
Improvement in the Sediment Management of a Lagoon Harbor: The Case of Marano Lagunare, Italy


Abstract
:1. Introduction
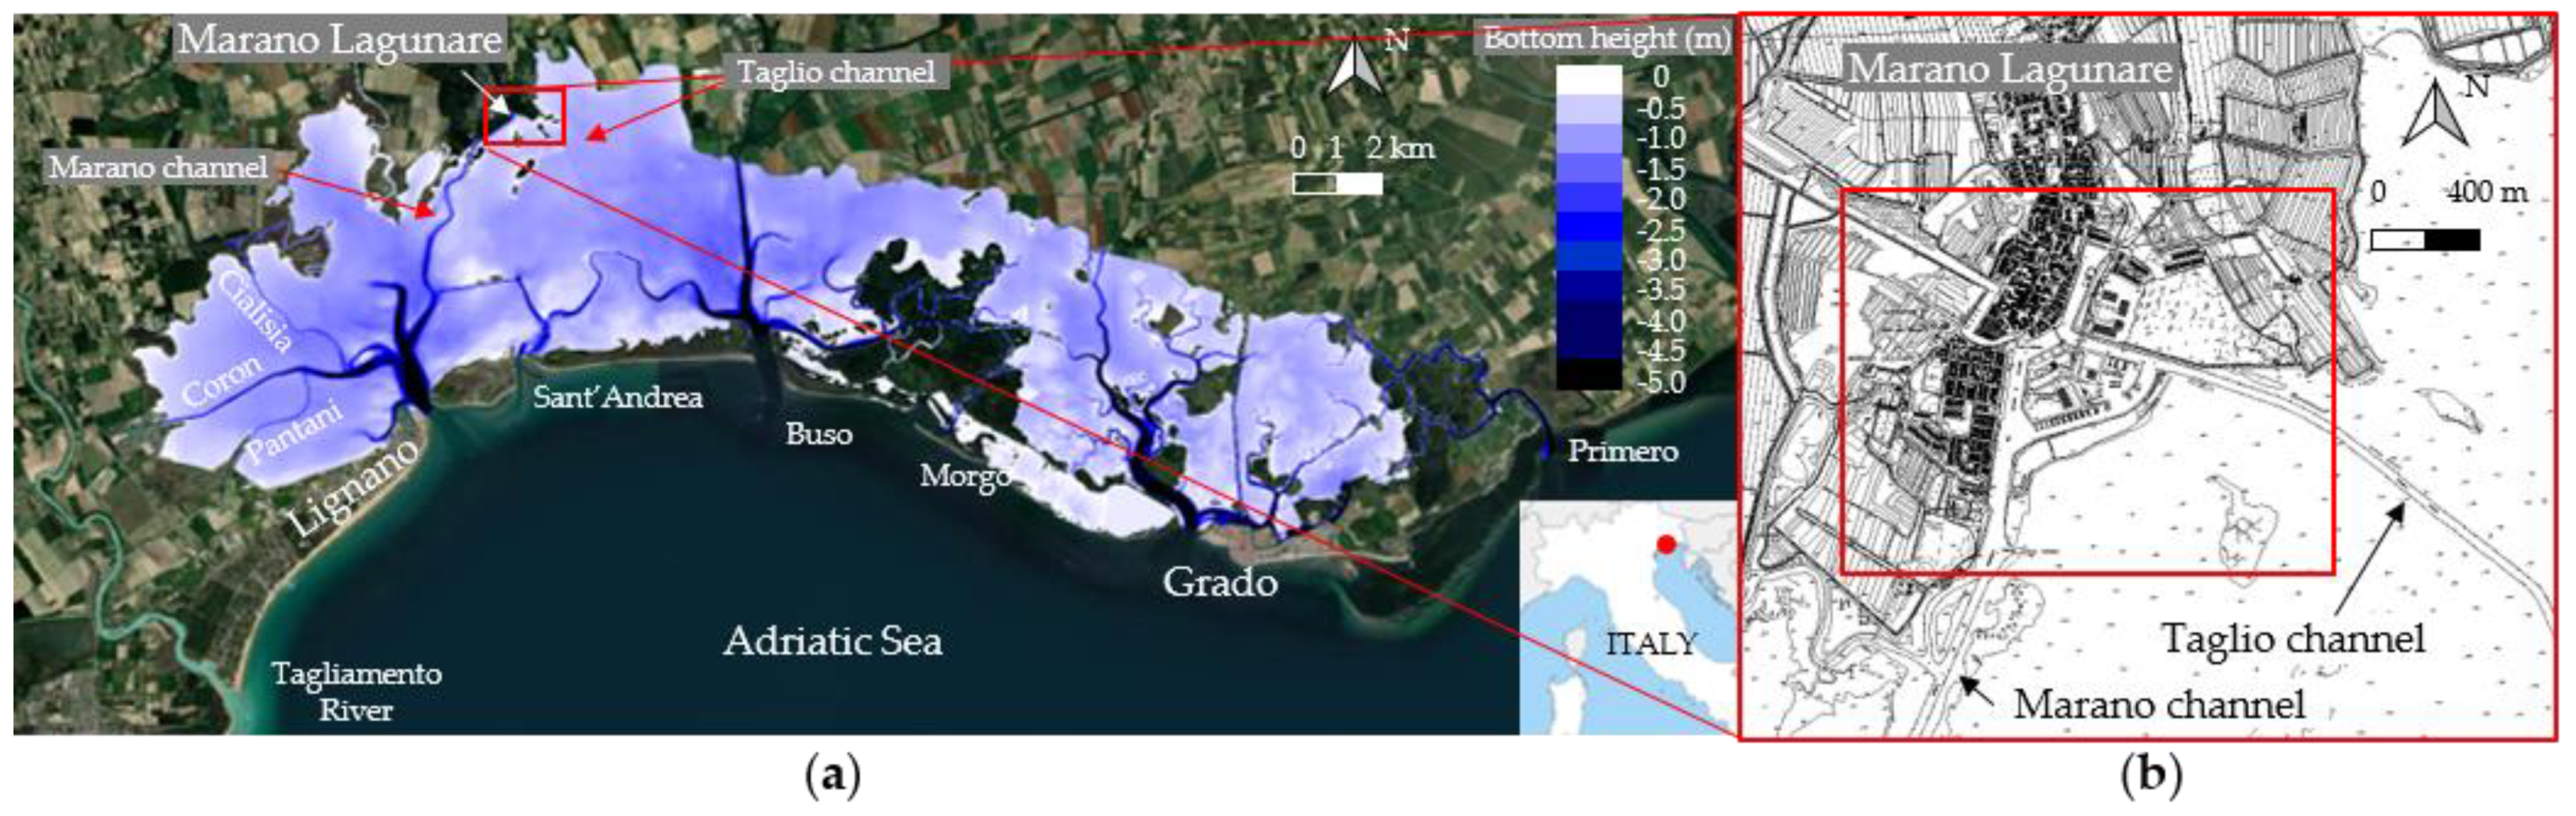
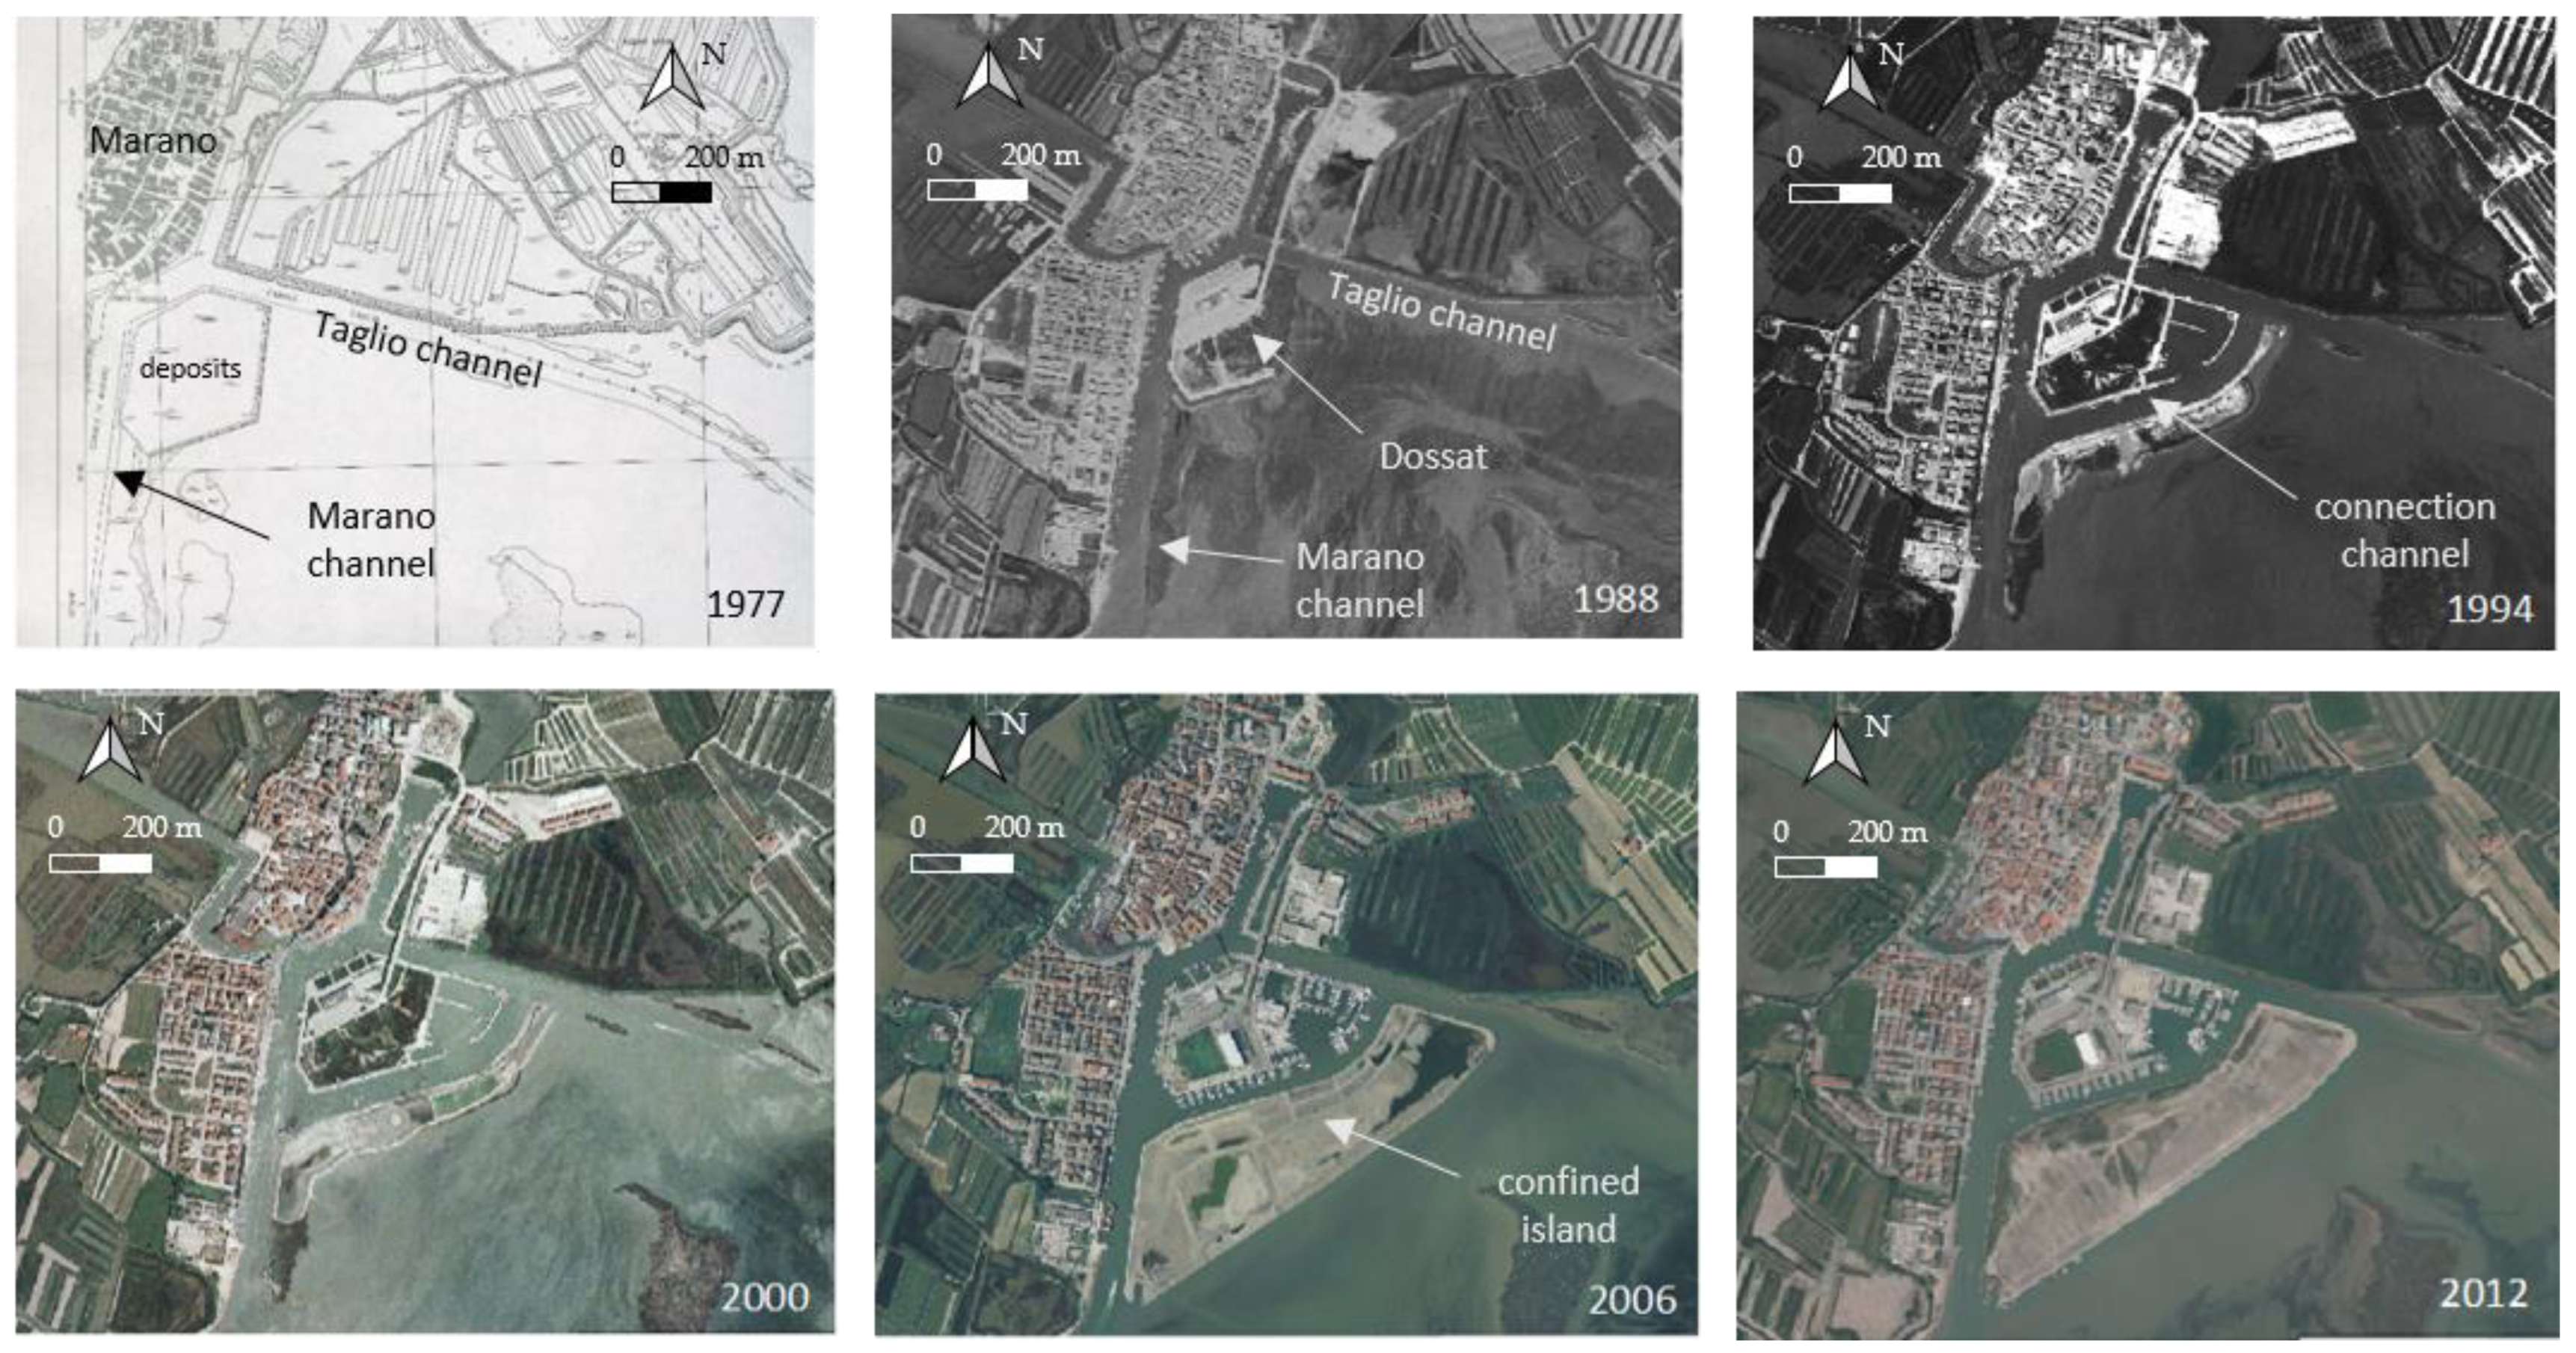
2. Study Site
3. Numerical Model
4. Simulation Setup
5. Results and Discussion
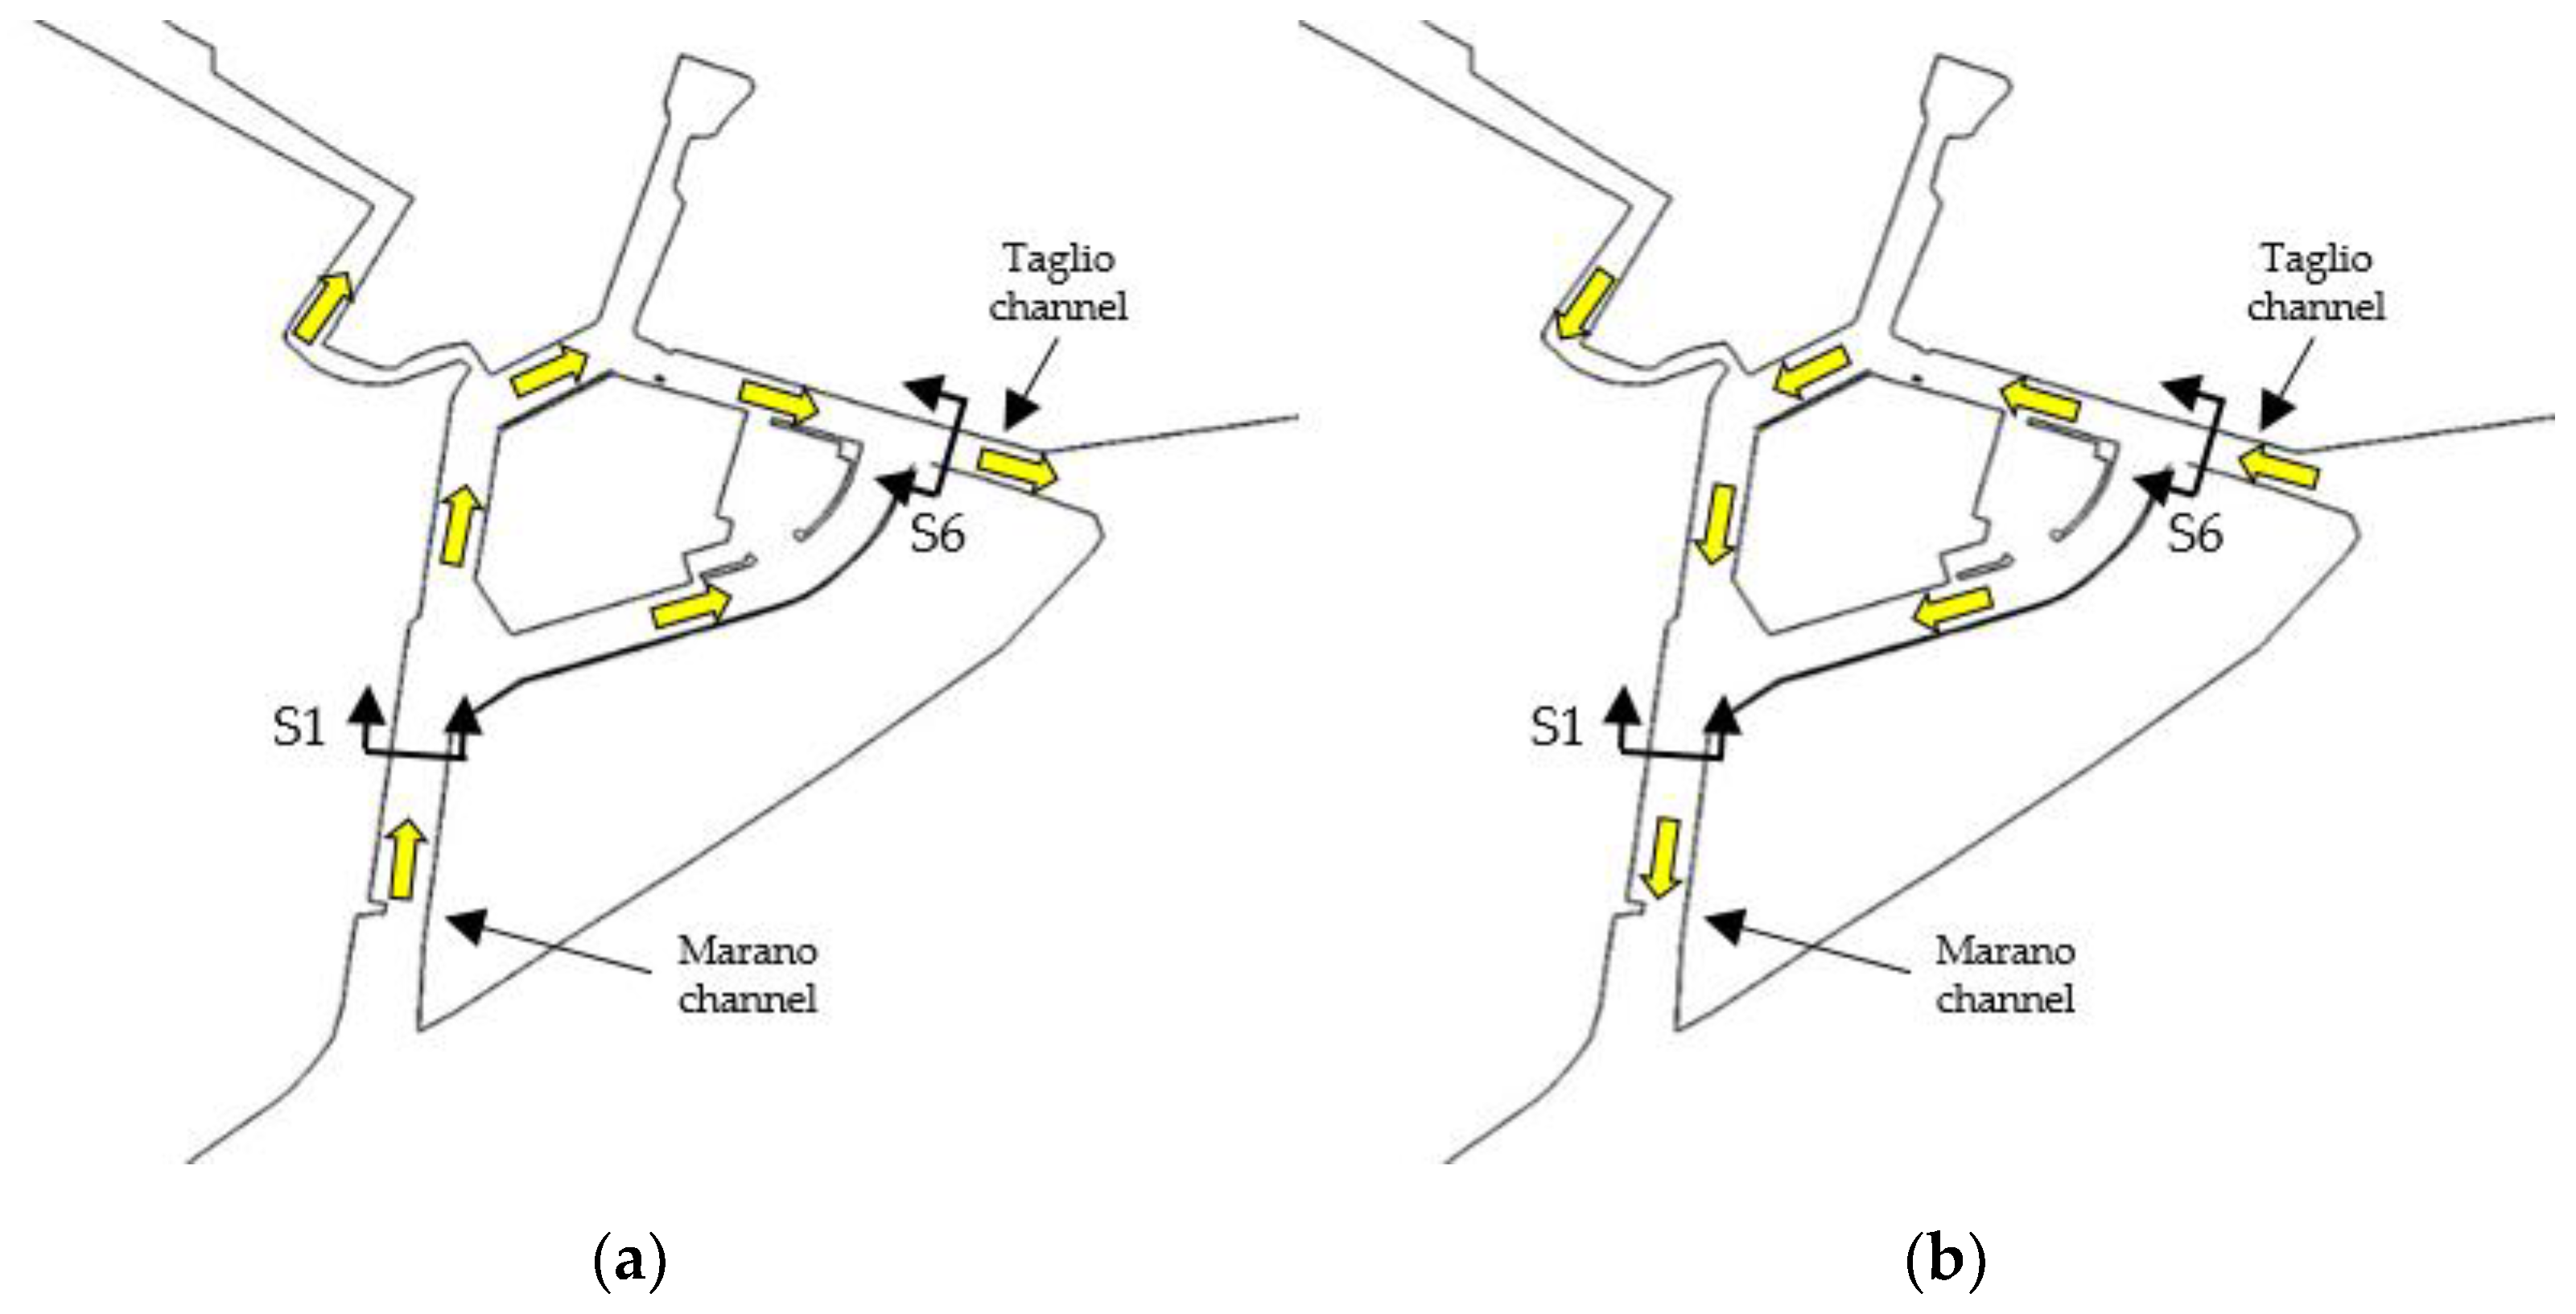
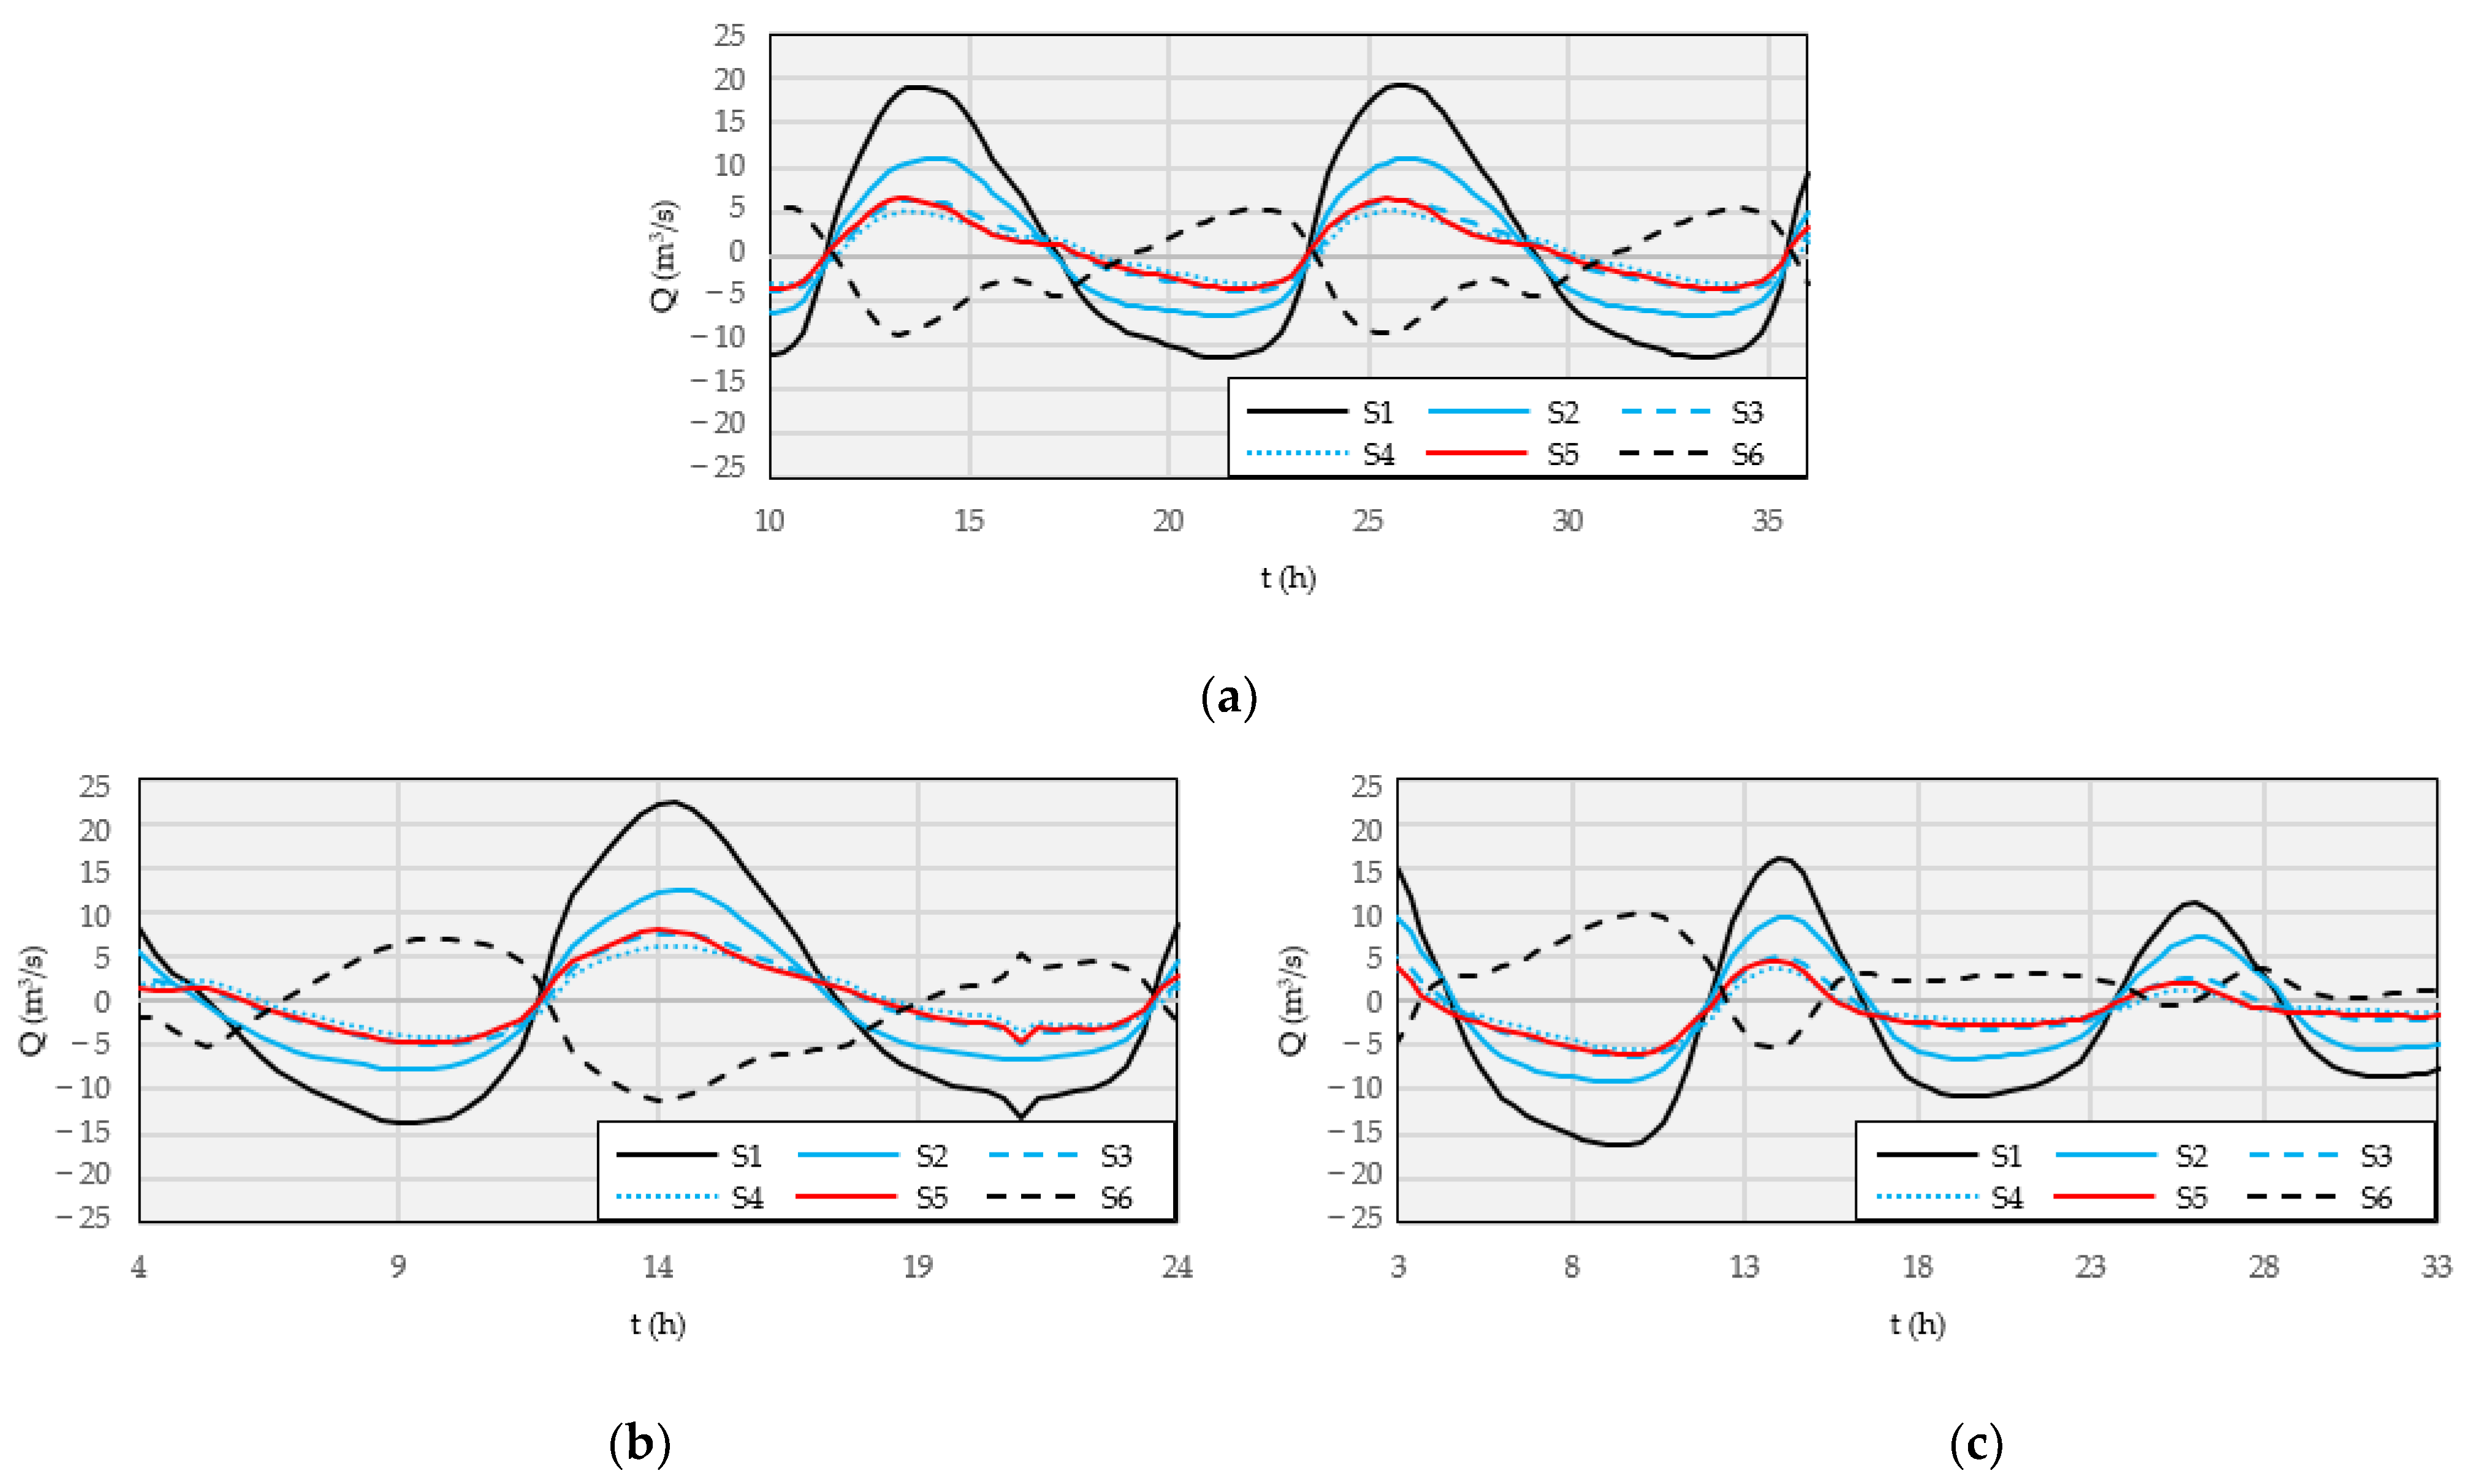
5.1. Reference Configuration
5.2. Closure of the Secondary Entrance
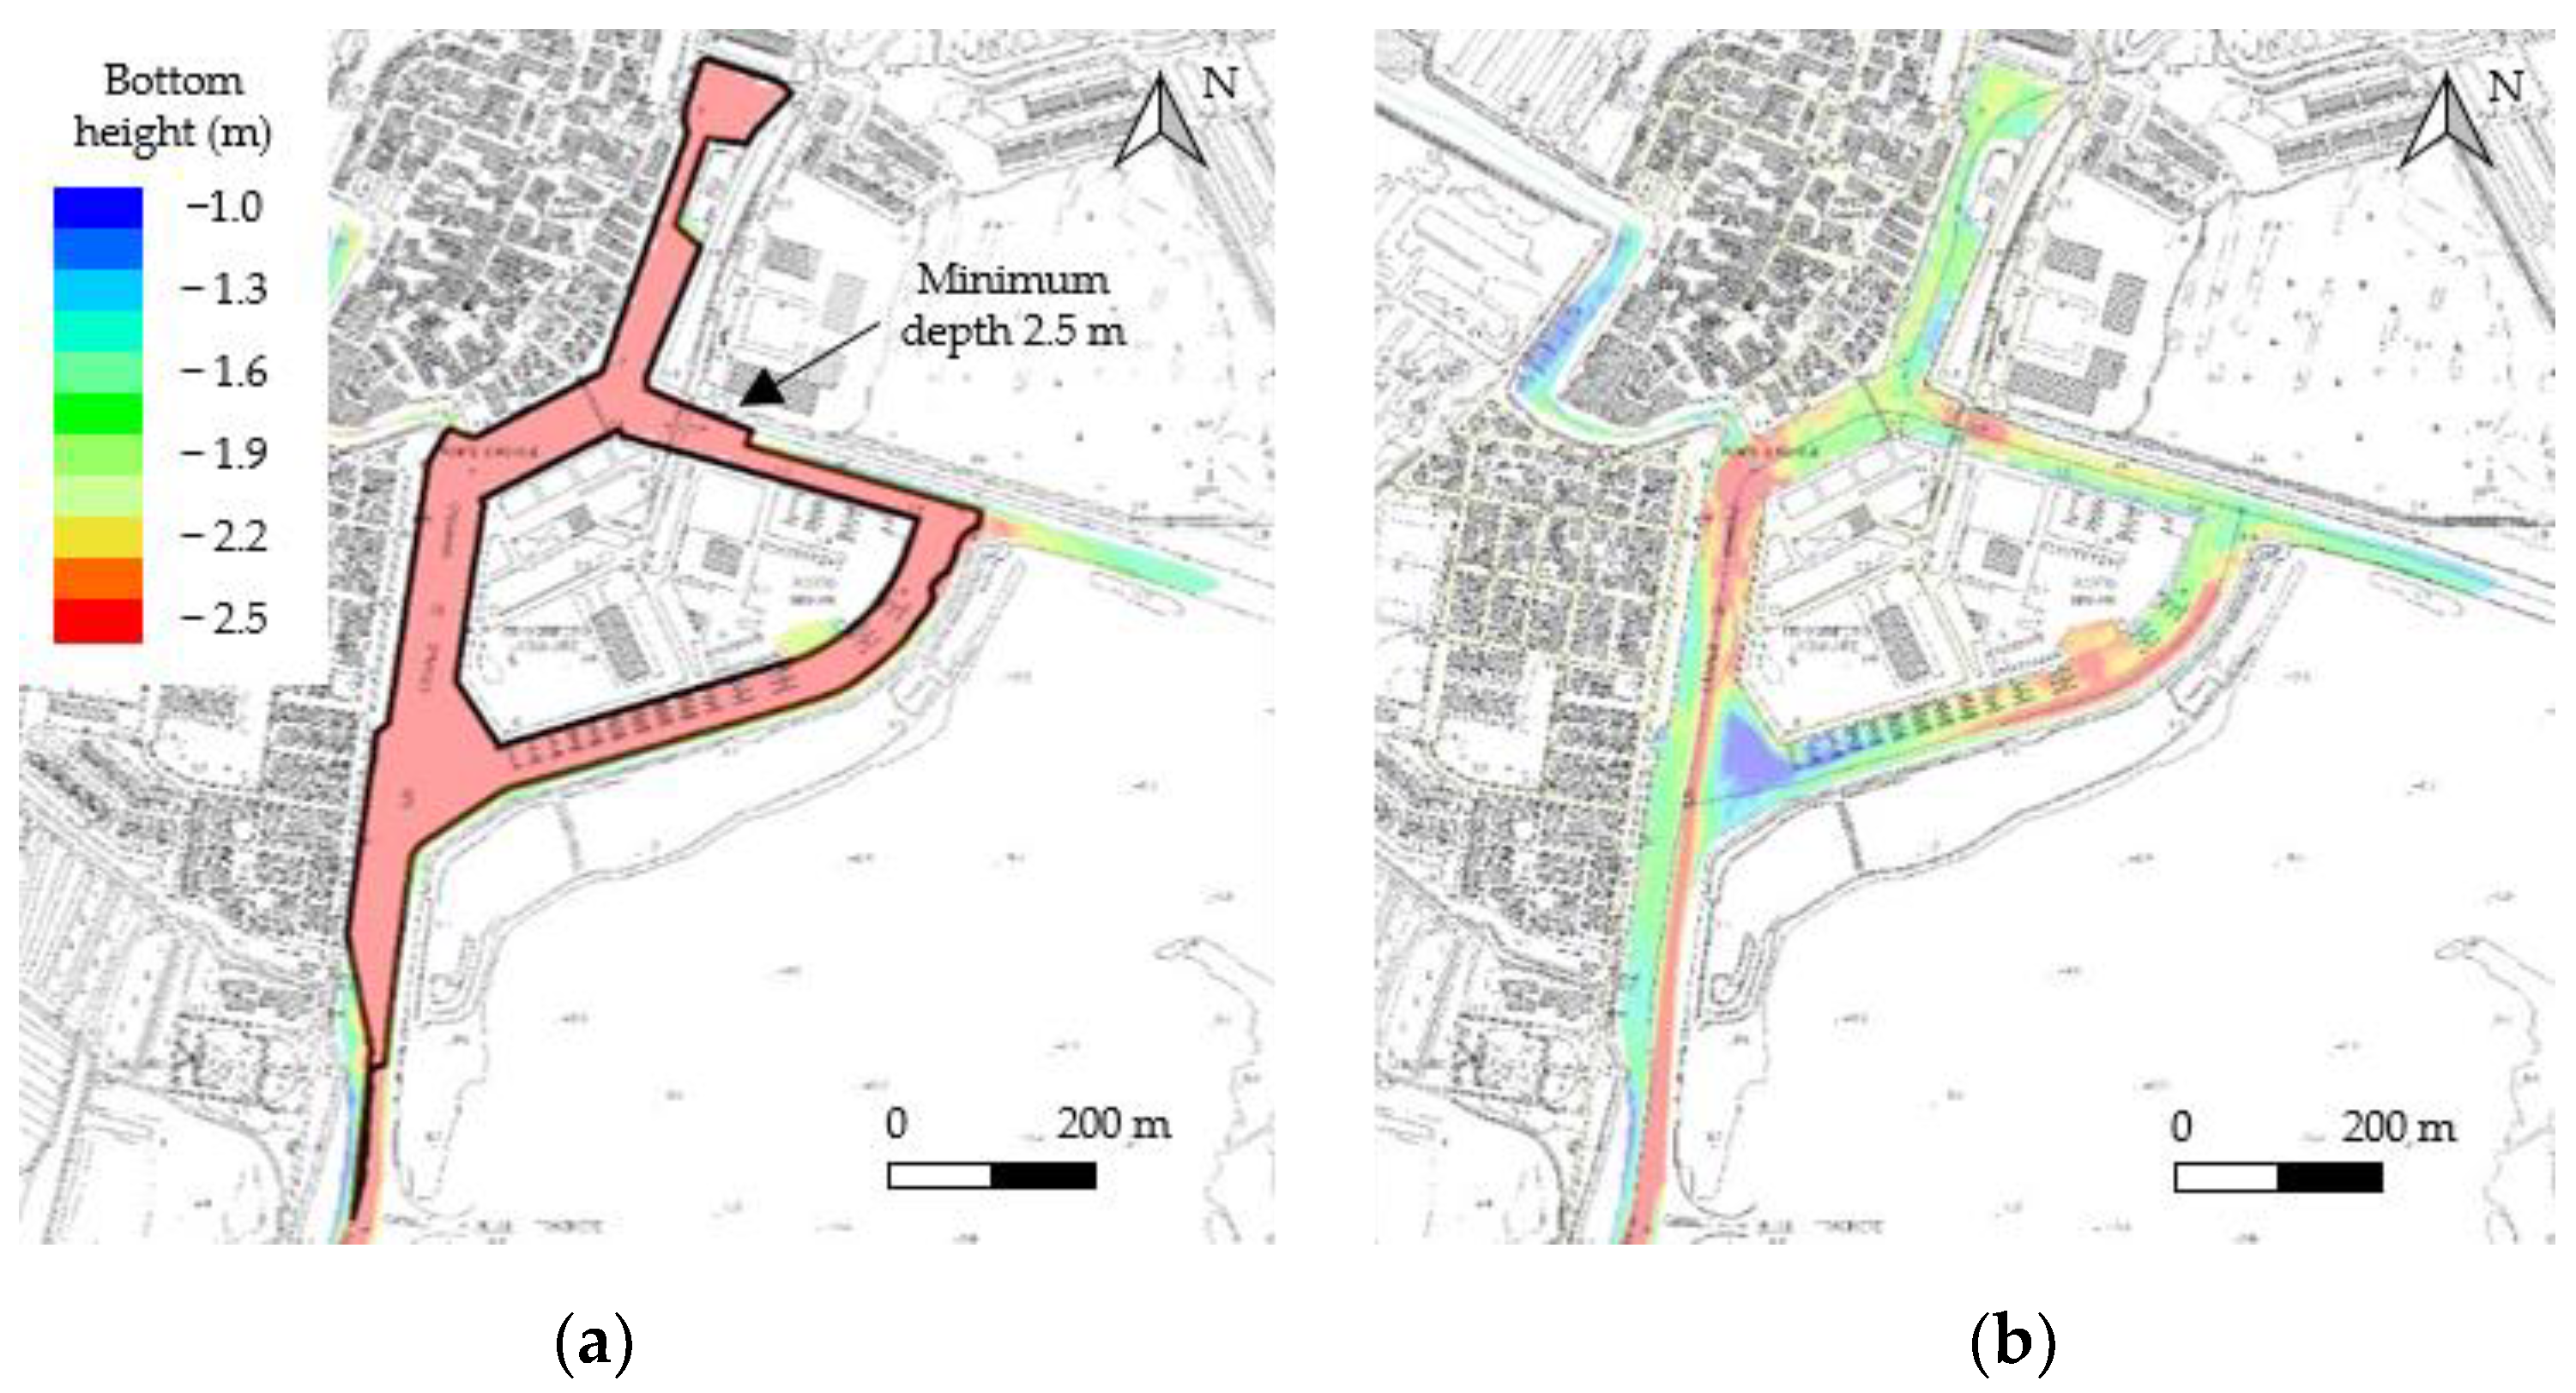
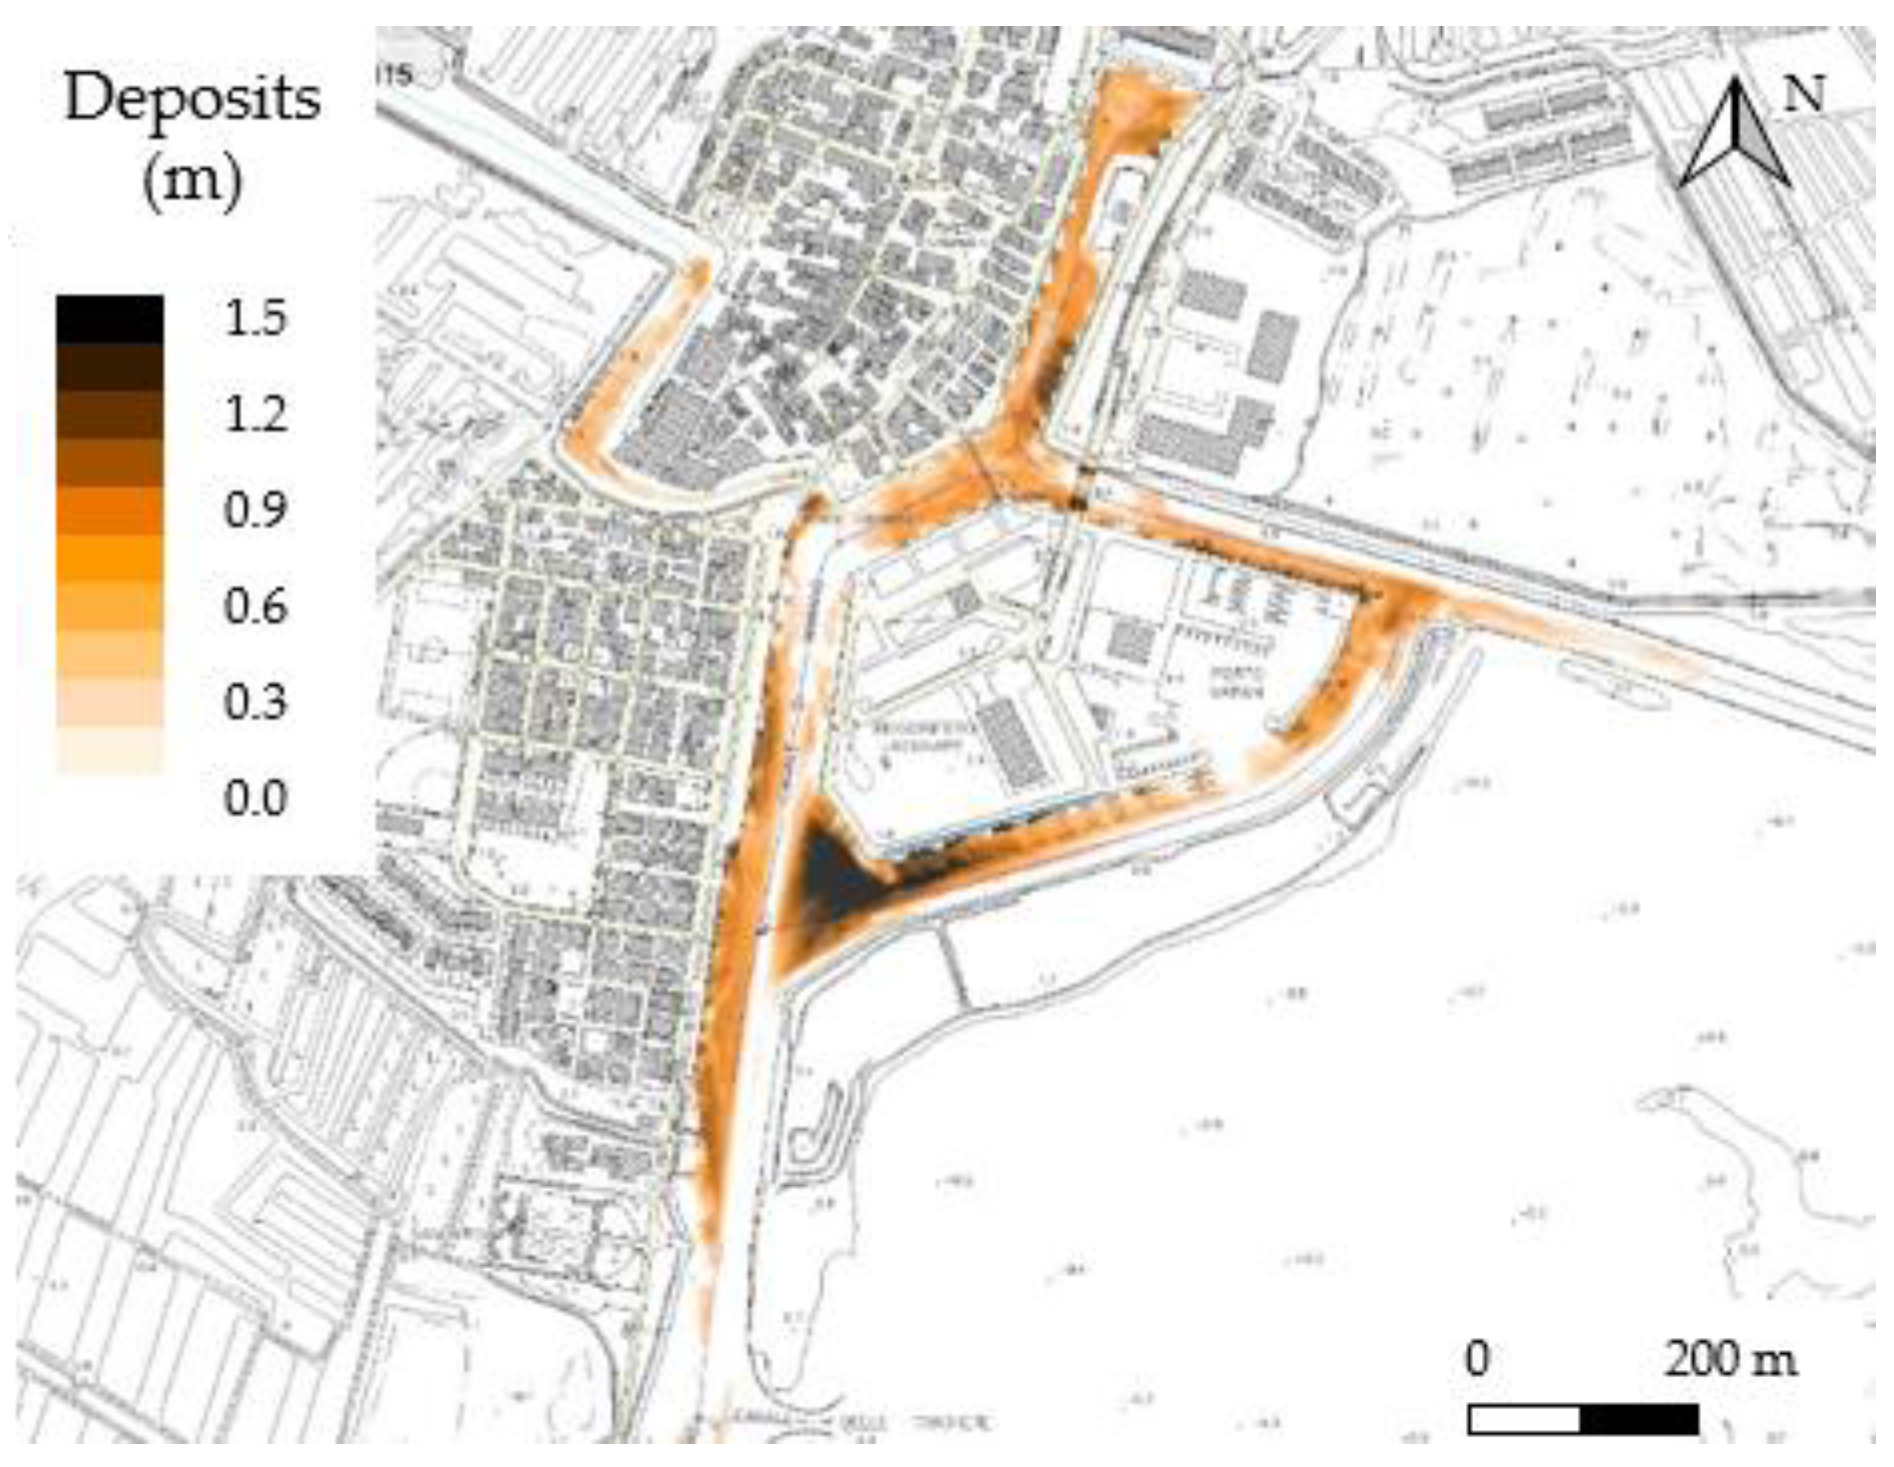
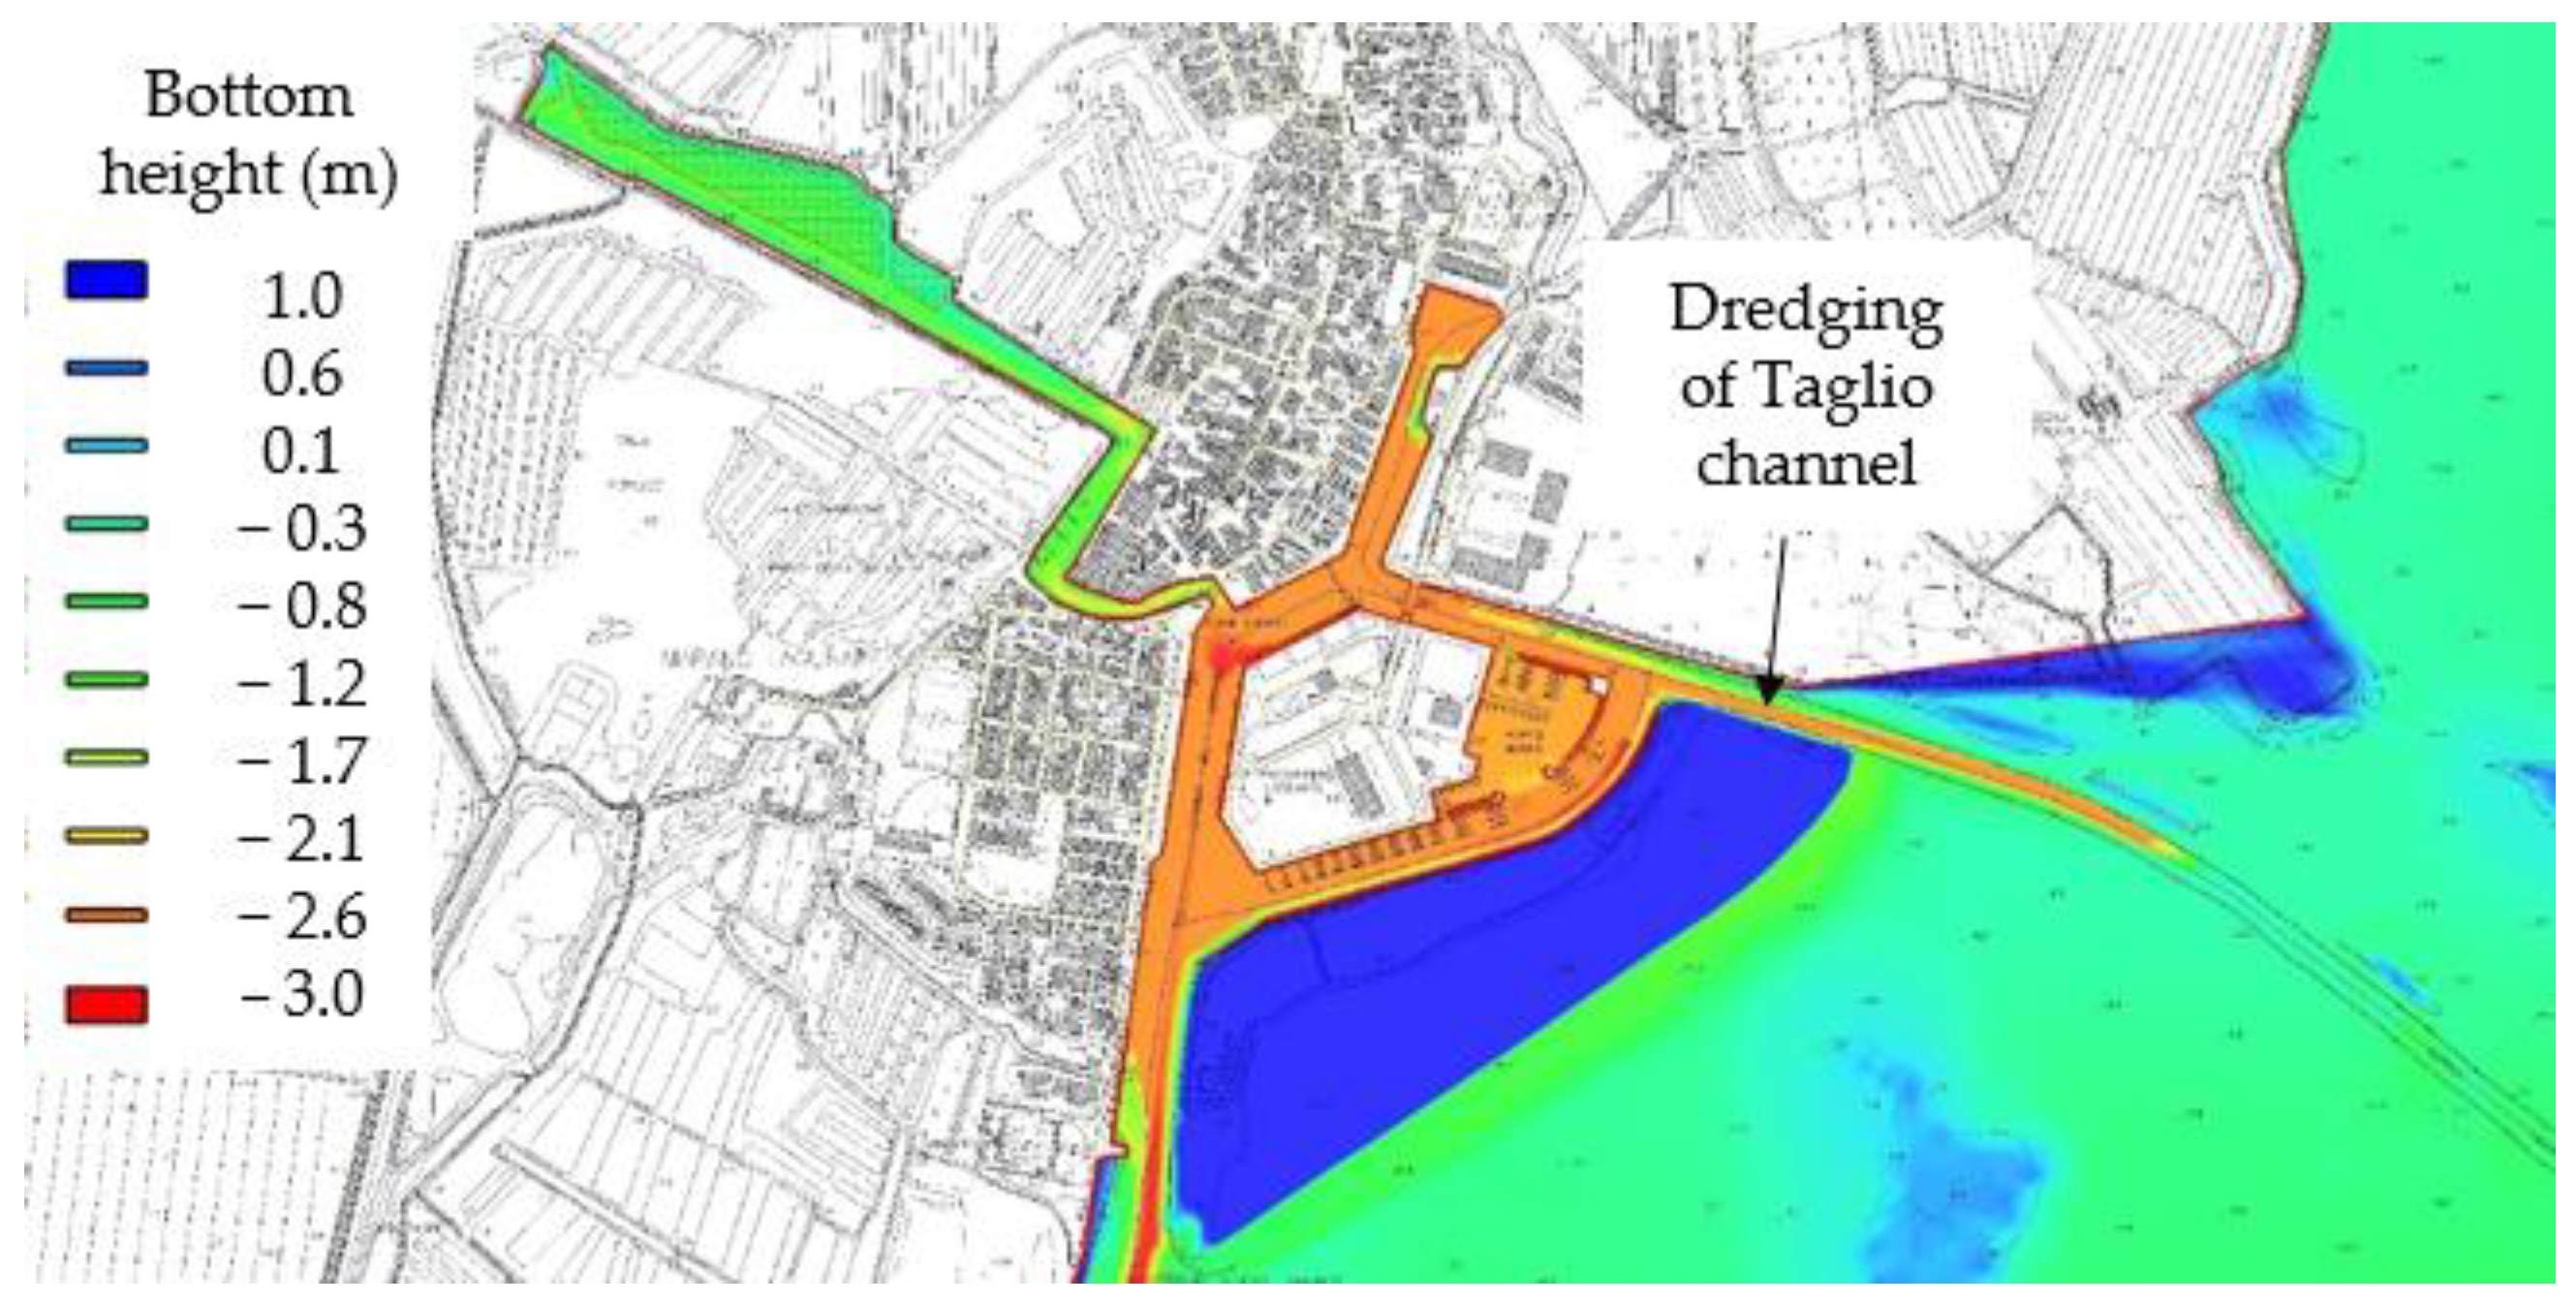
5.3. Dredging of the Taglio Channel
6. Conclusions
Author Contributions
Funding
Institutional Review Board Statement
Informed Consent Statement
Data Availability Statement
Conflicts of Interest
References
- Van Rijn, L.C. Harbour Siltation and Control Measures. 2016. Available online: http://www.leovanrijn-sediment.com (accessed on 15 July 2021).
- Franco, L. Ancient Mediterranean harbours: A heritage to preserve. Ocean Coast. Manag. 1996, 30, 115–151. [Google Scholar] [CrossRef]
- Winterwerp, J.C. Reducing Harbor Siltation. I: Methodology. J. Waterw. Port Coast. Ocean Eng. 2005, 131, 258–266. [Google Scholar] [CrossRef]
- Langedoen, E.J.; Kranenburg, C.; Booij, R. Flow patterns and exchange of matter in tidal harbours. J. Hydraul. Res. 1994, 32, 259–270. [Google Scholar] [CrossRef]
- Fernández, R.; Garcia, M.H.; Parker, G. Upper Mississippi River Flow and Sediment Characteristics and Their Effect on a Harbor Siltation Case. J. Hydraul. Eng. 2018, 144, 04018066. [Google Scholar] [CrossRef]
- Langendoen, E.J. Flow Patterns and Transports of Dissolved Matter in Tidal Harbours. Ph.D. Thesis, Delft University of Technology, Delft, The Netherlands, 1992. [Google Scholar]
- Lee, G.; Shin, H.J.; Kim, Y.T.; Dellapenna, T.M.; Kim, K.J.; Williams, J.; Kim, S.-Y.; Figueroa, S.M. Field investigation of siltation at a tidal harbor: North Port of Incheon, Korea. Ocean Dyn. 2019, 69, 1101–1120. [Google Scholar] [CrossRef]
- de Nijs, M.A.J.; Winterwerp, J.C.; Pietrzak, J.D. On harbour siltation in the fresh-salt water mixing region. Cont. Shelf Res. 2009, 29, 175–193. [Google Scholar] [CrossRef]
- Nasner, H. Siltation in tidal harbours, part I. Die Küste 1992, 127–170. (In German) [Google Scholar]
- Vanlede, J.; Dujardin, A. A geometric method to study water and sediment exchange in tidal harbors. Ocean Dyn. 2014, 64, 1631–1641. [Google Scholar] [CrossRef] [Green Version]
- Eysink, W.D. Impact of Sea-Level Rise on the Morphology of the Wadden Sea within the Scope of Its Ecological Function. Delft Hydraulics Internal Report. 1993. Available online: http://resolver.tudelft.nl/uuid:ebccbef0-32fd-4f25-b1ad-2f0192f24996 (accessed on 28 July 2021).
- Stoschek, O.; Zimmermann, C. Water Exchange and Sedimentation in an Estuarine Tidal Harbor Using Three-Dimensional Simulation. J. Waterw. Port Coast. Ocean Eng. 2006, 132, 410–414. [Google Scholar] [CrossRef]
- Van Maren, D.S.; Winterwerp, J.C.; Sas, M.; Vanlede, J. The effect of dock length on harbour siltation. Cont. Shelf Res. 2009, 29, 1410–1425. [Google Scholar] [CrossRef]
- Giaime, M.; Marriner, N.; Morhange, C. Evolution of ancient harbours in deltaic contexts: A geoarchaeological typology. Earth-Sci. Rev. 2019, 191, 141–167. [Google Scholar] [CrossRef] [Green Version]
- Rouse, H. Engineering Hydraulics; John Wiley & Sons: Hoboken, NJ, USA, 1950; ISBN 047174283X. [Google Scholar]
- Carniello, L.; Defina, A.; D’Alpaos, L. Modeling sand-mud transport induced by tidal currents and wind waves in shallow microtidal basins: Application to the Venice Lagoon (Italy). Estuar. Coast. Shelf Sci. 2012, 102, 105–115. [Google Scholar] [CrossRef]
- Cuadrado, D.G.; Gomez, E.A.; Pierini, J.O.; Federici, G.A. A Possible Solution to Rosales Harbour Excessive Siltation Rate (Bahìa Blanca Estuary, Argentina). J. Coast. Res. 2006, 1, 419–423. [Google Scholar]
- Pascolo, S.; Petti, M.; Bosa, S. On the Wave Bottom Shear Stress in Shallow Depths: The Role of Wave Period and Bed Roughness. Water 2018, 10, 1348. [Google Scholar] [CrossRef] [Green Version]
- Pascolo, S.; Petti, M.; Bosa, S. Wave Forecasting in Shallow Water: A New Set of Growth Curves Depending on Bed Roughness. Water 2019, 11, 2313. [Google Scholar] [CrossRef] [Green Version]
- Petti, M.; Pascolo, S.; Bosa, S.; Bezzi, A.; Fontolan, G. Tidal Flats Morphodynamics: A new Conceptual Model to Predict Their Evolution over a Medium-Long Period. Water 2019, 11, 1176. [Google Scholar] [CrossRef] [Green Version]
- Christiansen, T.; Wiberg, P.L.; Milligan, T.G. Flow and Sediment Transport on a Tidal Salt Marsh Surface. Estuar. Coast. Shelf Sci. 2000, 50, 315–331. [Google Scholar] [CrossRef] [Green Version]
- Wallbrink, P.J.; Hancock, G.J.; Olley, J.M.; Hughes, A.; Prosser, I.P.; Hunt, D.; Rooney, G.; Coleman, R.; Stevenson, J. The Western Port Sediment Study; Consultancy Report; CSIRO Land and Water: Melbourne, Australia, 2003. [Google Scholar]
- Shanehsazzadeh, A.; Ardalan, H. Regional-Scale Study on Sediment Processes of Khuran Strait at Persian Gulf with Implications for Engineering Design. China Ocean Eng. 2019, 33, 356–364. [Google Scholar] [CrossRef]
- Kirby, R. Minimising harbour siltation—Findings of PIANC Working Group 43. Ocean Dyn. 2011, 61, 233–244. [Google Scholar] [CrossRef]
- Purhoit, A.A.; Basu, A.; Chavan, K.A.; Kudale, M.D. Current Deflecting Wall: A Promising Structure for Minimising Siltation in Semi-Enclosed Docks. Int. J. Civ. Environ. Eng. 2017, 11, 121–129. [Google Scholar]
- Theron, A.K.; Schoonees, J.S.; Claassens, H. Port of East London: Design and optimization of the sand traps. J. S. Afr. Inst. Civ. Eng. 2002, 44, 8–15. [Google Scholar]
- Nasner, H. Siltation in tidal harbours, part II. Die Küste 1997, 63–114. (In German) [Google Scholar]
- Huguet, J.R.; Brenon, I.; Coulombier, T.; Hamani, V. Dynamics and management of siltation in a macro-tidal marina: The case of La Rochelle marina, France. Ocean Coast. Manag. 2020, 198, 105371. [Google Scholar] [CrossRef]
- Jeuken, M.C.J.L.; Wang, Z.B. Impact of dredging and dumping on the stability of ebb–flood channel systems. Coast. Eng. 2010, 57, 553–566. [Google Scholar] [CrossRef]
- Sarretta, A.; Pillon, S.; Molinaroli, E.; Guerzoni, S.; Fontolan, G. Sediment budget in the Lagoon of Venice, Italy. Cont. Shelf Res. 2010, 30, 934–949. [Google Scholar] [CrossRef] [Green Version]
- Stagg, C.L.; Mendelssohn, I.A. Restoring Ecological Function to a Submerged Salt Marsh. Restor. Ecol. 2010, 18, 10–17. [Google Scholar] [CrossRef]
- Guerra, R.; Pasteris, A.; Ponti, M. Impacts of maintenance channel dredging in a northern Adriatic coastal lagoon. I: Effects on sediment properties, contamination and toxicity. Estuar. Coast. Shelf Sci. 2009, 85, 134–142. [Google Scholar] [CrossRef]
- Taupp, T.; Wetzel, M.A. Relocation of dredged material in estuaries under the aspect of the Water Framework Directive—A comparison of benthic quality indicators at dumping areas in the Elbe estuary. Ecol. Indic. 2013, 34, 323–331. [Google Scholar] [CrossRef]
- Scheffler, A.; Roth, T.; Ahlf, W. Sustainable decision making under uncertainty: A case study in dredged material management. Environ. Sci. Eur. 2014, 26, 7. [Google Scholar] [CrossRef]
- Toumazis, A.D. Environmental impact associated with the dumping of dredged material at sea. A study for the Limassol port extension works. Water Sci. Technol. 1995, 32, 151–158. [Google Scholar] [CrossRef]
- Somerfield, P.; Atkins, M.; Bolam, S.; Clarke, K.R.; Garnacho, E.; Rees, H.L.; Smith, R.; Warwick, R.M. Relative impacts at sites of dredged-material relocation in the coastal environment: A phylum-level meta-analysis approach. Mar. Biol. 2006, 148, 1231–1240. [Google Scholar] [CrossRef]
- Cecchi, G.; Vagge, G.; Cutroneo, L.; Greco, G.; Di Piazza, S.; Faga, M.; Zotti, M.; Capello, M. Fungi as potential tool for polluted port sediment remediation. Environ. Sci. Pollut. Res. 2019, 26, 35602–35609. [Google Scholar] [CrossRef]
- Petti, M.; Bosa, S.; Pascolo, S. Lagoon Sediment Dynamics: A Coupled Model to Study a Medium-Term Silting of Tidal Channels. Water 2018, 10, 569. [Google Scholar] [CrossRef] [Green Version]
- Umgiesser, G.; Sclavo, M.; Carniel, S.; Bergamasco, A. Exploring the bottom stress variability in the Venice Lagoon. J. Mar. Syst. 2004, 51, 161–178. [Google Scholar] [CrossRef]
- Fagherazzi, S.; Carniello, L.; D’Alpaos, L.; Defina, A. Critical bifurcation of shallow microtidal landforms in tidal flats and salt marshes. Proc. Natl. Acad. Sci. USA 2006, 103, 8337–8341. [Google Scholar] [CrossRef] [Green Version]
- Mariotti, G.; Fagherazzi, S. Wind waves on a mudflat: The influence of fetch and depth on bed shear stresses. Cont. Shelf Res. 2013, 60, S99–S110. [Google Scholar] [CrossRef]
- Shi, B.; Cooper, J.R.; Pratolongo, P.D.; Gao, S.; Bouma, T.J.; Li, G.; Li, C.; Yang, S.L.; Wang, Y.P. Erosion and Accretion on a Mudflat: The Importance of Very Shallow-Water Effects. J. Geophys. Res. Oceans 2017, 122, 9476–9499. [Google Scholar] [CrossRef] [Green Version]
- Triches, A.; Pillon, S.; Bezzi, A.; Lipizer, M.; Gordini, E.; Villalta, R.; Fontolan, G.; Menchini, G. Carta Batimetrica Della Laguna di Marano e Grado; Arti Grafiche Friulane, Imoco spa: Udine, Italy, 2011; 39p, 5 Maps; ISBN 978-88-95980-02-7. (In Italian) [Google Scholar]
- Dorigo, L. La Laguna di Grado e le sue Foci. Ricerche e Rilievi Idrografici; Magistrato alle Acque, Ufficio Idrografico: Venice, Italy, 1965. (In Italian) [Google Scholar]
- D.Lgs.152/2006. Decreto legislativo, 03/04/2006 n° 152, G.U. 14 April 2006. Available online: https://www.camera.it (accessed on 1 October 2021). (In Italian).
- D.M.173/2016. Decreto ministeriale, 15/07/2016 n° 173, G.U. 6 September 2016. Available online: https://www.gazzettaufficiale.it (accessed on 1 October 2021). (In Italian).
- OGS. Campionamento e caratterizzazione dei sedimenti del Porto di Marano Lagunare finalizzato ai lavori di ricalibratura del fondale dei canali prospicenti l’abitato di Marano Lagunare. Internal Report. 2019. (In Italian) [Google Scholar]
- ARPA-FVG. Laguna di Marano-Grado. Ricalibratura del fondale dei canali prospicienti l’abitato di Marano. Prot.0016630/P/GEN/PRA. 20 May 2019; PRA-AUT. Internal Report. 2019. (In Italian) [Google Scholar]
- Bosa, S.; Petti, M.; Lubrano, F.; Pascolo, S. Morphodynamic Model Suitable for River Flow and Wave-Current Interaction. IOP Conf. Ser. Mater. Sci. Eng. 2017, 245, 062005. [Google Scholar] [CrossRef] [Green Version]
- Soulsby, R.L. Dynamics of Marine Sands: A Manual for Practical Applications; Thomas Telford Publications: London, UK, 1997; 249p, ISBN 978-0-7277-2584-X. [Google Scholar]
- Booij, N.; Ris, R.C.; Holthuijsen, L.H. A third-generation wave model for coastal regions, Part I, Model description and validation. J. Geophys. Res. 1999, 104, 7649–7666. [Google Scholar] [CrossRef] [Green Version]
- Partheniades, E. Erosion and Deposition of Cohesive Soils. J. Hydraul. Div. 1965, 91, 105–139. [Google Scholar] [CrossRef]
- Krone, R.B. Flume Studies of the Transport of Sediment in Estuarial Shoaling Processes, Final Report; Hydraulic Engineering and Sanitary Engineering Research Laboratory, University of California: Berkeley, CA, USA, 1962. [Google Scholar]
- Whitehouse, R.J.S.; Soulsby, R.L.; Roberts, W.; Mitchener, H.J. Dynamics of Estuarine Muds; Thomas Telford: London, UK, 2000; ISBN 0727728644. [Google Scholar]
- Winterwerp, J.C.; van Kesteren, W.G.M. Introduction to the Physics of Cohesive Sediment Dynamics in the Marine Environment; Elsevier: Oxford, UK, 2004; Volume 56, ISBN 0-444-51553-4. [Google Scholar]
- Thorn, M.F.C.; Parson, J.C. Erosion of cohesive sediments in estuaries: An engineering guide. In Proceedings of the 3rd International Symposium on Dredging Technology, Bordeaux, France, 5–7 March 1980; BHRA: Cranfield, UK; pp. 349–358. [Google Scholar]
- Mitchener, H.J.; Whitehouse, R.J.S.; Soulsby, R.L.; Lawford, V.A. Estuarine Morphodynamics. Development of SedErode—Instrument for In-Situ Mud Erosion Measurements; HR Wallingford Report TR 17; HR wallingford Ltd.: Wallingford, UK, 1996. [Google Scholar]
- Kranenburg, C. Effects of floc strength on viscosity and deposition of cohesive sediment suspensions. Cont. Shelf Res. 1999, 19, 1665–1680. [Google Scholar] [CrossRef]
- Briaud, J.L.; Ting, F.C.K.; Chen, H.C.; Cao, Y.; Han, S.W.; Kwak, K.W. Erosion Function Apparatus for Scour Rate Predictions. J. Geotech. Geoenviron. Eng. 2001, 127, 105–113. [Google Scholar] [CrossRef]
- Huang, J.; Hilldale, R.C.; Greimann, B.P. Cohesive Sediment Transport. In Erosion and Sedimentation Manual; U.S. Department of the Interior Bureau of Reclamation: Washington, DC, USA, 2006; pp. 4-1–4-54. [Google Scholar]
- Julian, J.P.; Torres, R. Hydraulic erosion of cohesive riverbanks. Geomorphology 2006, 76, 193–206. [Google Scholar] [CrossRef]
- Sanford, L.P.; Maa, J.P.-Y. A unified erosion formulation for fine sediments. Mar. Geol. 2001, 179, 9–23. [Google Scholar] [CrossRef]
- Kombiadou, K.; Krestenitis, Y.N. Modelling Cohesive Sediment Dynamics in the Marine Environment. In Sediment Transport Processes and Their Modelling Applications; Manning, A.J., Ed.; IntechOpen: London, UK, 2013; Available online: https://www.intechopen.com/chapters/38257 (accessed on 1 October 2021). [CrossRef] [Green Version]
- Amos, C.L.; Bergamasco, A.; Umgiesser, G.; Cappucci, S.; Cloutier, D.; DeNat, L.; Flindt, M.; Bonardi, M.; Cristante, S. The stability of tidal flats in Venice Lagoon—The results of in-situ measurements using two benthic, annular flumes. J. Mar. Syst. 2004, 51, 211–241. [Google Scholar] [CrossRef]
- Maa, J.P.-Y.; Kwon, J.-I.; Hwang, K.-N.; Ha, H.-K. Critical Bed-Shear Stress for Cohesive Sediment Deposition under Steady Flows. J. Hydraul. Eng. 2008, 134, 1767–1771. [Google Scholar] [CrossRef] [Green Version]
- Stone, M.; Krishnappan, B.G.; Granger, S.; Upadhayay, H.R.; Zhang, Y.; Chivers, C.A.; Decent, Q.; Collins, A.L. Deposition and erosion behaviour of cohesive sediments in the upper River Taw observatory, southwest UK: Implications for management and modelling. J. Hydrol. 2021, 598, 126–145. [Google Scholar] [CrossRef]
- Lumborg, U.; Pejrup, M. Modelling of cohesive sediment transport in a tidal lagoon—An annual budget. Mar. Geol. 2005, 218, 1–16. [Google Scholar] [CrossRef]
- Petti, M.; Bosa, S.; Pascolo, S.; Uliana, E. Marano and Grado Lagoon: Narrowing of the Lignano Inlet. IOP Conf. Ser. Mater. Sci. Eng. 2019, 603, 032066. [Google Scholar] [CrossRef]
- Petti, M.; Bosa, S.; Pascolo, S.; Uliana, E. An Integrated Approach to Study the Morphodynamics of the Lignano Tidal Inlet. J. Mar. Sci. Eng. 2020, 8, 77. [Google Scholar] [CrossRef] [Green Version]
- Roelvink, J.A. Coastal morphodynamic evolution techniques. Coast. Eng. 2006, 53, 277–287. [Google Scholar] [CrossRef]


| Duration Classes | Events Number | Duration (h) | Max Velocity (m/s) | RMS Velocity (m/s) | |
|---|---|---|---|---|---|
| Bora | 0–48 h | 5.9 | 26.2 | 11.2 | 6.9 |
| 48–96 h | 2.9 | 64.7 | 11.0 | 6.7 | |
| >96 h | 1.1 | 169.0 | 13.7 | 7.6 | |
| Sirocco | 0–48 h | 14.2 | 21.9 | 12.1 | 7.6 |
| 48–96 h | 0.9 | 61.5 | 13.2 | 7.9 |
| Channel | Average Annual Dredged Volumes (m3) | Simulated Deposited Volumes (m3) |
|---|---|---|
| Marano | 11,050 | 10,920 |
| Cialisia | 8600 | 10,180 |
| Coron | 21,750 | 18,850 |
| Pantani | 9800 | 10,140 |
| Q (m3/s) | ||||||
|---|---|---|---|---|---|---|
| S1 | S2 | S3 | S4 | S5 | S6 | |
| Reference configuration | 18.03 | 10.49 | 5.91 | 4.62 | 5.82 | 4.93 |
| Closure of Taglio channel | 11.27 | 7.01 | 2.22 | 0.78 | 2.29 | 0.00 |
| ΔQ/Q (%) | ||||||
|---|---|---|---|---|---|---|
| S1 | S2 | S3 | S4 | S5 | S6 | |
| Tide only | +5.9 | +3.2 | +7.1 | +9.3 | +10.7 | +8.9 |
| Bora | +8.8 | +6.8 | +10.9 | +14.1 | +15.0 | +9.3 |
| Sirocco | +4.0 | +3.0 | +5.5 | +7.8 | +7.3 | +18.1 |
| Sediment Volume (m3) | |||
|---|---|---|---|
| Bora Simulation | Sirocco Simulation | Total Deposit | |
| Reference Configuration | 13,112 | 2769 | 15,881 |
| Dredged Taglio Channel Configuration | 14,676 | 3085 | 17,761 |
Publisher’s Note: MDPI stays neutral with regard to jurisdictional claims in published maps and institutional affiliations. |
© 2021 by the authors. Licensee MDPI, Basel, Switzerland. This article is an open access article distributed under the terms and conditions of the Creative Commons Attribution (CC BY) license (https://creativecommons.org/licenses/by/4.0/).
Share and Cite
Bosa, S.; Petti, M.; Pascolo, S. Improvement in the Sediment Management of a Lagoon Harbor: The Case of Marano Lagunare, Italy. Water 2021, 13, 3074. https://doi.org/10.3390/w13213074
Bosa S, Petti M, Pascolo S. Improvement in the Sediment Management of a Lagoon Harbor: The Case of Marano Lagunare, Italy. Water. 2021; 13(21):3074. https://doi.org/10.3390/w13213074
Chicago/Turabian StyleBosa, Silvia, Marco Petti, and Sara Pascolo. 2021. "Improvement in the Sediment Management of a Lagoon Harbor: The Case of Marano Lagunare, Italy" Water 13, no. 21: 3074. https://doi.org/10.3390/w13213074