1. Introduction
The Sahel region is a transitional belt limited by the wet tropics of Africa to the south and by the Sahara desert to the north. It is an arid region with limited water resources, where most of the population derives their income from agropastoral activities. In this region, mesoscale convective systems are frequently observed and cause most of the rainfall [
1]. The Sahelian rainfall variability has been linked to a number of climate processes on local, regional, and global scales. Salih et al. [
2] used the general circulation atmospheric model CAM3 and the Lagrangian transport and dispersion model FLEXPART (FLEXible PARTicle dispersion model) to estimate the moisture contributions from different source regions to the Sahelian–Sudan rainfalls and showed that distant regions, such as the Mediterranean, can be a significant moisture source, with a notable seasonality.
Janicot et al. [
3] also showed that there could be some atmospheric connection between the distribution of diabatic heat sources associated with the break and active phases of the Indian monsoon and the African monsoon through a pathway north of 20° N. The two African and Indian monsoon systems present a similarity in decadal variability suggesting a possible association between Indian and African monsoon precipitation. This similarity of decadal variability between African and Indian monsoon results from a large-scale forcing induced by the interaction of different ocean basins [
4].
An inter-annual teleconnection between Africa and India can be considered, as a first approximation, as a Gill–Matsuno-type mechanism response to a heating anomaly in the equatorial Atlantic region [
5]. The diabatic warming of the Asian monsoon produces a subsidence movement over Africa through westward Rossby wave propagation [
6]. Likewise, Dyer et al. [
7] estimated that warming and atmospheric circulation over the Indian Ocean impacts the Sahelian rainfall through a modulation of Asian monsoon circulation and subsidence in North Africa.
At the intraseasonal scale, the dynamics of the Indian monsoon is linked to the Tropical Easterly Jet (TEJ), a strong upper level easterly wind during the Asian monsoon (from late June to early September) from South-East Asia to Africa [
8], to the Madden Julian Oscillation (MJO), an intraseasonal (30–90 day) variability mode in the tropical atmosphere propagating eastward [
9,
10], and to Rossby waves, planetary waves resulting from the conservation of potential vorticity and from the equilibrium between the Coriolis force and the pressure gradient [
6] and finally Kelvin waves that result from the Coriolis force against a topographic boundary, such as a coastline, or a waveguide, such as the equator [
3].
Recently, Rizou et al. [
11] applied statistical methods to establish a relation between the Indian summer monsoon and the upper tropospheric eastern Mediterranean circulation. Zhan et al. [
12] analyzed upper tropospheric water vapor in the Indian Boreal monsoon region. They found two intraseasonal modes of variability (30–60 and 10–20 days) and showed that the 10–20-day wave moves westward to the Arabian Sea from the western Pacific.
TEJ advects atmospheric water, whose origin can be from either the Indian Ocean [
13] or the Arabian Sea [
14]. The higher/lower intensity of the TEJ is associated with:
wetter/drier conditions in the Sahelian region [
15,
16]
wetter/drier conditions in India [
17]
decreasing/increasing number of cyclones in the Bay of Bengal [
18].
Many authors performed studies to identify moisture sources over the Sahel [
2,
19,
20,
21,
22,
23]. However, the relative contributions of these sources vary from one study to another. The differences in the methods and in the spatial and temporal domains used in each of these studies could explain some of the disagreements.
The tropical North Atlantic Ocean [
19,
24], the South Tropical Atlantic Ocean [
25], and the Mediterranean Sea [
24,
26] are considered significant sources of moisture for the Sahel. Nieto et al. [
20] estimated that the Indian Ocean is not an important source, but Salih et al. [
22], using the same model, found that most of the air masses that reach Sahel during the monsoon period come from the Arabian Peninsula, Central Africa or are associated with the TEJ. They also claim that these regions (Arabian Peninsula, North Asia, horn of North Africa, and Indian Ocean) provide 1/3 of the precipitable water for the Sahel.
Furthermore, in a more recent study, Salih et al. [
2] suggest that 40% of the moisture comes from the monsoon flow and that the regions of the Mediterranean Sea, the Arabian Peninsula, and the South Indian Ocean contribute 10.2%, 8.1%, and 6.4%, respectively. The local evaporation contributes 20.3%.
These works suggest a link between the Indian and the West African monsoons, the Indian monsoon being a moisture source for rainfall in Sahel. However, transport mechanisms and the altitudes of which this transport take place remain uncertain.
Thus, our work aims to contribute to the following scientific questions: Is the Indian monsoon directly influencing the African monsoon through transport of upper tropospheric air masses? Is the TEJ the only direct link between these two monsoons regions? Which atmospheric layers contribute the most to the water vapor fluxes?
Hence, this paper presents an analysis of moisture fluxes from India to the Sahelian region in the upper troposphere during the period 1998–2008. We will detail the spatiotemporal variability and the annual cycle of the moisture fluxes before establishing the link between the fluxes and the monsoon dynamics.
2. Data, Models, and Calculations
2.1. Outgoing Longwave Radiation Data
Outgoing longwave radiation (OLR) data can be obtained from polar orbiting satellites of the National Oceanic and Atmospheric Administration (NOAA) Television and Infrared Observation Satellite (TIROS).
Since 1974 they have made two recordings per day of OLR at the top of the atmosphere [
27]. OLR has a large daily variability. Therefore, in this work we used an interpolated daily series of the OLR at a resolution of 2.5 × 2.5 produced by the Climate Diagnostic Center.
2.2. Global Precipitation Climatology Project Rainfall Data
Starting in October 1996, the Global Precipitation Climatology Project (GPCP) started making higher-resolution estimates by working with the geosynchronous-satellite operators around the world to collect histograms of geo-IR brightness temperature on a 1 × 1 grid covering 40° N–40° S at 3-hourly intervals.
The availability of this dataset allowed the development of the threshold-matched precipitation index to estimate precipitation from the 3-hourly geo-IR histograms [
28]. To complete the global coverage, a technique for estimating precipitation outside of the geo-IR coverage using sounding data from low-earth polar-orbit satellites was developed. Together, these form the One-Degree Daily dataset (1DD), which is a first approach to estimating global daily precipitation at the 1 × 1 scale from observationally-based data.
The objective is to use statistical parameters from trusted estimates to constrain the overall behavior of the 1DD estimates, and then to use the geo-IR and sounder data to determine the day-to-day behavior.
2.3. ECMWF ERA-Interim
ERA-Interim is a reanalysis dataset produced by the European Centre for Medium Range Weather Forecasting (ECMWF). It covers the period 1979 to now and atmospheric parameters can be extracted at 6-h intervals (00, 06, 12, and 18 UT) for latitude-longitude grids from 3° to 0.125° for 15 isentropic levels and 37 pressure levels between 1 and 1000 hPa.
ERA-Interim has replaced the ERA-40 archive. The main advances in the ERA-Interim data assimilation compared to ERA-40 are the 12 h 4-D variational analysis; the T255 horizontal original resolution; improvement in the humidity analysis, model physics, and data quality control; variational bias correction of satellite radiance data; and other improvements in bias handling [
29]. The moisture fluxes have been calculated using specific humidity and wind with 2.5° of horizontal resolution from 1998 to 2008 with the following relation:
where
ps and
pt are the pressure lower and upper limits fixed to 500 and 300 hPa in this study,
q is specific humidity in kg·kg
−1,
is the horizontal wind in m·s
−1, and
g is the gravitational acceleration. The resulting moisture flux is
in kg·(m·s)
−1.
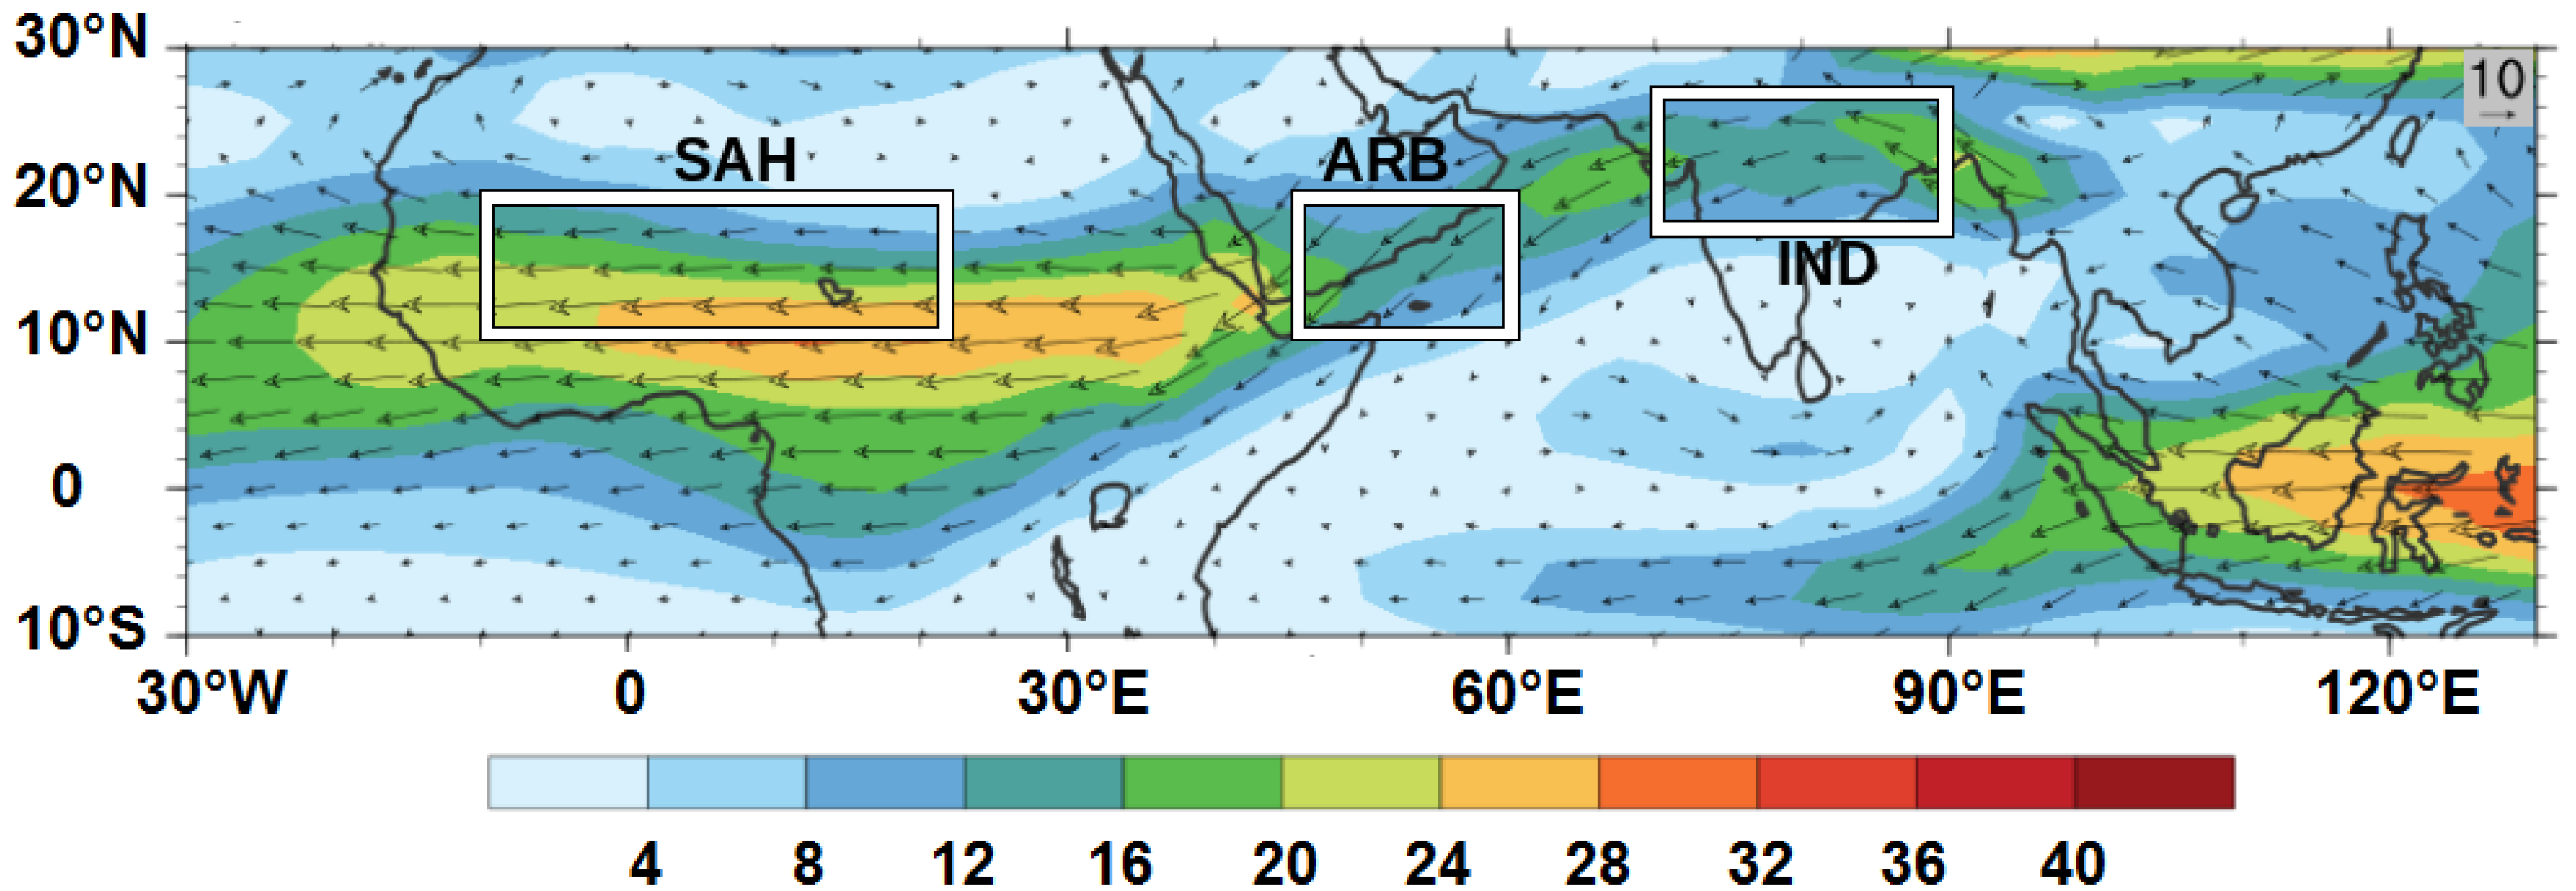
Figure 1 presents the horizontal moisture zonal fluxes calculated from 6-h ECMWF ERA-Interim and averaged from June to September over the period 1998–2008. Three different regions were defined according to the amount of humidity and the intensity of the moisture fluxes in our study area: a North-Indian, a Sahelian, and an Arabian region.
The Sahelian and Indian monsoon zones show westward flows. The Arabian region shows southwestward flows that extend until the boundary of the Indian zone. These observed average movements give the climatological trajectory of circulation and transport at 500–300 hPa according to the Intertropical Convergence Zone (ITCZ).
In order to follow the trajectories of air masses from India and quantify the number of trajectory plot arriving over Sahel, we calculated forward trajectories with LACYTRAJ (LACY TRAJectory code) ([
30]. LACYTRAJ is a 3-D kinematic trajectory code using initialization wind fields from ECMWF ERA-Interim re-analyses with a horizontal resolution of 1° in latitude and longitude, and 37 vertical levels. Each trajectory point is advected using a bilinear interpolation for horizontal wind fields, and time and a log-linear interpolation for vertical wind field. The time resolution between two trajectory points is 15 min. Four clusters of 14 days forward trajectories are calculated by day from July 18 to August 15, and from 1998 to 2008. The starting domain is from 17 to 23° N and from 74 to 80°E with a resolution of 2 degrees, and on three vertical pressure levels (±10 hPa) around 300, 400, and 500 hPa. Then, with this configuration, one year of calculation corresponds to 5.6 × 10
6 trajectory points. LACYTRAJ has been first used for stratosphere–troposphere exchange studies [
30], and then for many other applications such as long-range inter-hemispheric transport of carbon monoxide [
31], interaction between the mixing layer and the free troposphere [
32], transport of subtropical cirrus clouds [
33], or air mass determination of Cloud Water Samples at Puy de Dôme [
34]
3. Description of the Dynamical Context
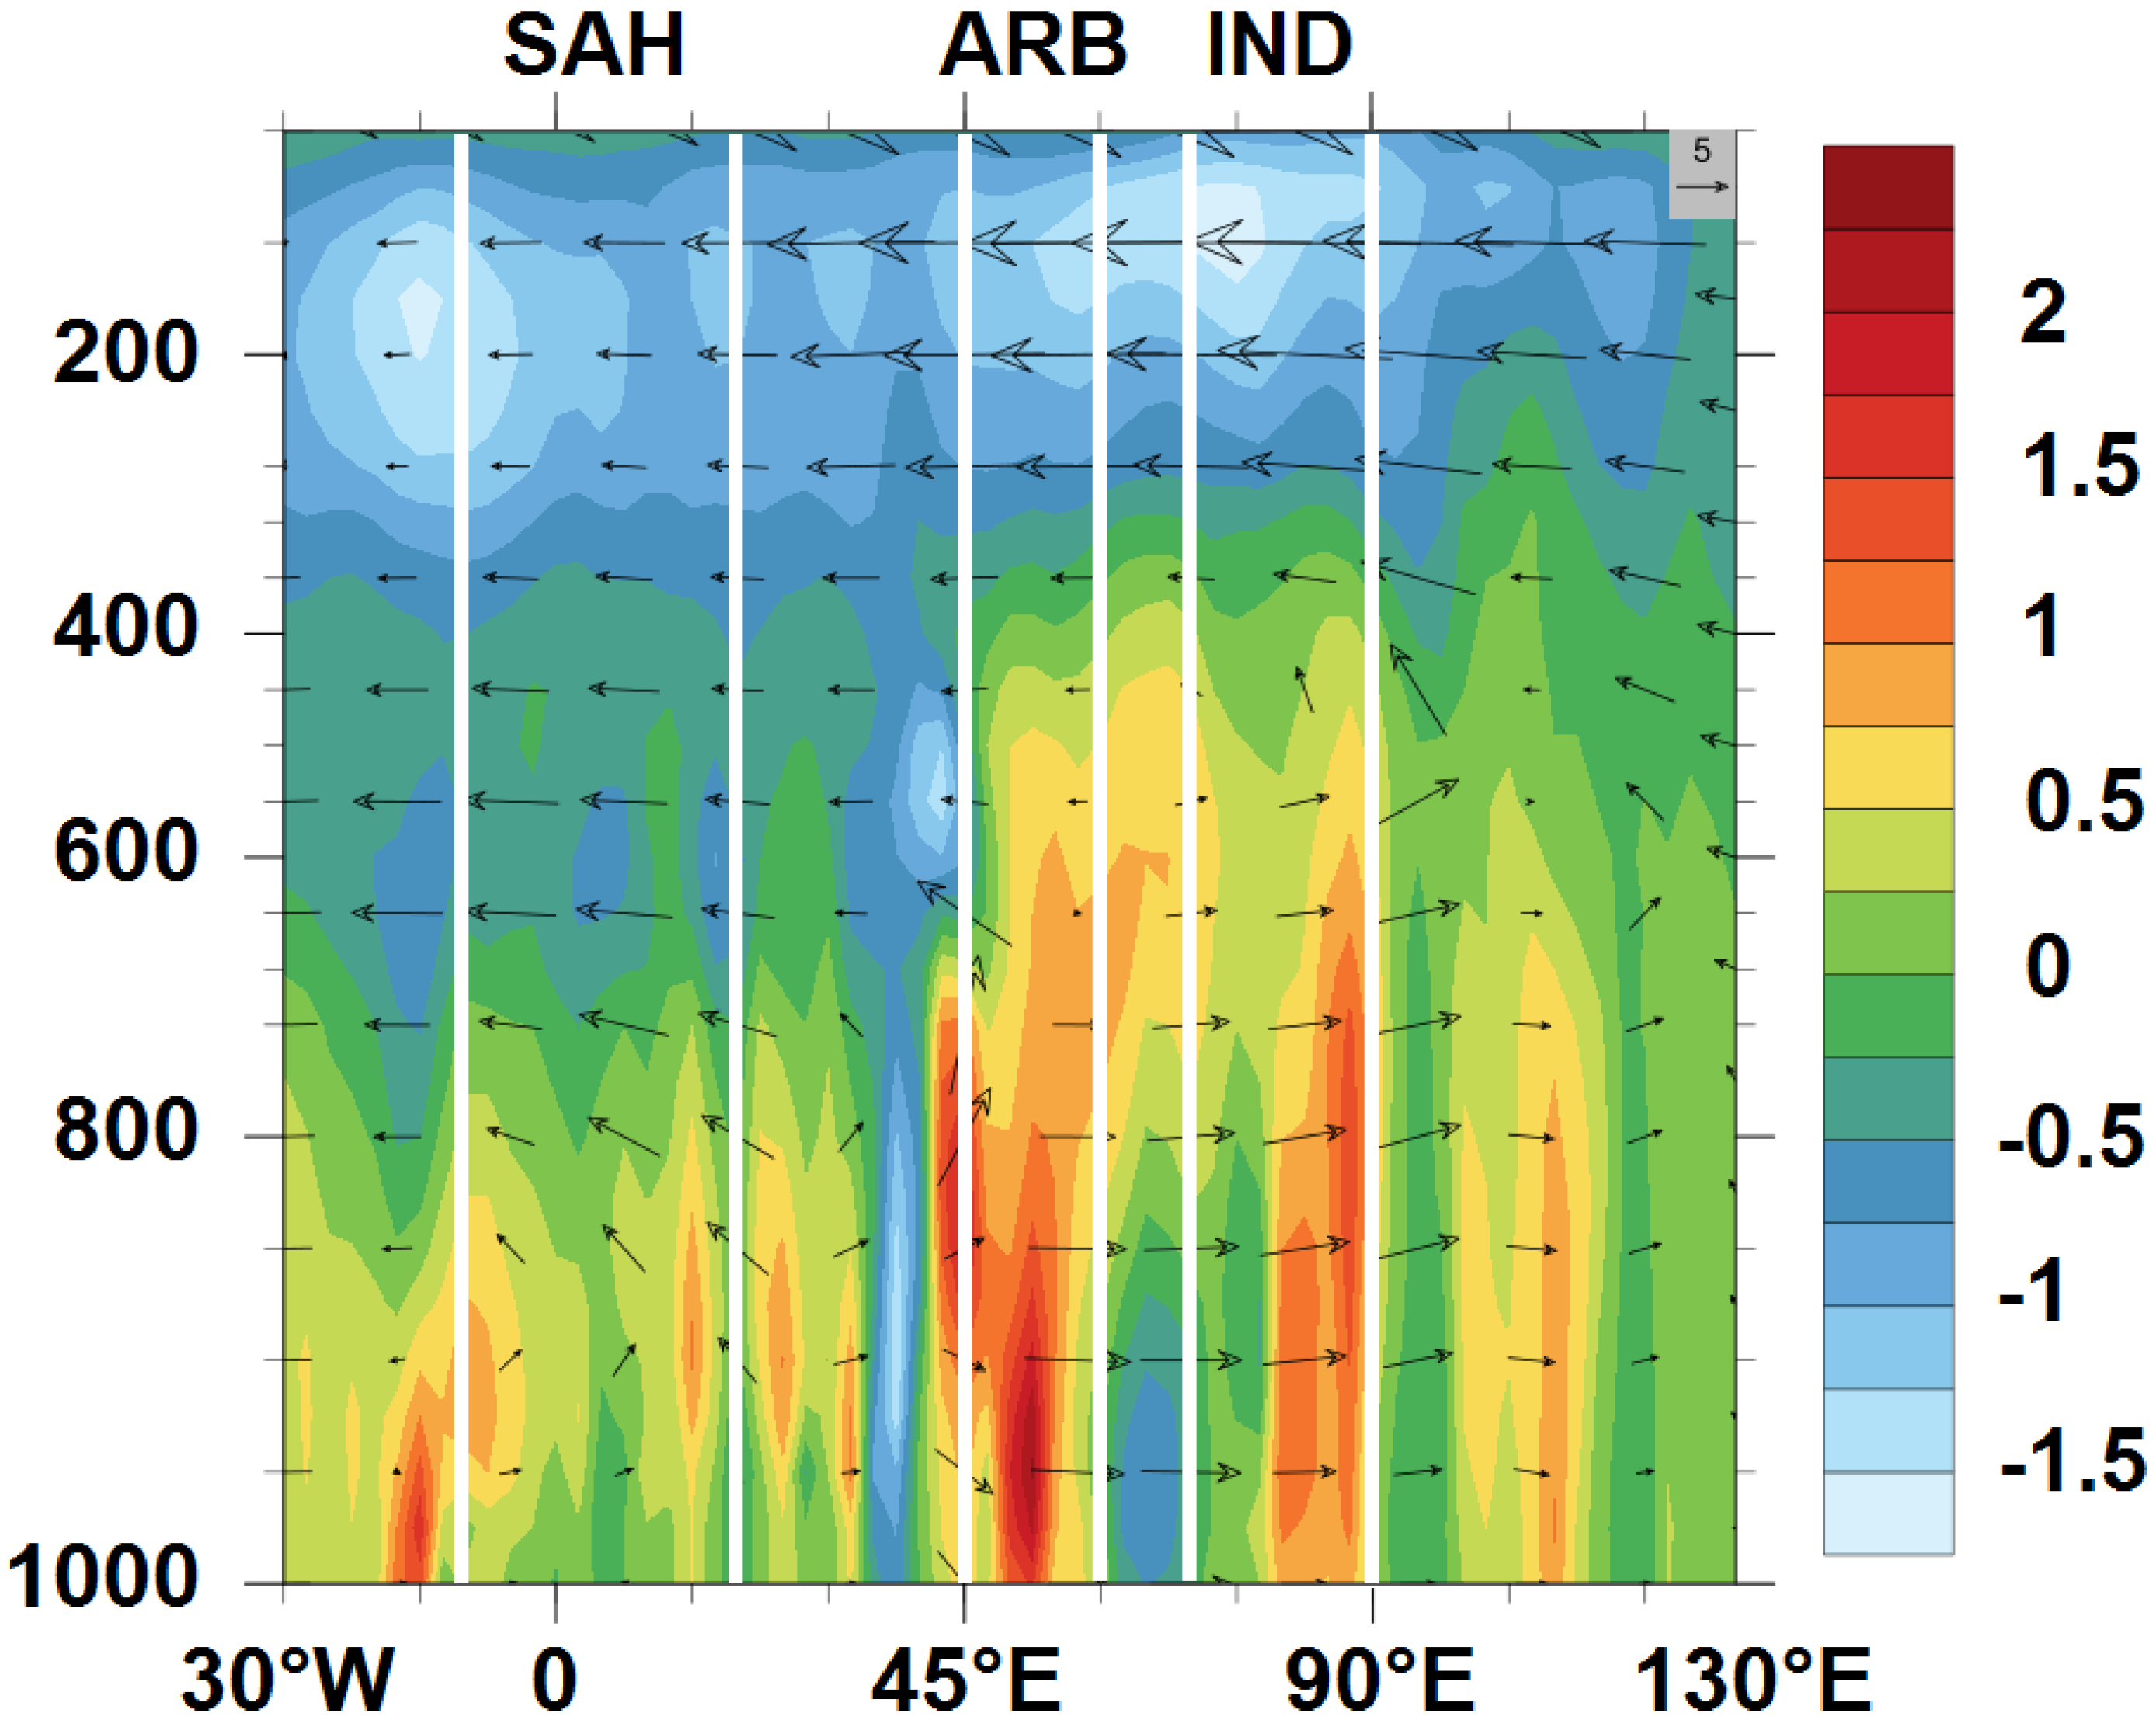
In order to determine the water vapor injection mean altitude in the Indian monsoon zone and the altitude of the TEJ, we calculated the 3-D wind and relative vorticity distributions averaged between 30° W and 130° E from June to September (
Figure 2).
The relative vorticity is a dynamical parameter available in ERA-Interim products. In the northern hemisphere, when the relative vorticity is negative, it indicated a cyclonic movement favoring upward movement of air by convection. A positive value indicated an anticyclonic circulation favoring subsidence of air. In the Indian zone, the monsoon height exceeded 600 hPa due to convection. A cyclonic circulation from the lower atmosphere to the Somali coast contributed to the upward flow over India. The altitude of the TEJ was between 300 and 150 hPa, with winds having a westward component and a decreasing intensity from India to the Sahel in the upper troposphere, near 200 hPa.
The upward movements over India were observed up to 100 hPa. Between 65° E (Western India) and 30° W (Atlantic Ocean), the upward flows did not reach the 500 hPa level. Wind vectors in this area were directed westward above 500 hPa.
The vorticity distributions indicated convective and cyclonic activity in the west (Africa) and the east (India). The vertical injection of water vapor was noticeably higher in the east (Indian side), reaching 500 hPa, than in the west. Vertical movements in the Sahel were limited by the upper tropospheric anticyclonic circulation, taking place more significantly in the middle troposphere (700 hPa).
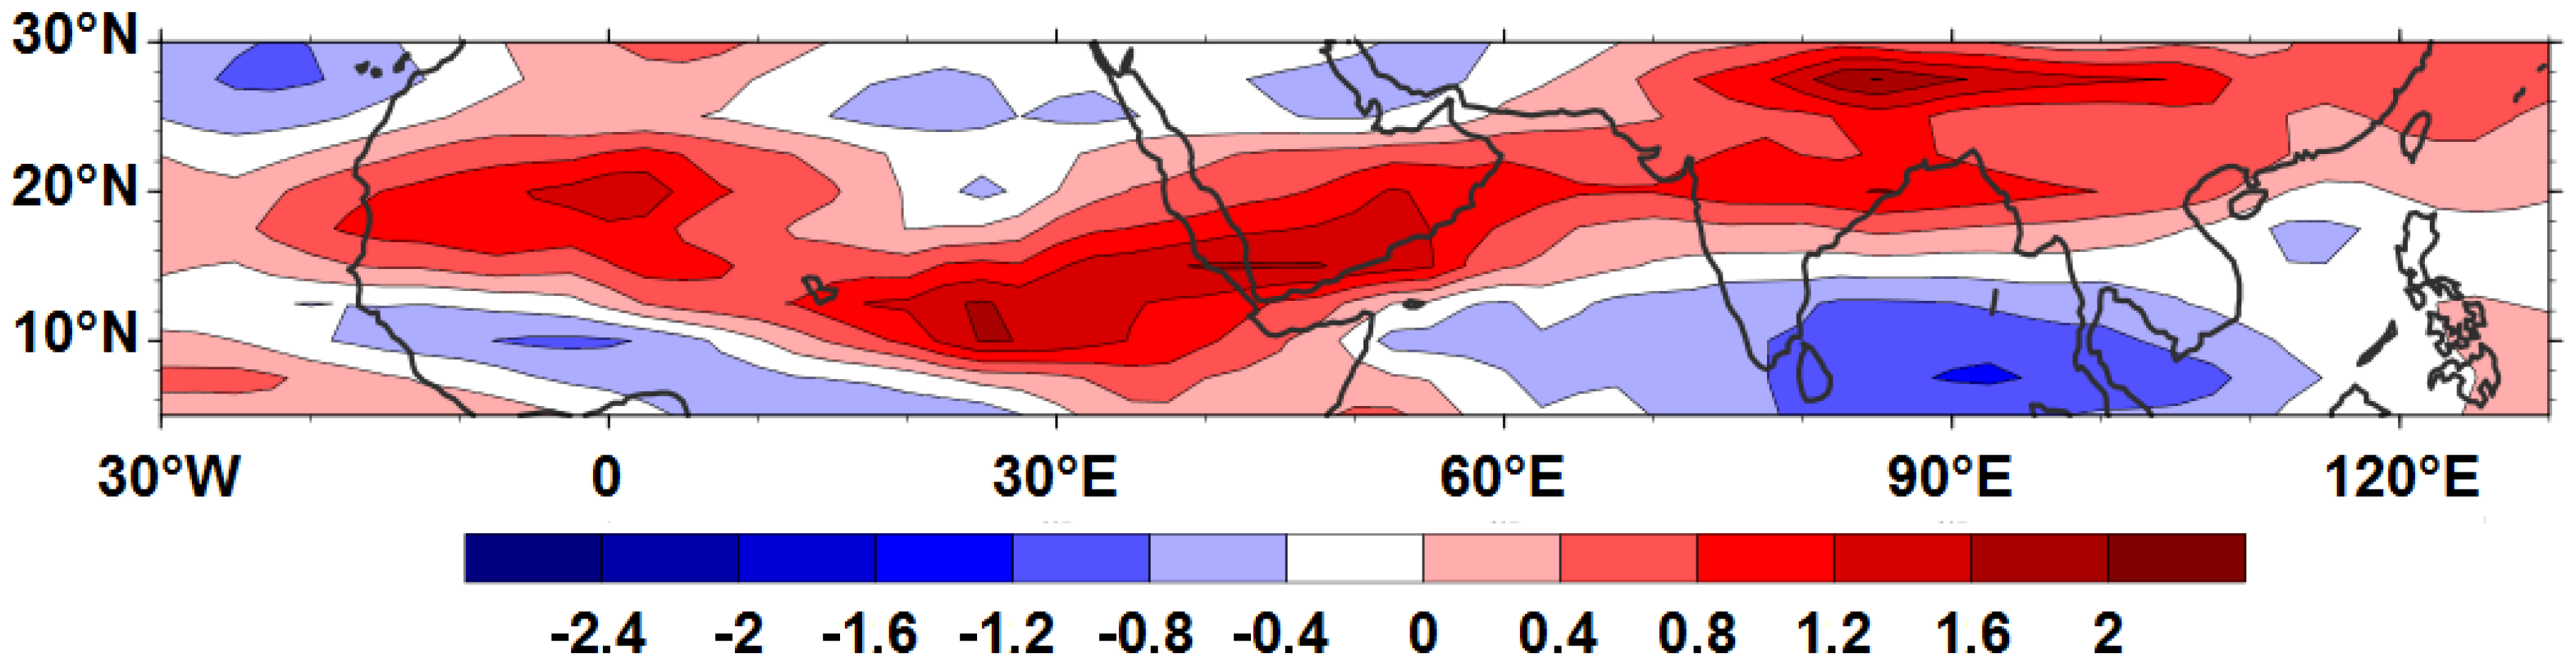
The climatology of the divergence of air between 500 and 300 hPa from June to September over the period 1998–2008 over 0–30° N and 30° W–130° E covered both Indian and Sahelian summer monsoon systems, and indicates a more or less divergent atmosphere (
Figure 3). The divergence of the air at this altitude level described a band connecting the north-east (30° N–85° E) in Asia and south-west (10° N–10° E) in Africa. This band covered the northern part of India and highlights, on the Asian continent, a maximum of divergence observed over 28° N–85° E. A second lower intense maximum was observed over India (20° N). This led to a region of maximum divergence from the Arabian Sea at 10° E centered at 10° N. A zone of divergence was also notable a little further north, from 10° E to the Atlantic Ocean.
4. Dynamical Analysis Based on Trajectory Statistics
In order to establish how the individual air masses followed the climatological wind behavior described in
Section 3, we calculated a forward trajectory statistical set that started from the upper troposphere over India, between 300 and 500 hPa during the monsoon season.
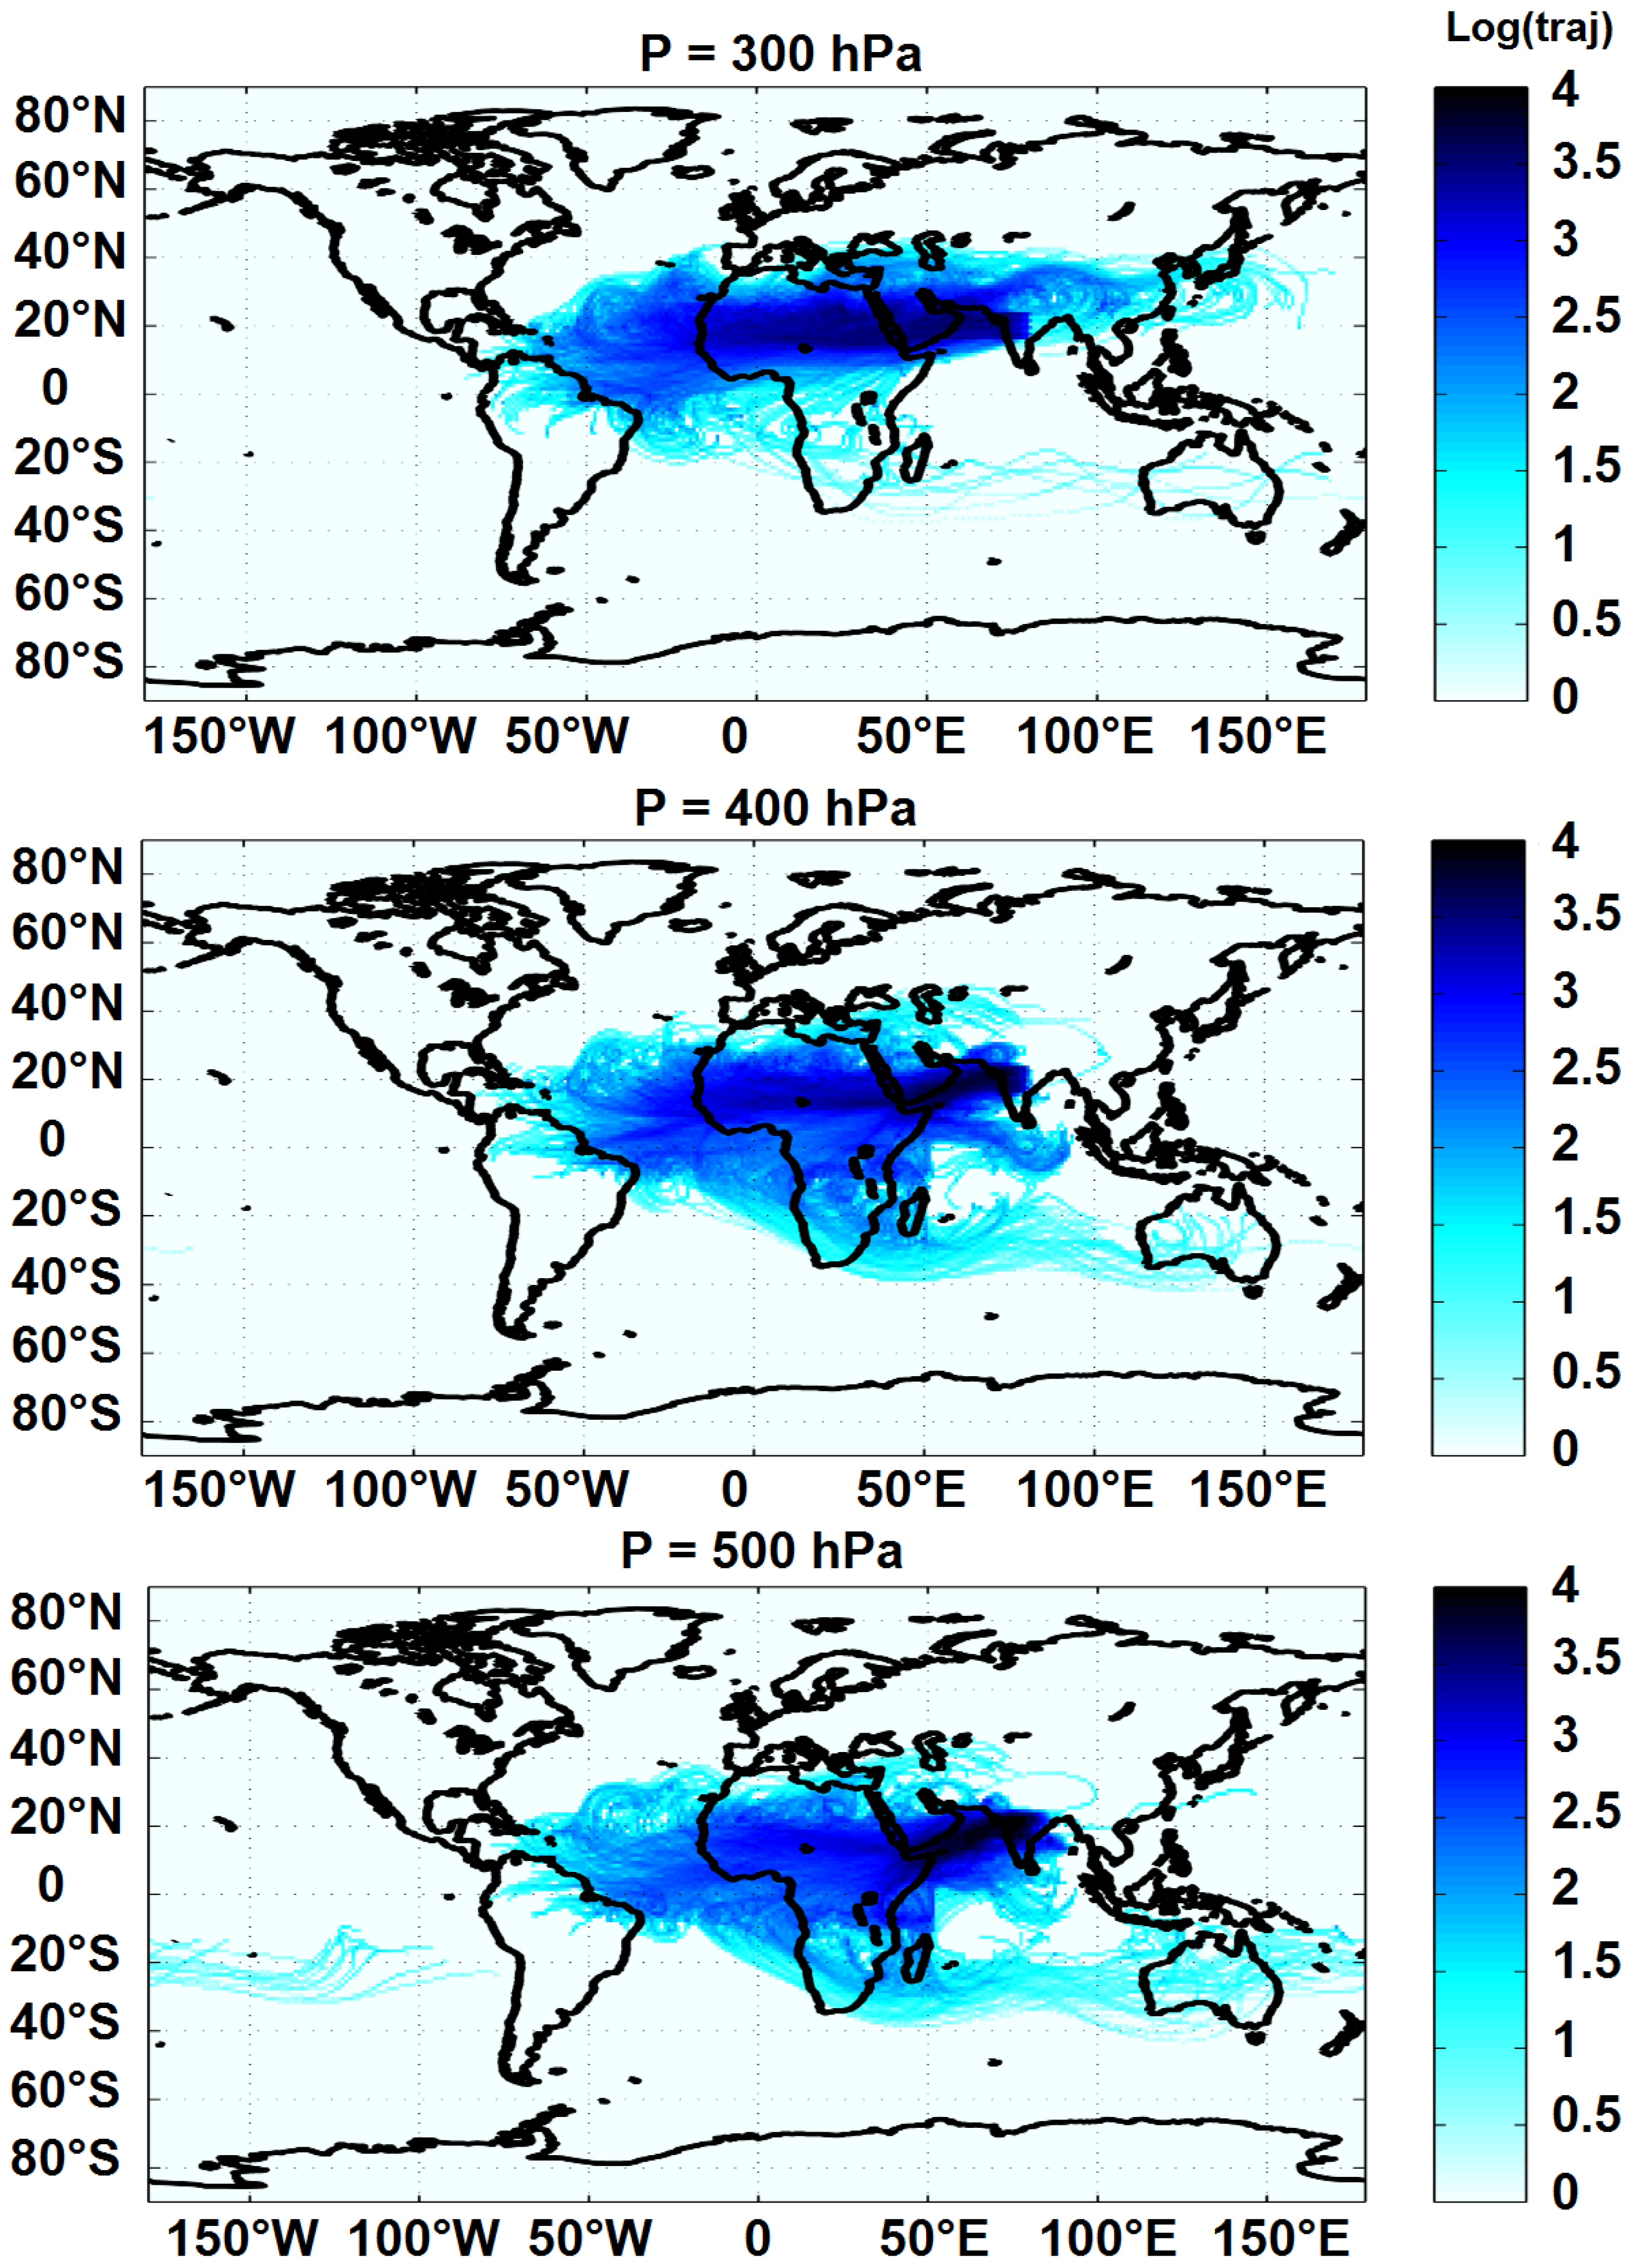
Figure 4 presents the log probability density of trajectory points that left India every 6 h between the July 1 and the August 15, corresponding to the maximum monsoon period in India and Sahel, from 1998 to 2008. We delimited the Sahelian zone (10–20° N, 10° W–20° E) and quantified the proportion of trajectories that passed above this zone. We observed that a large proportion of the air masses, starting from a pressure level between 500 and 300 hPa of India, were found in Africa a few days after their departure. By establishing the global calculation, taking into account the three pressure levels and the 11 years, this proportion was 42%.
Figure 4 shows that air masses left latitudes around 20° N over India at 500 and 400 hPa pressure levels were oriented from north-eastern India to the south of Africa. At 300 hPa, we observed a more direct path, from the east, towards Africa.
The percentage of parcels that passed over the Sahel more precisely, depending on years and pressure levels is given in
Figure 5.
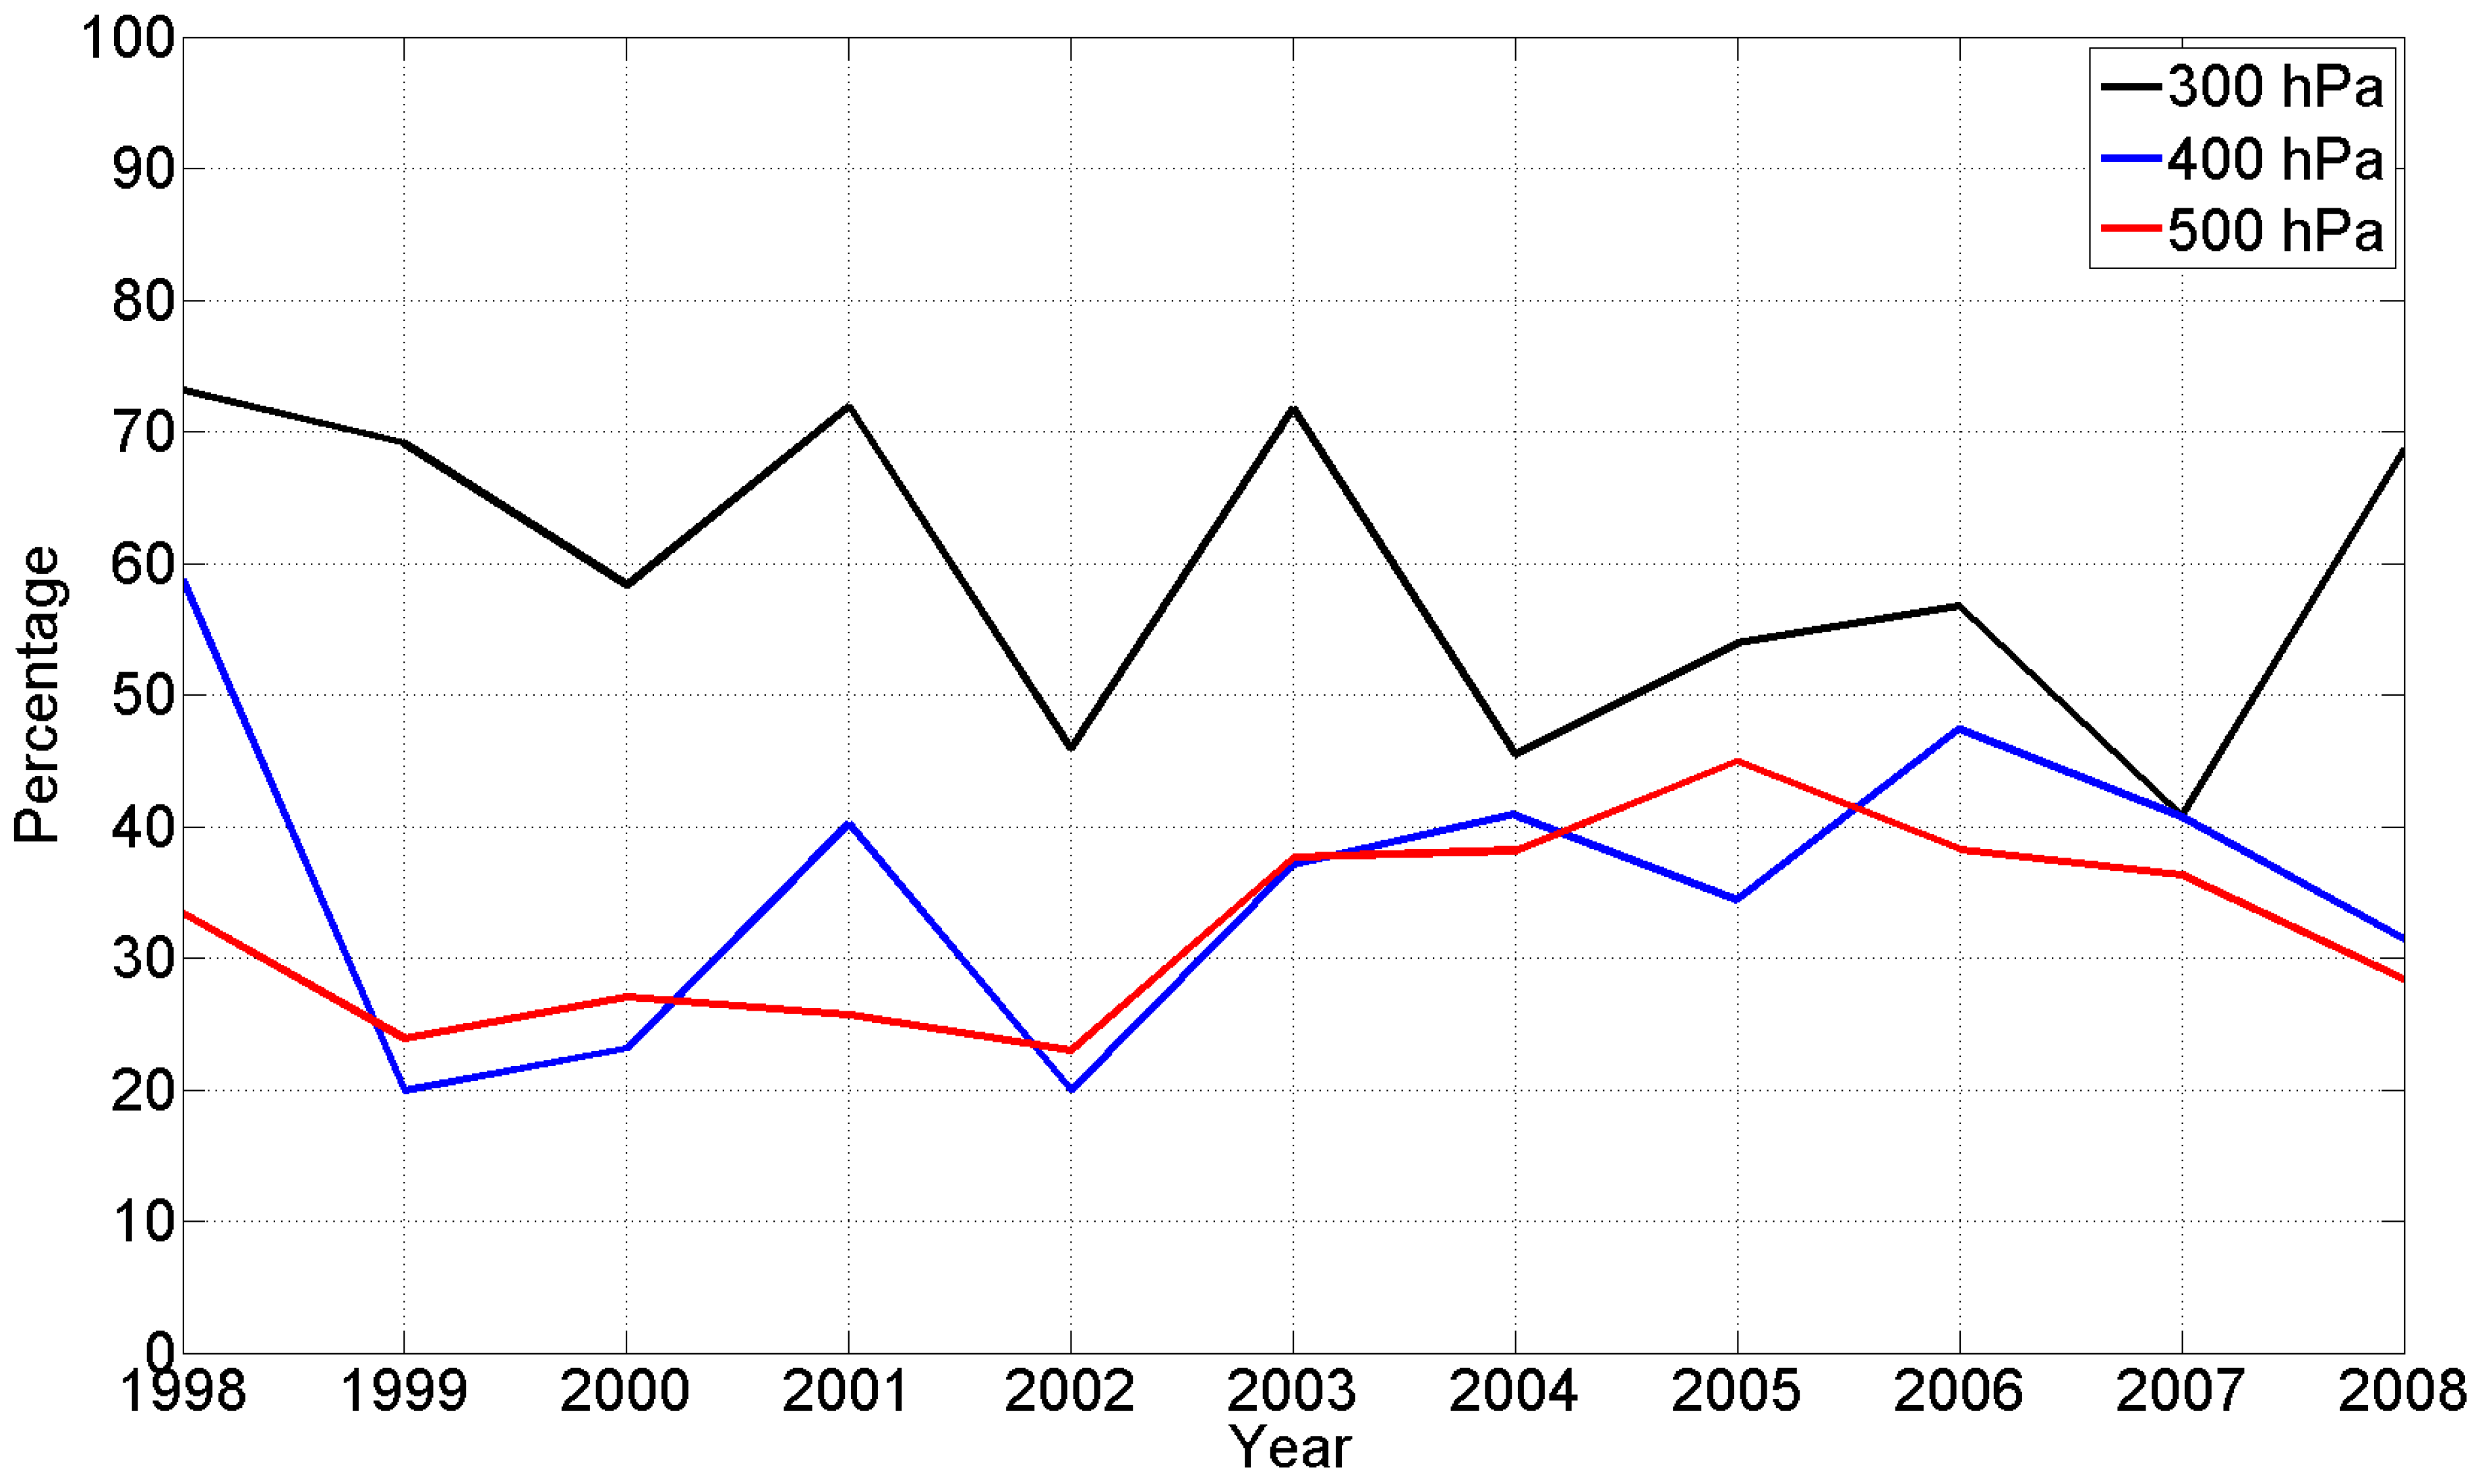
We found that the proportion of trajectories passing above the Sahel was all the more important as their altitude of origin was high. Over the 1998–2008 period, the proportion was 59% at 300 hPa, 36% at 400 hPa, and 32% at 500 hPa.
The air masses observed from July 18 to August 15 above Sahel had a residence time not exceeding 11 days. Most of the time, the residence time was between 7 and 11 days. The air masses took 5 to 14 days to reach Sahel, depending on the altitude of departure from India and on the year. We also note that some of the parcels crossed the ITCZ and moved eastward under the influence of the southern hemisphere subtropical jet stream, reaching Australia.
Figure 5 shows also that the inter-annual variability of the proportion of air masses passing over Sahel was relatively large. Whatever the level considered from 300 to 500 hPa, there was more than a factor of two between the years when this proportion was low (2002 as an example) and those where it was important (2001 or 2003).
The proportion of inter-hemispheric transfer was greater at 500 hPa (6.7%) than at 300 hPa (5.7%), which was not negligible, but remained low compared to the proportions of air masses passing over the Sahel. Such inter-hemispheric transport of biomass burning plumes has previously been observed [
31].
5. Mean Flux Calculations
In this part, we detail the evolution of flux established with the method described in
Section 2.3 based on monthly means dynamical and humidity fields. It is to be noted that both humidity and winds were highly variable on hourly, daily, and weekly timescales, and in this section, we will document only larger timescale variations. Between June and September, the ITCZ covers India and Africa. In this intertropical band, two more humid zones could be distinguished, the first one around India being much larger and another one in western Africa, with a less humid interface zone between India and Africa (
Figure 1). The dynamical link between the Sahel and northern India (north of 15° N) was characterized by a high tropospheric westward transport characterized by the trajectory approach in
Section 4 and analyzed here in terms of three-dimensional mean fluxes.
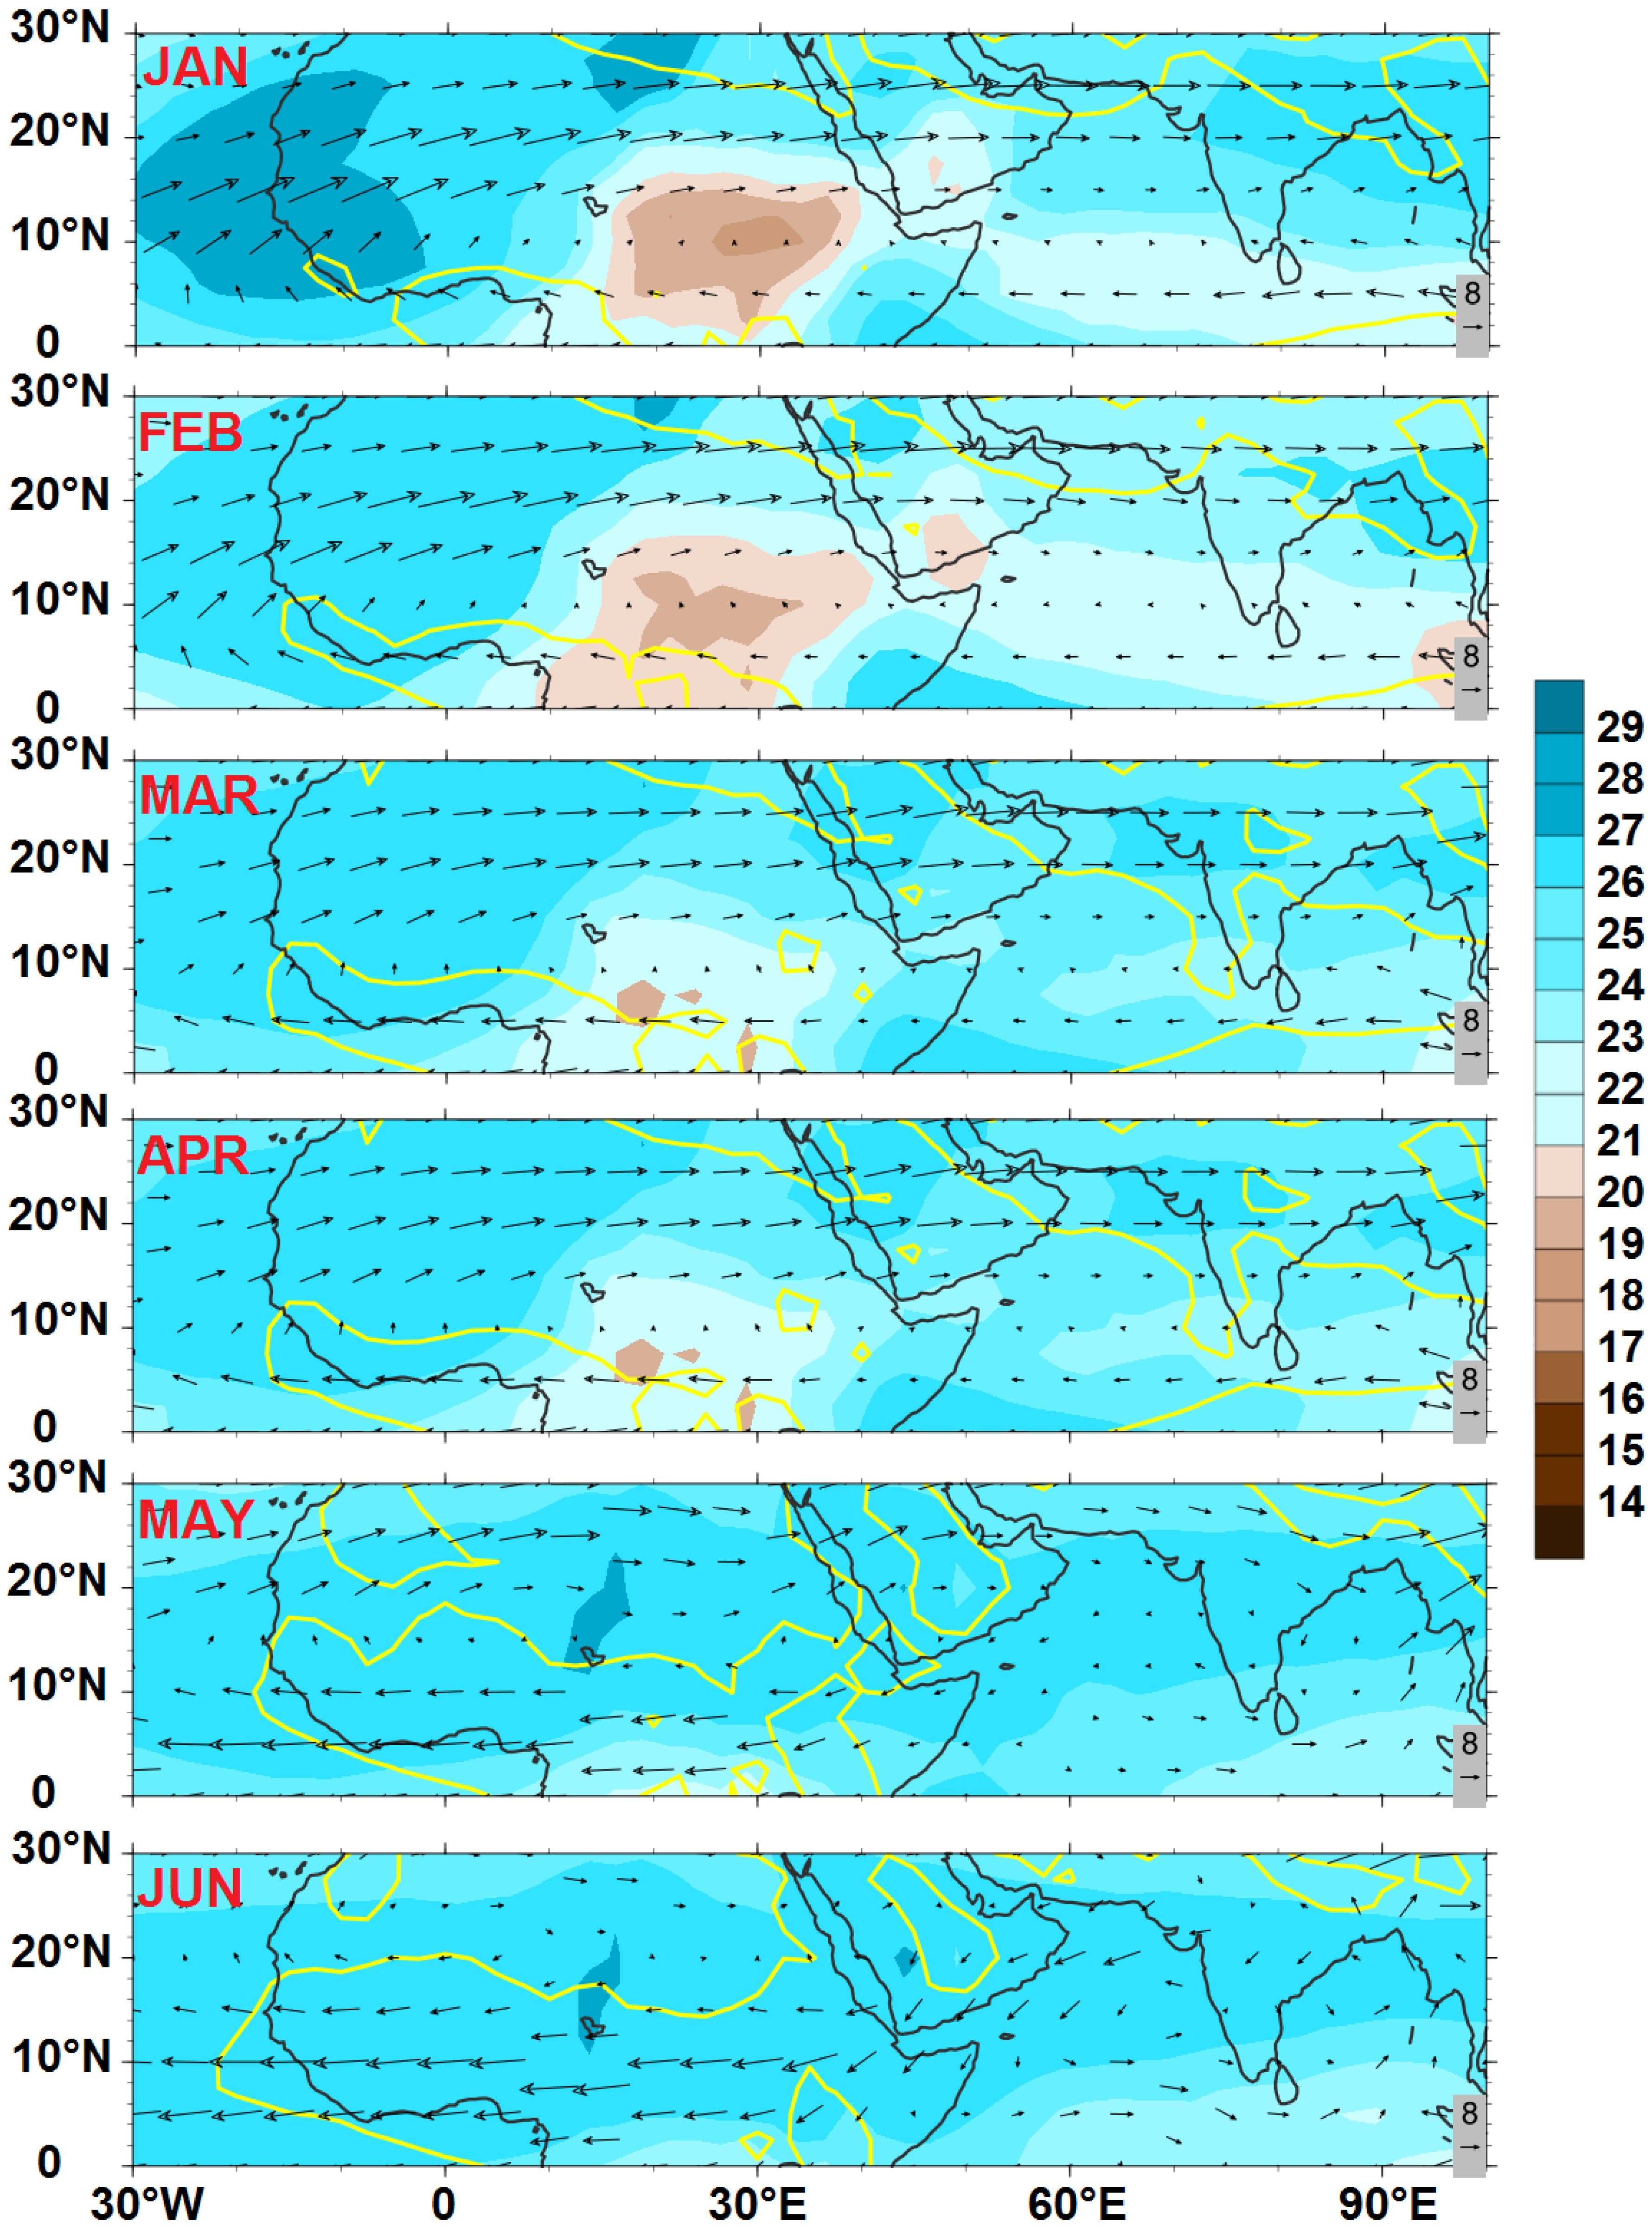
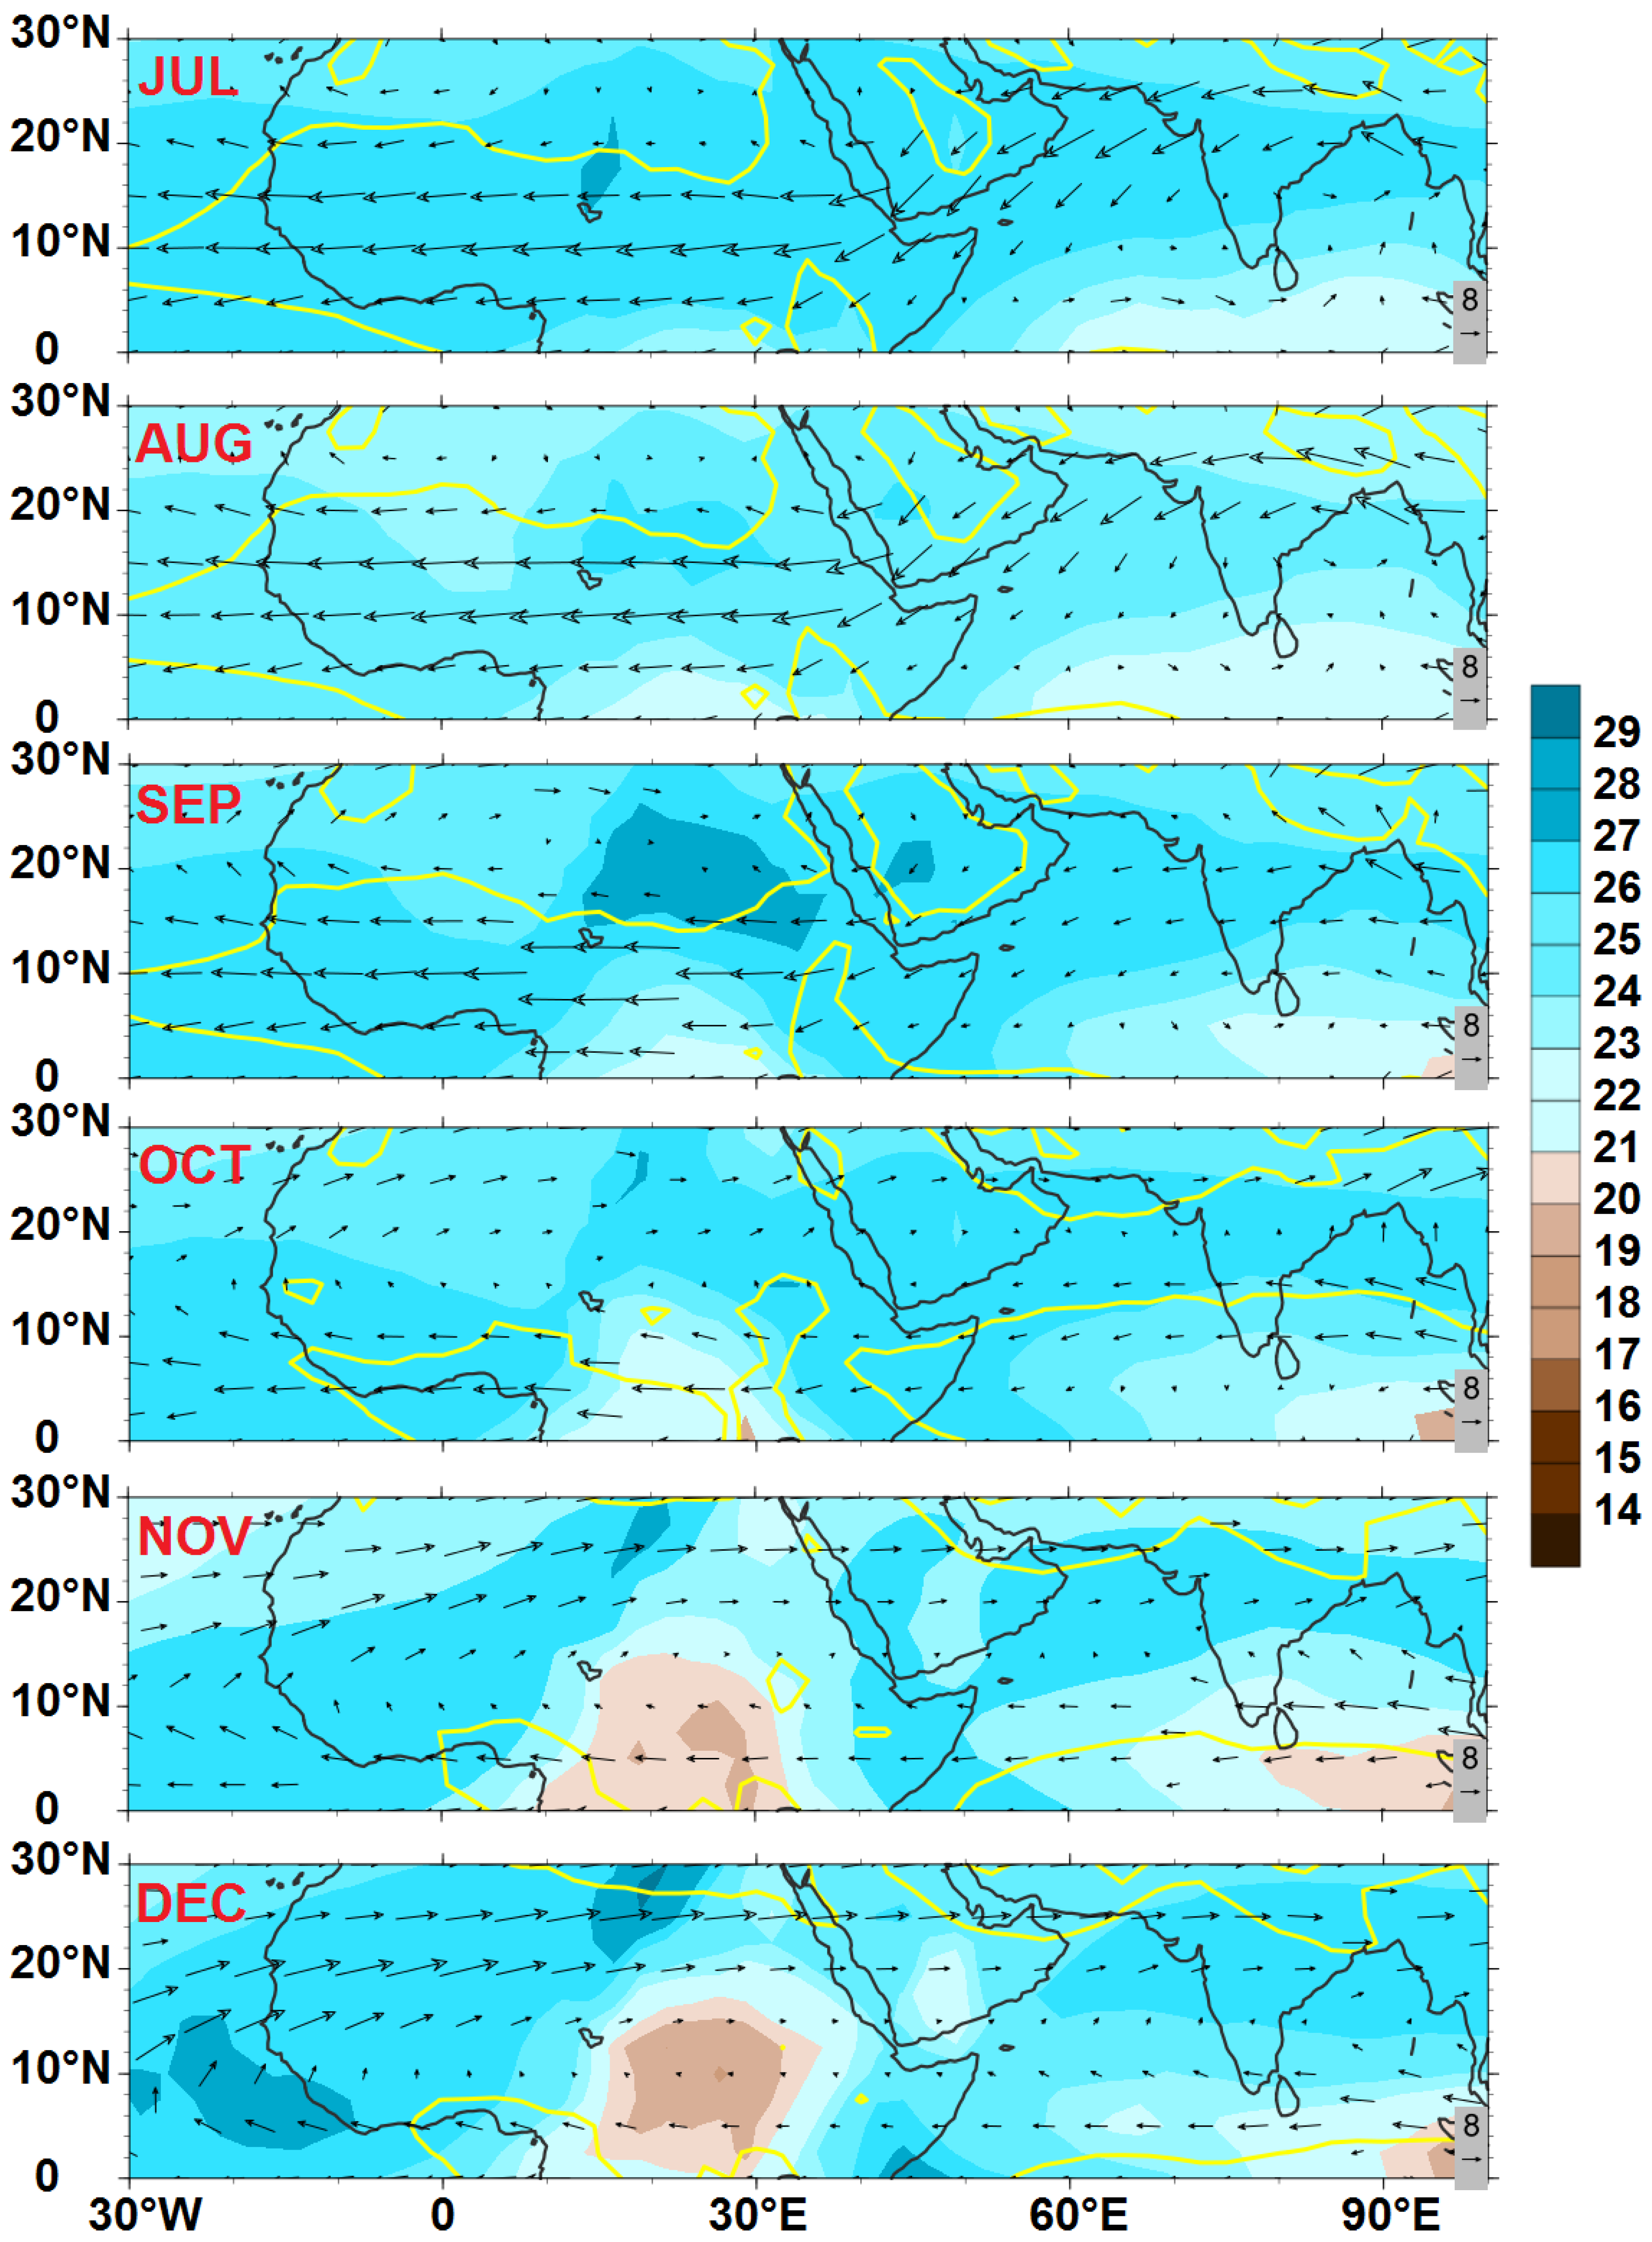
Figure 6 shows the monthly mean flux for the 11 years of study (1998–2008), with respect to convective activity provided by OLR distributions.
The meridional shift of ITCZ in western Africa (yellow lines of
Figure 6) is associated with westward flux circulation from 500 to 300 hPa (vectors of
Figure 6). This westward flux was located in a zone where strong convection was surrounded by the 925 hPa zero zonal wind isoline that delimits the rain zone. The ITCZ appeared in June in the Sahelian latitudes. At the same time, we observed an extension of the westward flux until 70−80°E in India with a north-east circulation along Arabia. At this time, the flux of north-eastern India was of low intensity and the convection was not yet well established there.
After July, the Indian monsoon reached the latitudes located north of 20° N, allowing the reinforcement of these westward moisture fluxes. They continued until August and begin to decrease in intensity in September. The withdrawal of the Indian monsoon from these latitudes (north of 20° N) considerably decreased the intensity of these fluxes from this region. The westward zonal fluxes followed a regular cycle in three phases (installation, intensification, and clearing), similar to that of the Indian and African monsoons convections, and identical in India and Africa.
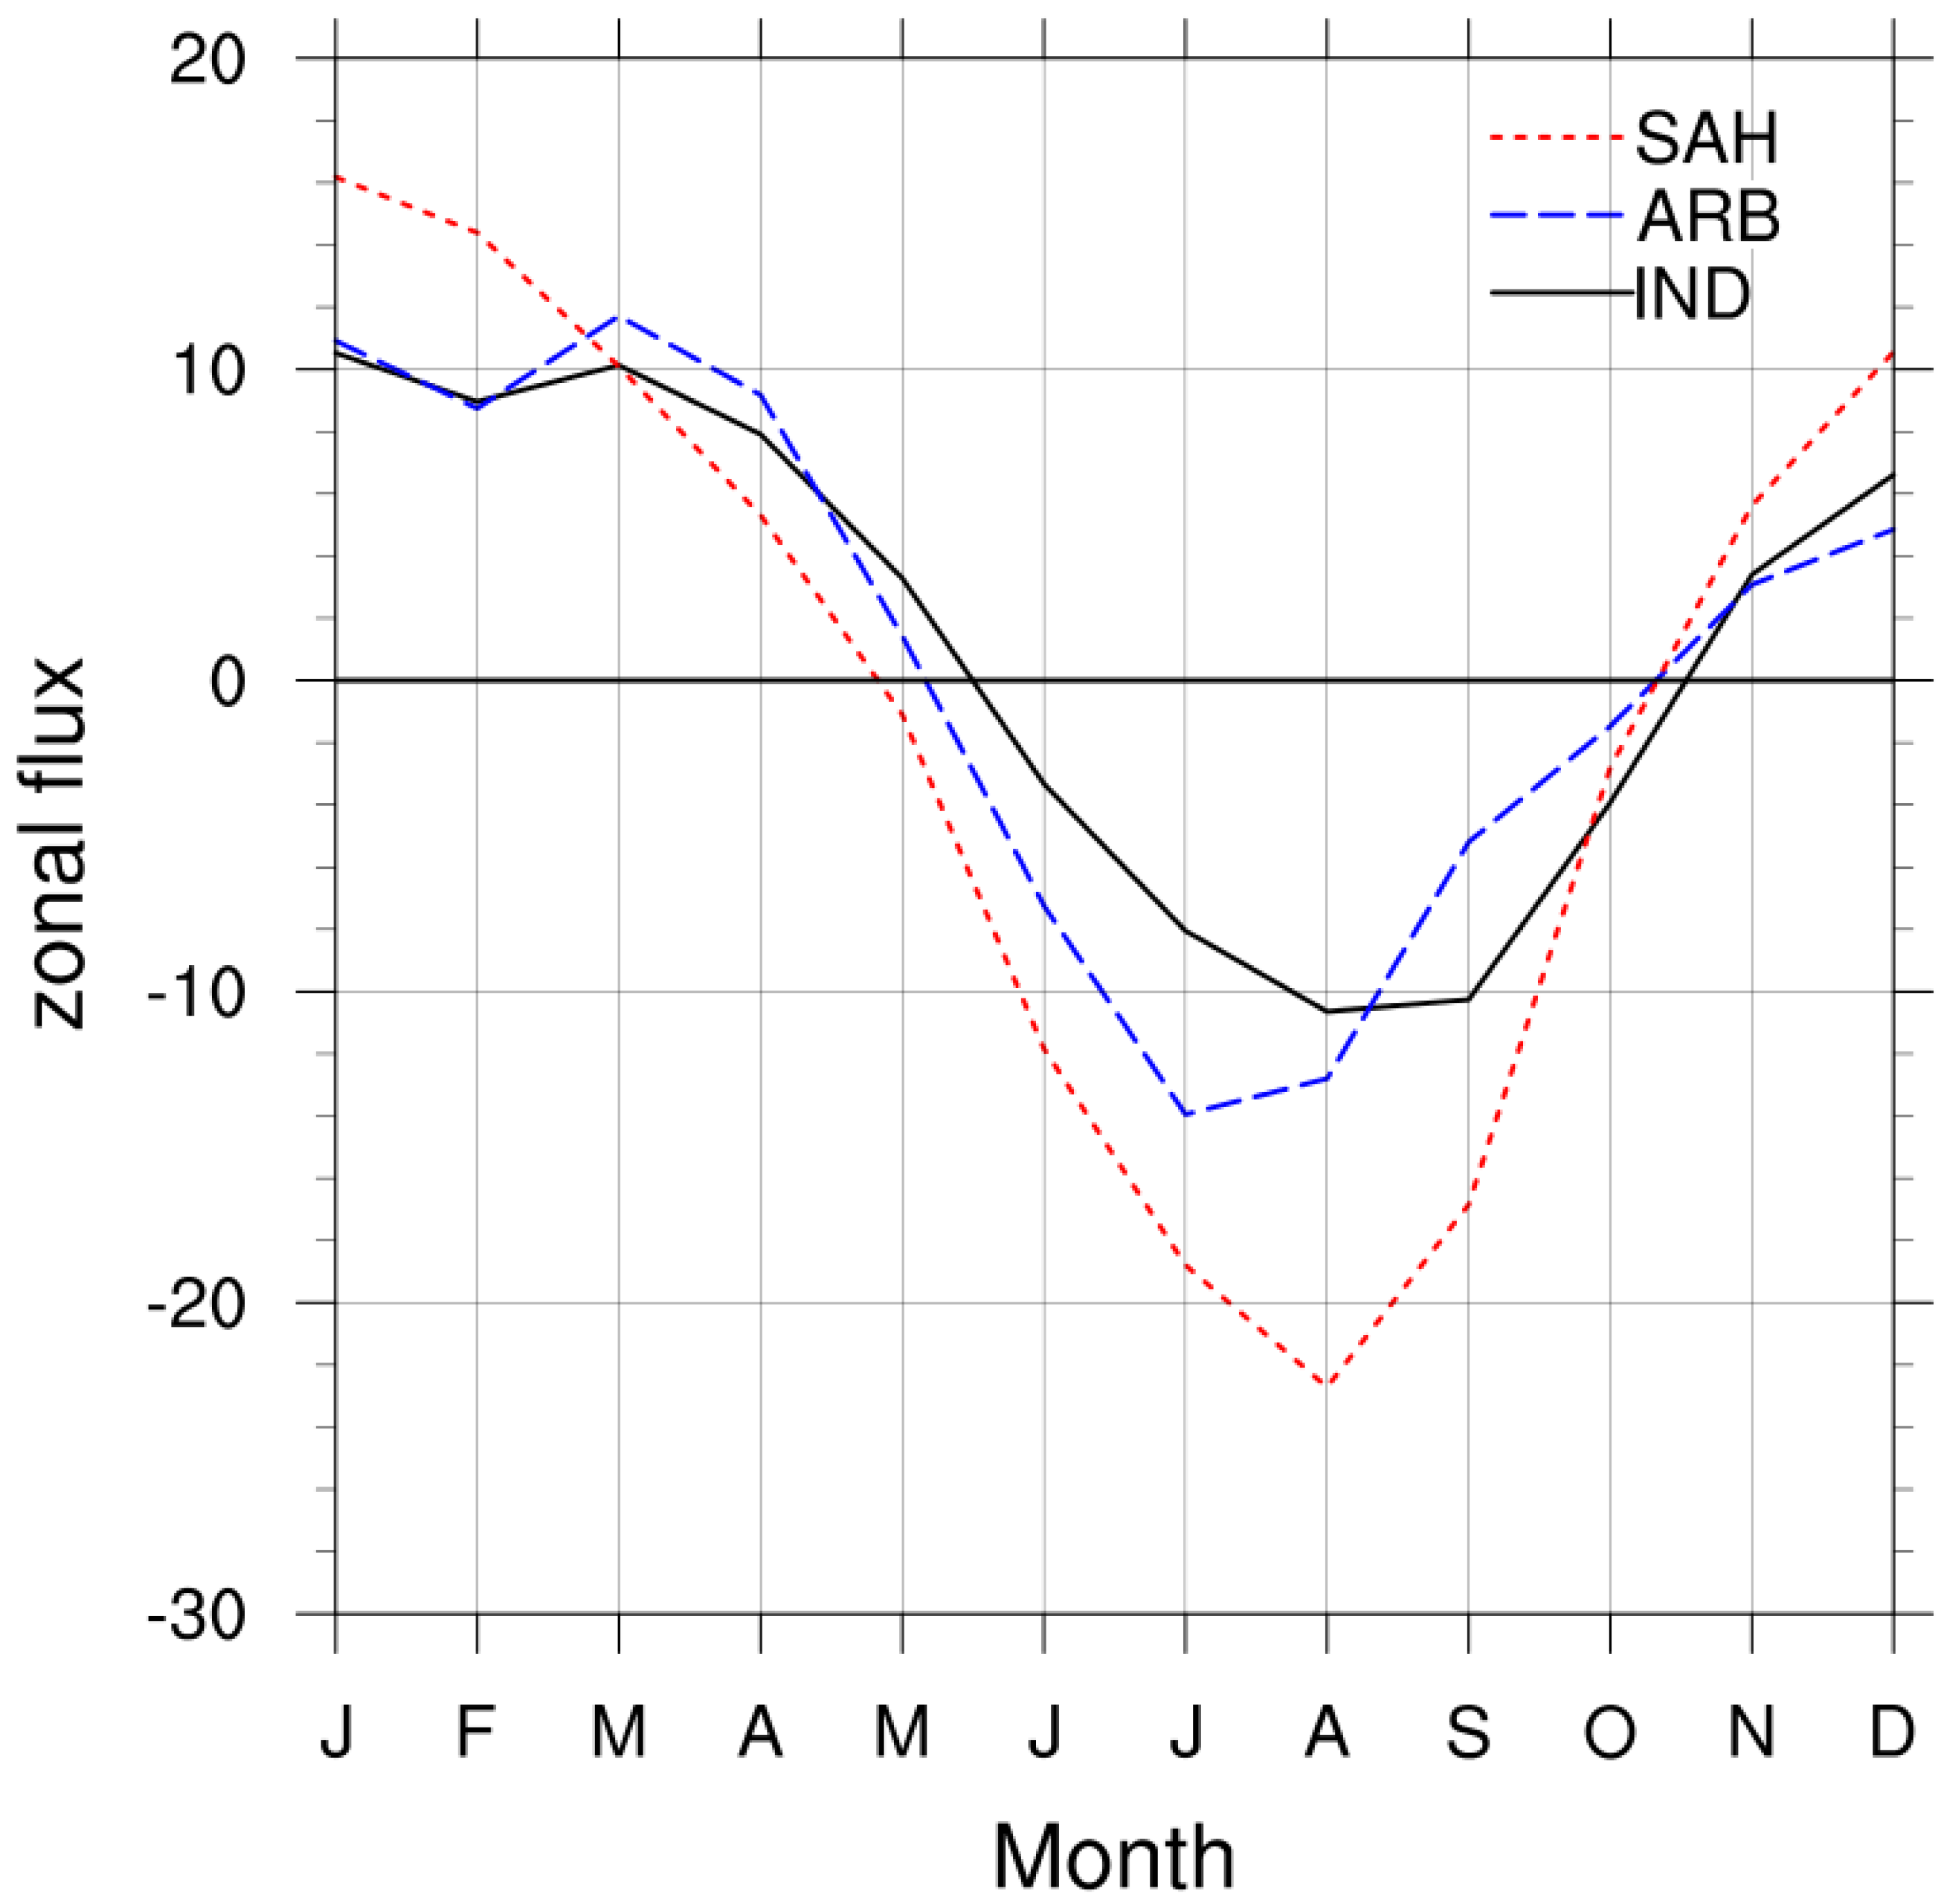
Figure 7 presents the monthly mean of zonal flux calculated from 6 h ECMWF ERA-Interim and averaged over different areas (India, Arabia, and Sahel) between 500 and 300 hPa. Eastward fluxes were observed in India and Arabia from January to May, their intensity decreased and westward fluxes were observed in June. In Sahel, westward fluxes took place after May. These westward fluxes were established in the three zones (India, Arabia, and Sahel), their intensity increased and reaches their maximum in Sahel and India in August and in Arabia in July. Then the intensities gradually decreased, and eastward fluxes were established in November.
The establishment of fluxes was highly variable from one year to another. In Sahel, the flux was maximal in August whatever the year during the period of study (1998−2008). If we compared these fluxes for each region, the monthly mean intensities were higher in Sahel over the entire monsoon season, except in July 2000, when larger values exceeding 20 kg·(m·s)−1 were observed in India. In 2000, in Sahel and Arabia, zonal flux did not exceed 10 kg·(m·s)−1, constituting the lowest value for 1998–2008. In the two other regions, monthly means were highest in August 1998, with values exceeding 30 kg·(m·s)–1 in Sahel and 25 kg·(m·s)−1 in Arabia.
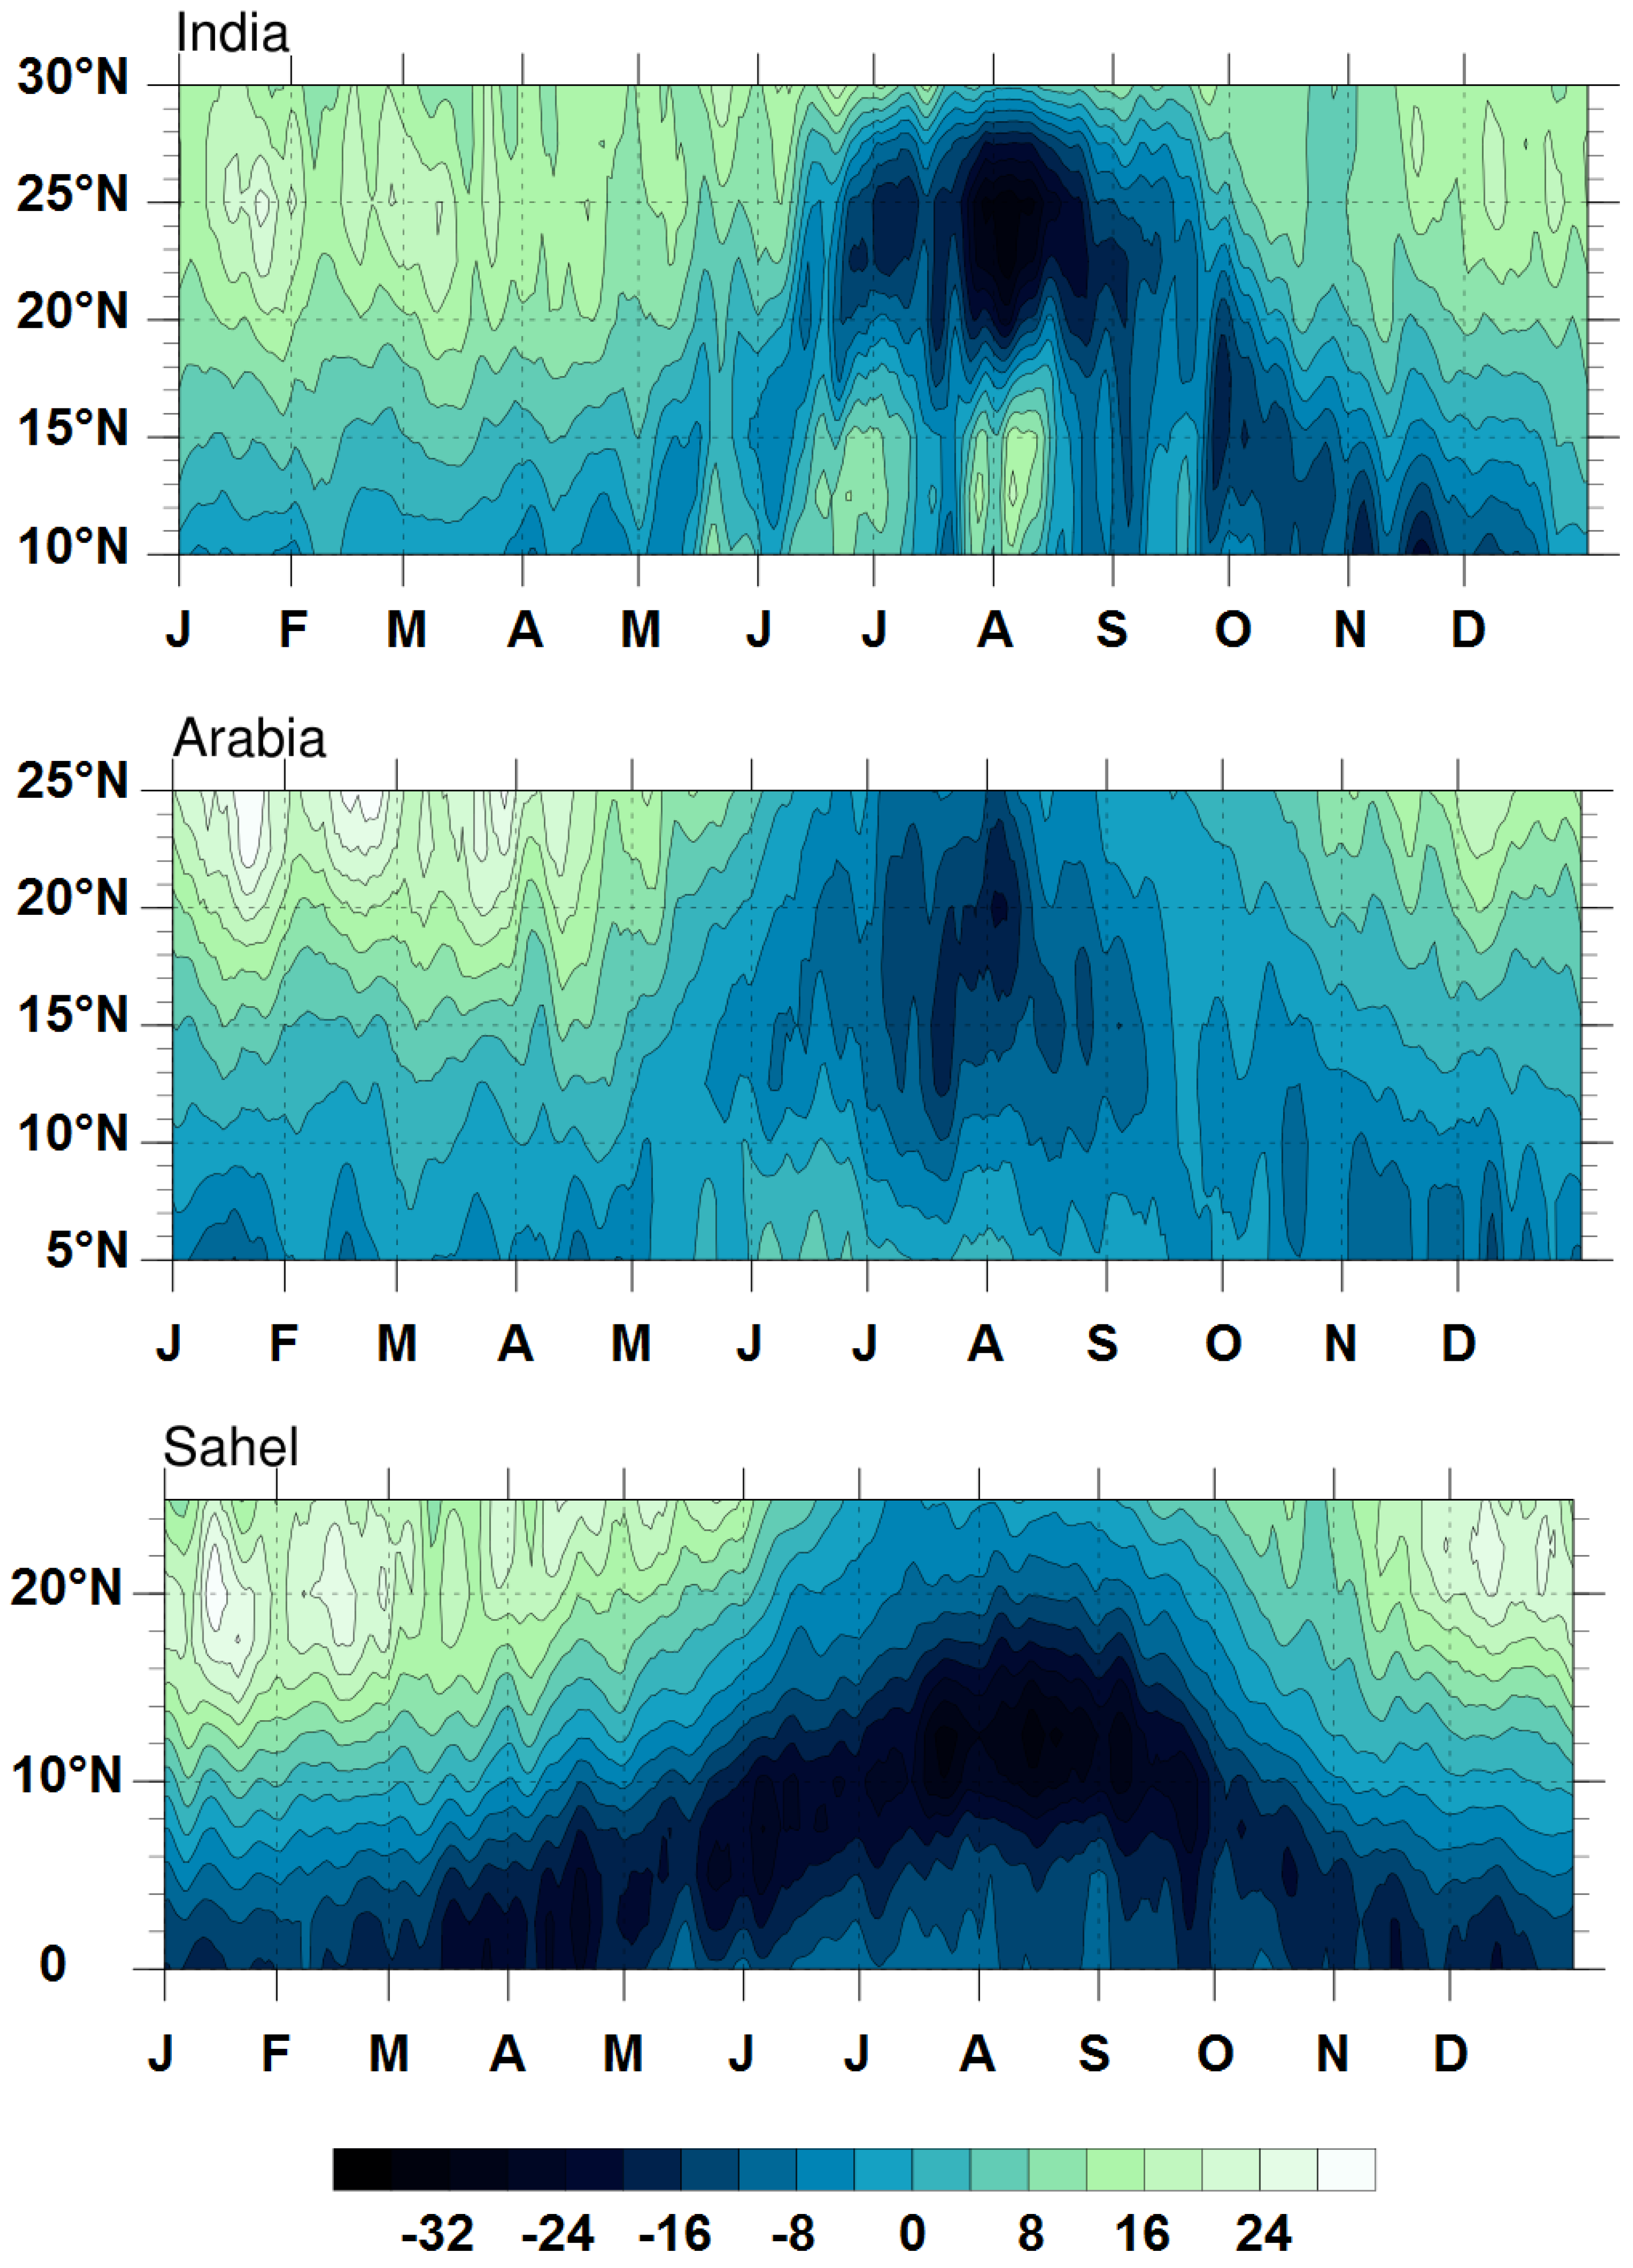
6. Spatiotemporal Variability, Annual Cycle of the Westward Flux, and Link with Monsoon
The objective of this section was to characterize the evolution of the westward fluxes at timescales larger than 5 days, as functions of latitudes and time, in order to compare the latitudinal cycle of these fluxes with that of ITCZ and monsoon. The zonal wind variations were different in the three areas considered to be involved in transport—India, Arabia, and the Sahel—as defined in
Section 5.
Figure 8 presents the time-latitude diagrams of zonal flux between January and December averaged over the period 1998–2008, above India, Arabia, and Sahel.
We observed westward-oriented fluxes over the three regions, whose intensity varied from one region to another. Their duration and their temporal variability also took different forms. In Sahel and Arabia, westward transport was observed at the begin of May with values of flux reaching 12 kg·(m·s)
−1 in Sahel and a few days later with values of 8 kg·(m·s)
−1 in Arabia. At the same time, north of 20°N in India, westerly flows continued to circulate on the upper troposphere until mid-June when the upper tropospheric zonal vapor flux changed orientation. The largest values of flux over the Indian zone were observed between mid-July and mid-August. This period corresponded to the intensification phase of the West African monsoon [
30]. During this period and until September, we noted the intensification of westward flux over Sahel.
Westward zonal circulation was clearly established between 10° N and 15° N above Sahel from the beginning of July with values exceeding 32 kg·(m·s)−1. These fluxes had a shorter duration in the Indian zone because the Indian monsoon regime appeared later and disappeared earlier, in connection with the ITCZ meridian shift in summer. These westward transports above the Indian monsoon zone had the highest intensity at the beginning of August. At this time, in the other two regions (Arabia and Sahel), we could also note an intensification of the westward fluxes around 15–20° N in Arabia and around 10–15° N in Sahel. Westward fluxes gradually decreased over the three regions from mid-September in India and Arabia, and the beginning of October in the Sahel, giving way to westerlies over 500–300 hPa. The dates of change of direction (from west to east) of flows above 500 hPa coincide with the arrival of the Indian monsoon north of 15° N in India.
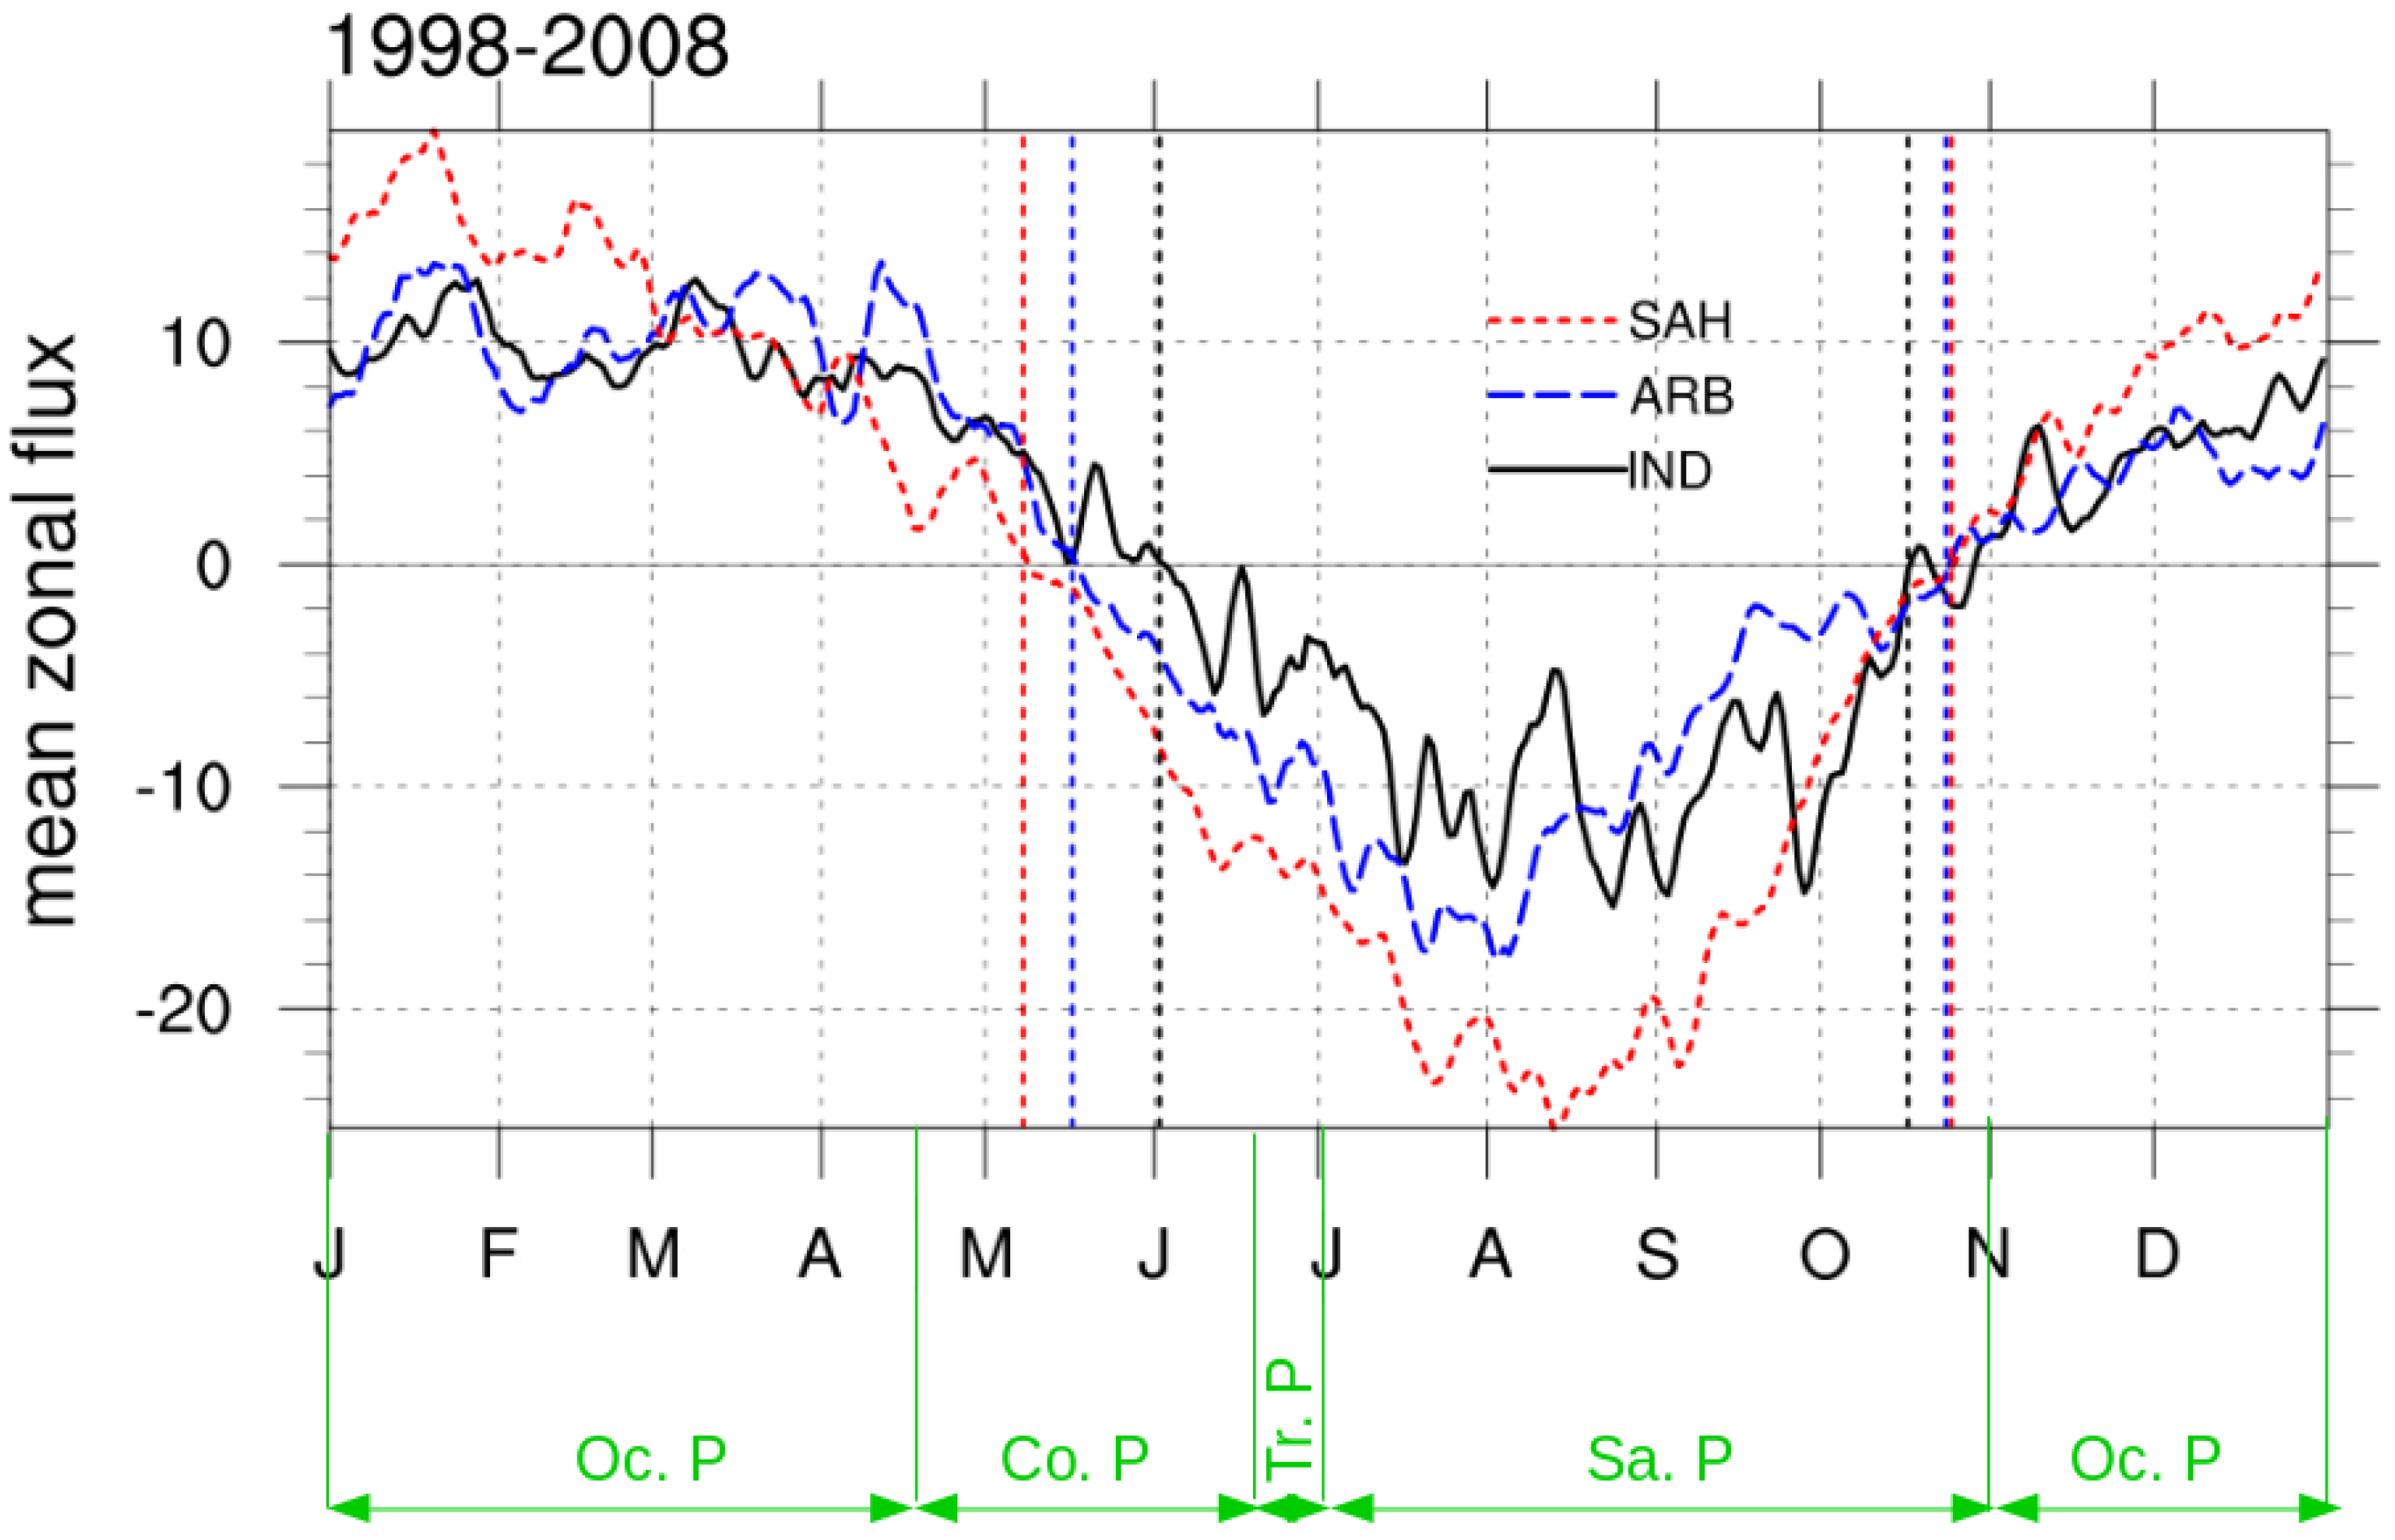
Figure 9 presents the evolution of the daily mean flux. We could identify three phases for the three regions (India, Arabia, and Sahel): two periods of eastward flux during January–May and October–December in Arabia and Sahel, and January-June and October-December in India; and one period of eastward flux from June to September. During the monsoon months, the westward fluxes took place, then intensified and finally disappeared to give way to eastward fluxes.
Figure 9 also presents the phases of the annual cycle of the West African (green) monsoon defined by Thorncroft et al. [
35]. The average dates of changes of direction of the fluxes were May 8, May 17, and June 2 in Sahel, Arabia, and India respectively.
Until October 25 (Sahel), 24 (Arabia), and 17 (India), the east–west direction was more or less maintained until a change of direction to an eastward circulation. Thus, the duration of the maintenance of the fluxes above the three regions was 171, 161, and 138 days in Sahel, Arabia, and India, respectively. Maximum flux intensities were observed on August 12 (Sahel), 2 (Arabia), and 23 (India). In the Sahel, the date of change of direction of flux was earlier in the year than the beginning of the monsoon of West Africa. Sultan and Janicot [
36] have designated this period as the pre-monsoon or pre-onset of the West African monsoon. At this time, the West African monsoon was at the coastal phase of its annual cycle [
35].
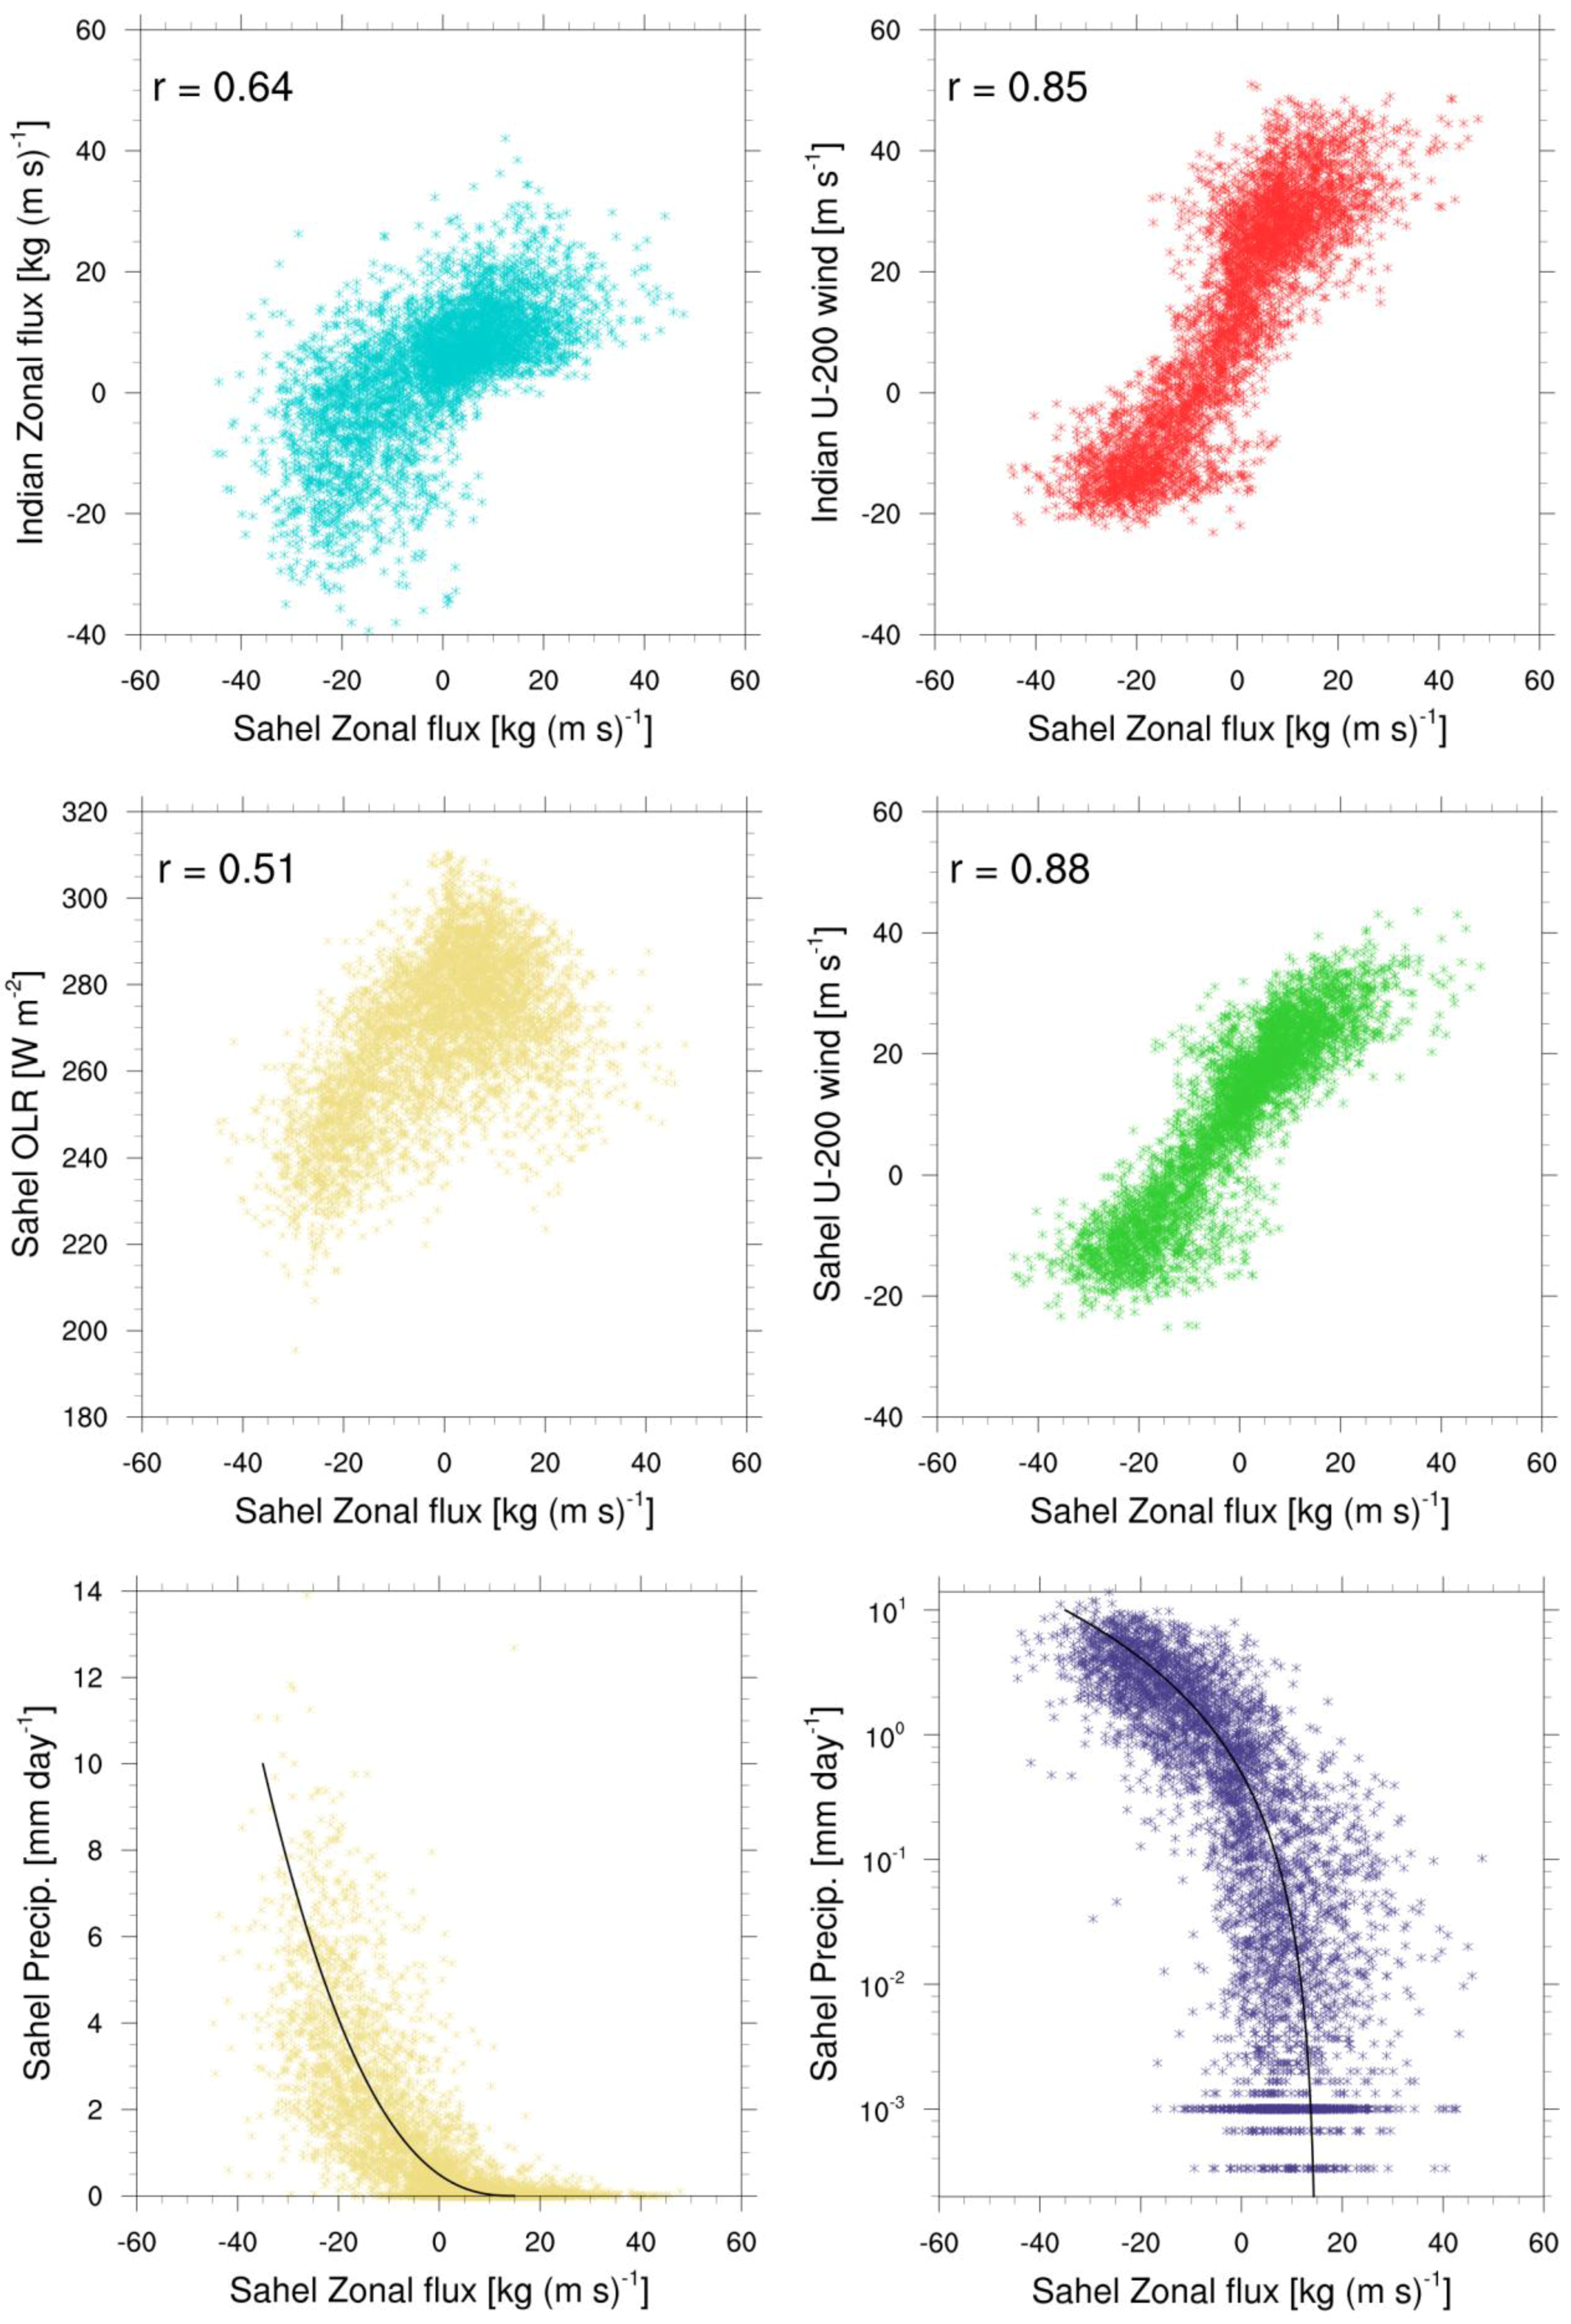
Figure 10 shows the statistical correlations between the different variables in India and Sahel. Zonal fluxes in India and the Sahel have a correlation coefficient of 0.64. The correlation coefficient between the Indian wind at 200 hPa and the Sahelian flux was greater (0.85), indicating a strong relationship between the Asian branch of TEJ and flows in the Sahel. This relationship could indicate that the intensity of TEJ played an important role in the transport of high tropospheric Indo-Sahelian flows. This is consistent with the results of He et al. [
37] that showed that the latent warming of the Indian monsoon plays an important role in the variability of the Sahelian rainfall.
The weaker correlation (0.64) between the two fluxes could be explained by the fact that the TEJ had a more direct trajectory between the two regions, whereas the moisture flux was influenced by the variations of the atmospheric dynamics between India and Sahel, but also a less pronounced divergence in the upper troposphere. The different regions crossed by the moisture fluxes contributed to their strengthening or weakening.
The correlation between Sahel flux and OLR was poor (0.51). The Sahel flux was well correlated with the Sahel zonal wind (0.88). That showed the impact of the African branch of TEJ on the moisture flux. As for its Indian branch, TEJ in West Africa was also very close to the 500–300 hPa flux above the region.
Daily rainfall in Sahel was low (or null) when fluxes were from west (positive). Sahelian rainfall only occurred when the zonal flows 500–300 hPa in the Sahel were from east. The variation of the rainfall as function of the zonal flux over Sahel (
Figure 10, bottom left and right) indicated a non-linear relationship between the vapor flux and the precipitation. A simple non-linear fit following Equation (2) is overplotted (
Figure 10, black curves bottom left and right).
With A = 10 kg·(m·s)−1 and B = 2.5. This non-linear function between the source (vapor flux) and sink (rain) was an indicator of a non-linear rain efficiency and could be related to the thresholded onset and auto-organization of the large precipitation systems (MCS). The relation between flux and precipitation revealed an appearance of rains larger than 1 mm·day−1 corresponding to minimum value of 8.67 kg·(m·s)−1 for the westward flux.
7. Conclusions
In this article we have documented the transport of air masses coming from the Indian monsoon zone over the period 1998–2008, and characterized the influence of Indian monsoon fluxes on the Sahelian region. This transport of air masses constituted a source for the water vapor budget in the Sahel and played a role in the convection and precipitation of the region. Our strategy was based, on one hand, on a Lagrangian approach consisting of analyzing the statistics of sets of LACYTRAJ forward trajectories, and, on the other hand, on calculating fluxes of water vapor using wind and humidity ECMWF ERA-Interim fields.
The Lagrangian approach showed that a substantial part (40 to 70% at 300 hPa) of trajectories coming from the upper troposphere of the monsoon region crossed the Sahelian region in a few days (3–14 days). The duration of the India–Sahel transport depended on the levels of pressure of the air masses after leaving India. A smaller part (5–7%) of the trajectories crosses the ITCZ and induced inter-hemispheric exchanges of air masses.
The flux calculation approach confirmed this source of moisture for the Sahel. In India and the Sahel, an intensification of flux at 500–300 hPa corresponded, on one hand, to a decrease of OLR (convection), and on the other hand, to a contribution to the Sahelian humidity during the months of June to September. Moreover, the 500–300 hPa precipitable water column was mainly fed by advection of westward flux; it increased and decreased almost systematically with the calculated flux.
The 500–300 hPa zonal fluxes over the Sahel were correlated (about +0.85) with the Indian and African branches of TEJ. In addition, there was almost no rain in the Sahel if fluxes above 500 hPa in the area were from the west. Significant Sahelian rainfall occurred only when the 500–300 hPa zonal flows in the Sahel were from the east.
The contribution of moisture from India was probably a minor contribution compared to the lower tropospheric fluxes, but our results showed a quite strong correlation with the Sahel precipitations. These upper tropospheric water vapor fluxes from India could therefore be associated or trigger rainfall in the Sahel. In order to quantitatively study the total water vapor budget of the Sahel, it will be necessary to characterize all the fluxes (not only those coming from India), over the whole troposphere (not only the upper troposphere), and to perform a more detailed analysis of the flux divergence in the lower, middle, and upper troposphere. Future works could also lead us to calculate the Fourier spectra of zonal flux and rain in the Sahel. Preliminary results indicate that they have the same end of the scale invariance range at 45 days. This suggests a similar large-scale organization for fluxes and convection responsible for rainfall.
Author Contributions
Conceptualization, A.S., B.D., and J.-L.B.; Methodology, A.S. and J.-L.B.; Software, A.S. and J.-L.B.; Validation, A.S., C.D., B.D., and J.-L.B.; Formal Analysis, A.S., B.D., C.D., and J.-L.B.; Investigation, A.S., B.D., Y.G., C.D., and J.-L.B.; Resources, A.S.; Data Curation, A.S., Y.G., and C.D.; Writing–Original Draft Preparation, A.S. and J.L.B; Writing-Review and Editing, A.S., B.D., Y.G., C.D., J.V.B., and J.-L.B.; Visualization, A.S. and J.-L.B.; Supervision, B.D. and J.V.B.; Project Administration, A.S. and J.-L.B.; Funding Acquisition, B.D. and J.V.B.
Funding
This research received no external funding.
Acknowledgments
We acknowledge the Centre d’Excellence Africain (CEA) Mathématiques, Informatique et Technologies de l’Information et de la Communication (MITIC) for hosting this research. We acknowledge also the European Centre for Medium-Range Weather Forecasts (ECMWF) for providing ERA-Interim reanalysis ECMWF; The National Oceanic and Atmospheric Administration (NOAA) for providing OLR and the Global Precipitation Climatology Project (GPCP) for providing precipitation data. Finally, we thank the reviewers for their constructive and useful comments.
Conflicts of Interest
The authors declare no conflict of interest.
References
- Mohr, K.I. Interannual, monthly, and regional variability in the wet season diurnal cycle of precipitation in sub-Saharan Africa. J. Clim. 2004, 17, 2441–2453. [Google Scholar] [CrossRef]
- Salih, A.A.M.; Zhang, Q.; Pausata, F.S.R.; Tjernström, M. Sources of Sahelian-Sudan moisture: Insights from a moisture-tracing atmospheric model. J. Geophys. Res. Atmos. 2016, 121, 7819–7832. [Google Scholar] [CrossRef]
- Janicot, S.; Mounier, F.; Hall, N.; Leroux, S.; Sultan, B.; Kiladis, G. The West African monsoon dynamics. Part IV: Analysis of 25-90-day variability of convection and the role of the Indian monsoon. J. Clim. 2009, 22, 1541–1565. [Google Scholar] [CrossRef]
- Feudale, L.; Kucharski, F. A common mode of variability of African and Indian monsoon rainfall at decadal timescale. Clim. Dyn. 2013, 41, 243–254. [Google Scholar] [CrossRef]
- Kucharski, F.; Bracco, A.; Yoo, J.; Tompkins, A.; Feudale, L.; Ruti, P.; Dell’Aquila, A. A Gill–Matsuno-type mechanism explains the tropical Atlantic influence on African and Indian monsoon rainfall. Q. J. R. Meteorol. Soc. 2009, 135, 569–579. [Google Scholar] [CrossRef]
- Rodwell, M.J.; Hoskins, B.J. Subtropical anticyclones and summer monsoons. J. Clim. 2001, 14, 3192–3211. [Google Scholar] [CrossRef]
- Dyer, E.L.E.; Jones, D.B.A.; Li, R.; Sawaoka, H.; Mudryk, L. Sahel precipitation and regional teleconnections with the Indian Ocean. J. Geophys. Res. Atmos. 2017, 122, 5654–5676. [Google Scholar] [CrossRef]
- Roja, R.M.; Jagannadha, R.V.V.M.; Venkat, R.M.; Rajeevan, M.; Rao, S.V.B.; Narayana, R.D.; Prabhakara, R.N. Characteristics of the Tropical Easterly Jet: Long-term trends and their features during active and break monsoon phases. J. Geophys. Res. Atmos. 2009, 114, D19105. [Google Scholar] [CrossRef]
- Matthews, A.J. Intraseasonal variability over tropical Africa during northern summer. J. Clim. 2004, 17, 2427–2440. [Google Scholar] [CrossRef]
- Mohino, E.; Janicot, S.; Douville, H.; Li, L.Z.X. Impact of the Indian part of the summer MJO on West Africa using nudged climate simulations. Clim. Dyn. 2012, 38, 2319–2334. [Google Scholar] [CrossRef]
- Rizou, D.; Flocas, H.A.; Hatzaki, M.; Bartzokas, A. A Statistical Investigation of the Impact of the Indian Monsoon on the Eastern Mediterranean Circulation. Atmosphere 2018, 9, 90. [Google Scholar] [CrossRef]
- Zhan, R.; Li, J.; Gettelman, A. Intraseasonal variations of upper tropospheric water vapor in Asian monsoon region. Atmos. Chem. Phys. Discuss. 2006, 6, 8069–8095. [Google Scholar] [CrossRef]
- De Felice, P.; Viltard, A.; Camara, M. Vapeur d’eau dans la troposphère en Afrique de l’Ouest. Meteorologie 1982, 29, 129–134. [Google Scholar]
- Benson, C.L.; Rao, G.V. Convective bands as structural components of an Arabian Sea convective cloud cluster. Mon. Weather Rev. 1987, 115, 3013–3023. [Google Scholar] [CrossRef]
- Grist, J.P.; Nicholson, E. A study of the dynamic factors influencing the rainfall variability in the West African Sahel. J. Clim. 2001, 14, 1337–1359. [Google Scholar] [CrossRef]
- Hulme, M.; Tosdevin, N. The Tropical easterly Jet and Sudan rainfall: A review. Theor. Appl. Clim. 1989, 39, 179–187. [Google Scholar] [CrossRef]
- Pattanaik, D.R.; Satyan, V. Fluctuations of Tropical Easterly Jet during contrasting monsoons over India: A GCM study. Meteorol. Atmos. Phys. 2000, 75, 51–60. [Google Scholar] [CrossRef]
- Srinivasa Rao, B.R.; Bhaskar Rao, D.V.; Brahmananda Rao, V. Decreasing trend in the strength of Tropical Easterly Jet during the Asian summer monsoon season and the number of tropical cyclonic systems over Bay of Bengal. Geophys. Res. Lett. 2004, 31, L141031–L141033. [Google Scholar]
- Gong, C.; Eltahir, E. Sources of moisture for rainfall in West Africa. Water Resour. Res. 1996, 32, 3115–3121. [Google Scholar] [CrossRef]
- Nieto, R.; Gimeno, L.; Trigo, R.M. A Lagrangian identification of major sources of Sahel moisture. Geophys. Res. Lett. 2006, 33, L18707. [Google Scholar] [CrossRef]
- Meynadier, R.; Bock, O.; Guichard, F.; Boone, A.; Roucou, P.; Redelsperger, J.L. West African Monsoon water cycle: 1. A hybrid water budget data set. J. Geophys. Res. Atmos. 2010, 115, D1910. [Google Scholar] [CrossRef]
- Salih, A.A.M.; Zhang, Q.; Tjernström, M. Lagrangian tracing of Sahelian Sudan moisture sources. J. Geophys. Res. Atmos. 2015, 120, 6793–6808. [Google Scholar] [CrossRef] [Green Version]
- Sorí, R.; Nieto, R.; Drumond, A.; Gimeno, L. The Niger River Basin Moisture Sources: A Lagrangian Analysis. Atmosphere 2017, 8, 38. [Google Scholar] [CrossRef]
- Fontaine, B.; Roucou, P.; Trzaska, S. Atmospheric water cycle and moisture fluxes in the West African monsoon: mean annual cycles and relationship using NCEP/NCAR reanalysis. Geophys. Res. Lett. 2003, 30, 1117. [Google Scholar] [CrossRef]
- Thiaw, W.M.; Kousky, J.V.; Kumar, J.V. Atmospheric circulation associated with recent Sahelian hydrologic anomalies. IAHS Publ. 1998, 252, 63–67. [Google Scholar]
- Rowell, D.P. The impact of Mediterranean SSTs on the Sahelian rainfall season. J. Clim. 2003, 16, 849–862. [Google Scholar] [CrossRef]
- Liebmann, B.; Smith, C.A. Description of a Complete (Interpolated) Outgoing Longwave Radiation Dataset. Bull. Am. Meteorol. Soc. 1996, 77, 1275–1277. [Google Scholar]
- Huffman, G.J.; Adler, R.F.; Morrissey, M.M.; Bolvin, D.T.; Curtis, S.; Joyce, R.; Mc Gavock, B.; Susskind, J. Global precipitation at one degree daily resolution from multisatellite observations. J. Hydrometeorol. 2001, 2, 36–50. [Google Scholar] [CrossRef]
- Dee, D.P.; Uppala, S.M.; Simmons, A.J.; Berrisford, P.; Poli, P.; Kobayashi, S.; Andrae, U.; Balmaseda, M.A.; Balsamo, G.; Bauer, P.; et al. The ERA-Interim reanalysis: configuration and performance of the data assimilation system. Q. J. R. Meteorol. Soc. 2011, 137, 553–597. [Google Scholar] [CrossRef] [Green Version]
- Clain, G.; Baray, J.L.; Delmas, R.; Keckhut, P.; Cammas, J.P. A lagrangian approach to analyse the tropospheric ozone climatology in the tropics: Climatology of stratosphere-troposphere exchange at Reunion Island. Atmos. Environ. 2010, 44, 968–975. [Google Scholar] [CrossRef]
- Duflot, V.; Dils, B.; Baray, J.L.; De Mazière, M.; Attié, J.L.; Vanhaelewyn, G.; Senten, C.; Vigouroux, C.; Clain, G.; Delmas, R. Analysis of the origin of the distribution of CO in the subtropical southern Indian Ocean in 2007. J. Geophys. Res. Atmos. 2010, 115, D22106. [Google Scholar] [CrossRef]
- Freney, E.; Sellegri, K.; Asmi, E.; Rose, C.; Chauvigne, A.; Baray, J.-L.; Colomb, A.; Hervo, M.; Montoux, N.; Bouvier, L.; et al. Experimental evidence of the feeding of the free troposphere with aerosol particles from the mixing layer. Aerosol Air Q. Res. 2016, 16, 702–716. [Google Scholar] [CrossRef]
- Larroza, E.G.; Keckhut, P.; Baray, J.L.; Nakaema, W.M.; Vérèmes, H.; Landulfo, E.; Dionisi, D.; Khaykin, S.; Ravetta, F. Long range transport of water channelize through the southern subtropical jet. Atmosphere 2018, 9, 374. [Google Scholar] [CrossRef]
- Bianco, A.; Deguillaume, L.; Vaïtilingom, M.; Nicol, E.; Baray, J.L.; Chaumerliac, N.; Bridoux, M. Molecular characterization of cloud water samples collected at the puy de Dôme (France) by Fourier Transform Ion Cyclotron Resonance Mass Spectrometry. Environ. Sci. Technol. 2018, 52, 10275–10285. [Google Scholar] [CrossRef] [PubMed]
- Thorncroft, C.D.; Nguyen, H.; Zhang, C.; Peyrille, P. Annual Cycle of the West African Monsoon: Regional Circulations and associated Water Vapour Transport. Q. J. R. Meteorol. Soc. 2011, 137, 129–147. [Google Scholar] [CrossRef]
- Sultan, B.; Janicot, S. The West African monsoon dynamics. Part II: The“preonset” and “onset” of the summer monsoon. J. Clim. 2003, 16, 3407–3427. [Google Scholar] [CrossRef]
- He, S.; Yang, S.; Li, Z. Influence of latent heating over the Asian and western Pacific monsoon region on Sahel summer rainfall. Sci. Rep. 2017, 7, 7680. [Google Scholar] [CrossRef] [PubMed]
Figure 1.
Climatology of the moisture flux (in kg·(m·s)−1) vector at 500–300 hPa resulting from ECMWF ERA-Interim averaged from June to September over the period 1998–2008. IND, SAH, and ARB are the North-Indian (15–25° N and 70–90° E), Sahelian (10–20° N and 10° W–20° E) and Arabian (10–20° N and 45–60° E) regions, respectively.
Figure 2.
Zonal cross section of the zonal and vertical component of the wind (vectors) and the relative vorticity (×105, s−1 colors) averaged between 10−23° N from June to September over the period 1998–2008, and from 30° W to 130° E. The longitudes of SAH, ARB, and IND regions are marked by white vertical lines.
Figure 3.
Climatology of the wind divergence (in day−1) from 500 to 300 hPa resulting from ECMWF ERA-Interim averaged from June to September over the period 1998–2008 between 0–30° N and 30° W–130° E.
Figure 3.
Climatology of the wind divergence (in day−1) from 500 to 300 hPa resulting from ECMWF ERA-Interim averaged from June to September over the period 1998–2008 between 0–30° N and 30° W–130° E.
Figure 4.
Forward trajectories computed with the LACYTRAJ model of 14 day air masses leaving India at 300 hPa (top), 400 hPa (middle), and 500 hPa (bottom) during the monsoon season over the period 1998–2008.
Figure 4.
Forward trajectories computed with the LACYTRAJ model of 14 day air masses leaving India at 300 hPa (top), 400 hPa (middle), and 500 hPa (bottom) during the monsoon season over the period 1998–2008.
Figure 5.
Percentage of trajectories passing above Sahel after leaving India.
Figure 5.
Percentage of trajectories passing above Sahel after leaving India.
Figure 6.
Monthly mean of OLR (colors, × 10−1 W·m−2), horizontal moisture flux (vectors, kg·(m·s)–1), and zonal wind (yellow isoline 0 m·s–1) at 925 hPa over the period 1998–2008 from January to December.
Figure 6.
Monthly mean of OLR (colors, × 10−1 W·m−2), horizontal moisture flux (vectors, kg·(m·s)–1), and zonal wind (yellow isoline 0 m·s–1) at 925 hPa over the period 1998–2008 from January to December.
Figure 7.
Monthly mean of zonal flux (in kg·(m·s)–1) between 500 and 300 hPa in India (70–90° E and 15–23° N, in red), Arabia (45–60° E and 15–20° N, in green), and Sahel (10° W–20° E and 10–20° N, in red) from January to December over the period 1998–2008.
Figure 7.
Monthly mean of zonal flux (in kg·(m·s)–1) between 500 and 300 hPa in India (70–90° E and 15–23° N, in red), Arabia (45–60° E and 15–20° N, in green), and Sahel (10° W–20° E and 10–20° N, in red) from January to December over the period 1998–2008.
Figure 8.
Time-latitude plots of zonal fluxes (in kg·(m·s)−1) between January to December averaged over the period 1998–2008 above India (70–90° E, top), Arabia (45–60° E middle), and Sahel (10° W–20° E, bottom). Data have been filtered using a 5 day moving average.
Figure 8.
Time-latitude plots of zonal fluxes (in kg·(m·s)−1) between January to December averaged over the period 1998–2008 above India (70–90° E, top), Arabia (45–60° E middle), and Sahel (10° W–20° E, bottom). Data have been filtered using a 5 day moving average.
Figure 9.
Averaged zonal flux (in kg·(m·s)−1, 1998–2008) between 500 and 300 hPa, in India (black), Arabia (blue), and Sahel (red), represented from January to December. Data have been filtered using a 5 day moving average. In green, the different phases of the annual cycle of the West African monsoon are in green: Oc. P: Oceanic Phase; Co. P: Coastal Phase; Tr. P: Transitional Phase; Sa. P: Sahelian Phase.
Figure 10.
Scatterplot of the Sahel zonal flux as a function of Indian zonal flux (top left, blue), as 200 hPa zonal wind in India (top right, red), as OLR (middle left, yellow), as 200 hPa zonal wind in Sahel (middle, green), precipitation in Sahel (bottom left, yellow), and precipitation in the Sahel with log scales (bottom right, purple). Flux, wind, OLR, and precipitation have been averaged in the area 10° W–20° E and 10–20° N for the Sahel. Indian flux and wind have been averaged in the area 70–90° E and 15–30° N, with a daily sampling from 1998 to 2008.
© 2018 by the authors. Licensee MDPI, Basel, Switzerland. This article is an open access article distributed under the terms and conditions of the Creative Commons Attribution (CC BY) license (http://creativecommons.org/licenses/by/4.0/).


