
On the Size Discrepancies between Datasets from China Meteorological Administration and Joint Typhoon Warning Center for the Northwestern Pacific Tropical Cyclones

Abstract
:1. Introduction
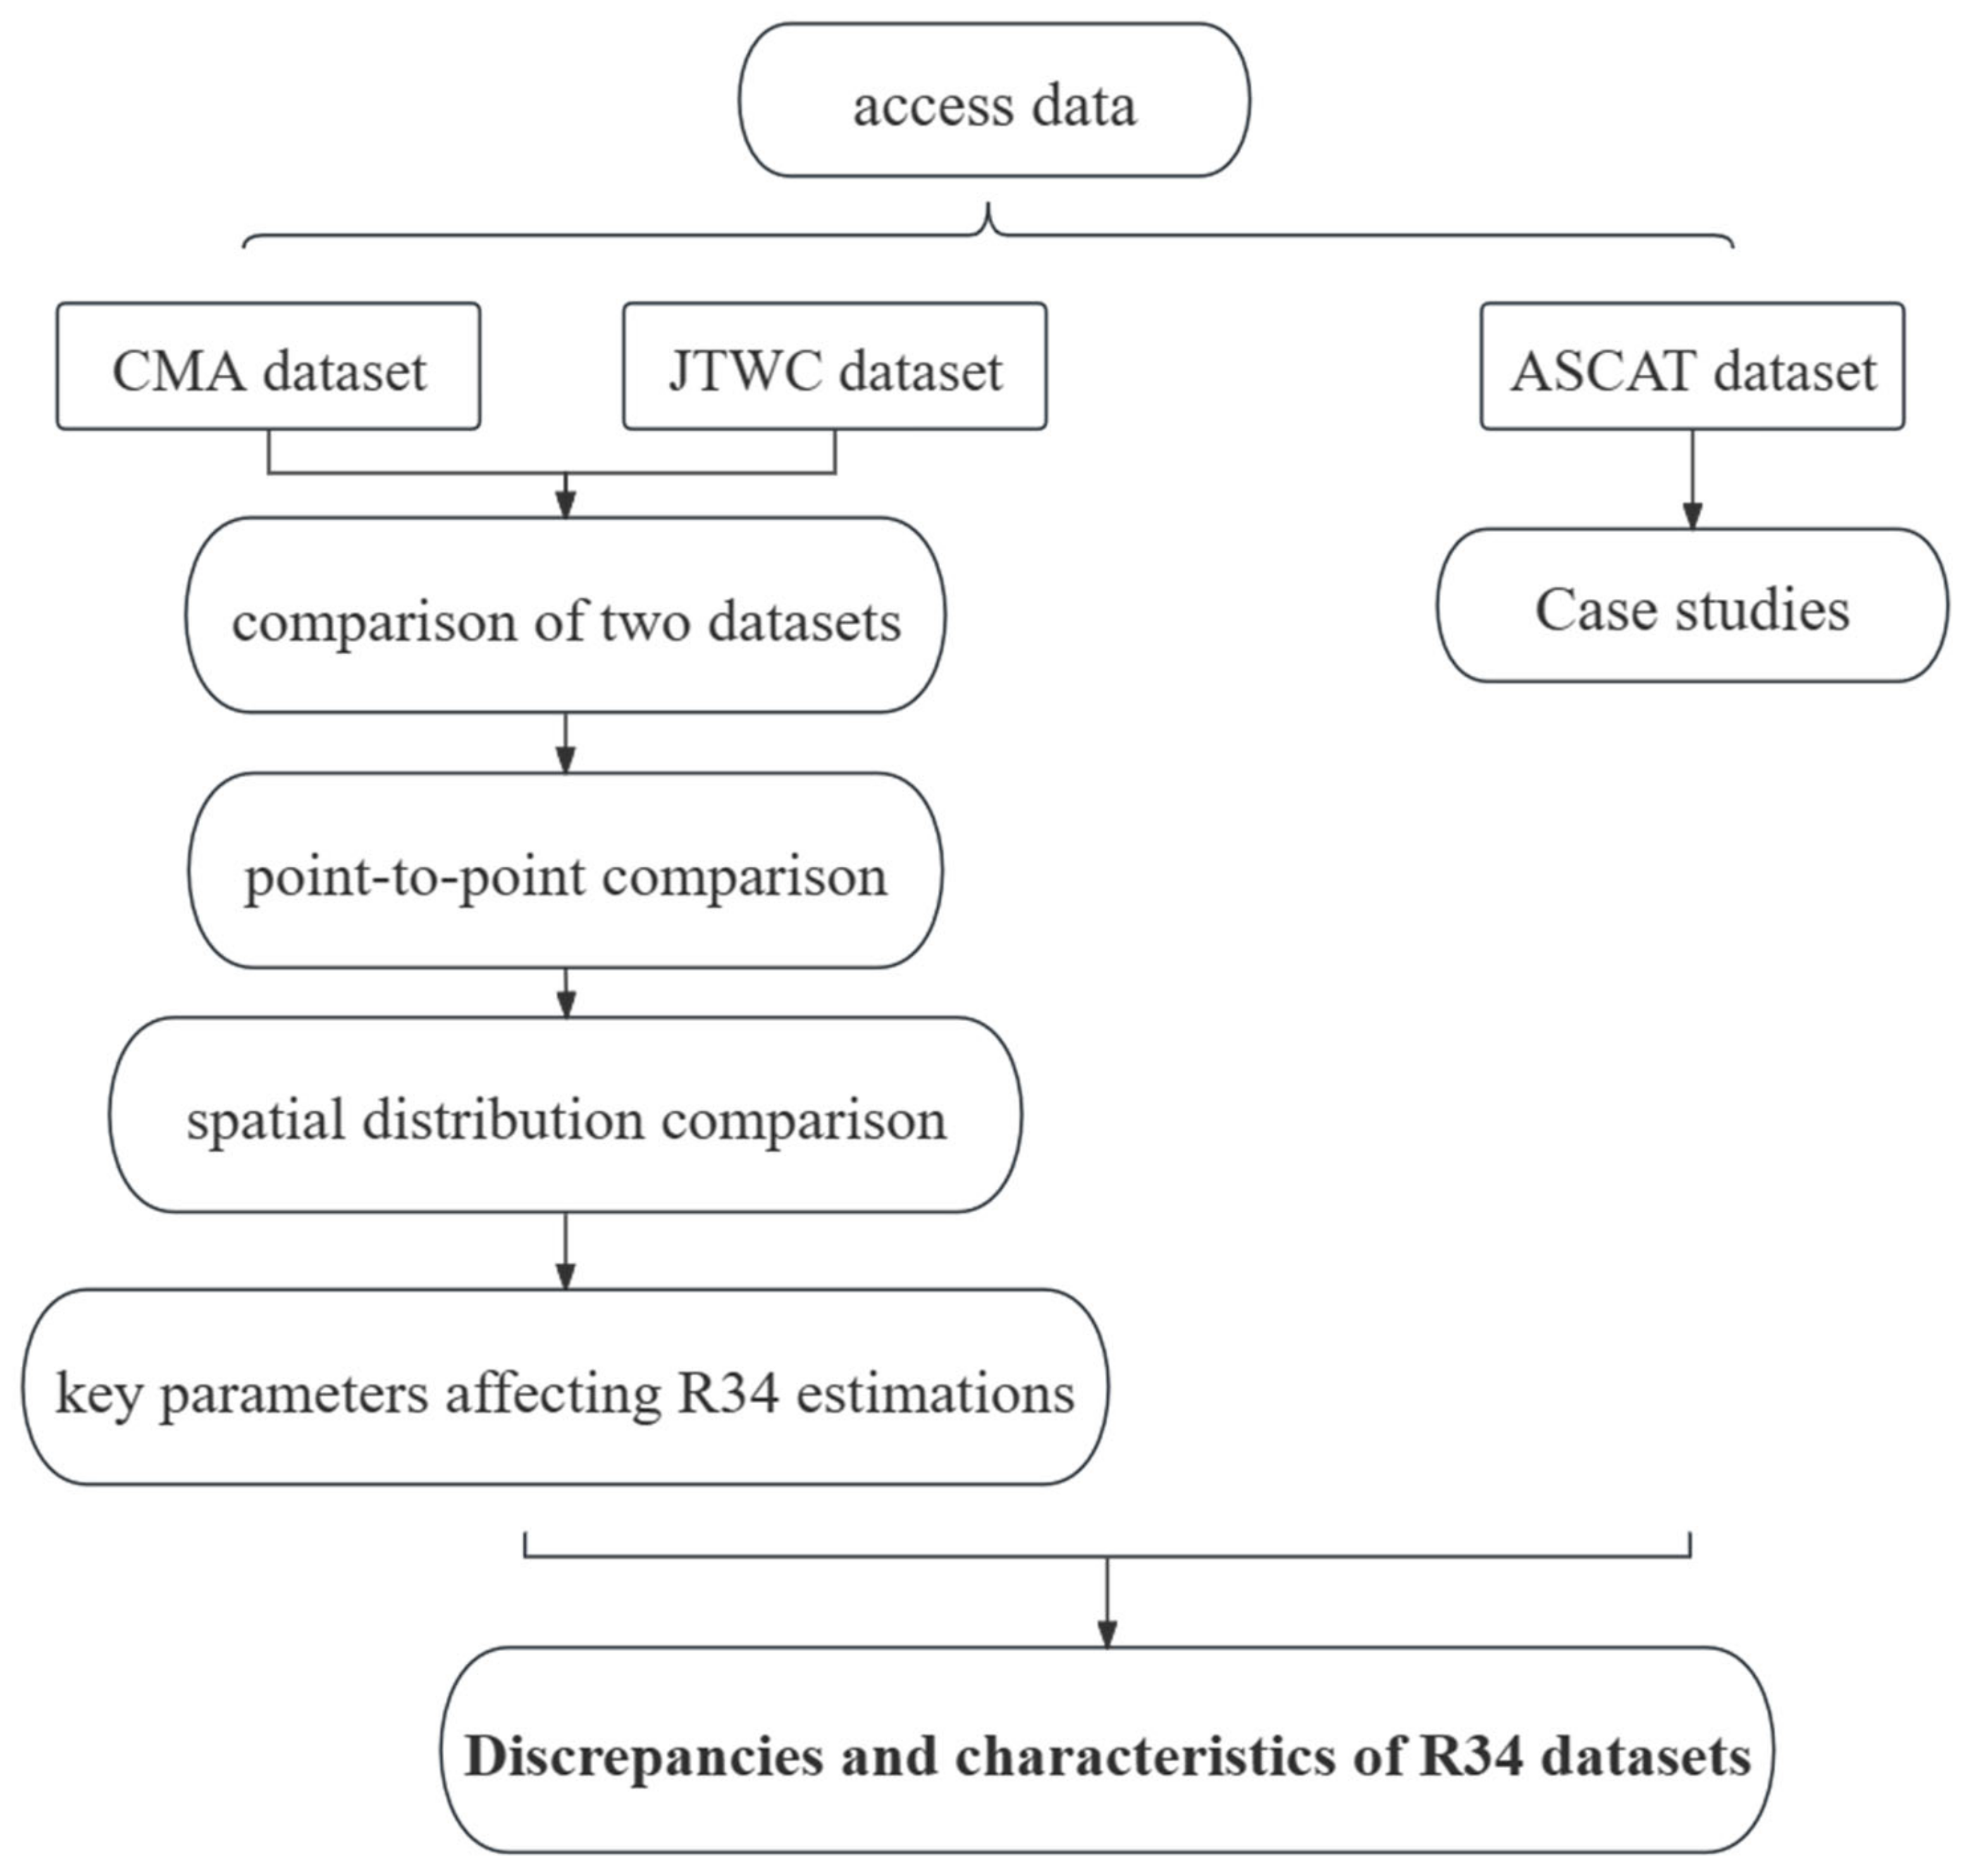
2. Data and Methods
2.1. Datasets
2.1.1. CMA TC Size Datasets
2.1.2. JTWC TC Size Datasets
2.1.3. ASCAT Datasets
2.2. Data Preprocessing
2.3. Method for Estimating R34 Using Satellite Data
- (1)
- The number of available data points for each belt must exceed 5.
- (2)
- The proportion of available data points in each annular belt must be larger than 50%.
3. Results
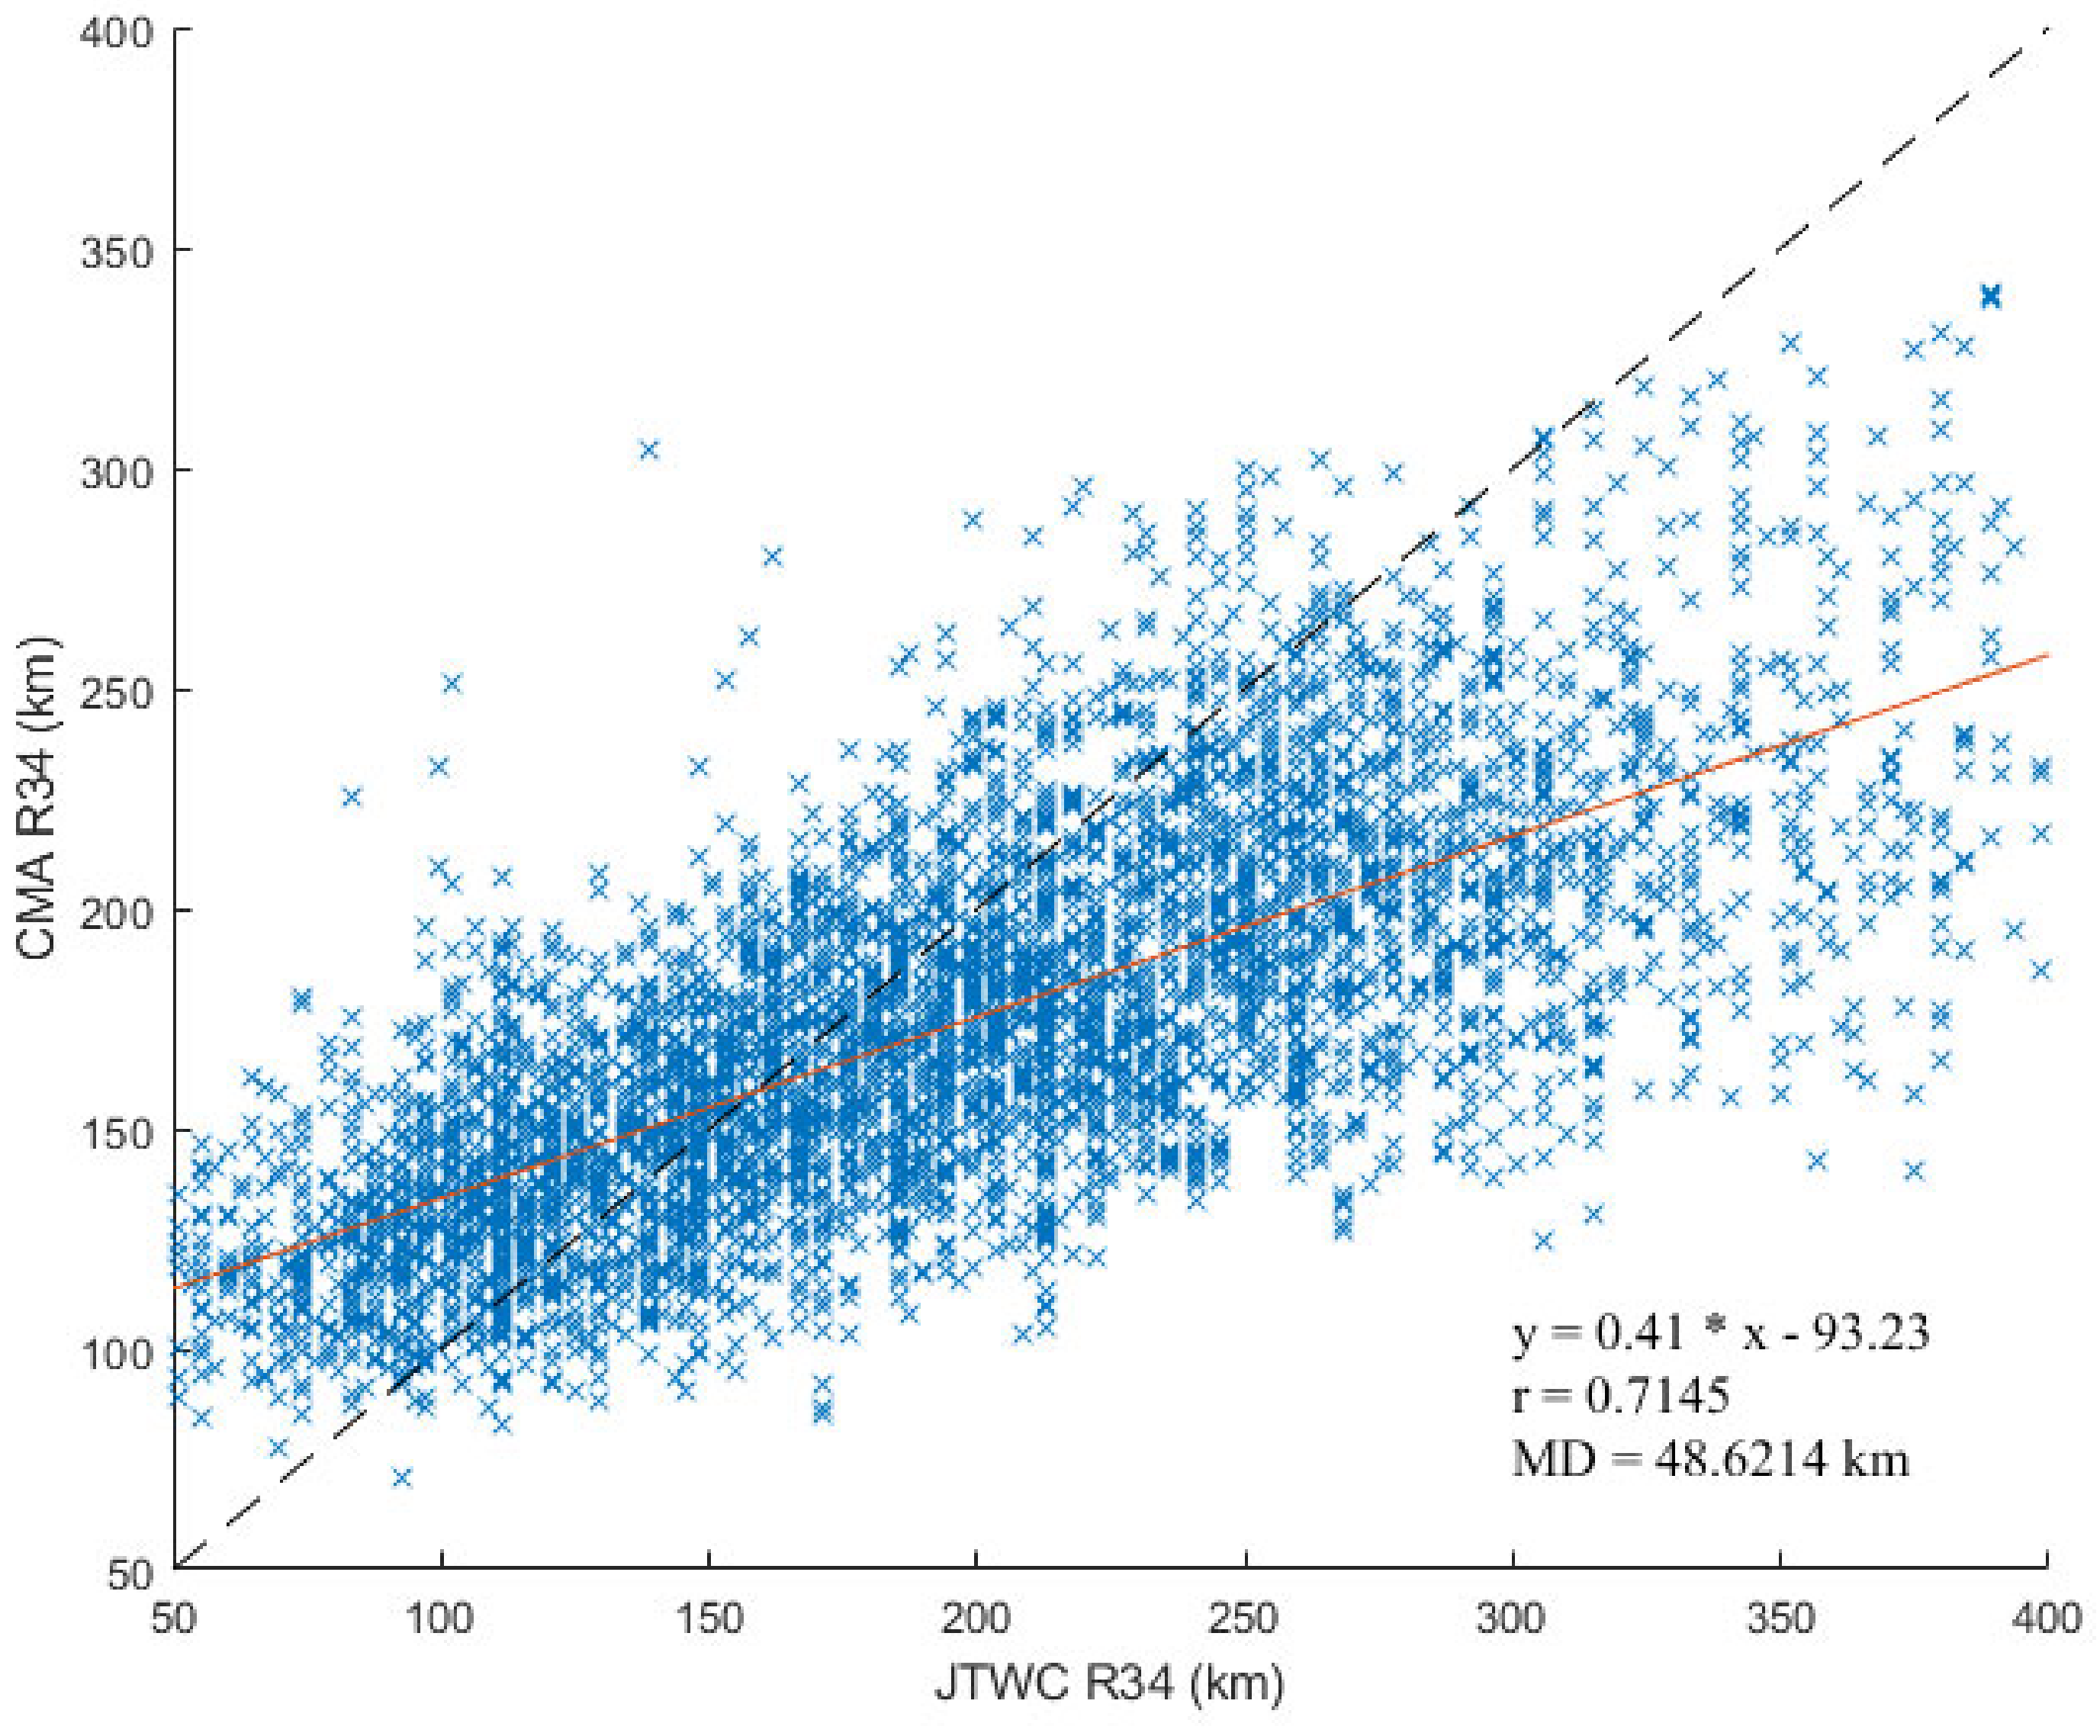
3.1. R34 Point-To-Point Comparison between CMA and JTWC Datasets
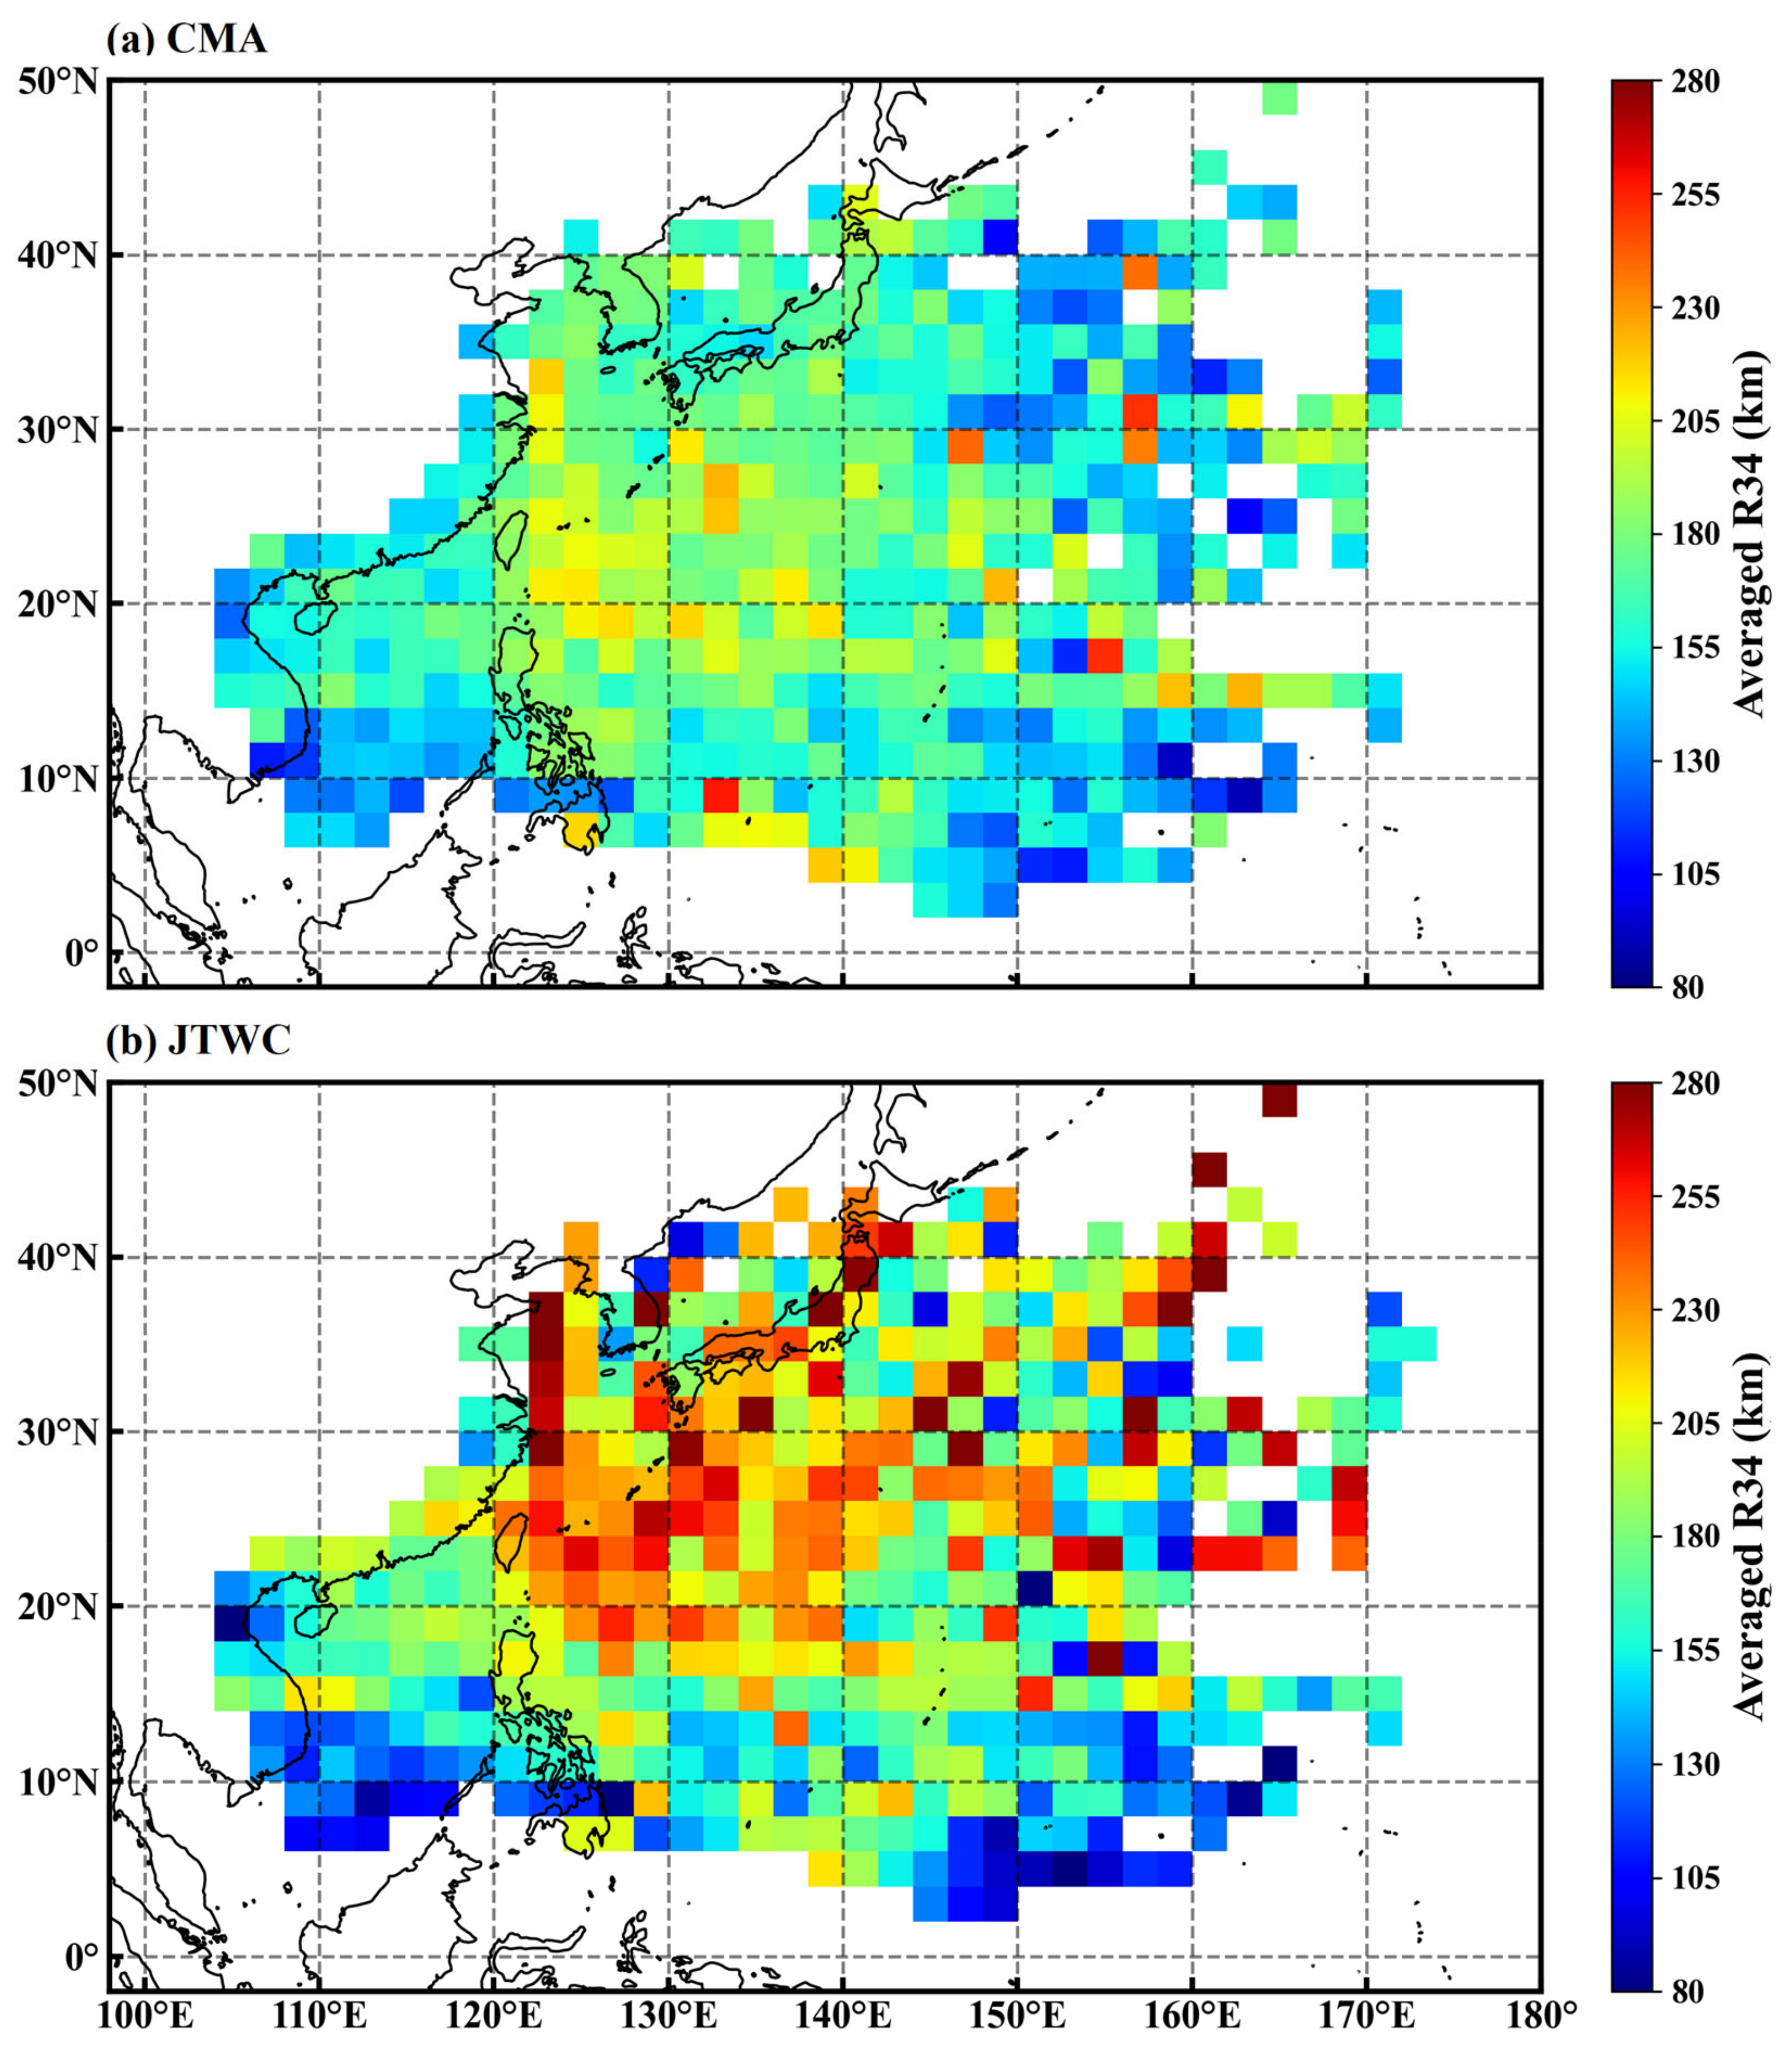
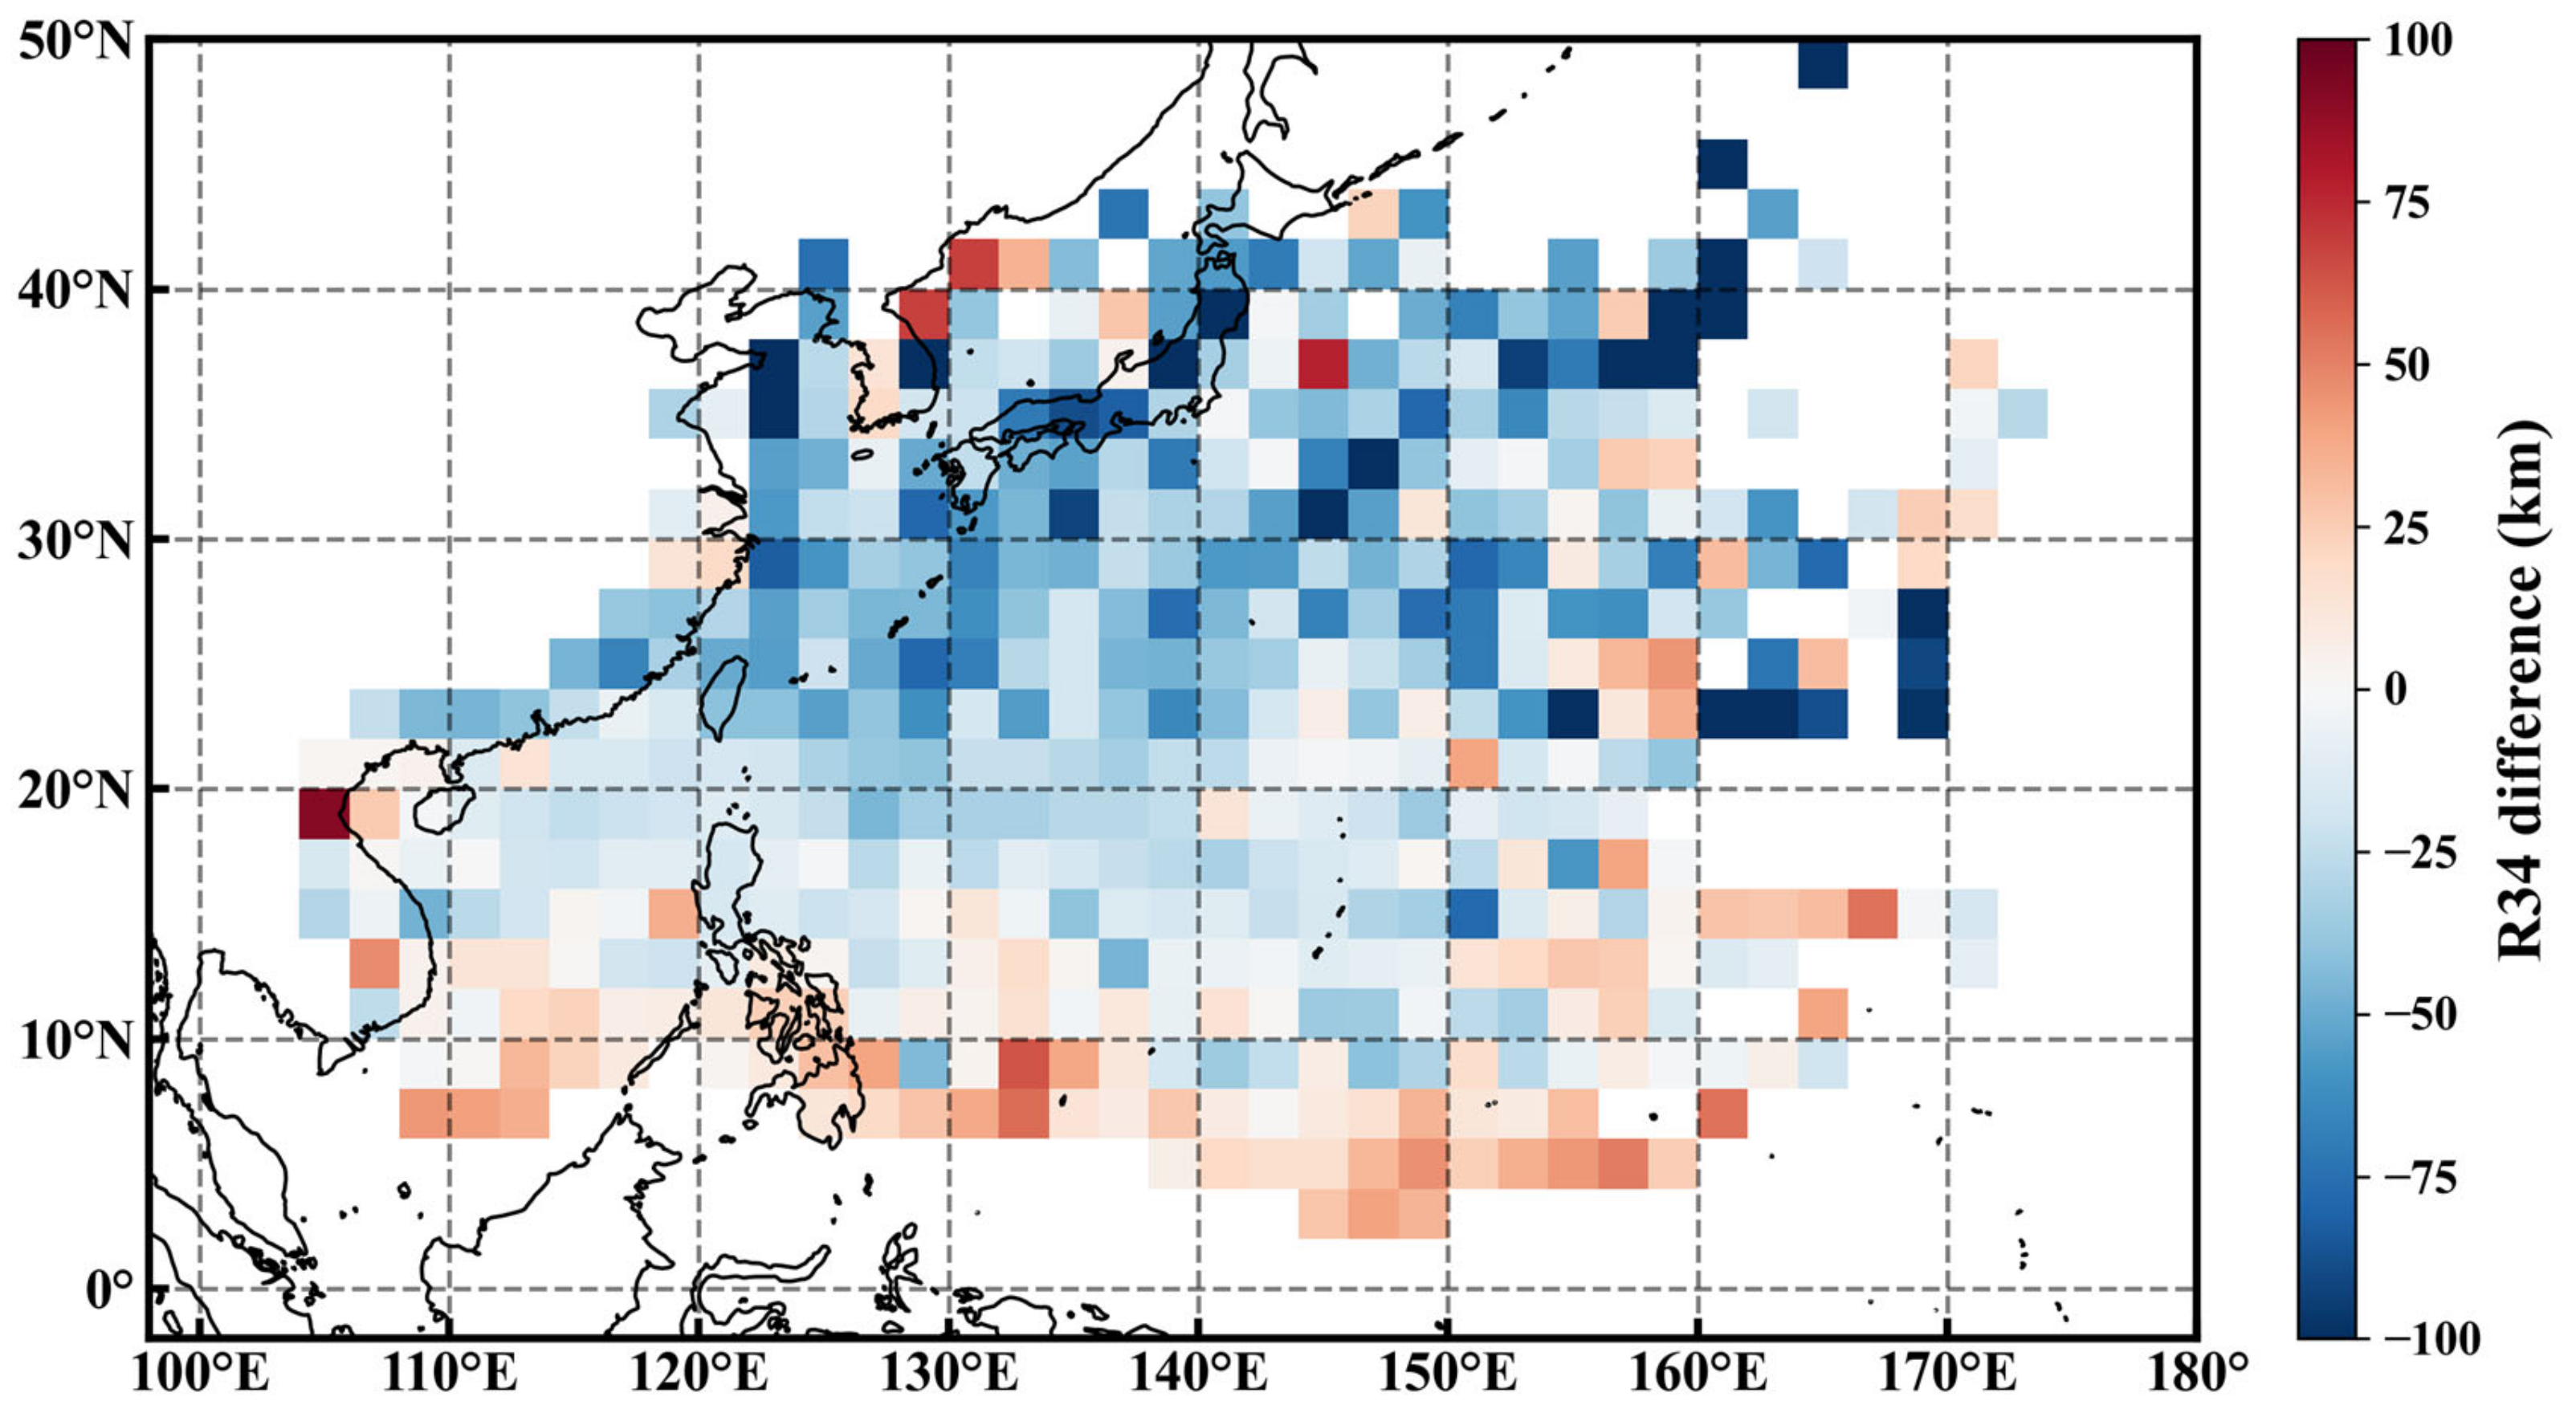
3.2. The Spatial Distribution Characteristics of R34 from CMA and JTWC Datasets
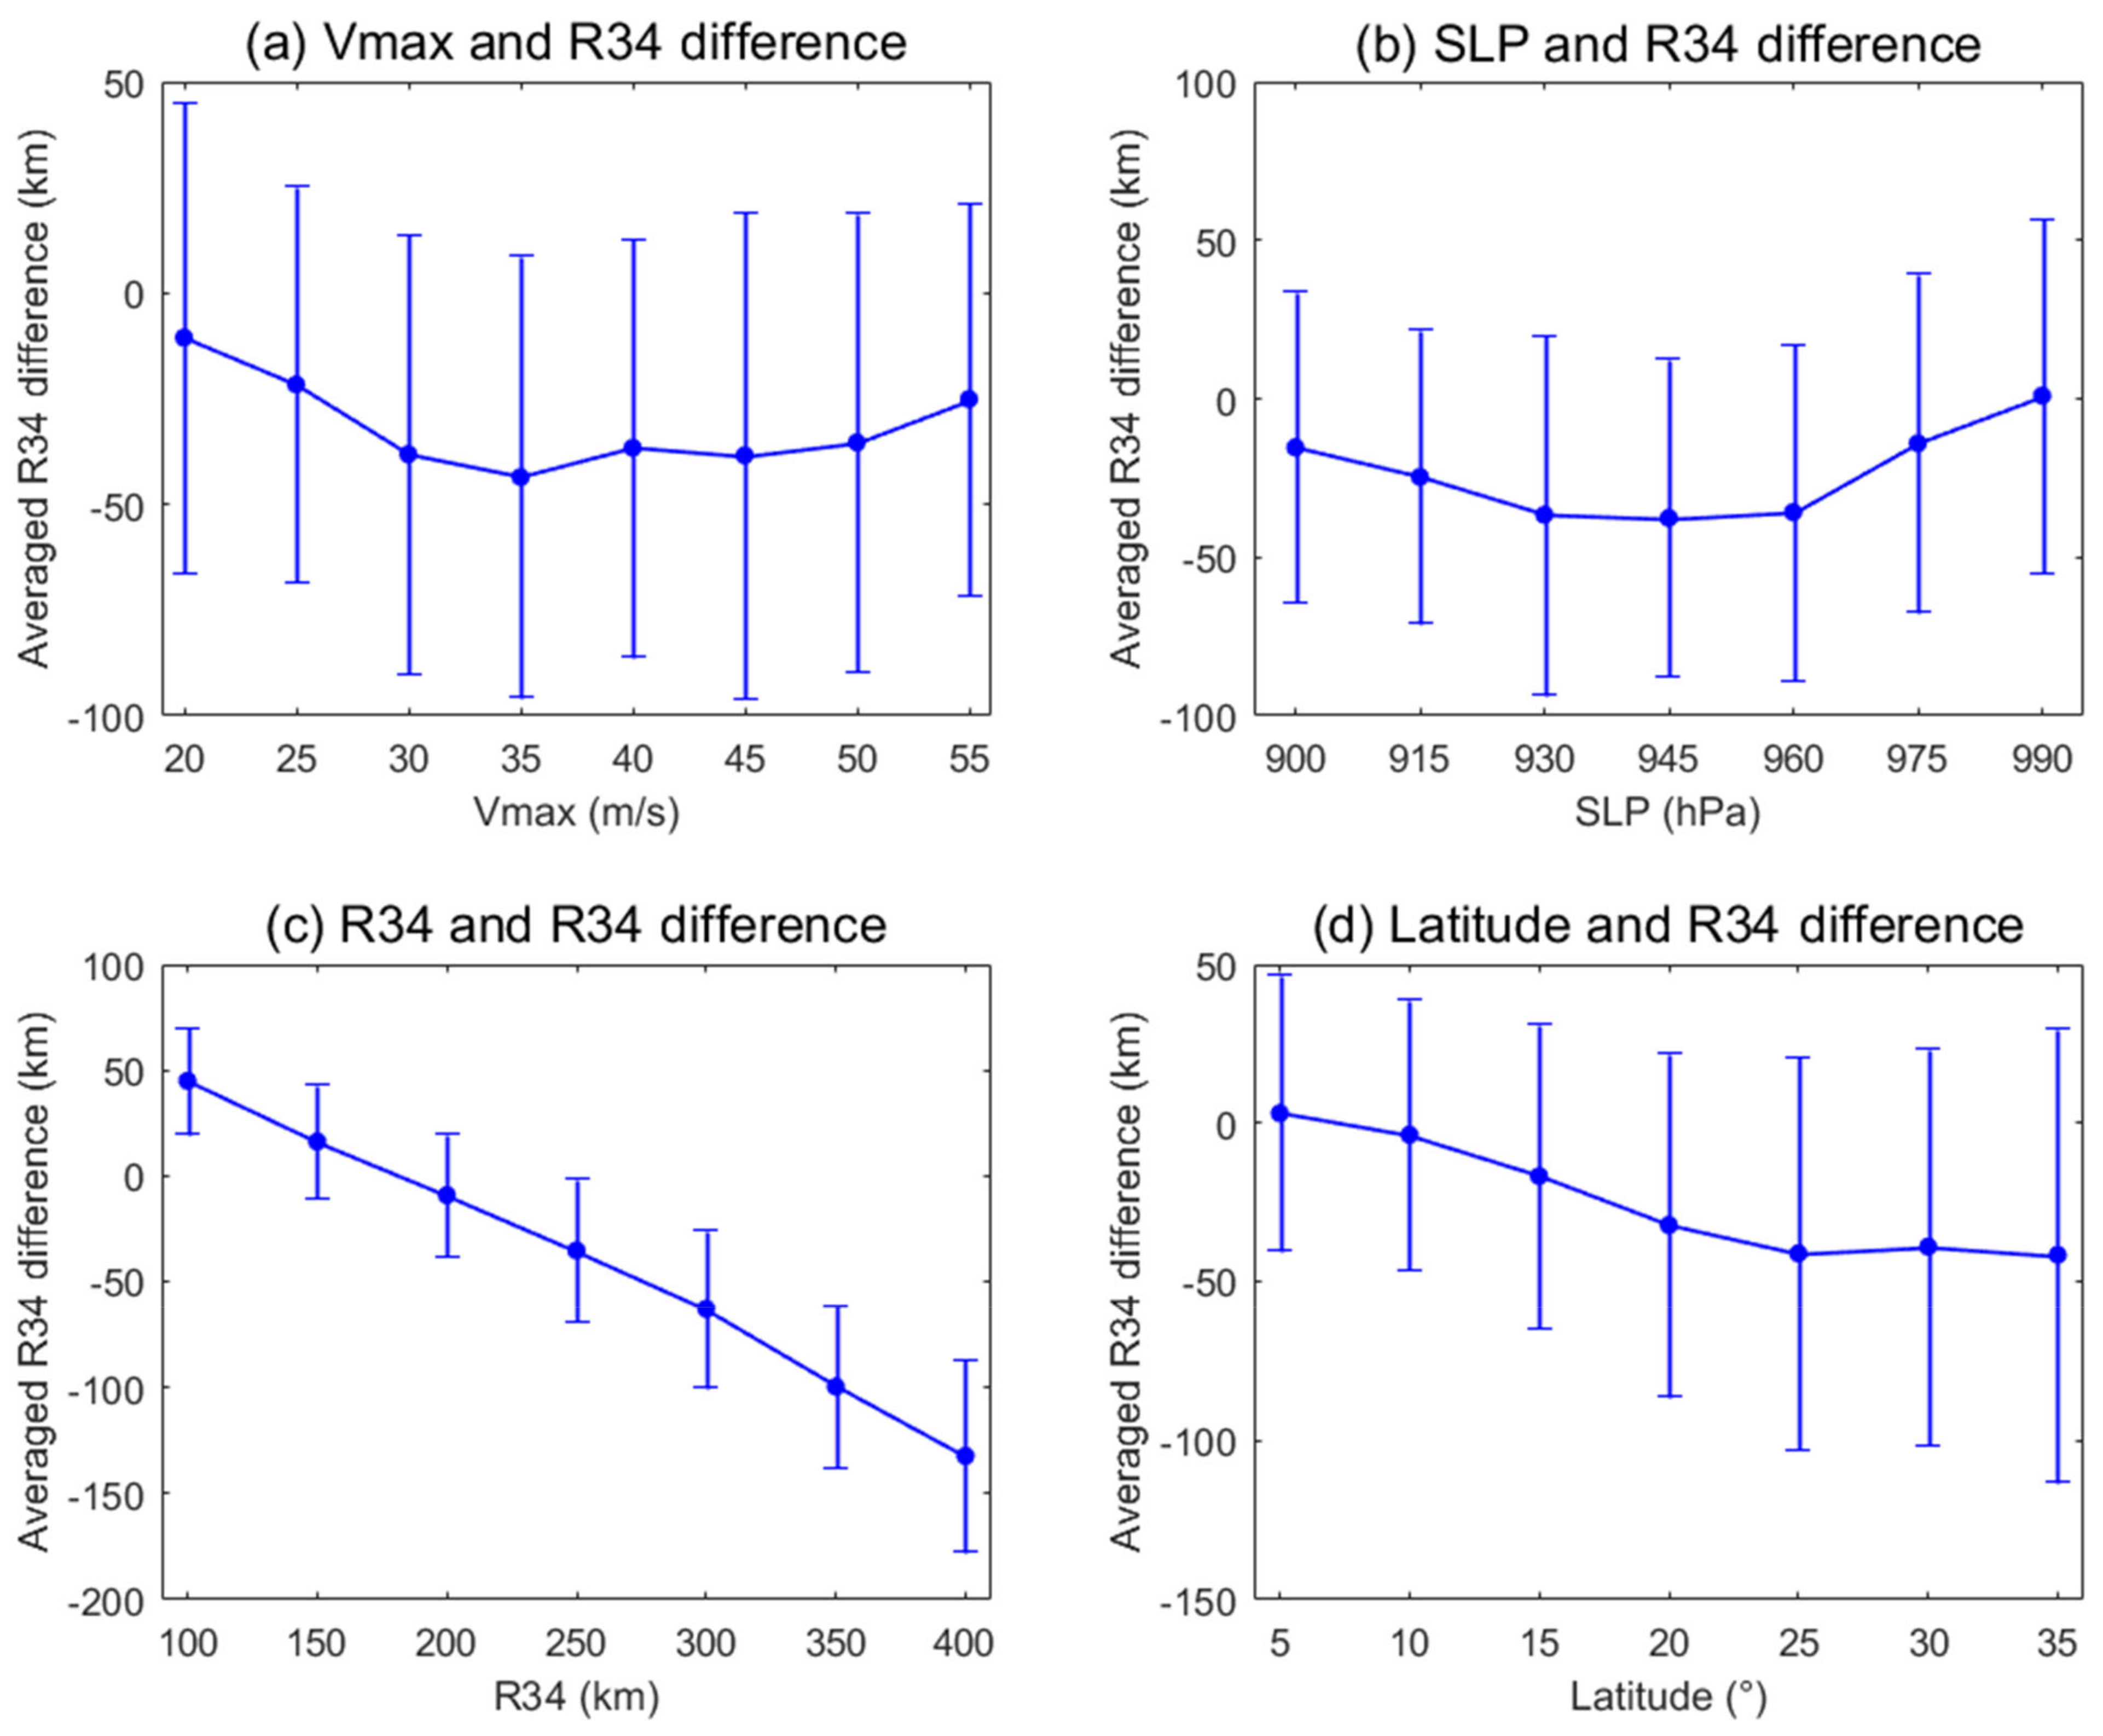
3.3. The Relationship of R34 Difference with R34, Vmax, SLP, and Latitude
3.4. Case Study Based on Satellite Data
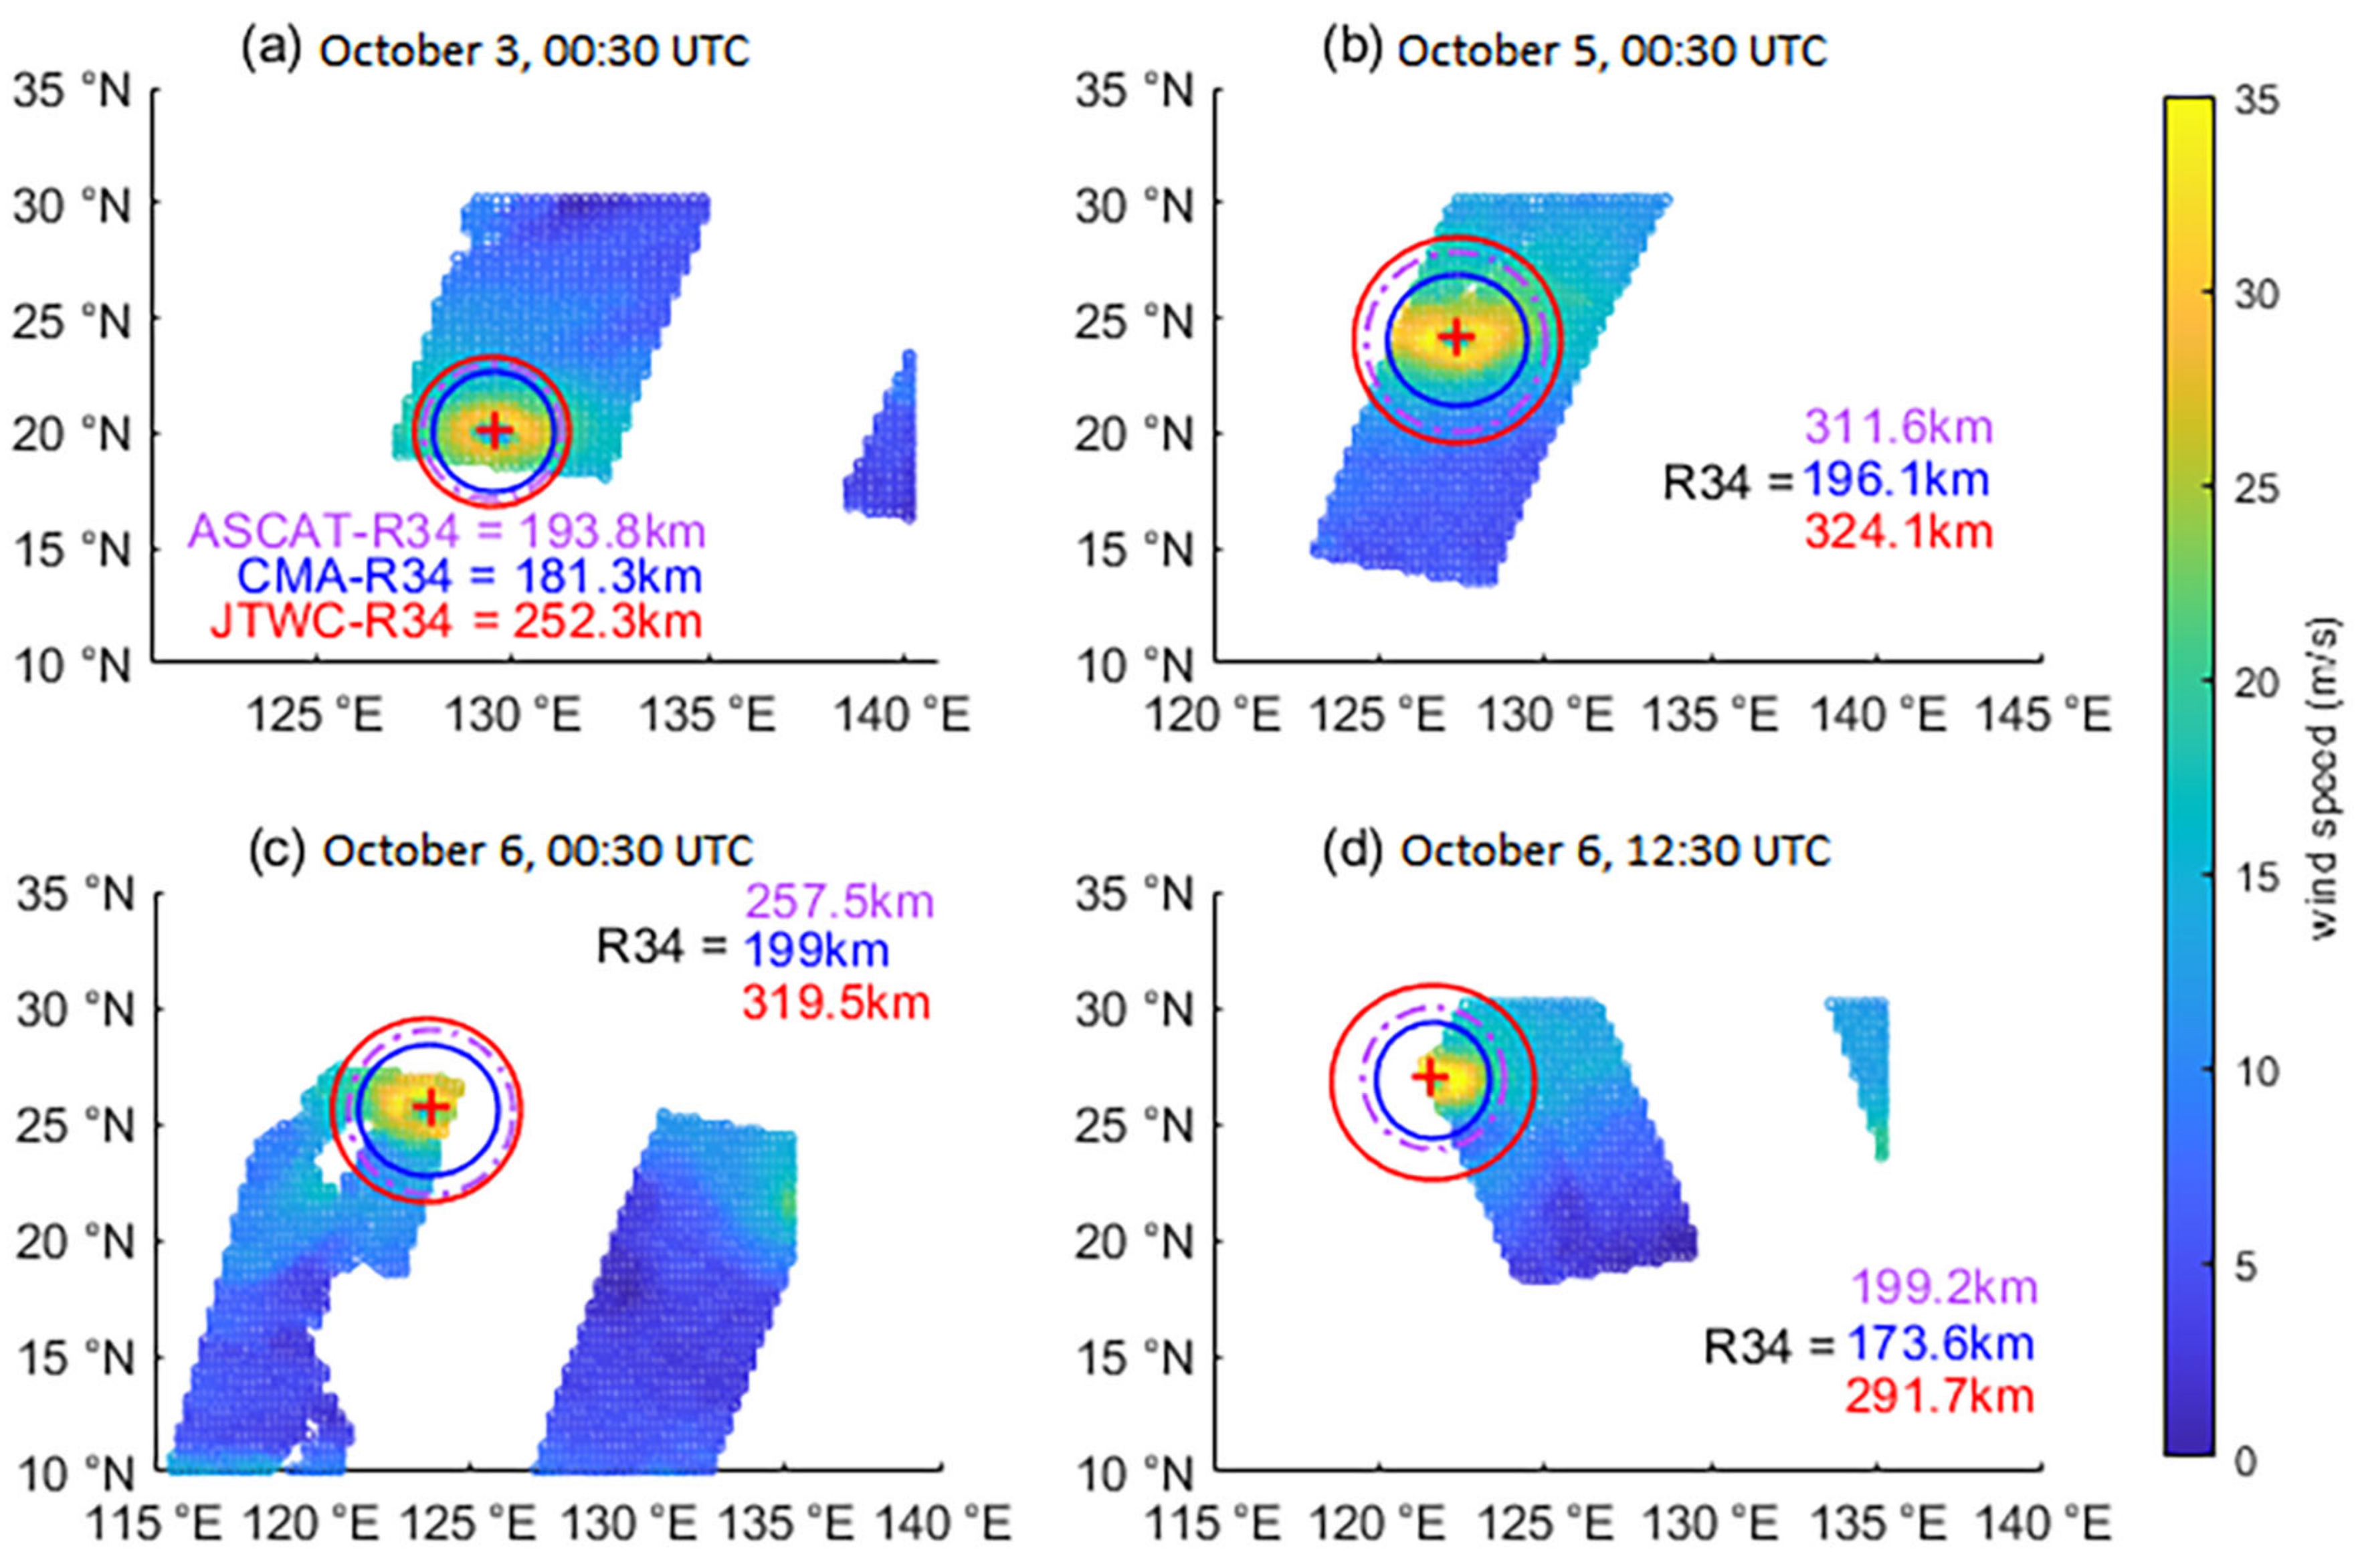
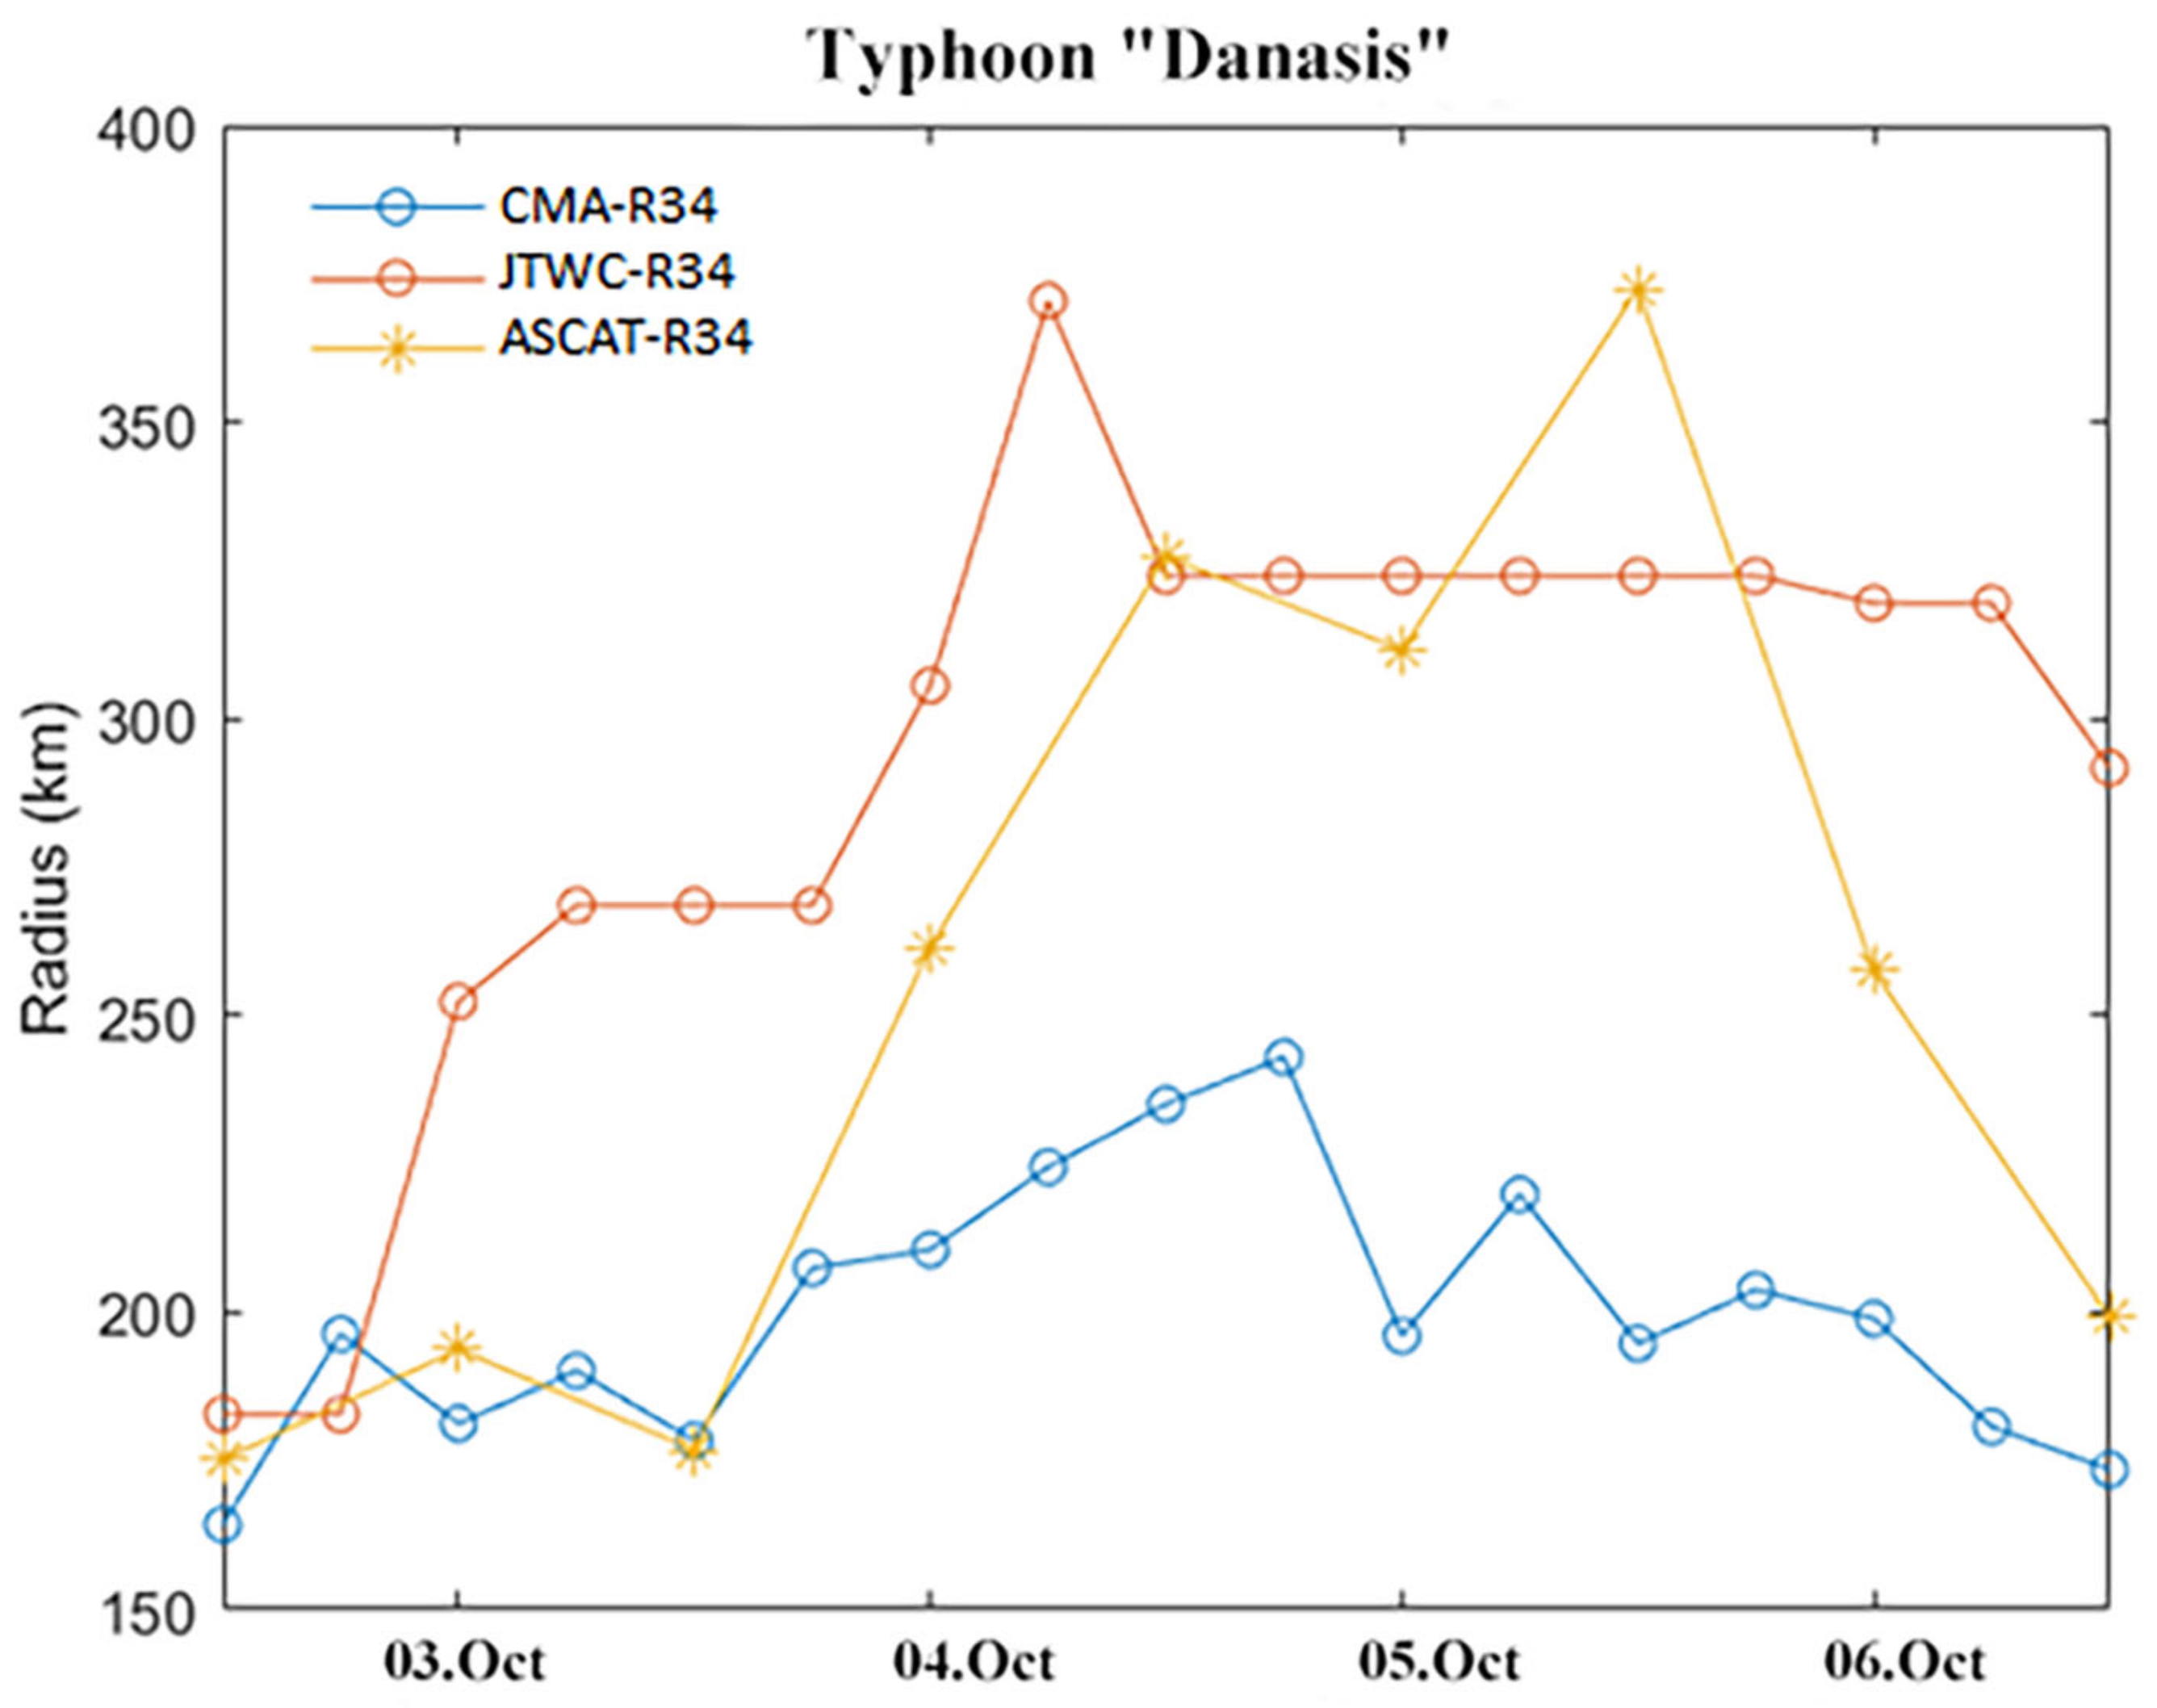
3.4.1. Case Study of Typhoon “Danasis”
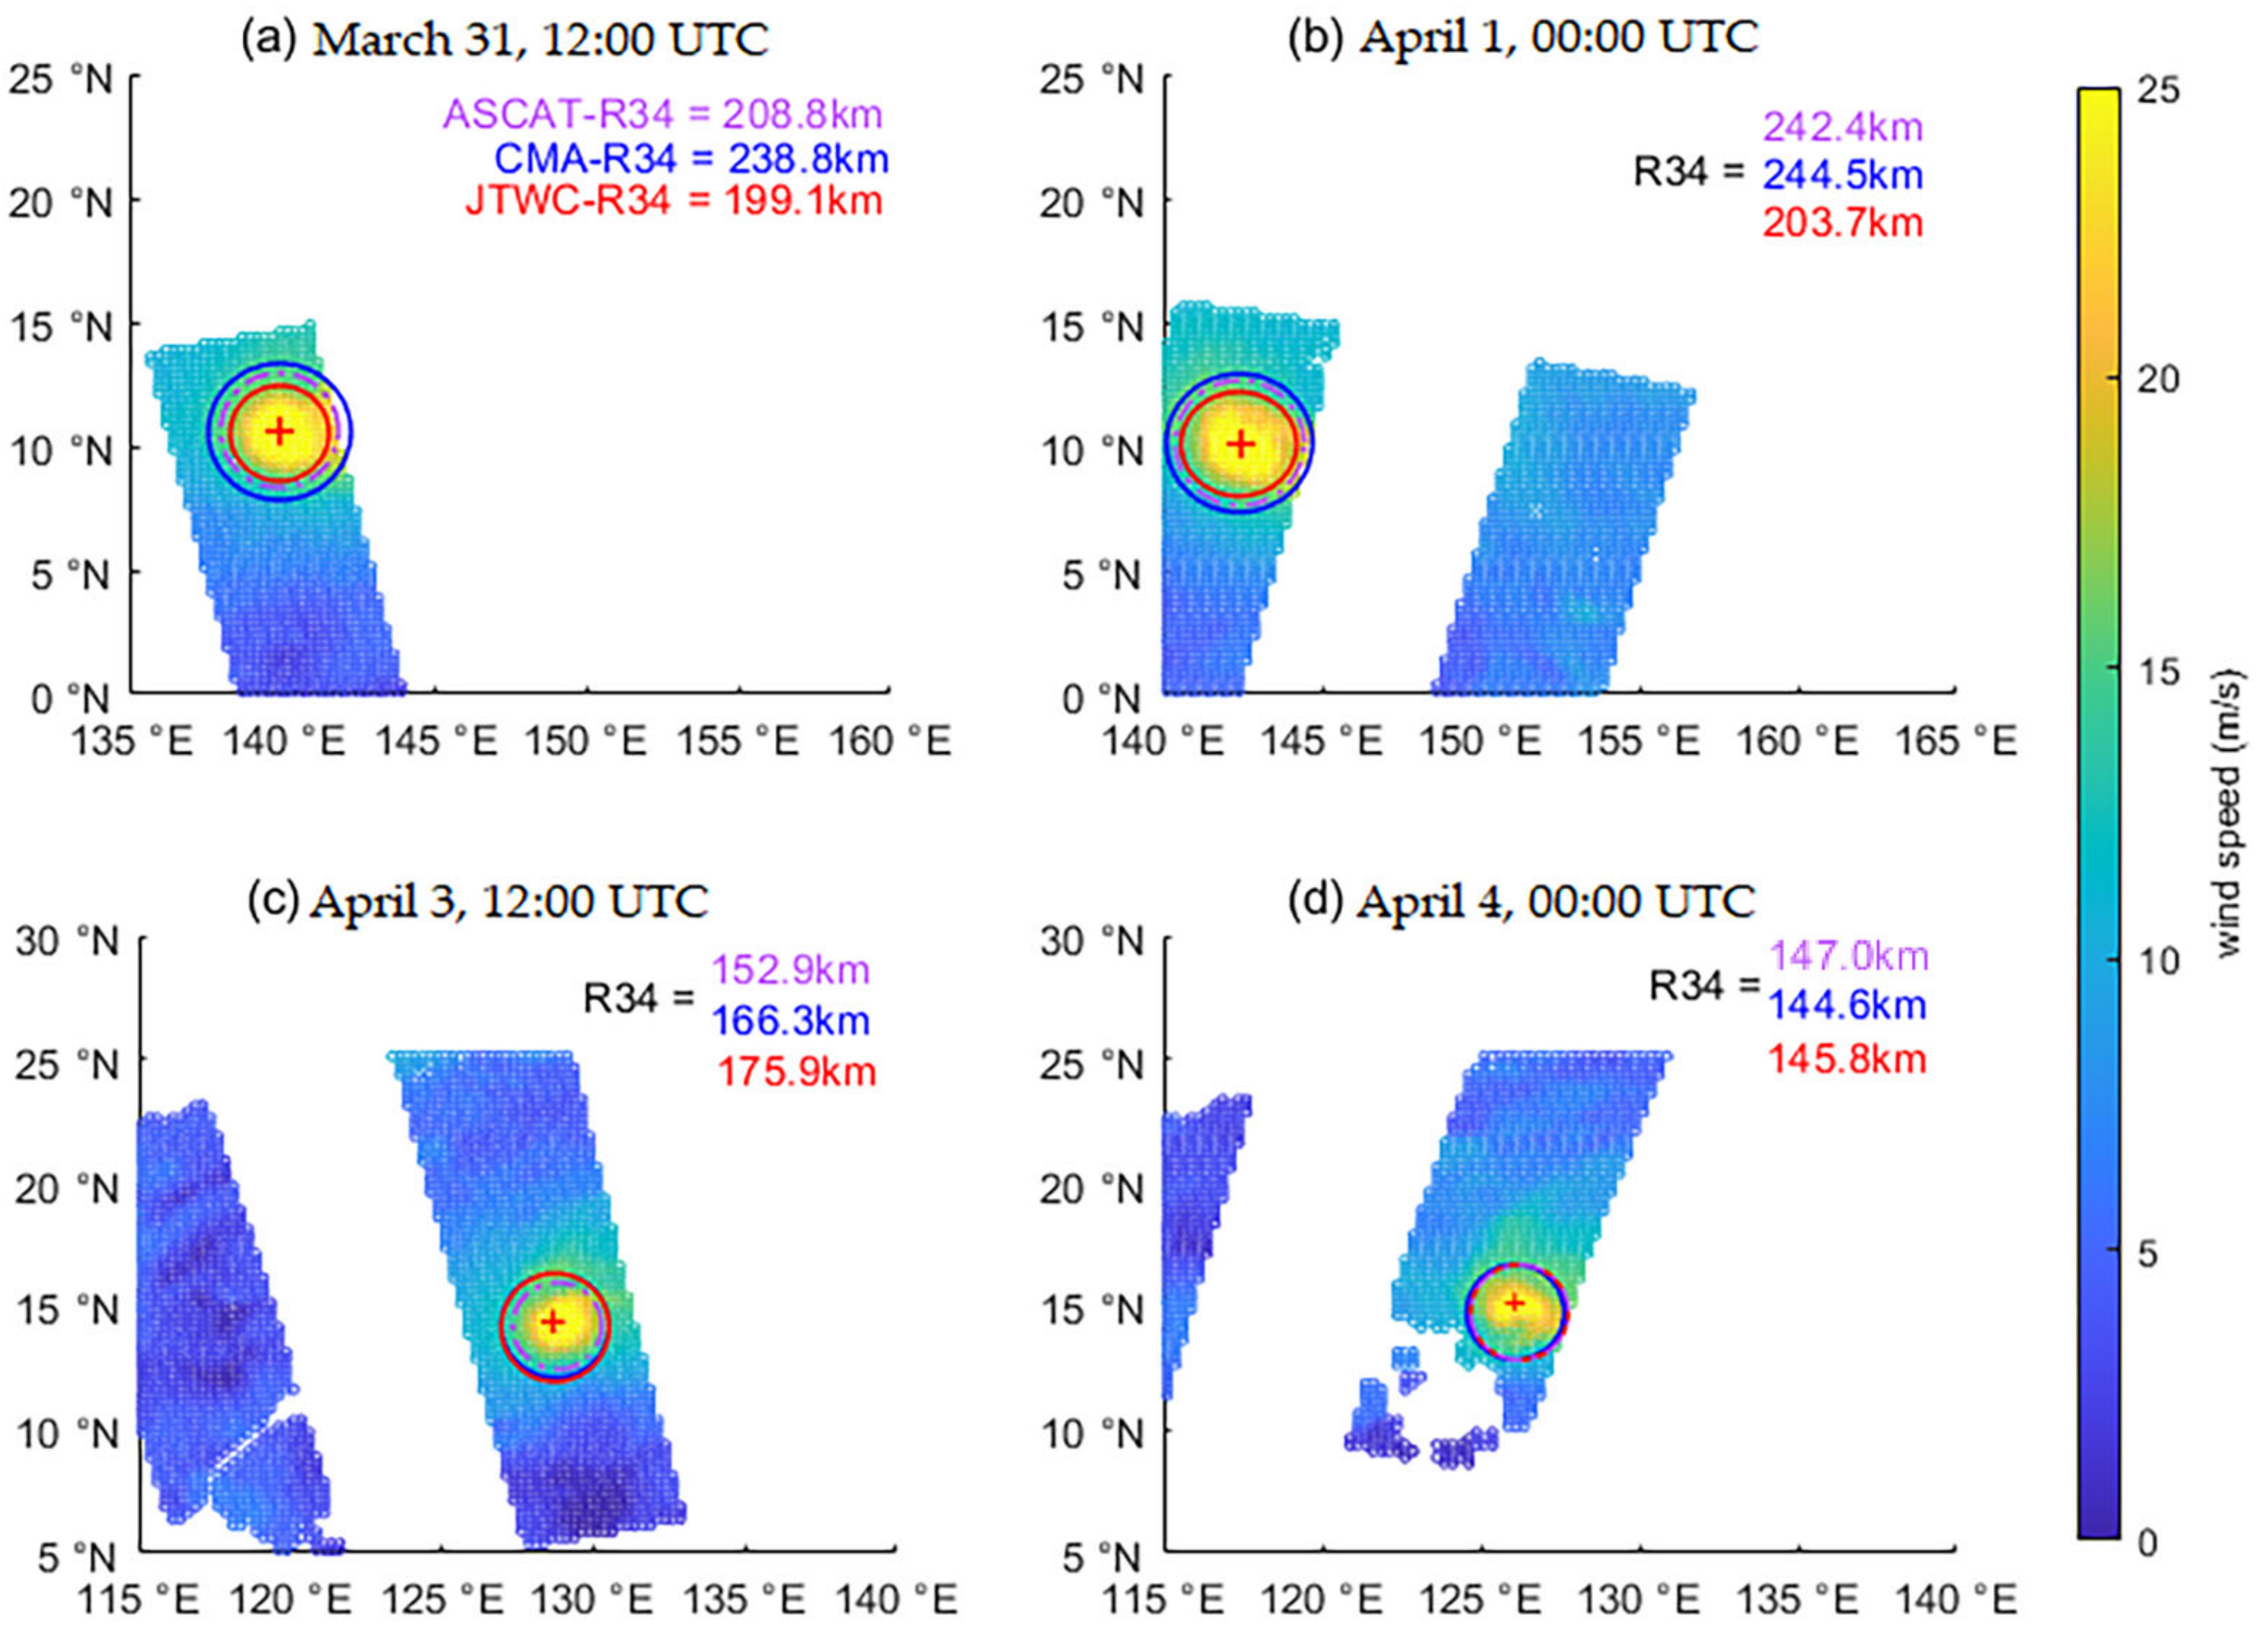
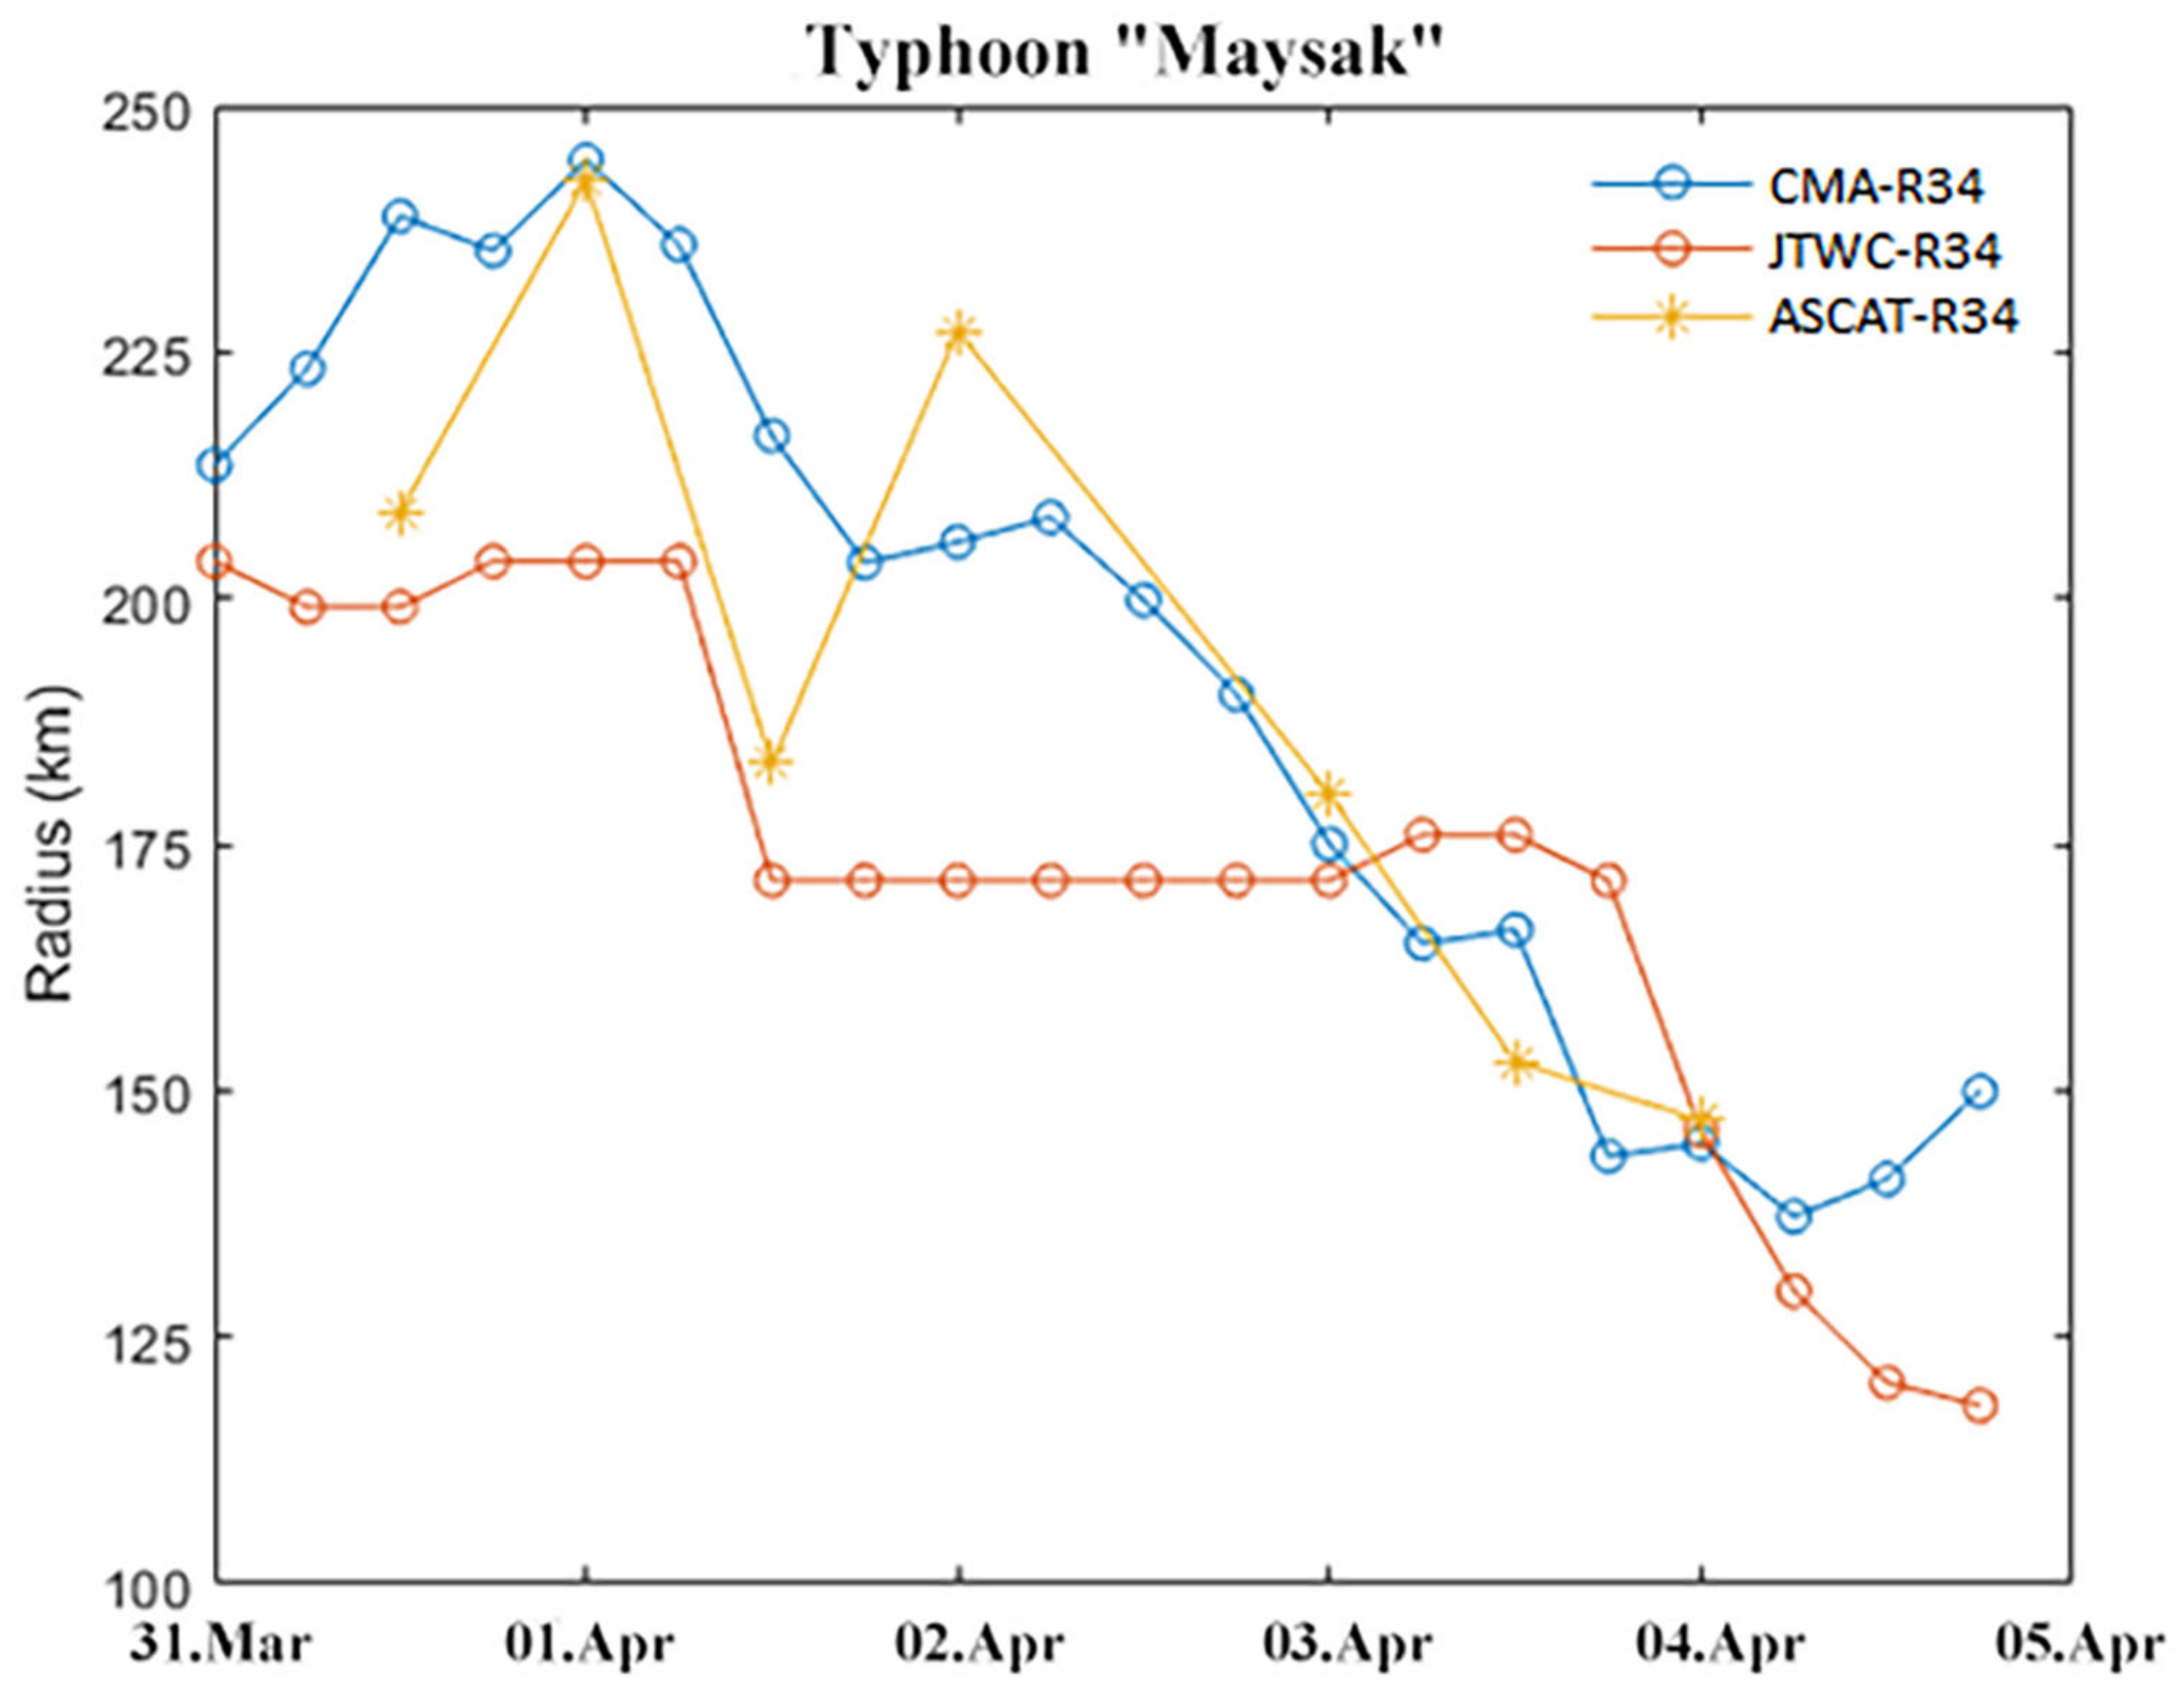
3.4.2. Case Study of Typhoon ”Maysak”
4. Discussion
5. Conclusions
Author Contributions
Funding
Institutional Review Board Statement
Informed Consent Statement
Data Availability Statement
Acknowledgments
Conflicts of Interest
References
- Wang, H.; Xu, M.; Onyejuruwa, A.; Wang, Y.; Wen, S.; Gao, A.E.; Li, Y. Tropical cyclone damages in Mainland China over 2005–2016: Losses analysis and implications. Environ. Dev. Sustain. 2019, 21, 3077–3092. [Google Scholar] [CrossRef]
- Schmidt, S.; Kemfert, C.; Höppe, P. The impact of socio-economics and climate change on tropical cyclone losses in the USA. Reg. Environ. Change J. 2010, 10, 13–26. [Google Scholar] [CrossRef]
- Liu, D.; Pang, L.; Xie, B. Typhoon disaster in China: Prediction, prevention, and mitigation. Nat. Hazards 2009, 49, 421–436. [Google Scholar] [CrossRef]
- Knaff, J.A.; Sampson, C.R.; Chirokova, G. A global statistical–dynamical tropical cyclone wind radii forecast scheme. Weather Forecast. 2017, 32, 629–644. [Google Scholar] [CrossRef]
- Chan, J.C.L.; Yip, C.K.M. Interannual variations of tropical cyclone size over the western North Pacific. Geophys. Res. Lett. 2003, 30, 2267. [Google Scholar] [CrossRef]
- Kimball, S.K.; Mulekar, M.S. A 15-year climatology of North Atlantic tropical cyclones. Part I: Size parameters. J. Clim. 2004, 17, 3555–3575. [Google Scholar] [CrossRef]
- Zhan, R.; Wang, Y. Weak tropical cyclones dominate the poleward migration of the annual mean location of lifetime maximum intensity of Northwest Pacific tropical cyclones since 1980. J. Clim. 2017, 30, 6873–6882. [Google Scholar] [CrossRef]
- Knaff, J.A.; Sampson, C.R.; DeMaria, M.; Marchok, T.P.; Gross, J.M.; McAdie, C.J. Statistical tropical cyclone wind radii prediction using climatology and persistence. Weather Forecast. 2007, 22, 781–791. [Google Scholar] [CrossRef]
- Merrill, R.T. A comparison of large and small tropical cyclones. Mon. Weather Rev. 1984, 112, 1408–1418. [Google Scholar] [CrossRef]
- Lungu, T.; Callahan, P.S. Quikscat Science Data Product User’s Manual: Overview and Geophysical Data Products, Jet Propulsion Laboratory. D-18053-Rev A, version 3. 2006, p. 91. Available online: http://web.eng.ucsd.edu/~sgls/final_galley.pdf (accessed on 3 March 2024).
- Bentamy, A.; Croize-Fillon, D.; Perigaud, C. Characterization of ASCAT measurements based on buoy and QuikSCAT wind vector observations. Ocean Sci. 2008, 4, 265–274. [Google Scholar] [CrossRef]
- Sampson, C.R.; Goerss, J.S.; Knaff, J.A.; Strahl, B.R.; Fukada, E.M.; Serra, E.A. Tropical cyclone gale wind radii estimates, forecasts, and error forecasts for the Western North Pacific. Weather Forecast. 2018, 33, 1081–1092. [Google Scholar] [CrossRef]
- Knapp, K.R.; Kruk, M.C.; Levinson, D.H.; Diamond, H.J.; Neumann, C.J. The international best track archive for climate stewardship (IBTrACS). Bull. Am. Meteorol. Soc. 2010, 91, 363–376. [Google Scholar] [CrossRef]
- Knaff, J.A.; Sampson, C.R.; Kucas, M.E.; Slocum, C.J.; Brennan, M.J.; Meissner, T.; Ricciardulli, L.; Mouche, A.; Reul, N.; Morris, M.; et al. Estimating tropical cyclone surface winds: Current status, emerging technologies, historical evolution, and a look to the future. Trop. Cyclone Res. Rev. 2021, 10, 125–150. [Google Scholar] [CrossRef]
- Zhao, K.; Zhao, C. Evaluation of HY-2a scatterometer ocean surface wind data during 2012–2018. Remote Sens. 2019, 11, 2968. [Google Scholar] [CrossRef]
- Lee, C.-S.; Cheung, K.K.W.; Fang, W.-T.; Elsberry, R.L. Initial maintenance of tropical cyclone size in the Western North Pacific. Mon. Weather Rev. 2010, 138, 3207–3223. [Google Scholar] [CrossRef]
- Misra, T.; Chakraborty, P.; Lad, C.; Gupta, P.; Rao, J.; Upadhyay, G.; Kumar, S.V.; Kumar, B.S.; Gangele, S.; Sinha, S.; et al. SCATSAT-1 scatterometer: An improved successor of OSCAT. Curr. Sci. 2019, 117, 941–949. [Google Scholar] [CrossRef]
- Chan, K.T.F.; Chan, J.C.L. Size and strength of tropical cyclones as inferred from QuikSCAT data. Mon. Weather Rev. 2012, 140, 811–824. [Google Scholar] [CrossRef]
- Knaff, J.A.; DeMaria, M.; Molenar, D.A.; Sampson, C.R.; Seybold, M.G. An automated, objective, multiple-satellite-platform tropical cyclone surface wind analysis. J. Appl. Meteorol. Clim. 2011, 50, 2149–2166. [Google Scholar] [CrossRef]
- Hong, S.; Shin, I. Wind speed retrieval based on sea surface roughness measurements from spaceborne microwave radiometers. J. Appl. Meteorol. Clim. 2013, 52, 507–516. [Google Scholar] [CrossRef]
- Kwon, M. Estimation and statistical characteristics of the radius of maximum wind of tropical cyclones using COMS IR imagery. Atmosphere 2012, 22, 473–481. [Google Scholar] [CrossRef]
- Lee, Y.-K.; Kwon, M. An estimation of the of tropical cyclone size using COMS infrared imagery. Atmosphere 2015, 25, 569–573. [Google Scholar] [CrossRef]
- Song, J.; Klotzbach, P.J. Wind structure discrepancies between two best track datasets for Western North Pacific tropical cyclones. Mon. Weather Rev. 2016, 144, 4533–4551. [Google Scholar] [CrossRef]
- Kim, H.-J.; Moon, I.-J.; Oh, I. Comparison of tropical cyclone wind radius estimates between the KMA, RSMC Tokyo, and JTWC. Asia-Pac. J. Atmos. Sci. 2022, 58, 563–576. [Google Scholar] [CrossRef]
- Lu, X.; Yu, H.; Yang, X.; Li, X. Estimating tropical cyclone size in the northwestern pacific from geostationary satellite infrared images. Remote Sens. 2017, 9, 728. [Google Scholar] [CrossRef]
- Yu, H.; Hu, C.; Jiang, L. Comparison of three tropical cyclone intensity datasets. Acta Meteorol. Sin. 2007, 21, 121. [Google Scholar]
- Shea, D.J.; Gray, W.M. The hurricane’s inner core region. I. Symmetric and asymmetric structure. J. Atmos. Sci. 1973, 30, 1544–1564. [Google Scholar] [CrossRef]
- Sampson, C.R.; Knaff, J.A. A Consensus Forecast for Tropical Cyclone Gale Wind Radii. Weather Forecast. 2015, 30, 1397–1403. [Google Scholar] [CrossRef]
- Weatherford, C.L.; Gray, W.M. Typhoon structure as revealed by aircraft reconnaissance. Part I: Data analysis and climatology. Mon. Weather Rev. 1988, 116, 1032–1043. [Google Scholar] [CrossRef]
- Wu, L.; Lei, X. Preliminary research on the size of inner core and periphery and their relationship with the intensity of tropical cyclones. J. Trop. Meteorol. 2012, 28, 719–725. [Google Scholar] [CrossRef]
- Chan, K.T.F.; Chan, J.C.L. Global climatology of tropical cyclone size as inferred from QuikSCAT data. Int. J. Clim. 2015, 35, 4843–4848. [Google Scholar] [CrossRef]
- Knaff, J.A.; Longmore, S.P.; Molenar, D.A. An objective satellite-based tropical cyclone size climatology. J. Clim. 2014, 27, 455–476. [Google Scholar] [CrossRef]
- Song, J.; Wang, Y.; Wu, L. Trend discrepancies among three best track data sets of western North Pacific tropical cyclones. J. Geophys. Res. Atmos. 2010, 115, D12128. [Google Scholar] [CrossRef]
- Zhang, D.; Zhang, H.; Cheng, X. Comparative analysis on the characteristics of tropical-cyclone activities over the western North Pacific in three datasets. J. Mar. Sci. 2020, 38, 48–57. [Google Scholar] [CrossRef]
- Dvorak, V.F. Tropical Cyclone Intensity Analysis Using Satellite Data; US Department of Commerce, National Oceanic and Atmospheric Administration, National Environmental Satellite, Data, and Information Service: Silver Spring, MD, USA, 1984; Volume 11. [Google Scholar]
- Velden, C.; Burton, A.; Kuroiwa, K. The first international workshop on satellite analysis of tropical cyclones: Summary of current operational methods to estimate intensity. Trop. Cyclone Res. Rev. 2012, 1, 469–481. [Google Scholar] [CrossRef]
- Xiang, F.; Di, X.; Xiaolong, L.; Xin, W. The ocean surface vector wind data of QuikSCAT and its application in tropical cyclone analysis. Meteorol. Mon. 2007, 33, 33–39. [Google Scholar]
- Lu, X.; Yu, H.; Lei, X. Statistics for size and radial wind profile of tropical cyclones in the western North Pacific. J. Meteorol. Res. 2011, 25, 104–112. [Google Scholar] [CrossRef]
- Barcikowska, M.; Feser, F.; von Storch, H. Usability of best track data in climate statistics in the Western North Pacific. Mon. Weather Rev. 2012, 140, 2818–2830. [Google Scholar] [CrossRef]
- Knaff, J.A.; Slocum, C.J.; Musgrave, K.D.; Sampson, C.R.; Strahl, B.R. Using routinely available information to estimate tropical cyclone wind structure. Mon. Weather Rev. 2016, 144, 1233–1247. [Google Scholar] [CrossRef]
- Dolling, K.; Ritchie, E.A.; Tyo, J.S. The use of the deviation angle variance technique on geostationary satellite imagery to estimate tropical cyclone size parameters. Weather Forecast. 2016, 31, 1625–1642. [Google Scholar] [CrossRef]


| The Parameters Are Correlated with the Discrepancies in R34 | R34 | VAMX | SLP | Latitude |
|---|---|---|---|---|
| CMA | 0.16 | 0.05 | −0.06 | 0.26 |
| JTWC | 0.58 | 0.01 | −0.01 | 0.26 |
Disclaimer/Publisher’s Note: The statements, opinions and data contained in all publications are solely those of the individual author(s) and contributor(s) and not of MDPI and/or the editor(s). MDPI and/or the editor(s) disclaim responsibility for any injury to people or property resulting from any ideas, methods, instructions or products referred to in the content. |
© 2024 by the authors. Licensee MDPI, Basel, Switzerland. This article is an open access article distributed under the terms and conditions of the Creative Commons Attribution (CC BY) license (https://creativecommons.org/licenses/by/4.0/).
Share and Cite
Li, J.; Li, Y.; Tang, J. On the Size Discrepancies between Datasets from China Meteorological Administration and Joint Typhoon Warning Center for the Northwestern Pacific Tropical Cyclones. Atmosphere 2024, 15, 355. https://doi.org/10.3390/atmos15030355
Li J, Li Y, Tang J. On the Size Discrepancies between Datasets from China Meteorological Administration and Joint Typhoon Warning Center for the Northwestern Pacific Tropical Cyclones. Atmosphere. 2024; 15(3):355. https://doi.org/10.3390/atmos15030355
Chicago/Turabian StyleLi, Jinhe, Yubin Li, and Jie Tang. 2024. "On the Size Discrepancies between Datasets from China Meteorological Administration and Joint Typhoon Warning Center for the Northwestern Pacific Tropical Cyclones" Atmosphere 15, no. 3: 355. https://doi.org/10.3390/atmos15030355