
Mesoscale Convective Systems and Extreme Precipitation on the West African Coast Linked to Ocean–Atmosphere Conditions during the Monsoon Period in the Gulf of Guinea


Abstract
:1. Introduction
2. Data and Methods
2.1. Data
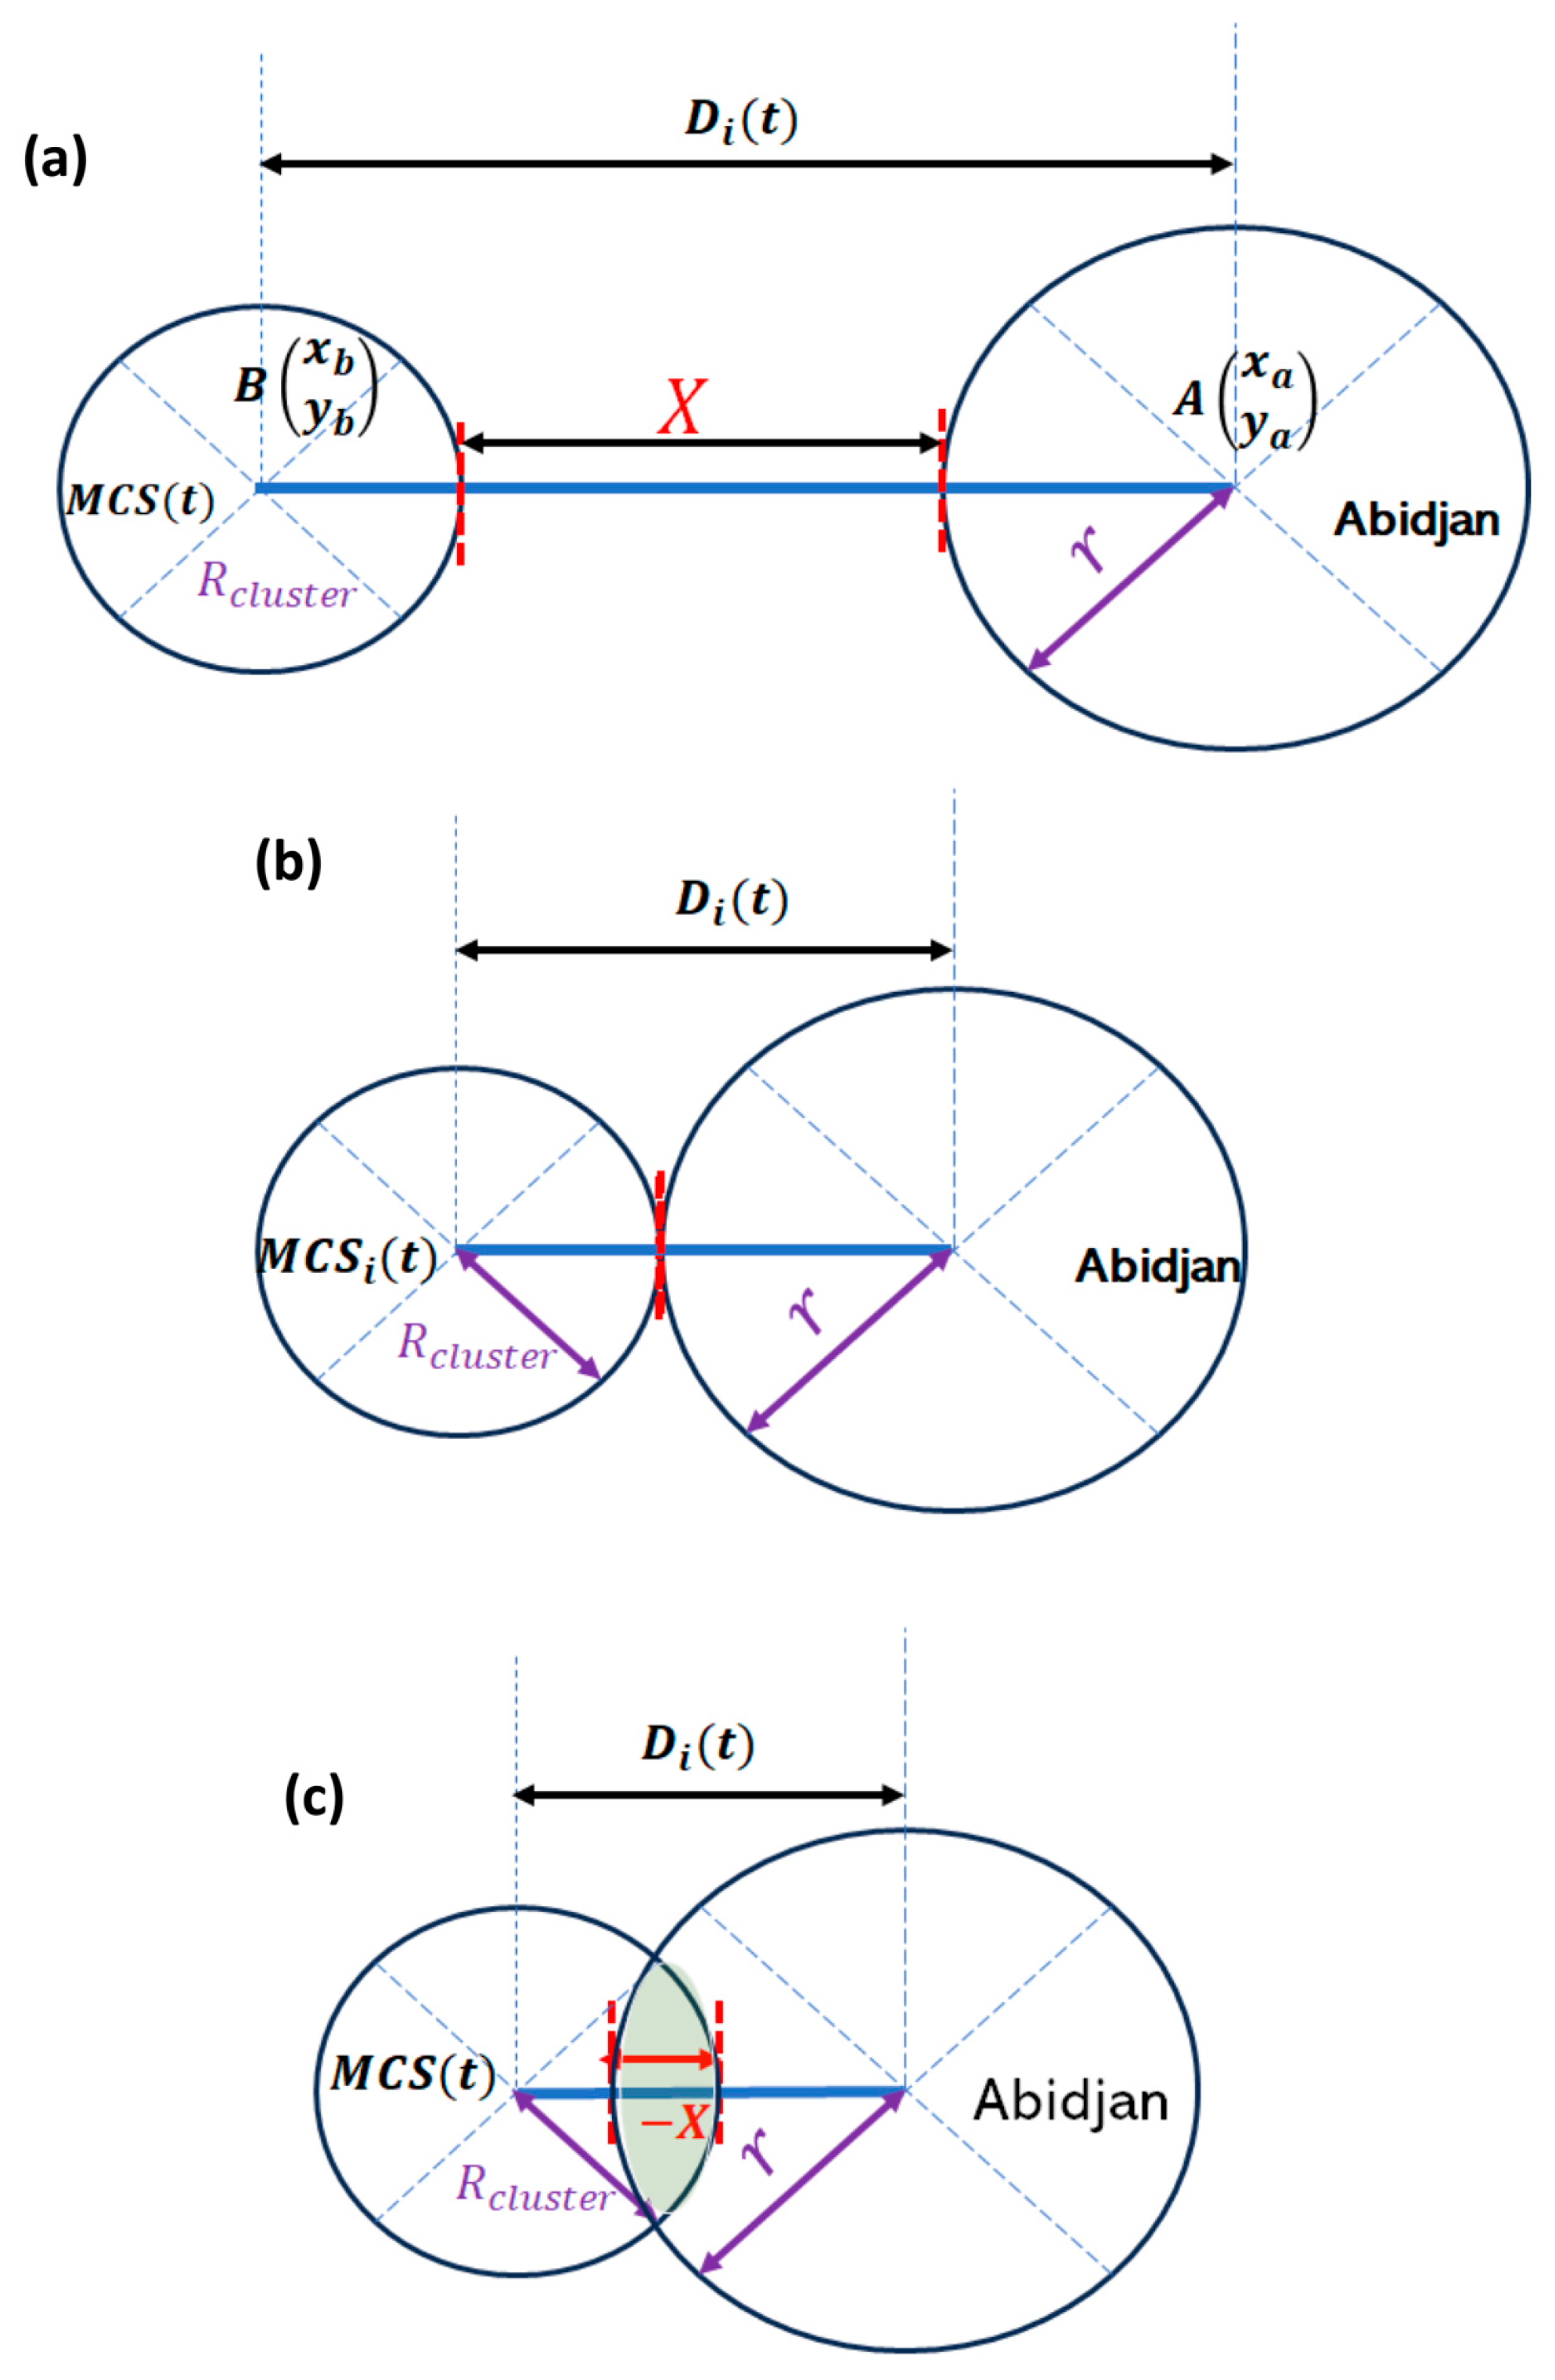
2.2. Methods
3. Results and Discussion
3.1. MCS Occurrence along the Coast during JJAS
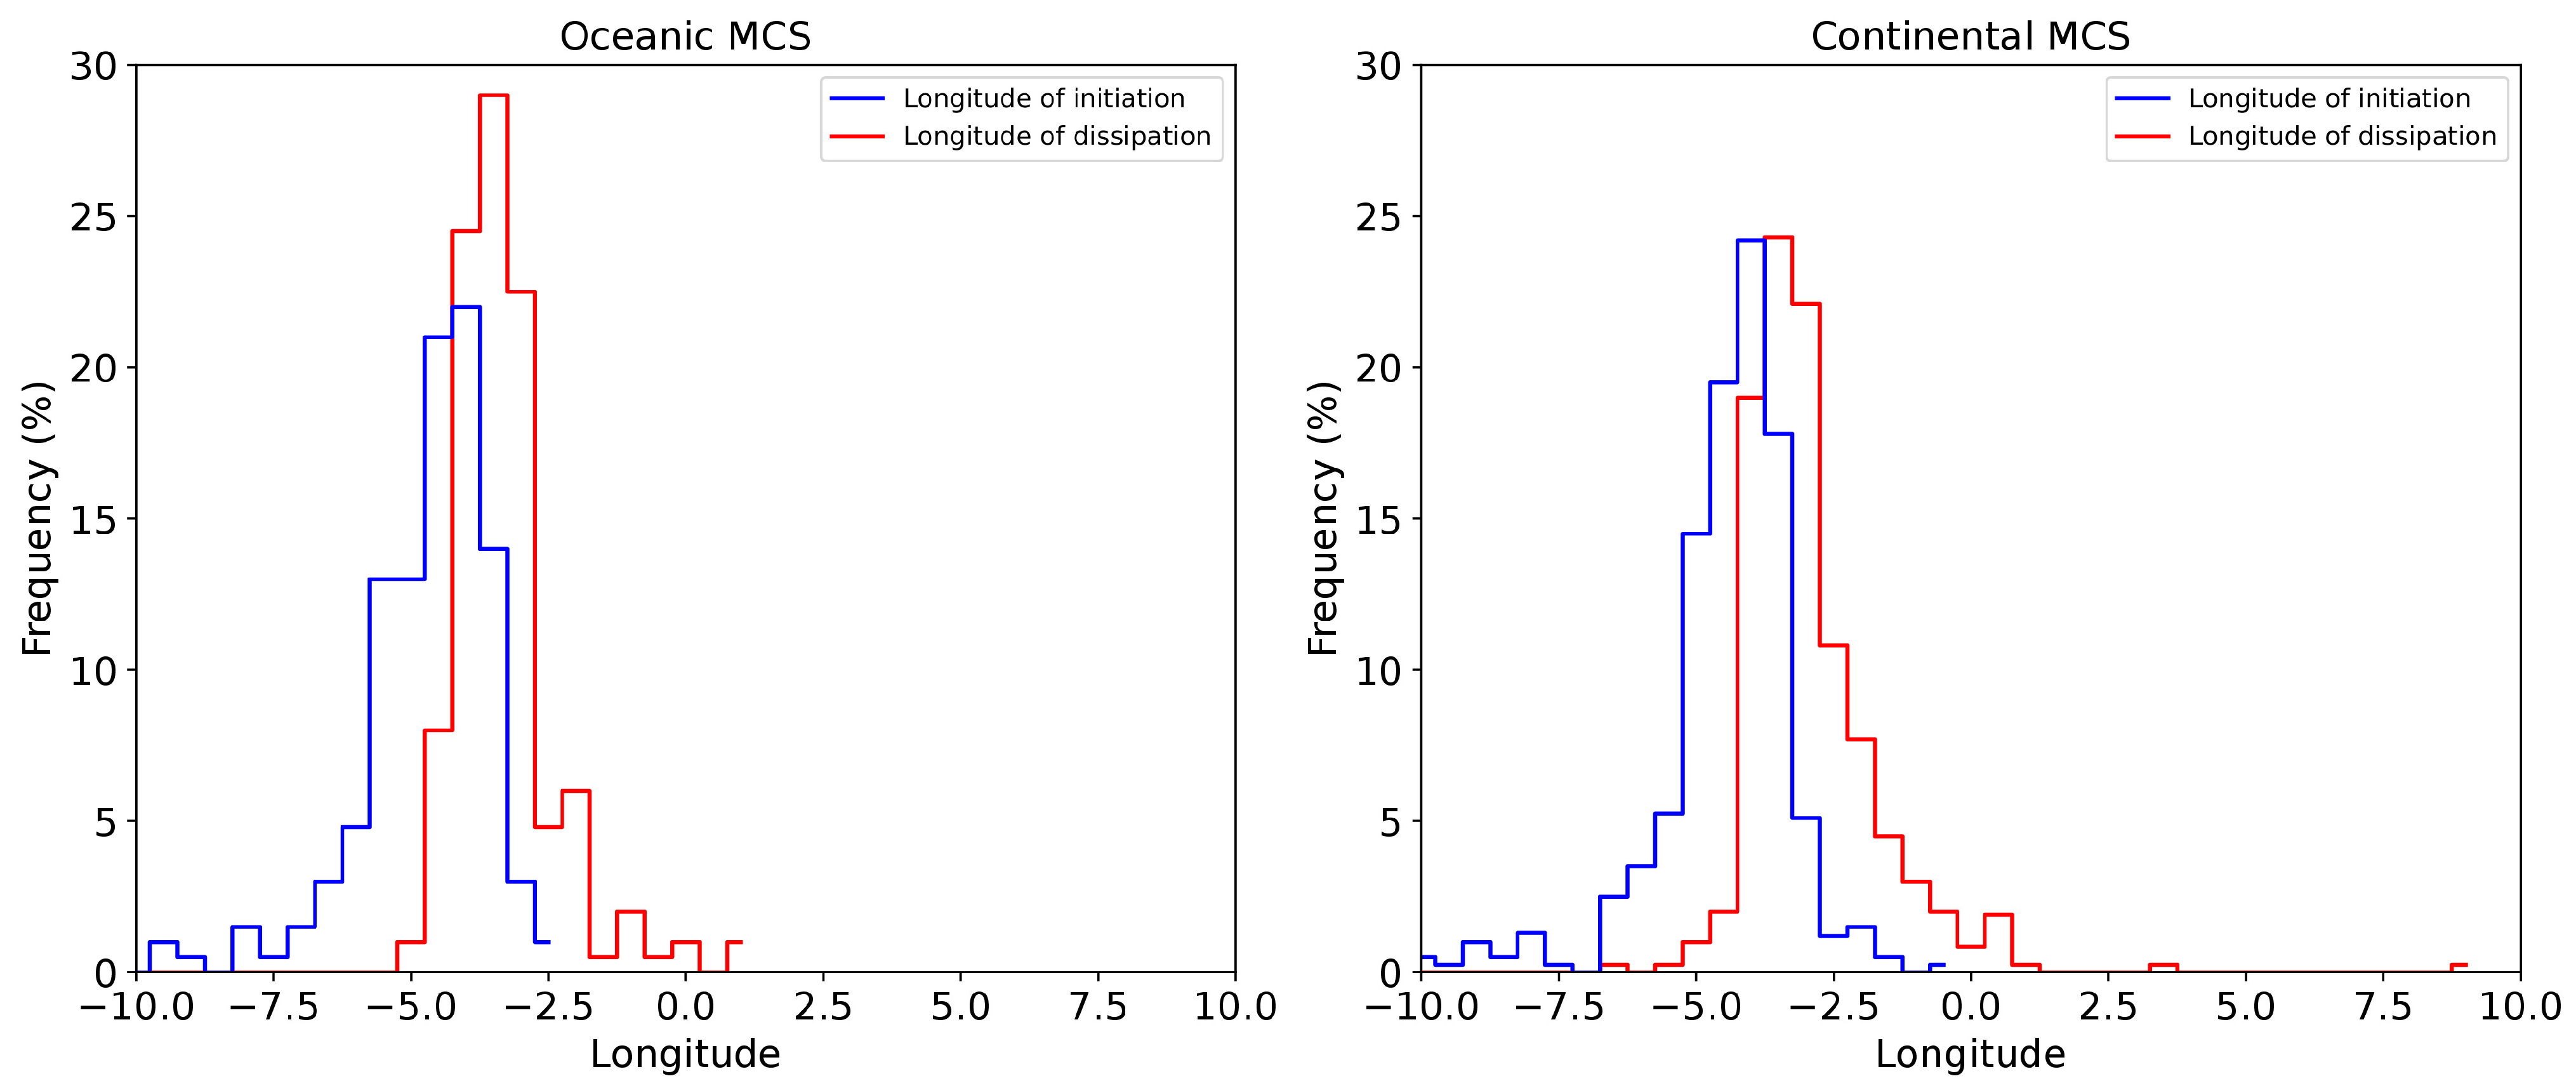
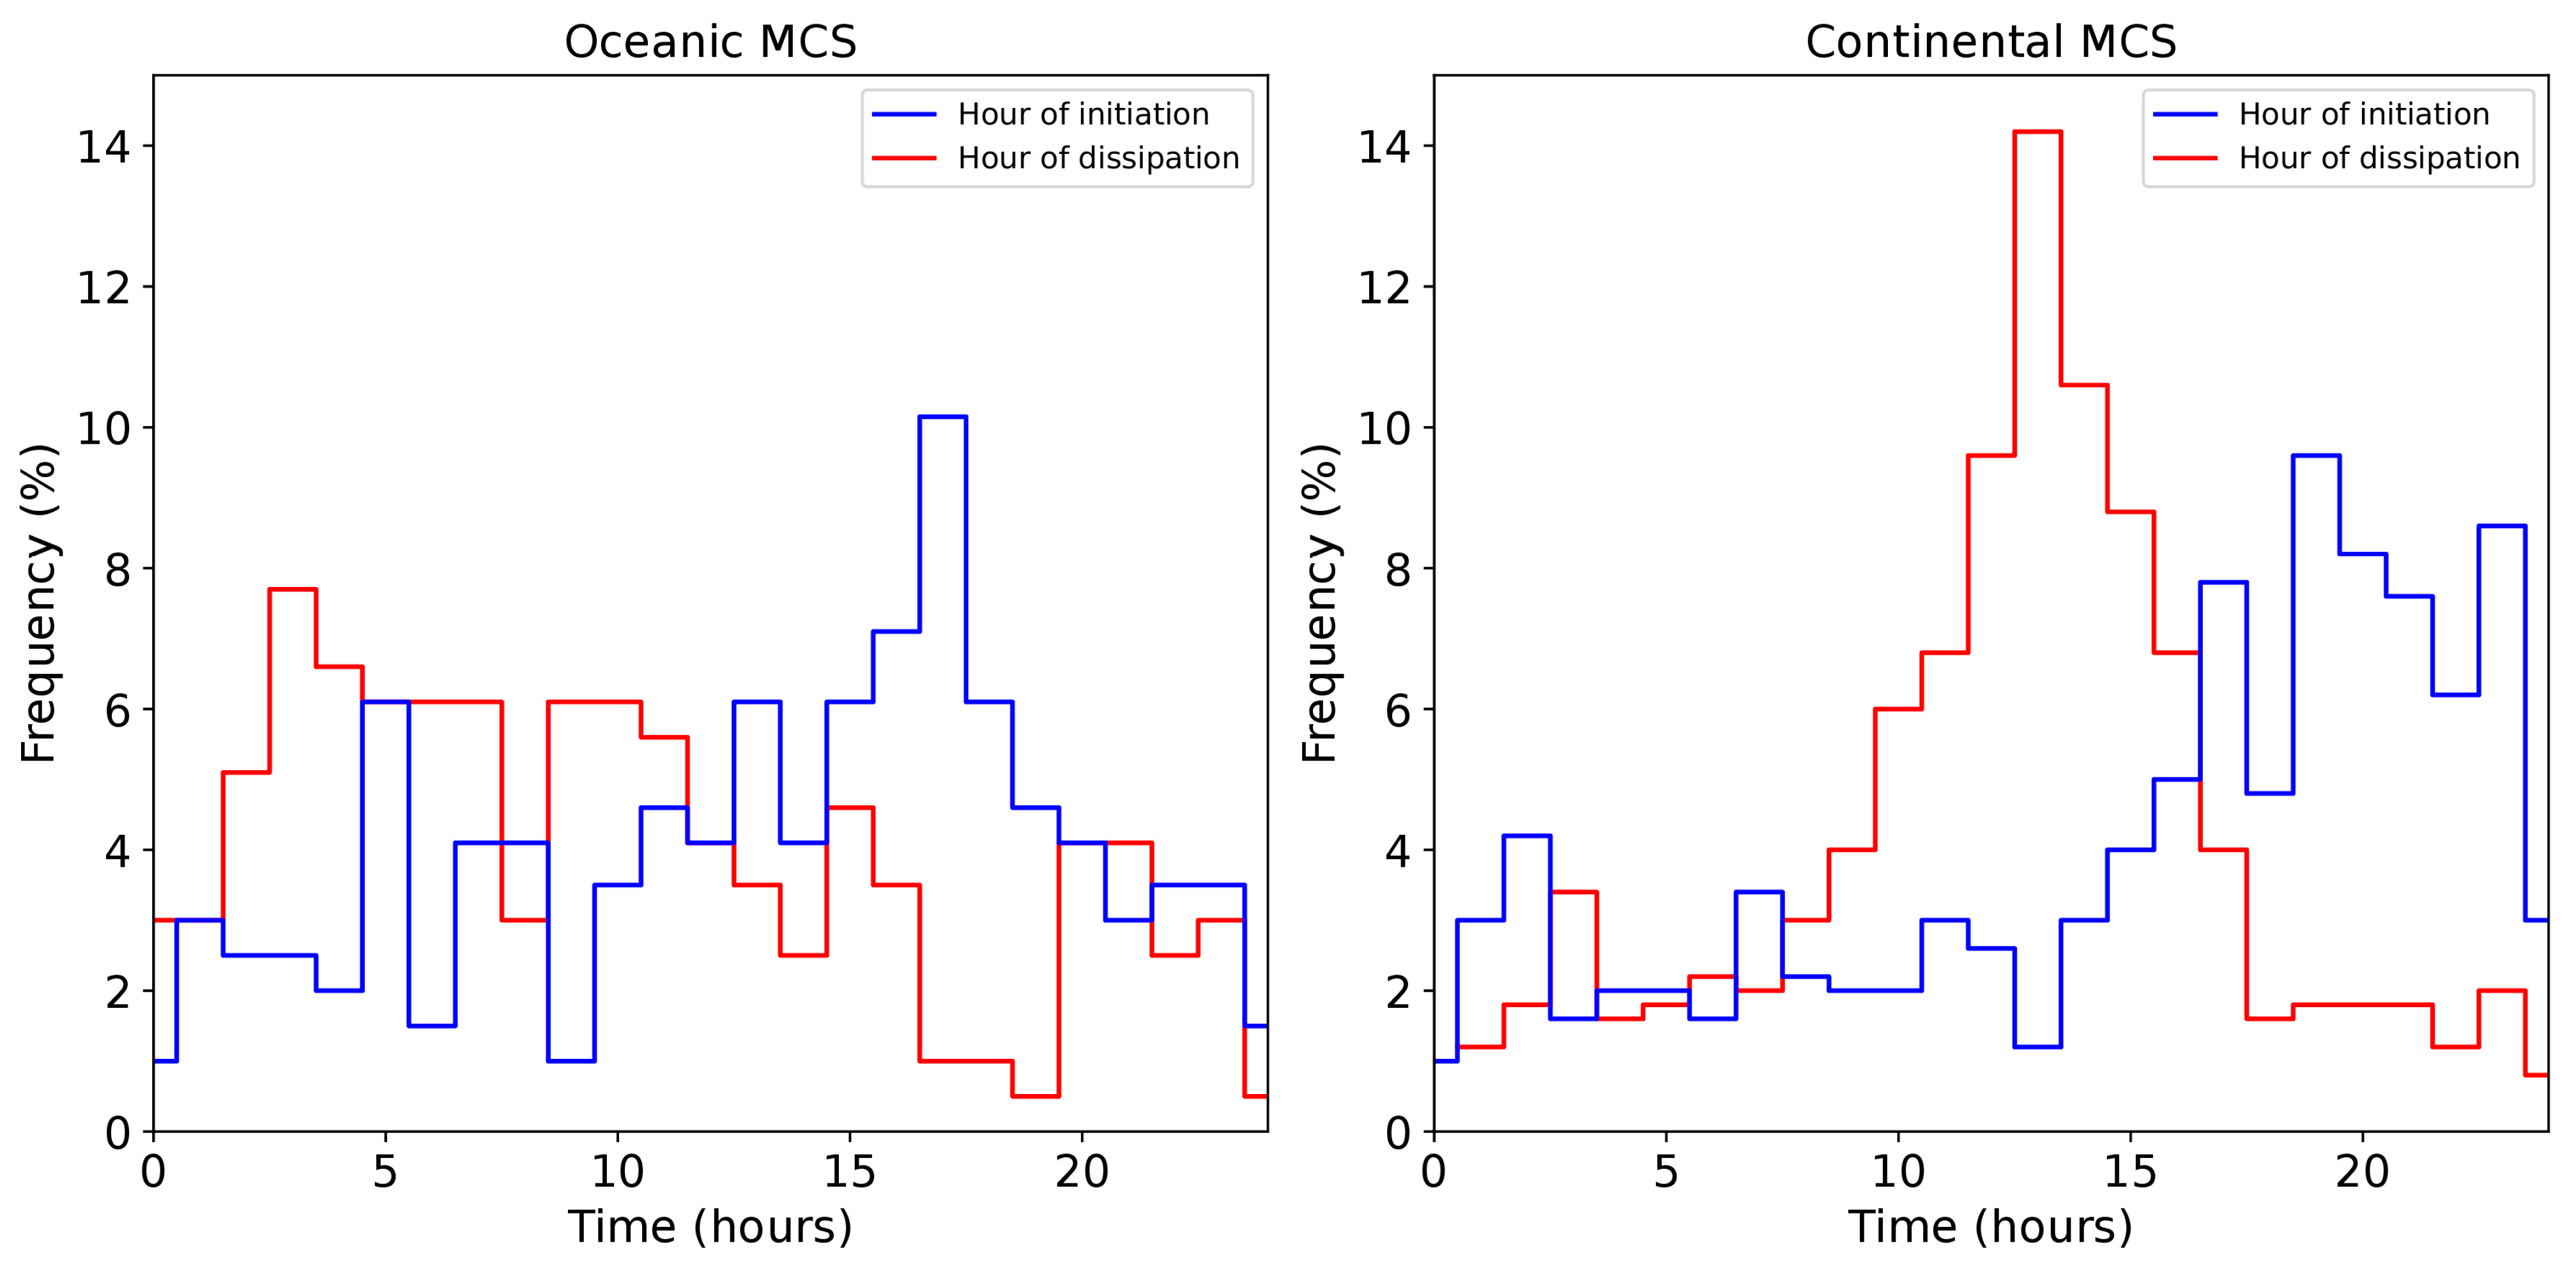
3.2. Spreading and Daily Convective Activity of MCSs along the Coast
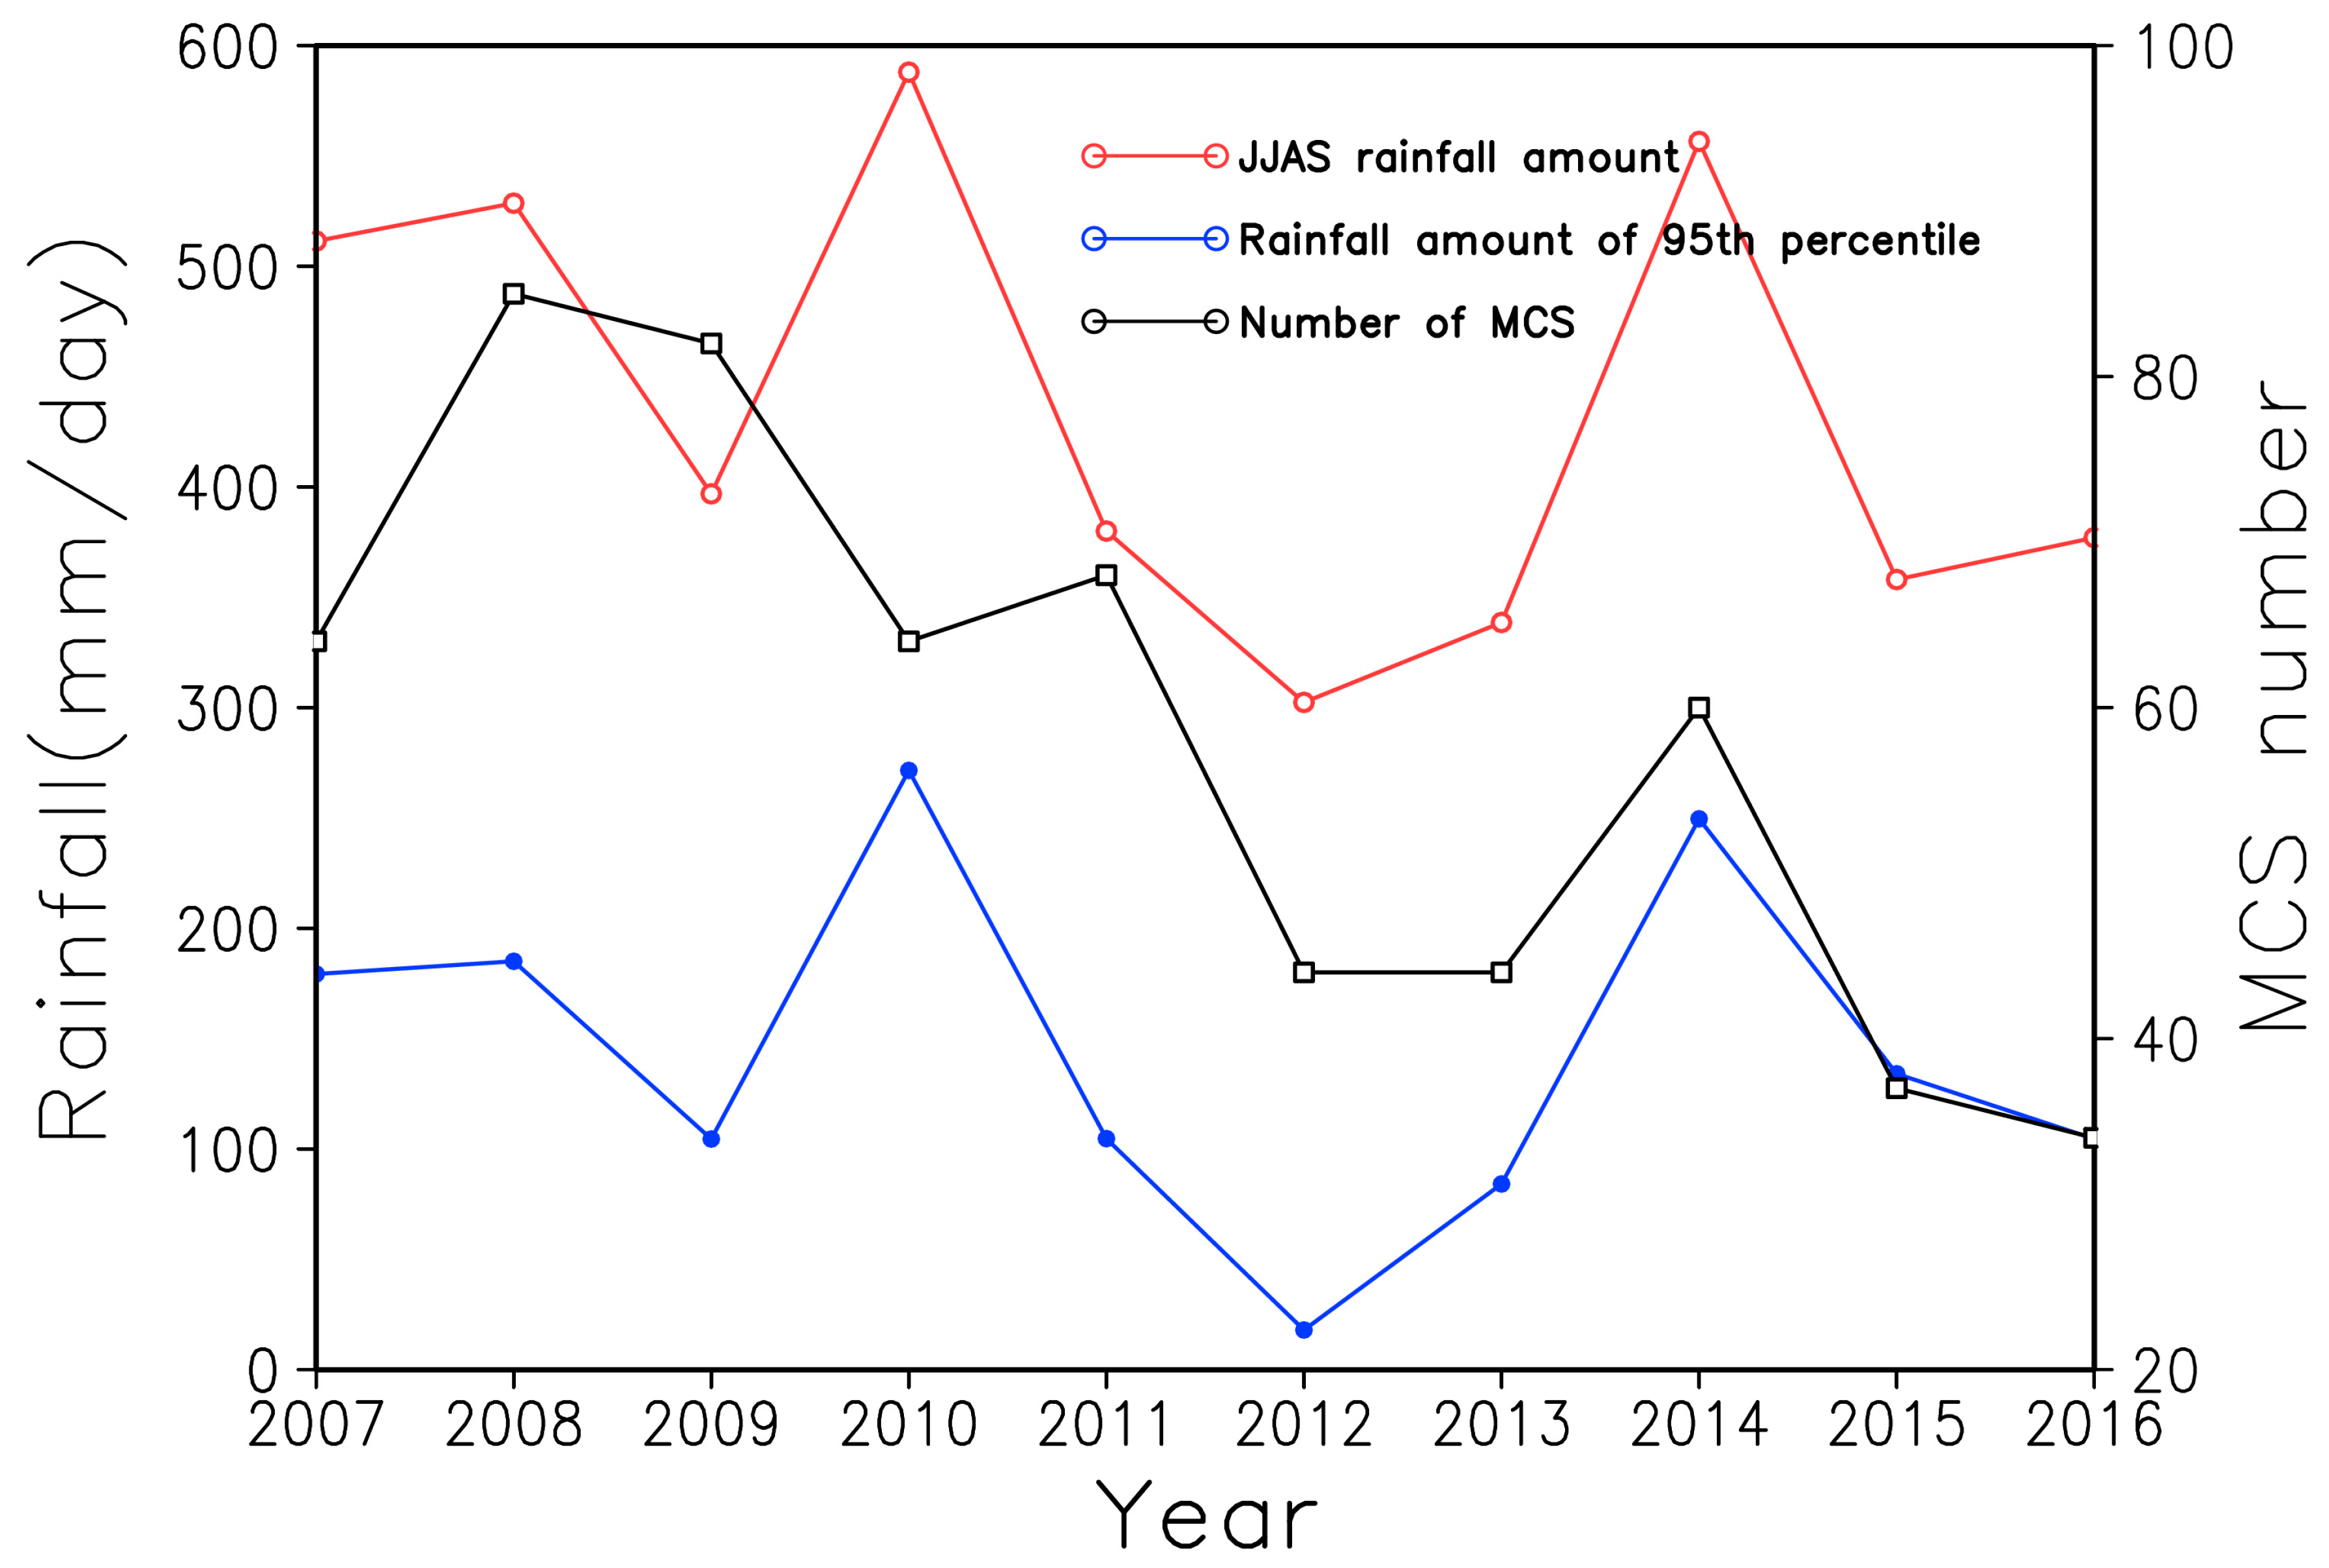
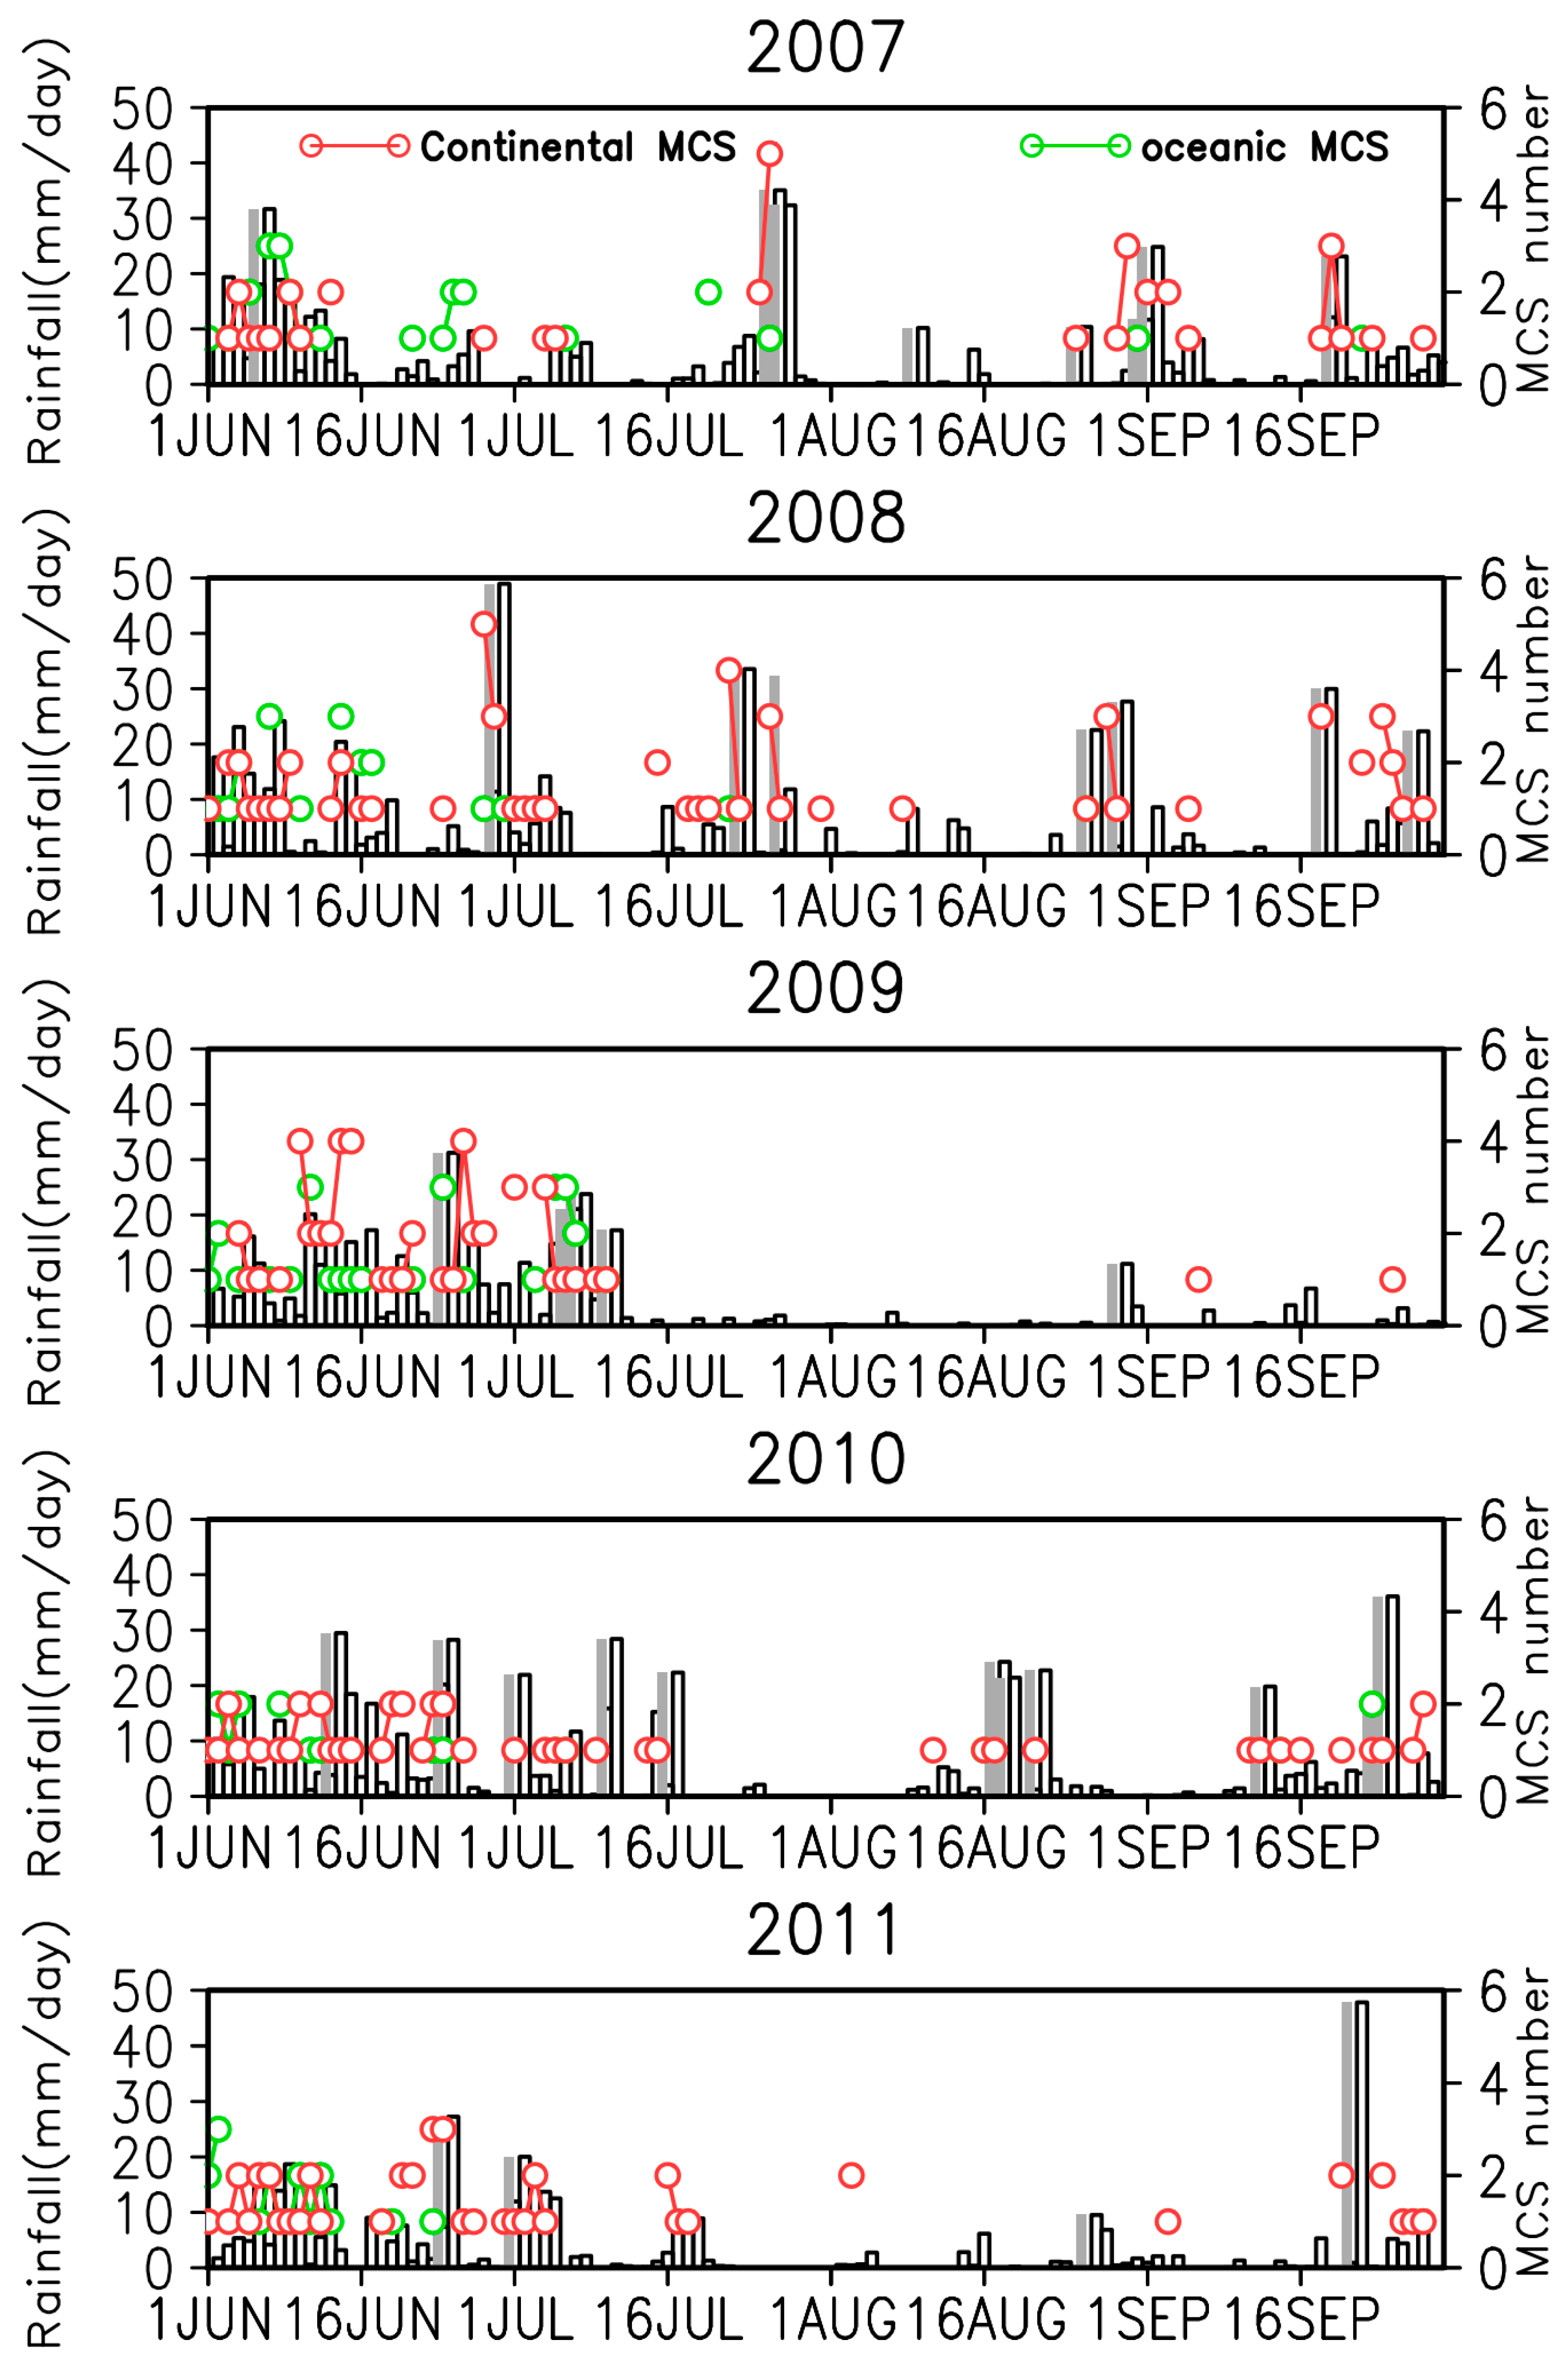
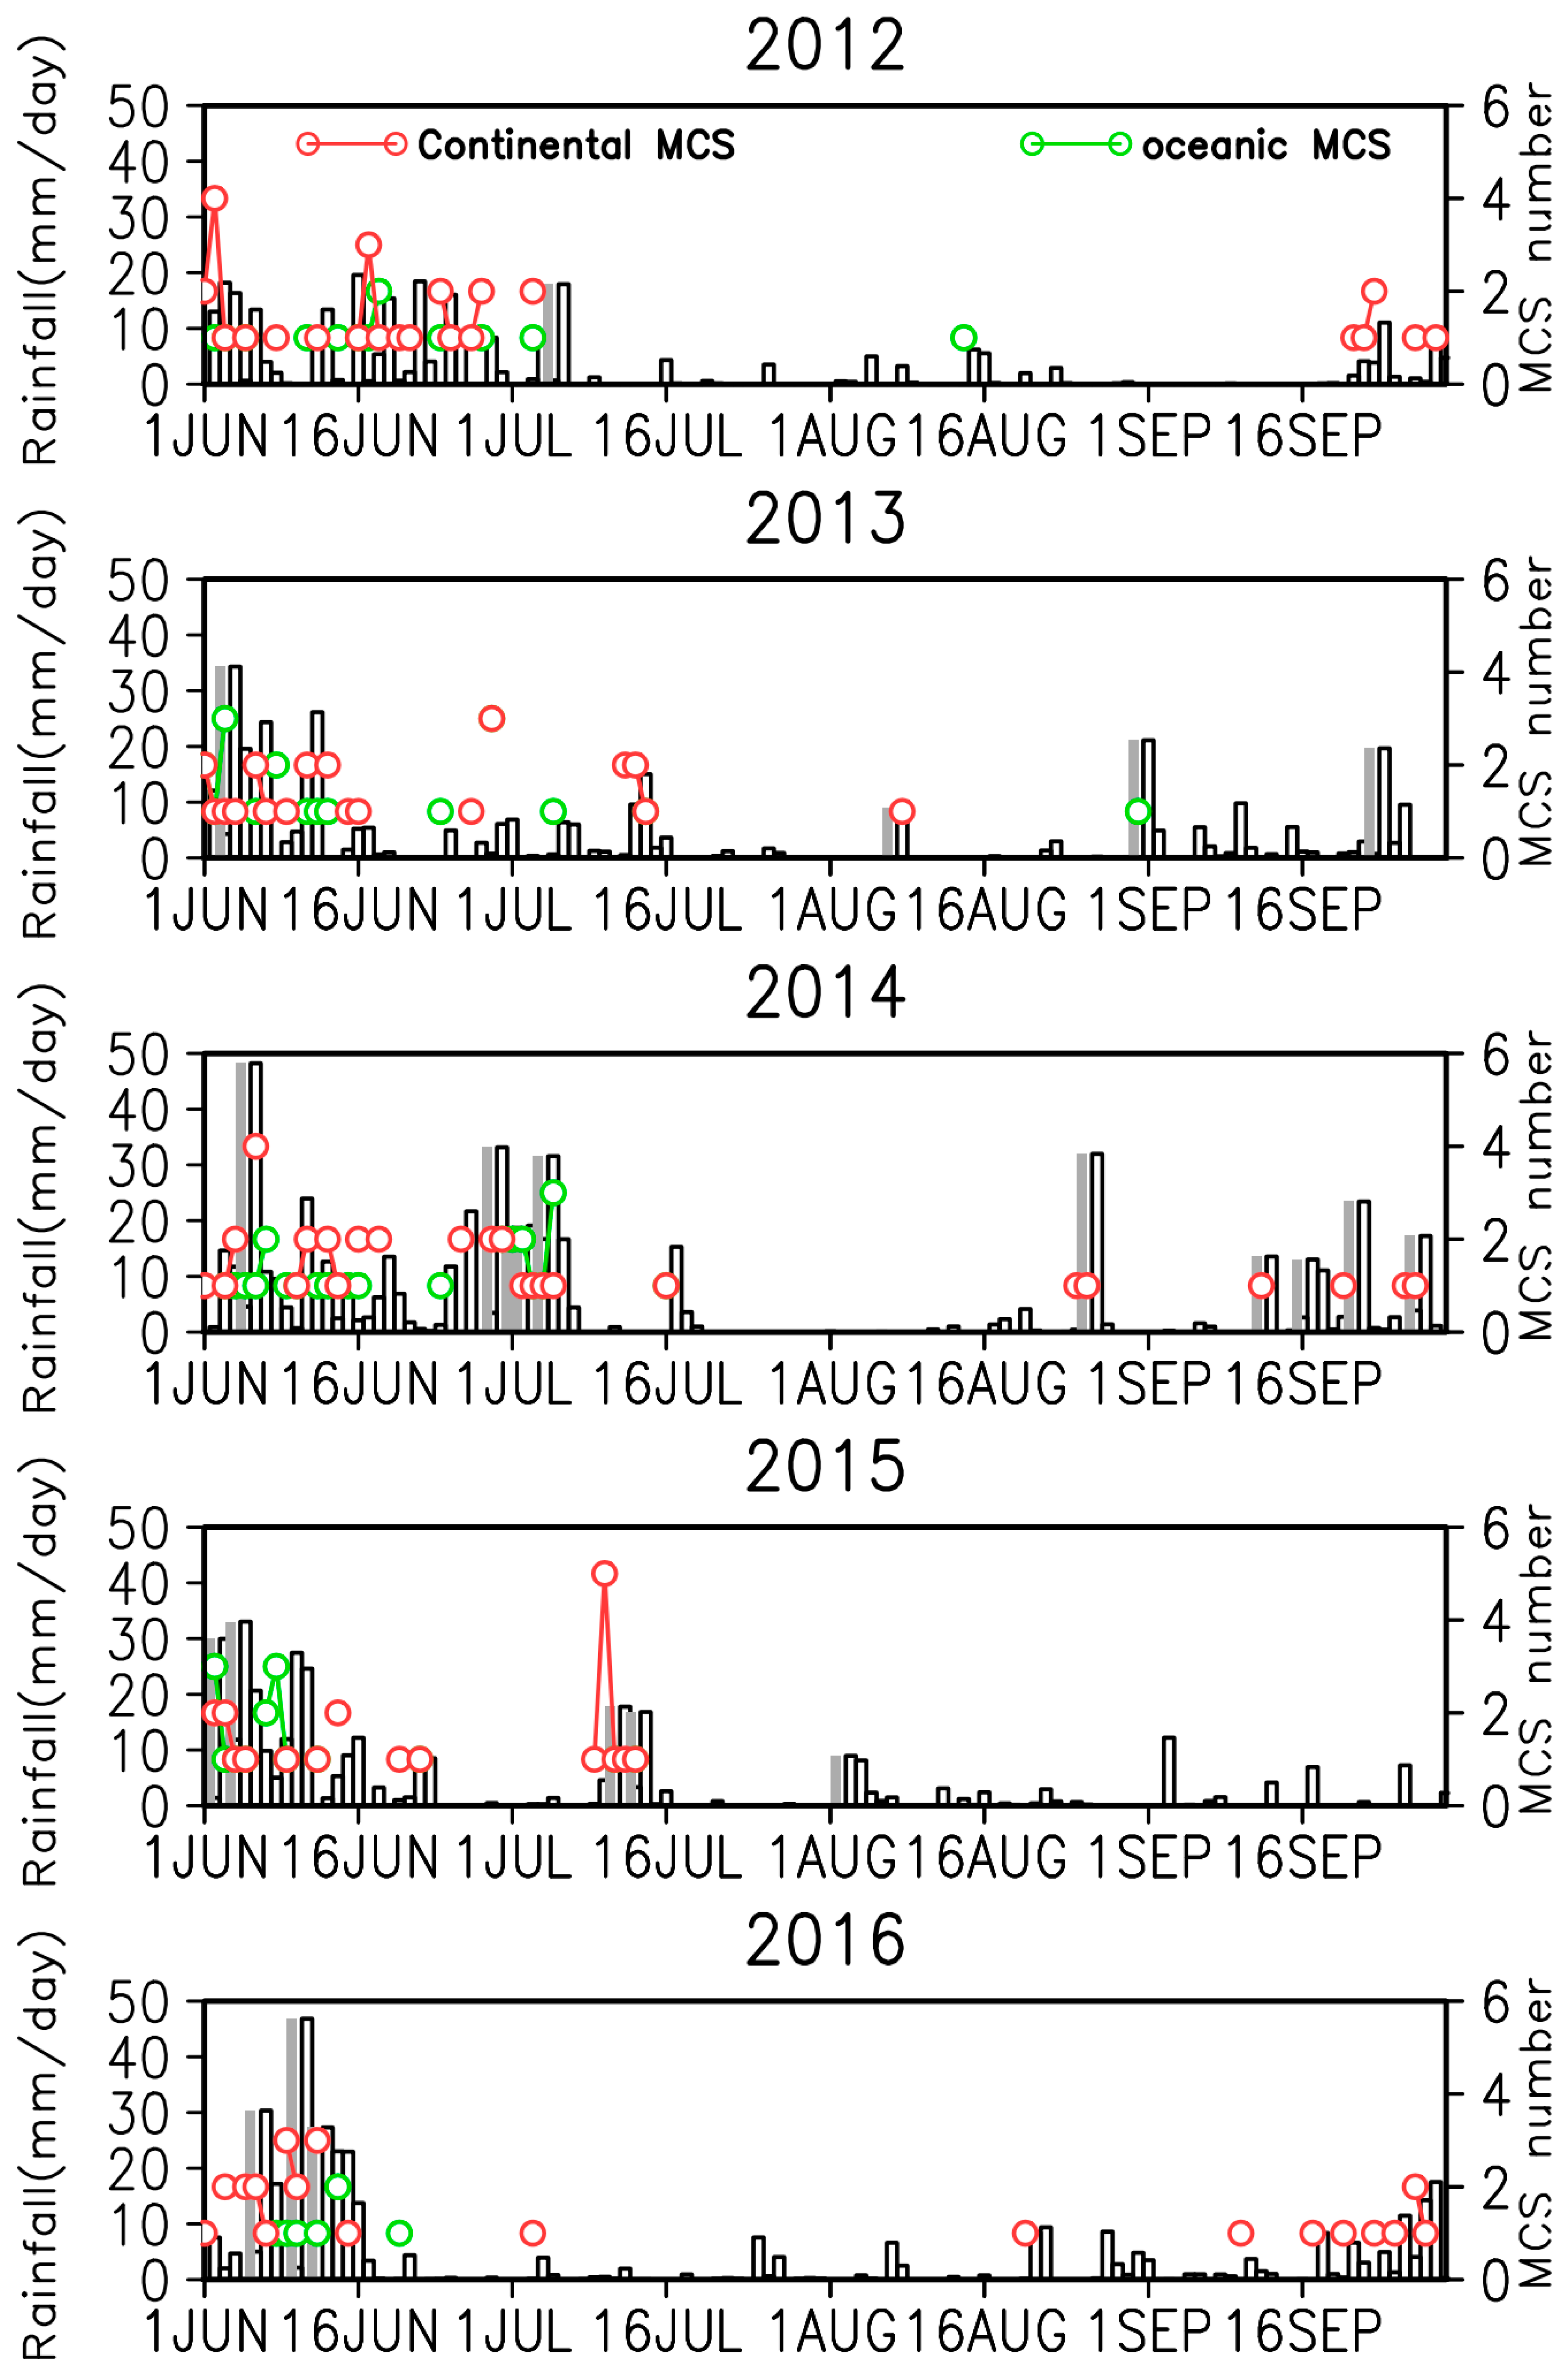
3.3. Relationship between MCSs and Extreme Rainfall along the Coast of the Gulf of Guinea
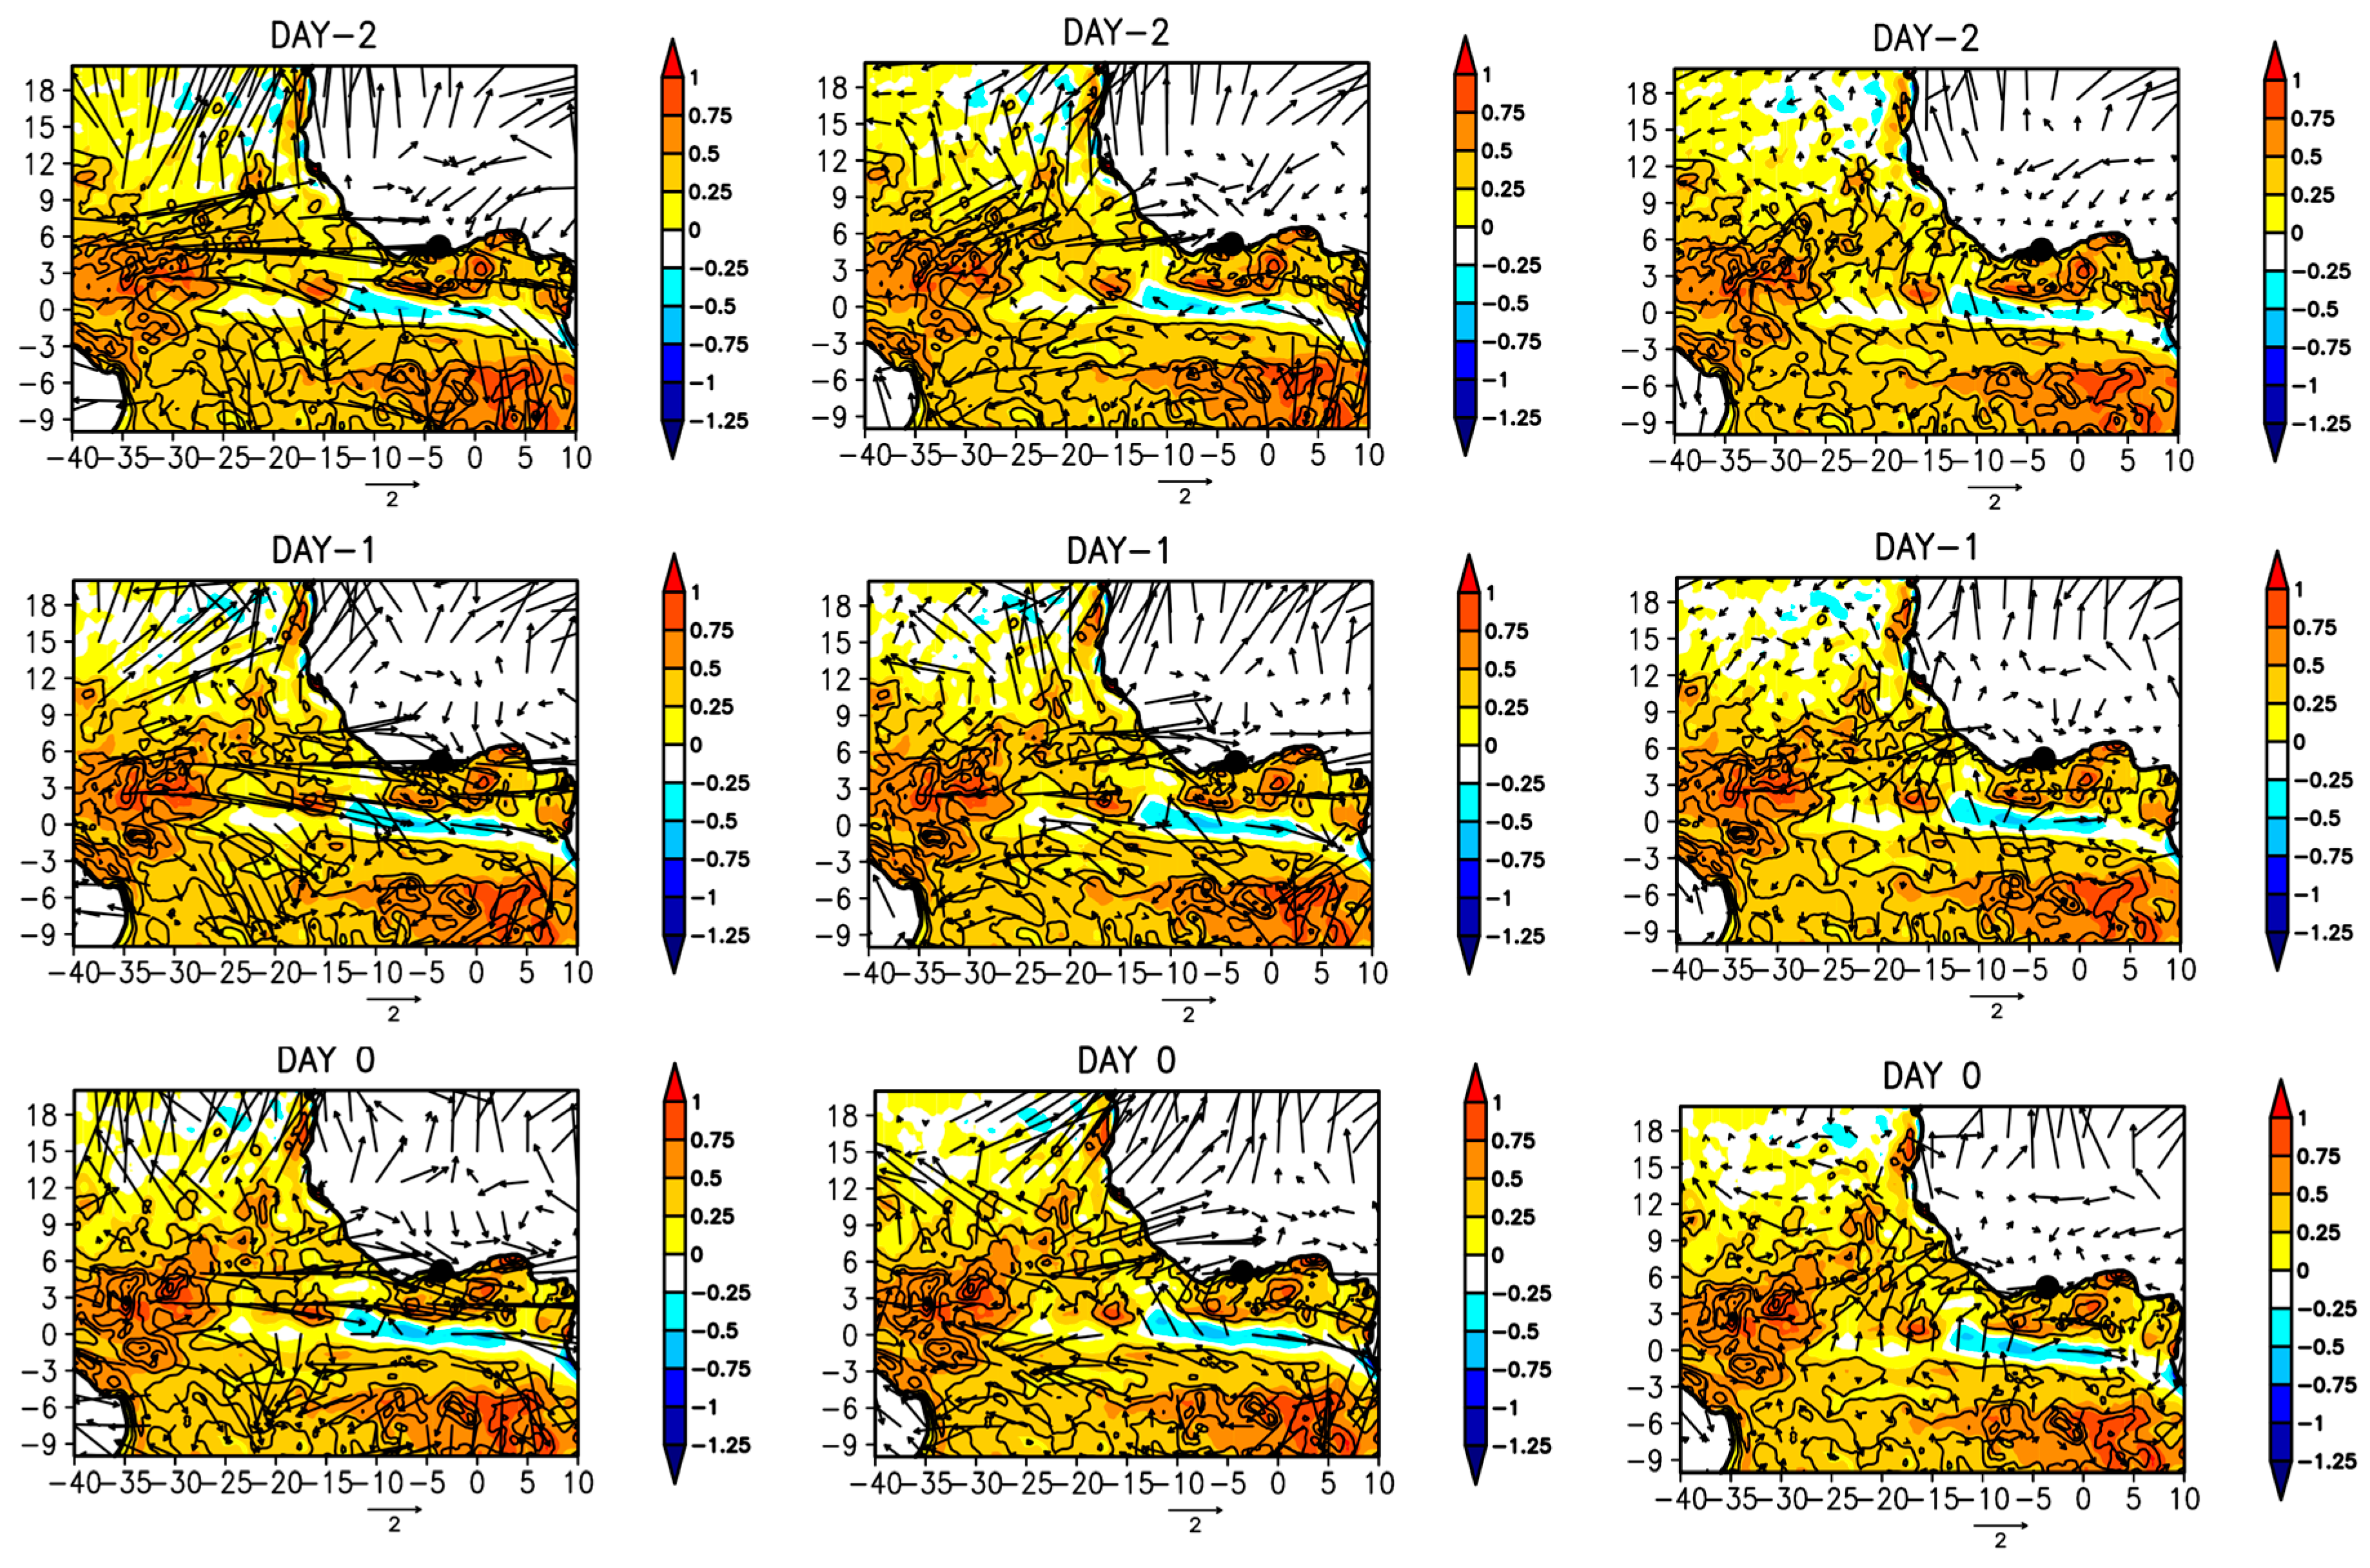
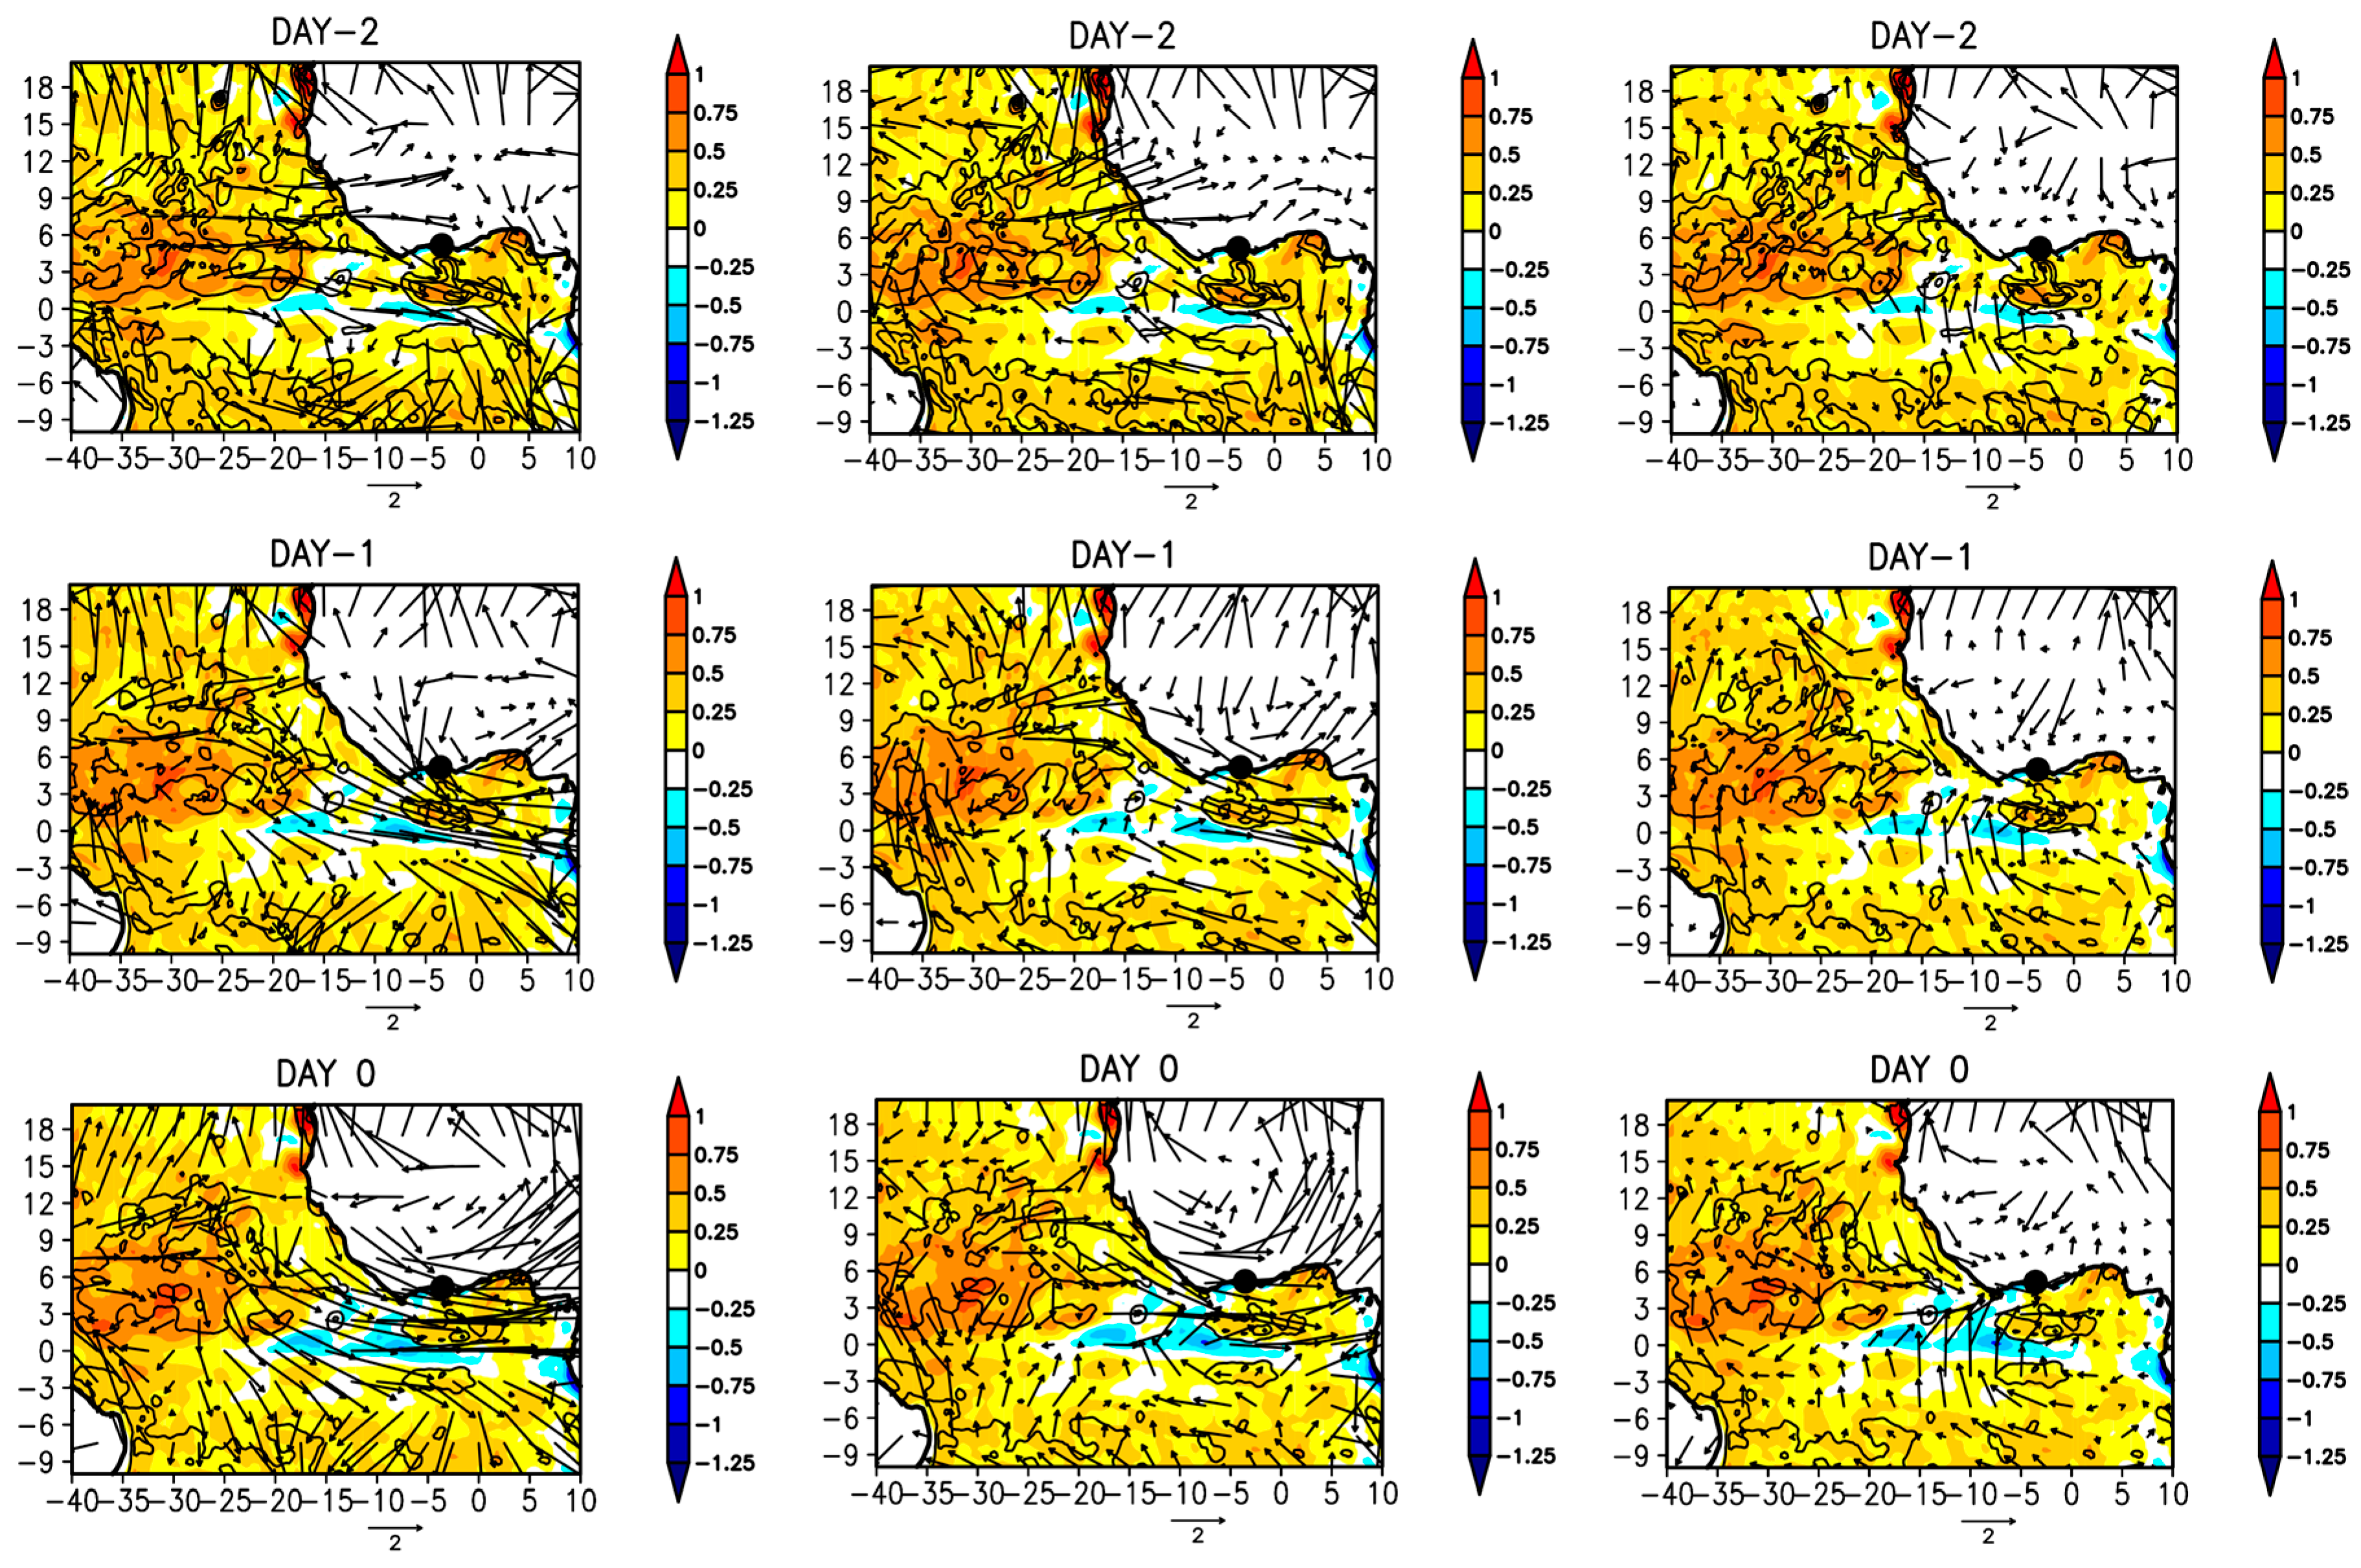
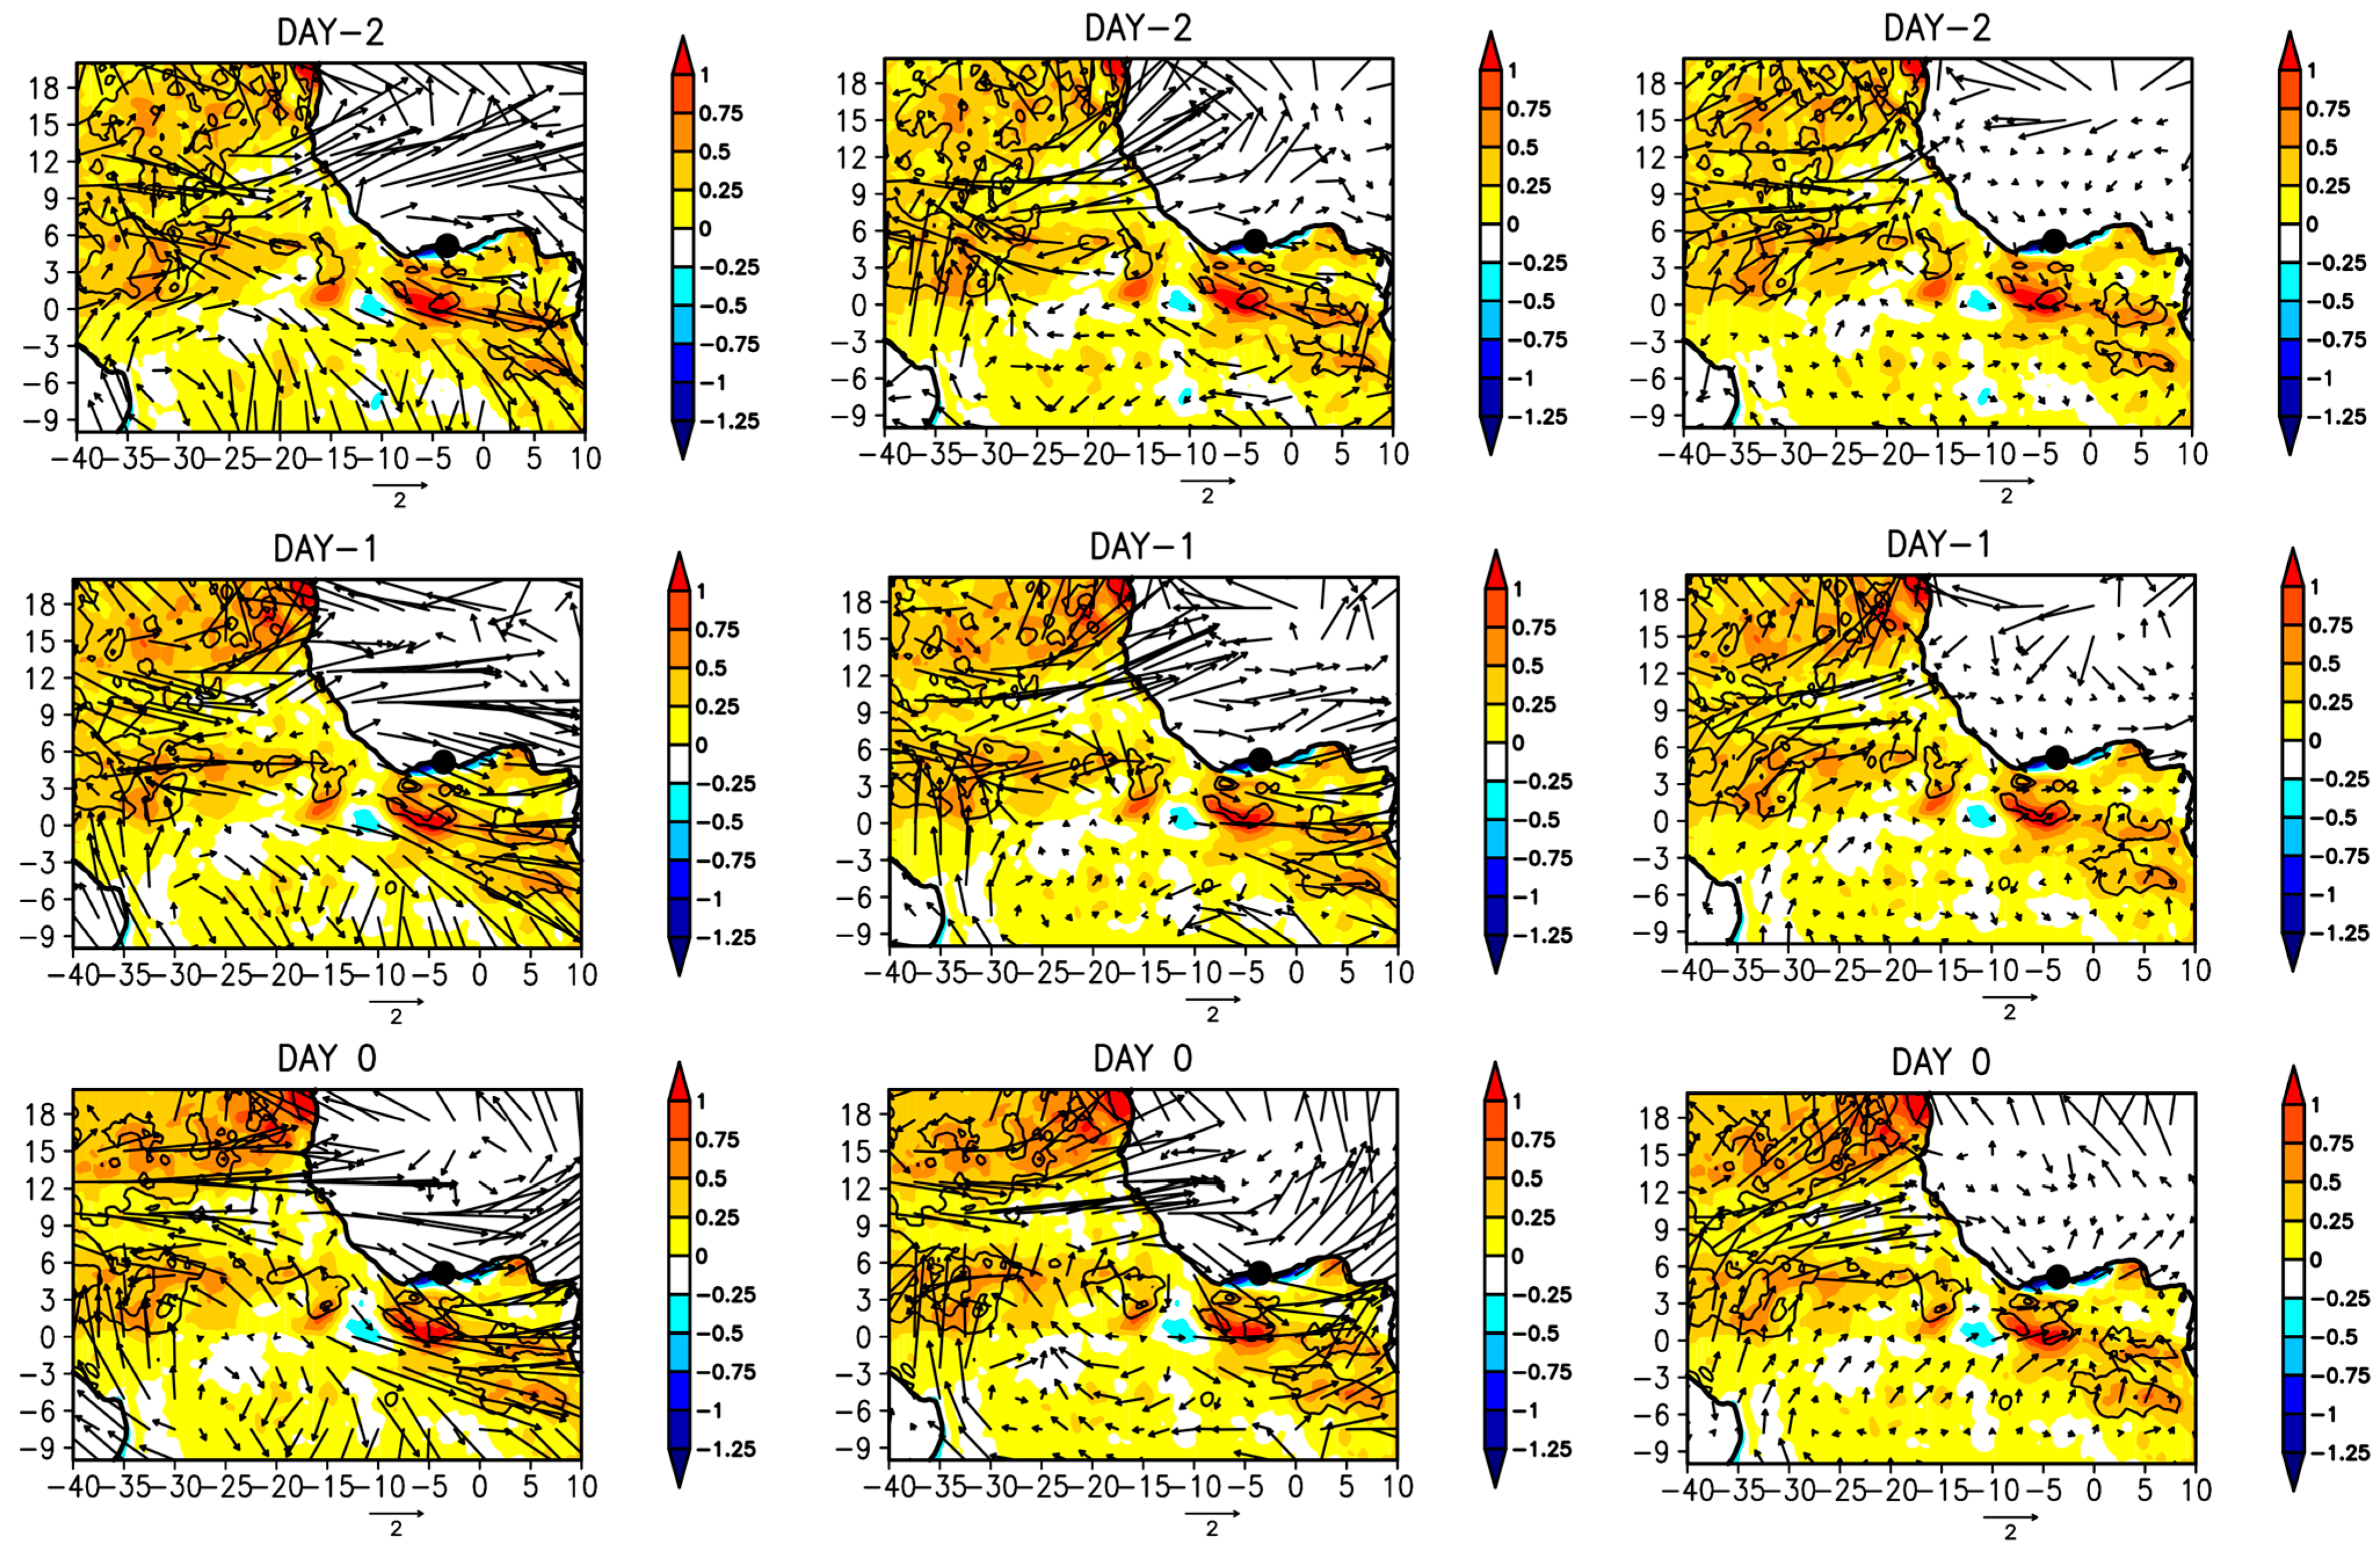
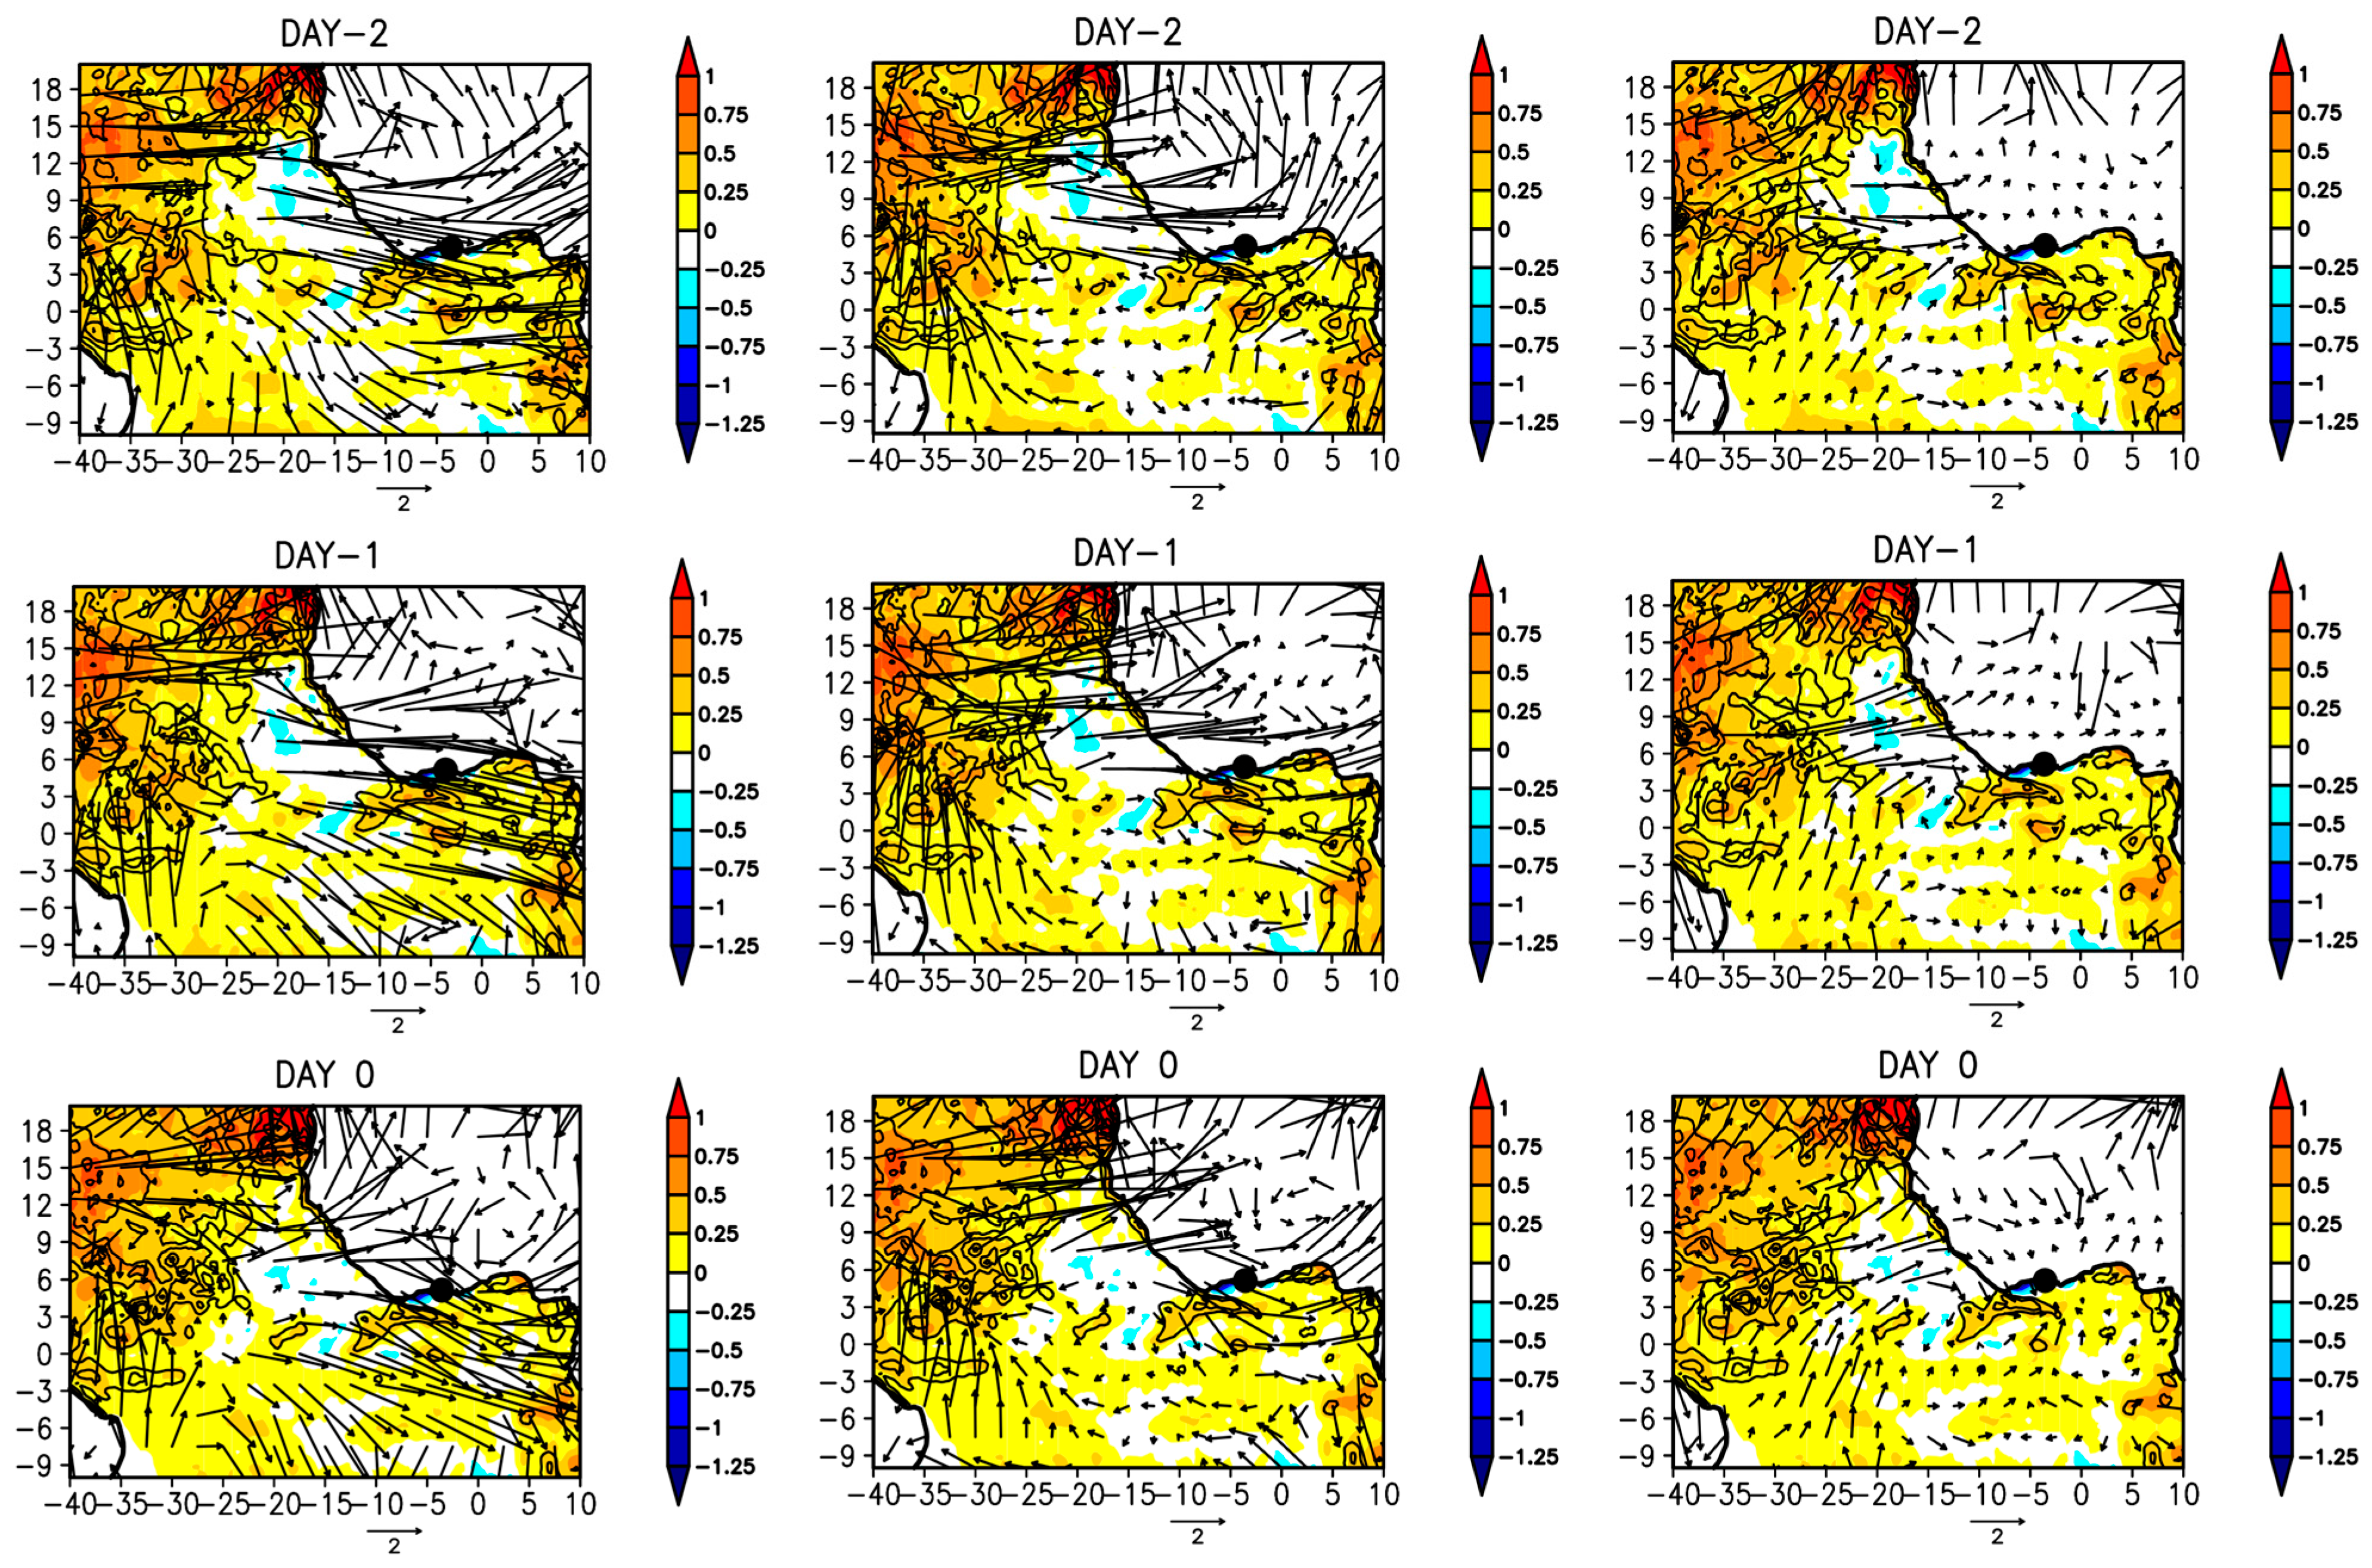
3.4. Overview of Atmospheric Circulation and Oceanic Conditions
4. Conclusions
Author Contributions
Funding
Institutional Review Board Statement
Informed Consent Statement
Data Availability Statement
Acknowledgments
Conflicts of Interest
Appendix A

References
- Tomasini, M.; Lafore, J.P.; Piriou, C.; Roca, R.; Ramage, K.; Laurent, H.; Morel, C.; Senesi, S. Atlas on a Climatology of West African Mesoscale Convective Systems. AMMA Eur. Deliv. 2006. Available online: https://d1wqtxts1xzle7.cloudfront.net/50451864/ATLAS_on_a_climatology_of_West_African_M20161121-9766-12iy4n9-libre.pdf?1479722653=&response-content-disposition=inline%3B+filename%3DATLAS_on_a_climatology_of_West_African_M.pdf&Expires=1698051746&Signature=cixcy~V3cNbvBOUMoII~Zb4jbxdfJh5IqRpbf0JdesnkxjbjKimTFvRsyJNC~J76ZDcAOLG8fXlrwLmet3f0p9B6KzNffin7AIJAPaYSFZ94MYhzeebkDJTHf3nnxh~CJV4cr-vplaECFViKINscPWEEcwj1IBU~TESurh5dmJpHB--Ig2DtTesuOya-b0Wa~qxVt-qjSkVVmAt259tKOpSDlfVdaPZn4e3e47kjd~Qg1kz5RKmmVaYpYxHr8GiVsE6bedW3W9JJyKgBPkUpdNbNtzxL9EtbfuFhWFCIyMXju1InyGX~JRlHqfOQk0eVrbOBP60wY-U~cV62y5qhBg__&Key-Pair-Id=APKAJLOHF5GGSLRBV4ZA (accessed on 26 August 2023).
- Mathon, V.; Laurent, H.; Lebel, T. Mesoscale Convective System Rainfall in the Sahel. J. Appl. Meteor. 2002, 41, 1081–1092. [Google Scholar] [CrossRef]
- Ta, S.; Kouadio, K.Y.; Ali, K.E.; Toualy, E.; Aman, A.; Yoroba, F. West Africa Extreme Rainfall Events and Large-Scale Ocean Surface and Atmospheric Conditions in the Tropical Atlantic. Adv. Meteorol. 2016, 2016, 1940456. [Google Scholar] [CrossRef]
- Lafore, J.-P.; Beucher, F.; Peyrillé, P.; Diongue-Niang, A.; Chapelon, N.; Bouniol, D.; Caniaux, G.; Favot, F.; Ferry, F.; Guichard, F.; et al. A Multi-Scale Analysis of the Extreme Rain Event of Ouagadougou in 2009: Extreme Rain Event in Burkina Faso. Q. J. R. Meteorol. Soc. 2017, 143, 3094–3109. [Google Scholar] [CrossRef]
- Kouadio, Y.K.; Ochou, D.A.; Servain, J. Tropical Atlantic and Rainfall Variability in Côte d’Ivoire. Geophys. Res. Lett. 2003, 30, 8005. [Google Scholar] [CrossRef]
- Kouadio, K.Y.; Aman, A.; Ochou, A.D.; Ali, K.E.; Assamoi, P.A. Rainfall Variability Patterns in West Africa: Case of Cote d’Ivoire and Ghana. J. Environ. Sci. Eng. 2011, 5, 1229–1238. [Google Scholar]
- Damania, R.; Desbureaux, S.; Zaveri, E. Does Rainfall Matter for Economic Growth? Evidence from Global Sub-National Data (1990–2014). J. Environ. Econ. Manag. 2020, 102, 102335. [Google Scholar] [CrossRef]
- Santé, N.; N’Go, Y.; Soro, G.E.; Meledje, N.D.H.; Goula, B.T.A. Characterization of Meteorological Droughts Occurrences in Côte d’Ivoire: Case of the Sassandra Watershed. Climate 2019, 7, 60. [Google Scholar] [CrossRef]
- Konate, D.; Didi, S.R.; Dje, K.B.; Diedhiou, A.; Kouassi, K.L.; Kamagate, B.; Paturel, J.-E.; Coulibaly, H.S.J.-P.; Kouadio, C.A.K.; Coulibaly, T.J.H. Observed Changes in Rainfall and Characteristics of Extreme Events in Côte d’Ivoire (West Africa). Hydrology 2023, 10, 104. [Google Scholar] [CrossRef]
- Ochou, A.D.; Aman, A.; Kouadio, K.Y.; Assamoi, P. Nouveau Zonage Climatique Basé Sur La Variabilité Pluviométrique En Côte d’Ivoire et Au Ghana. Geotrope 2005, 5, 34–46. [Google Scholar]
- Amouin, J.; Kouadio, K.Y.; Kacou, M.; Djakouré, S.; Ta, S. Diagnosis of the Causes of the Rain Flooding in June in the West Africa Coastal Area. ACS 2021, 11, 11–31. [Google Scholar] [CrossRef]
- OCHA. Côte d’Ivoire: Zones à Risques d’inondations et de Choléra—Portail Sur La Résilience Aux Inondations. Available online: https://resilience-inondations.net/ressources/item/cote-divoire-zones-a-risques-dinondations-et-de-cholera/ (accessed on 28 July 2023).
- UN-HABITAT. Profil Urbain de La Ville d’Abidjan, Édité Par Le Programme Des Nations Unies Pour Les Établissements Humains—Recherche Google. Available online: https://unhabitat.org/sites/default/files/download-manager-files/Cote%20d%20Ivoire%20-%20Abidjan.pdf (accessed on 26 August 2023).
- Reason, C.J.C.; Rouault, M. Sea Surface Temperature Variability in the Tropical Southeast Atlantic Ocean and West African Rainfall. Geophys. Res. Lett. 2006, 33, L21705. [Google Scholar] [CrossRef]
- Lutz, K.; Jacobeit, J.; Rathmann, J. Atlantic Warm and Cold Water Events and Impact on African West Coast Precipitation: Atlantic SST and African West Coast Precipitation. Int. J. Climatol. 2015, 35, 128–141. [Google Scholar] [CrossRef]
- Panthou, G.; Vischel, T.; Lebel, T.; Blanchet, J.; Quantin, G.; Ali, A. Extreme Rainfall in West Africa: A Regional Modeling: Extreme Rainfall Mapping West Africa. Water Resour. Res. 2012, 48, W08501. [Google Scholar] [CrossRef]
- Ibrahim, B.; Polcher, J.; Karambiri, H.; Rockel, B. Characterization of the Rainy Season in Burkina Faso and It’s Representation by Regional Climate Models. Clim. Dyn. 2012, 39, 1287–1302. [Google Scholar] [CrossRef]
- Goula, B.T.A.; Soro, E.G.; Kouassi, W.; Srohourou, B. Tendances et Ruptures Au Niveau Des Pluies Journalières Extrêmes En Côte d’Ivoire (Afrique de l’Ouest). Hydrol. Sci. J. 2012, 57, 1067–1080. [Google Scholar] [CrossRef]
- Machado, L.A.T.; Rossow, W.B. Structural Characteristics and Radiative Properties of Tropical Cloud Clusters. Mon. Wea. Rev. 1993, 121, 3234–3260. [Google Scholar] [CrossRef]
- Machado, L.A.T.; Guedes, R.L.; Alves, M.A.S. Structural Characteristics of Convective Systems and Forcing of Convection in South America Observed by Satellites (Caracterısticas Estruturais de Sistemas Convectivos e Forçantes da Convecçao Na América Do Sul Observados Por Satélites). Ediçao Comemorativa Anos Climanálise 1997, 110–122. [Google Scholar]
- Machado, L.A.T.; Laurent, H. The Convective System Area Expansion over Amazonia and Its Relationships with Convective System Life Duration and High-Level Wind Divergence. Mon. Wea. Rev. 2004, 132, 714–725. [Google Scholar] [CrossRef]
- Mathon, V.; Diedhiou, A.; Laurent, H. Relationship between Easterly Waves and Mesoscale Convective Systems over the Sahel: Relationship between Easterly Waves and Mesoscale Convective Systems Over The Sahel. Geophys. Res. Lett. 2002, 29, 57-1–57-4. [Google Scholar] [CrossRef]
- Fiolleau, T.; Roca, R. Composite Life Cycle of Tropical Mesoscale Convective Systems from Geostationary and Low Earth Orbit Satellite Observations: Method and Sampling Considerations: Composite Life Cycle of Tropical Mesoscale Convective Systems. Q. J. R. Meteorol. Soc. 2013, 139, 941–953. [Google Scholar] [CrossRef]
- Maranan, M.; Fink, A.H.; Knippertz, P.; Francis, S.D.; Akpo, A.B.; Jegede, G.; Yorke, C. Interactions between Convection and a Moist Vortex Associated with an Extreme Rainfall Event over Southern West Africa. Mon. Weather. Rev. 2019, 147, 2309–2328. [Google Scholar] [CrossRef]
- Atiah, W.A.; Amekudzi, L.K.; Danuor, S.K. Mesoscale Convective Systems and Contributions to Flood Cases in Southern West Africa (SWA): A Systematic Review. Weather Clim. Extrem. 2023, 39, 100551. [Google Scholar] [CrossRef]
- Sultan, B.; Janicot, S.; Drobinski, P. Characterization of the Diurnal Cycle of the West African Monsoon around the Monsoon Onset. J. Clim. 2007, 20, 4014–4032. [Google Scholar] [CrossRef]
- Huffman, G.J.; Adler, R.F.; Morrissey, M.M.; Bolvin, D.T.; Curtis, S.; Joyce, R.; McGavock, B.; Susskind, J. Global Precipitation at One-Degree Daily Resolution from Multisatellite Observations. J. Hydrometeor. 2001, 2, 36–50. [Google Scholar] [CrossRef]
- Laurent, H. Characteristics of the Amazonian Mesoscale Convective Systems Observed from Satellite and Radar during the WETAMC/LBA Experiment. J. Geophys. Res. 2002, 107, 8054. [Google Scholar] [CrossRef]
- Reynolds, R.W.; Rayner, N.A.; Smith, T.M.; Stokes, D.C.; Wang, W. An Improved In Situ and Satellite SST Analysis for Climate. J. Clim. 2002, 15, 1609–1625. [Google Scholar] [CrossRef]
- Kalnay, E.; Kanamitsu, M.; Kistler, R.; Collins, W.; Deaven, D.; Gandin, L.; Iredell, M.; Saha, S.; White, G.; Woollen, J.; et al. The NCEP/NCAR 40-Year Reanalysis Project. Bull. Amer. Meteor. Soc. 1996, 77, 437–471. [Google Scholar] [CrossRef]
- Frei, C.; Schär, C. Detection Probability of Trends in Rare Events: Theory and Application to Heavy Precipitation in the Alpine Region. J. Clim. 2001, 14, 1568–1584. [Google Scholar] [CrossRef]
- Klein Tank, A.M.G.; Können, G.P. Trends in Indices of Daily Temperature and Precipitation Extremes in Europe, 1946–1999. J. Clim. 2003, 16, 3665–3680. [Google Scholar] [CrossRef]
- Haylock, M.R.; Peterson, T.C.; Alves, L.M.; Ambrizzi, T.; Anunciação, Y.M.T.; Baez, J.; Barros, V.R.; Berlato, M.A.; Bidegain, M.; Coronel, G.; et al. Trends in Total and Extreme South American Rainfall in 1960–2000 and Links with Sea Surface Temperature. J. Clim. 2006, 19, 1490–1512. [Google Scholar] [CrossRef]
- Zakaria, R.; Ahmad Radi, N.F.; Satari, S.Z. Extraction Method of Extreme Rainfall Data. J. Phys. Conf. Ser. 2017, 890, 012154. [Google Scholar] [CrossRef]
- Demirdjian, L.; Zhou, Y.; Huffman, G.J. Statistical Modeling of Extreme Precipitation with TRMM Data. J. Appl. Meteorol. Climatol. 2018, 57, 15–30. [Google Scholar] [CrossRef]
- Brown, T.J.; Hall, B.L. The Use of t Values in Climatological Composite Analyses. J. Clim. 1999, 12, 2941–2944. [Google Scholar] [CrossRef]
- Roldán-Gómez, P.J.; González-Rouco, J.F.; Melo-Aguilar, C.; Smerdon, J.E. The Role of Internal Variability in ITCZ Changes Over the Last Millennium. Geophys. Res. Lett. 2022, 49, e2021GL096487. [Google Scholar] [CrossRef]
- Xie, S.-P. Tropical Atlantic Variability. In Coupled Atmosphere-Ocean Dynamics; Elsevier: Amsterdam, The Netherlands, 2023; pp. 251–276. ISBN 978-0-323-95490-7. [Google Scholar]
- Djakouré, S.; Penven, P.; Bourlès, B.; Koné, V.; Veitch, J. Respective Roles of the Guinea Current and Local Winds on the Coastal Upwelling in the Northern Gulf of Guinea. J. Phys. Oceanogr. 2017, 47, 1367–1387. [Google Scholar] [CrossRef]
- Koné, M.; Djakouré, S.; Adon, M.; Ta, S.; Kouadio, Y. Marine Heatwaves, Upwelling, and Atmospheric Conditions during the Monsoon Period at the Northern Coast of the Gulf of Guinea. Climate 2022, 10, 199. [Google Scholar] [CrossRef]
- Rasera, G.; Anabor, V.; Scremin Puhales, F.; Dal Piva, E. Developing an MCS Index Using the Climatology of South America: South American Mesoscale Convective System Index. Met. Apps 2018, 25, 394–405. [Google Scholar] [CrossRef]
- Servain, J.; Wainer, I.; Ludos Ayina, H.; Roquet, H. The Relationship between the Simulated Climatic Variability Modes of the Tropical Atlantic. Int. J. Climatol. 2000, 20, 939–953. [Google Scholar] [CrossRef]
- Servain, J. Réponse Océanique à Des Actions Éloignées Du Vent Dans Le Golfe de Guinée En 1967–1968. Oceanol. Acta 1984, 7, 297–307. [Google Scholar]
- Servain, J. Simple Climatic Indices for the Tropical Atlantic Ocean and Some Applications. J. Geophys. Res. 1991, 96, 15137. [Google Scholar] [CrossRef]
- Kouadio, Y.K.; Servain, J.; Machado, L.A.; Lentini, C.A. Heavy Rainfall Episodes in the Eastern Northeast Brazil Linked to Large-Scale Ocean-Atmosphere Conditions in the Tropical Atlantic. Adv. Meteorol. 2012, 2012, 369567. [Google Scholar] [CrossRef]


| Months | June | July | August | September |
|---|---|---|---|---|
| Threshold (mm) | 24.45 | 17.19 | 8.35 | 12.17 |
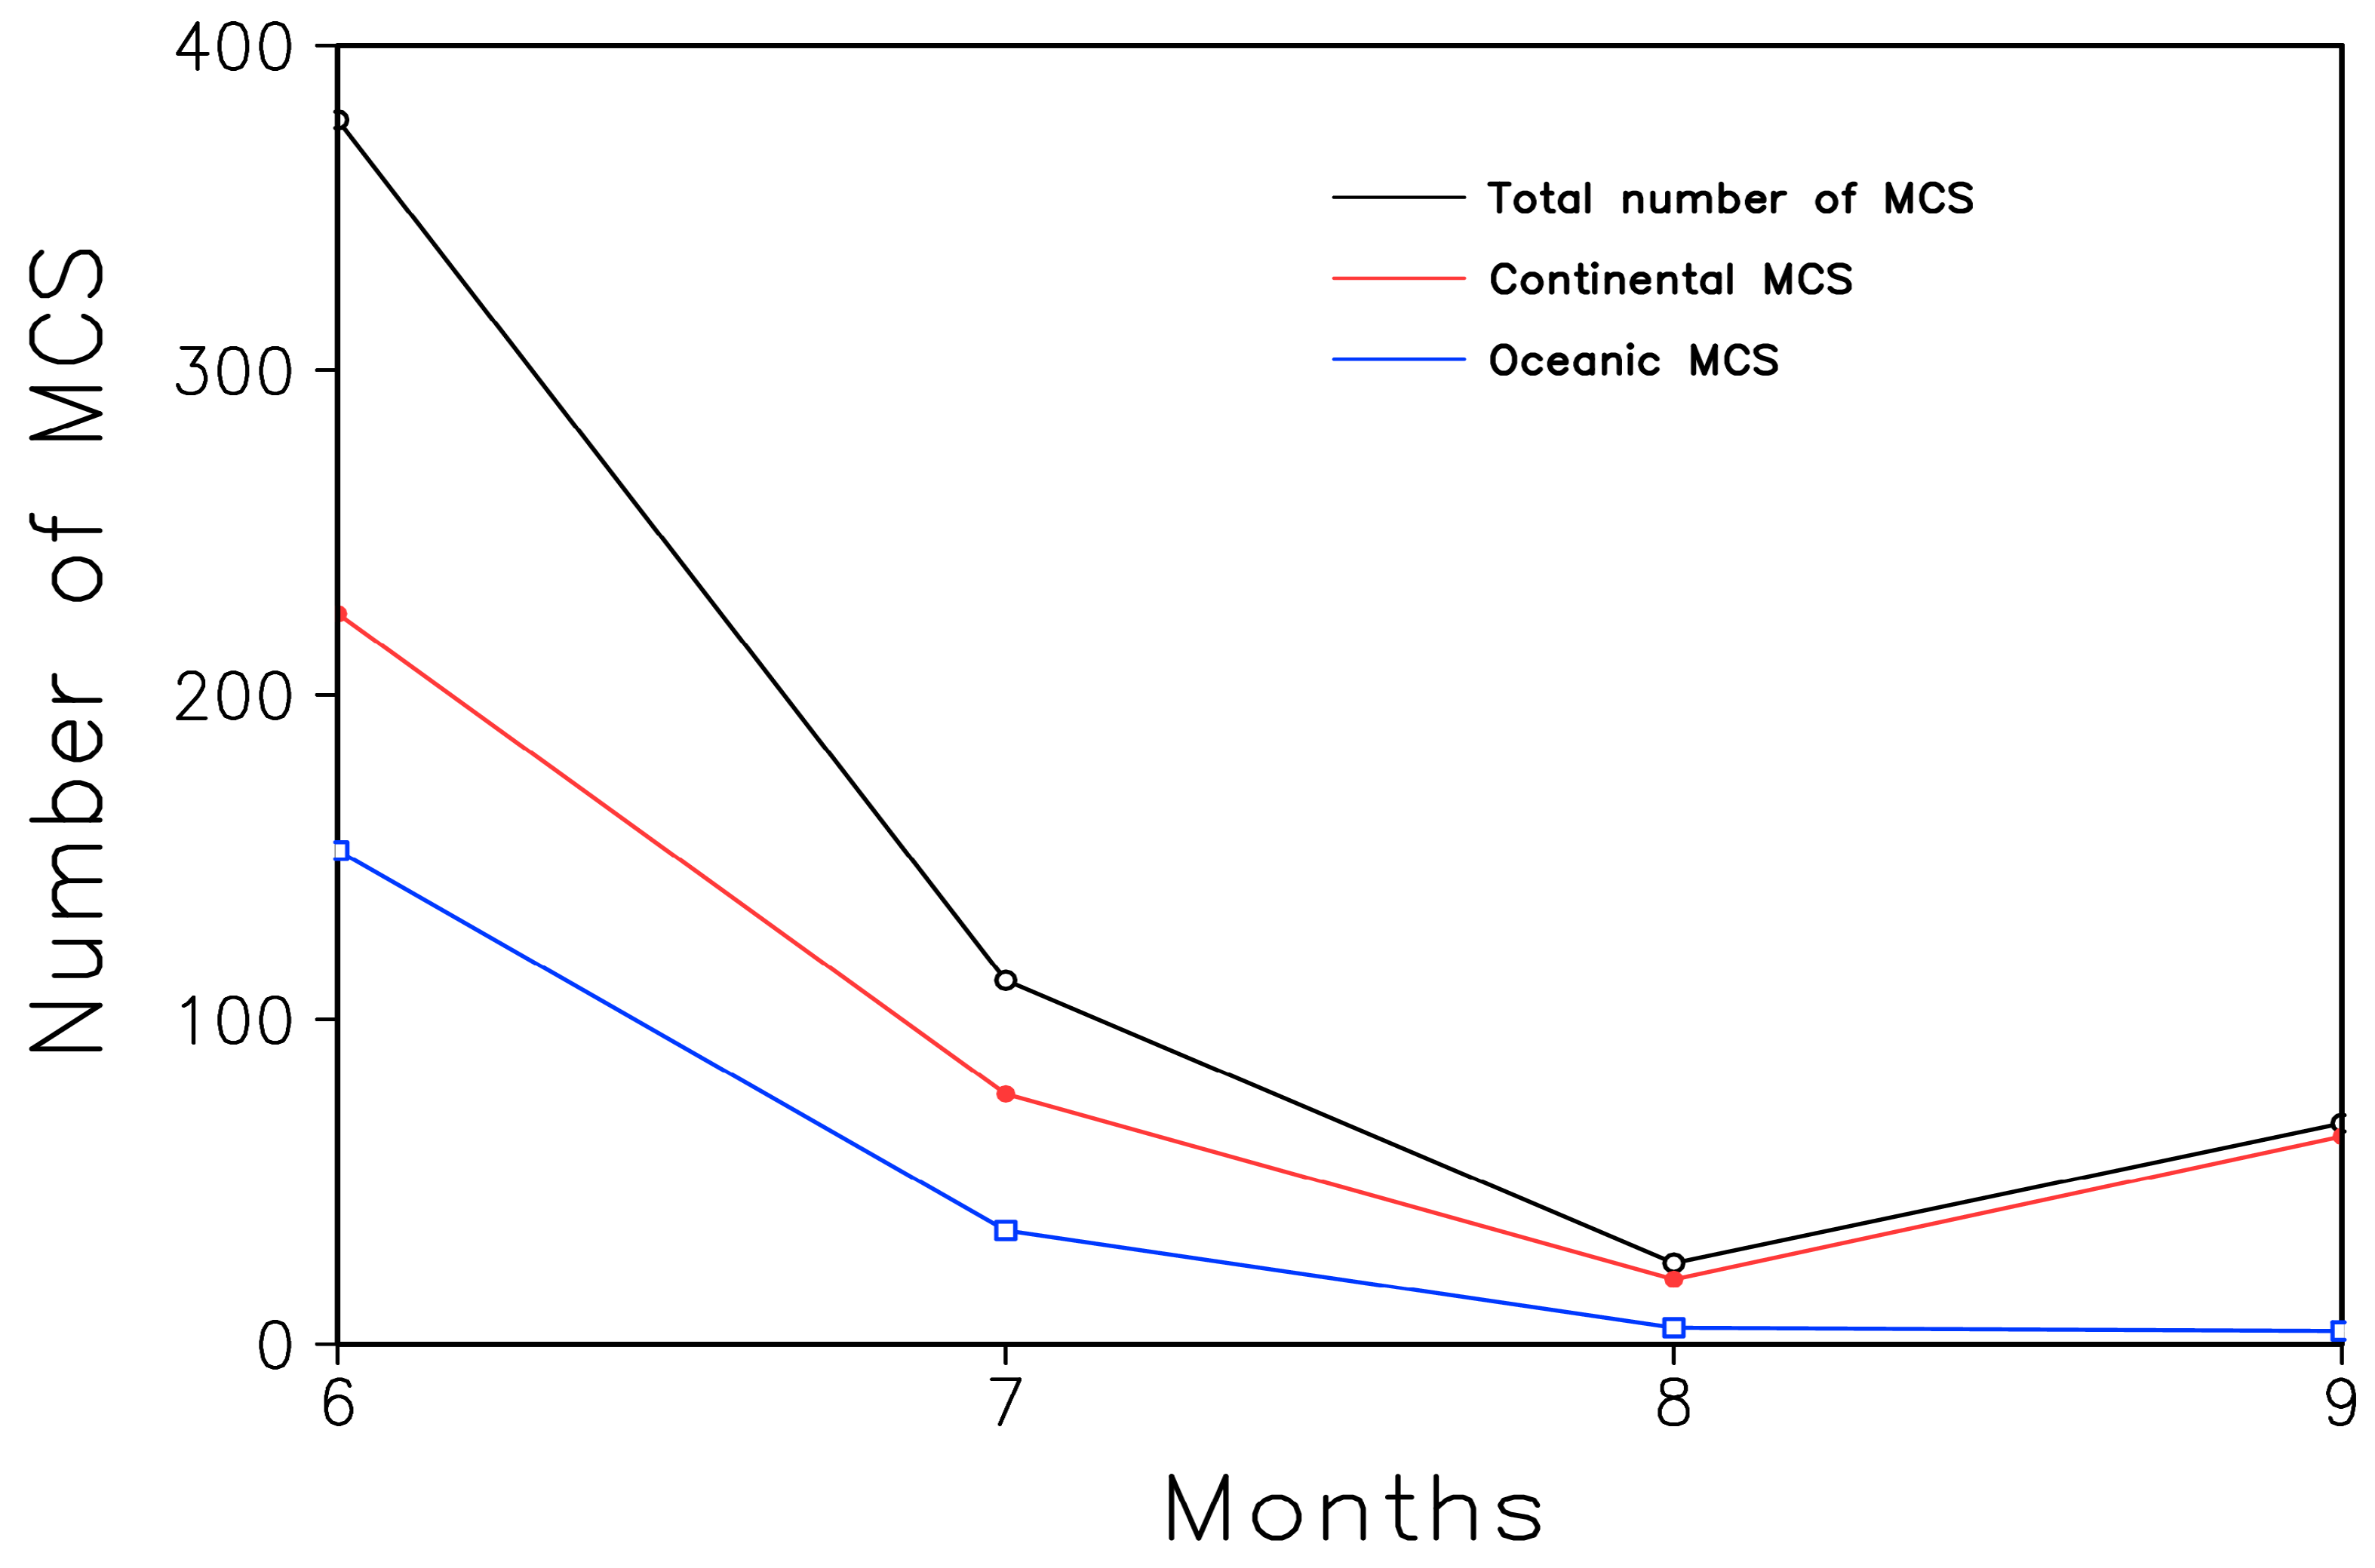
| Months | Total MCS | Continental MCS | Oceanic MCS |
|---|---|---|---|
| June | 377 (64.77%) | 225 (38.66%) | 152 (26.12%) |
| July | 112 (19.24%) | 77 (13.23%) | 35 (6.01%) |
| August | 25 (4.30%) | 20 (3.44%) | 5 (0.90%) |
| September | 68 (11.66%) | 64 (11.00%) | 4 (0.69%) |
| Total | 582 (100%) | 386 (66.32%) | 196 (33.68%) |
Disclaimer/Publisher’s Note: The statements, opinions and data contained in all publications are solely those of the individual author(s) and contributor(s) and not of MDPI and/or the editor(s). MDPI and/or the editor(s) disclaim responsibility for any injury to people or property resulting from any ideas, methods, instructions or products referred to in the content. |
© 2024 by the authors. Licensee MDPI, Basel, Switzerland. This article is an open access article distributed under the terms and conditions of the Creative Commons Attribution (CC BY) license (https://creativecommons.org/licenses/by/4.0/).
Share and Cite
Djakouré, S.; Amouin, J.; Kouadio, K.Y.; Kacou, M. Mesoscale Convective Systems and Extreme Precipitation on the West African Coast Linked to Ocean–Atmosphere Conditions during the Monsoon Period in the Gulf of Guinea. Atmosphere 2024, 15, 194. https://doi.org/10.3390/atmos15020194
Djakouré S, Amouin J, Kouadio KY, Kacou M. Mesoscale Convective Systems and Extreme Precipitation on the West African Coast Linked to Ocean–Atmosphere Conditions during the Monsoon Period in the Gulf of Guinea. Atmosphere. 2024; 15(2):194. https://doi.org/10.3390/atmos15020194
Chicago/Turabian StyleDjakouré, Sandrine, Joël Amouin, Kouassi Yves Kouadio, and Modeste Kacou. 2024. "Mesoscale Convective Systems and Extreme Precipitation on the West African Coast Linked to Ocean–Atmosphere Conditions during the Monsoon Period in the Gulf of Guinea" Atmosphere 15, no. 2: 194. https://doi.org/10.3390/atmos15020194