


Radiative Regime According to the New RAD-MSU(BSRN) Complex in Moscow: The Roles of Aerosol, Surface Albedo, and Sunshine Duration


Abstract
:1. Introduction
2. Materials and Methods
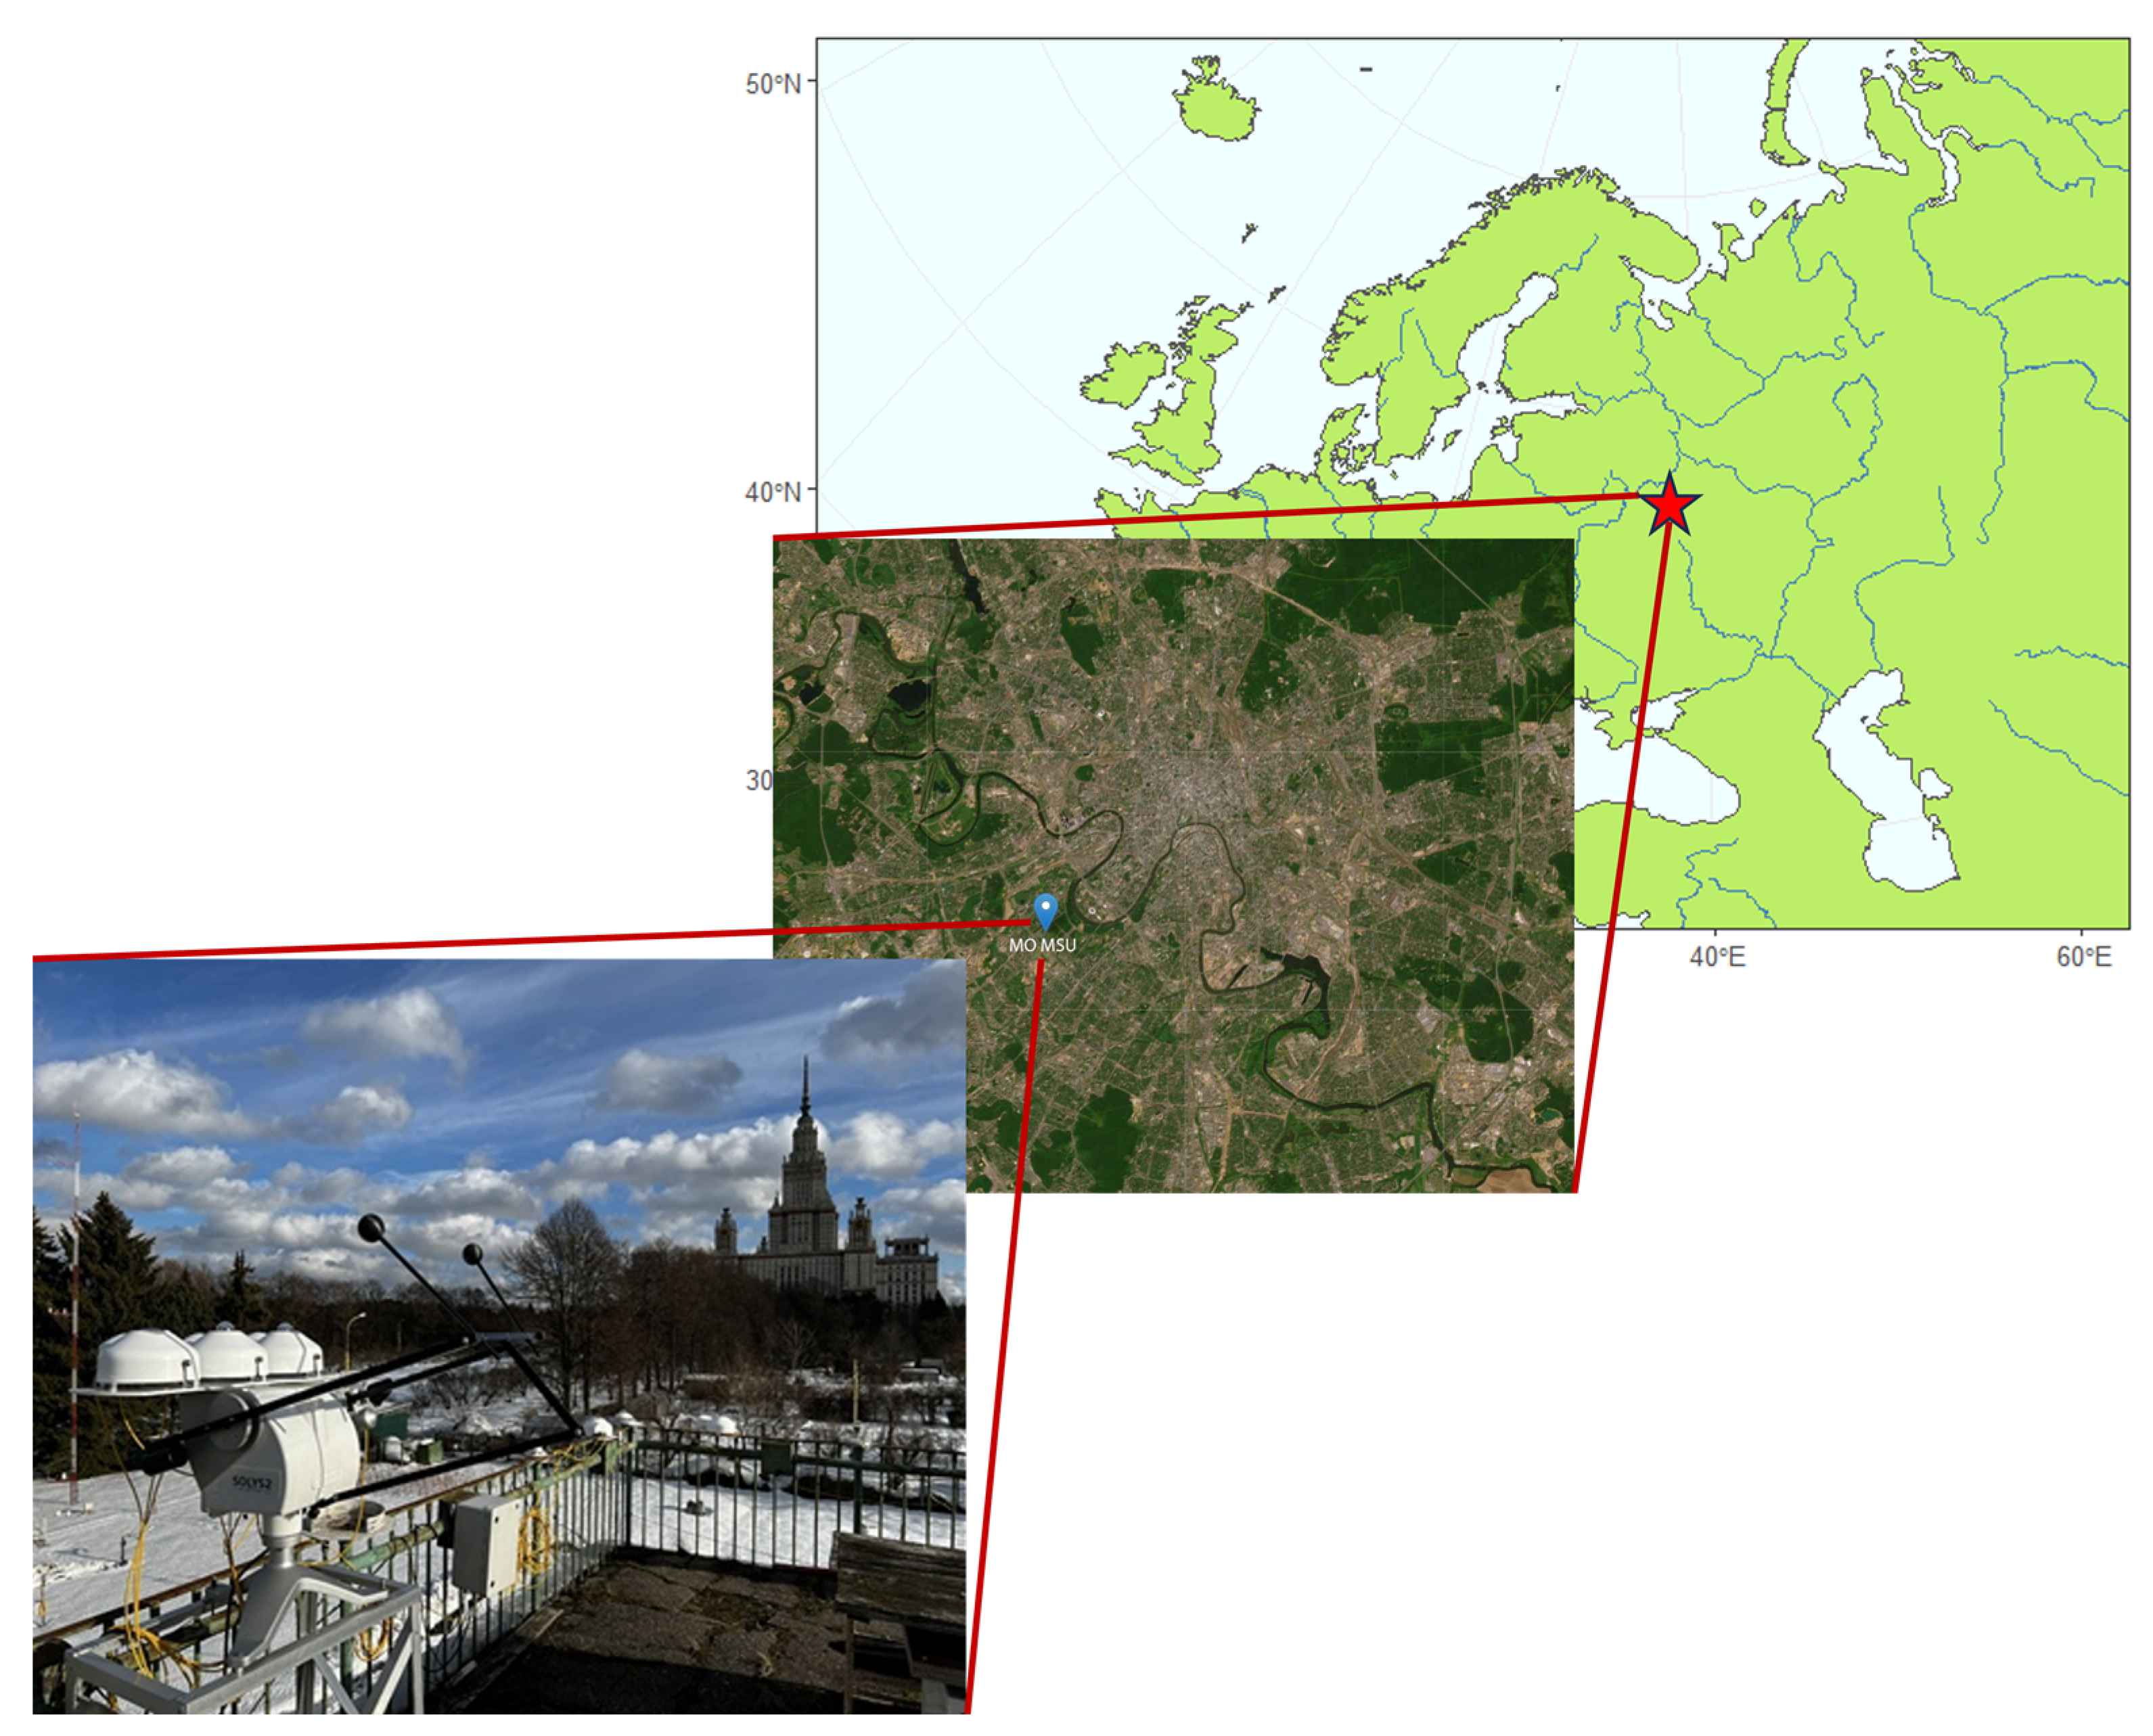
2.1. The Description of the RAD-MSU(BSRN) Complex
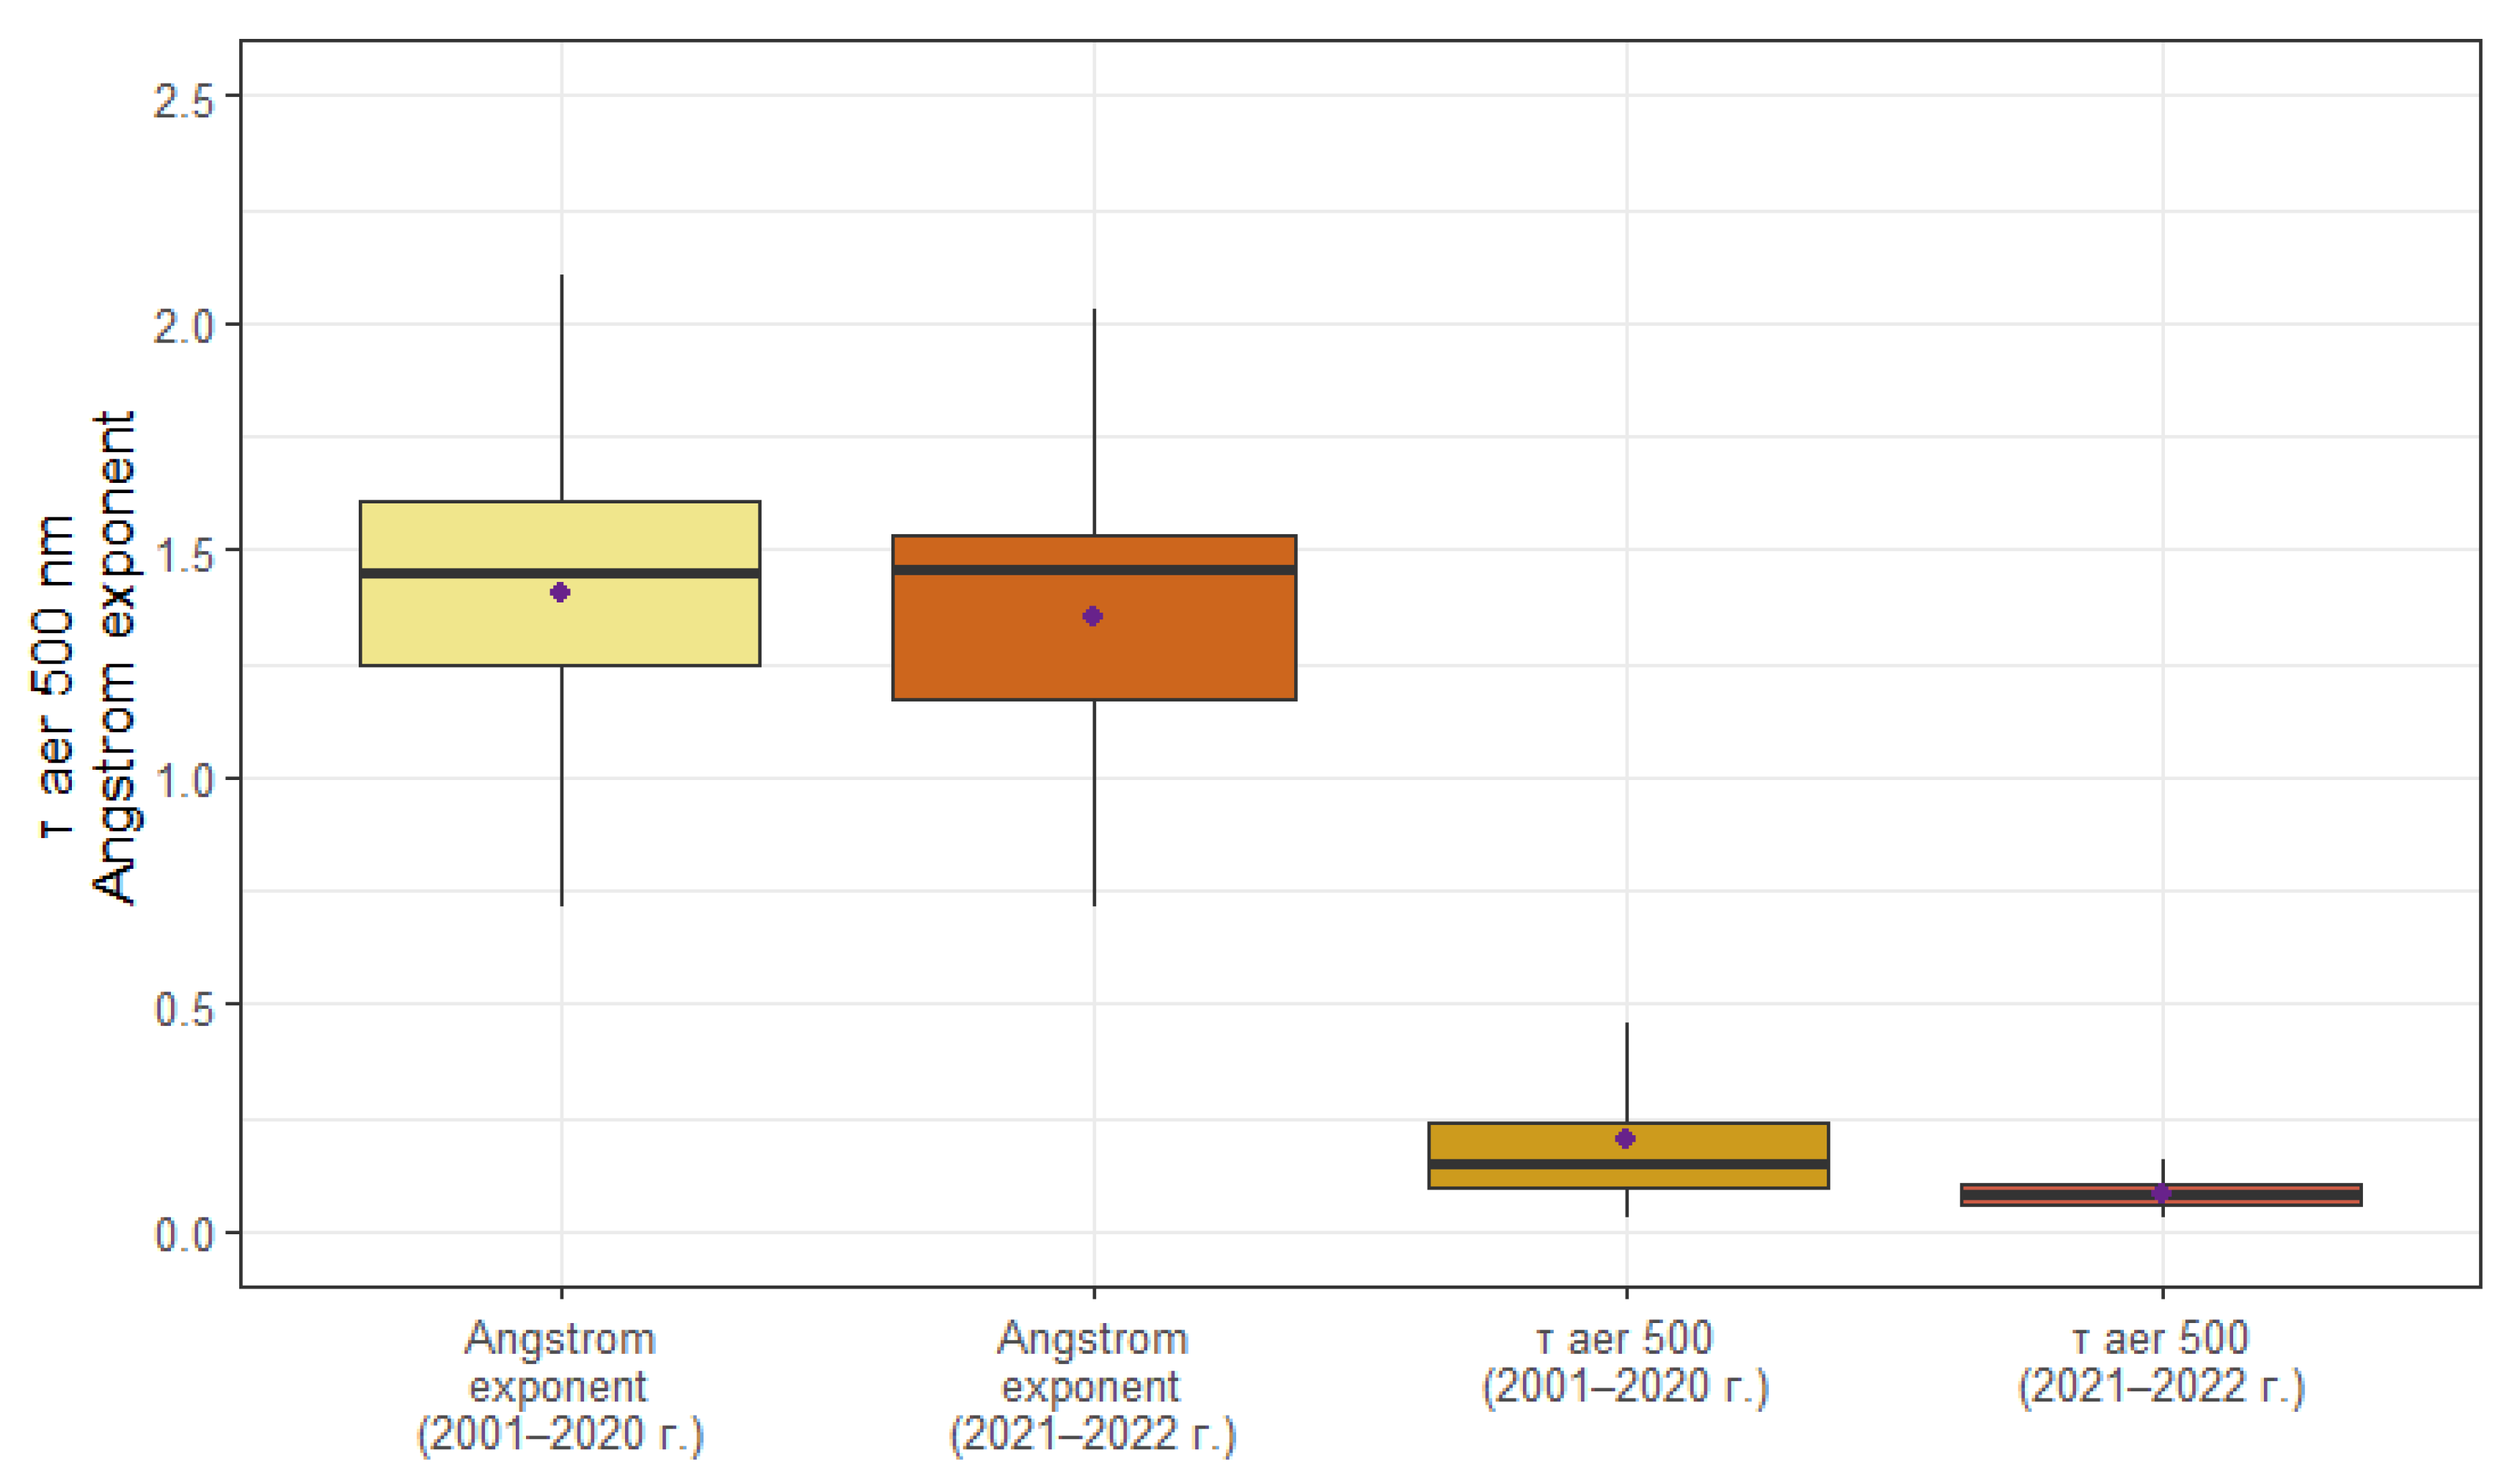
2.2. The Description of the Procedure for Estimating Aerosol Characteristics
3. Results and Discussion
3.1. Factors Affecting Shortwave Irradiance
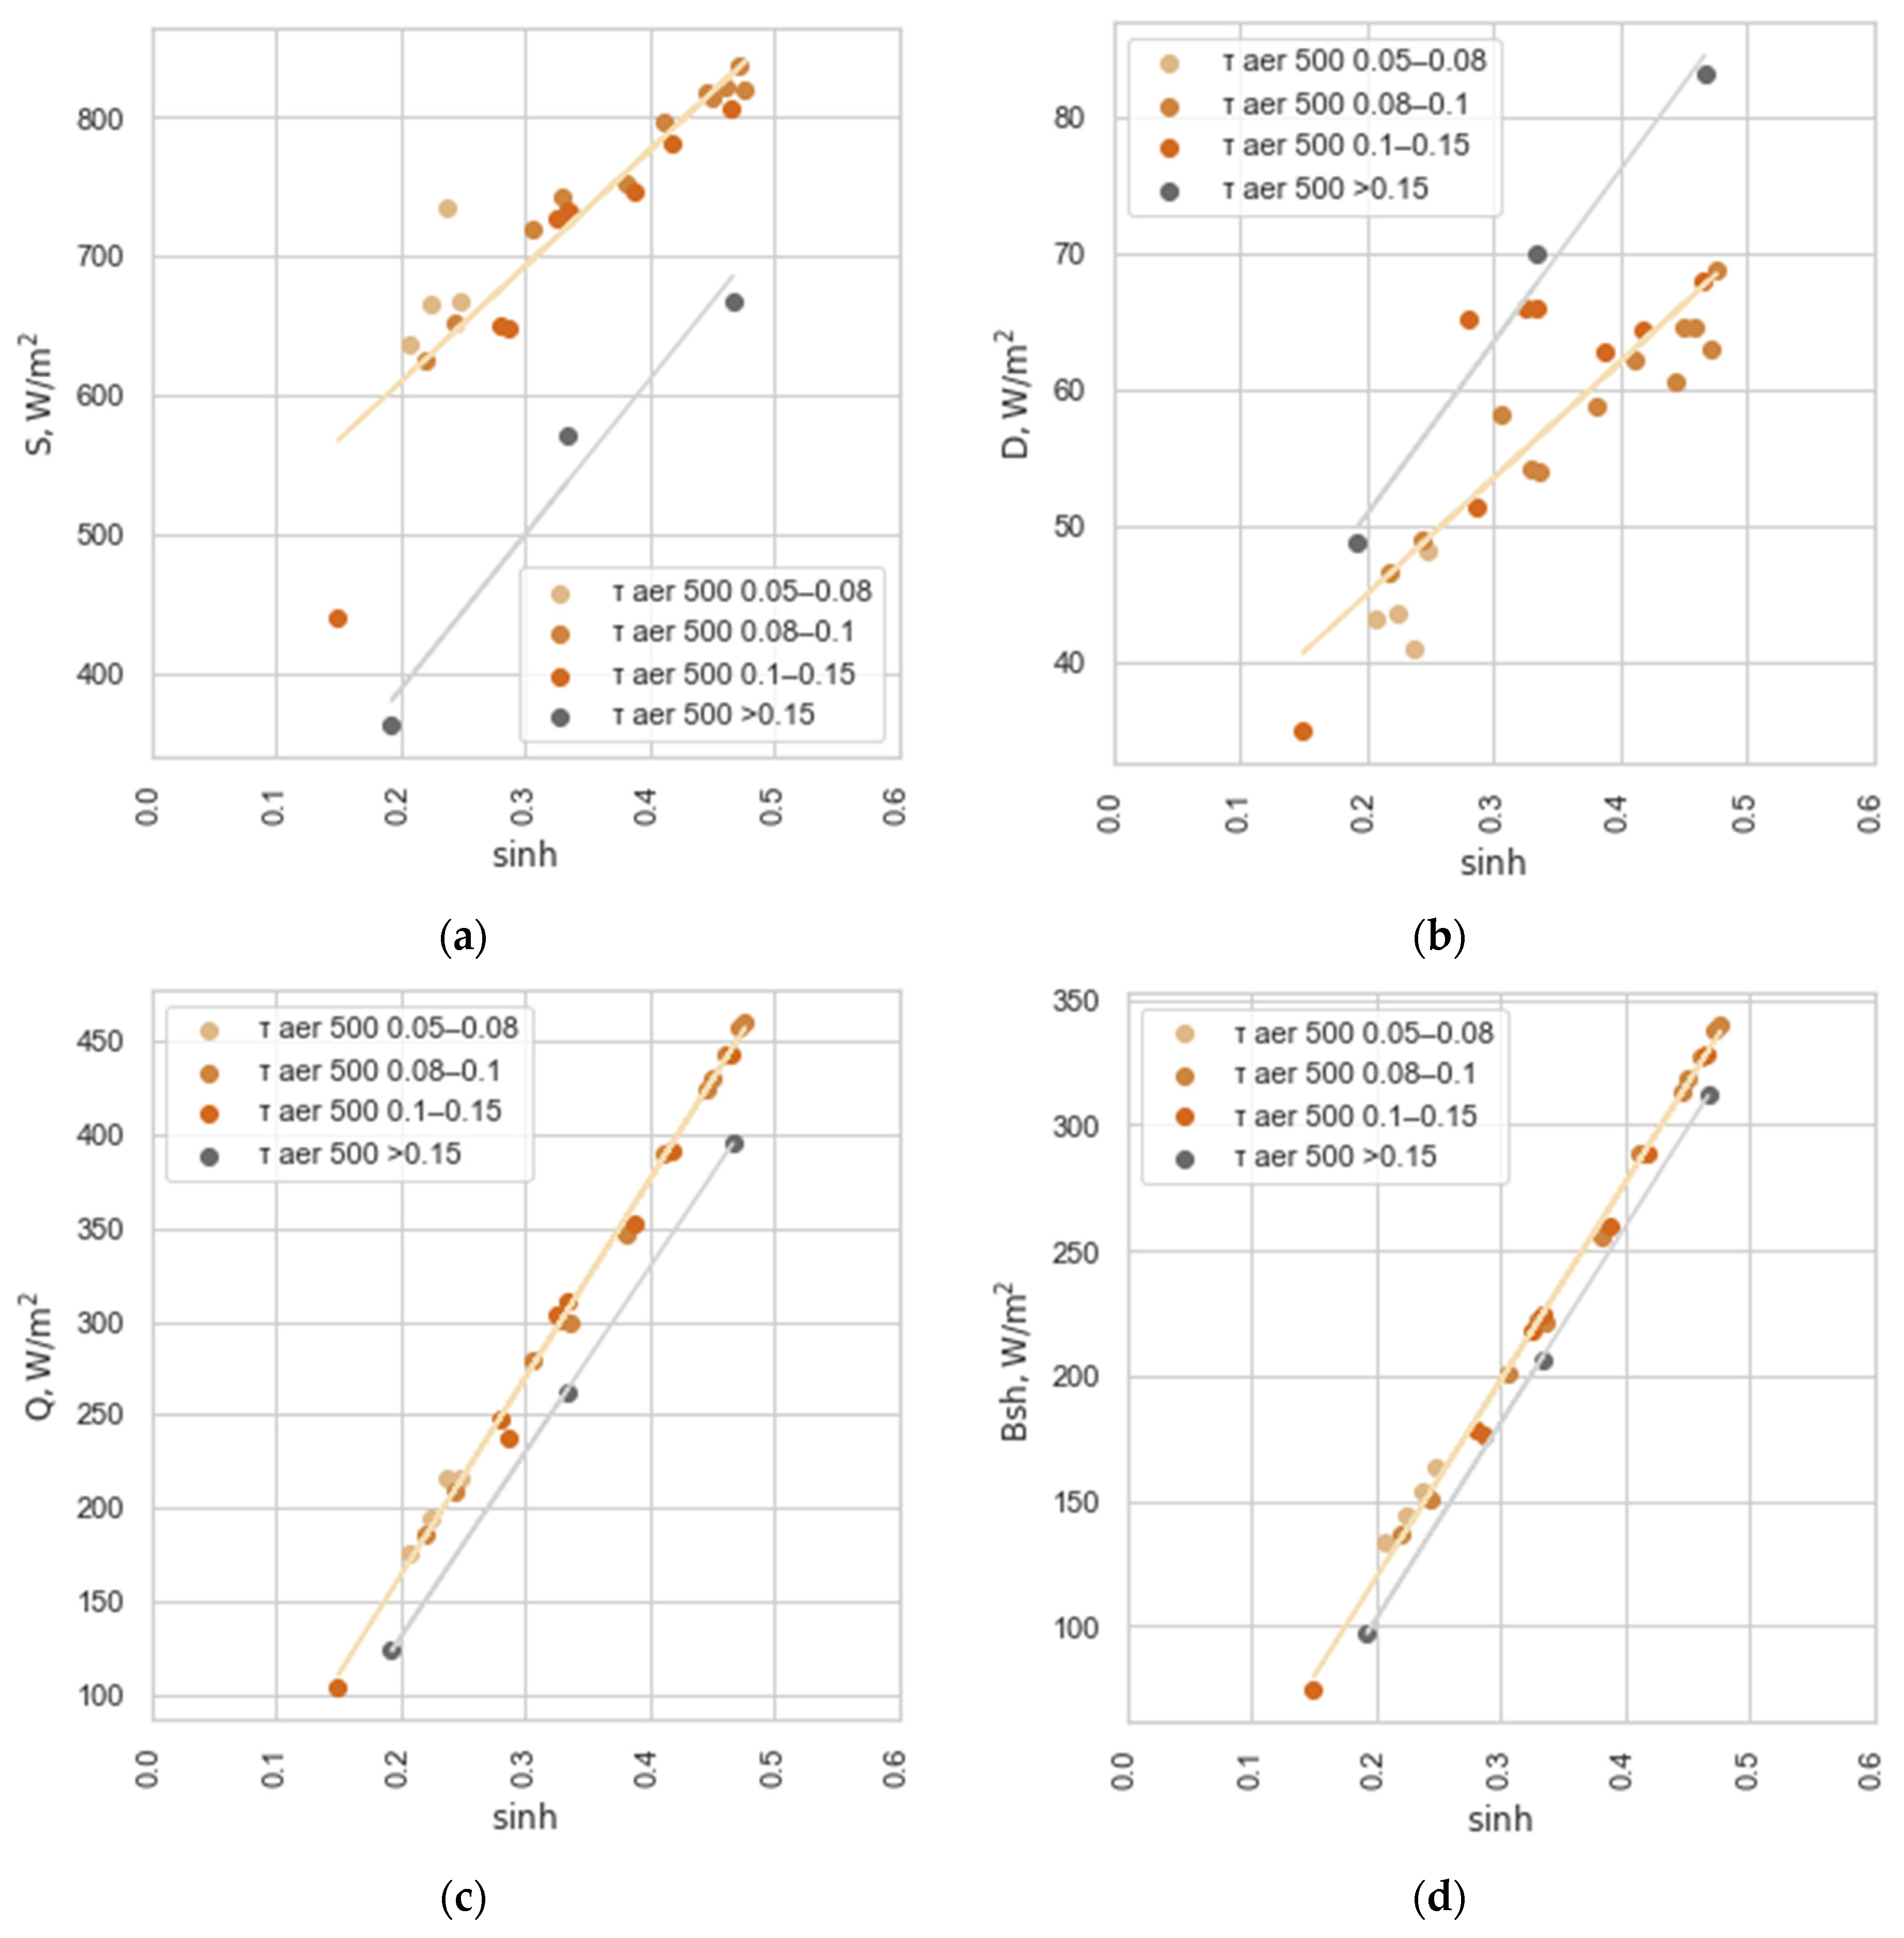
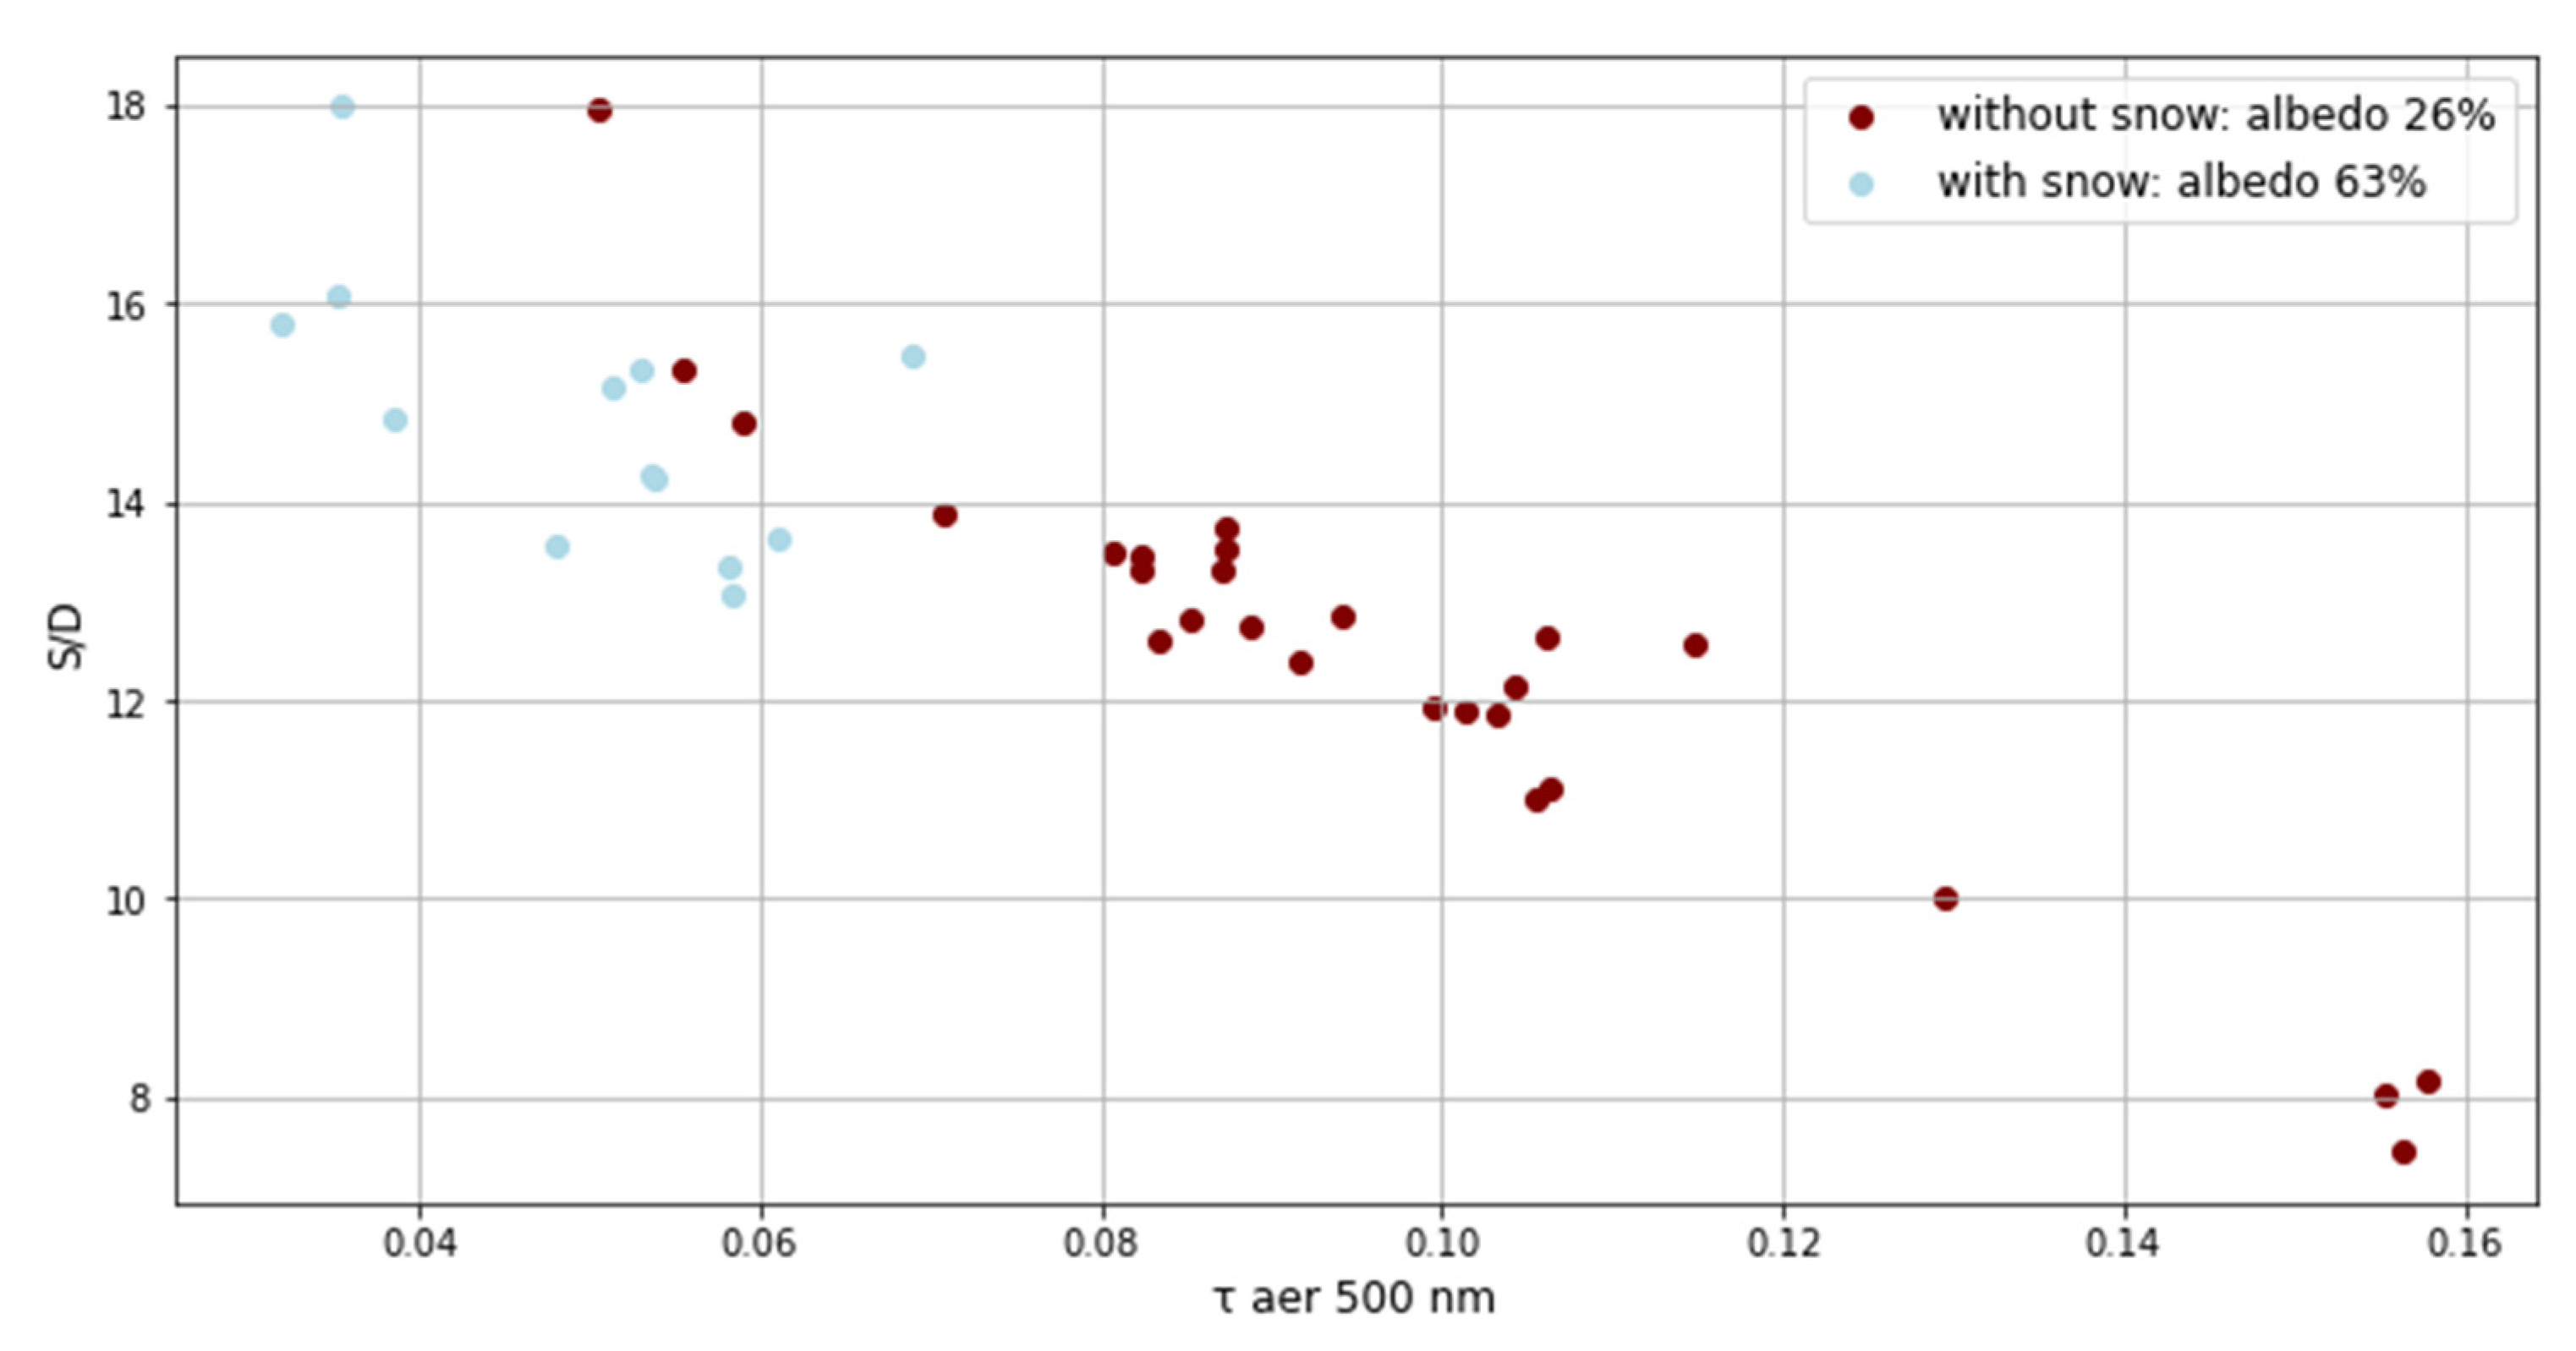
3.1.1. Aerosol Effects on Shortwave Irradiance in Snow and Snow-Free Clear-Sky Conditions
3.1.2. Cloud Influence on Shortwave Irradiance
3.2. Radiative Regime at the MSU MO According to the RAD-MSU(BSRN) Measurements
3.3. The Comparisons of the Radiative Regime during the 2021–2023 Period with Long-Term Observations
4. Conclusions
Author Contributions
Funding
Institutional Review Board Statement
Informed Consent Statement
Data Availability Statement
Conflicts of Interest
Appendix A

| Direct Irradiance | Diffuse Irradiance | Reflected Irradiance | Global Irradiance | |
|---|---|---|---|---|
| Δ/Δ% | Δ/Δ% | Δ/Δ% | Δ/Δ% | |
| January | 0/0 | −5.2/−12.7 | 3.3/9.7 | −5.2/−11.7 |
| February | 6.5/5.3 | −3.6/−4.7 | 0.1/0.1 | −1.8/−1.5 |
| March | 25.5/5.1 | −3.6/−2.9 | 5.6/3.3 | 5.7/1.8 |
| April | 3.5/1.4 | −8.9/−4.4 | −0.6/−0.6 | −6.9/−2.1 |
| May | −0.5/−0.1 | −4.4/−1.6 | −2.9/−2.3 | −3.9/−0.7 |
| June | 0.8/0.1 | −2.4/−1 | −5.1/−3.4 | −11.4/−1.7 |
| July | 16.4/2.4 | 0.5/0.2 | −8.9/−6.4 | 8.7/1.3 |
| August | −4.2/−0.7 | −2.9/−1.2 | −10.3/−9.3 | −4.3/−0.8 |
| October | 1.6/1 | −4.6/−5.3 | −2.3/−9.2 | −5.4/−3.9 |
| November | 0.9/2.7 | −2.5/−7.1 | −0.8/−4.9 | −3/−7.1 |
| December | −0.1/−0.2 | −2.7/−10.3 | −1.1/−4.8 | −3.1/−9.5 |
| Year | 50.4/1.4 | −40.3/−2.5 | −23/−2.4 | −30.5/−0.9 |
| Direct Irradiance | Diffuse Irradiance | Reflected Irradiance | Global Irradiance | Downwelling Longwave Irradiance | Upwelling Longwave Irradiance | Net Irradiance | |
|---|---|---|---|---|---|---|---|
| September, 21 | 47.2 | 139.3 | 38.1 | 186.5 | 869.8 | 941.2 | 77.1 |
| October, 21 | 90.2 | 89.1 | 39.9 | 179.3 | 807.5 | 912.8 | 30.5 |
| November, 21 | 13.4 | 36.4 | 12.0 | 49.8 | 783.2 | 835.2 | −14.3 |
| December, 21 | 6.9 | 29.5 | 26.9 | 36.4 | 696.4 | 742.9 | −37.0 |
| January, 22 | 3.4 | 41.1 | 33.7 | 44.5 | 732.0 | 763.1 | −20.3 |
| February, 22 | 32.4 | 78.5 | 75.3 | 110.9 | 668.3 | 724.2 | −20.2 |
| March, 22 | 192.9 | 126.5 | 167.2 | 319.5 | 670.5 | 793.7 | 29.4 |
| April, 22 | 133.8 | 200.0 | 103.9 | 333.8 | 790.8 | 883.5 | 137.2 |
| May, 22 | 278.7 | 283.7 | 122.7 | 562.4 | 836.5 | 983.9 | 292.3 |
| June, 22 | 451.7 | 247.1 | 142.8 | 698.8 | 909.4 | 1049.4 | 394.2 |
| July, 22 | 411.4 | 264.8 | 139.8 | 676.2 | 972.5 | 1116.3 | 392.6 |
| August, 22 | 430.3 | 245.9 | 110.1 | 676.2 | 983.6 | 1143.9 | 282.4 |
| September, 22 | 76.6 | 155.5 | 40.4 | 232.1 | 863.3 | 947.9 | 107.1 |
| October, 22 | 54.3 | 87.2 | 24.9 | 141.5 | 847.2 | 929.8 | 34.0 |
| November, 22 | 7.7 | 35.0 | 16.9 | 42.7 | 768.9 | 805.5 | −10.9 |
| December, 22 | 6.4 | 26.3 | 22.8 | 32.7 | 737.3 | 778.7 | −31.4 |
| January, 23 | 5.8 | 31.4 | 25.1 | 37.2 | 734.5 | 773.0 | −26.3 |
| February, 23 | 19.9 | 71.7 | 66.5 | 91.6 | 655.7 | 698.9 | −18.1 |
| March, 23 | 76.9 | 133.4 | 111.5 | 210.2 | 765.1 | 830.5 | 33.5 |
| April, 23 | 234.4 | 218.3 | 90.6 | 452.8 | 784.6 | 937.4 | 209.4 |
| May, 23 | 302.1 | 266.6 | 119.5 | 568.7 | 852.8 | 1004.6 | 297.4 |
| June, 23 | 394.4 | 255.1 | 129.1 | 649.5 | 872.0 | 1040.2 | 352.3 |
| July, 23 | 238.3 | 276.3 | 103.2 | 514.6 | 979.9 | 1091.8 | 299.5 |
| August, 23 | 261.4 | 212.7 | 104.4 | 474.1 | 987.7 | 1091.5 | 265.9 |
| Wavelengths | 1020 nm | 870 nm | 670 nm | 440 nm | 500 nm | 380 nm | 340 nm |
|---|---|---|---|---|---|---|---|
| Calibration constants, So.λ | 13,902 | 19,880 | 24,785 | 18,666 | 15,967 | 36,550 | 39,394 |
| Wavelengths | 340 nm | 380 nm | 440 nm | 500 nm | 675 nm | 870 nm | 1020 nm |
|---|---|---|---|---|---|---|---|
| Δτ | |||||||
| Mean | 0.0023 | 0.0015 | 0.0014 | 0.0018 | 0.0000 | −0.0002 | −0.0090 |
| Max | 0.0258 | 0.0184 | 0.0136 | 0.0116 | 0.0056 | 0.0032 | 0.0132 |
| Min | −0.0092 | −0.0067 | −0.0045 | −0.0035 | −0.0028 | −0.0024 | −0.0372 |
| Standard deviation | 0.0049 | 0.0035 | 0.0026 | 0.0025 | 0.0014 | 0.0013 | 0.0070 |
| Δτaer | |||||||
| Mean | −0.0009 | −0.0008 | 0.0026 | 0.0022 | 0.0001 | −0.0001 | −0.0088 |
| Max | 0.0331 | 0.0228 | 0.0174 | 0.0131 | 0.0066 | 0.0034 | 0.0113 |
| Min | −0.0172 | −0.0108 | −0.0040 | −0.0028 | −0.0025 | −0.0025 | −0.0357 |
| Standard deviation | 0.0071 | 0.0047 | 0.0032 | 0.0028 | 0.0016 | 0.0013 | 0.0068 |
| a. Q Dependence on sin h for Different τaer 500 | ||
|---|---|---|
| τaer range | Q | R2 |
| <0.05 | 19.148 ×sin h − 43.074 | 1 |
| 0.05–0.08 | 19.064 ×sin h − 49.633 | 0.99 |
| 0.08–0.1 | 17.596 ×sin h − 41.954 | 1 |
| 0.1–0.12 | 17.804 × sin h − 50.009 | 1 |
| >0.12 | 16.208 ×sin h − 41.939 | 0.98 |
| b. Q dependence on τaer for different h | ||
| h. ° | Q | R2 |
| 10 | 161.75 × e−2.118×τaer | 1 |
| 20 | 359.63 × e−1.858×τaer | 0.97 |
| 30 | 577.53 × e−1.787×τaer | 0.95 |
| 40 | 785.43 × e−1.754×τaer | 0.93 |
| 50 | 993.33 × e−1.735×τaer | 0.93 |
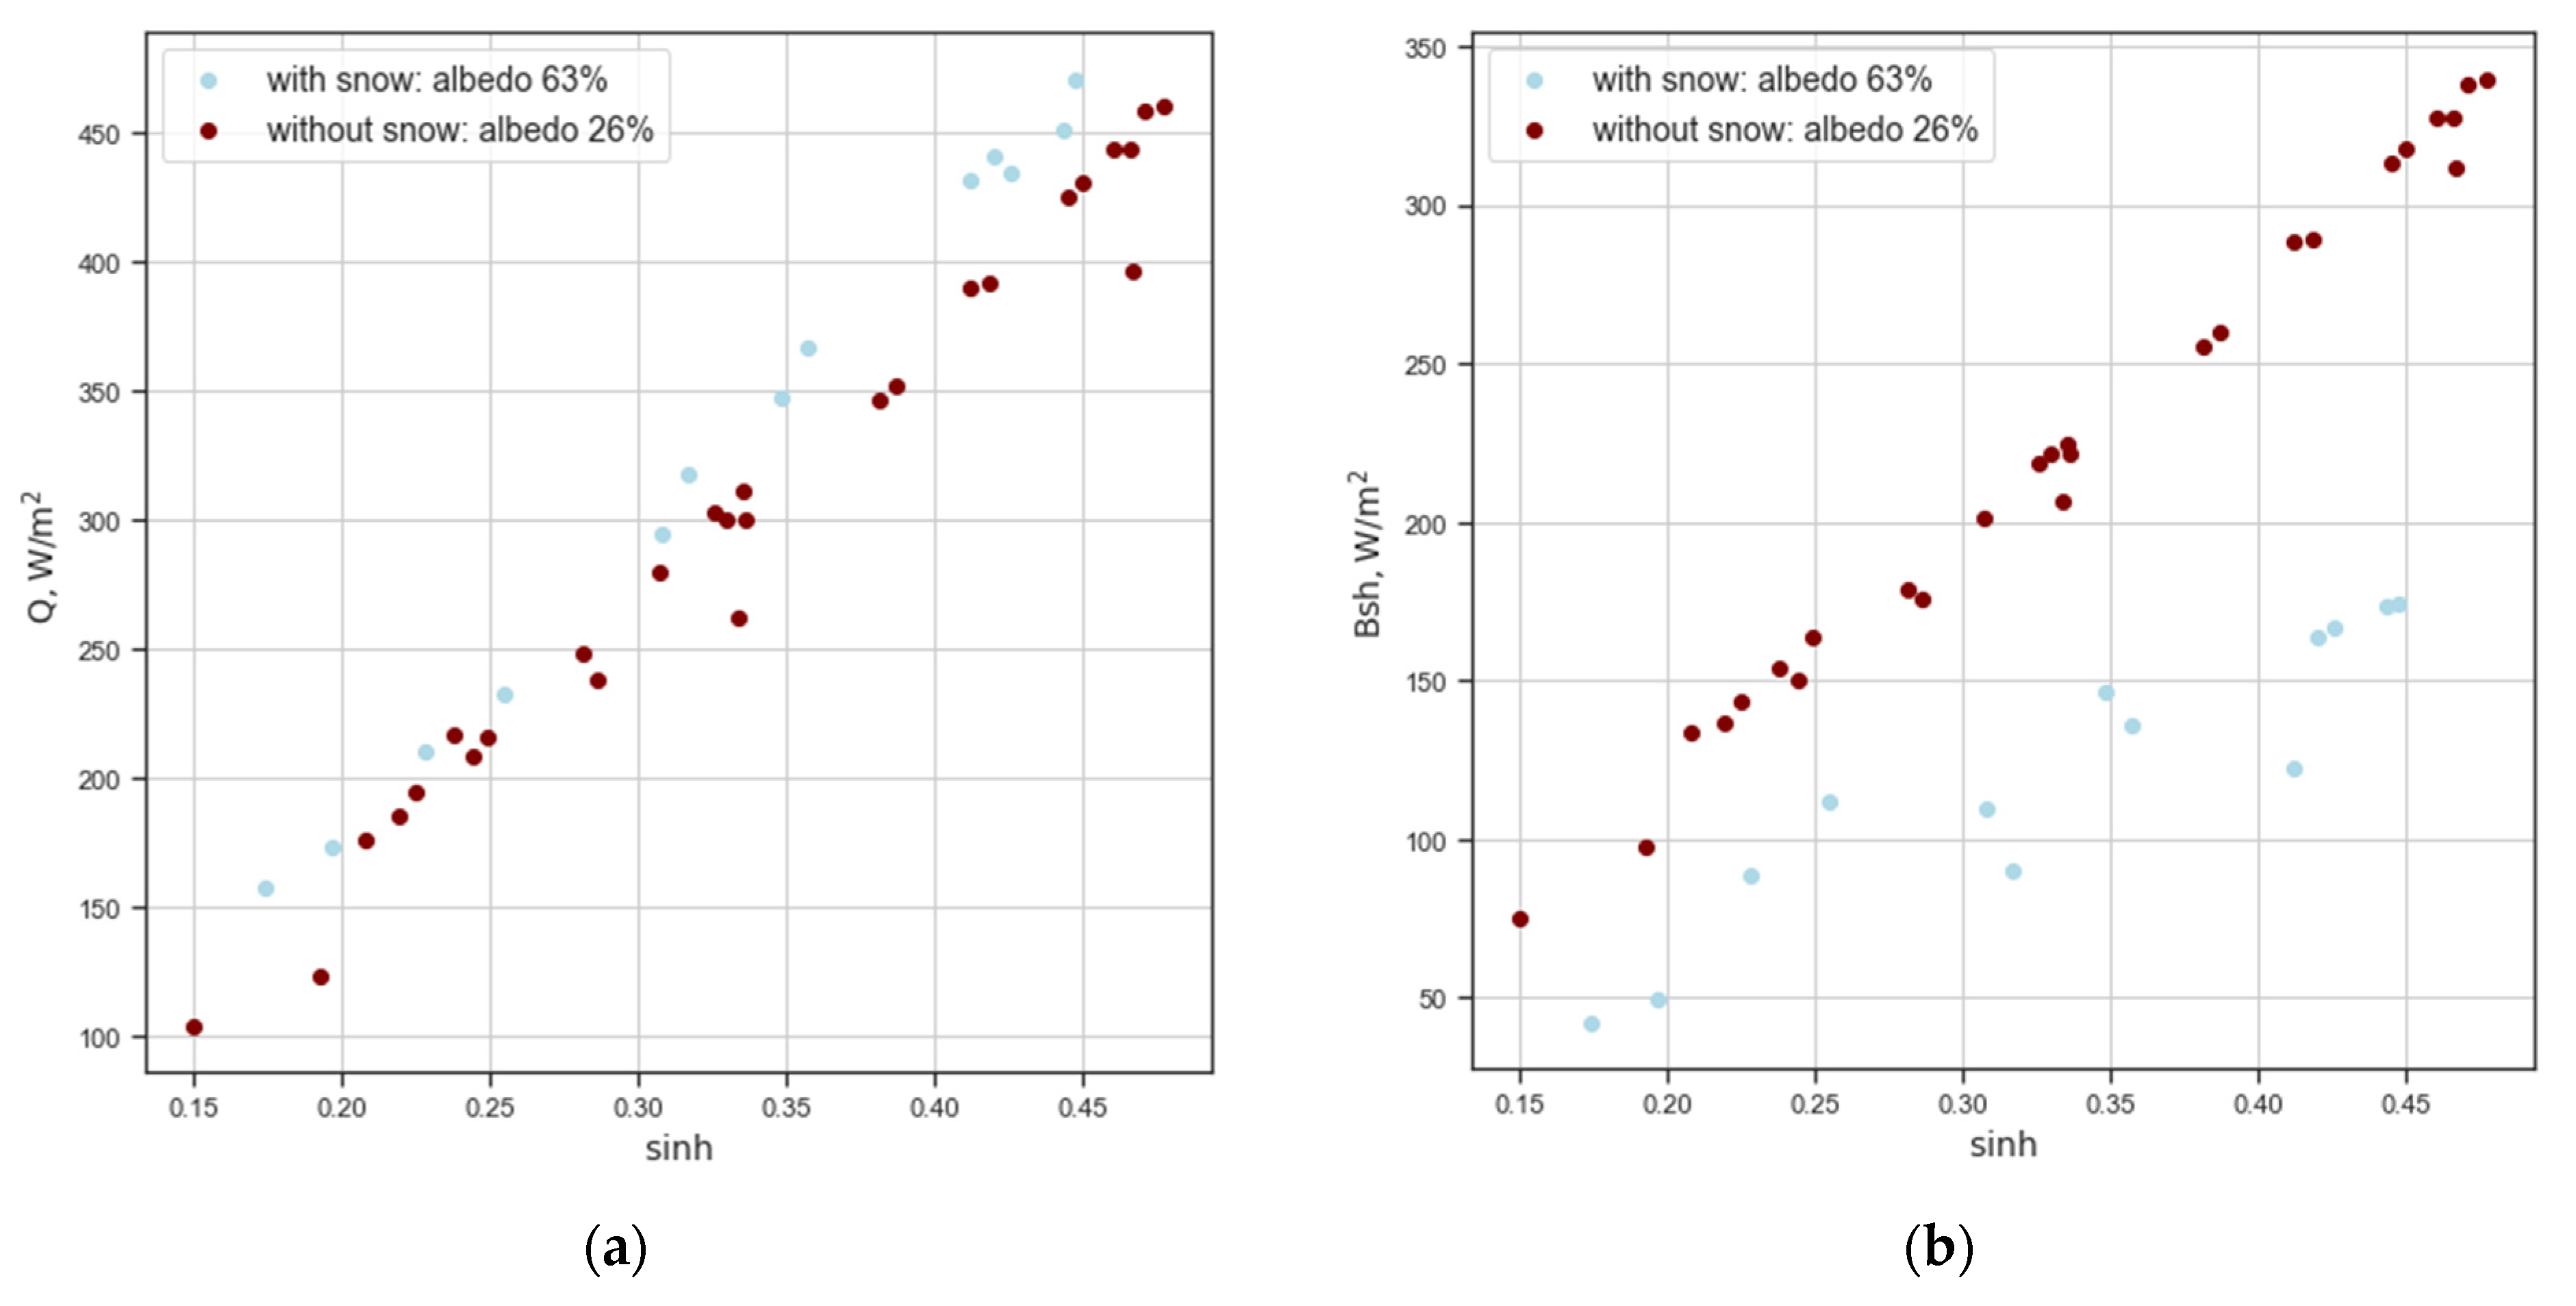
| Q | Bsh | |||
|---|---|---|---|---|
| Q | R2 | Bsh | R2 | |
| Summer (grass, snow-free surface) | 1063.2 × sin h − 49.498 | 1 | 788.35 × sin h − 38.755 | 1 |
| Winter (snow surface) | 1161.2 × sin h − 53.915 | 1 | 434.33 × sin h − 23.579 | 0.87 |

References
- Masson-Delmotte, V.P.; Zhai, A.; Pirani, S.L.; Connors, C.; Péan, S.; Berger, N.; Caud, Y.; Chen, L.; Goldfarb, M.I.; Gomis, M.; et al. (Eds.) IPCC, 2021: Climate Change 2021: The Physical Science Basis. Contribution of Working Group I to the Sixth Assessment Report of the Intergovernmental Panel on Climate Change; Cambridge University Press: Cambridge, UK; New York, NY, USA, 2021; Chapter 7; pp. 923–1055. [Google Scholar]
- Wild, M. Decadal Changes in Radiative Fluxes at Land and Ocean Surfaces and Their Relevance for Global Warming. Wiley Interdiscip. Rev. Clim. Change 2016, 7, 91–107. [Google Scholar] [CrossRef]
- Ohmura, A.; Gilgen, H.; Hegner, H.; Müller, G.; Wild, M.; Dutton, E.G.; Forgan, B.; Fröhlich, C.; Philipona, R.; Heimo, A.; et al. Baseline Surface Radiation Network (BSRN/WCRP): New Precision Radiometry for Climate Research. Bull. Am. Meteorol. Soc. 1998, 79, 2115–2136. [Google Scholar] [CrossRef]
- Wild, M. The Global Energy Balance as Represented in CMIP6 Climate Models. Clim. Dyn. 2020, 55, 553–577. [Google Scholar] [CrossRef] [PubMed]
- Lu, L.; Ma, Q. Diurnal Cycle in Surface Incident Solar Radiation Characterized by CERES Satellite Retrieval. Remote Sens. 2023, 15, 3217. [Google Scholar] [CrossRef]
- Yang, S.; Zhang, X.; Guan, S.; Zhao, W.; Duan, Y.; Yao, Y.; Jia, K.; Jiang, B. A Review and Comparison of Surface Incident Shortwave Radiation from Multiple Data Sources: Satellite Retrievals, Reanalysis Data and GCM Simulations. Int. J. Digit. Earth 2023, 16, 1333–1358. [Google Scholar] [CrossRef]
- Wang, G.; Wang, T.; Xue, H. Validation and Comparison of Surface Shortwave and Longwave Radiation Products over the Three Poles. Int. J. Appl. Earth Obs. Geoinf. 2021, 104, 102538. [Google Scholar] [CrossRef]
- BSRN Home Page. Available online: https://bsrn.awi.de/ (accessed on 3 October 2023).
- Pashiardis, S.; Kalogirou, S.A.; Pelengaris, A. Shortwave Radiation on Horizontal and Incline Surfaces—One Year of Solar Radiation Measurements at Athalassa, an Inland Location in Cyprus. Appl. Sci. 2022, 12, 11035. [Google Scholar] [CrossRef]
- Pashiardis, S.; Pelengaris, A.; Kalogirou, S.A. Geographical Distribution of Global Radiation and Sunshine Duration over the Island of Cyprus. Appl. Sci. 2023, 13, 5422. [Google Scholar] [CrossRef]
- Meloni, D.; di Sarra, A.; Iorio, T.; Monteleone, F.; Pace, G.; Sferlazzo, D.; Iaccarino, A.; Anello, F.; Piacentino, S. Global Shortwave Irradiance at the ENEA Atmospheric Observatory at Lampedusa Island Since 2004; ENEA: Palermo, Italy, 2021; Available online: https://www.researchgate.net/publication/373947065_Global_shortwave_irradiance_at_the_ENEA_Atmospheric_Observatory_at_Lampedusa_Island_since_2004 (accessed on 15 January 2024).
- Vogt, R.; Marais, E.; Maggs-Kölling, G.; Göttsche, F.M.; Cermak, J.; Seely, M.K. A Decade of Solar and Terrestrial Radiation Monitoring at Gobabeb for BSRN. J. Namib. Sci. Soc. 2022, 69, 141–157. [Google Scholar]
- Mol, W.B.; Knap, W.H.; Van Heerwaarden, C.C. Ten Years of 1 Hz Solar Irradiance Observations at Cabauw, the Netherlands, with Cloud Observations, Variability Classifications, and Statistics. Earth Syst. Sci. Data 2023, 15, 2139–2151. [Google Scholar] [CrossRef]
- Becherini, F.; Vitale, V.; Lupi, A.; Stone, R.S.; Salvatori, R.; Salzano, R.; di Carlo, P.; Viola, A.P.; Mazzola, M. Surface Albedo and Spring Snow Melt Variations at Ny-Ålesund, Svalbard. Bull. Atmos. Sci. Technol. 2021, 2, 14. [Google Scholar] [CrossRef]
- Stamatis, M.; Hatzianastassiou, N.; Korras-Carraca, M.B.; Matsoukas, C.; Wild, M.; Vardavas, I. An Assessment of Global Dimming and Brightening during 1984–2018 Using the FORTH Radiative Transfer Model and ISCCP Satellite and MERRA-2 Reanalysis Data. Atmosphere 2023, 14, 1258. [Google Scholar] [CrossRef]
- Stamatis, M.; Hatzianastassiou, N.; Korras-Carraca, M.B.; Matsoukas, C.; Wild, M.; Vardavas, I. On the Contribution of Aerosols and Clouds to Global Dimming and Brightening Using a Radiative Transfer Model, ISCCP-H Cloud and MERRA-2 Aerosol Optical Properties. Environ. Sci. Proc. 2023, 26, 34. [Google Scholar] [CrossRef]
- Driemel, A.; Augustine, J.; Behrens, K.; Colle, S.; Cox, C.; Cuevas-Agulló, E.; Denn, F.M.; Duprat, T.; Fukuda, M.; Grobe, H.; et al. Baseline Surface Radiation Network (BSRN): Structure and Data Description (1992–2017). Earth Syst. Sci. Data 2018, 10, 1491–1501. [Google Scholar] [CrossRef]
- Shuvalova, J.; Chubarova, N.; Shatunova, M. Cloud Characteristics and Their Effects on Solar Irradiance According to the ICON Model, CLOUDNET and BSRN Observations. Atmosphere 2023, 14, 1769. [Google Scholar] [CrossRef]
- García, R.D.; García, O.E.; Cuevas, E.; Cachorro, V.E.; Romero-Campos, P.M.; Ramos, R.; de Frutos, A.M. Solar Radiation Measurements Compared to Simulations at the BSRN Izaña Station. Mineral Dust Radiative Forcing and Efficiency Study. J. Geophys. Res. Atmos. 2014, 119, 179–194. [Google Scholar] [CrossRef]
- Salmon, A.; Quiñones, G.; Soto, G.; Polo, J.; Gueymard, C.; Ibarra, M.; Cardemil, J.; Escobar, R.; Marzo, A. Advances in Aerosol Optical Depth Evaluation from Broadband Direct Normal Irradiance Measurements. Sol. Energy 2021, 221, 206–217. [Google Scholar] [CrossRef]
- Urraca, R.; Lanconelli, C.; Cappucci, F.; Gobron, N. Comparison of Long-Term Albedo Products against Spatially Representative Stations over Snow. Remote Sens. 2022, 14, 3745. [Google Scholar] [CrossRef]
- MO MSU Home Page. Available online: http://www.momsu.ru (accessed on 3 September 2023).
- Lutsko, L.V.; Makhotkina, E.L.; Bychkova, A.P.; Sokolenko, S.A.; Lebedeva, K.D. Guidance Document. Instruction to Hydrometeorological Stations and Posts; Roshydromet: Moscow, Russia, 1997. [Google Scholar]
- Chubarova, N.E.; Nezval’, E.I.; Belikov, I.B.; Gorbarenko, E.V.; Eremina, I.D.; Zhdanova, E.Y.; Korneva, I.A.; Konstantinov, P.I.; Lokoshchenko, M.A.; Skorokhod, A.I.; et al. Climatic and Environmental Characteristics of Moscow Megalopolis According to the Data of the Moscow State University Meteorological Observatory over 60 Years. Russ. Meteorol. Hydrol. 2014, 39, 602–613. [Google Scholar] [CrossRef]
- WRDC Home Page. Available online: http://wrdc.mgo.rssi.ru/ (accessed on 5 October 2023).
- Abakumova, G.M.; Gorbarenko, E.V.; Nezval, E.I.; Shilovtseva, O.A. Fifty Years of Actinometrical Measurements in Moscow. Int. J. Remote Sens. 2008, 29, 2629–2665. [Google Scholar] [CrossRef]
- Gorbarenko, E.V. Climate Changes in Atmospheric Radiation Parameters from the MSU Meteorological Observatory Data. Russ. Meteorol. Hydrol. 2016, 41, 789–797. [Google Scholar] [CrossRef]
- Volpert, E.V.; Chubarova, N.E. Long-Term Changes in Solar Radiation in Northern Eurasia during the Warm Season According to Measurements and Reconstruction Model. Russ. Meteorol. Hydrol. 2021, 46, 507–518. [Google Scholar] [CrossRef]
- Chubarova, N.E.; Rosental, V.A.; Zhdanova, E.Y.; Poliukhov, A.A. New Radiation Complex at the Moscow State University Meteorological Observatory of the BSRN Standard: Methodological Aspects and First Measurement Results. Opt. Atmos. Okeana 2022, 35, 670–678. [Google Scholar] [CrossRef]
- Kipp and Zonen Home Page. Available online: https://www.kippzonen.com/ (accessed on 17 November 2023).
- Long, C.N.; Shi, Y. An Automated Quality Assessment and Control Algorithm for Surface Radiation Measurements. Open Atmos. Sci. J. 2008, 2, 23–37. [Google Scholar] [CrossRef]
- Gorbarenko, E.V. Extremes and general trends in long-term variability of atmospheric radiation parameters in Moscow. Vestn. Mosk. Univ. Seriya Geogr. 2022, 5, 90–103. [Google Scholar] [CrossRef]
- Holben, B.N.; Eck, T.F.; Slutsker, I.; Tanré, D.; Buis, J.P.; Setzer, A.; Vermote, E.; Reagan, J.A.; Kaufman, Y.J.; Nakajima, T.; et al. AERONET—A Federated Instrument Network and Data Archive for Aerosol Characterization. Remote Sens. Environ. 1998, 66, 1–16. [Google Scholar] [CrossRef]
- Giles, D.M.; Sinyuk, A.; Sorokin, M.G.; Schafer, J.S.; Smirnov, A.; Slutsker, I.; Eck, T.F.; Holben, B.N.; Lewis, J.R.; Campbell, J.R.; et al. Advancements in the Aerosol Robotic Network (AERONET) Version 3 Database—Automated near-Real-Time Quality Control Algorithm with Improved Cloud Screening for Sun Photometer Aerosol Optical Depth (AOD) Measurements. Atmos. Meas. Tech. 2019, 12, 169–209. [Google Scholar] [CrossRef]
- Chubarova, N.Y.; Poliukhov, A.A.; Gorlova, I.D. Long-Term Variability of Aerosol Optical Thickness in Eastern Europe over 2001–2014 According to the Measurements at the Moscow MSU MO AERONET Site with Additional Cloud and NO2 Correction. Atmos. Meas. Tech. 2016, 9, 313–334. [Google Scholar] [CrossRef]
- Wei, J.; Li, Z.; Peng, Y.; Sun, L. MODIS Collection 6.1 Aerosol Optical Depth Products over Land and Ocean: Validation and Comparison. Atmos. Environ. 2019, 201, 428–440. [Google Scholar] [CrossRef]
- Witthuhn, J.; Hünerbein, A.; Filipitsch, F.; Wacker, S.; Meilinger, S.; Deneke, H. Aerosol Properties and Aerosol–Radiation Interactions in Clear-Sky Conditions over Germany. Atmos. Chem. Phys. 2021, 21, 14591–14630. [Google Scholar] [CrossRef]
- Tarasova, T.A.; Fomin, B.A. The Use of New Parameterizations for Gaseous Absorption in the CLIRAD-SW Solar Radiation Code for Models. J. Atmos. Ocean. Technol. 2007, 24, 1157–1162. [Google Scholar] [CrossRef]
- Mullamaa, I.-A. Stochastic Structure of Cloud and Radiation Fields; National Aeronautics and Space Administration: Washington, DC, USA, 1975; Volume 822. [Google Scholar]
- Luo, H.; Quaas, J.; Han, Y. Examining Cloud Vertical Structure and Radiative Effects from Satellite Retrievals and Evaluation of CMIP6 Scenarios. Atmos. Chem. Phys. 2023, 23, 8169–8186. [Google Scholar] [CrossRef]
- Gorbarenko, E.V.; Abakumova, G.M. Radiation Balance Variations of Underlying Surface from the Long-Term Observations of the Meteorological Observatory of the Moscow State University. Russ. Meteorol. Hydrol. 2011, 36, 383–391. [Google Scholar] [CrossRef]
- Myachkova, N.A. (Ed.) Climates of the USSR; Moscow University Publishing House: Moscow, Russia, 1983. [Google Scholar]
- Chubarova, N.E.; Pastukhova, A.S.; Zhdanova, E.Y.; Volpert, E.V.; Smyshlyaev, S.P.; Galin, V.Y. Effects of Ozone and Clouds on Temporal Variability of Surface UV Radiation and UV Resources over Northern Eurasia Derived from Measurements and Modeling. Atmosphere 2020, 11, 59. [Google Scholar] [CrossRef]


| Parameters | Designations | Instruments | Measurement Errors |
|---|---|---|---|
| Direct normal shortwave irradiance | S | CHP1 Pyrheliometer | <0.5% |
| Diffuse shortwave irradiance | D | CMP21 Pyranometer | <±10 W/m2 |
| Global shortwave irradiance | Q | CMP21 Pyranometer | <±10 W/m2 |
| Downward longwave irradiance | L_U | CGR4 Pyrgeometer on the roof | <1% |
| Reflected shortwave irradiance | R | CMP21 Pyranometer | <±10 W/m2 |
| Upward longwave irradiance | L_L | CGR4 Pyrgeometer on the ground | <1% |
| Ultraviolet irradiance in the range of 315–400 nm. | UVA | SUV-A UVA Radiometer | <±5% |
| Erythemal UV irradiance | ER | SUV-E UVE Radiometer | <±5% |
| Sunshine duration | Sd | CSD3 Sunshine Duration Sensor | >90% (monthly sunshine hours |
| Solar Elevation | 10° | 20° | 30° | 40° | 50° | |||||
|---|---|---|---|---|---|---|---|---|---|---|
| W/m2 | % | W/m2 | % | W/m2 | % | W/m2 | % | W/m2 | % | |
| τaer 500 < 0.05 | 8.3 | 5.1 | 16.3 | 4.5 | 25.1 | 4.4 | 33.6 | 4.3 | 42 | 4.2 |
| τaer 500 0.05–0.1 | 22.2 | 13.7 | 43.8 | 12.2 | 67.8 | 11.7 | 90.5 | 11.5 | 113.3 | 11.4 |
| τaer 500 0.1–0.15 | 36.3 | 22.4 | 71.8 | 20.0 | 111.3 | 19.3 | 148.9 | 19.0 | 186.5 | 18.8 |
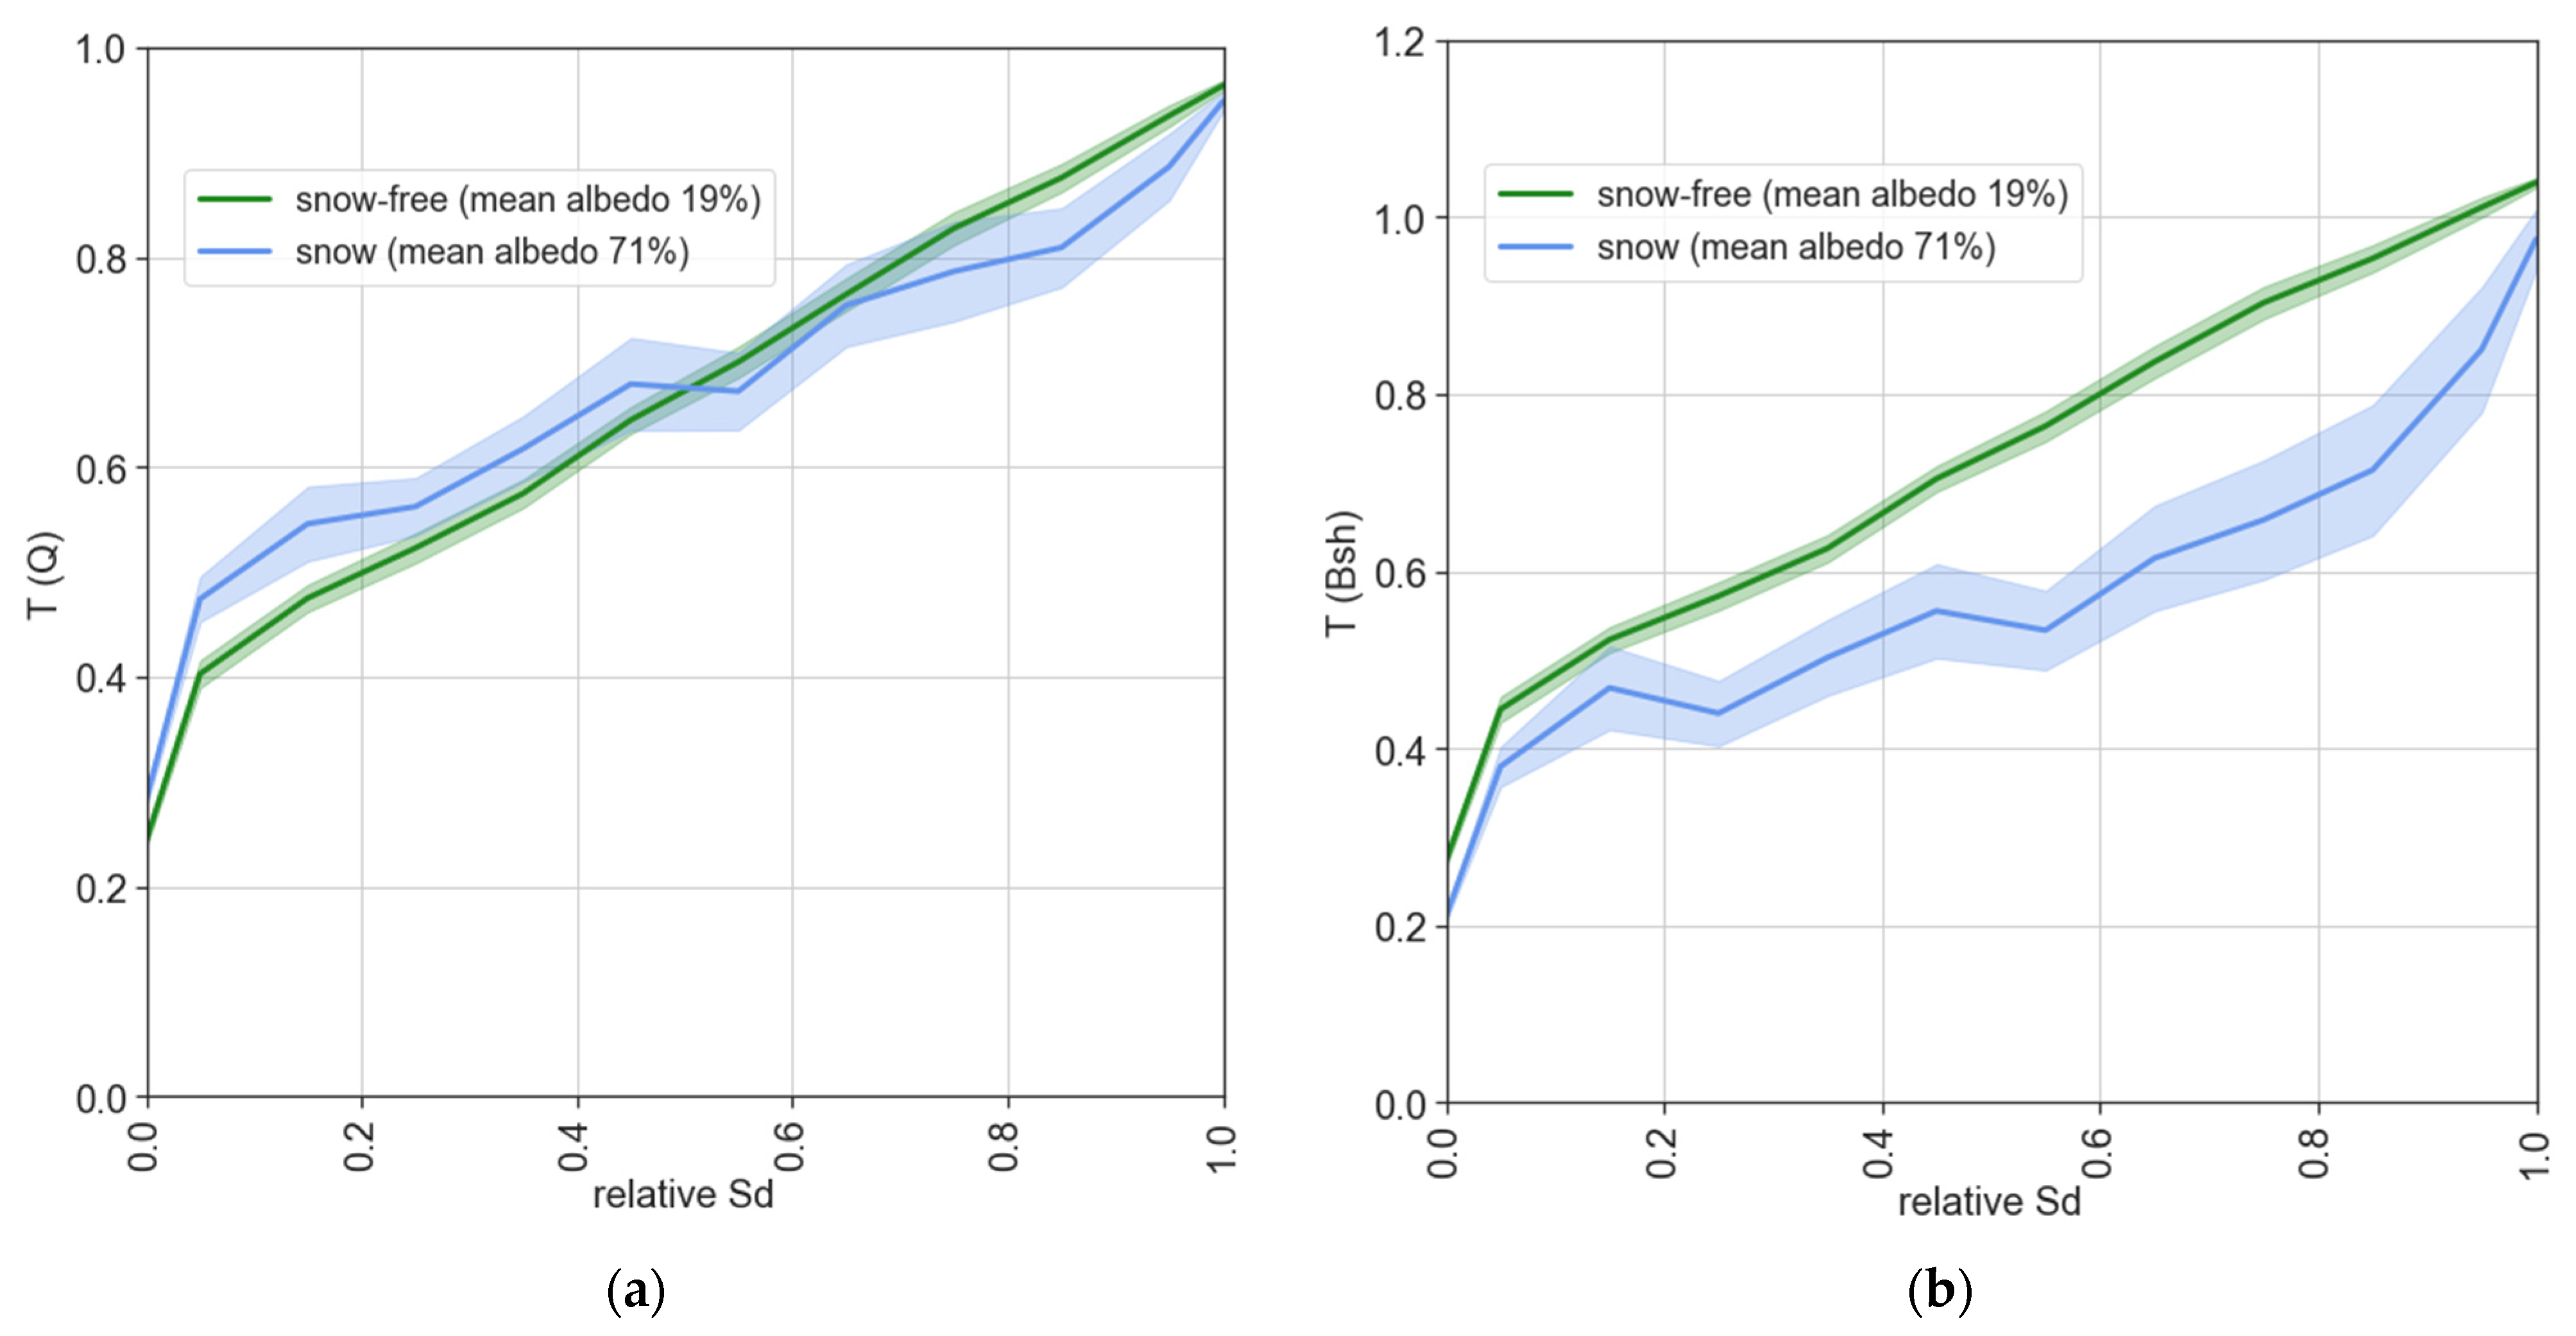
| The Relative Sd Intervals | Mean T(Q) | Mean T(Bsh) | Standard Deviation for T(Q) | Standard Deviation for T(Bsh) | Case Number | |||||
|---|---|---|---|---|---|---|---|---|---|---|
| Snow-Free | Snow | Snow-Free | Snow | Snow-Free | Snow | Snow-Free | Snow | Snow-Free | Snow | |
| 0 | 0.24 | 0.28 | 0.27 | 0.21 | 0.13 | 0.12 | 0.14 | 0.10 | 1516 | 1008 |
| 0–0.1 | 0.40 | 0.47 | 0.44 | 0.38 | 0.11 | 0.10 | 0.13 | 0.11 | 294 | 91 |
| 0.1–0.2 | 0.48 | 0.55 | 0.52 | 0.47 | 0.10 | 0.11 | 0.11 | 0.15 | 213 | 40 |
| 0.2–0.3 | 0.52 | 0.56 | 0.57 | 0.44 | 0.10 | 0.08 | 0.11 | 0.10 | 183 | 30 |
| 0.3–0.4 | 0.57 | 0.62 | 0.63 | 0.50 | 0.09 | 0.08 | 0.11 | 0.11 | 182 | 24 |
| 0.4–0.5 | 0.64 | 0.68 | 0.70 | 0.56 | 0.09 | 0.11 | 0.11 | 0.14 | 212 | 26 |
| 0.5–0.6 | 0.70 | 0.67 | 0.76 | 0.53 | 0.11 | 0.09 | 0.13 | 0.11 | 227 | 25 |
| 0.6–0.7 | 0.76 | 0.75 | 0.84 | 0.61 | 0.12 | 0.11 | 0.14 | 0.16 | 229 | 28 |
| 0.7–0.8 | 0.83 | 0.79 | 0.90 | 0.66 | 0.12 | 0.11 | 0.13 | 0.16 | 209 | 22 |
| 0.8–0.9 | 0.88 | 0.81 | 0.95 | 0.71 | 0.11 | 0.10 | 0.13 | 0.19 | 274 | 26 |
| 0.9–1 | 0.93 | 0.89 | 1.01 | 0.85 | 0.11 | 0.13 | 0.12 | 0.29 | 430 | 64 |
| 1 | 0.96 | 0.95 | 1.04 | 0.98 | 0.09 | 0.07 | 0.10 | 0.27 | 1229 | 238 |
Disclaimer/Publisher’s Note: The statements, opinions and data contained in all publications are solely those of the individual author(s) and contributor(s) and not of MDPI and/or the editor(s). MDPI and/or the editor(s) disclaim responsibility for any injury to people or property resulting from any ideas, methods, instructions or products referred to in the content. |
© 2024 by the authors. Licensee MDPI, Basel, Switzerland. This article is an open access article distributed under the terms and conditions of the Creative Commons Attribution (CC BY) license (https://creativecommons.org/licenses/by/4.0/).
Share and Cite
Piskunova, D.; Chubarova, N.; Poliukhov, A.; Zhdanova, E. Radiative Regime According to the New RAD-MSU(BSRN) Complex in Moscow: The Roles of Aerosol, Surface Albedo, and Sunshine Duration. Atmosphere 2024, 15, 144. https://doi.org/10.3390/atmos15020144
Piskunova D, Chubarova N, Poliukhov A, Zhdanova E. Radiative Regime According to the New RAD-MSU(BSRN) Complex in Moscow: The Roles of Aerosol, Surface Albedo, and Sunshine Duration. Atmosphere. 2024; 15(2):144. https://doi.org/10.3390/atmos15020144
Chicago/Turabian StylePiskunova, Daria, Natalia Chubarova, Aleksei Poliukhov, and Ekaterina Zhdanova. 2024. "Radiative Regime According to the New RAD-MSU(BSRN) Complex in Moscow: The Roles of Aerosol, Surface Albedo, and Sunshine Duration" Atmosphere 15, no. 2: 144. https://doi.org/10.3390/atmos15020144