1. Introduction
Over the past 170 years, the global average temperature has risen by 1.1 °C. Recent decades have seen an alarming acceleration in the trend of global warming, establishing it as an undeniable reality [
1,
2]. Human activities, particularly the continuous release of carbon dioxide and other greenhouse gases, are the primary drivers of global climate change [
2]. Climate change poses a severe threat to the human habitat, highlighting the urgency of reducing greenhouse gas emissions—a global consensus on addressing climate change [
2]. In a concerted effort to address global warming and curb carbon emissions, China’s President Xi Jinping made a significant announcement at the 75th United Nations General Assembly: China is committed to peaking its carbon dioxide emissions by 2030 and aspires to achieve carbon neutrality by 2060.
However, research findings by Liu, A.J., Zhai, J., and others suggest that under the current development model and policy framework, China may fall short of peaking carbon dioxide emissions by 2030 [
3,
4]. Achieving this target necessitates a gradual shift from previous extensive production and lifestyles. Current research outlines various pathways for China to attain its 2030 carbon peak [
5,
6,
7], including: (1) Accelerating the transformation and upgrading of the industrial structure by reducing the proportion of traditional enterprises, enhancing the energy efficiency of traditional industries, and promoting low-energy third industries, advanced manufacturing, and high-tech sectors. (2) Adjusting the energy structure through reduced reliance on fossil fuels, increased utilization of clean energy, and enhanced energy efficiency. (3) Employing carbon capture and storage technology, advancing ecological governance and afforestation, and increasing carbon sinks. (4) Enhancing relevant policies, fostering the development of carbon trading markets, enforcing stringent corporate carbon emission standards, and guiding individuals toward adopting low-carbon consumption habits.
Situated in the southernmost region of mainland China, Guangdong Province shares borders with Fujian Province to the east, Guangxi Zhuang Autonomous Region to the west, Jiangxi Province and Hunan Province to the north, and the special administrative regions of Hong Kong and Macao to the south. Guangdong Province is one of the most economically developed provinces in China and is also the most populous province. In 2022, the region’s gross domestic product (GDP) reached 12.92 trillion yuan and the province was home to a population of 126.568 million [
8]. Being China’s most economically advanced and densely populated province, the persistent population growth and increasing per capita GDP will continue to drive fossil fuel consumption. This dynamic presents a significant challenge to Guangdong Province in achieving its carbon peak by 2030 [
9]. In the absence of stringent carbon emission control policies, carbon emissions in the province are likely to grow after 2030, similar to the situation in other regions of the country. Only through a comprehensive approach that involves expediting the transition to cleaner and low-carbon energy sources and upgrading the industrial structure can Guangdong Province be poised to achieve its carbon peak ahead of 2030 and commence the journey towards carbon neutrality [
9,
10,
11].
According to research by Zhou, B. and others, the key sectors contributing to carbon dioxide emissions in Guangdong Province include equipment manufacturing, construction, transportation, warehousing, and other services. Among these sectors, the transportation and warehousing industry shows the greatest potential for carbon reduction [
12]. In the transportation sector, road transportation stands out as the primary contributor to carbon emissions, accounting for over 50% [
13]. Therefore, achieving the carbon peak in the transportation sector, especially in road transportation, is pivotal for Guangdong Province to achieve the carbon peak target.
Taking a lifecycle approach, an automobile’s lifecycle encompasses two primary aspects: the material cycle and the fuel cycle. The fuel cycle further comprises the upstream stage (well to pump, WTP) and the operational stage (pump to wheels, PTW), as shown in
Figure 1. Research by Yu, D. L., Qiao, Q., and others emphasizes that energy consumption and greenhouse gas emissions in the fuel cycle significantly influence the overall automobile lifecycle [
14,
15,
16]. Conventional internal combustion engine vehicles (ICVs) primarily emit carbon during the operational stage of the fuel cycle, whereas new energy vehicles (NEVs) release carbon during the upstream stage of the fuel cycle. To account for the increased indirect carbon emissions resulting from vehicle electrification’s impact on fuel production, this study employs a fuel cycle carbon emissions analysis method. It aims to assess the timing and approach for achieving carbon peaking in automobile usage within Guangdong Province, thus providing valuable insights for selecting the most suitable carbon peaking pathway for road transportation in the region. The scope of this study includes CO
2 emissions from the operation of automobiles within Guangdong Province and the production of electricity and petroleum products but excludes CO
2 emissions originating from the extraction of raw materials, the transportation processes, and the energy transportation processes.
2. Research Methods and Data
2.1. Car Ownership Forecasting Method
Research conducted by Tang, B. J. and others suggests that changes in passenger car ownership follow the Gompertz model and per capita car ownership per thousand people exhibits an S-shaped growth curve with increasing per capita income [
17,
18,
19]. This study employs the Gompertz model to forecast passenger car ownership, with the Gompertz curve equation as follows:
In this equation:
represents the passenger car ownership rate, measured in vehicles per person.
denotes per capita GDP, measured in thousands of yuan per person.
signifies the saturation level of passenger car ownership, derived primarily from pertinent literature and experiences in other regions [
20,
21].
and
are the model parameters estimated through data fitting using historical passenger car ownership rates and the per capita GDP of the current year.
According to research by Liu, Y. H. and others, the number of motor vehicles owned correlates closely with regional socio-economic development [
22]. Hence, this study utilizes the elasticity coefficient method to predict the ownership of other vehicle types (mid–large buses and trucks). It establishes the mathematical relationship between GDP growth and the growth of ownership of other vehicle types using the following equations:
In these equations: represents the year. is the ownership of a specific type of vehicle in Guangdong Province in the kth year, measured in vehicles. represents the growth rate of ownership of a specific type of vehicle in the kth year. signifies the elasticity coefficient. represents the growth rate of Guangdong Province’s GDP in the kth year. represents the growth rate of ownership of a specific type of vehicle in the jth year. represents the growth rate of Guangdong Province’s GDP in the jth year.
2.2. Method for Calculating Energy Consumption during the Usage Phase of Automobiles
The energy consumption during the target year of automobile usage is determined based on the average energy consumption per vehicle using the following formula:
In this equation: represents the energy consumption (electricity or fuel) for a specific type of vehicle in the kth year, measured in kW·h or kg. indicates the number of vehicles of a specific type in operation in the kth year, measured in vehicles. stands for the energy consumption per unit distance traveled by a specific type of vehicle, measured in kW·h/100 km or kg/100 km. represents the annual average mileage of a specific type of vehicle, measured in kilometers.
2.3. Method for Calculating CO2 Emissions during the Fuel Cycle of Automobiles
- (1)
Method for Calculating CO2 Emissions from Upstream Energy Production
The annual CO
2 emissions during the production of vehicle energy are computed as per the following formula:
In this equation:
represents the annual CO
2 emissions during the production of vehicle energy (electricity or fuel), measured in tons per year.
signifies the production volume of vehicle energy in the kth year, measured in kW·h or kg. It assumes a comprehensive conversion rate of electricity generation between power plants and electric vehicle usage of 90%.
denotes the CO
2 emission coefficient for the production of a unit product in the i category of vehicle energy. Based on research and references to the work of Xu, N., Rao, Q., and others, this study assumes a CO
2 emission coefficient of 815 gCO
2/kW·h for coal-fired power plants and 335 gCO
2/kW·h for gas-fired power plants [
23,
24]. Additionally, based on research by Zhao, J. and others, this study adopts a CO
2 emission coefficient of 403 gCO
2/kg for gasoline production and 168 gCO
2/kg for diesel fuel production [
25].
- (2)
Method for Calculating CO2 Emissions during the Operational Phase
The annual CO
2 emissions during the usage of ICVs are calculated as per the following formula:
In this equation:
represents the annual CO
2 emissions during the usage phase of a specific type of motor vehicle in the kth year, measured in tons per year.
denotes the annual fuel consumption of a specific type of vehicle in the kth year, measured in kg per year.
represents the CO
2 emission coefficient for the use of a unit of fuel. It is calculated using the formula:
In this formula: i represents the type of fuel (gasoline, diesel). signifies the unit fuel consumption, measured in tons. denotes the lower heating value of the fuel, measured in TJ per ten thousand tons. represents the carbon content in the fuel’s lower heating value, measured in tons of carbon per TJ. stands for the fixed carbon content, measured in tons. represents the carbon oxidation rate during the combustion of fossil fuels, measured as a percentage. This study calculates the CO2 emission factor for gasoline as 3.04 kgCO2/kg of fuel and for diesel as 3.15 kgCO2/kg of fuel.
2.4. Data Sources
- (1)
Car Ownership and Socioeconomic Data
Historical data related to car ownership in Guangdong Province, Guangdong’s GDP, urban population, and other pertinent information are primarily sourced from statistical data published in various editions of the “Guangdong Statistical Yearbook” and “Guangdong National Economic and Social Development Statistics Bulletin” for the respective historical years. Information concerning fleet energy structures and emission standards is obtained through collaborative research with relevant government departments. Data on Guangdong Province’s electricity generation structure is drawn from policy documents such as the “Guangdong Province Strategic Emerging Industry Cluster Action Plan for Cultivating New Energy (2021–2025)” and the “Guangdong Province Energy Development 14th Five-Year Plan.”
- (2)
Car Activity Level Data
The annual average mileage (VKT) of different vehicle types in Guangdong Province references recommended values from the “Technical Guidelines for Compiling Road Motor Vehicle Emission Inventories” issued by the Ministry of Ecology and Environment of the People’s Republic of China and research results related to the annual average mileage of passenger cars (PCs) by the China Automotive Technology Research Center in Tianjin, China [
26,
27]. The study further incorporates localized adjustments based on a sample survey of registration and accumulated mileage data recorded during the periodic environmental inspection of motor vehicles.
To establish more accurate energy consumption levels, this study refines actual unit mileage energy consumption data for different vehicle types in Guangdong Province, referencing energy consumption test data for vehicles under standard conditions in China. It then applies adjustments to estimate real-world driving energy consumption, drawing correction factors from research by Wu, R., Liu, S., Tian, W., and others [
28,
29,
30,
31]. For a more realistic assessment, actual unit mileage energy consumption for different vehicle types is further refined based on data from prominent platforms such as the Xiaoxiongyouhao website (
https://www.xiaoxiongyouhao.com, accessed on 16 December 2023), coupled with data collected through sample surveys of typical vehicles.
3. Scenario Design
This study takes 2020 as the benchmark year and employs scenario analysis to forecast and examine carbon emissions from the fuel cycle of automobiles in Guangdong Province between 2020 and 2035. Two distinct development scenarios are established to compare the trends in CO2 emissions from the fuel cycle of automobiles in Guangdong Province under different low-carbon development strategies: the baseline scenario (BS) and the enhancement scenario (ES). The BS is grounded in historical trends in automobile development in Guangdong Province and the planning and development objectives introduced by the national and Guangdong provincial governments. It represents a development scenario based on established policies. The ES, building upon the baseline scenario, accelerates the market penetration rate of NEVs, further improves energy efficiency, and expedites the development of renewable electricity. This scenario is founded on the aspiration to achieve carbon peaking in the transportation sector. Considering factors such as technological advancement and promotion strategies, this study assumes that all new or replacement NEVs introduced in Guangdong Province before 2035 will be purely electric vehicles (Evs).
In the BS, by 2025, 2030, and 2035, the proportion of NEVs in the sales of PCs and commercial vehicles (CVs) in Guangdong Province is projected to reach 21% and 43%, 71% and 17%, and 24% and 30%, respectively. The average fuel consumption of internal combustion engine passenger cars (ICV-PCs) is anticipated to decrease by 5%, 10%, and 17% compared to 2020. Similarly, internal combustion engine light-duty trucks (ICV-LTs) are expected to see a reduction of 5%, 11%, and 19%; internal combustion engine medium- and heavy-duty trucks (ICV-MHTs) will see a reduction of 6%, 12%, and 20%; and internal combustion engine medium- and large-sized buses (ICV-MLBs) will see a reduction of 3%, 8%, and 16%. In the case of purely electric passenger cars (EV-PCs), the average electricity consumption is anticipated to decrease by 2%, 5%, and 10% while for purely electric commercial vehicles (EV-CVs), it is expected to decrease by 1%, 3%, and 7%. The VKT for PC fleets is predicted to decrease by 3.0%, 5.5%, and 6.9%, with light-duty trucks (LTs) projected to see a decrease of 2.0%, 4.0%, and 6.0%. For medium- and heavy-duty trucks (MHTs), a reduction of 3.5%, 5.5%, and 7.5% is expected, while medium- and large-sized buses (MLBs) are foreseen to decrease by 3.0%, 5.0%, and 7.0%. In the electricity structure of Guangdong Province, coal, gas, and non-fossil fuel power generation (including transmission from western to eastern regions) are expected to account for 30%, 17%, and 53%; 24%, 18%, and 58%; and 18%, 19%, and 63%, respectively.
In the ES, by 2025, 2030, and 2035, the penetration rate of NEVs in PCs and CVs is expected to reach 26% and 53%, 83% and 18%, and 30% and 42%, respectively. The average fuel consumption of ICV-PCs, ICV-LTs, ICV-MHTs, and ICV-MLBs is projected to decrease by 7%, 14%, and 22%; 6%, 14%, and 23%; 8%, 15%, and 25%; and 4%, 11%, and 21%, respectively, compared to 2020. The average electricity consumption of EV-PCs and EV-CVs is expected to decrease by 3%, 6%, and 12% and 2%, 4%, and 8%, respectively, compared to 2020. The VKT for PCs, LTs, MHTs, and MLBs is expected to decrease by 4.5%, 7.0%, and 8.5%; 2.4%, 6.1%, and 12.9%; 3.9%, 7.6%, and 14.2%; and 14.0%, 16.5%, and 20.4%, respectively, compared to 2020. In the electricity structure of Guangdong Province, coal, gas, and non-fossil fuel power generation are projected to account for 28%, 18%, and 54%; 22%, 19%, and 59%; and 16%, 19%, and 65%, respectively.
In both the BS and ES, the average energy consumption reduction for taxis aligns with that of PCs, while the energy consumption reduction for public buses (PBs) corresponds to that of MLBs. In addition, during the period from 2020 to 2035, the VKT for both vehicle types remains constant.
Table 1 outlines the key parameters for the two scenarios.
4. Results and Discussion
4.1. Trends and Characteristics of Vehicle Ownership
Figure 2 illustrates the predicted trends in vehicle ownership in Guangdong Province. By 2035, the overall trend shows a substantial increase, with the total number of vehicles exceeding 48 million, nearly doubling the 2020 figure. The ICV ownership in Guangdong Province exhibits an initial increase followed by a decline. In the BS, it peaks around 2030 and gradually decreases thereafter. However, by 2035, the number of ICVs remains over 30% higher than in 2020. In the ES, the growth of ICVs is relatively slower in the early stages compared to the BS and the decline post-peak is more significant. Nevertheless, even in this scenario, the ICV ownership is projected to peak around 2030 and increase by over 15% compared to 2020 by 2035. The EV ownership in Guangdong Province continues to experience rapid growth. In the BS, by 2035, the number of EVs has surged by approximately 25 times compared to 2020. In the ES, the growth of EVs is even more substantial, with the number increasing nearly 30 times compared to 2020.
Figure 3 shows the predicted results of different vehicle types in Guangdong Province. In the BS, by 2035, EV-PCs constitute over one-third of PCs, while EV-MHTs represent less than 10%. In the ES, by 2035, EV-PCs surpass 40%, while EV-MHTs make up roughly 11%. It is clear that the electrification of vehicles in Guangdong Province is primarily concentrated on PCs, with EV-CVs growing significantly but maintaining a relatively low overall share.
4.2. Trends and Characteristics of Vehicle Energy Consumption
Figure 4 showcases the predicted trends in vehicle energy consumption in Guangdong Province. Gasoline and diesel consumption for automotive use exhibit initial growth followed by a gradual decline. On the contrary, electricity consumption shows continuous and rapid growth. This aligns with the transition from ICVs to EVs. In the BS, gasoline consumption reaches its peak in 2029, with diesel consumption peaking in 2028. By 2035, gasoline consumption has only increased by less than 2% and diesel consumption has decreased by about 1% compared to 2020 due to reductions in per-vehicle fuel consumption and VKT. Meanwhile, electricity consumption maintains rapid growth, exceeding five times the 2020 levels by 2035. With the exception of PBs and taxis, the electricity consumption of all other vehicle types has seen significant increases. The electricity consumption of EV-PCs has increased by more than 30 times. In the ES, gasoline and diesel consumption peaks in 2027 and 2026, respectively, with peak values reduced by 2.049 million tons and 0.653 million tons compared to the BS. By 2035, due to a significant reduction in per-vehicle fuel consumption, the consumption of gasoline and diesel decreases by about 17% compared to 2020. In contrast to the BS, electricity consumption experiences more significant growth in the ES. Compared to 2020, electricity consumption in 2035 increases by over six times, with passenger cars contributing to over thirty-six times the electricity consumption. Except for PBs, taxis, and MLBs, the electricity consumption of other vehicle types has increased significantly compared to the BS.
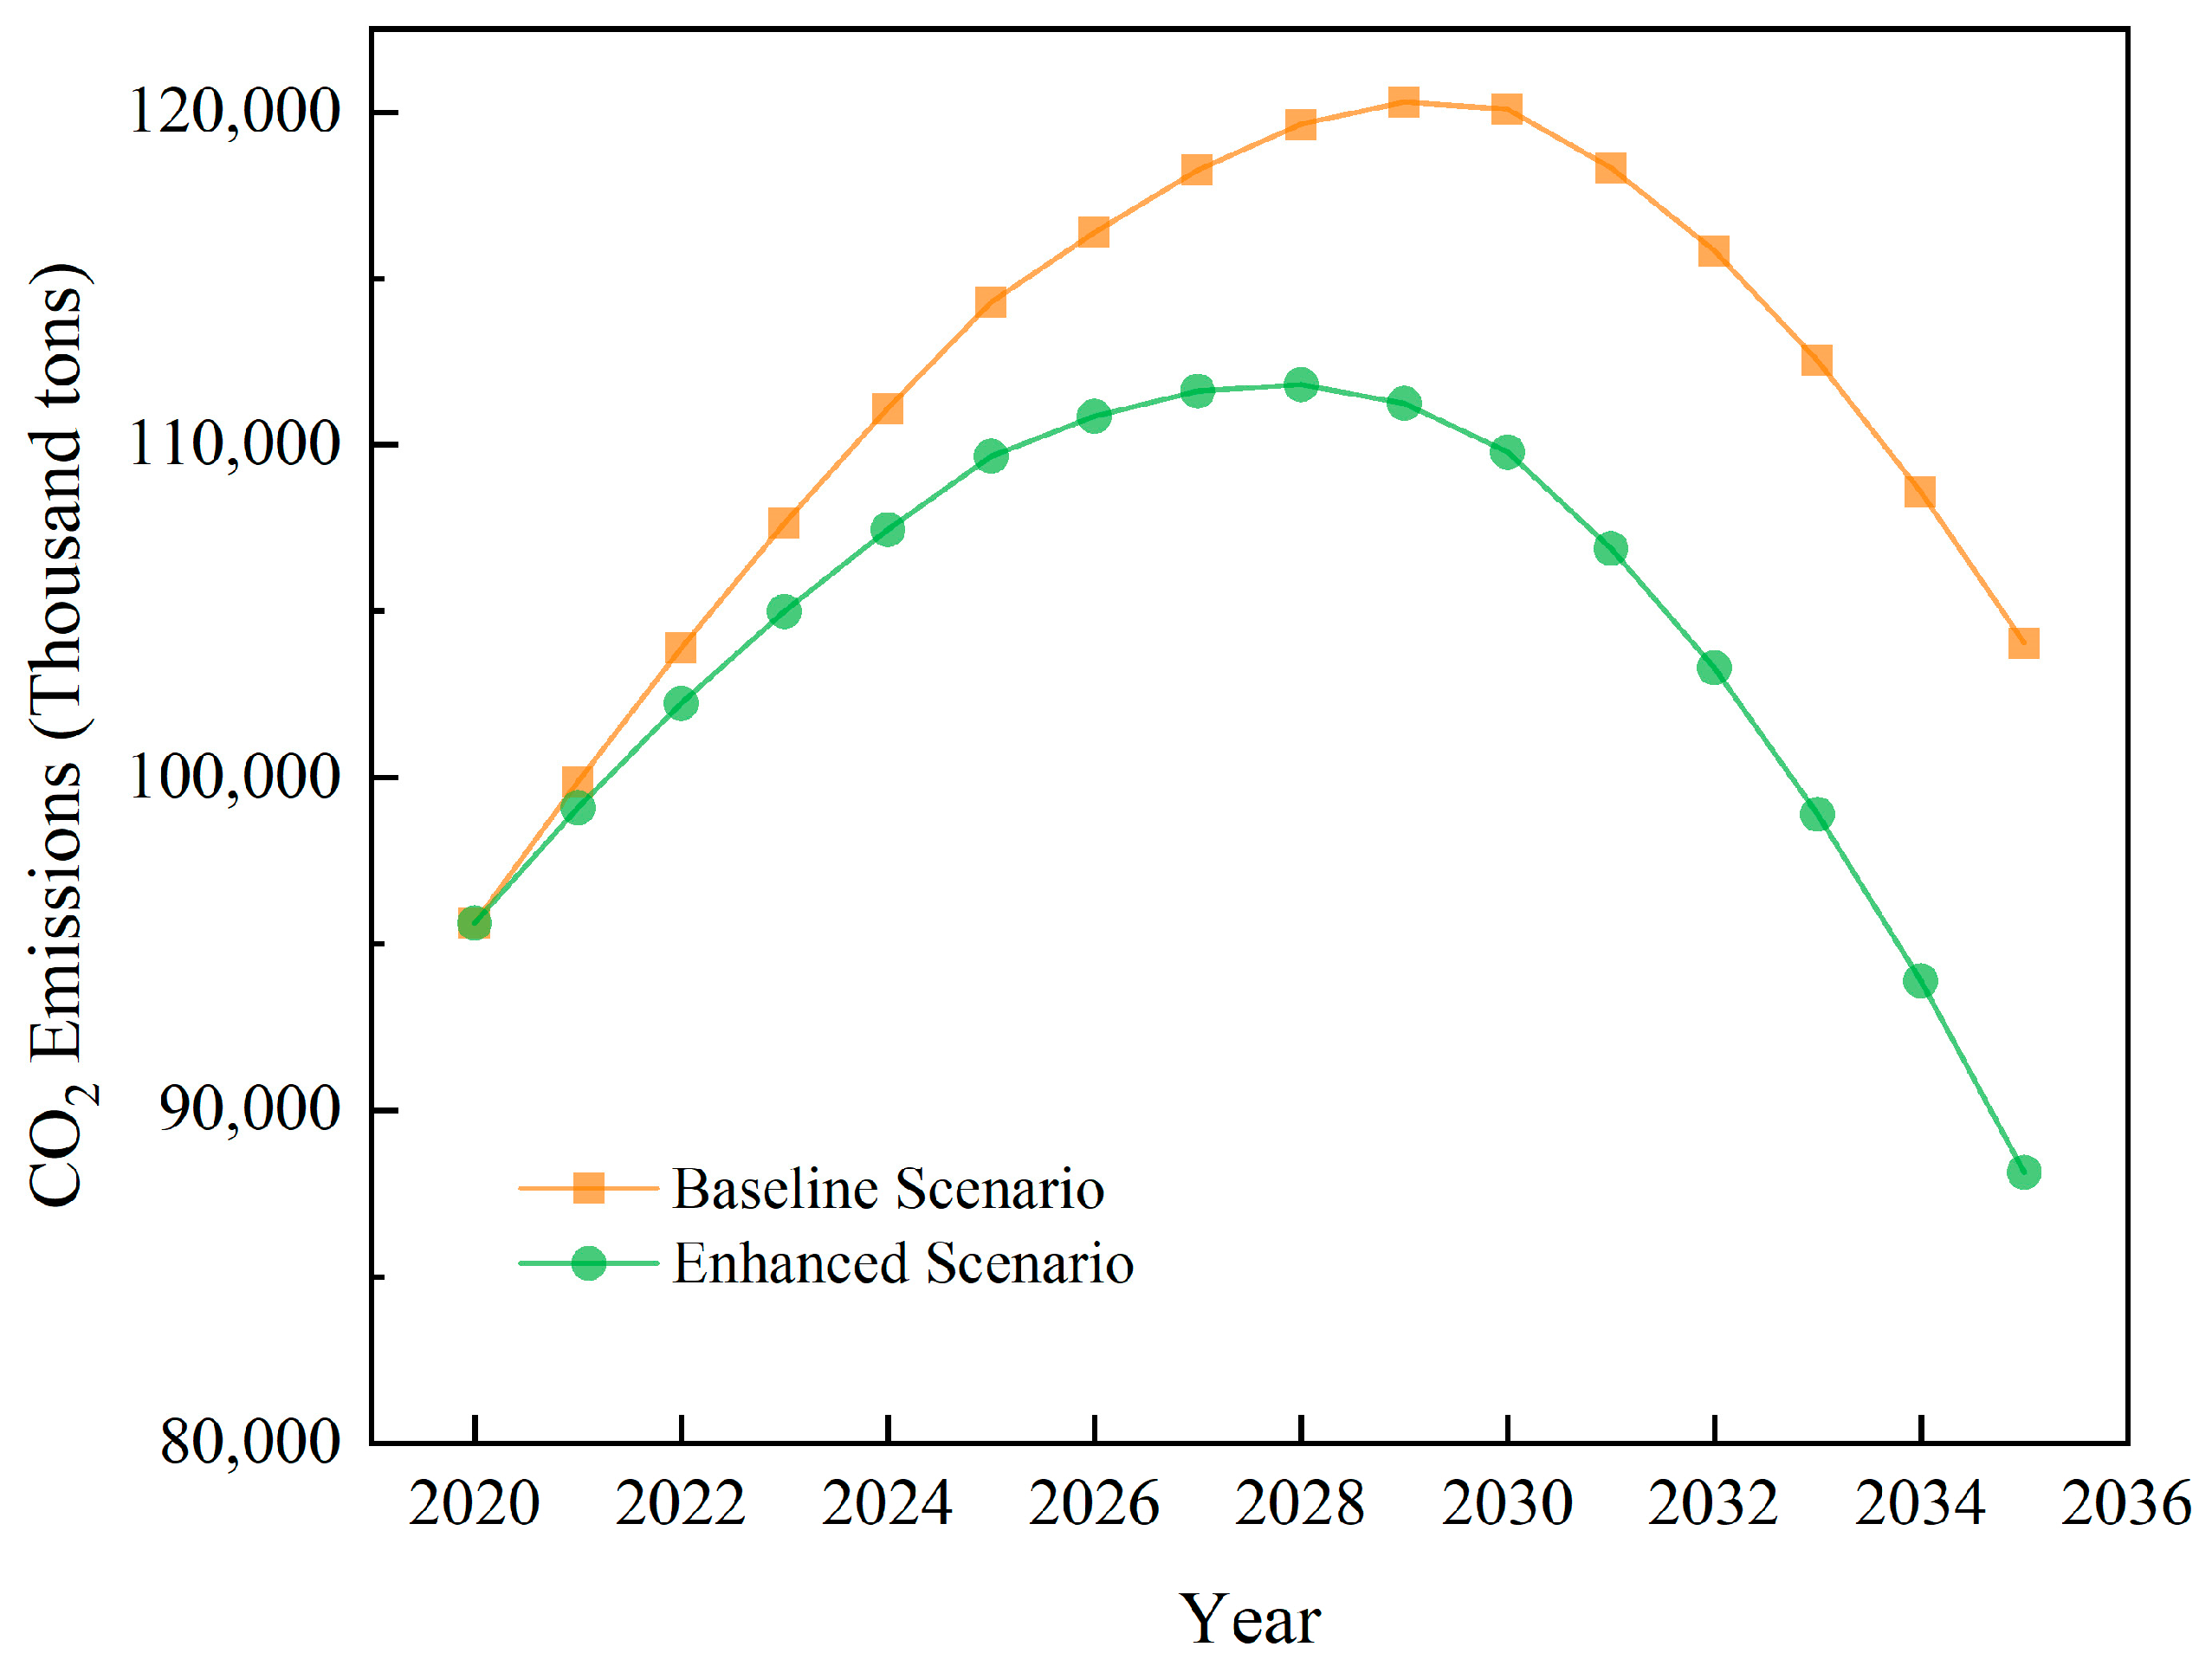
4.3. Trends and Characteristics of Carbon Emissions from the Vehicle Fuel Cycle
Figure 5 presents the predicted results for carbon emissions from the vehicle fuel cycle in Guangdong Province. In the BS, these emissions reach their peak in 2029 at around 120 million tons of CO
2. Subsequently, they begin a gradual decline, falling to approximately 100 million tons by 2035. This represents a decrease of about 13.5% from the peak but is still more than 8% higher than in 2020. In the ES, carbon emissions peak in 2028 at around 110 million tons of CO
2, roughly 85% of the emissions in the BS for the same period. After reaching the peak, CO
2 emissions decrease rapidly, reaching about 90 million tons by 2035, which is a decrease of around 21.2% from the peak and an 8% decrease from 2020. Maintaining a constant total stock of motor vehicles, the substitution of a greater number of ICVs with PEVs not only accelerates the peak timing of CO
2 emissions in the automotive fuel cycle but also leads to a reduction in the peak magnitude of CO
2 emissions.
Figure 6 reveals the composition of carbon emissions from the vehicle fuel cycle. In both scenarios, CO
2 emissions from the operational phase of the fuel cycle remain the primary contributor to carbon emissions. In the BS, carbon emissions from the fuel cycle operation phase account for over 80%, even in 2035, while in the ES, it remains above 78%. In the BS, the CO
2 emissions from the fuel cycle operation phase are projected to peak in 2029, whereas in the ES, the peak is anticipated to occur earlier in 2027, aligning with the peak in gasoline consumption. This indicates that these emissions are primarily driven by ICV-PCs. While both scenarios show rapid growth in carbon emissions from electricity production, by 2035, the BS attributes only about 10% of emissions to electricity production while the ES attributes about 12% to it. Thus, the production and use of gasoline and diesel fuels are expected to remain the primary sources of carbon emissions from the vehicle fuel cycle for a significant period, emphasizing the need for carbon reduction in ICV use.
Figure 7 illustrates the percentage of carbon emissions from different vehicle types in the vehicle fuel cycle. In both scenarios, PCs continue to be the major contributors to carbon emissions from the vehicle fuel cycle, accounting for over 50% of emissions. MHTs follow, with a share of approximately one-fourth, while LTs represent about 12% in both scenarios. The combined emissions from these three vehicle types already exceed 95%, with a slight increase over time. This underscores that PCs and MHTs will remain the primary sources of carbon emissions from the vehicle fuel cycle in Guangdong Province for a significant period. Reducing the use of these vehicles is crucial for carbon emission reduction. One effective method to achieve urban transportation carbon reduction is to enhance the quality and coverage of public transportation services, fostering a diversified urban transportation system with public transportation as its main component, reducing residents’ reliance on private cars [
32]. Structural transportation adjustments like “road-to-rail transport” and “road-to-water transport “options can reduce road freight volume and the use of MHTs and also play a significant role in reducing carbon emissions from road transportation [
33].
4.4. Main Factors Influencing Carbon Emissions from Vehicles and Reduction Paths
Carbon emissions from the vehicle fuel cycle are directly linked to the energy consumption of vehicles. The most significant factors are vehicle energy types, average energy consumption, and VKT. Among these, the energy type of the vehicles and their actual average energy consumption are the most impactful [
34]. As shown in
Figure 8, per-vehicle annual average CO
2 emissions from PEVs are significantly lower than those from ICVs of the same type. In 2020, the per-vehicle annual CO
2 emissions for various types of PEVs ranged from only 30% (PCs) to 58% (MHTs) compared to their ICV counterparts. By 2035, in the BS, these emissions are further reduced to 22% (PCs) to 42% (MHTs) of ICVs. In the ES, these proportions are further reduced to 21% (PCs) to 41% (MHTs). The ES exhibits significantly lower carbon emissions from the vehicle fuel cycle compared to the BS in 2035, largely attributed to replacing more ICVs with PEVs. Given the lower per-vehicle CO
2 emissions in the fuel cycle of PEVs, accelerating the promotion and use of NEVs, especially PEVs, is a pivotal pathway to achieving carbon peak emissions from vehicles [
35,
36].
By 2035, per-vehicle annual average CO
2 emissions from ICVs in the BS have decreased by about one-fifth compared to 2020. In the ES, the reduction is even more significant, reaching about one-third. This reduction is due to the combined effect of decreasing per-vehicle average fuel consumption and VKT. By 2035, despite a significant increase in the overall stock of ICVs compared to 2020, the carbon emissions during the operational phase of these vehicles experience only a slight rise or even demonstrate a noticeable decrease. Promoting energy-saving technologies, like hybrid systems, and transitioning road transport to rail transport to reduce the use of ICVs are essential strategies for promoting carbon emissions reduction and driving towards carbon peaking. However, achieving fuel efficiency improvement goals may require additional incentive measures and strict monitoring [
37].
In the BS, per-vehicle annual average CO
2 emissions from PEVs have decreased by about two-fifths compared to 2020 by 2035. In the ES, the reduction is even more significant, reaching about half. This reduction is attributed not only to the continuous decrease in per-vehicle average electricity consumption and VKT but also to the ongoing optimization of the power structure and the increasing share of non-fossil energy sources for electricity production. Therefore, vigorously developing non-fossil energy sources, such as wind and photovoltaic power, to replace traditional coal and gas power generation is also a crucial pathway for reducing carbon emissions from vehicles. As highlighted in the research of Zhang, X. and others, achieving peak carbon emissions from transportation requires clean energy sources alongside the development of clean transportation tools [
38].
5. Conclusions
In this study, a comprehensive analysis of vehicle ownership, vehicle energy consumption, and carbon emissions from the vehicle fuel cycle in Guangdong Province was undertaken from 2020 to 2035. Simultaneously, a comprehensive analysis was conducted on the primary influencing factors and emission reduction pathways for automotive carbon emissions in Guangdong Province. The key findings are as follows:
- (1)
Vehicle Ownership and Energy Consumption
Vehicle ownership in Guangdong Province exhibits a consistent upward trend, with the total number of vehicles surpassing 48 million by 2035, nearly doubling from 2020. ICV ownership, as projected in both scenarios, reaches its zenith around 2030 before gradually declining. PEV ownership continues to soar, constituting over 40% of the total by 2035 in the ES. The consumption of gasoline and diesel shows an initial increase followed by a subsequent decrease. Primarily due to improvements in average fuel consumption and reduced VKT, under the ES, fuel consumption for gasoline and diesel in 2035 decreases by approximately 17% compared to 2020. In contrast, electricity consumption for vehicles continues to rise, with both baseline and enhanced scenarios predicting a five- to six-fold increase compared to 2020.
- (2)
Carbon Emissions from the Vehicle Fuel Cycle
In both the BS and ES, Guangdong Province is expected to achieve a peak in carbon emissions from the vehicle fuel cycle before 2030. The BS reaches its peak in 2029, while the ES achieves the peak in 2028, one year earlier. In the ES, the peak carbon emissions from the vehicle fuel cycle are approximately 1.1 billion tons of CO2, equivalent to 93% of the peak emissions in the BS for the same period. Carbon emissions in the BS decrease by about 13.5% compared to the peak but still grow by over 8% relative to 2020. In the ES, carbon emissions in 2035 are reduced by about 21.2% compared to the peak and by around 8% relative to 2020. In the ES, not only was the peaking achieved ahead of schedule but there was also a reduction in the peak magnitude.
- (3)
Influencing Factors of Carbon Peaking
Carbon emissions per vehicle from the fuel cycle for PEVs are significantly lower than their ICV counterparts. Accelerating the adoption of NEVs, especially PEVs, can advance the peak of carbon emissions from the vehicle fuel cycle and lower the peak emissions. Reducing average energy consumption and VKT for vehicles and transitioning road transport to alternative modes are effective methods to lower carbon emissions in the active fleet. These actions are critical for achieving carbon peak emissions from the vehicle fuel cycle.
- (4)
External Influencing Factors of Carbon Peaking
Achieving improved per-vehicle energy consumption is pivotal for reaching carbon peak emissions from the vehicle fuel cycle. Strict regulatory measures are necessary to ensure the timely realization of energy efficiency goals. To fully harness the role of promoting PEVs in achieving the carbon peak in the vehicle fuel cycle, it is essential to enhance the ecological profile of the electricity supply. This necessitates accelerating the substitution of traditional coal and gas power generation with non-fossil energy sources.
The findings above can be extrapolated beyond Guangdong Province. The trends observed in vehicle ownership, energy consumption, and carbon emissions can serve as valuable reference points for policymakers and researchers in other regions.
6. Policy Recommendations
To expedite Guangdong Province’s pursuit of its 2030 carbon peak goal and to provide a reference for promoting carbon peak in the transportation sector in other regions, the following policy recommendations are suggested based on the main conclusions of this study:
Given that PEVs produce significantly lower carbon emissions during the fuel cycle, it is recommended that Guangdong Province and other regions enact comprehensive policies to support the accelerated development of NEVs, especially PEVs. A multi-faceted strategy should be employed including the provision of incentives for vehicle purchases, reducing the permitted duration of conventional vehicle usage, and implementing route restrictions. These measures will incentivize the replacement of conventional ICVs with NEVs and promote their widespread adoption, with particular emphasis on the rapid proliferation of EV-MHTs.
- (2)
Optimization of Transportation Modes
As PCs and MHTs are the primary sources of carbon emissions from the vehicle fuel cycle in Guangdong Province, it is imperative to optimize the transportation structure. Measures should include investing in the development of urban and intercity rail transit, expanding the coverage of suburban and rural area public transportation, and enhancing the attractiveness of public transit to reduce reliance on private vehicles. At the same time, attention should be paid to the restructuring of transport, such as “water-to-water intermodal transport,” “bulk-to-container transport,” and “road-to-rail transport”, in order to reduce road freight and the use of MHTs. In regions where road transportation accounts for a high proportion of bulk cargo transport, accelerated implementation of measures such as “road-to-rail transportation” is equally essential to achieve the carbon peak target in the transportation sector.
- (3)
Technological Advances and Research
Whether at the national or provincial level, continued focus on research and development is paramount to meet the demands of carbon reduction in the vehicle fuel cycle. Areas of focus should encompass research into lightweight materials and energy-efficient technologies for vehicles, development and implementation of advanced battery materials, promotion of super-fast charging technology, and expansion of charging and battery-swapping infrastructure. Furthermore, investments in research and development of “green hydrogen” production technology and equipment should be intensified. Promoting non-fossil energy sources such as nuclear power, wind energy, solar energy, and other clean power generation technologies is also crucial.


