Article

Assessment of Heavy-Duty Diesel Vehicle NOx and CO2 Emissions Based on OBD Data

1
School of Mechanical Engineering, Beijing Institute of Technology, Beijing 100081, China
2
State Key Laboratory of Engine Reliability, Weichai Power Co., Ltd., Weifang 261061, China
3
Department of Energy Sciences, Lund University, 22363 Lund, Sweden
*
Authors to whom correspondence should be addressed.
Atmosphere 2023, 14(9), 1417; https://doi.org/10.3390/atmos14091417
Submission received: 16 August 2023 / Revised: 31 August 2023 / Accepted: 7 September 2023 / Published: 8 September 2023
(This article belongs to the Special Issue Traffic Related Emission (2nd Edition))

Abstract

:
Controlling NOx and CO2 emissions from heavy-duty diesel vehicles (HDDVs) is receiving increasing attention. Accurate measurement of HDDV NOx and CO2 emissions is the prerequisite for HDDV emission control. Vehicle emission regulations srecommend the measurement of NOx and CO2 emissions from vehicles using an emission analyzer, which is expensive and unsuitable to measure a large number of vehicles in a short time. The on-board diagnostics (OBD) data stream of HDDVs provides great convenience for calculating vehicle NOx and CO2 emissions by providing the engine fuel flow rate, NOx sensor output, and air mass flow. The calculated vehicle NOx and CO2 emissions based on the OBD data were validated by testing a heavy-duty truck’s emissions on the chassis dynamometer over the CHTC-HT driving cycle, showing that the calculated NOx and CO2 emissions based on the OBD data are consistent with the measured results by the emission analyzer. The calculated vehicle fuel consumptions based on the OBD data were close to the calculated results based on the carbon balance method and the measured results by the fuel flowmeter. The experimental results show that accessing vehicle NOx and CO2 emissions based on the OBD data is a convenient and applicable method.

1. Introduction

Vehicle exhaust contains hundreds of different compounds, becoming the main source of atmospheric pollution. Vehicle exhaust emissions are mostly concentrated at a low level about 1 m from the ground, which is near the human respiratory belt and is extremely harmful to human health, mainly reflected in the damage to human cells, decreased immunity, and susceptibility to respiratory and cardiovascular diseases [1,2,3]. The main pollutants controlled by vehicle emission standards are hydrocarbons (HC), carbon monoxide (CO), nitrogen oxides (NOx), and particulate matter (PM), among which the NOx and PM emissions of diesel vehicles account for 80% and 90% of the total vehicle emissions of NOx and PM, respectively [4]. In addition, NOx and PM are the main cause of haze and ozone formation in the atmosphere, which has a serious impact on human health, crop production, and climate [5]. In addition, the CO2 emitted by vehicles will cause the greenhouse effect, which will lead to an increase in the atmospheric temperature on the earth’s surface and cause a serious impact on the earth’s environment. Therefore, with the increase in vehicle ownership, the world automobile industry is facing great pressure to reduce greenhouse gas emissions and toxic pollutant emissions. Accordingly, vehicle emission regulations and fuel economy regulations are also being tightened in order to effectively reduce vehicle emissions and fuel consumption [4,6].
Since California established the world’s first vehicle emission regulation in 1966, the vehicle emission standards in the United States have been continuously tightened. The U.S. vehicle emission standard EPA 2010 was issued in 2001 and fully implemented in 2010. California adopted almost identical vehicle emission standards in October 2001 [7]. The European Union (EU) implemented the Euro I emission standard in 1992, and the latest Euro VI standard was implemented in 2013 [8]. China started relatively late in the field of emission regulations. It was only in 2001 that the China I emission standard was implemented nationwide, and stricter regulations were introduced successively. Since 2020, the China VI emission standard has been implemented nationwide [4].
In recent years, vehicle CO2 emissions have become increasingly concerning. In Europe, the CO2 emissions of heavy-duty vehicles (HDVs) (i.e., trucks and buses) account for about 25% of the total road transport CO2 emissions. Reducing CO2 emissions of HDVs is a critical priority in the European Union policy agenda [9,10]. In 2020, the average CO2 emissions were 107.8 g/km for passenger cars and 157.7 g/km for light-duty commercial vehicles in Europe. The sales-weighted CO2 emissions of passenger cars sold in 2025 and 2030 will be reduced by 15% and 37.5%, respectively. The CO2 emission reduction of light-duty commercial vehicles is about 15% and 31%. Compared with the 2019 CO2 emissions, the CO2 emissions of medium- and heavy-duty trucks need to be reduced by 15% and 30%, respectively, by 2025 and 2030 [11]. The targets for 2030 have been revised, with the proposed more ambitious reductions of CO2 emissions for cars and light trucks by 55% and 50%, respectively. By 2035, these two categories of vehicles need to reach the target of 100% carbon emission reduction.
A similar situation also exists in the United States. HDVs account for a small proportion of the vehicle fleet in use, but they are responsible for 22.8% of the CO2 emissions from road traffic [12]. The regulations on vehicle fuel economy in the United States were issued with the signing of the Energy Independence and Security Act in 2007. In addition to improving the average fuel economy of light-duty vehicles, the Act also proposed the formulation of fuel economy standards for medium- and heavy-duty vehicles in the United States. Later, the United States successively issued regulations on fuel economy and greenhouse gas emissions of medium- and heavy-duty vehicles and engines. The latest fuel economy regulations require that from 2021 to 2027 the phased-in fuel economy standards reduce CO2 emissions and fuel consumption by 8 to 16 percent for combined tractors, trailers, occupational vehicles, and trucks based on the average level of the 2017 model year [13].
In China, the first, second, and third phases of the fuel economy limit for heavy-duty commercial vehicles were implemented in 2012, 2014, and 2019 respectively, which played an essential role in reducing the fuel consumption of heavy-duty commercial vehicles, effectively promoted the introduction, application, and development of advanced energy-saving technologies, and significantly improved the fuel economy of heavy-duty commercial vehicles and reduced their carbon emissions. In 2025, the fuel consumption limits of China’s commercial vehicles in the fourth phase will be tightened by 12% to 16% based on the standard limit in the third phase of 2018 [14]. At the same time, the vehicle test cycle is also built based on the actual road driving conditions of Chinese vehicles. To coordinate the future vehicle fuel economy and emission standards, the measurement and calculation methods of fuel consumption and CO2 emissions are added [15,16].
As the main freight vehicle, diesel vehicles account for a high proportion of the total fuel consumption and pollution emissions of vehicles and have received more attention. Because the CO and HC emissions of diesel vehicles are very low, the main concern is the NOx and PM emissions of diesel vehicles. At present, a diesel particulate filter (DPF) can effectively reduce the PM emissions of diesel vehicles [17], while the diesel SCR after-treatment system is often affected by the operation conditions and deterioration status, the risk of vehicle NOx emission exceeding the standard is high, and the NOx emissions during actual road driving are very easy to exceed the emission standard [18,19]. Therefore, NOx emission is the main concern for diesel vehicle emission control. Therefore, the NOx sensor is used to detect the concentration of NOx and uses the electrochemical principle to measure the NOx content in the vehicle exhaust gas by measuring the current. The output signal of the NOx sensor is sent to the CAN bus through the NOx sensor control unit and will be used for the closed-loop control of the vehicle’s NOx emissions by controlling the amount of urea injected into the exhaust system. Many environmental factors may affect the detection accuracy of the NOx sensor. Not only does the concentration of NOx in the exhaust change, but the parameters such as exhaust pressure, humidity, and temperature also change with the engine’s working conditions. Therefore, the detection accuracy and stability of the NOx sensor have a significant impact on the effectiveness of NOx emission monitoring and control.
The vehicle emission control system has no CO2 sensor. Based on the combustion mechanism of diesel engines, the equivalent emission of CO2 can be calculated according to vehicle fuel consumption. The fuel flow data provided by the vehicle engine OBD data stream is an important reference parameter for the prediction of engine torque output, vehicle fuel consumption, and vehicle CO2 emission. The calculation accuracy of fuel flow is also affected by many factors. At present, the electronically controlled fuel injection system is widely used in diesel vehicle engines. The electronic control unit (ECU) controls the fuel injection quantity of the engine by controlling the switching time of the fuel injector according to engine operating conditions. Ideally, knowing the fuel injection quantity per cylinder controlled by ECU, the vehicle’s fuel flow rate can be calculated by relating the engine speed and other data. However, due to the complex hydraulic process of the fuel injection system, injection pressure fluctuation, nozzle orifice throttling characteristics, electrical and mechanical inertia delay of the solenoid valve (the needle valve of the injector has a nozzle opening delay and a nozzle closure delay), and other factors [20,21], the actual fuel injection quantity is usually inconsistent with the target injection quantity. In particular, in order to reduce PM and NOx emissions, the diesel engine ECU optimizes the fuel injection control strategy and improves the diesel engine combustion process through flexible adjustment of fuel injection rate and multiple injection capability [22,23]; all of these measures further increase the difficulty of precise control of fuel injection quantity. In many cases, researchers cannot access the fuel injection quantity data from the engine ECU without special scanning tools. Therefore, researchers usually use test or model simulation methods to evaluate vehicle fuel consumption, CO2 emissions, and other pollutant emissions.
At present, the standard method for testing vehicle NOx and CO2 emissions is to use the emission analyzer to test the vehicle through a chassis dynamometer or through an on-road driving emission test [21,24,25]. However, the cost of emission test equipment is high, the test operation is complex and time-consuming, and it is unsuitable to measure a large number of vehicles in a short time. Meanwhile, on-board diagnostics (OBD) emerged with the development of vehicle electronic control technology and can monitor vehicle emissions with good economic benefits and cost advantages [26,27]. For heavy-duty diesel vehicles in China, remote OBD is required to monitor vehicle emissions during real-road driving. The vehicle OBD system monitors vehicle parameters and sends the required data related to engine emissions through the data stream, including vehicle speed, engine speed, engine output torque (for example, calculated based on the amount of fuel injected), engine fuel flow rate, NOx sensor output, air mass flow, and other data. Based on the OBD data, the diesel vehicle NOx and CO2 emissions can be estimated and used to evaluate the vehicle emission level. Zhang et al. used vehicle engine OBD parameters and emission sensor data to study the on-board monitoring (OBM) system for emissions monitoring of heavy-duty diesel vehicles (HDDVs) in China [28]. They also tested eight HDDVs equipped with OBM on the road using a portable emission measurement system (PEMS). Most of the experimental results showed good consistency between OBM and PEMS results. This early assessment suggests that the OBM method may play a core role in China’s HDDV emission monitoring. Regulatory agencies should focus on the data integrity and reliability of NOx sensors by developing effective verification procedures.
Vehicle on-board monitoring (OBM) and on-board fuel and energy consumption monitoring (OBFCM) are important technologies for future vehicle fuel consumption and emission monitoring [29]. OBM requires emission sensors to accurately detect vehicle emissions, and the fuel consumption and net output torque of the engine are calculated based on the engine fuel flow rate. The accuracy of emission sensor signals and the fuel flow rate provided by the engine OBD data stream need to be evaluated. This study aims to evaluate the feasibility of using OBD data in future vehicle on-board monitoring (OBM) and vehicle fuel and energy consumption monitoring (OBFCM) data calculations. In the past, the vehicle NOx and CO2 emissions are usually measured by the emission analyzer. Few works of the literature related to the study of diesel vehicle NOx and CO2 emissions are based on the OBD data. In this study, the NOx and CO2 emissions of a heavy-duty truck calculated based on OBD data were validated by testing the vehicle emissions and fuel consumption on the chassis dynamometer over the CHTC-HT driving cycle. The calculated NOx and CO2 emissions based on OBD data were compared with the results measured by the emission analyzer. Meanwhile, the vehicle fuel consumptions calculated using OBD data were compared with the measured results by the fuel flowmeter and the calculated results based on the carbon balance method. The accuracy and convenience of calculating NOx and CO2 emissions based on OBD data were verified.

2. Materials and Methods

2.1. Vehicle NOx and CO2 Emissions Calculation Based on OBD Data

The output of the NOx sensor installed downstream of the SCR catalyst, engine fuel flow rate, and air mass flow in the OBD data stream for heavy-duty diesel vehicles were used to calculate NOx emissions, and the engine fuel flow and air mass flow are used to calculate the engine’s instantaneous exhaust flow. Therefore, the mass emission rate of NOx is calculated by the NOx concentration downstream of the SCR catalyst and the instantaneous vehicle exhaust flow rate.
m NOx = M NOx 1000 M e · C NOx · m e
where m NOx is the mass emission rate of NOx, g·s−1; M NOx is the molar mass of NOx , g·mol−1;   M e is the molar mass of the exhaust gas, g·mol−1; C NOx is the instantaneous NOx concentration in the exhaust gas measured by the NOx sensor installed downstream of the SCR catalyst, 10−6 (ppm); m e is the instantaneous exhaust mass flow, kg·s−1; and t 0 and t c are the start and end times of the test cycle.
According to the engine fuel injection control strategy, the engine ECU records the fuel injection quantity of each cylinder and calculates the real-time fuel flow rate, which can be sent to the vehicle CAN bus and can be accessed as the standardized OBD information. The fuel flow rate is defined as
m f ˙ = q · n · i / 30 τ
where m f ˙ is the fuel flow rate, g·s−1; q is the fuel injection quantity per cylinder per cycle, g; n is the engine speed, r·min−1; i is the number of engine cylinders; and τ is the number of engine strokes per operating cycle.
The mass emission rate of CO2 can be calculated as
m CO 2 ˙ = k CO 2 · m f ˙
where k CO 2 is the mass coefficient of diesel fuel and CO2 generated; k CO 2 can be obtained by calculating the ratio of CO2 emission mass to the total fuel consumption mass over the entire emission test cycle, which is the CHTC-HT driving cycle in this study, and the calculated value of k CO 2 is 3.186. The CHTC-HT driving cycle includes various vehicle driving conditions, so the calculated coefficient of k CO 2 is representative and applicable.
According to the emission regulations and engine fuel injection control strategy, the engine fuel flow rate sent by ECU to the CAN bus indicates the calculated amount of fuel consumed only by the engine in grams per 1 s and does not include fuel injected directly into the after-treatment system. Meanwhile, the vehicle fuel flow rate refers to the total amount of fuel consumed by the engine and fuel injected directly into the after-treatment system per unit of time in grams per 1 s. For the test vehicle of this study, there was no fuel injected directly into the after-treatment system. Therefore, the vehicle fuel flow rate equals the engine fuel flow rate, which is calculated as the sum of the fuel consumed over the last 1000 milliseconds. The engine fuel flow rate is usually updated at the rate of 1 s. The engine fuel flow rate and the vehicle fuel flow rate are assigned as zero g·s−1 when the engine is not running.
The mass emissions of NOx or CO2 can be calculated by integrating the instantaneous emission rate over the test cycle.
m i = t 0 t c m I
where m i is the mass emission of NOx or CO2 over the test cycle, g; t 0 and t c are the start and end times of the test cycle.
The vehicle’s total travel distance over the test cycle can be calculated by
S = t 0 t c v d t · 10 3
where S is the vehicle’s total travel distance, km; v is the vehicle speed, m·s−1.
The diesel vehicle NOx or CO2 mass emissions per kilometer over the whole test cycle can be calculated by
F i = m i S
where F i is the mass emission per kilometer during the whole test cycle, g/km; m i represents the total emission of NOx or CO2 over the whole test cycle.

2.2. Validation of the Vehicle Emission Calculation Method Based on OBD Data

In order to verify the accuracy of vehicle NOx and CO2 emissions calculated based on OBD data, a heavy-duty diesel truck was tested on a chassis dynamometer, and the vehicle emissions and fuel consumption test was conducted at the same time as the OBD data was collected so as to compare the NOx and CO2 emissions calculated based on OBD data with the measured results.

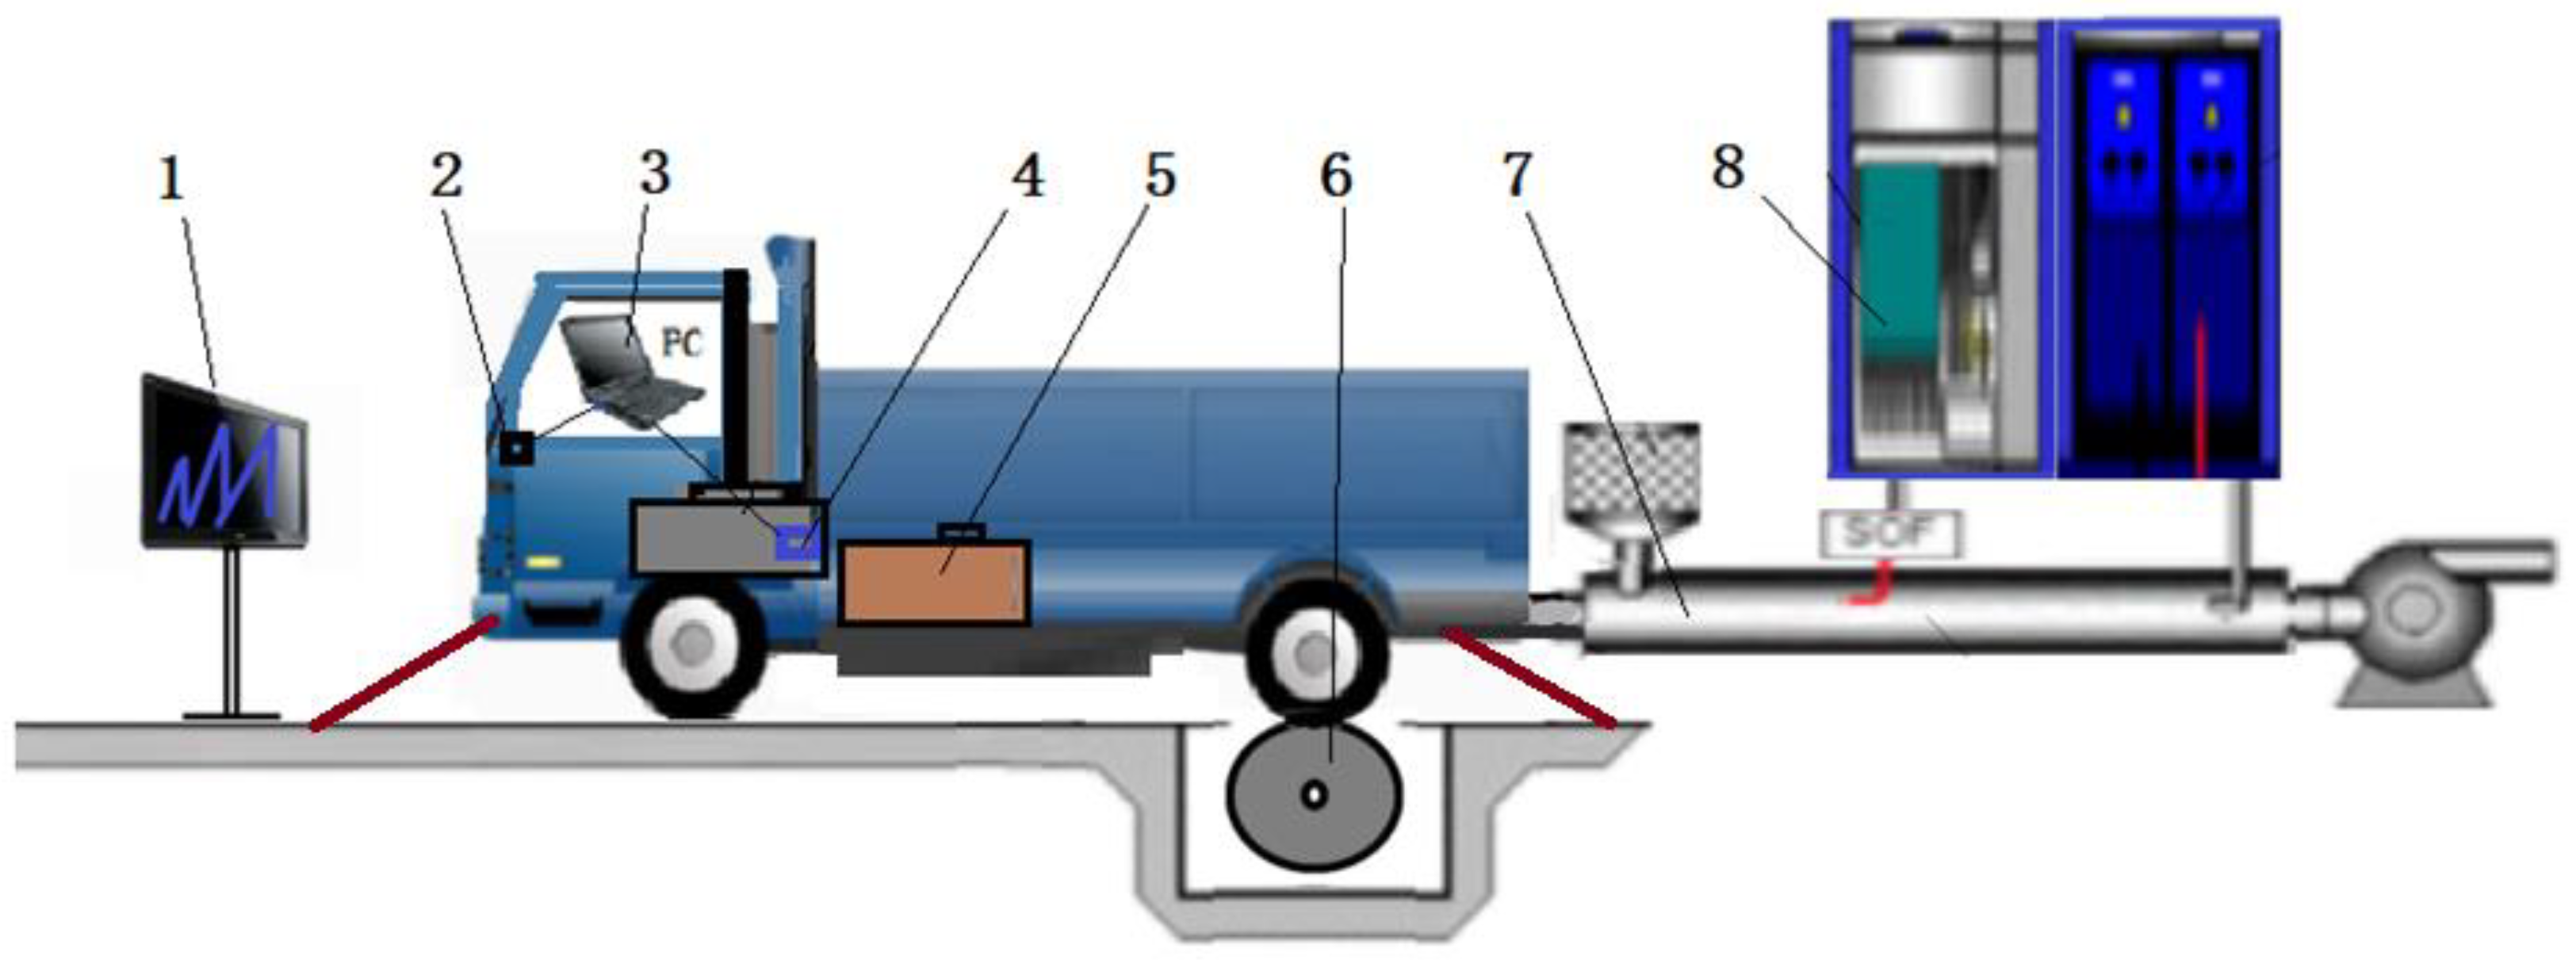
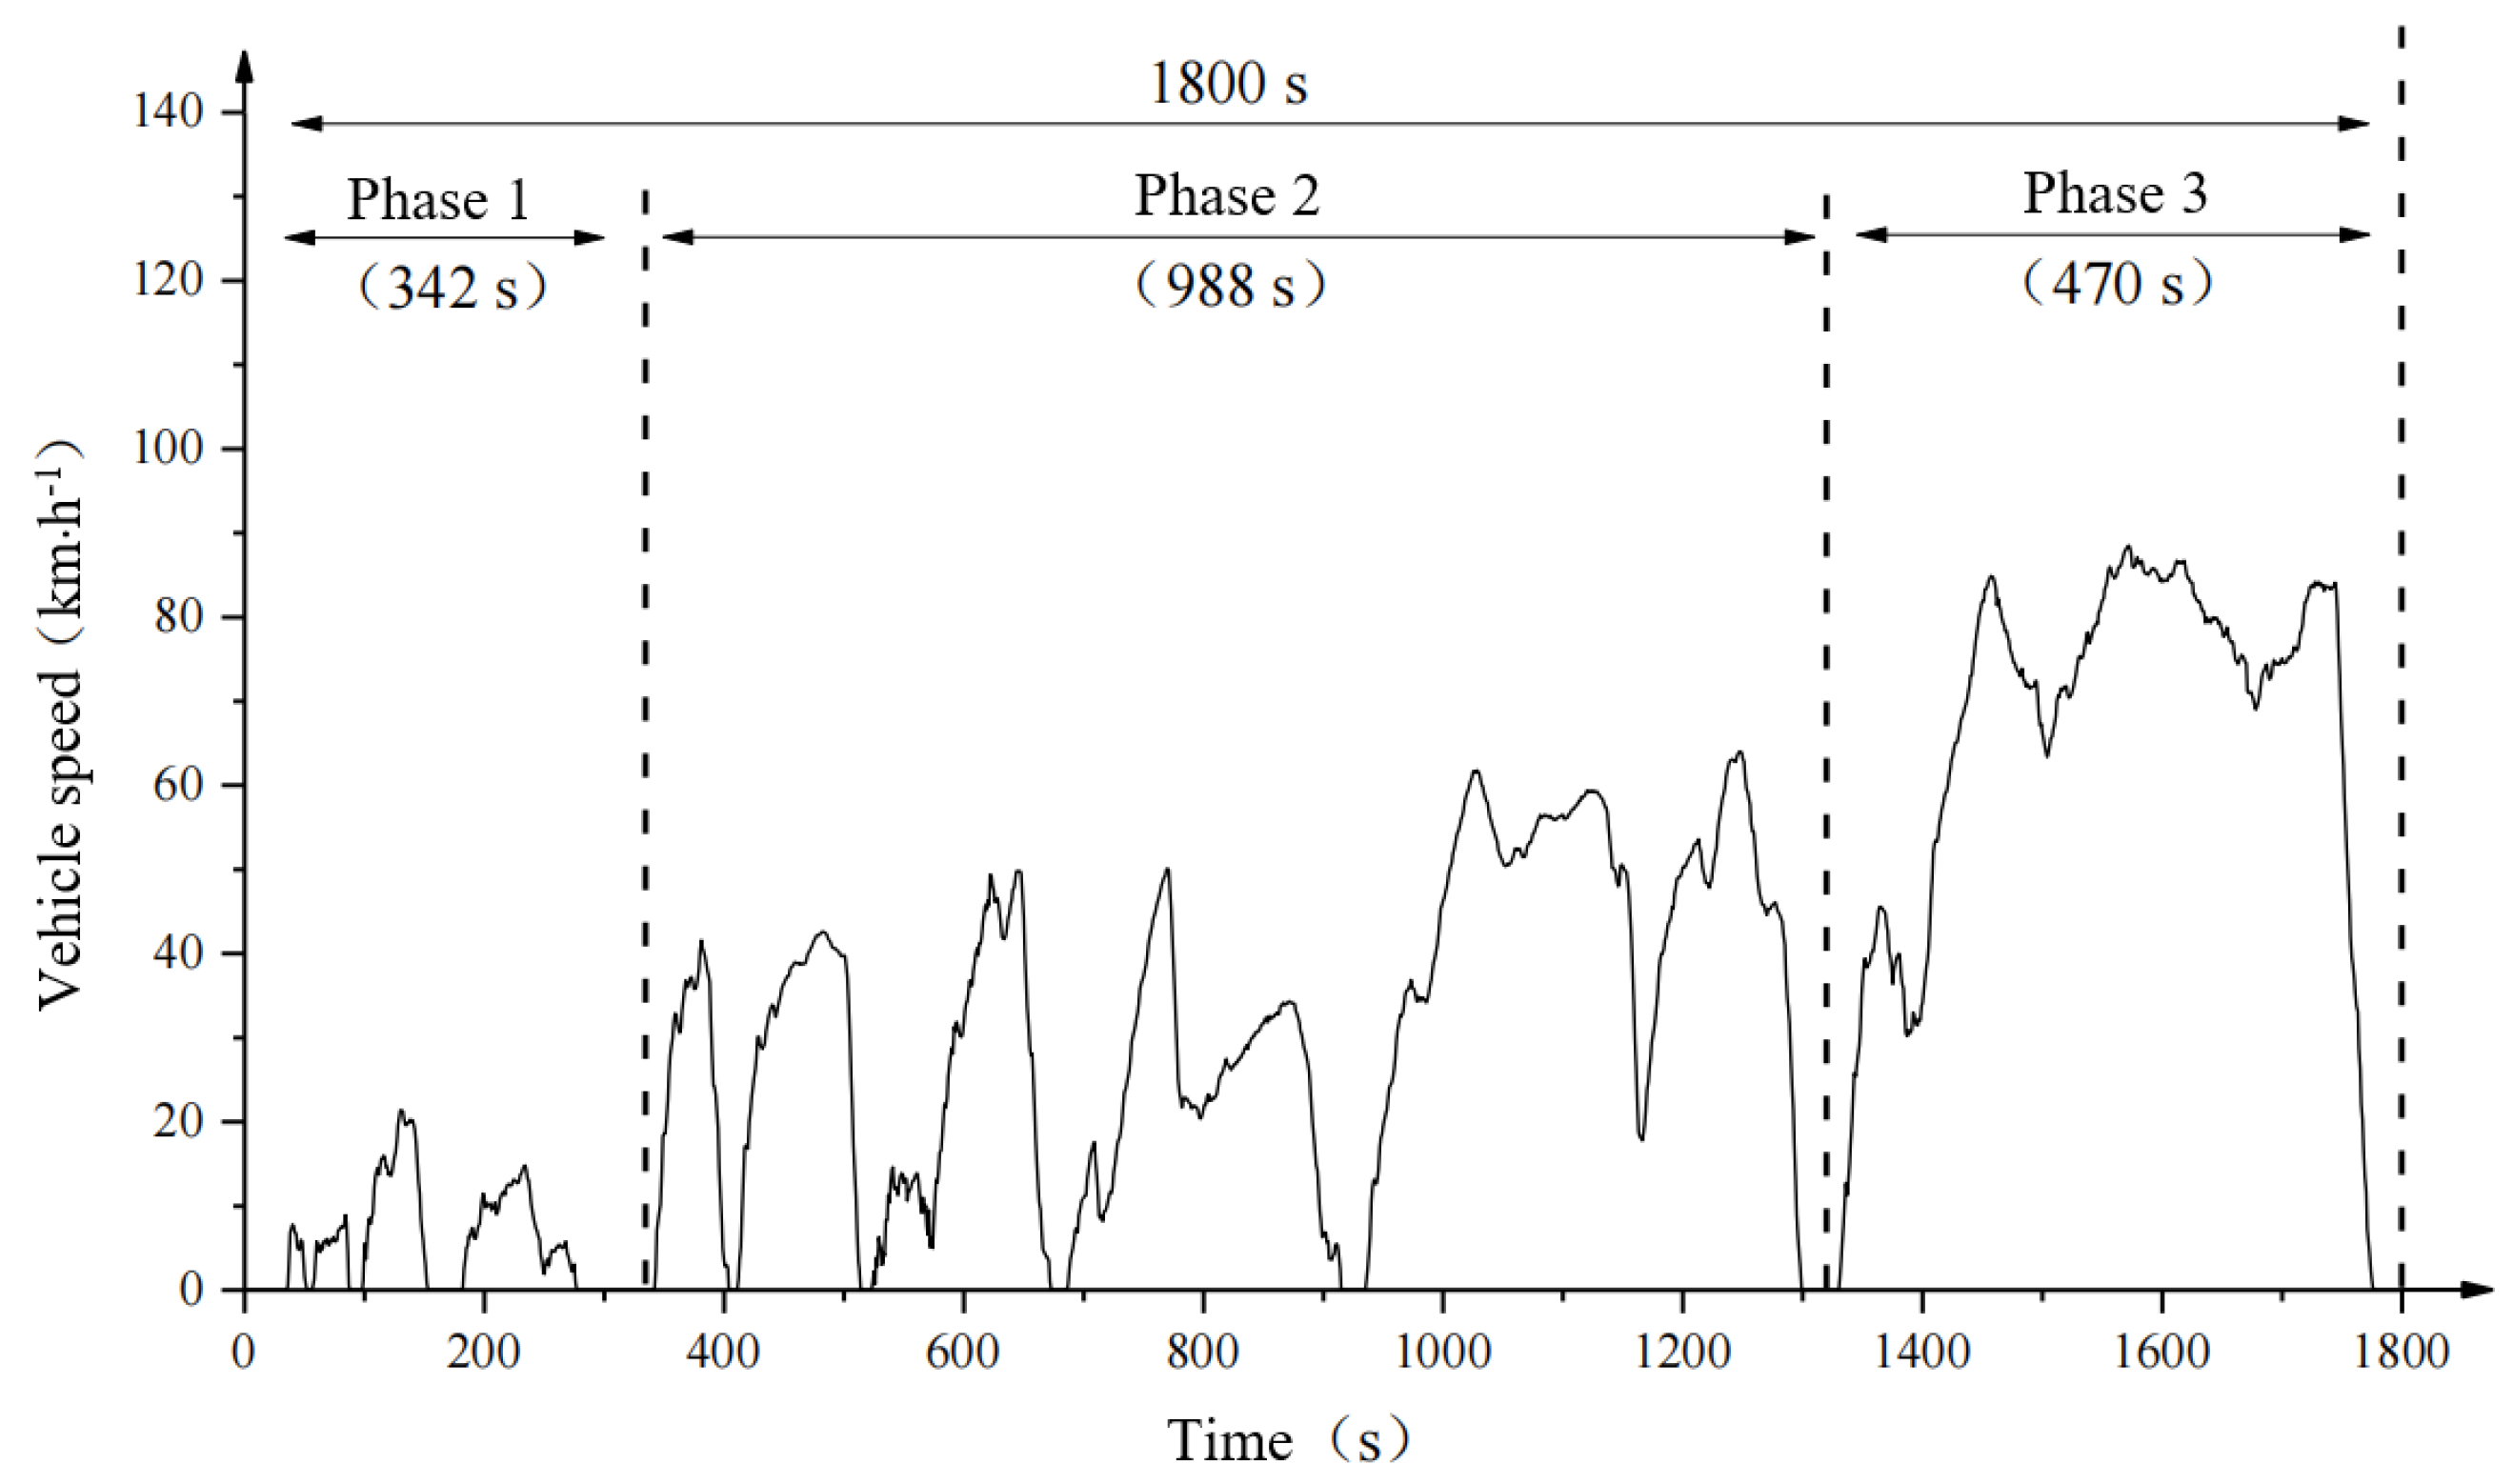
2.2.1. Test Facilities and Procedures

Using a chassis dynamometer to test vehicle emissions and fuel consumption has the advantages of high accuracy and good repeatability. It is a widely accepted method for vehicle emission inspection and approval. In this study, a heavy-duty diesel truck was tested on the chassis dynamometer, the exhaust emissions of the heavy-duty truck were measured by the emission analyzer over the CHTC-HT driving cycle, and a fuel flow meter was connected to the fuel line to measure the fuel flow. Test equipment parameters are shown in Table 1. The schematic of the vehicle fuel consumption and emission test system is depicted in Figure 1.
The specifications of the heavy-duty diesel truck are shown in Table 2. The NOx sensor used for engine exhaust emission detection is a smart NOx sensor produced by Continental AG, with a measurement range of NOx concentration from 0 ppm to 1500 ppm and O2 concentration from −12% to 21%. The NOx sensor is calibrated under various conditions, combined with filtering and correction strategies of the engine electronic control system, to ensure that the NOx sensor can accurately measure the NOx emission concentration.
While testing on the chassis dynamometer, the vehicle driving resistive force was simulated and exerted by the chassis dynamometer. An AVL AMAi60 emission analyzer and an i60 CVS sampling system were utilized to measure vehicle exhaust emissions, including CO, HC, NOx, and CO2. The AVL AMAi60 emission analyzer uses an infrared detector (IRD) for the measurement of CO and CO2, a chemiluminescent detector (CLD) for NOx, and a heated flame ionization detector (HFID) for THC. During the test, the INCA calibration device was used to read vehicle engine OBD data, including vehicle speed, engine speed and torque, engine fuel flow, NOx sensor output, air mass flow, and other related data. INCA is a calibration tool for automotive electronic control systems under ETAS; it has comprehensive testing and calibration functions, supports the CAN Calibration Protocol (CCP), can manage calibration data, and can be used for data acquisition, calibration, ECU flash programming, and other functions. The data sampling rate of the emission analyzer is 1 HZ, while the data sampling rate of INCA is 10 HZ.
The diesel used in the test meets the China VI diesel emission standard, which has been fully implemented in China from 1 January 2019 [30].
After the engine was fully warmed up, the vehicle emissions and fuel consumption were conducted over the CHTC-HT driving cycle [16]. The CHTC-HT driving cycle is shown in Figure 2. It contains three stages that characterize typical urban, suburban, and highway driving conditions and is used to test the fuel consumption of heavy-duty trucks. The total driving cycle lasts 1800 s, of which the driving time ratios for urban, suburban, and highway are 19.0%, 54.9%, and 26.1%, respectively. The total mileage of the CHTC-HT driving cycle is 17.32 km, with an average speed of 34.7 km·h−1 and a maximum speed of 88.5 km·h−1 [15].

2.2.2. Vehicle NOx and CO2 Emission Test

During the vehicle test, the emission analyzer AMAi60 was used to measure the concentrations of exhaust components. The CVS i60 was utilized to measure the total volume flow of diluted exhaust gas. The hydrocarbons in diesel engine exhaust are primarily high molecular hydrocarbons, which are easy to condense, so the sampling bag cannot be used for sampling HC in diesel engine exhaust. The heated sampling tube was used to keep the temperature at about 190 °C, and a heated hydrogen flame ionization detector (HFID) was used to measure HC continuously.
The mass emission rate of component i during the test cycle is calculated by
m i = k · C i · V mix · ρ i
where m i is the mass emission rate of component i during the test cycle, g·s−1; i refers to CO, HC, NOx, and CO2; k is the coefficient; V mix is the volume flow rate of the diluted exhaust gas, m3·min−1; ρ i is the density of component i , g∙L−1.; and C i is the sampled real-time concentration of component i in the diluted exhaust gas, % or 10−6 (ppm).
Therefore, the emission factor of each emission component i over the test cycle can be calculated by
F i = t 0 t c m i · d t / S
where t 0 and t c are the start and end times of the test cycle and S is the vehicle’s total travel distance, km.

2.2.3. Vehicle Fuel Consumption Test

The CO2 emissions were calculated based on the vehicle engine fuel flow rate provided by the engine’s OBD, so we need to verify the accuracy of the fuel flow data provided by the OBD by comparing it with the measured fuel flow rate. For this reason, the carbon balance method and the fuel flow meter test method were used to detect the vehicle fuel consumption during the vehicle test.
Based on the carbon balance mechanism [31], the diesel vehicle fuel consumption per hundred kilometers in the whole test cycle can be calculated by
Q L = 0.1155 ρ 0.273 × F CO 2 + 0.429 × F CO + 0.866 × F HC
where Q L is the vehicle fuel consumption in liters per hundred kilometers, F CO 2 is the CO2 emission factor in g∙km−1, F CO is the emission factor of CO in g∙km−1, F HC is the HC emission factor in g∙km−1, and ρ is the density of diesel at 20 °C, g∙L−1.
Similarly, the transient fuel consumption rate of the vehicle while driving can also be calculated by the carbon balance method and is calculated as
m f = 0.273 × m CO 2 + 0.429 × m CO + 0.866 × m HC / 0.866
where m f is the instantaneous fuel mass consumption rate of the vehicle, g·s−1; m CO 2 ; m CO and m HC are the instantaneous mass emission rates of HC, CO, and CO2, respectively, g·s−1.
The vehicle fuel consumption can be calculated by integrating the obtained fuel flow rate.
m f = t 0 t c m f ˙ d t
where m f is the cumulative fuel consumption of the vehicle over the whole test cycle, g; t 0 and t c are the start and end times of the test cycle.
Furthermore, the diesel vehicle fuel consumption per hundred kilometers over the whole test cycle can be obtained by
Q L = 100 m f ( S · ρ )
where Q L is the vehicle fuel consumption per hundred kilometers, L·(100 km)−1.
During the whole test cycle of the vehicle, the vehicle fuel consumption was also measured by the fuel flowmeter, and the vehicle fuel consumption per hundred kilometers was calculated by
Q L = Q V + Q V · k V · T 0 T a S · 100  
where Q V is the total volume fuel consumption of the vehicle over the whole test cycle, L; k V is the volume expansion coefficient of fuel; T 0 is the reference temperature, 20 °C; T a is the average fuel temperature during the test; and S is the distance traveled by the vehicle over the test cycle, km.

3. Results and Discussion

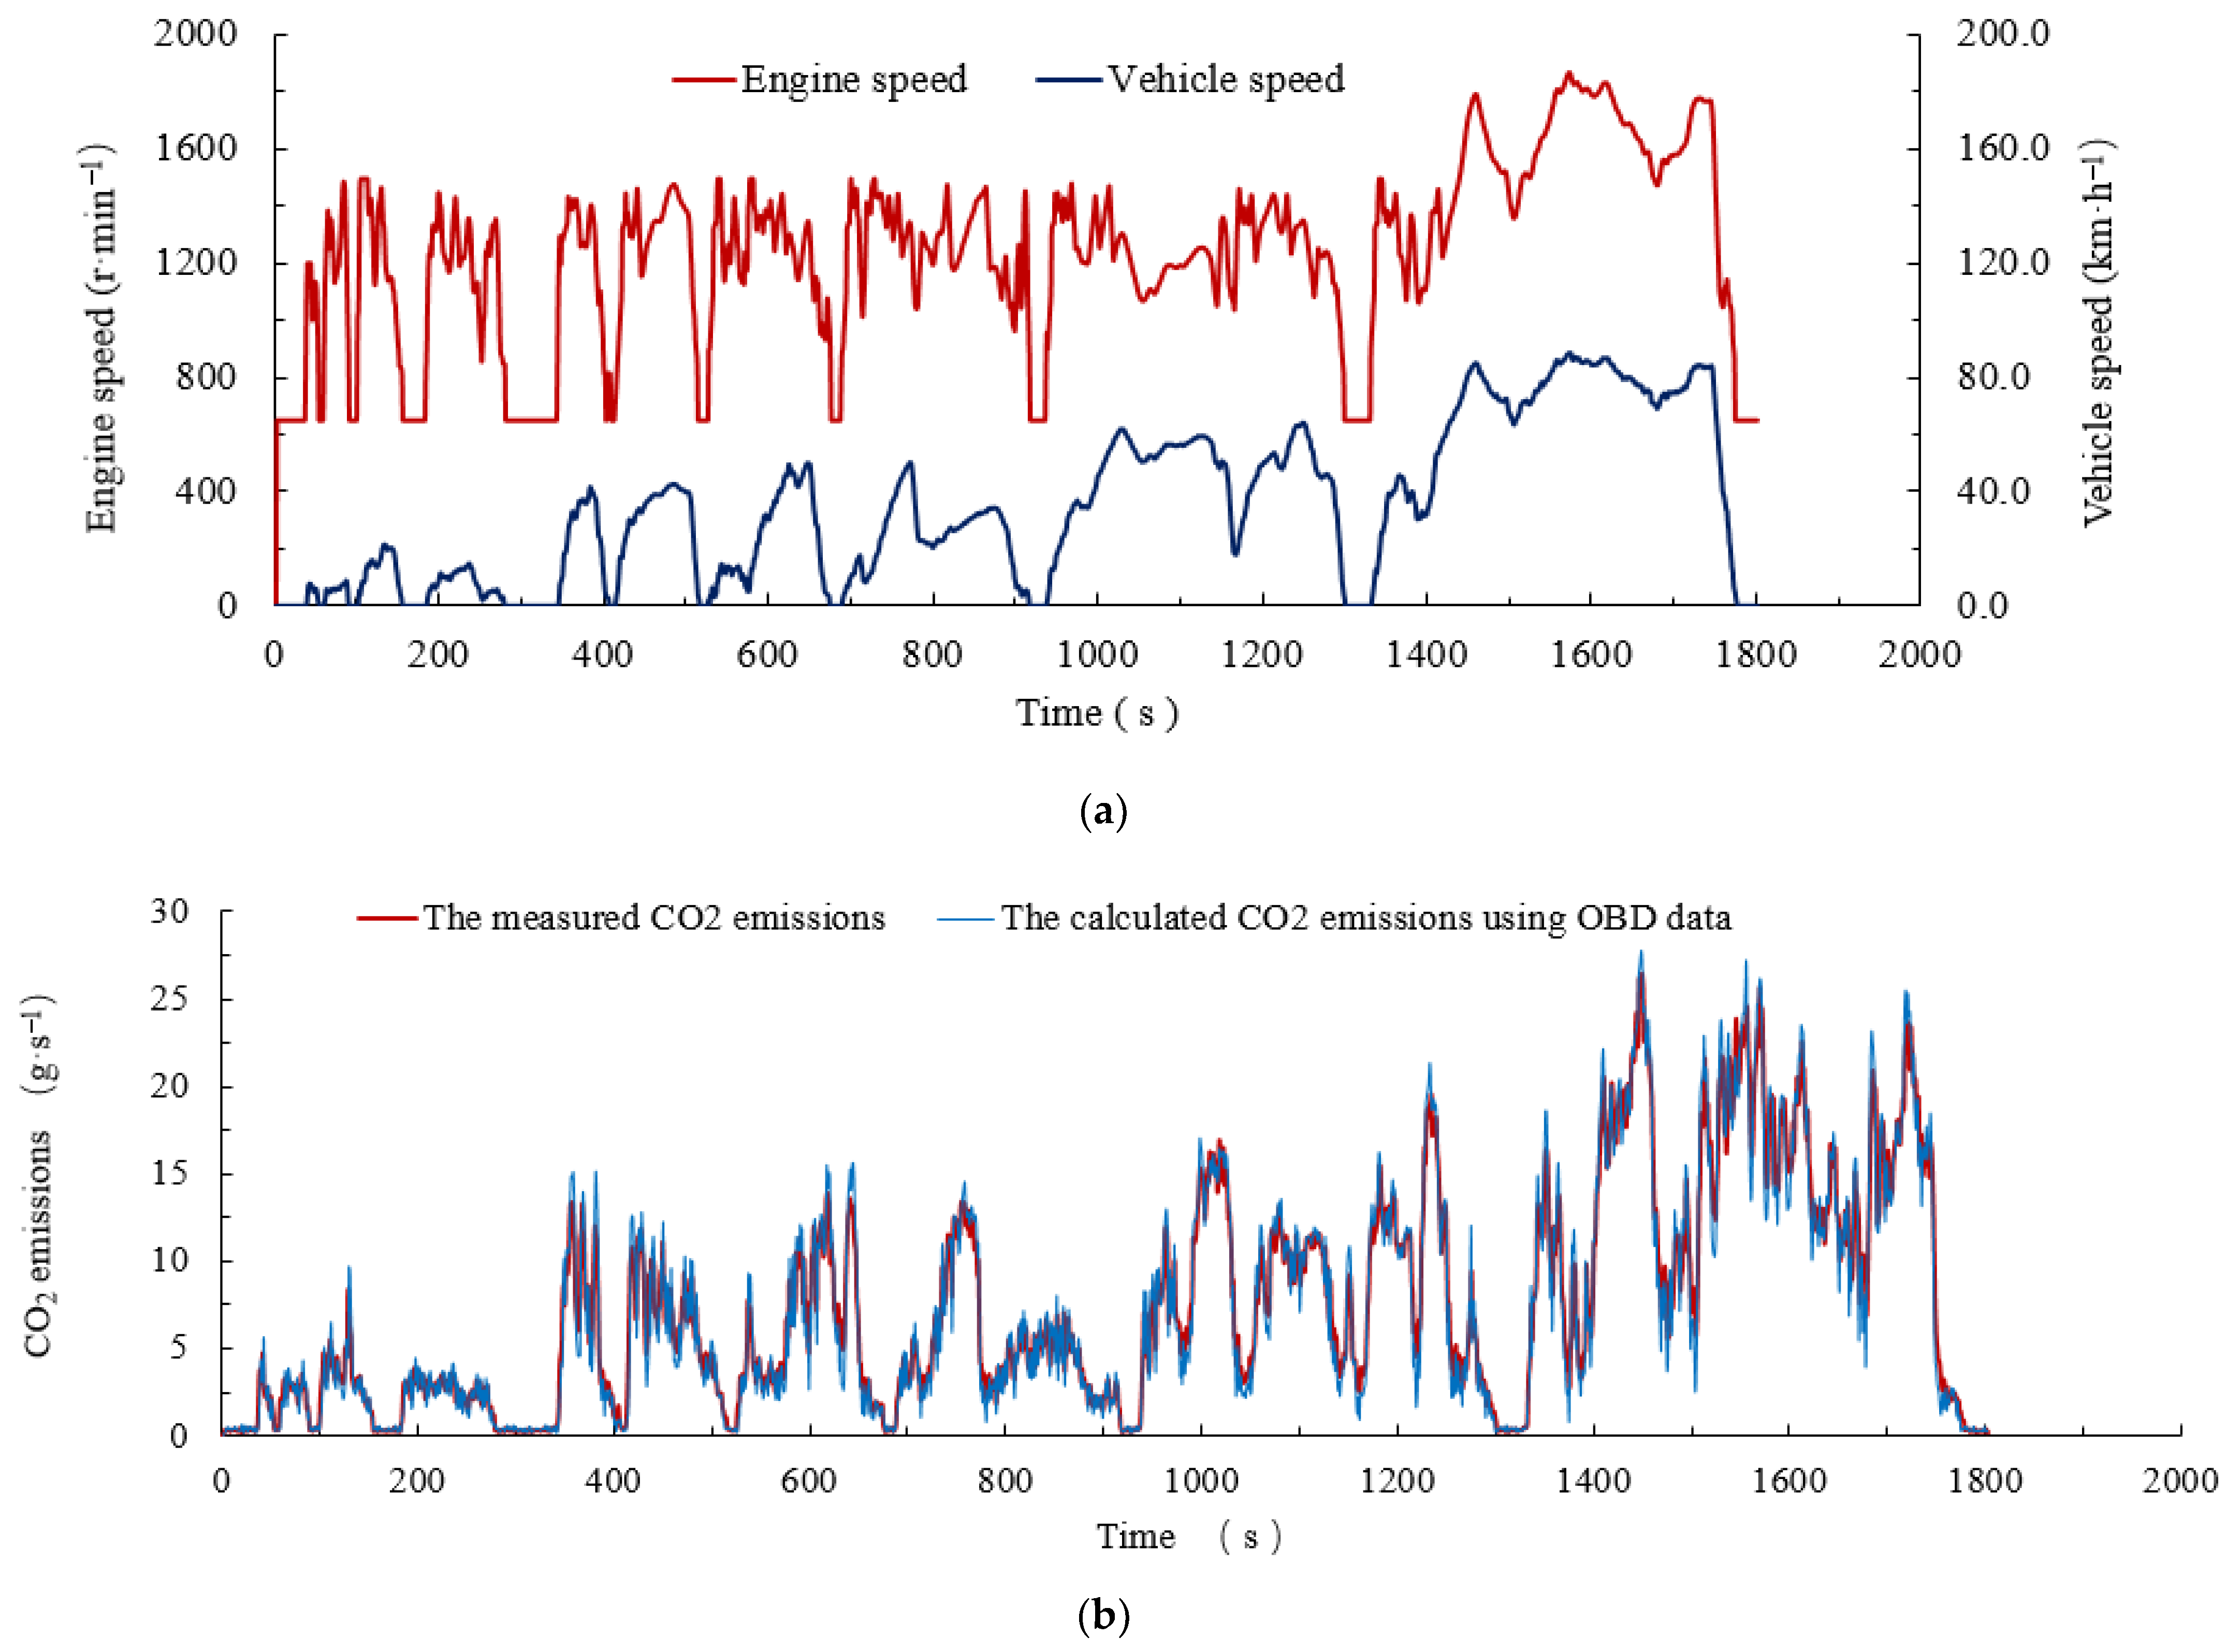
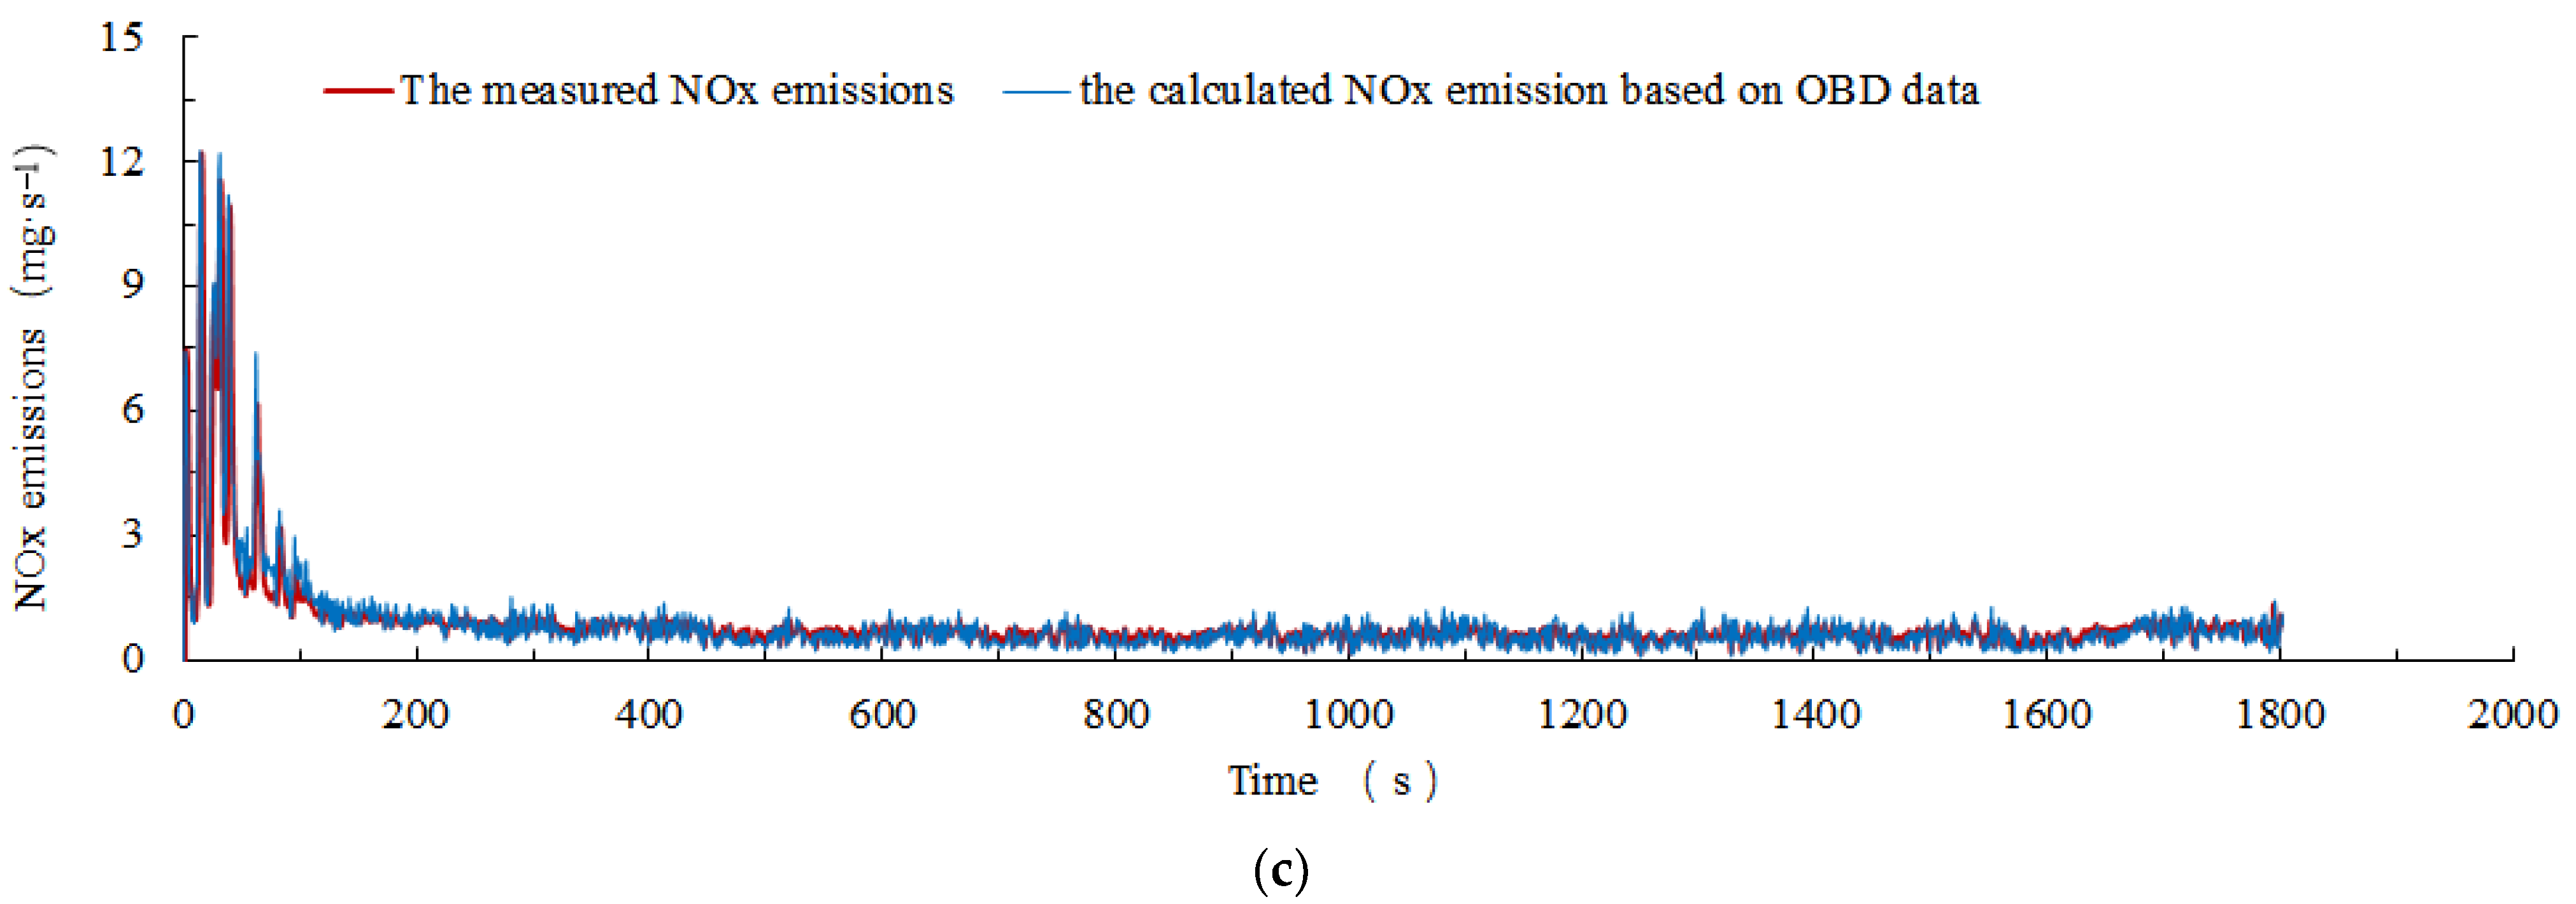
3.1. Comparison between the Calculated NOx and CO2 Emissions Based on OBD Data and the Measured Results

The calculated NOx and CO2 emissions based on OBD data were compared with the measured NOx and CO2 emissions during the CHTC-HT test cycle of the heavy-duty diesel truck and are shown in Figure 3. Due to the time delay of different data sampling devices, the sampled data needs to be aligned based on time. The method is to first align the fuel consumption rate data with the engine operating conditions, and then align the emission data with the fuel consumption rate data based on carbon dioxide data. Figure 3 shows that the calculated CO2 emissions closely follow the transient operating conditions of the vehicle and engine because the CO2 emissions are closely related to the fuel consumption of the vehicle’s engine. Meanwhile, the CO2 emissions measured by the emission analyzer have fewer transient fluctuations than the OBD data-based CO2 emissions due to the transportation of exhaust gas in the exhaust pipe and diluted by the air in the CVS system.
At the beginning of the test cycle, the peak value and fluctuation of NOx emissions are large, mainly due to the lower temperature of the engine SCR catalyst, resulting in a decrease in NOx purification efficiency. As the vehicle runs, the temperature of the engine SCR catalyst increases, resulting in an increase in NOx purification efficiency and a decrease in NOx emissions. Although NOx emissions vary with the vehicle’s engine operating conditions, the fluctuation is significantly reduced. Moreover, since the exhaust gas is diluted with air in the CVS system, the fluctuation of NOx emissions measured by the emission analyzer is also significantly smaller than the calculated NOx emissions based on OBD data.
The comparisons of the OBD data-based NOx and CO2 emission factors and the measured NOx and CO2 emission factors over the three CHTC-HT driving cycles are shown in Table 3.
As shown in Table 3, the calculated NOx emission factors based on OBD data in the three CHTC-HT driving cycles are 0.812, 0.805, and 0.803 g·km−1, respectively, while the measured NOx emission factors by emission analyzer are 0.804, 0.813, and 0.785 g·km−1, correspondingly. The relative errors between the calculated NOx emission factors based on the OBD data and the measured NOx emission factors are −0.99%, 0.99%, and 2.24%, respectively, with the average error of 0.74%, indicating that the NOx emission data downstream of SCR catalyst and engine fuel flow and air mass flow provided by the OBD data stream for heavy-duty diesel vehicles can be used to calculate vehicle NOx emissions.
The calculated CO2 emission factors based on OBD data in the three CHTC-HT driving cycles are 785.52, 772.76, and 768.51 g·km−1, respectively, while the measured CO2 emission factors by emission analyzer are 776.84, 767.72, and 750.80 g·km−1, correspondingly. The relative errors between the calculated CO2 emission factors based on the OBD data and the measured CO2 emission factors are 1.10%, 0.65%, and 2.30%, respectively, with an average error of 1.35%. The main reason is that the OBD-based data is calculated based on the assumption that the diesel fuel is completely combusted. However, the degree of fuel combustion completeness varies under different operating conditions of internal combustion engines, resulting in the actual measured emissions being less than the value calculated based on the fuel flow rate provided by the OBD data stream. The maximum error of the calculated CO2 emission factors based on the OBD data with the actually measured emission factors is 2.3%, and the average error is 1.35%, indicating that the CO2 emissions calculated based on OBD fuel flow rate can predict vehicle CO2 emissions and has great convenience.

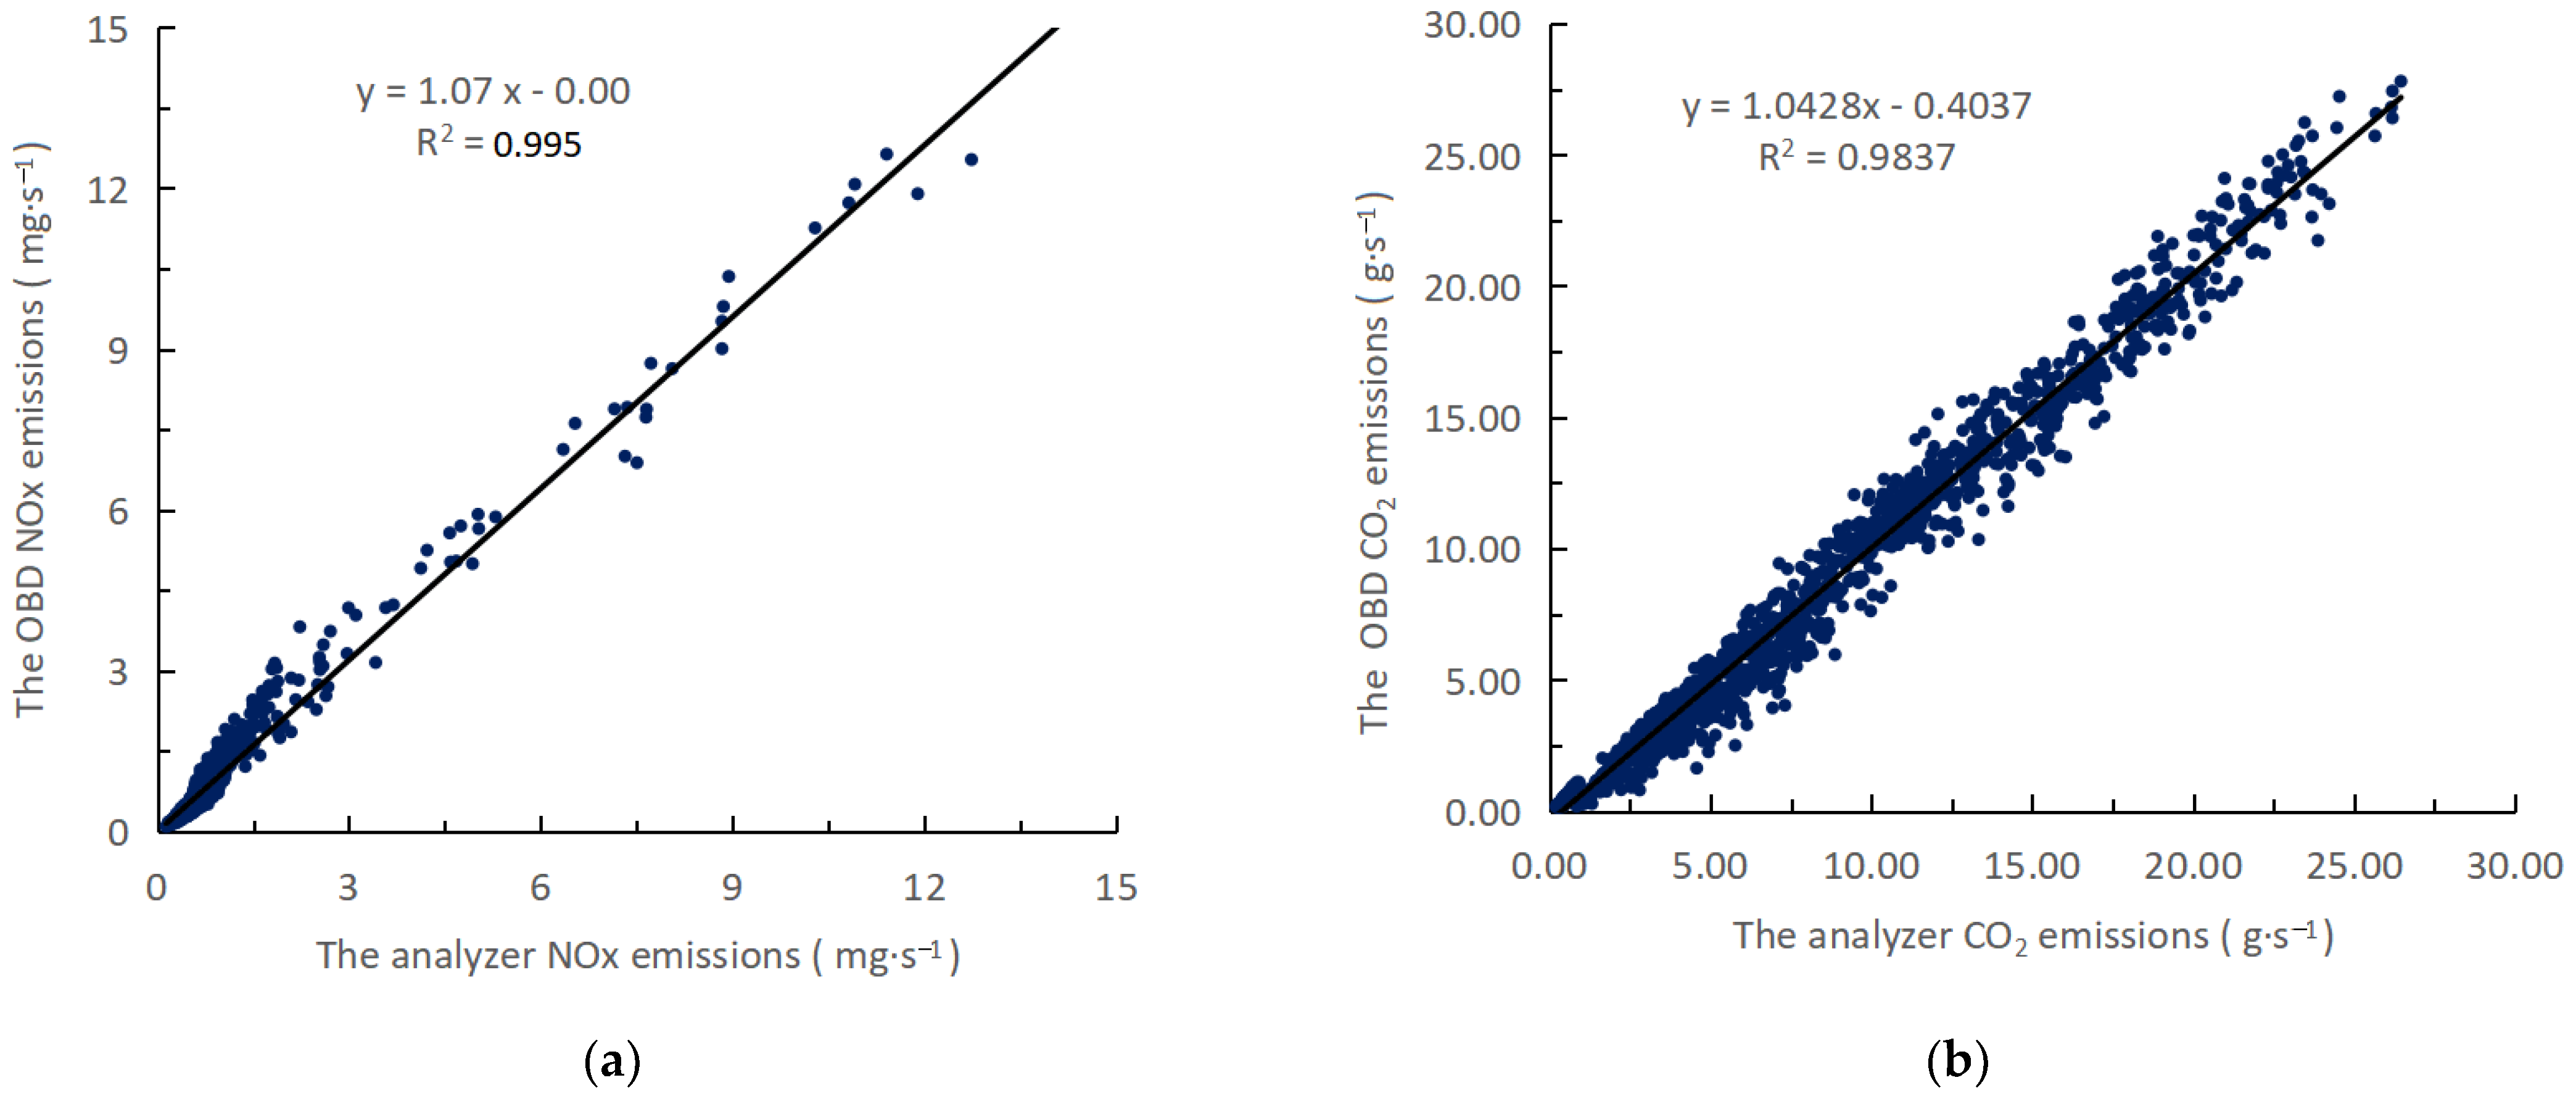
3.2. Correlation Analysis of NOx and CO2 Emission Data

The correlation between the calculated NOx and CO2 emissions based on the OBD data and the actual measured emission results of NOx and CO2 is shown in Figure 4.
Figure 4a shows that vehicle NOx emissions calculated based on OBD data are highly correlated with the results measured by the emission analyzer. R2 equals 0.995, indicating that the vehicle NOx emissions calculated based on OBD data are consistent with the results tested by the emission analyzer. Similarly, Figure 4b shows that vehicle CO2 emissions calculated based on OBD fuel flow rate are highly correlated with the results measured by the emission analyzer and R2 is greater than 0.98. That means that the vehicle NOx and CO2 emissions can be estimated by the vehicle OBD data.

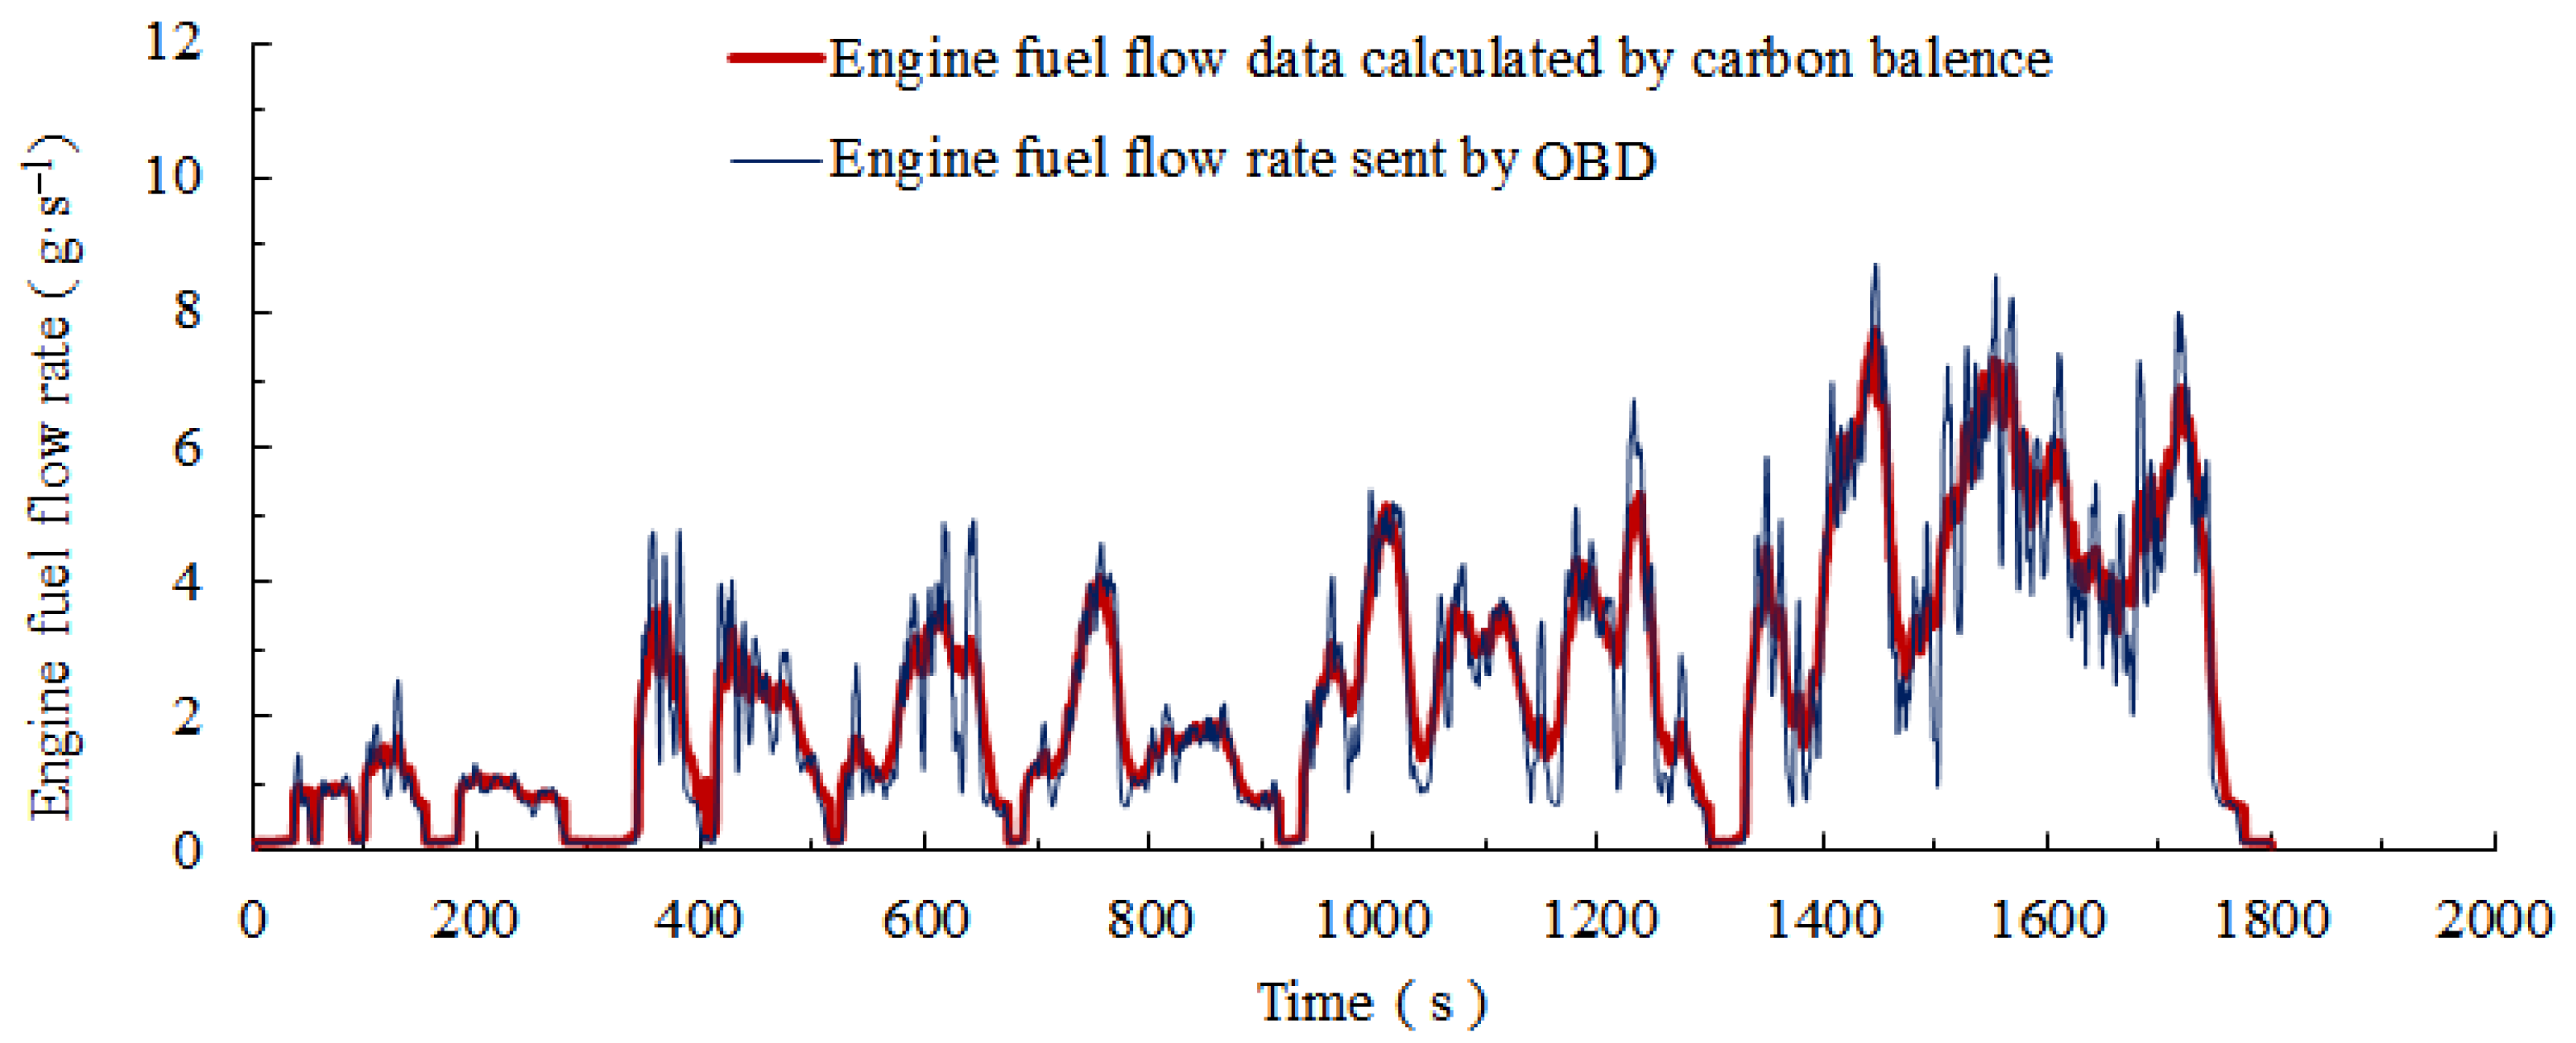
3.3. Comparison between the Fuel Consumption Calculated Based on OBD Data and the Measured Results

The CO2 emission estimation is based on the vehicle OBD fuel flow data, so it is necessary to further verify the accuracy of the fuel consumption calculated based on the OBD fuel flow data and compare it with the fuel flow calculated using the carbon balance method and the fuel flow meter.
The mass emission rate of various exhaust components during the CHTC-HT cycle test of the vehicle can be calculated by Formula (10). The fuel consumption rate of the vehicle can be calculated according to the carbon balance method. Figure 5 shows the comparison between the OBD fuel flow rate and fuel consumption rate calculated based on carbon balance. The fuel consumption rates of the vehicle calculated based on the carbon balance method are consistent with the trend of the OBD fuel flow rate, but the transient fluctuation of the calculated fuel consumption rates based on the carbon balance is significantly reduced compared with the OBD fuel flow rate. The main reason is that the OBD fuel flow rate is calculated based on the vehicle engine fuel injection quantity per operation cycle and changes with the engine operating conditions, but the exhaust gas is mixed in the exhaust pipe and diluted by the air in the CVS system, and the transient fluctuation of the calculated vehicle fuel consumption rates is significantly reduced. Therefore, the OBD fuel flow rates can better reflect the transient operating characteristics of the vehicle and engine.
The results of vehicle fuel consumption per hundred kilometers calculated based on the OBD fuel flow rate, fuel flow meter, and carbon balance method over the CHTC-HT driving cycle are compared and shown in Table 4.
The vehicle fuel consumptions per hundred kilometers calculated based on the OBD fuel flow rate are in good agreement with the fuel flowmeter test results, with a maximum relative error of about 1.17%, and the average deviation of the three measurements is only 0.39%. In addition, the relative error between the fuel consumptions per hundred kilometers calculated based on the OBD fuel flow rate and the fuel consumptions per hundred kilometers calculated using the carbon balance method is about 2.28%, and the average deviation of the three measurements is 1.38%. The fuel consumption results calculated by the carbon balance method are relatively small, which may be due to the influence of condensation of exhaust emission components and the influence of PM emissions containing carbon elements not included in the calculation of vehicle fuel consumption. The experimental results show that the method of calculating fuel consumption based on the OBD fuel flow rate has sufficient measurement accuracy and can be used to calculate vehicle fuel consumption.
Although the vehicle fuel consumptions calculated based on these three methods are very close, there are still some deviations. The possible reasons are as follows:
(i)
Test instruments, including fuel flowmeter, emission analyzer, and CVS dilution system, have measurement errors that may affect test results.
(ii)
The control accuracy of ECU fuel injection quantity is affected by many factors, such as injection pressure, injection pulse width, injector needle valve inertia, and control system voltage, resulting in a difference between the actual injection quantity and the target injection quantity, which may lead to deviations in the fuel flow rate transmitted by ECU through OBD and affect the vehicle fuel consumption results calculated based on the instantaneous fuel flow rate.
(iii)
These three test methods of vehicle fuel consumption are based on different sampling principles, which may have some influences on the test results.

4. Conclusions

The OBD data of heavy-duty diesel vehicles were used to calculate vehicle NOx and CO2 emissions, and they are validated by testing a heavy-duty truck’s emissions and fuel consumption on the chassis dynamometer over the CHTC-HT driving cycle.
The calculated NOx and CO2 emissions based on the OBD data are consistent with the NOx and CO2 emissions measured by the emission analyzer. The calculated NOx emission factors based on OBD data in the three CHTC-HT driving cycles are very close to the measured NOx emission factors by the emission analyzer with a maximum error of 2.24% and an average error of 0.74%. The calculated CO2 emission factors per unit mileage based on OBD data are also very close to the measured CO2 emission factors by emission analyzer with the maximum error of 2.3%, and the average error is 1.68%. The OBD data of heavy-duty diesel vehicles can be used to calculate vehicle NOx and CO2 emissions and has sufficient prediction accuracy.
The fuel consumption of the heavy-duty diesel truck was measured using three methods including accessing vehicle fuel flow rate by OBD, using a fuel flowmeter, and using carbon balance. The measured vehicle fuel consumptions obtained by the three methods are very close. For the test results of the CHTC-HT cycle, the maximum relative error between the results calculated based on the OBD data and the result tested by the fuel flowmeter is 1.17%, and the average deviation of the three measurements is only 0.39%. The maximum relative error between the results calculated based on OBD data and the results calculated based on carbon balance is 2.28%, and the average deviation of three measurements is 1.38%. The experimental results further prove that the OBD data of heavy-duty vehicles can be used to calculate vehicle fuel consumption and CO2 emissions.

Author Contributions

L.H.: conceptualization, methodology, writing—original draft. Y.R.: investigation, methodology, data curation. W.L.: methodology, investigation, writing—original draft. N.J.: investigation, methodology, data curation. Y.G.: conceptualization, supervision. Y.W.: methodology, writing—original draft and editing. All authors have read and agreed to the published version of the manuscript.

Funding

This work was supported by the National Key R&D Program of China (2018YFE0106800) and the funding from the European Union’s Horizon 2020 Research and Innovation Programme under CARES Grant Agreement No. 814,966 (https://cares-project.eu/ (accessed on 10 August 2023).

Institutional Review Board Statement

Not applicable.

Informed Consent Statement

Not applicable.

Data Availability Statement

The research data will be made available on request.

Conflicts of Interest

The authors declare that they have no known competing financial interests or personal relationships that could have appeared to influence the work reported in this paper.

Nomenclature

ASCAmmonia slip catalyst
CANController area network
CBDChemiluminescent detector
CCPCAN Calibration Protocol
CEMComprehensive modal emissions model
CHTC-HTChina heavy-duty test cycle-heavy-duty truck
CICompression ignition
COCarbon monoxide
CO2Carbon dioxide
DOCDiesel oxidation catalyst
DPFDiesel particulate filter
ECUElectronic control unit
HCHydrocarbon
HDHeated flame ionization detector
HDDVHeavy-duty diesel vehicle
HDVHeavy-duty vehicle
NDIRNon-dispersive infrared detection
NOxOxides of nitrogen
OBDOn-board diagnostics
OBFCMOn-board fuel and energy consumption monitoring
OBMOn-board monitoring
PMParticulate matter
REDInfrared detector
SCRSelective catalytic reduction
THCTotal hydrocarbons
US EPAUS Environmental Protection Agency

References

  1. Anenberg, S.C.; Mohegh, A.; Goldberg, D.L.; Kerr, G.H.; Brauer, M.; Burkart, K.; Hystad, P.; Larkin, A.; Wozniak, S.; Lamsal, L. Long-term trends in urban NO2 concentrations and associated paediatric asthma incidence: Estimates from global datasets. Lancet Planet Health 2022, 6, 49–58. [Google Scholar] [CrossRef]
  2. Kotz, A.J.; Kittelson, D.B.; Northrop, W.F. Lagrangian Hotspots of In-Use NOX Emissions from Transit Buses. Environ. Sci. Technol. 2016, 50, 5750–5756. [Google Scholar] [CrossRef] [PubMed]
  3. Monks, P.S.; Archibald, A.T.; Colette, A.; Cooper, O.; Coyle, M.; Derwent, R.; Fowler, D.; Granier, C.; Law, K.S.; Mills, G.E.; et al. Tropospheric ozone and its precursors from the urban to the global scale from air quality to short-lived climate forcer. Atmos. Chem. Phys. 2015, 15, 8889–8973. [Google Scholar] [CrossRef]
  4. Ministry of Ecology and Environment of the People’s Republic of China (MEEPRC). China Mobile Source Environmental Management Annual Report; MEEPRC: Beijing, China, 2021. (In Chinese) [Google Scholar]
  5. Anenberg, S.C.; Miller, J.; Minjares, R.; Du, L.; Henze, D.K.; Lacey, F.; Malley, C.S.; Emberson, L.; Franco, V.; Klimont, Z.; et al. Impacts and mitigation of excess diesel-related NOx emissions in 11 major vehicle markets. Nature 2017, 545, 467–471. [Google Scholar] [CrossRef] [PubMed]
  6. Wu, Y.; Zhang, S.; Hao, J.; Liu, H.; Wu, X.; Hu, J.; Walsh, M.P.; Wallington, T.J.; Zhang, K.M.; Stevanovic, S. On-road vehicle emissions and their control in China: A review and outlook. Sci. Total Environ. 2017, 574, 332–349. [Google Scholar] [CrossRef] [PubMed]
  7. Environmental Protection Agency (EPA). 40 CFR Parts 69, 80, and 86. Control of Air Pollution from New Motor Vehicles: Heavy-Duty Engine and Vehicle Standards and Highway Diesel Fuel Sulfur Control Requirements; Final Rule. Federal Register/Volume 66, No. 12, 18 January 2001. Available online: https://www.govinfo.gov/content/pkg/FR-2001-01-18/pdf/01-2.pdf (accessed on 15 January 2023).
  8. European Commission. Commission Regulation (EU) No 582/2011 of 25 May 2011 Implementing and Amending Regulation (EC) No 595/2009 of the European Parliament and of the Council with Respect to Emissions from Heavy Duty Vehicles (Euro VI) and Amending Annexes I and III to Directive 2007/46/EC of the European Parliament and of the Council Text with EEA Relevance. (Consolidated Version). Official Journal of the European Union, No. L 167 (22 July 2018). 2018, pp. 1–168. Available online: https://eur-lex.europa.eu/legal-content/EN/TXT/?uri=CELEX:02011R0582-20180722 (accessed on 12 March 2023).
  9. Zacharof, N.; Fontaras, G.; Ciuffo, B.; Tansini, A.; Prado-Rujas, I. An estimation of heavy-duty vehicle fleet CO2 emissions based on sampled data. Transp. Res. Part D Transp. Environ. 2021, 94, 102784. [Google Scholar] [CrossRef]
  10. EU. Regulation (EU) 2017/2400, 2018. Regulation (EU) 2017/2400 of 12 December 2017 Implementing Regulation (EC) No 595/2009 of the European Parliament and of the Council as Regards the Determination of the CO2 Emissions and Fuel Consumption of Heavy-Duty Vehicles and Amending Directive 2007/46/EC of the European Parliament and of the Council and Commission Regulation (EU) No 582/2011, OJ L.; EU: Brussels, Belgium, 2017. [Google Scholar]
  11. EU. Regulation (EU) 2019/631 of the European Parliament and of the Council of 17 April 2019 Setting CO2 Emission Performance Standards for New Passenger Cars and for New Light Commercial Vehicles, and Repealing Regulations (EC) No 443/2009 and (EU) No 510/2011 (2019); EU: Brussels, Belgium, 2019. [Google Scholar]
  12. Environmental Protection Agency (EPA). Inventory of U.S. Greenhouse Gas Emissions and Sinks; 1990–2013 (Reports and Assessments No. EPA 430-R-15-004); EPA: Washington, DC, USA, 2015. [Google Scholar]
  13. Environmental Protection Agency (EPA). EPA-420-F-15-901.EPA and NHTSA Propose Standards to Reduce Greenhouse Gas Emissions and Improve Fuel Efficiency of Medium- and Heavy-Duty Vehicles for Model Year 2018 and beyond. 2015. Available online: https://nepis.epa.gov/Exe/ZyPDF.cgi/P100MLQ5.PDF?Dockey=P100MLQ5.PDF (accessed on 18 April 2022).
  14. GB 30510-2018; Fuel Consumption Limits for Heavy-Duty Commercial Vehicles. State Administration for Market Regulation of People’s Republic of China (SAMRC): Beijing, China, 2018.
  15. GB/T 38146.2-2019; China Automotive Test Cycle-Part 2: Heavy-Duty Commercial Vehicles. State Administration for Market Regulation of People’s Republic of China (SAMRC): Beijing, China, 2019.
  16. GB/T 27840-2021; Fuel Consumption Test Methods for Heavy-Duty Commercial Vehicles. State Administration for Market Regulation (SAMRC): Beijing, China, 2021.
  17. Yu, Q.; Tan, J.; Ge, Y.; Hao, L.; Peng, Z. Application of Diesel Particulate Filter on in-use On-road Vehicles. Energy Procedia 2017, 105, 1730–1736. [Google Scholar]
  18. Carslaw, D.C.; Rhys-Tyler, G. New insights from comprehensive on-road measurements of NOx, NO2 and NH3 from vehicle emission remote sensing in London, UK. Atmos. Environ. 2013, 81, 339–347. [Google Scholar] [CrossRef]
  19. Dixit, P.; Miller, J.W.; Cocker, D.R., III.; Oshinuga, A.; Jiang, Y.; Durbin, T.D.; Johnson, K.C. Differences between emissions measured in urban driving and certification testing of heavy-duty diesel engines. Atmos. Environ. 2017, 166, 276–285. [Google Scholar] [CrossRef]
  20. Payri, R.; Gimeno, J.; Viera, J.P.; Plazas, A.H. Needle lift profile influence on the vapor phase penetration for a prototype diesel direct acting piezoelectric injector. Fuel 2013, 113, 257–265. [Google Scholar] [CrossRef]
  21. Pelkmans, L.; Debal, P. Comparison of on-road emissions with emissions measured on chassis dynamometer test-cycles. Transp. Res. D Transp. Environ. 2006, 11, 233–241. [Google Scholar] [CrossRef]
  22. Park, C.; Kook, S.; Bae, C. Effects of Multiple Injections in a HSDI Diesel Engine Equipped with Common Rail Injection System; SAE Paper 2004-01-0127; SAE: Warrendale, PA, USA, 2004. [Google Scholar]
  23. Mohan, B.; Yang, W.M.; Raman, V.; Sivasankaralingam, V.; Chou, S.K. Optimization of biodiesel fueled engine to meet emission standards through varying nozzle opening pressure and static injection timing. Appl. Energy 2014, 130, 450–457. [Google Scholar] [CrossRef]
  24. Chen, L.; Wang, Z.; Liu, S.; Qu, L. Using a chassis dynamometer to determine the influencing factors for the emissions of Euro VI vehicles. Transp. Res. D Transp. Environ. 2018, 65, 564–573. [Google Scholar] [CrossRef]
  25. Alves, C.A.; Lopes, D.J.; Calvo, A.I.; Evtyugina, M.; Rocha, S.; Nunes, T. Emissions from light-duty diesel and gasoline in-use vehicles measured on chassis dynamometer test-cycles. Aerosol Air Qual. Res. 2015, 15, 99–116. [Google Scholar] [CrossRef]
  26. Chamarthi, G.; Sarkar, A.; Baltusis, P.; Laleman, M. Comprehensive Diagnostic Methodology; SAE Technical Paper 2017-01-1685; SAE: Warrendale, PA, USA, 2017. [Google Scholar] [CrossRef]
  27. Farrugia, M.; Azzopardi, J.P.; Xuereb, E.; Caruana, C.; Farrugia, M. The usefulness of diesel vehicle onboard diagnostics (OBD) information. In Proceedings of the 2016 17th International Conference on Mechatronics—Mechatronika (ME), Prague, Czech Republic, 7–9 December 2016; pp. 1–5. [Google Scholar]
  28. Zhang, S.; Zhao, P.; He, L.; Yang, Y.; Liu, B.; He, W.; Cheng, Y.; Liu, Y.; Liu, S.; Hu, Q.; et al. On-board monitoring (OBM) for heavy-duty vehicle emissions in China: Regulations, early-stage evaluation and policy recommendations. Sci. Total Environ. 2020, 731, 139045. [Google Scholar] [CrossRef] [PubMed]
  29. European Commission (EC). On Type-Approval of Motor Vehicles and Engines and of Systems, Components and Separate Technical Units Intended for Such Vehicles, with Respect to Their Emissions and Battery Durability (Euro 7) and Repealing Regulations (EC) No. 715/2007 and (EC) No. 595/2009; 10.11.2022 COM(2022) 586 final 2022/0365 (COD); EU: Brussels, Belgium, 2022. [Google Scholar]
  30. GB 19147-2016; Automobile Diesel Fuels. State Administration for Market Regulation of People’s Republic of China (SAMRC): Beijing, China, 2016.
  31. European Union (EU). 80/1268/EEC Council Directive. Relating to the Carbon Dioxide Emissions and the Fuel Consumption of Motor Vehicles (as Last Amended by 1999/100/EC); Date Issued: 1 September 2000; EU: Brussels, Belgium, 2000. [Google Scholar]
Figure 1. The schematic of vehicle fuel consumption and emission test system. 1: Driver’s aid; 2: OBD; 3: computer; 4: fuel flow meter; 5: fuel tank; 6: chassis dynamometer; 7: CVS sampling system; 8: emission analyzer.
Atmosphere 14 01417 g001
Figure 2. The CHTC-HT driving cycle.
Atmosphere 14 01417 g002
Figure 3. Comparison between the measured CO2 emission and the calculated CO2 emission based on OBD data. (a) Vehicle speed and engine speed; (b) CO2 emissions; (c) NOx emissions.
Atmosphere 14 01417 g003aAtmosphere 14 01417 g003b
Figure 4. Correlation analysis of vehicle NOx and CO2 emissions. (a) NOx emissions; (b) CO2 emissions.
Atmosphere 14 01417 g004
Figure 5. Comparison between the OBD fuel flow rate and the fuel flow rate calculated based on carbon balance.
Atmosphere 14 01417 g005
Table 1. List of test equipment.
ItemTypeMeasuring RangeManufacturer
Heavy-duty vehicle chassis dynamometer9248Vehicle Weight: 3500 kg to 450,000 kgBurke E. Porter Machinery Company
Data acquisition toolINCAECU dataETAS
Fuel flow meterFP-2140H0~120 L·h−1ONOSOKKI
CVS systemCVS i600~150 m3·min−1AVL
Emission analysis systemAMAi60NOx: 0~10,000 × 10−1 (ppm)AVL
CO: 0~10%
THC: 0~20,000 × 10−1 (ppm) C3
CO2: 0~20%
Table 2. Technical specifications of the test vehicle.
ItemContent
Vehicle typeN3 *
Emission standardChina-VI
Curb weight (kg)8800
Total mass (kg)25,000
Drive form4 × 2 rear drive
Engine type/fuelCI/Diesel
Engine formInline 6-cylinder water-cooled
Engine capacity (L)10.5
Intake modeTurbocharged inter-cooled
Exhaust after-treatmentDOC + DPF + SCR + ASC
Idle speed (r·min−1)650
Rated power/speed (kW/(r·min−1))300/1900
Maximum torque/speed (N·m/(r·min−1))2100/1300
* N3: Vehicles designed and constructed for the carriage of goods and having a maximum mass exceeding 12 tons.
Table 3. Comparison of vehicle NOx and CO2 emissions over the CHTC-HT driving cycle.
NOx EmissionsCO2 Emissions
Number of TestsCalculated Data Based on OBD Data (g·km−1)Measured Data by Emission Analyzer (g·km−1)Deviation (%)Calculated Data Based on OBD Data (g·km−1)Measured Data by Emission Analyzer (g·km−1)Deviation (%)
Test 10.8120.8040.99785.52776.841.10
Test 20.8050.813−0.99772.76767.720.65
Test 30.8030.7852.24768.51750.802.30
Mean value0.8070.8010.74775.60765.121.35
Table 4. Comparison of vehicle fuel consumption over the CHTC-HT driving cycle.
Number of TestsVehicle Fuel Consumption per 100 km
(L·(100 km)−1)
Deviation from the Calculated Data Based on OBD Data (%)
Calculated Results Based on OBD DataCalculated Results by Carbon Balance MethodFuel Flow Meter Test ResultsCalculated Results by Carbon Balance MethodFuel Flow Meter Test Results
Test 129.5629.2429.35−1.08%−0.71%
Test 229.0828.8529.42−0.79%1.17%
Test 328.9228.2629.13−2.28%0.73%
Mean value29.1928.78 29.30 −1.38%0.39%
Disclaimer/Publisher’s Note: The statements, opinions and data contained in all publications are solely those of the individual author(s) and contributor(s) and not of MDPI and/or the editor(s). MDPI and/or the editor(s) disclaim responsibility for any injury to people or property resulting from any ideas, methods, instructions or products referred to in the content.

