Article

Seasonal Variations in Anthropogenic and Natural Particles Induced by Rising CO2 Levels

1
School of Geography and Tourism, Qufu Normal University, Rizhao 276826, China
2
State Key Laboratory of Severe Weather, Chinese Academy of Meteorological Sciences, Beijing 100081, China
3
Canadian Center for Climate Modeling and Analysis, University of Victoria, Victoria, BC V8W 2Y2, Canada
*
Author to whom correspondence should be addressed.
Atmosphere 2024, 15(1), 105; https://doi.org/10.3390/atmos15010105
Submission received: 24 November 2023 / Revised: 4 January 2024 / Accepted: 12 January 2024 / Published: 15 January 2024
(This article belongs to the Special Issue Ozone Pollution and Effects in China)

Abstract

:
Using an aerosol–climate coupled model, this paper has investigated the changes in distributions of anthropogenic and natural particles due to 4 × CO2-induced global warming, under the low emission scenario of Representative Concentration Pathway 4.5 (RCP4.5). Special attention is paid to the seasonal variations of aerosol size modes. With rising CO2 levels, surface warming, and changes in atmospheric circulations and hydrologic cycles are found during both summer (JJA) and winter (DJF). For anthropogenic particles, changes in fine anthropogenic particulate matter (PM2.5, particles with diameters smaller than 2.5 μm) decrease over high-latitude regions and increase over the tropics in both DJF and JJA. Global mean column concentrations of PM2.5 decrease by approximately 0.19 mg m−2, and concentrations of coarse anthropogenic particles (CPM, particles with diameters larger than 2.5 μm) increase by 0.005 mg m−2 in JJA. Changes in anthropogenic particles in DJF are similar to those in JJA, but the magnitudes of maximum regional changes are much smaller than those in JJA. The coarse anthropogenic particles (CPM, particles with diameters larger than 2.5 μm) increase over northern Africa and the Arabian Peninsula during JJA, whereas changes in anthropogenic CPM during DJF are minimal. During both JJA and DJF, changes in anthropogenic CPM are about two orders of magnitude smaller than those of anthropogenic PM2.5. Enhanced wet deposition by large-scale precipitation under rising CO2-induced surface warming is the critical factor affecting changes in anthropogenic particles. For natural particles, the distribution of change in the natural PM2.5 burden is similar to that of natural CPM, but much larger than natural CPM during each season. Both natural PM2.5 and CPM burdens increase over northern Africa and the Arabian Peninsula during JJA, but decrease over most of the continental regions during DJF. Changes in surface wind speed, divergence/convergence of surface wind, and precipitation are primary reasons for the variation of natural particles.

1. Introduction

It is evident that one of the most important indicators of global climate change is rising greenhouse gas (GHG) concentrations, especially the concentration of carbon dioxide (CO2) in the atmosphere [1]. Global warming has been demonstrated to correspond approximately with the cumulative CO2 emissions in numerous simulations through climate models [2]. Studies have shown that reduction in rainfall and surface relative humidity is found in observations and model projections, with an increase in the global air temperature [3,4]. Global warming must have impacts on air pollution and air quality, which is a critical issue for human beings. Fine particles tend to remain in the air longer than heavy particles. The small size and long lifespan of these particles increase the chances of human inhalation.
Many studies have explored the relationship between climate change and aerosols [5,6,7,8]. For example, particles in the atmosphere can change the balance of Earth’s radiation through scattering or absorbing the solar energy and can go further to affect global climate change [5,6,7]. Since emissions are the main contributor to changes in the column concentrations of particles in the atmosphere, climatic variables and local meteorology also remain highly correlated factors [8]. Surface warming due to rising concentrations of GHGs in the atmosphere could affect the distribution and burden of particles through the hydrologic cycle and atmospheric circulations [9]. The relationship between global warming caused by rising CO2 levels and declining air quality are controlled through complex interactions, such as rainfall patterns and changes in hydrological flows. This relationship between meteorology and anthropogenic aerosols has been reported in detail [10,11].
However, most studies on the influence of climate change on aerosol particles have only addressed bulk aerosols without considering the impact on aerosol size distributions [6,10]. This paper aims to simulate changes in the concentrations of both fine and coarse particles caused by the warming climate. In recent years, public awareness and social relevance for air pollution have paid dramatic attention to the PM2.5 concentration in the atmosphere. PM2.5 refers to atmospheric particulate matter (PM) that has a diameter less than or equal to 2.5 μm. Since they are so small and light, fine particles tend to stay longer in the air than heavy particles. Both small size and long lifespan increase the chances of humans inhaling fine particles into their bodies. Anthropogenic PM2.5, emitted into the atmosphere due to human activities, is a critical type of air pollutant. Furthermore, natural PM2.5, particularly for fine dust particles, is another essential source for air pollution. A study showed that the trend of desertification is caused by a variety of factors, but climate change is the dominant one [12]. Therefore, the impacts of climate change on aerosol particles should be addressed not only for the concentration of bulk aerosols, but also for the change in particle size distribution, especially for anthropogenic and natural PM2.5. Besides the fine mode of PM2.5, there is a coarse mode of aerosol, with a size larger than 2.5 μm; we call such coarse particulate matter CPM. To our knowledge, so far, seldom attention has been paid to the change in CPM under climate change. Therefore, it is interesting to find out the impact on CPM of rising CO2 levels and the feedback of CPM to climate.
The paper aims to find the answer of the following questions. Under CO2-induced global warming, what are the responses from the different modes of anthropogenic and natural particles? And what are the roles the climatic variables play in changes in particulate matter in different seasons? A proper address of these questions helps us to understand air pollution in the future climate, which could potentially be used in the climate change mitigation policy of governments. This paper firstly investigates changes in climatic variables, including temperature, atmospheric circulation, and the hydrologic cycle in June–July–August (JJA) and December–January–February (DJF), with rising CO2 mass-mixing ratios. Secondly, this paper estimates the variations of anthropogenic and natural particulate matter of both fine and coarse modes during JJA and DJF. And finally, the paper goes further to analyze the impacts of climatic factors on changes in anthropogenic and natural particles. The model and experimental design are given in Section 2. Section 3 shows changes in climate variables, including changes in temperature, surface wind vector, cloud cover, and precipitation under 4 × CO2-induced global warming. Changes in anthropogenic and natural particles during JJA and DJF are also given in Section 3. Each type of particle is classified into fine and coarse modes. Impacts of climatic variables on changes in particles will be discussed as well in these two sections.

2. Data and Methods

To investigate the impacts on anthropogenic and natural particles of fine and coarse modes under induced climate change during summer (JJA) and winter (DJF), we conduct the following three experiments, using the aerosol–climate model BCC_AGCM2.0_CUACE/Aero. Previous studies have shown the accuracy of simulated results, including the column concentrations, radiative effects, and climate impacts of aerosols based on the model [7,13]. More detailed information on the model can be found [7].
As shown in Table 1, the CO2 mass-mixing ratios are set as 389, 798, and 1556 ppm in the three experiments, respectively. The CO2 mass-mixing ratios, as well as the emission data of anthropogenic aerosol particles and their precursors (in the year 2010), are based on the low emission scenario of Representative Concentration Pathway 4.5 (RCP4.5). The climatological mean of the National Centers for Environmental Prediction’s (NCEP) 1971–2000 reanalysis data is used to build the same initial fields for each experiment, with the sea surface temperature (SST) and sea ice (SI) obtained from a coupled slab ocean module [14]. Differences between climatic states induced by CO2 mass-mixing ratios of 4 × CO2 (or 2 × CO2) and 1 × CO2 are used to estimate the impacts on changes in the column concentrations of anthropogenic and natural particles in the atmosphere. Each test was run for 80 years, with the last 50-year simulated data utilized to discuss the impacts on particles.
In BCC_AGCM2.0_CUACE/Aero, each type of aerosol is divided into 12 bins as geometric series according to their sizes. The first eight bins of each anthropogenic and natural aerosol species in BCC_AGCM2.0_CUACE/Aero, with sizes less than 2.5 μm in diameter, are regarded as particles of fine mode. Particles in the last four bins, with sizes larger than 2.5 μm in diameter, are considered coarse particles, that is CPM. Hereafter, fine particles of the five types of aerosols, including sulfate (SO4), nitrate, black carbon (BC), organic carbon (OC), dust (SD), and sea salt (SS), are named as SO4 (PM2.5), BC (PM2.5), OC (PM2.5), SD (PM2.5), and SS (PM2.5), and coarse particles of the aerosols are abbreviated as SO4 (CPM), BC (CPM), OC (CPM), SD (CPM), and SS (CPM). PM2.5 refers to the total SF, BC, and OC particles in the first eight bins, i.e., the sum of SF (PM2.5), BC (PM2.5), and OC (PM2.5). Since the impacts on climate are mainly due to changes in anthropogenic fine and coarse particles, the total PM2.5 here in this study only refers to the sum of concentrations of SO4 (PM2.5), BC (PM2.5), OC (PM2.5), and likewise for the CPM particles.

3. Results and Discussion

3.1. Climatic Effects Due to Increased CO2 Levels

In this section, this paper study the changes in different climatic variables due to rising CO2 levels. The obtained results provide the physical explanations to the evolution of anthropogenic and natural aerosols in the future climate, as shown in the following sections. The changes in these climatic variables are evaluated with a statistical significance of 90%. As mentioned in the experimental design, the CO2 mass-mixing ratios were set to 389, 778, and 1556 ppm, respectively, in the three tests. However, it was found that changes in these climatic variables, including surface temperature, cloud, precipitation, horizontal wind, and divergence, due to 2 × CO2, have similar patterns to those caused by 4 × CO2. Therefore, the variations of climatic factors under 4 × CO2-induced global warming, will be discussed in detail. Also, this paper will pay attention to seasonal variation by addressing the results of the two seasons of JJA and DJF.
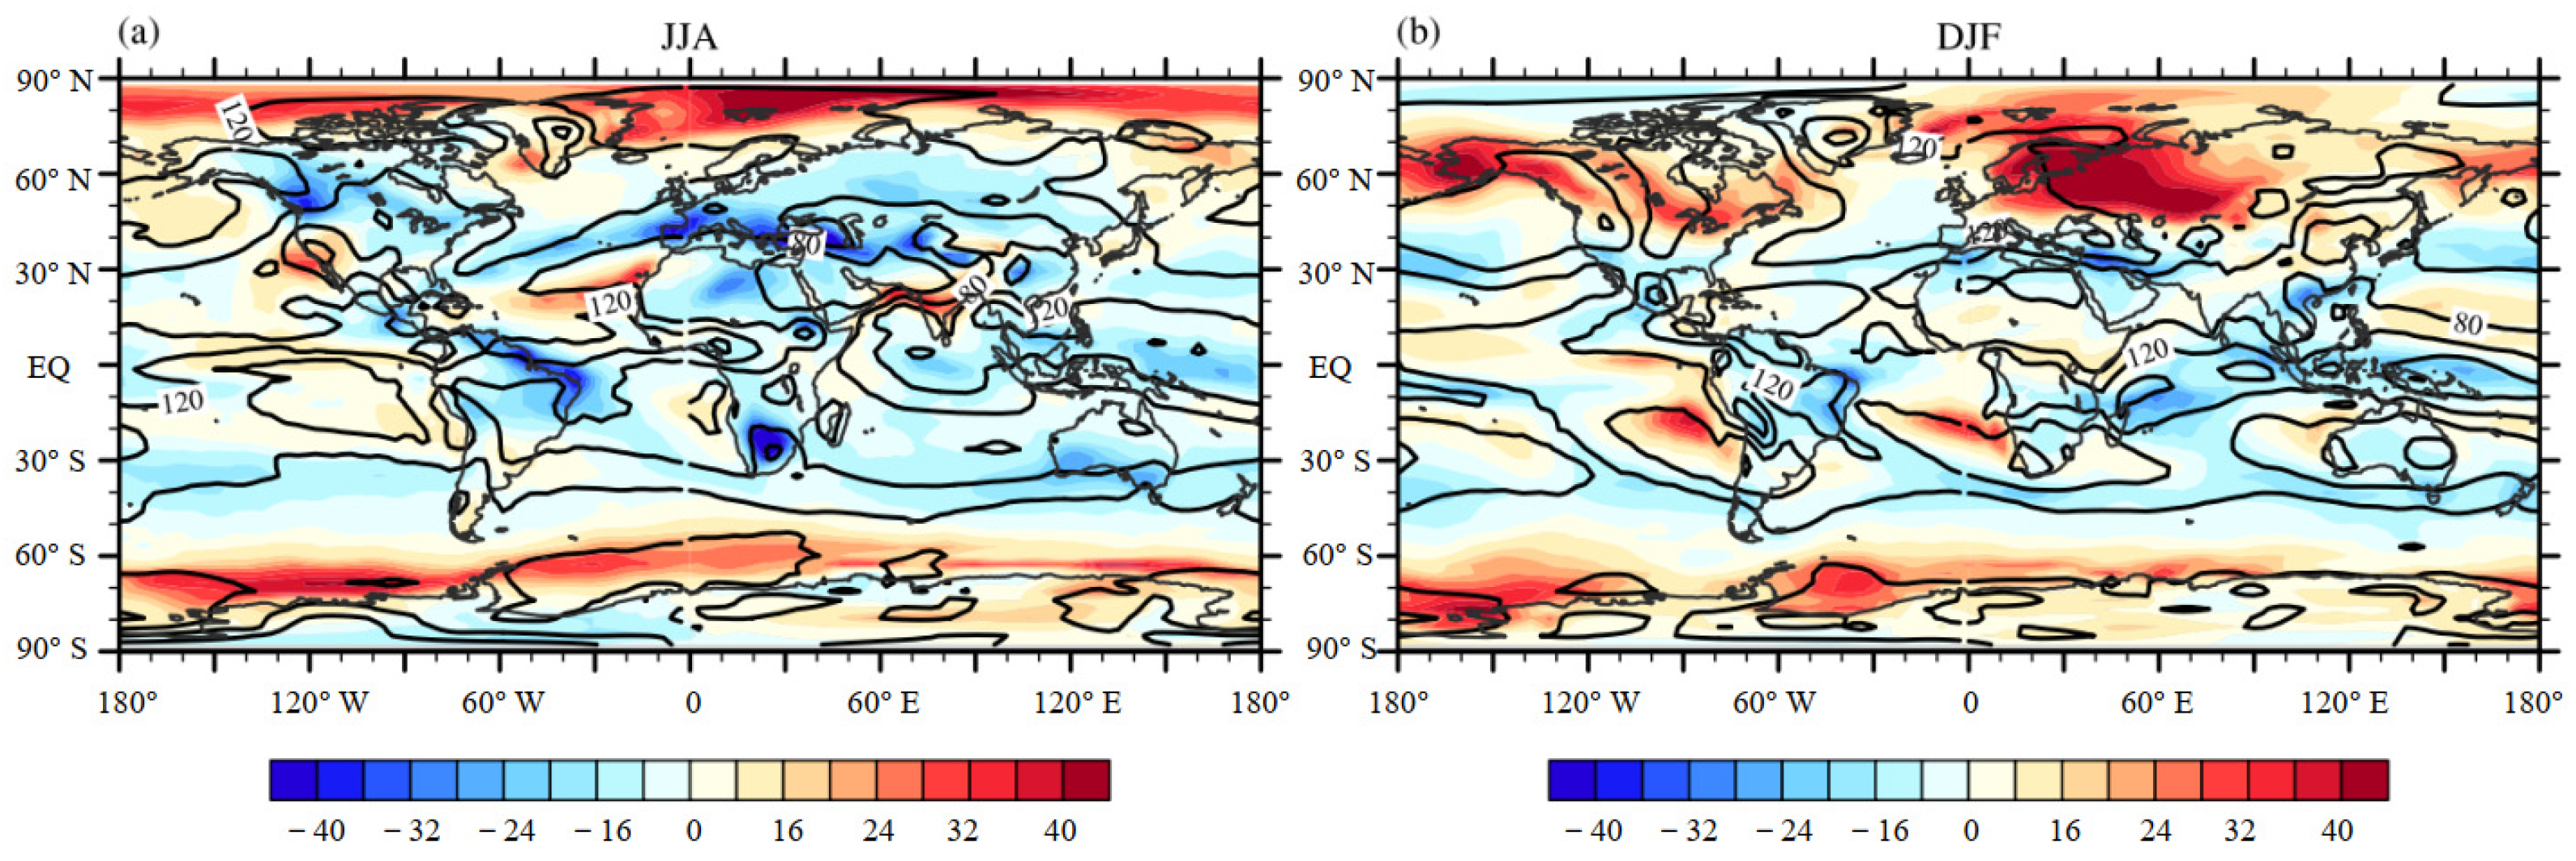
Figure 1 shows the geographic distributions of changes in the surface air temperature (SAT) between 1 × CO2- and 4 × CO2- induced climatic status in JJA and DJF, with the solid lines representing the SAT under the 1 × CO2 climate. The global annual mean SAT increases by 6.29 K in JJA and 6.66 K in DJF between the experiments of 4 × CO2 and 1 × CO2, which is almost double the related values between the experiments of 2 × CO2 and 1 × CO2 (3.09 K in JJA and 3.29 K in DJF). The growth rates of SAT to CO2 concentrations are 0.008 K/ppm for both JJA and DJF under 2 × CO2-induced warming, which are slightly higher than the corresponding values from 4 × CO2 (0.005 K/ppm in JJA, and 0.006 K/ppm in DJF), due to the CO2 effect. Since the patterns of climate change are similar for 2 × CO2 and 4 × CO2, here, only the results of 4 × CO2 are discussed in this paper because of the stronger signals. From Figure 1a,b, although the global warming induced by rising CO2 levels is found in both JJA and DJF, the geographic distributions of changes in SAT are very different.
In JJA, the apparent surface warming induced by rising CO2 is found over the high-latitude regions in the southern hemisphere (SH), and mid-latitudes over North America and North Asia in the northern hemisphere (NH). The largest increase of SAT occurs over the high latitudes in the SH, reaching up to 18.0 K. However, in DJF, SAT increases more over the high latitude continental regions in the NH than in other areas. The most significant changes in SAT are also found over high latitudes in the NH, with the local maximum of SAT exceeding 18.0 K. Slight warming occurs over high latitudes in the SH, with SAT increasing up to 8.0 K over most of this area. Larger increases of SAT are often at high latitudes in the NH (DJF) and SH (JJA), whereas changes over the tropics are considerably smaller. Warming near the surface could be enhanced over the polar areas because of the strong ice and snow albedo feedback [15]. In addition, surface warming occurs much stronger over continental areas than oceanic regions, which is caused by the weaker heat capacity as well as less efficient evaporative cooling.
Different results of changes in surface temperature in JJA and DJF induced by rising CO2 concentrations, as shown in Figure 1, can produce differences in atmospheric circulation since the surface heat source is one of the key factors driving air movement. Changes in large-scale circulations result in variations of wind speed. 
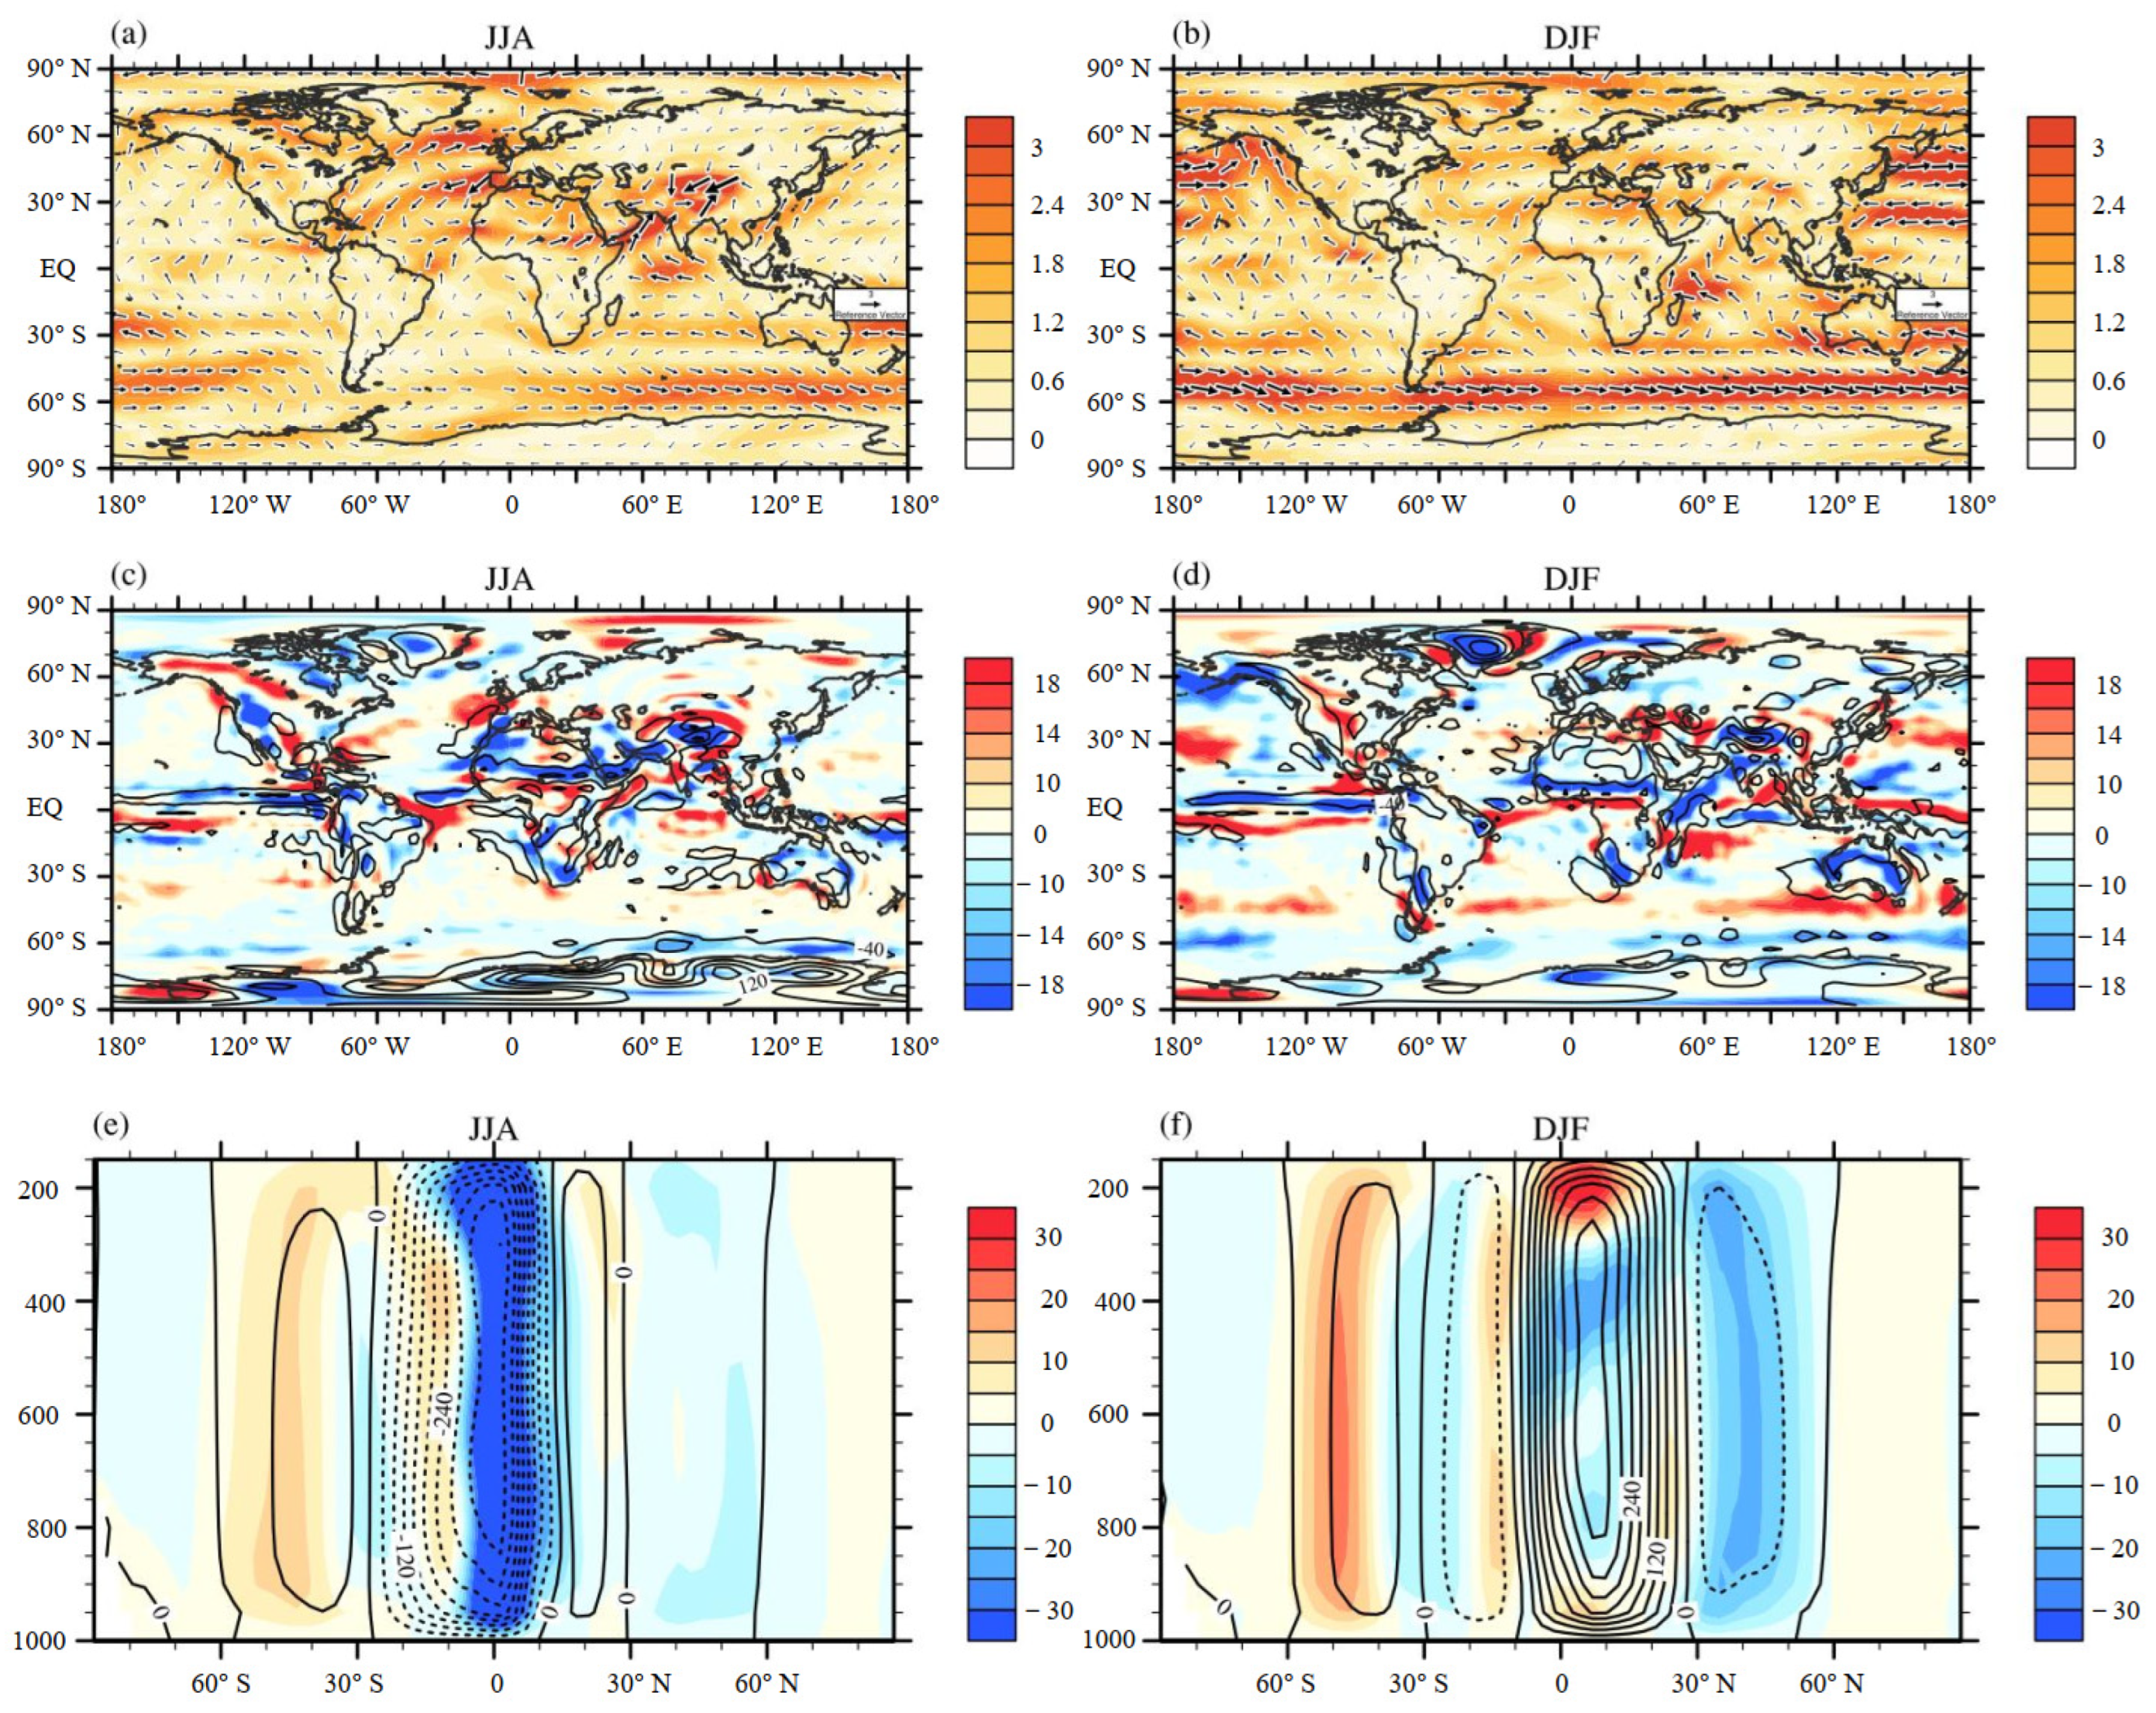
Figure 2 shows seasonal changes in the surface wind vector (U, V) under 4 × CO2-induced global warming, where U and V are the zonal and meridional wind speeds. Furthermore, changes in the convergence and divergence (∂U/∂x + ∂V/∂y) of wind near surface are presented.
In JJA, apparent changes in the surface wind vector occur over the Atlantic Ocean in the NH, whereas slight and messy changes in surface wind are seen over the Pacific Ocean. Over central Africa, an increase in the wind speed causes a significant convergence of surface wind over northern Africa. Changes in the wind vector are found in vortex forms over tropical regions, leading to a large account of convergence and divergence over this region (Figure 2a,c). The divergence/convergence of wind could cause a decrease/increase in local aerosol distributions when it overlaps with the source of aerosol particles. In addition, the eastward horizontal zonal wind is slightly strengthened over oceans at 50° S (Figure 2a). Horizontal divergence of surface wind at 50° S is minimal due to the parallel surface air flows. In DJF, the largest wind speed occurs over the Pacific Ocean in the NH, whereas the wind speed over the Atlantic Ocean is lower. Similar to changes in JJA, the convergence and divergence are also located over tropical areas in DJF (Figure 2b,d). Enhanced westerlies over oceanic regions at 50° S are much larger than those during JJA (Figure 2b). Changes in the surface wind vector and the resulting convergence and divergence may have impacts on variations of particles over the corresponding regions.
Changes in the zonal mean stream function of vertical atmospheric circulation under 4 × CO2-induced global warming (color contours), as well as the stream function at the 1 × CO2 level (solid and dashed lines), are also shown in Figure 2. In JJA, the Hadley cell in the NH is much weaker than that in the SH in the 1 × CO2 experiment. In 4 × CO2, the Hadley circulation in the SH is enhanced and moves northwards, whereas the Hadley in the NH becomes much weaker (Figure 2e). Changes in the Hadley circulation would lead to a northward shift of the intertropical convergence zone (ITCZ). Moreover, the Ferrel cell in the SH is slightly strengthened due to rising CO2 levels, which could be the reason for small increases in the surface wind speed over the oceanic regions at 50° S (Figure 2e) due to the Coriolis force. However, in DJF, the situation is totally different from that in JJA. The Hadley is more robust in the NH than in the SH in the 1 × CO2 experiment (Figure 2f). Under 4 × CO2-induced warming, the Hadley and Ferrel cells in the NH are slightly intensified, with the ascending branches of Hadley circulations moving southward. A strengthened Hadley circulation in the NH is likely to lead to a southward shift of ITCZ. In the SH, although a weakened trend is found in the Hadley circulation, the Ferrel cell is strengthened in DJF due to 4 × CO2-induced warming. The enhanced Ferrel cell contributes to the increase in the wind speed over oceanic regions in the SH.
Figure 3 shows the geographic distributions of changes in total cloud cover (TCC, the sum of low, middle, and high cloud fractions) and precipitation during JJA and DJF, respectively, under 4 × CO2-induced global warming. The simulated global annual mean TCC decreases by approximately 2.73% in JJA and increases by 0.75% in DJF. In JJA, the TCC decreases over most continental regions with the rising CO2 levels. The relatively large decreases of TCC are over Europe, North America, eastern South America, and southern Africa. The reductions over the regions mentioned above are mainly due to dry descending air branches of the Hadley and Ferrel cells caused by CO2-induced warming, as shown in Figure 2. The reductions in cloud over regions in the subtropics and mid-latitude under global warming have also been shown in climatic models and observations [16,17]. Increases of TCC caused by rising CO2 levels are located over the high latitudes of the two hemispheres, such as oceanic regions at latitudes between 80° N to 90° N in the NH, and regions at 70° S in the SH. Increases of TCC at 70° S are mainly due to the amplified Ferrel cell in the SH during JJA. At high latitudes, the maximum increases of TCC reach up to 49% in the NH and 40% in the SH. In addition, some slight increases in TCC caused by rising CO2 concentrations are over regions at 10° N during JJA, such as western North America, South Asia, and the oceans west of northern Africa. Increases in TCC over these regions above are mainly due to the shift of the ascending branch of the Hadley circulation (Figure 2e). In DJF, the increases in TCC in the NH shift to the regions with latitudes ranging from 50° N to 80° N. The most apparent increases are over the northwestern part of North America and northern Asia, with the maximum increase reaching up to 54%. Apparent decreases in TCC are still found over lower and mid-latitudes, which are similar to changes in TCC during JJA.
Global averaged precipitation increases by 0.37 mm day−1 in JJA and 0.41 mm day−1 in DJF. Apparent increases occur over the tropical regions during both seasons (Figure 3c,d). In JJA, increases in precipitation are located in the tropical regions of the NH, especially over oceanic regions at 10° N, such as the central Pacific Ocean, South Asia, and their neighboring oceanic regions (Figure 3c). The maximum increase over these regions above reaches up to 8.18 mm day−1. Increases in precipitation at 10ºN are mainly caused by the northward shift of ITCZ under 4 × CO2-induced warming, as shown in Figure 2. In DJF, the ITCZ is shifted to the regions at 10° S; thus, the changes in the distribution of precipitation become different from those of JJA. For the central Pacific Ocean, increases of precipitation in the NH are weakened, with significant increases occurring over areas at 10ºS over the eastern Pacific Ocean (Figure 3d). For South Asia, increases in precipitation shift to the central Indian Ocean in DJF. In addition, there are slight increases over mid- and high latitudes in both the NH and SH during the two seasons (Figure 3c,d). The distributions of changes in precipitation are mainly caused by the strengthened Hadley circulation in the NH under 4 × CO2-induced global warming.
Furthermore, increases in precipitation are at mid- and high latitudes in both the NH and SH in both seasons. Over mid- and high-latitude regions, increases in precipitation during DJF are much larger than those in JJA, which is caused by different changes in particles in the two seasons. Strengthened ascending branches of the Ferrel cell, along with the amount of moisture from the ocean, are the main leading factors of increases in precipitation. Changes in TCC and precipitation may play roles in variations of anthropogenic and natural particulate matter in JJA and DJF, under CO2-induced global warming.

3.2. Variations in Anthropogenic Particulate Matters

This section presents the differences in anthropogenic aerosol column concentrations between the experiments of 4 × CO2 and 1 × CO2. 
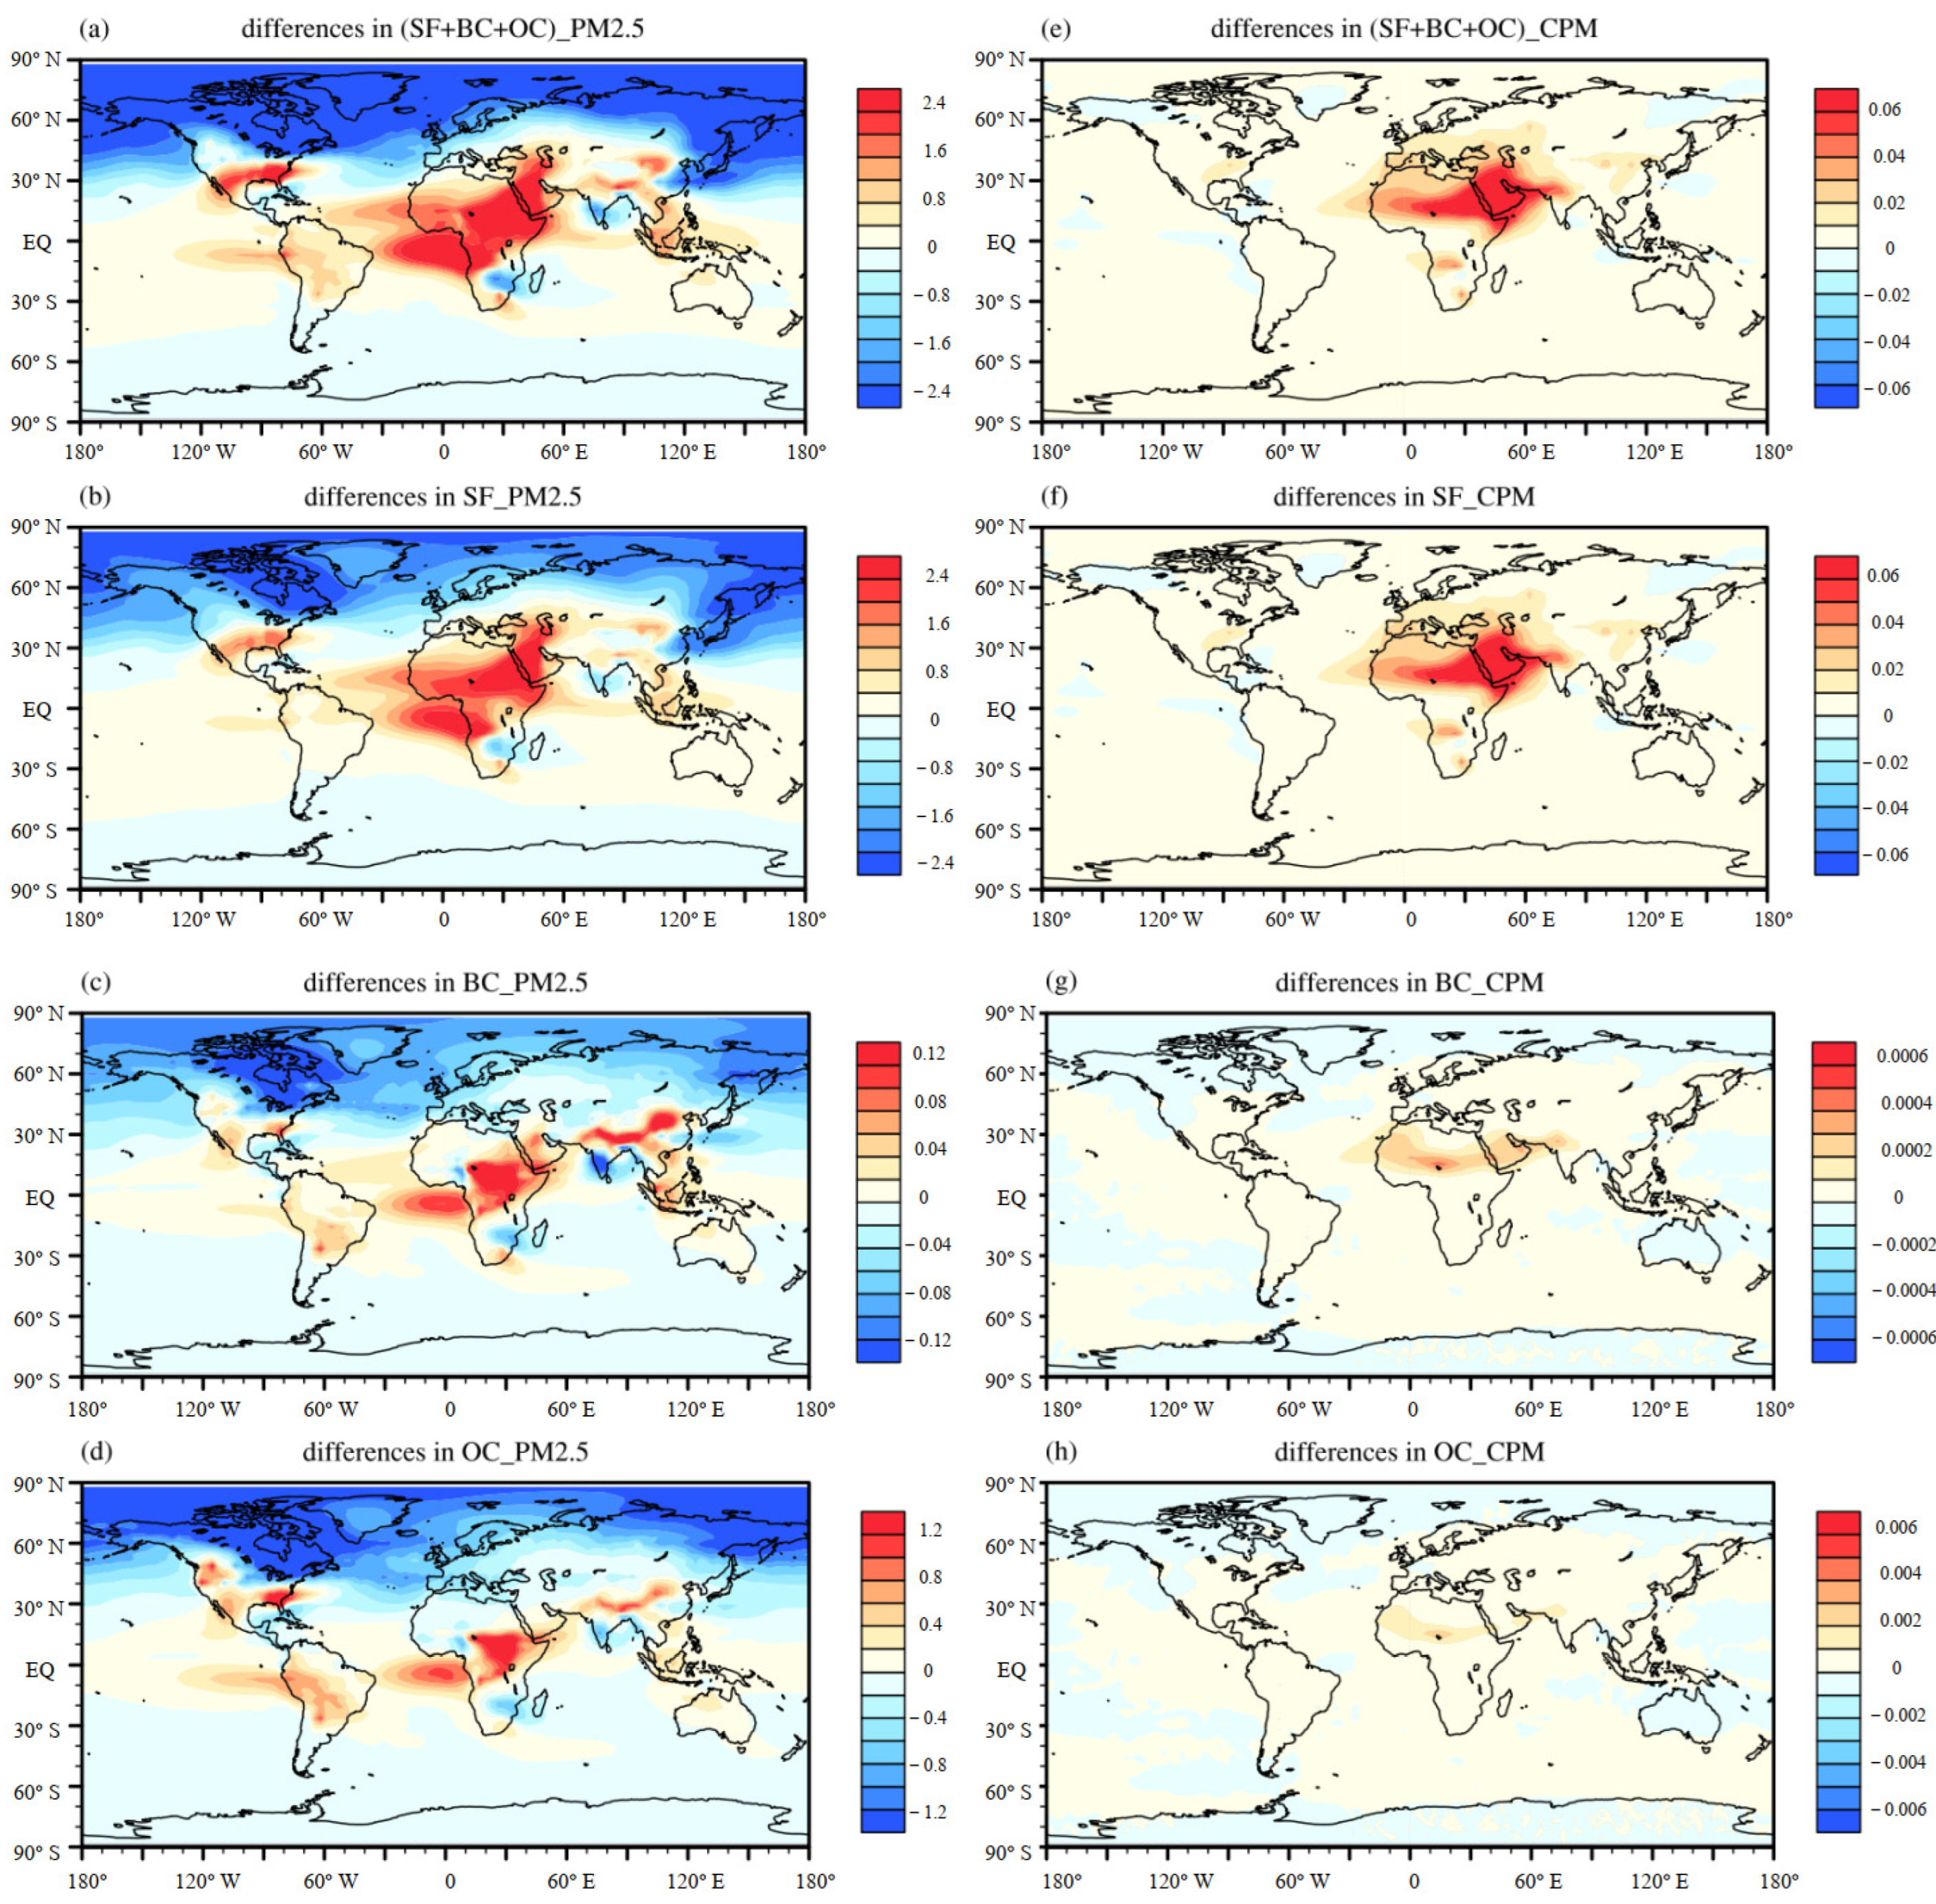
Figure 4 shows the JJA seasonal mean of geographic distributions of changes in column concentrations of anthropogenic PM2.5 and CPM. Global mean column concentrations of PM2.5 decrease by approximately 0.19 mg m−2, and those of CPM increase by 0.005 mg m−2. Changes in fine particles are about two or more orders of magnitude larger than those of particulate matter of coarse mode. Variations of corresponding SO4, BC, and OC particles of fine and coarse modes in JJA are also shown in Figure 4. Decreases in global mean column concentrations of SO4 (PM2.5), BC (PM2.5), and OC (PM2.5) are 0.07, 0.01, and 0.11 mg m−2, respectively, contributing about 37%, 5%, and 58% to the total reduction of PM2.5. The global mean SO4 (CPM) burden increases by 0.005 mg m−2, accounting for almost of the total increase in CPM. Changes in BC (CPM) and OC (CPM) particles are very small. For fine anthropogenic particles, the PM2.5 burden decreases sharply over the mid- and high-latitude regions, especially in the NH, whereas it increases over the continental areas at lower latitudes in the two hemispheres during summer (Figure 4a). In addition, it is found that changes in column concentrations of the three individual species (SO4 (PM2.5), BC (PM2.5), and OC (PM2.5)) are similar to those of PM2.5 from the perspective of global distributions (Figure 4b–d). The largest reduction in the anthropogenic PM2.5 burden occurs over North America and North Asia. Over mid- and high-latitude regions (regions with latitudes > 40° N), regional mean burdens of PM2.5, SO4 (PM2.5), BC (PM2.5), and OC (PM2.5) particles decrease by approximately 2.41, 1.49, 0.07, and 0.85 mg m−2, with three individual species (SO4 (PM2.5), BC (PM2.5), and OC (PM2.5)) contributing about 62%, 3%, and 35%, respectively, to the reduction of total fine anthropogenic particles. The most apparent increases in PM2.5, SO4 (PM2.5), BC (PM2.5), and OC (PM2.5) column concentrations are located over the Arabian Peninsula and Africa, with the regional mean increases reaching up to 2.79 and 3.35 mg m−2. Also, changes in anthropogenic PM2.5 particles over the Arabian Peninsula are mainly caused by increases of the SO4 (PM2.5) burden (about 2.44 mg m−2), contributing about 87% to the total changes. Over Africa, the SO4 (PM2.5), BC (PM2.5), and OC (PM2.5) column concentrations increase by 2.28, 0.14, and 0.93 mg m−2, accounting for about 68%, 4%, and 28% of the total increase of anthropogenic PM2.5. Slight increases occur over southern North America, South America, East Asia, and Southeast Asia, with the largest regional mean increases of total fine particles reaching up to 0.72 mg m−2.
Different from changes in fine anthropogenic particulate matter, the column concentrations of coarse particles apparently increase over the Arabian Peninsula, with regional mean burdens increasing by 0.109 mg m−2. Over these growing areas, the regional mean column concentrations of SO4 (CPM) increase by approximately 0.108 mg m−2, accounting for about 99% of the total anthropogenic CPM changes. Changes in BC (CPM) and OC (CPM) particles are much smaller than those in SO4 (CPM). A slight increase of 0.04 mg m−2 is also found over central Africa. Changes in CPM over the rest of the areas are very small (Figure 4e) since changes in BC (CPM) and OC (CPM) column concentrations are about two orders of magnitude smaller than the corresponding concentrations of fine particles in JJA. Therefore, the paper does not pay more attention to changes in carbon particles in JJA. Increases in anthropogenic CPM over central Africa are consistent with those of fine particulate matters, which could be put together in the discussion of the climatic factors, as in the following sections.
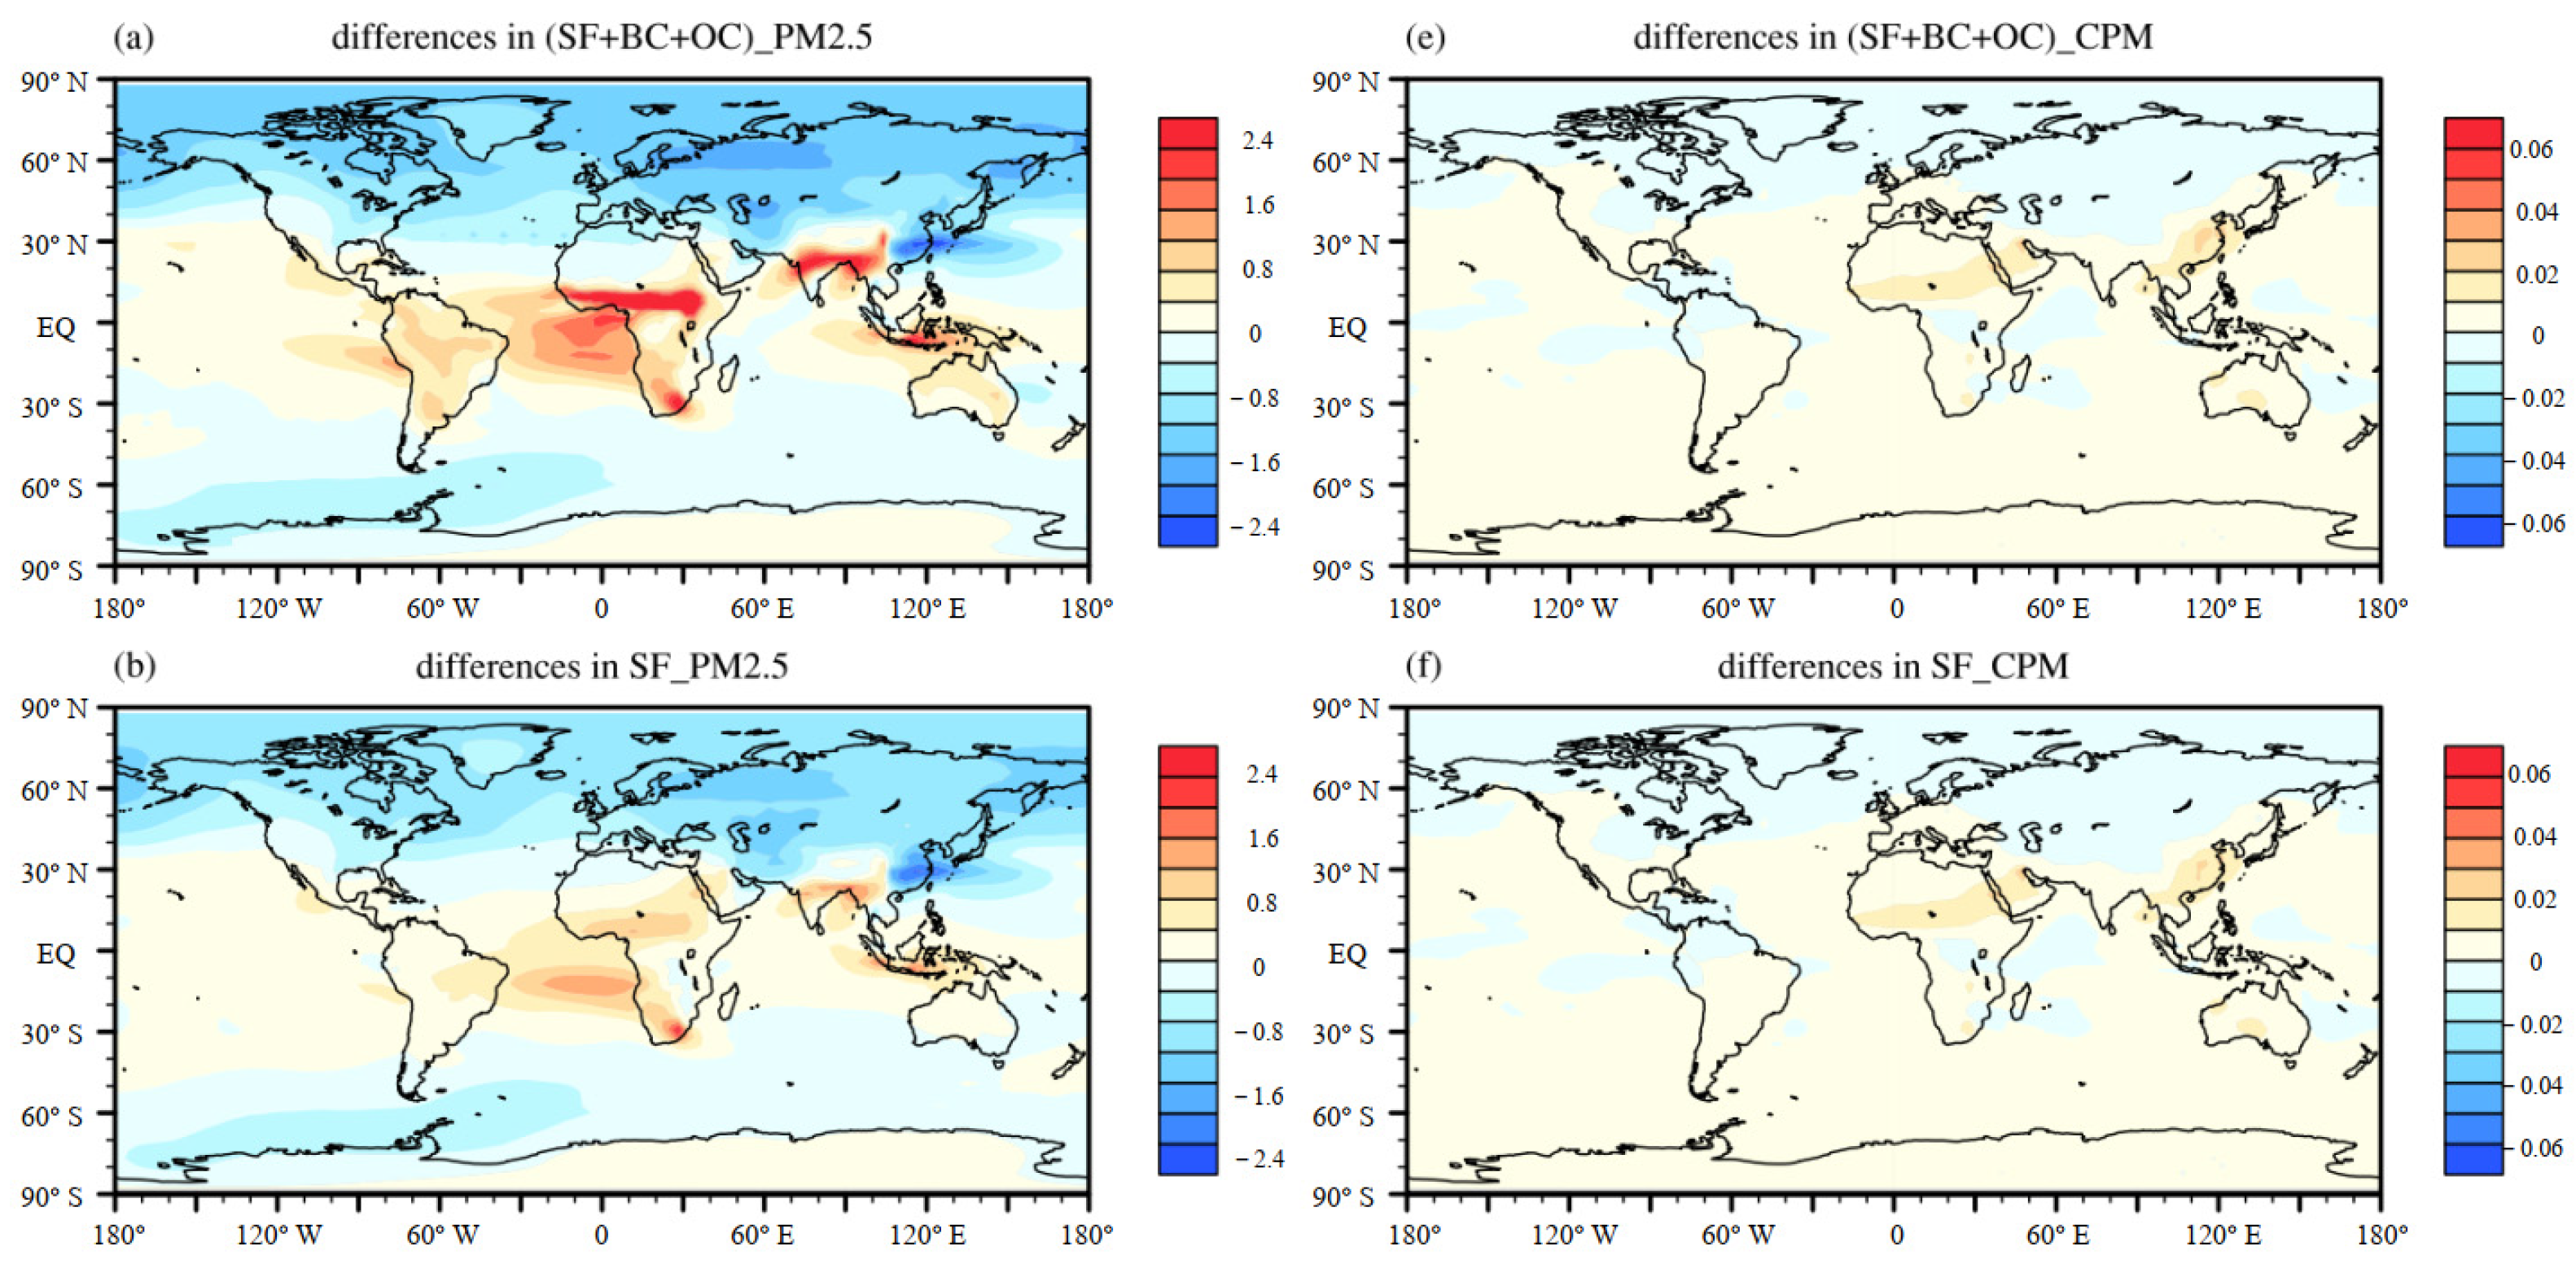
Figure 5 shows the corresponding changes in fine and coarse anthropogenic particles during DJF. It is interesting to find, to some extent, that the geographic distributions of changes in anthropogenic PM2.5 in DJF are similar to those in JJA, but the magnitudes of maximum regional changes are much smaller than those in JJA (Figure 4a and Figure 5a). Similar to JJA, the burden of anthropogenic PM2.5 decreases in mid- and high latitudes in the NH, with the maximum decrease occurring over East Asia, and increases over some regions in the tropics and over central Africa. Over mid- and high-latitude regions, decreases in anthropogenic PM2.5 during DJF are much smaller than those during JJA. The main reason is the lower column concentration of anthropogenic PM2.5 in DJF than in JJA. Although changes in rainfall are more conducive to a decreased PM2.5 burden during DJF, the decreasing regions of anthropogenic PM2.5 over Asia are broader to the south. Furthermore, the growing regions are narrowed down sharply, especially over northern and central Africa. Over the Arabian Peninsula, the trend of changes in anthropogenic PM2.5 shifts from a noticeable increase in JJA to a small decrease in DJF. The same as in JJA, changes in particles of coarse mode are much lower than those of fine particles in DJF.
Under 4 × CO2-induced warming, changes in anthropogenic fine and coarse particulate matter can be analyzed and understood from changes in surface wind and precipitation caused by rising CO2 concentrations, as shown in Section 3. In both JJA and DJF, the burden of the anthropogenic particle decreases over mid- and high latitudes and increases over some land regions in the tropics. Based on the results of precipitation, it is found that large-scale precipitation over mid- and high-latitude regions in the NH increases, which leads to enhanced wet deposition over these regions during both JJA and DJF. Changes in the surface wind are minimal and messy at mid- and high latitudes, and contribute little to decreases over these regions (Figure 2). Although convergences occur over eastern Greenland and the northern part of North Asia, the anthropogenic particles are still exposed to a decrease because there is no particle source over these regions. Over Europe and central Asia, the precipitation falls slightly during JJA, but increases during DJF, which supports the broadened decrease over Asia and Europe in DJF. Although the anthropogenic particle burden increases over regions in the tropics in both JJA and DJF, some differences still can be found over some regions caused by variations in some climatic factors. For example, over the Arabian Peninsula, the anthropogenic particle burden decreases in JJA but increases in DJF, which is opposite to the trends of precipitation in JJA and DJF.
In the mode of high CO2 concentrations, the column concentrations of PM2.5 may be larger [18,19]. The wet deposition caused by the rising CO2 concentrations is the most important factor in changes in the column concentrations of anthropogenic particulate matter.

3.3. Variations in Natural Particulate Matters

Figure 6 shows the geographic distributions of changes in column concentrations of natural PM2.5 and CPM, as well as in the corresponding species of fine and coarse particles in JJA under 4 × CO2-induced global warming. Different from the anthropogenic particles, the column concentrations of natural particulate matter in both modes increase significantly over northern Africa and the Arabian Peninsula. Global mean burden increases of natural PM2.5 and CPM are 7.00 and 3.60 mg m−2; much more substantial than the corresponding results of anthropogenic particles. Increases in fine particles are more apparent than those of coarse particles in JJA, and contribute approximately 66% to the total increase of natural aerosols. Changes in SD particles mainly cause increases in PM2.5 and CPM over northern Africa and the Arabian Peninsula. From Figure 6b,e, it can be seen that the distributions of changes in SD (PM2.5) and SD (CPM) are highly consistent with those of corresponding natural PM2.5 and CPM particles, respectively, occurring over central Africa and the Arabian Peninsula. The global mean burden of SD (PM2.5) and SD (CPM) increases by 6.45 and 2.63 mg m−2, and contributes 92% and 73% to PM2.5 and CPM particles in JJA due to 4 × CO2-induced climate change. Similar to the changes in total fine and coarse particulate matter, the increases in SD (PM2.5) in JJA also are more severe than changes in SD (CPM) over these significant areas mentioned above. In addition, slight increases in PM2.5 and CPM column concentrations are shown over the oceanic regions near 50°S in JJA under 4 × CO2-induced warming, which is mainly due to changes in SS. From Figure 6c,f, it can be seen that significant increases in SS (PM2.5) and SS (CPM) are shaped as a band over oceans at 50° S. Opposite to the results of total natural particles and SD, the increase in coarse SS particles is much higher than that of fine mode. Over the jet stream regions from 40° S to 60° S, the maximum increases of SS (PM2.5) and SS (CPM) reach up to 7.00 and 19.02 mg m−2, respectively.
Figure 7 is the same as Figure 6, but for the season of DJF. Different from the result of JJA, the decrease in changes in natural particles becomes the dominant tendency over the continental regions, especially the fine natural particles over land areas in the NH. Except for a few areas in East Asia, the column concentrations of natural PM2.5 in DJF decrease over the regions with latitudes 30° N, especially over northern Africa, the northern part of the Arabian Peninsula, central Asia, North Asia, and North America. The most substantial decrease in fine natural particles reaches up to 206.86 mg m−2. On the other hand, the reductions in coarse natural particles are much smaller than those of fine natural particulate matter, with apparent reductions occurring over northern Africa and central Asia. Slight increases in the natural PM2.5 and CPM burden are also found in some land regions, such as western North Africa, East Asia, and Western Australia, which is also due to increases in SD particles of both fine and coarse modes. Compared with the distributions of changes in SD particles (Figure 7b,e), changes in PM2.5 and CPM over most land regions are mainly dominated by changes in SD particles. For SS particles, both SS (PM2.5) and SS (CPM) increase over oceanic regions near 50° N and 50° S during DJF. Increases in the column concentrations of SS (PM2.5) particles are much smaller than those of SS (CPM). Increases in the SS (PM2.5) burden are often offset by the decreases in SD (PM2.5), especially over the oceanic regions near 50° N (Figure 7a–c). Increases in the SS (CPM) burden are much larger, with maximum increases of 18.58 and 15.10 mg m−2 over the oceanic regions (near 50° N) in the NH and SH. The rising SS (CPM) burden in the NH will lead to slight increases in natural particles of the coarse mode over the oceans in the mid-latitudes in the NH (Figure 7d,f).
The results in Figure 6 and Figure 7 show that the fine and coarse models have the same trends of changes. Climate change, as well as land-use change, might be the most important factors affecting the variations of natural particle burden in the atmosphere [20].
In JJA, the column concentrations of natural PM2.5 and CPM increase over northern Africa and the Arabian Peninsula, which is associated with the large sand source region of the Sahara Desert. Changes in the distributions of natural particles can be found when the divergence/convergence of surface wind overlaps with the source regions. As discussed above, the Hadley circulation in the SH is strengthened and moves northward during JJA, with the ascending branch of the Hadley circulation extending around 10° N. The enhanced northward surface wind of the Hadley circulation and the weakened southward surface wind lead to a horizontal convergence over regions at 10° N. The convergence occurs over the desert region, which could contribute to the increases in natural particles over northern Africa and the Arabian Peninsula. In JJA, the precipitation and TCC over North Africa and the Arabian Peninsula decrease slightly under 4 × CO2 (Figure 3), and are conducive to the increases in natural particles due to a weaker wet deposition over these regions. These decreases in the precipitation and TCC over North Africa and the Arabian Peninsula rely on the changes in the atmospheric circulation. For SS particles, from the comparisons of the changes in the SS burden and the surface wind speed shown in Figure 2 and Figure 6, we can conclude that the rising column concentrations of SS particles are mainly caused by the enhanced eastward wind speed over oceanic regions, especially in the polar jet stream regions. As discussed above, the accelerated wind speed over oceanic regions at 50° N and 50° S are mainly caused by the strengthened Ferrel cell in the two hemispheres (Figure 2).
In DJF, the column concentrations of natural particles of both fine and coarse modes decrease over most continental regions in the NH, except for the west coast of North America, Australia, North Africa and the eastern and northern regions of East Asia. The result of DJF is very different from that of JJA, particularly for SD in both fine and coarse modes. In DJF, Hadley and Ferrel cells in the NH are strengthened due to 4 × CO2-induced warming (Figure 3). The descending branches of Hadley and Ferrel cells are located over the lower-latitude regions (<30° N), leading to decreases in aerosol column loading over these regions; whereas the robust ascending branches of the enhanced Ferrel cell in the NH result in increases in precipitation over the mid- and high latitudes (>30° N). Over mid- and high latitudes, the rising precipitation could cause the apparent reductions in natural particles during DJF. The same as in JJA, the change in SS particle column loading is mostly associated with the surface wind speed. In summary, the divergence/convergence of surface wind, near-surface wind speed, and decreasing precipitation caused by the rising CO2 concentrations contribute most to changes in natural particle concentrations.

4. Conclusions

To understand the impact of climate change caused by rising CO2 levels on anthropogenic and natural particles, we have investigated the changes in anthropogenic and natural particulate matter with two modes of PM2.5 and CPM in DJF and JJA, under 4 × CO2-induced global warming.
In JJA, the column concentrations of anthropogenic PM2.5, as well as the corresponding species, show significant decreases over mid- and high latitudes in the NH, but increase over the tropical land regions, with the global mean column concentration of PM2.5 decreasing by approximately 0.19 mg m−2. The global mean column concentration of CPM increases by 0.005 mg m−2. The anthropogenic CPM burden increases over northern Africa and the Arabian Peninsula, mainly dominated by the changes in SO4 (CPM). In DJF, the changing patterns in anthropogenic PM2.5, as SO4 (PM2.5), BC (PM2.5), and OC (PM2.5), are consistent with those in JJA, with a decrease at high latitudes and a small increase in the tropics. The magnitudes of maximum regional changes are much smaller than those in JJA. Changes in anthropogenic CPM, as SO4 (CPM), BC (CPM), and OC (CPM), in DJF are small over the globe. For natural particles, the changes in both fine and coarse modes are in the same order of magnitude, in which the changes in SD (PM2.5) are more apparent than those in SD (CPM), and the changes in SS (PM2.5) are less apparent than those in SS (CPM). The column concentrations of natural particles increase over northern Africa and the Arabian Peninsula in JJA, but decrease over most of the continental regions, especially for natural PM2.5 over land areas in the NH during DJF. The SS particle burdens increase over the oceanic regions near 50°N, both in JJA and DJF.
Under 4 × CO2-induced warming, changes in the climatic variables provide physical explanations for the variations of anthropogenic and natural particles. Changes in the column concentrations of anthropogenic particles are primarily caused by the increases in precipitation through wet deposition during both JJA and DJF, especially over the mid- and high-latitude regions. Changes in the burden of natural particulate matter are affected by various climatic variables, including surface wind speed, the divergence/convergence of surface wind, and precipitation.
PM2.5 is the primary factor for air quality. This study indicates that both fine and coarse anthropogenic PM2.5 present a decreasing trend in the mid- and high latitudes the in the NH, but an increasing trend in the mid- and low latitudes in the SH, under the warming future climate, especially for the winter season. For natural particles, there are opposite signals for summer and winter, significantly over northern Africa and the Arabian Peninsula. This could be an important base for governments issuing laws concerning air pollution.

Author Contributions

Conceptualization, H.Z.; methodology, H.Z.; software, D.Y.; validation, D.Y.; formal analysis, D.Y.; investigation, D.Y.; resources, H.Z.; data curation, D.Y.; writing—original draft preparation, D.Y.; writing—review and editing, D.Y., H.Z. and J.L.; visualization, D.Y.; supervision, H.Z.; project administration, H.Z.; funding acquisition, H.Z. All authors have read and agreed to the published version of the manuscript.

Funding

This research was funded by the National Key R&D Program of China (2022YFC3701202) and the National Key Natural Science Foundation of China (42275039).

Institutional Review Board Statement

Not applicable.

Informed Consent Statement

Not applicable.

Data Availability Statement

The data presented in this study are available on request from the corresponding author. The data are not publicly available due to privacy. The data will be used for further research.

Conflicts of Interest

The authors declare no conflict of interest.

References

  1. Lu, X.; Zhang, S.; Xing, J.; Wang, Y.; Chen, W.; Ding, D.; Wu, Y.; Wang, S.; Duan, L.; Hao, J. Progress of air pollution control in China and its challenges and opportunities in the ecological civilization era. Engineering 2020, 6, 1423–1431. [Google Scholar] [CrossRef]
  2. Solomon, S.; Qin, D.; Manning, M.; Marquis, M.; Averyt, K.; Tignor, M.M.B.; Miller, H.L., Jr.; Chen, Z. Climate Change 2007: The Physical Science Basis; Working Group I Contribution to the Fourth Assessment Report of the IPCC; Cambridge University Press: Cambridge, UK, 2007; p. 996. [Google Scholar]
  3. Zickfeld, K.; Eby, M.; Matthews, H.; Weaver, A. Setting cumulative emissions targets to reduce the risk of dangerous climate change. Proc. Natl. Acad. Sci. USA 2009, 106, 16129–16134. [Google Scholar] [CrossRef] [PubMed]
  4. Dai, A. Increasing drought under global warming in observations and models. Nat. Clim. Chang. 2013, 3, 52–58. [Google Scholar] [CrossRef]
  5. Feng, S.; Fu, Q. Expansion of global drylands under a warming climate. Atmos. Chem. Phys. 2013, 13, 10081–10094. [Google Scholar] [CrossRef]
  6. Kloster, S.; Dentener, F.; Feichter, J.; Raes, F.; Lohmann, U.; Roeckner, E.; Bruns, I.F. AGCM study of future climate response to aerosol pollution reductions. Clim. Dyn. 2010, 34, 1177–1194. [Google Scholar] [CrossRef]
  7. Boucher, O.; Randall, D.; Artaxo, P.; Bretherton, C.; Feingold, G.; Forster, P.; Stocker, T.F.; Qin, D.; Plattner, G.-K.; Tignor, M.; et al. Clouds and Aerosols. In Climate Change 2013: The Physical Science Basis. Contribution of Working Group I to the Fifth Assessment Report of the Intergovernmental Panel on Climate Change; Cambridge University Press: Cambridge, UK, 2013; pp. 571–658. [Google Scholar]
  8. Zhang, H.; Zhao, S.Y.; Wang, Z.L.; Zhang, X.Y.; Song, L.C. The updated effective radiative forcing of major anthropogenic aerosols and their effects on global climate at present and in the future. Int. J. Climatol. 2016, 36, 4029–4044. [Google Scholar] [CrossRef]
  9. Westervelt, D.; Horowitz, L.; Naik, V.; Tai, A.; Fiore, A.; Mauzerall, D. Quantifying PM2:5-meteorology sensitivities in a global climate model. Atmos. Environ. 2016, 142, 43–56. [Google Scholar]
  10. Robert, J.A.; William, L.; Steven, T.R. An increase in aerosol burden and radiative effects in a warmer world. Nat. Clim. Chang. 2016, 6, 269–274. [Google Scholar]
  11. Leung, D.M.; Tai, A.P.; Mickley, L.J.; Moch, J.M.; Donkelaar, A.V.; Shen, L.; Martin, R.V. Synoptic meteorological modes of variability for fine particulate matter (PM 2.5) air quality in major metropolitan regions of China. Atmos. Chem. Phys. 2018, 18, 6733–6748. [Google Scholar] [CrossRef]
  12. Pendergrass, D.C.; Shen, L.; Jacob, D.J.; Mickley, L.J. Predicting the impact of climate change on severe wintertime particulate pollution events in Beijing using extreme value theory. Geophys. Res. Lett. 2019, 46, 1824–1830. [Google Scholar] [CrossRef]
  13. Xu, D.; Li, C.; Song, X.; Ren, H. The dynamics of desertification in the farming-pastoral region of North China over the past 10 years and their relationship to climate change and human activity. CATENA 2014, 123, 11–22. [Google Scholar] [CrossRef]
  14. Zhao, S.Y.; Zhang, H.; Wang, Z.L.; Jing, X.W. Simulating the Effects of Anthropogenic Aerosols on Terrestrial Aridity Using an Aerosol-Climate Coupled Model. J. Clim. 2017, 30, 7451–7463. [Google Scholar] [CrossRef]
  15. Hansen, J.; Lacis, A.; Rind, D.; Russell, G.; Stone, P.; Fung, I.; Ruedy, R.; Lerner, J. Climate Sensitivity: Analysis of Feedback Mechanisms. Clim. Process. Clim. Sensit. 1984, 29, 130–163. [Google Scholar]
  16. Manabe, S.; Bryan, K.; Spelman, M.J. Transient response of a global ocean-atmosphere model to a doubling of atmospheric carbon dioxide. J. Phys. Ocean Ogr. 1990, 20, 722–749. [Google Scholar] [CrossRef]
  17. Fasullo, J.T.; Trenberth, K.E. A less cloudy future: The role of subtropical subsidence in climate sensitivity. Science 2012, 338, 792–794. [Google Scholar] [CrossRef] [PubMed]
  18. Dong, F.; Yu, B.; Pan, Y. Examining the synergistic effect of CO2 emissions on PM2.5 emissions reduction: Evidence from China. J. Clean. Prod. 2019, 223, 759–771. [Google Scholar] [CrossRef]
  19. Requia, W.J.; Jhun, I.; Coull, B.A.; Koutrakis, P. Climate impact on ambient PM2.5 elemental concentration in the United States: A trend analysis over the last 30 years. Environ. Int. 2019, 131, 10488. [Google Scholar] [CrossRef] [PubMed]
  20. Su, H.; Jiang, J.H.; Zhai, C.; Shen, T.J.; Neelin, J.D.; Stephens, G.L.; Yung, Y.L. Weakening and strengthening structures in the Hadley Circulation change under global warming and implications for cloud response and climate sensitivity. J. Geophys. Res. 2014, 119, 5787–5805. [Google Scholar] [CrossRef]
Figure 1. Color contours on the maps indicate the changes in the spatial distributions of annual mean surface air temperature (SAT, units: K) in (a) summer (JJA) and (b) winter (DJF), caused by 4 × CO2−induced global warming; plots in the left column are simulated results during JJA, whereas plots in the right column are those during DJF; the solid line contours show SAT in the experiment of 1 × CO2.
Atmosphere 15 00105 g001
Figure 2. Color contours on the maps show changes in surface horizontal wind (a,b) (the shaded areas representing the wind speed, units: m s−1), horizontal divergence of surface wind (c,d) (units: m s−2), and stream function of vertical atmospheric circulation (e,f) (units: 10−11 kg s−1) during both JJA and DJF, respectively, caused by 4 × CO2-induced global warming; plots in the left column are simulated results during JJA, whereas plots in the right column are those during DJF; the solid line contours show horizontal divergence of surface wind (c,d) and stream function of vertical atmospheric circulation (e,f) in the experiment of 1 × CO2.
Atmosphere 15 00105 g002
Figure 3. Color contours on the maps show the changes in the spatial distributions of annual mean total cloud fraction (a,b) (TCC, units: %) and precipitation (c,d) (units: mm day−1) in JJA and DJF, respectively, caused by 4 × CO2-induced global warming; plots in the left column show simulated results during JJA, whereas plots in the right column show those during DJF; the solid line contours show TCC (a,b) and precipitation (c,d) in the 1 × CO2 experiment.
Atmosphere 15 00105 g003aAtmosphere 15 00105 g003b
Figure 4. Global distributions of changes in annual mean column concentrations of anthropogenic PM2.5 and CPM in JJA, caused by 4 × CO2-induced global warming (units: mg m−2). Plots in the left column represent changes in the annual mean column concentrations of anthropogenic PM2.5, SO4 (PM2.5), BC (PM2.5), and OC (PM2.5), respectively; plots in the right column represent those of anthropogenic CPM, SO4 (CPM), BC (CPM), and OC (CPM), respectively.
Atmosphere 15 00105 g004
Figure 5. As described for Figure 4, but showing changes in the annual mean column concentrations of anthropogenic PM2.5 and CPM in DJF, caused by 4 × CO2-induced global warming (units: mg m−2).
Atmosphere 15 00105 g005aAtmosphere 15 00105 g005b
Figure 6. Global distributions of changes in annual mean column concentrations of natural PM2.5 and CPM in JJA, caused by 4 × CO2-induced global warming (units: mg m−2). Plots in the left column represent changes in the annual mean column concentrations of natural PM2.5, SD (PM2.5), and SS (PM2.5), respectively; plots in the right column represent those of natural CPM, SD (CPM), and SS (CPM), respectively.
Atmosphere 15 00105 g006
Figure 7. As described for Figure 6, but showing changes in the annual mean column concentrations of natural PM2.5 and CPM in DJF, caused by 4 × CO2-induced global warming (units: mg m−2).
Atmosphere 15 00105 g007
Table 1. Experimental design.
GroupTest
Name
CO2 Mass-Mixing Ratios
(Units: ppm)
Sea
Temperature
Running Years
(Units: Year)
11 × CO2389Coupled SOM80
22 × CO2798Coupled SOM80
34 × CO21556Coupled SOM80
Disclaimer/Publisher’s Note: The statements, opinions and data contained in all publications are solely those of the individual author(s) and contributor(s) and not of MDPI and/or the editor(s). MDPI and/or the editor(s) disclaim responsibility for any injury to people or property resulting from any ideas, methods, instructions or products referred to in the content.

