Article

Source Attribution and Process Analysis of Summertime Ozone Pollution in Guanzhong Basin, Northwestern China

1
Sichuan Academy of Environmental Policy and Planning, Chengdu 610041, China
2
Tianfu Yongxing Laboratory, Chengdu 610217, China
3
Wuxi Ninecosmos Science and Technology, Wuxi 214000, China
*
Author to whom correspondence should be addressed.
Atmosphere 2023, 14(12), 1742; https://doi.org/10.3390/atmos14121742
Submission received: 13 October 2023 / Revised: 17 November 2023 / Accepted: 22 November 2023 / Published: 26 November 2023
(This article belongs to the Special Issue Ozone Pollution and Effects in China)

Abstract

:
The adverse effects of the transportation of O3 and its precursors on local air quality under certain meteorological conditions has long been recognized. Previous studies covered the effects of their transport without distinguishing specific forms (direct transport, via air pollutants originating from emissions outside the target regions; indirect transport, via air pollutants generated from chemical reactions between local and outside precursors) and processes (chemical and physical). This study aimed to figure out the effects of different scales of emissions on O3 pollution in the Guanzhong basin (GZB) by quantifying the forms and processes of transport using the CAMx model. The results showed that the emissions on different scales had various pathways for influencing O3 formation under two polluted, synoptic circulation types (southeast high and northeast ridge). Under the southeast high type, the meteorological conditions favored the chemical production of O3, which led to the highest local O3 contributions from the GZB. The prominent cross-regional transport was positive for indirect transport from south Shaanxi, implying the synergistic impacts of biogenic VOCs and urban pollutants in the GZB. With the southerly winds in the GZB, the downwind cities of Xi’an were impacted by positive direct and indirect transport from the emissions of Xi’an. These impacts occurred through the processes of gas-phase chemistry (especially O3P + O2 and O3 + NO) and vertical advection. For the northeast ridge type, positive direct transport from the emissions of Henan Province was important for O3 pollution in the GZB, as there were remarkable easterly airflows. From the east to the west of the GZB, the impacts from the emissions from Henan Province on cities in the GZB were reduced, which occurred through the processes of horizontal advection and vertical dispersion. This work highlights significant differences in the forms and processes of O3 formation in downwind areas impacted by the emissions from different-scale emissions, and advances our knowledge of atmospheric pollutant transport and its impact on O3 pollution.

1. Introduction

Troposphere ozone (O3) is an effective greenhouse gas and a strong oxidant that is detrimental to human health and vegetation growth [1,2]. Especially under favorable meteorological conditions, O3 transport could enhance O3 exposure and health risks [3,4,5]. High amounts of O3 are generated through the photochemical reactions of its two primary precursors (nitrogen oxides, NOx = NO + NO2, and volatile organic compounds (VOCs)), which could be emitted either locally or from distances of even hundreds of kilometers away under certain weather conditions [6,7,8]. Therefore, a key challenge in identifying the sources of O3 pollution is quantifying their contributions and processes on different scales.
The regional transport of O3 and its precursors significantly influences O3 pollution at a given location, which usually includes two forms: (1) direct transport: air pollutants originating from emissions outside the target regions; (2) indirect transport: e.g., NOx and VOCs from other regions participate in local atmospheric chemical reactions [9,10,11]. Such analyses are often qualitative, and detailed quantification of local and regional contributions to O3 need to be determined using chemical transport models (CTMs), such as reported in the following. The cross-state transport of O3 and its precursors is one of the most contentious issues in air pollution management and contributes up to 50% or more to O3 pollution in the eastern United States [12]. In China, transport from nearby cities and outside of the Yangtze River Delta (YRD) region provides the largest contribution (more than 60%) to O3 in the cities in the YRD [13]. Emissions in Hebei Province play an important role in O3 formation in the North China Plain (NCP); for example, transport from upwind cities in the Hebei Province significantly influence O3 pollution in Beijing, contributing 50% or more [14]. Furthermore, Wu et al. [15] pointed out that non-Beijing emissions provide contributions through direct transport (36.6%) and indirect transport (−5.1%) to summer O3 pollution in Beijing.
Enhanced local O3 formation is influenced by various physical and chemical processes under favorable meteorological conditions [16,17,18]. Specifically, net chemical production has a high value at vertical levels from 900 to 800 hPa, and O3 is generated and transported downward to increase O3 concentrations at the surface, whereas horizontal advection reduces surface O3 [19]. Notably, the precursors transported from source regions significantly influence local O3-NOx-VOCs sensitivity and enhance O3 formation [20,21,22]. However, the specific chemical and physical processes through which emissions from different source regions affect local O3 formation have rarely been quantified. Hence, investigation into the forms and detailed processes of the transportation of O3 and O3 precursors on local O3 pollution would be valuable for deepening the understanding of the interactions among pollutants from different regions.
The Xi’an-centered Guanzhong basin (GZB) is the most developed region in northwestern China, and one of the key regions for air pollution control, as listed by the Chinese government, with frequent O3 pollution in the summer [23,24]. A previous study [25] investigated the typical synoptic circulation types (CTs) related to summer O3 pollution and evaluated their impacts on the sources of O3 pollution in the GZB based on observational data analysis and model simulations. The results showed that local contributions and transport from regions outside of the GZB significantly affected O3 pollution in Xi’an and other cities (Weinan, Xiangyang, Tongchuan, and Baoji), but the impacts of the emissions from the cities in the GZB or outside areas on the forms and processes of O3 formation under CTs were not investigated.
In this study, sensitivity simulations using the Comprehensive Air Quality Model with Extensions (CAMx) were performed to assess how different-scale emissions influence O3 pollution and which form and process are more important. Section 2 explains the data and methodology, Section 3 presents the results and discussion, and Section 4 provides the summary and conclusions. This attempt to examine the forms and processes of O3 formation in the GZB is expected to deepen the understanding of the complex cause of O3 pollution in the region and beyond.

2. Materials and Methods

2.1. Air Quality and Meteorological Data

In this study, the surface O3 concentrations were obtained from the China National Environmental Monitoring Centre (http://106.37.208.233:20035/, last accessed: 22 February 2023). Frequent O3 pollution episodes were observed in the summer (June–August), and high O3 concentrations were generally observed in the daytime (10:00–18:00 local time (LT)). Hence, we selected a representative period (i.e., 14:00 LT) for the partial analysis of pollution and meteorological characteristics over the study area [25,26].

2.2. Classification of Circulation Types

Yan et al. [25] provided detailed analyses of the four typical CTs (southeast high and northeast ridge, east high, and northwest high type) associated with the occurrence of O3 pollution in the GZB. The northeast ridge type and southeast high type were identified as polluted. The east-high-type circulation was lightly polluted, and the northwest-high-type circulation was clean. Summer O3 pollution episodes were closely related to the presence of the northeast ridge type and southeast high type. Under the southeast high type, the meteorological conditions were marked by increased influence of southerly airflow, high temperature, low humidity, and the worst diffusion conditions, all of which were favorable for the local production of O3. The northeast ridge type was characterized by easterly airflows in the upper air, which transported O3 and its precursors from upwind polluted areas.

2.3. Model Setup and Approaches

Comprehensive Air Quality Model with Extensions (CAMx, version 6.50, http://www.camx.com, last accessed: 22 February 2023) was used to simulate O3 pollution in the GZB and its surrounding areas. The SAPRC-07 gas-phase mechanism was chosen for gas-phase chemistry in all the scenarios. Two-nested modeling domains with resolutions of 36 and 12 km (denoted as D01 and D02, respectively) were used in this study (Figure 1a). The Weather Research and Forecasting (WRF) model (version 3.2) provided the meteorological fields that were input in CAMx. The NCEP FNL data and the Community Atmosphere Model with Chemistry (CAM-chem) outputs were used to extract the initial and boundary meteorological and chemical conditions, respectively. For details about the model configurations, emissions inventory, and model performance, the reader can refer to a previous study [26]. The simulated meteorological factors used as inputs for CAMx and the simulated hourly O3 and NO2 concentrations of D02 matched the observed values, confirming the validity of the analyses.
The GZB was set as the target region in this study, and emissions in the five cities (Xi’an, XA; Xianyang, XY; Weinan, WN; Tongchuan, TC; Baoji, BJ) in the GZB and other regions (southern Shaanxi, SXS; northern Shaanxi, SXN; Henan Province, HN; Hubei Province, HB; other land regions, OTHER) within D02 (as shown in Figure 1b) were included or zeroed out in CAMx simulations to examine the effects of regional transport for on O3 pollution in the GZB.
In this study, six national air quality monitoring sites (as shown in Figure 1c) were chosen to analyze the sources of O3 pollution in the GZB, including Weinan Ribaoshe (WN_RBS, 34.5° N, 109.5° E), Lintong district in Xi’an (XA_LTD, 34.2° N, 108.9° E), Xiaozhai in Xi’an (XA_XZ, 34.5° N, 108.7° E), Normal school in Xianyang (XY_NS, 34.5° N, 108.7° E), Sanlu hospital in Baoji (BJ_SLH, 34.4° N, 107.1° E), and New District Management Committee in Tongchuan (TC_NDMC, 34.9° N, 108.9° E).

2.4. Factor Separation Approach and Scenario Design

The factor separation approach (FSA) was adopted to quantify the effects of different emission source regions on O3 formation. According to some studies [9,27], the FSA attributes air pollutant concentrations within the target regions to the following four types of contributions:
(1)
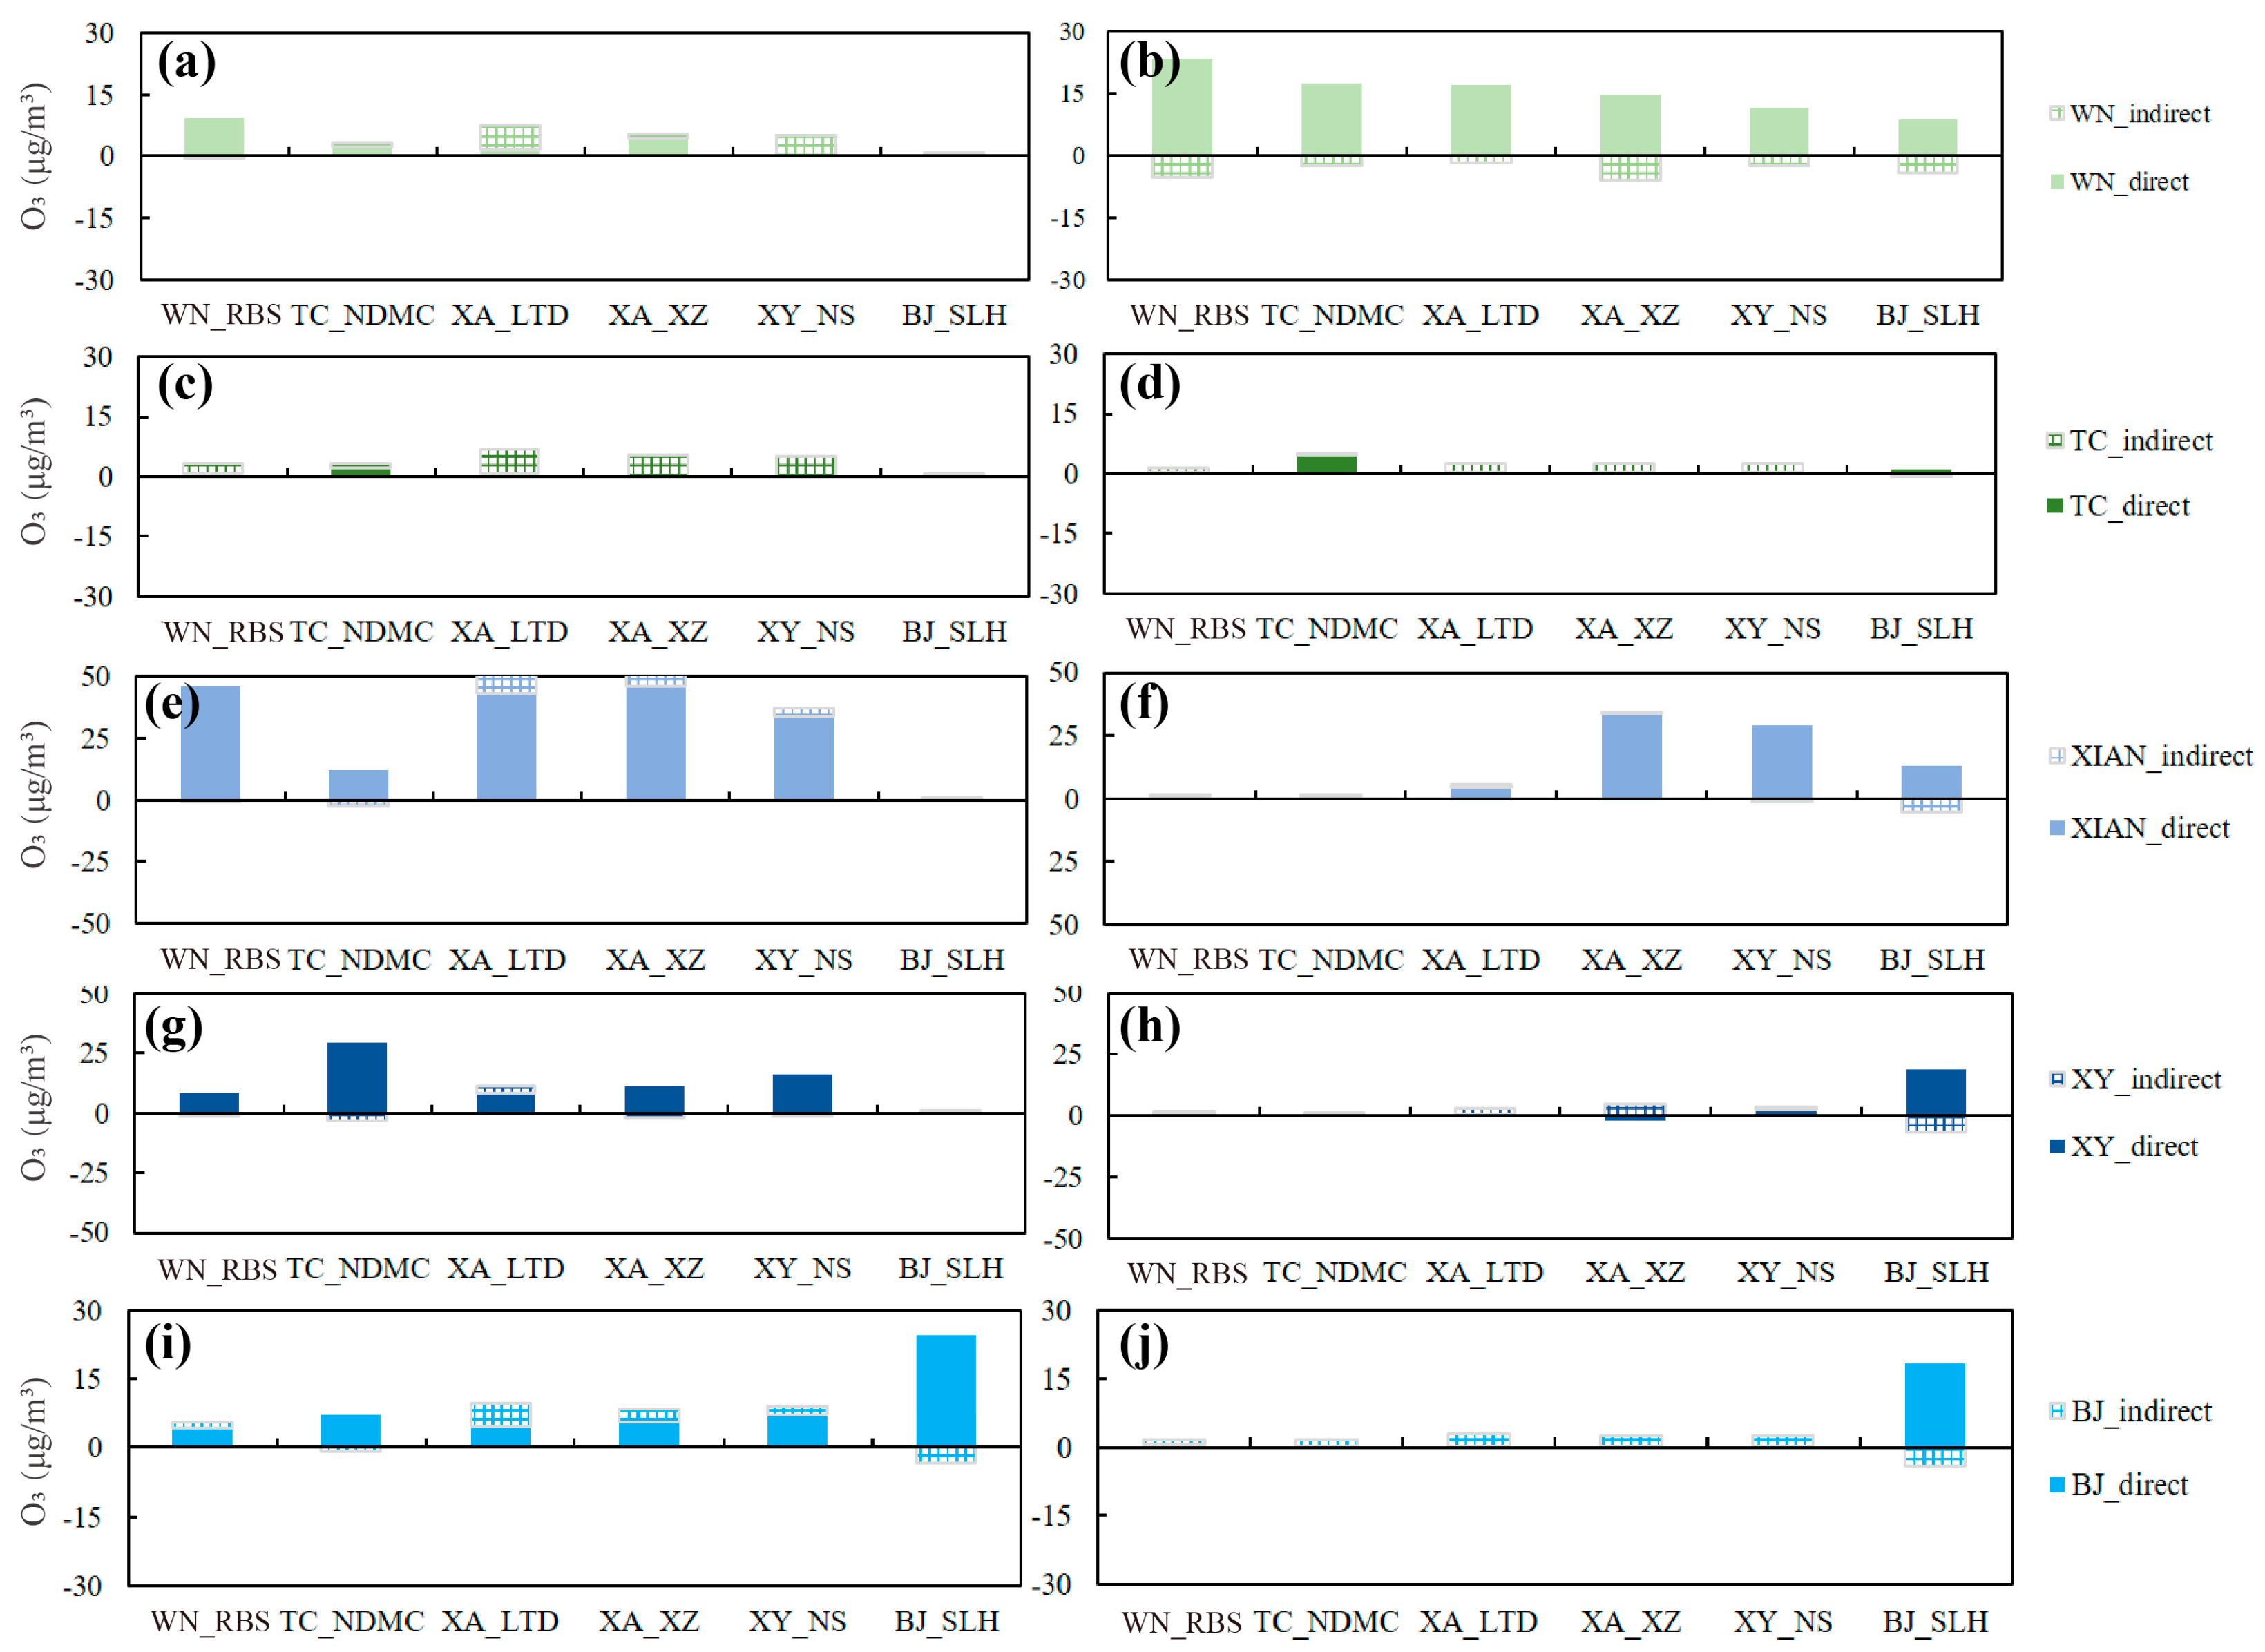
Local contribution (Flocal): air pollutants directly emitted by sources within target regions (or so-called local sources) and chemically produced from locally emitted precursors.
(2)
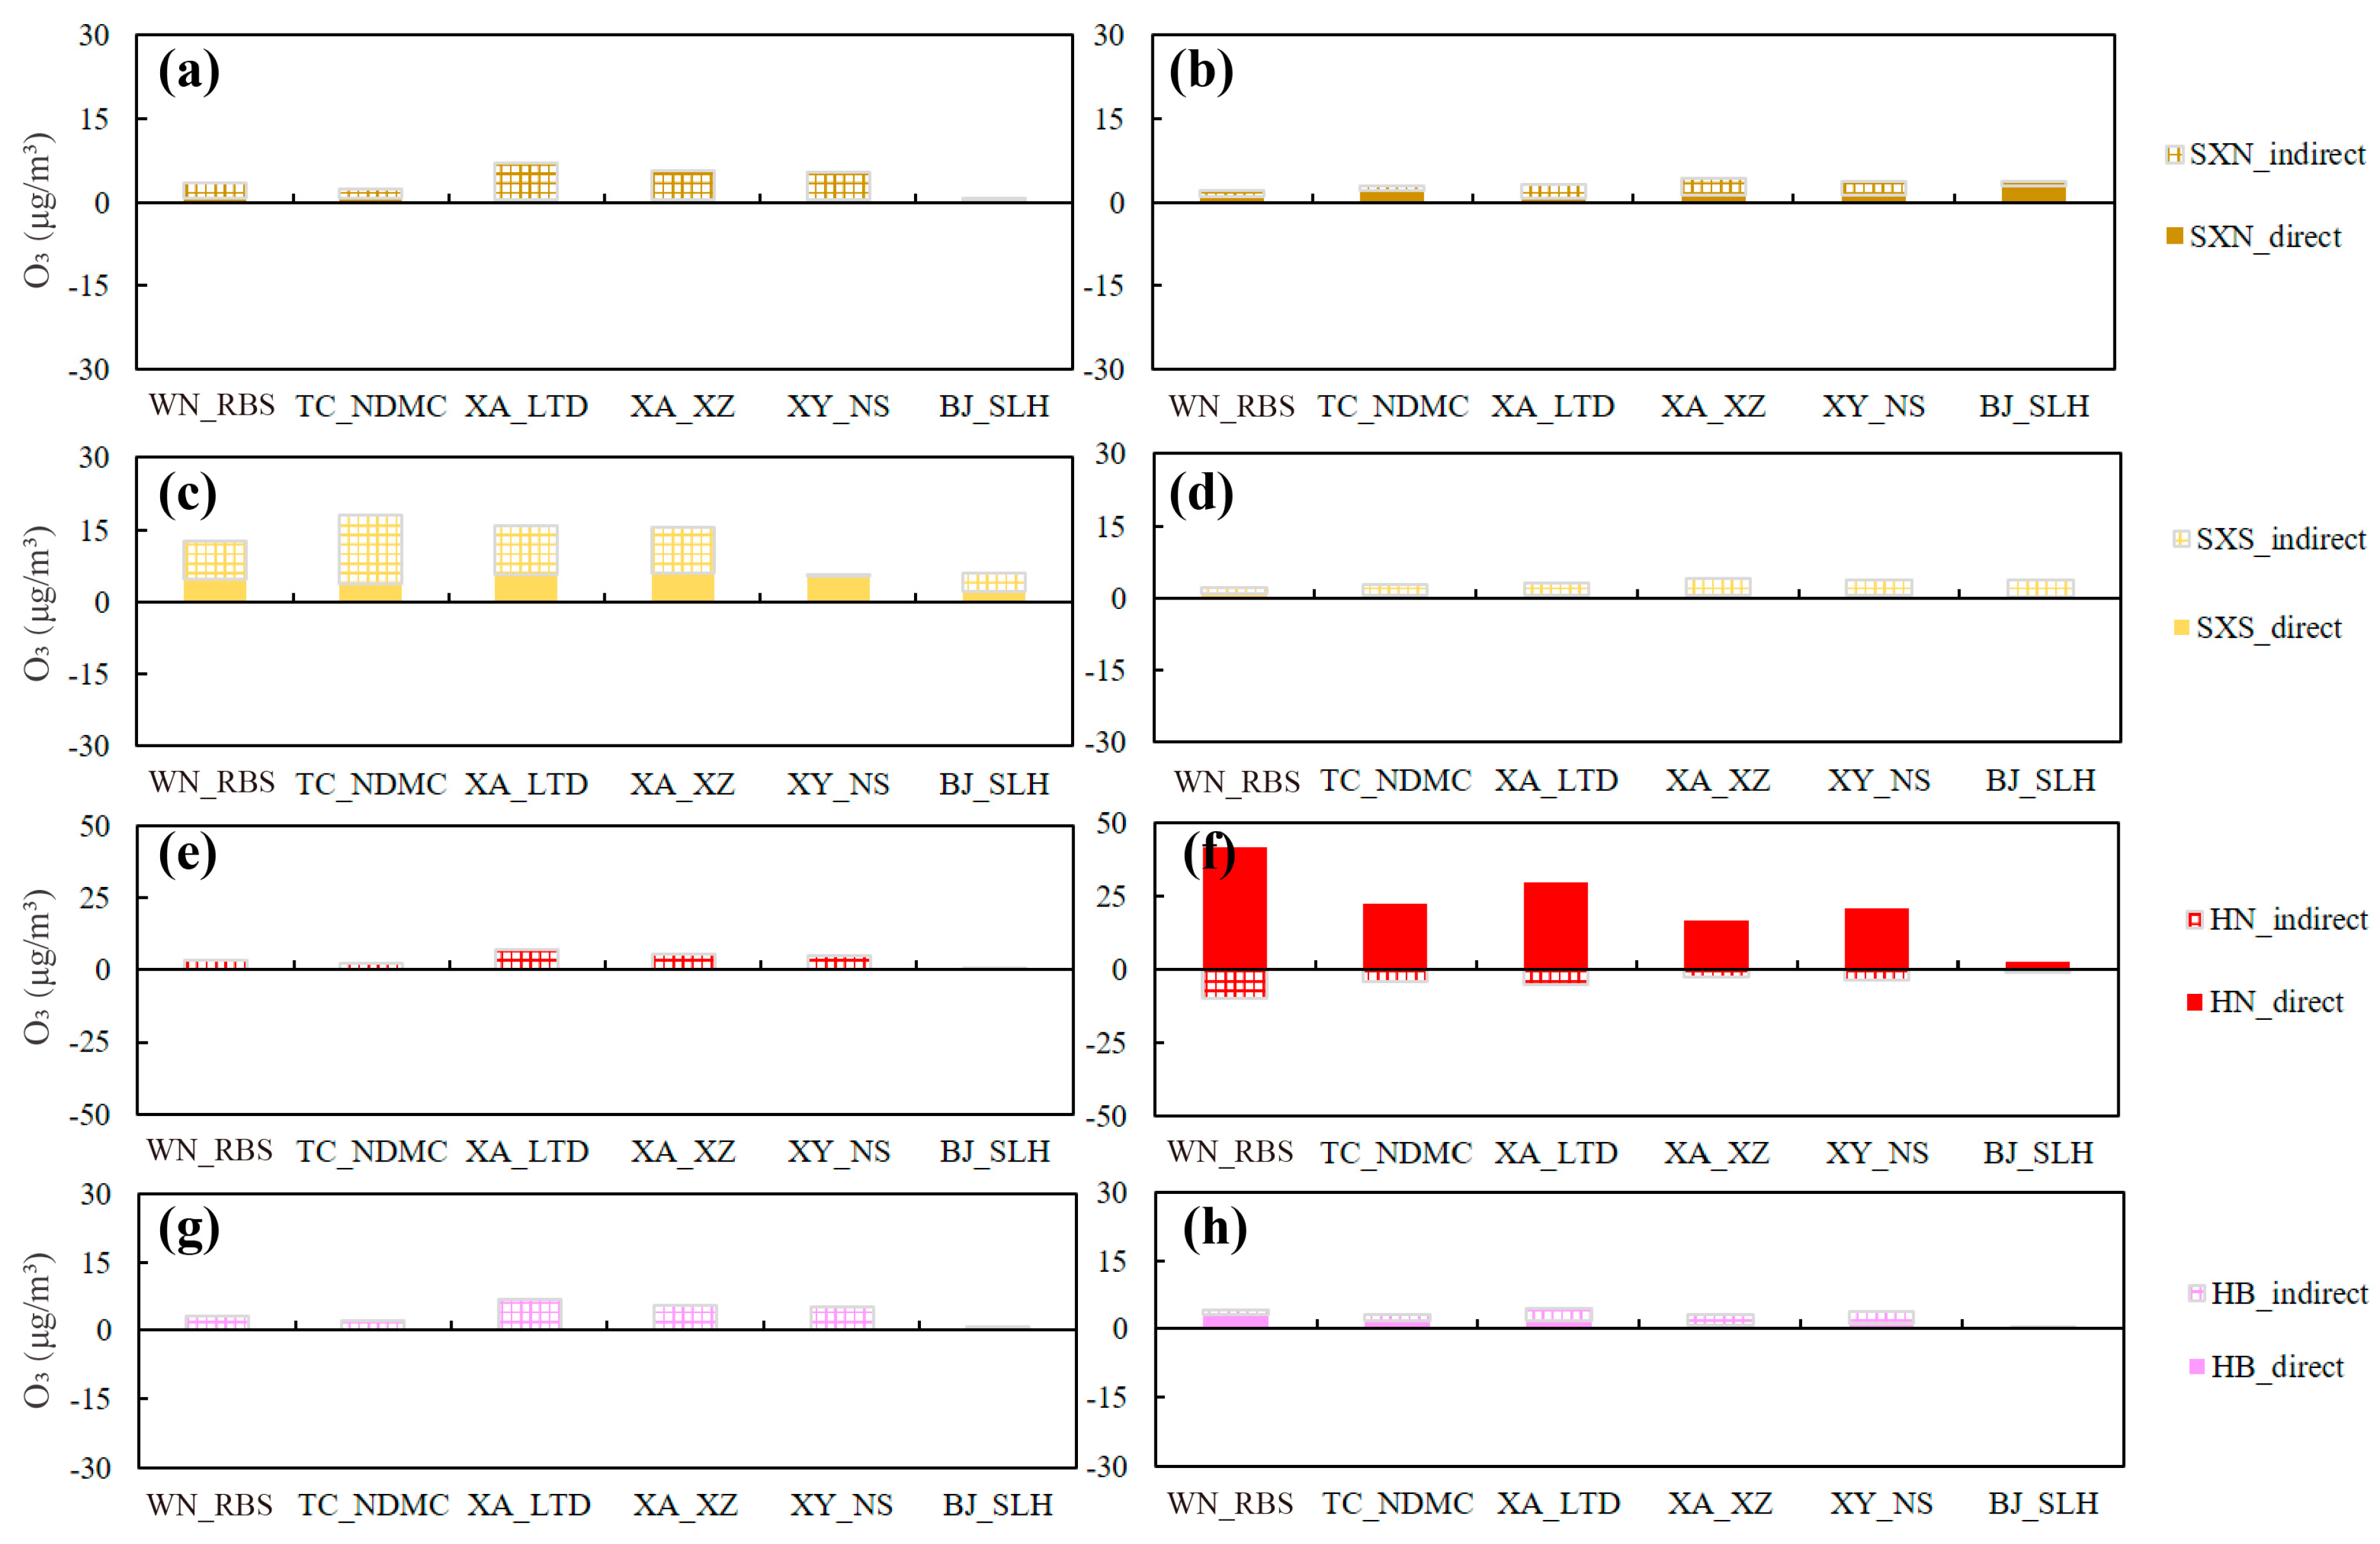
Direct transport contribution (Fdirect): air pollutants originating from emissions outside the target regions, including the directly transported portion as well as those formed through chemical reactions from outside precursors.
(3)
Indirect transport contribution (Findirect): air pollutants generated from chemical reactions between local and outside precursors.
(4)
Background contribution (F0): air pollutants derived from emissions in regions outside the modeling domain, which represent large-scale background levels.
We defined the contribution of O3 transport as the sum of Fdirect and Findirect. In detail, the following simulation cases were designed:
(1)
Base case: emissions in the GZB and outside areas were both included.
(2)
All_zero case: emissions within D02 were all zeroed out.
(3)
Source_region cases: emissions outside the certain source region of the D02 were zeroed out.
(4)
Source_region_zero cases: emissions in the certain source region of the D02 were zeroed out.
For these cases, modeled concentrations of air pollutants were separately marked as fbase, fall_zero, fSource_region, and fSource_region_zero. For example, local contributions from Xi’an and transport contributions from other source regions [i, i = 1–9] were calculated with the following equations:
F0 = fall_zero
Flocal = fxi’an − F0
Fdirect[i] = fsource_regions[i] − F0
Findirect[i] = (fbase − fSource_region_zero[i]) (fsource_regions[i] − F0)

2.5. Process Analysis

Pollutants contributed by transport were those produced via chemical reactions between locally emitted and transported precursors in the target regions. To study the impacts of the emissions from the cities in the GZB or outside areas on O3 pollution, we utilized the process analysis tools in CAMx to quantify the rates of O3 formation above ground level (AGL). Specifically, the chemical and physical processes of O3 formation were provided by the integrated process rate (IPR) [28,29], and the gas-phase chemical reactions rates of O3 production and loss were derived from the integrated reaction rate (IRR) [30,31].

3. Results

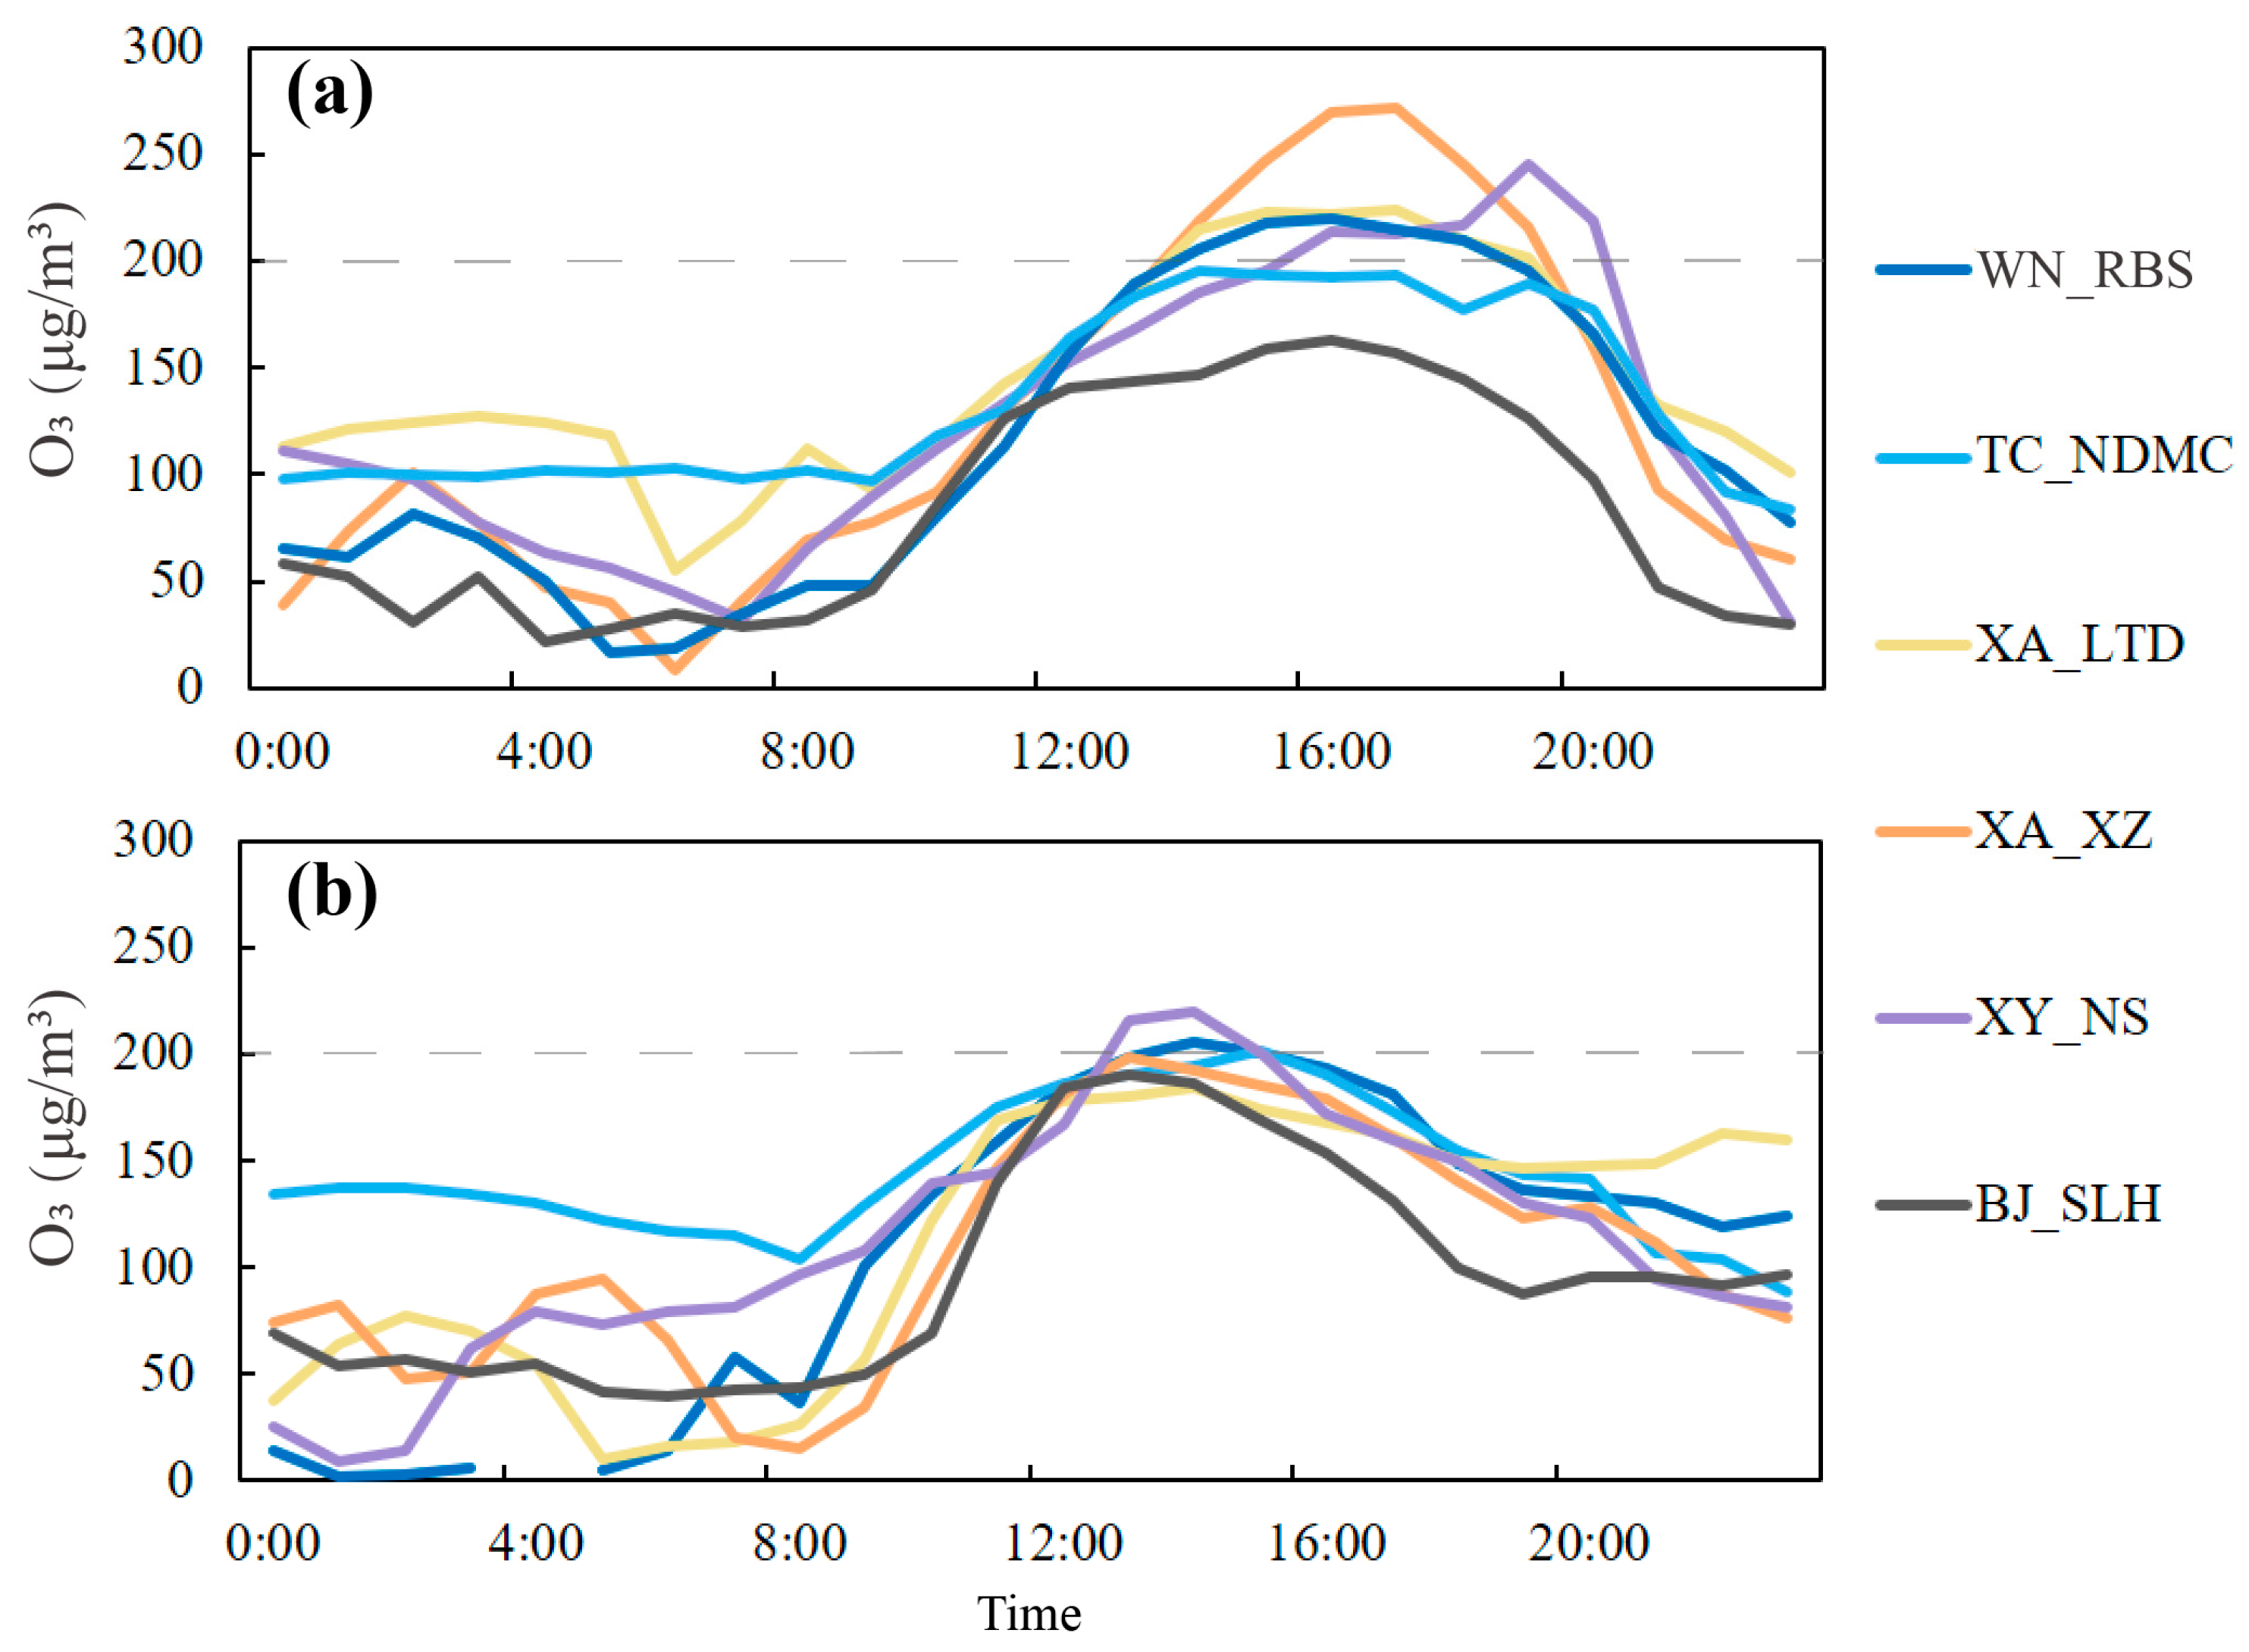
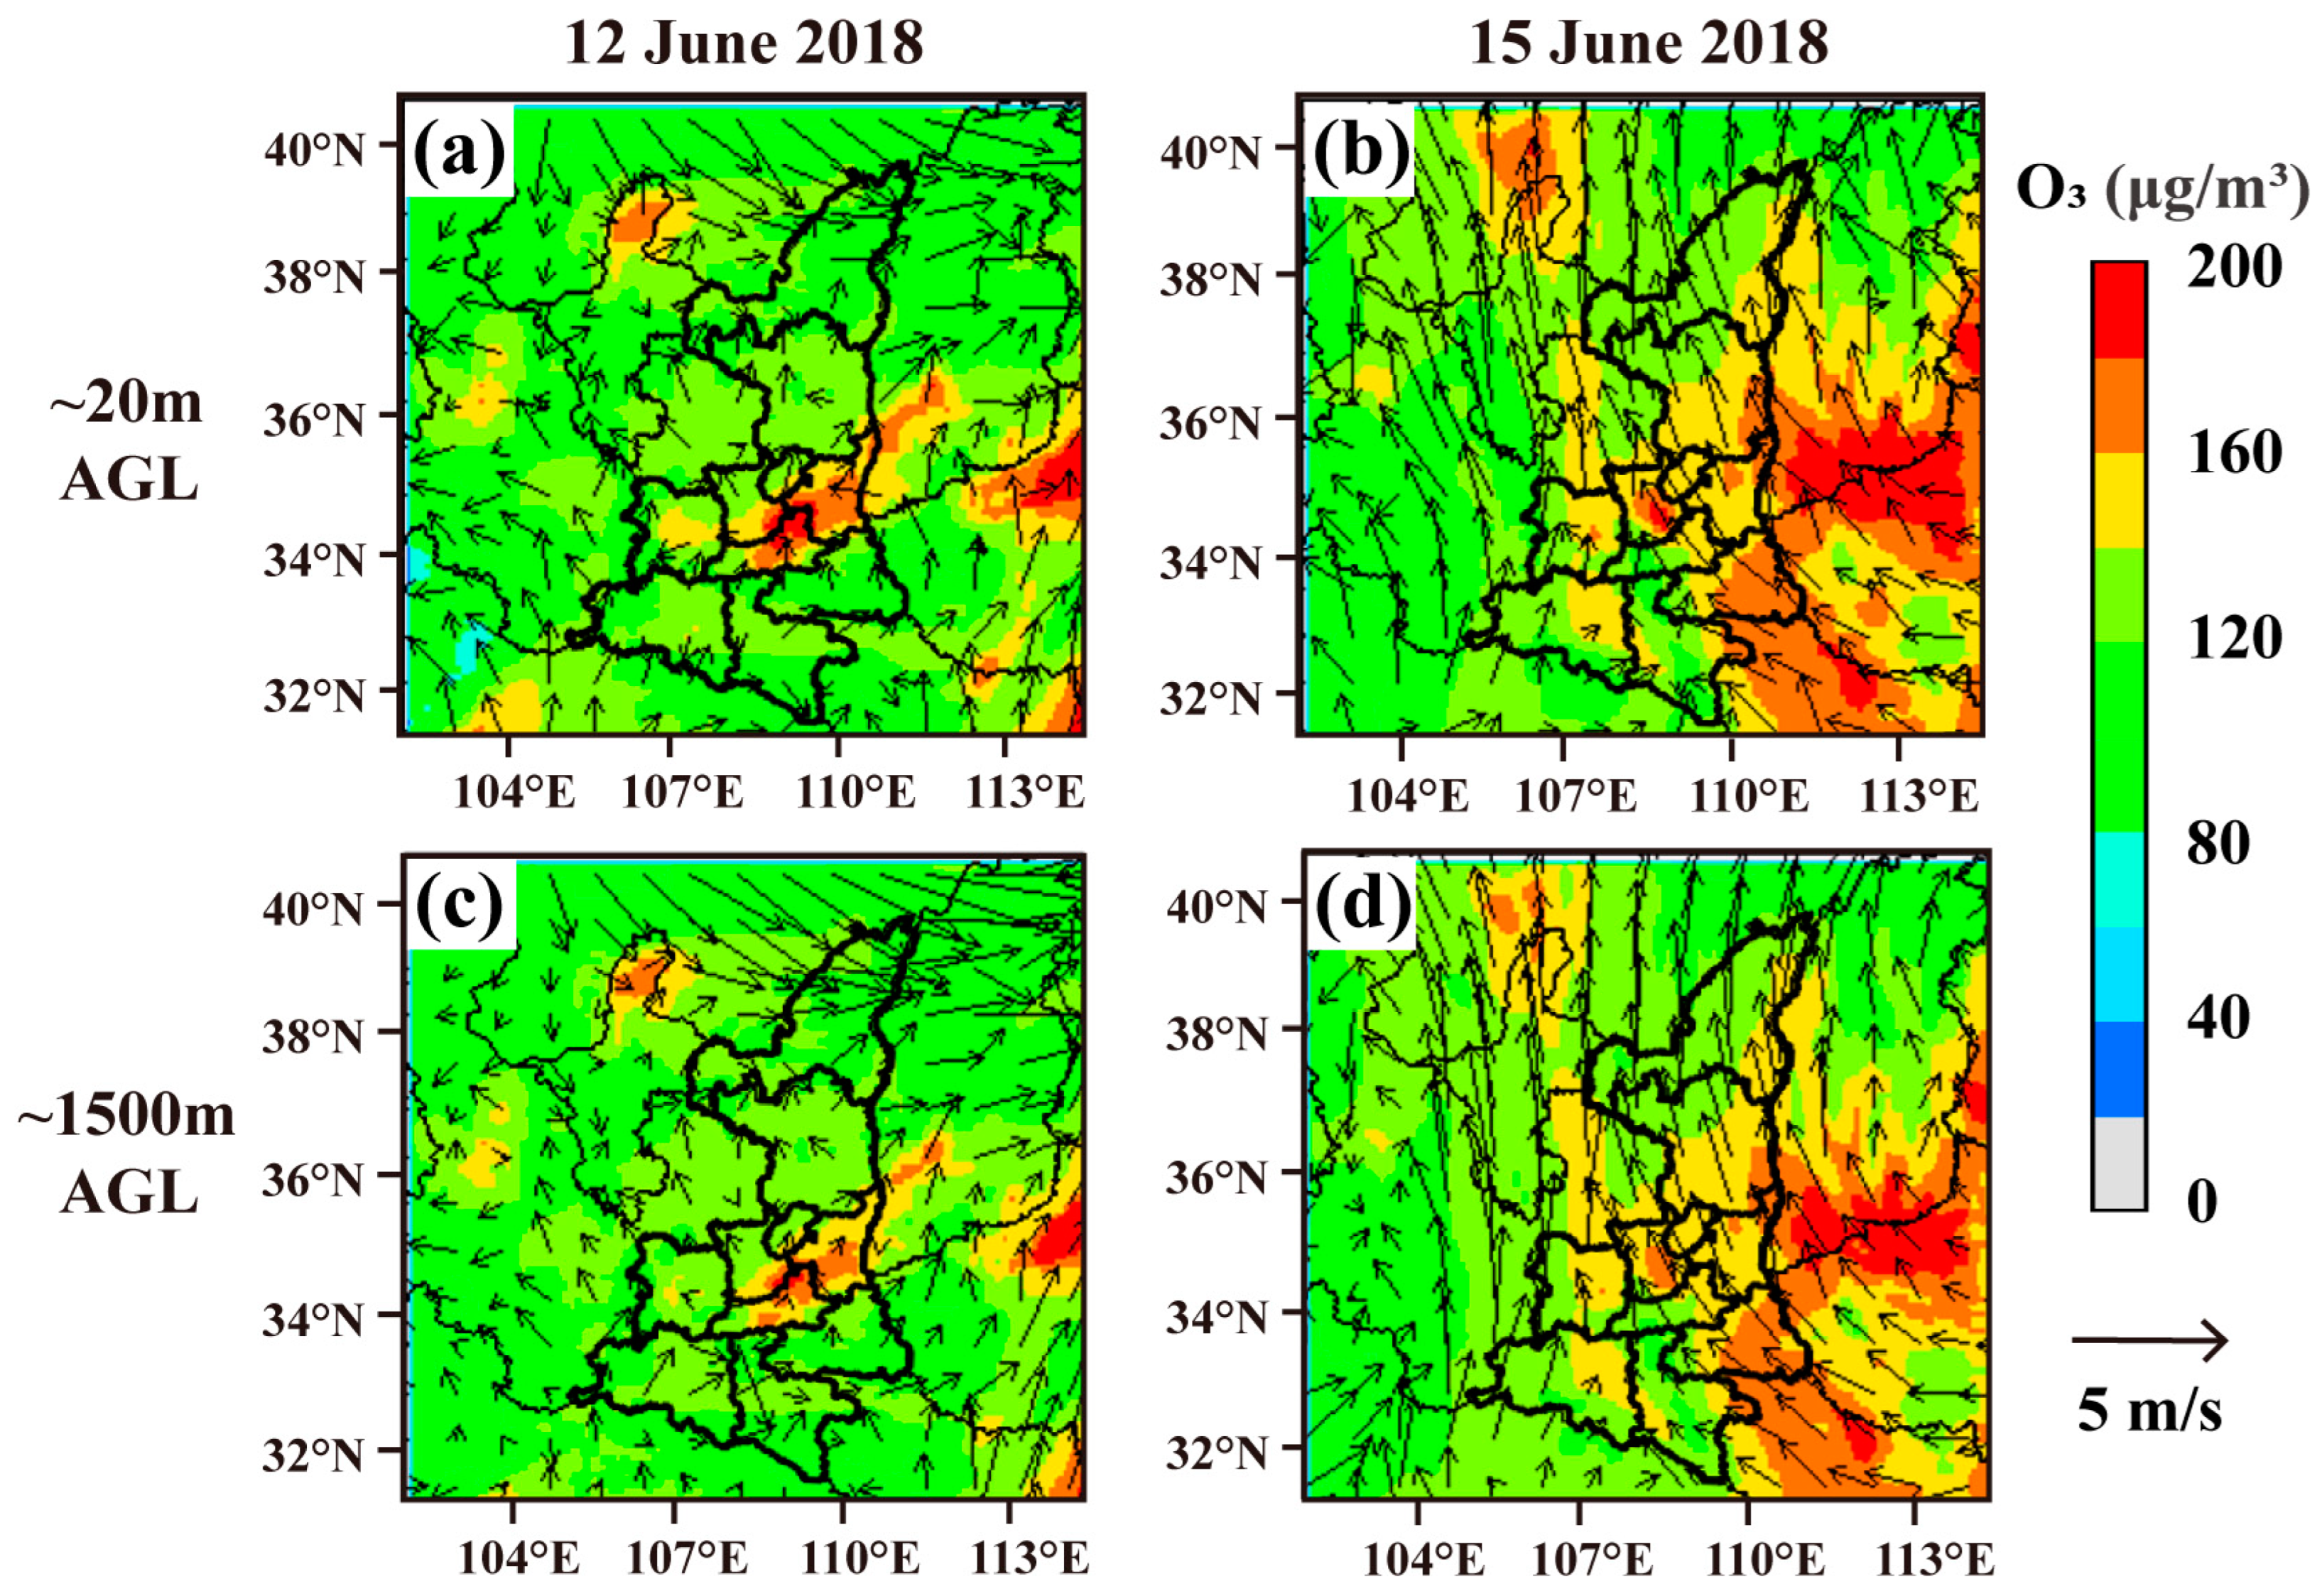
3.1. Overview of the Study Period

Controlled by two polluted CTs (southeast high type and northeast ridge type), a severe O3 episode during 11–15 June 2018 occurred in the five cities in the GZB. Specifically, 11–13 June was affected by the southeast high type, while 14–15 June was influenced by the northeast ridge type. The observed O3 concentrations at typical monitoring sites peaked at 184–281 μg/m3, especially during 12:00–18:00 LT. For the convenience of discussion, the following 2 days were selected to represent the above two polluted CTs: (1) 12 June 2018 (“southeast high-type”) and (2) 15 June 2018 (“northeast ridge-type”).
The daily variations in O3 concentration could provide insights into the interplay between emissions and chemical and physical processes that operate according to a diurnal cycle. The observed hourly O3 concentrations over the GZB under the two CTs are shown in Figure 2. Under the southeast high type, daytime mean O3 concentrations at the six sites corresponded to local precursor emissions over the GZB, which decreased in the following order: XA_XZ (216 μg/m3) > XA_LTD (198 μg/m3) > WN_RBS (191 μg/m3) = XY_NS (191 μg/m3) > TC_NDMC (180 μg/m3) > BJ_SLH (145 μg/m3). The O3 concentrations at the six sites were relatively low before 9:00 LT due to weak photochemical reactions, and all sites usually exhibited high O3 concentrations during daytime (10:00–20:00 LT), albeit with different peak times. Especially in XY_NS and TC_NDMC, O3 concentrations suddenly increased during 17:00–19:00 LT, implying the effects of O3 transportation. Moreover, the O3 concentrations at the six sites rapidly decreased during the nighttime (after 20:00 LT). However, it is noteworthy that the diurnal cycle of observed hourly O3 concentrations under the northeast ridge type was different from that under the southeast high type. Under the northeast ridge type, the average increase rates and peak concentrations of O3 in the six sites were less than those under the southeast high type. A longer duration of high O3 concentrations (from 12:00 to 20:00 LT) occurred at the six sites, indicating that regional transport had an important impact on the O3 levels in the GZB.
The simulated O3 concentrations and wind fields under the two CTs (Figure 3) further verified the analysis of the temporal characteristics of O3 concentrations over the GZB. For the southeast high type, favorable meteorological conditions (increased southerly airflow, high temperature, low humidity, and the worst diffusion conditions) enhanced the strong local O3 production. Particularly, southerly winds dominated the near-surface and at high altitudes in the GZB, which influenced pollutant transportation in the GZB. High O3 concentrations concentrated in Xi’an and downwind cities (Xianyang, Weinan, and Tongchuan) and O3 concentrations in Baoji were lower than those in the other four cities of the GZB, implying the importance of the transportation of O3 and its precursors from the emissions of upwind cities. Under the northeast ridge type, both the high altitude and near-surface levels in the GZB were dominated by easterly flow. Impacted by the easterly wind fields, high O3 concentrations were distributed over the GZB and the border between Shaanxi and Henan provinces, indicating that O3 and its precursors are transported from emissions of Henan province and upwind cities in the GZB significantly influence the concentration of O3 over the GZB. Hence, a comparative study of the characteristics of O3 transport under the two CTs would be valuable for deepening the understanding of the interactions among pollutants from different scales and providing strategies for targeted O3 reductions.

3.2. The Source of O3 in the GZB

The contributions from various regions to the daytime O3 concentrations in the typical sites in the GZB under the two polluted CTs are shown in Figure 4. Under the southeast high type, the meteorological conditions favored the chemical production of O3, which led to the highest local O3 contribution (10.7–45.2%) in the GZB. In addition to the largest contribution from outside of D02 (BCON), the prominent inter-regional transport was from south Shaanxi (1.2–10.8%). With the southerly winds in the GZB, the high O3 plumes from Xi’an had a great impact on the downwind cities, which contributed 37.2 μg/m3 and 45.1 μg/m3 to the O3 concentrations in Xianyang and Weinan, respectively. With increasing distance, the impacts of the emissions from Xi’an on the O3 concentrations in Tongchuan diminished, but the contributions from the emissions from Xianyang on O3 concentrations in Tongchuan increased to 26.1 μg/m3. Moreover, the O3 concentrations in Baoji were weakly influenced by the emissions from other cities in the GZB, and the emissions from adjacent provinces and the emissions of Baoji contributed a higher percentage of O3 concentrations (28.1 μg/m3 and 21.2 μg/m3, respectively) in Baoji.
Compared with those under the northeast ridge type, transport from Henan province and Weinan was of greater importance for O3 pollution over the GZB under the northeast ridge type, as there were remarkable easterly airflows. Particularly, the impacts of the emissions from Henan province and Weinan were reduced from the east to the west of the GZB. For example, the contributions of the emissions from Henan province to the O3 concentrations over the GZB decreased in the following order: WN_RBS (32.0 μg/m3) > XA_LTD (24.3 μg/m3) > TC_NDMC (18.2 μg/m3) > XY_NS (17.5 μg/m3) > XA_XZ (13.7 μg/m3) > BJ_SLH (1.3 μg/m3).
Figure 5 shows the contributions of direct and indirect transport from the five cites in the GZB to O3 concentrations. Under the two CTs, the O3 in the six sites was mostly from direct transport, while indirect transport from the emissions from Tongchuan had little contribution to the five sites outside Tongchuan. Notably, the characteristics of O3 transport from the emissions of each city in the GZB were different under the two CTs. Under the southeast high type, the emissions of Xi’an had a significant impact on the O3 pollution in Xi’an, Xianyang, and Weinan, with the direct (indirect) transport of 45.8 (4.8) μg/m3, 43.4 (9.3) μg/m3, 33.8 (3.4) μg/m3, and 45.9 (0.8) μg/m3 at XA_XZ, XA_LTD, XY_NS, and WN_RBS, respectively. Under the northeast ridge type, the impacts of the emissions of Xi’an concentrated in Xi’an and Boaji, and the emissions of Weinan greatly influenced the GZB overall, with the direct transport of 8.5–23.4 μg/m3. At this time, Baoji is downwind of other cities in the GZB and was influenced by direct transport, which contributed 19.0, 13.1, and 8.5 μg/m3 from the upwind cities (Xianyang, Xi’an, and Weinan, respectively).
Figure 6 displays the contributions of direct and indirect transport from the major source regions (i.e., other parts of Shaanxi, Henan, and Hubei provinces) outside the GZB. Under the southeast high type, the emissions of south Shaanxi had an impact on the O3 pollution in the GZB, and indirect transport was the major form, which indicates that O3 precursors from south Shaanxi (most likely biogenic VOCs from Qin Mountain) were transported to the urban areas of the GZB and further reacted with the pollutants there. Under the northeast ridge type, direct transport from the emissions of Henan province contributed 16.5–41.9 μg/m3 to the O3 concentrations at the typical sites in the GZB (except BJ_SLH). Negative indirect transport (about −5 μg/m3) reduced the contributions from the emissions of Henan province, implying the negative effects of pollutant transport on O3 formation over the GZB. The contributions from the other source regions to O3 concentrations were not significant.

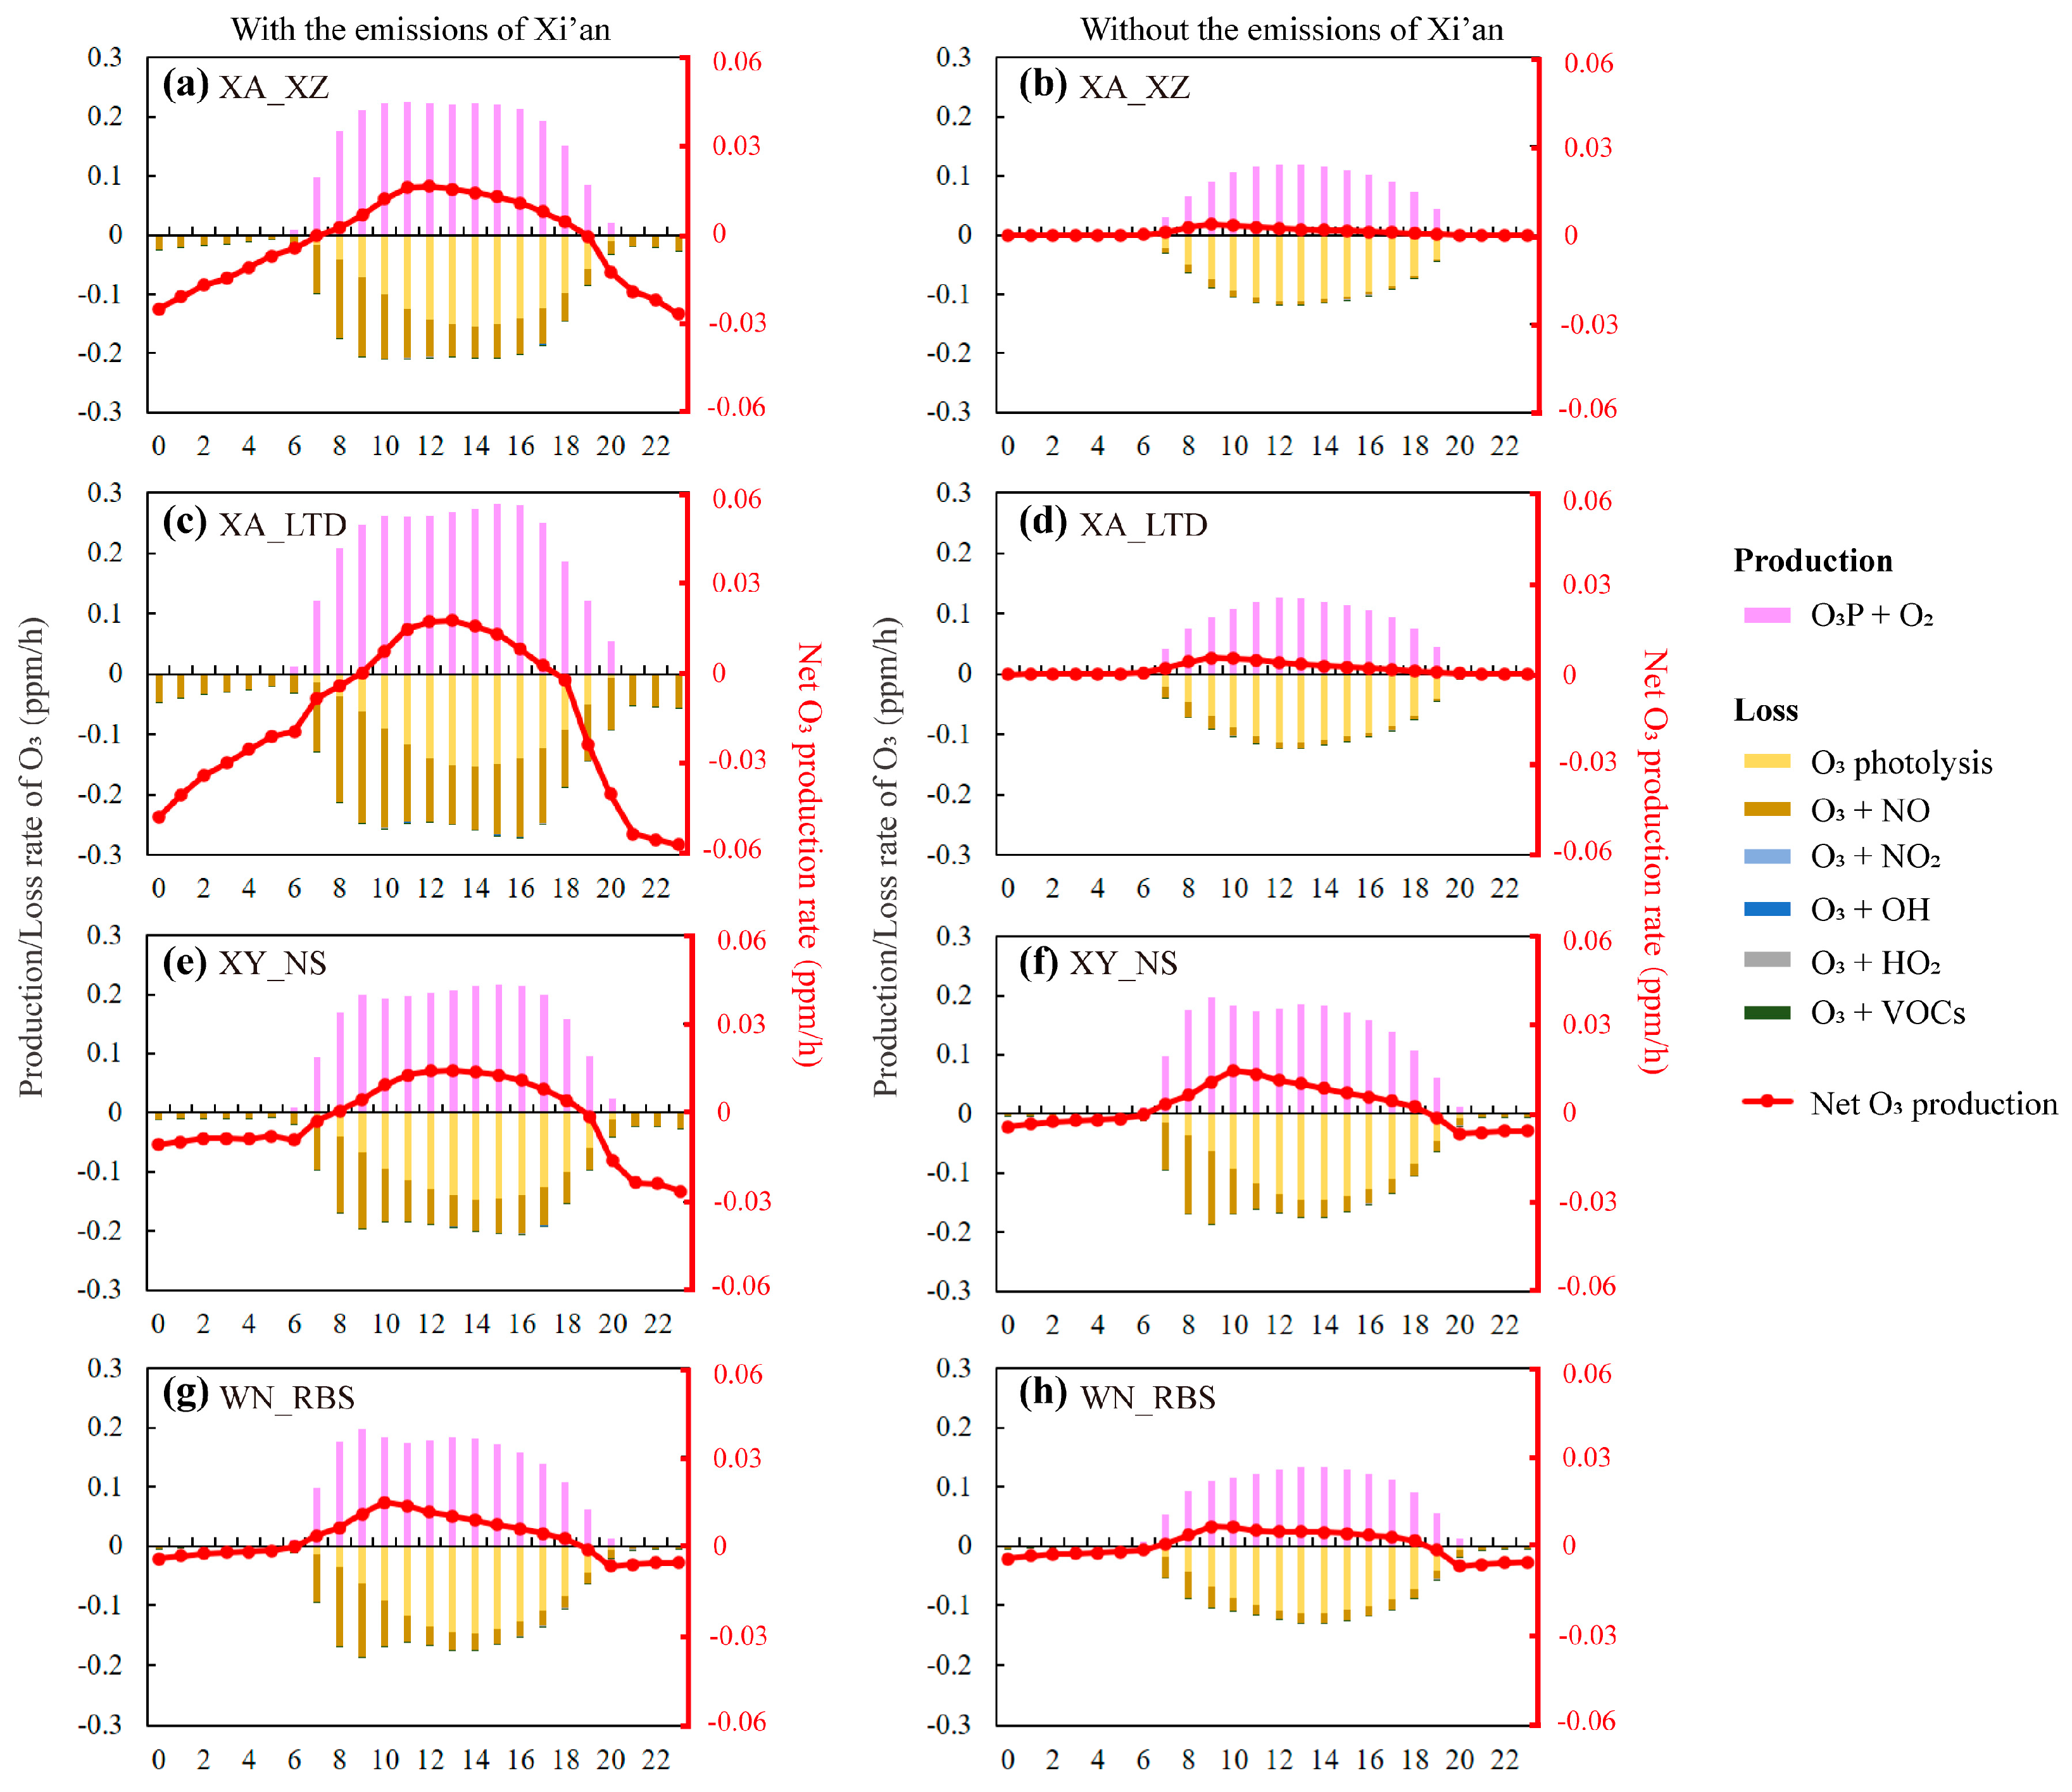
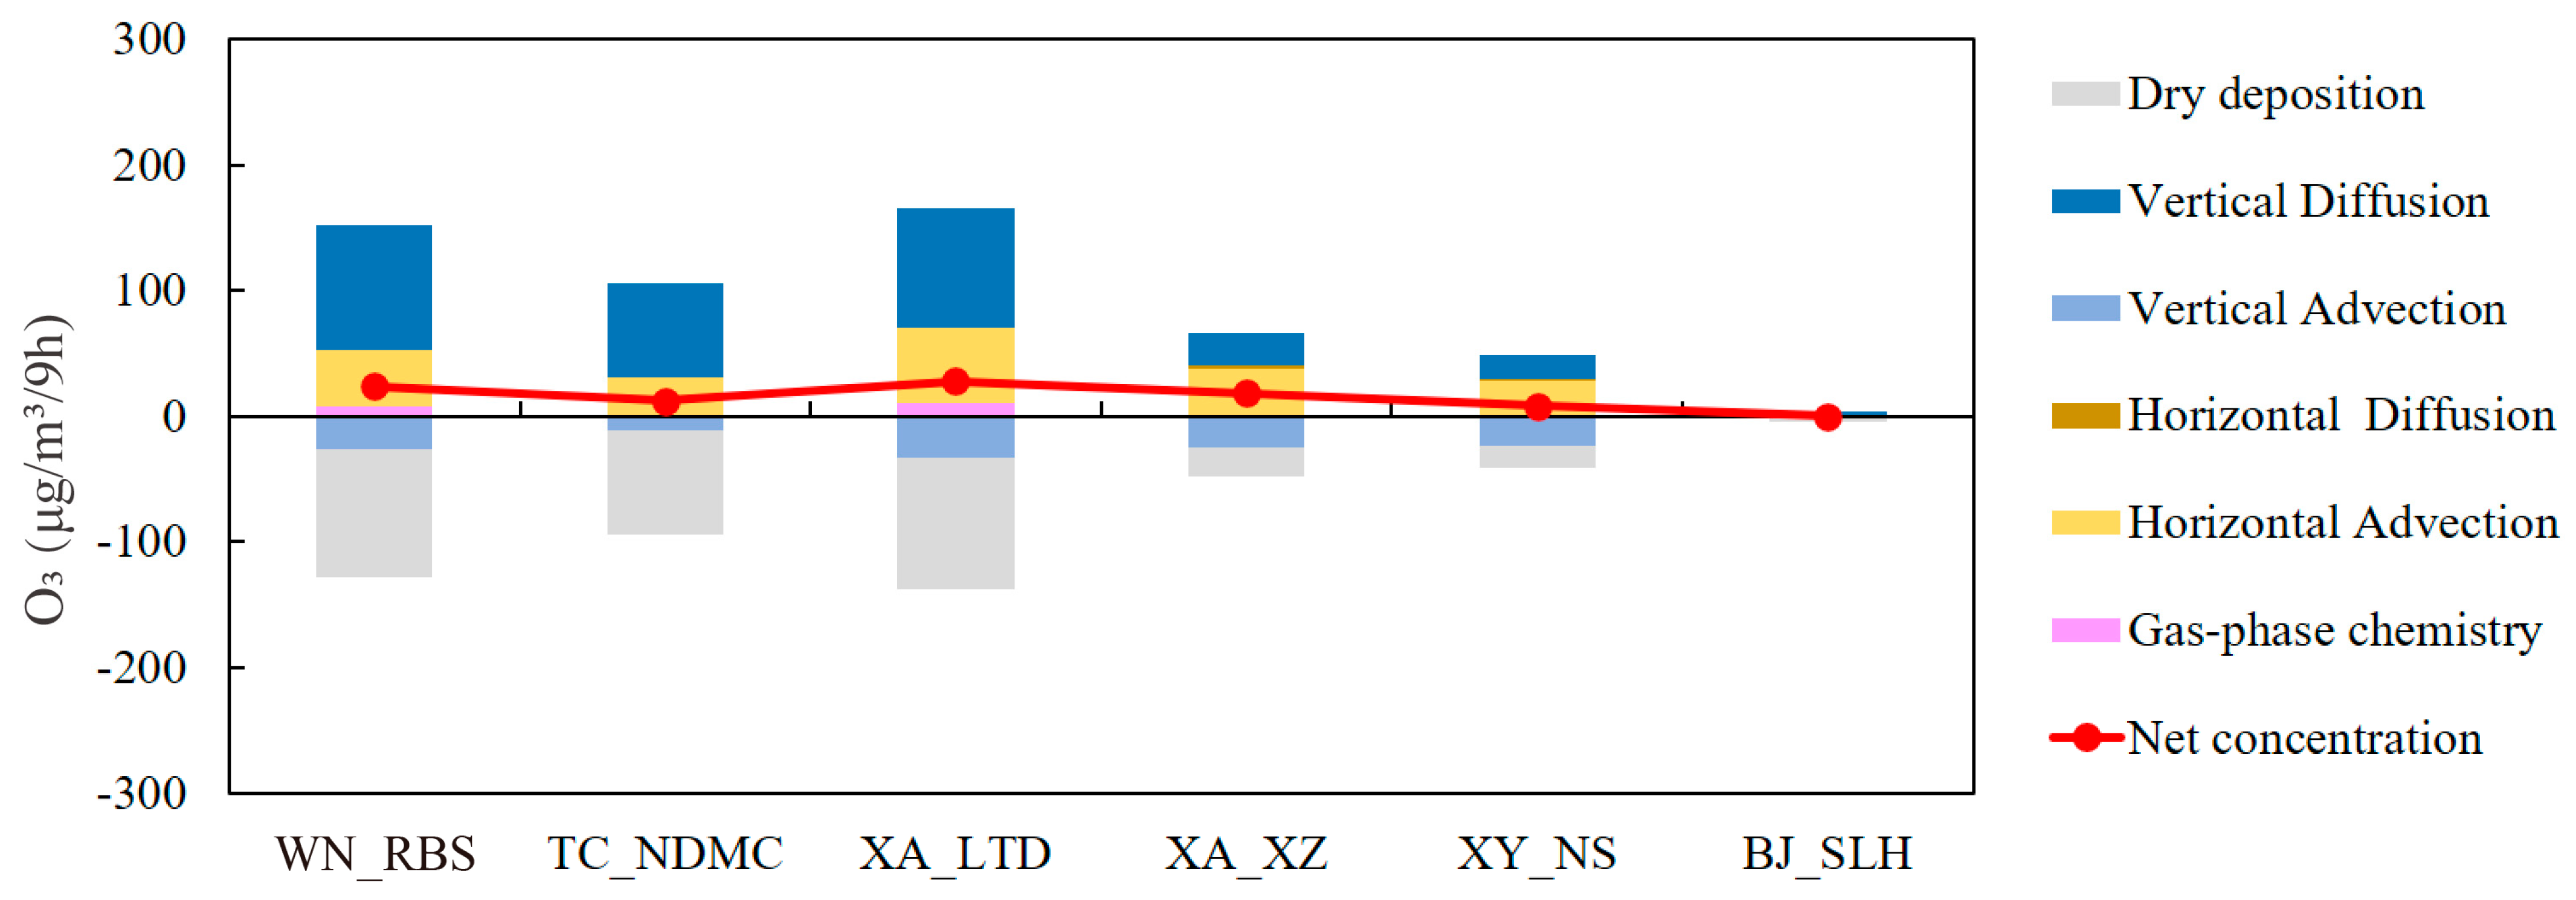
3.3. Process Analysis of O3 in the GZB

The emissions of Xi’an had a significant impact on O3 formation in the GZB. Figure 7 shows the contributions from the emissions of Xi’an to the daytime O3 processes at ~15 m AGL in the GZB under the southeast high type. For the urban site (i.e., Xiaozhai) in Xi’an, chemical production was the main process. For the suburban site (i.e., Lintong district) in Xi’an and the neighboring cities (Xianyang and Weinan), they influenced O3 formation through the processes of gas-phase chemistry and vertical advection. In Tongchuan, which is far away from Xi’an, there were some contributions from the emissions of Xi’an. However, Baoji was not located in the downwind area of Xi’an, so the contribution from the emissions of Xi’an was almost zero.
Considering the effects of the emissions of Xi’an on the daytime O3 processes over the GZB (Figure 7), Figure 8 further displays the hourly contributions from the emissions of Xi’an to O3 production and loss rates in the typical sites on 12 June (“southeast high-type”). For the four sites (XA_XZ, XA_LTD, XY_NS, and WN_RBS), the chemical pathways of the impacts from the emissions of Xi’an were enhanced O3 production (O3P + O2) and O3 titration by NO (O3 + NO). The impacts of the emissions of Xi’an on daytime mean O3 production rates were 0.04–0.15 ppm/h, while these impacts on daytime mean O3 loss rates were 0.02–0.11 ppm/h. The former had larger effects on O3 formation than the latter. Hence, the chemical contributions from the emissions of Xi’an were positive.
Figure 9 shows the contributions from the emissions of Henan to the daytime O3 processes at ~15 m AGL in the GZB under the northeast ridge type. The contributions from the emissions of Henan province to O3 formation in the GZB gradually decreased from the east to the west of the GZB. Higher contributions occurred in Weinan and suburban Xi’an, but the contributions were approaching zero in Baoji. Although the impacts from the emissions of Henan province were different over the GZB, horizontal advection and vertical dispersion were the main processes responsible for its impacts on O3 formation in the GZB. It is worth noting that these were completely different from the impacts of the emissions in the GZB, which indicates the distance between the receptors and source regions altered the processes of the interactions among the pollutants on different scales.

4. Conclusions

In the present study, the contributions of various forms of transport and processes to O3 pollution under two polluted CTs in the GZB were investigated using observational analyses and numerical simulations with a CAMx model. The results showed that the emissions on different scales could affect O3 pollution through different forms (direct and indirect transport), processes (chemical and physical processes), and chemical reactions (O3 production and loss pathways).
Under the southeast high type, the meteorological conditions favored the chemical production of O3, which led to the highest local O3 contribution (10.7–45.2%) from the GZB. In addition to the largest contribution from outside of D02 (BCON), the prominent inter-regional transport was from south Shaanxi (1.2–10.8%), and indirect transport was the main form. With the southerly winds in the GZB, high O3 plumes from Xi’an had a great impact on the downwind areas, which contributed 37.2 μg/m3 and 45.1 μg/m3 to the O3 concentrations of Xianyang and Weinan, respectively. With the increasing distance, the impacts of the emissions from Xi’an on O3 concentrations in Tongchuan were diminished. Moreover, direct transport was the major form and the major mechanism of O3 formation through the processes of gas-phase chemistry and vertical advection. Specifically, enhanced O3 production (O3P + O2) and O3 titration by NO (O3 + NO) were the predominant chemical reactions in O3 formation.
Compared with those under the northeast ridge type, transport from Henan province and Weinan was of greater importance for O3 under the northeast ridge type, as there were remarkable easterly airflows over the GZB. Specifically, the impacts of the emissions from Henan province and Weinan reduced from the east to the west of the GZB. Moreover, direct transport was the major form, and horizontal advection and vertical dispersion were the main processes influencing O3 formation in the GZB from the emissions of Henan province. Therefore, this study could help to improve the understanding of O3 pollution under different synoptic circulation conditions in this area, highlighting the necessity of enhanced regional collaboration and efforts in combating O3 pollution. Moreover, surface O3 concentration can likely be affected via the vertical exchange of the boundary layer, the free troposphere, or the stratosphere O3. Based on higher-resolution simulations in conjunction with additional observed data, future research will explore vertical O3 exchange and its impact on surface air quality over western China.

Author Contributions

Conceptualization, Y.Y.; methodology, Y.Y. and W.S.; software, Y.Y. and W.S.; validation, C.W; formal analysis, Y.Y.; investigation, Y.Y.; resources, Y.Y.; data curation, Y.Y.; writing—original draft preparation, Y.Y.; review and editing, Y.C. and C.W.; visualization, Y.Y.; supervision, C.W.; funding acquisition, Y.Y. All authors have read and agreed to the published version of the manuscript.

Funding

This work was supported by the Central Guided Local Science and Technology Development Special Project (No. 2022ZYD0129).

Institutional Review Board Statement

Not applicable.

Informed Consent Statement

Not applicable.

Data Availability Statement

The data presented in this study are available on request from the corresponding author. The data are not publicly available due to privacy.

Acknowledgments

The authors are grateful to all the organizations and individuals who provided the data.

Conflicts of Interest

Wenbin Shi is employee of Wuxi Ninecosmos Science and Technology. The company had no roles in the design of the study; in the collection, analysis, or interpretation of data; in the writing of the manuscript, or in the decision to publish the articles. The paper reflects the views of the scientists and not the company.

References

  1. Seinfeld, J.H.; Pandis, S.N. Atmospheric Chemistry and Physics: From Air Pollution to Climate Change, 3rd ed.; John Wiley & Sons: Hoboken, NJ, USA, 2016. [Google Scholar]
  2. Yin, P.; Brauer, M.; Cohen, A.J.; Wang, H.; Li, J.; Burnett, R.T.; Stanaway, J.D.; Causey, K.; Larson, S.; Godwin, W.; et al. The effect of air pollution on deaths, disease burden, and life expectancy across China and its provinces, 1990–2017: An analysis for the Global Burden of Disease Study 2017. Lancet Planet. Health 2020, 4, 386–398. [Google Scholar] [CrossRef] [PubMed]
  3. Dedoussi, I.C.; Eastham, S.D.; Monier, E.; Barrett, S.R.H. Premature mortality related to United States cross-state air pollution. Nature 2020, 578, 261–265. [Google Scholar] [CrossRef] [PubMed]
  4. Cromar, K.; Gladson, L.; Jaimes Palomera, M.; Perlmutt, L. Development of a Health-Based Index to Identify the Association between Air Pollution and Health Effects in Mexico City. Atmosphere 2021, 12, 372. [Google Scholar] [CrossRef]
  5. Manisalidis, I.; Stavropoulou, E.; Stavropoulos, A.; Bezirtzoglou, E. Environmental and Health Impacts of Air Pollution: A Review. Front. Public. Health 2020, 8, 14. [Google Scholar] [CrossRef] [PubMed]
  6. Xue, L.; Wang, T.; Louie, P.K.; Luk, C.W.; Blake, D.R.; Xu, Z. Increasing external effects negate local efforts to control ozone air pollution: A case study of Hong Kong and implications for other Chinese cities. Environ. Sci. Technol. 2014, 48, 10769–10775. [Google Scholar] [CrossRef] [PubMed]
  7. Pfister, G.; Wang, C.-T.; Barth, M.; Flocke, F.; Vizuete, W.; Walters, S. Chemical characteristics and ozone production in the Northern Colorado Front Range. J. Geophys. Res. Atmos. 2019, 124, 13397–13419. [Google Scholar] [CrossRef]
  8. Nascimento, J.P.; Barbosa, H.M.J.; Banducci, A.L.; Rizzo, L.V.; Vara-Vela, A.L.; Meller, B.B.; Gomes, H.; Cezar, A.; Franco, M.A.; Ponczek, M.; et al. Major Regional-Scale Production of O3 and Secondary Organic Aerosol in Remote Amazon Regions from the Dynamics and Photochemistry of Urban and Forest Emissions. Environ. Sci. Technol. 2022, 56, 9924–9935. [Google Scholar] [CrossRef]
  9. Chen, T.F.; Chang, K.H.; Tsai, C.-Y. Modeling direct and indirect effect of long range transport on atmospheric PM2 5 levels. Atmos. Environ. 2014, 89, 1–9. [Google Scholar] [CrossRef]
  10. Faloona, I.C.; Chiao, S.; Eiserloh, A.J.; Alvarez, R.J.; Kirgis, G.; Langford, A.O.; Senff, C.J.; Caputi, D.; Hu, A.; Iraci, L.T.; et al. The California Baseline Ozone Transport Study (CABOTS). Bull. Am. Meteorol. Soc. 2020, 101, pp. E427–E445. Available online: https://journals.ametsoc.org/view/journals/bams/101/4/bams-d-18-0302.1.xml. (accessed on 5 May 2023).
  11. Andrés Hernández, M.D.; Hilboll, A.; Ziereis, H.; Förster, E.; Krüger, O.O.; Kaiser, K.; Schneider, J.; Barnaba, F.; Vrekoussis, M.; Schmidt, J.; et al. Overview: On the transport and transformation of pollutants in the outflow of major population centres—Observational data from the EMeRGe European intensive operational period in summer 2017. Atmos. Chem. Phys. 2022, 22, 5877–5924. [Google Scholar] [CrossRef]
  12. Aleksic, N.; Kent, J.; Walcek, C. On ground truth in cross-border ozone transport. J. Air Waste Manag. Assoc. 2019, 69, 977–987. [Google Scholar] [CrossRef]
  13. Gong, K.; Li, L.; Li, J.; Qin, M.; Wang, X.; Ying, Q.; Liao, H.; Guo, S.; Hu, M.; Zhang, Y.; et al. Quantifying the impacts of inter-city transport on air quality in the Yangtze River Delta urban agglomeration, China: Implications for regional cooperative controls of PMPM2.5 and O3. Sci. Total Environ. 2021, 779, 146619. [Google Scholar] [CrossRef] [PubMed]
  14. Liu, H.; Zhang, M.; Han, X.; Li, J.; Chen, L. Episode analysis of regional contributions to tropospheric ozone in beijing using a regional air quality model. Atmos. Environ. 2019, 199, 299–312. [Google Scholar] [CrossRef]
  15. Wu, J.; Li, G.; Cao, J.; Bei, N.; Wang, Y.; Feng, T.; Huang, R.; Liu, S.; Zhang, Q.; Tie, X. Contributions of trans-boundary transport to summertime air quality in Beijing, China. Atmos. Chem. Phys. 2017, 17, 2035–2051. [Google Scholar] [CrossRef]
  16. Li, L.; Xie, F.; Li, J.; Gong, K.; Xie, X.; Qin, Y.; Qin, M.; Hu, J. Diagnostic analysis of regional ozone pollution in Yangtze River Delta, China: A case study in summer 2020. Sci. Total Environ. 2021, 812, 151511. [Google Scholar] [CrossRef] [PubMed]
  17. Zheng, Y.; Jiang, F.; Feng, S.; Cai, Z.; Shen, Y.; Ying, C.; Wang, X.; Liu, Q. Long-range transport of ozone across the eastern China seas: A case study in coastal cities in southeastern China. Sci. Total Environ. 2021, 768, 144520. [Google Scholar] [CrossRef] [PubMed]
  18. Chen, Y.; Han, H.; Zhang, M.; Zhao, Y.; Huang, Y.; Zhou, M.; Wang, C.; He, G.; Huang, R.; Luo, B.; et al. Trends and variability of ozone pollution over the mountain-basin areas in Sichuan province during 2013–2020: Synoptic impacts and formation regimes. Atmosphere 2021, 12, 1557. [Google Scholar] [CrossRef]
  19. Gong, C.; Liao, H. A typical weather pattern for ozone pollution events in North China. Atmos. Chem. Phys. 2019, 19, 13725–13740. [Google Scholar] [CrossRef]
  20. Wang, H.; Wu, K.; Liu, Y.; Sheng, B.; Lu, X.; He, Y.; Xie, J.; Wang, H.; Fan, S. Role of Heat Wave-induced Biogenic VOC Enhancements in Persistent Ozone Episodes Formation in Pearl River Delta. J. Geophys. Res. Atmos. 2021, 126, e2020JD034317. [Google Scholar] [CrossRef]
  21. Lei, X.; Cheng, H.; Peng, J.; Jiang, H.; Lyu, X.; Zeng, P.; Wang, Z.; Guo, H. Impact of long-range atmospheric transport on volatile organic compounds and ozone photochemistry at a regional background site in central China. Atmos. Environ. 2021, 246, 118093. [Google Scholar] [CrossRef]
  22. Xu, L.; Crounse, J.D.; Vasquez, K.T.; Allen, H.; Wennberg, P.O.; Bourgeois, I.; Brown, S.S.; Campuzano-Jost, P.; Coggon, M.M.; Crawford, J.H.; et al. Ozone chemistry in Western U.S. wildfire plumes. Sci. Adv. 2021, 7, eabl3648. [Google Scholar] [CrossRef]
  23. Li, N.; He, Q.; Greenberg, J.; Guenther, A.; Li, J.; Cao, J.; Wang, J.; Liao, H.; Wang, Q.; Zhang, Q. Impacts of biogenic and anthropogenic emissions on summertime ozone formation in the Guanzhong Basin, China. Atmos. Chem. Phys. 2018, 18, 7489–7507. [Google Scholar] [CrossRef]
  24. The State Council of the People's Republic of China. Three-Year Action Plan to Fight Air Pollution, 2018. Available online: https://www.gov.cn/zhengce/content/2018-07/03/content_5303158.htm (accessed on 5 June 2023).
  25. Yan, Y.; Wang, X.; Qu, K.; Li, X.; Shi, W.; Peng, Z.; Zhang, Y. Impacts of synoptic circulations on summertime ozone pollution in Guanzhong Basin, northwestern China. Atmos. Environ. 2021, 262, 118660. [Google Scholar] [CrossRef]
  26. Bei, N.; Liang, J.; Li, X.; Wang, R. Worsening summertime ozone pollution in the Guanzhong Basin, China from 2014 to 2018: Impacts of synoptic conditions and anthropogenic emissions. Atmos. Environ. 2022, 274, 1352–2310. [Google Scholar] [CrossRef]
  27. Qu, K.; Wang, X.; Xiao, T.; Shen, J.; Lin, T.; Chen, D.; He, L.; Huang, X.; Zeng, L.; Lu, K.; et al. Cross-regional transport of PM2.5 nitrate in the Pearl River Delta, China: Contributions and mechanisms. Sci. Total Environ. 2021, 753, 142439. [Google Scholar] [CrossRef] [PubMed]
  28. Wang, Z.; Langstaff, J.E.; Jeffries, H.E. The Application of the Integrated Process Rate Analysis Method for Investigation of Urban Airshed Model (UAM) Sensitivity to Speciation in VOC Emissions Data. In Proceedings of the A And Wma Annual Meeting, San Antonio, TX, USA, 18–23 June 1995. [Google Scholar]
  29. Kim, Y.; Park, S.; Kang, J.; Song, S. Numerical Simulation and Process Analysis Using the MM5-CMAQ in Yangsan on High Ozone Days during Spring and Summer. J. Environ. Sci. 2010, 19, 269–279. [Google Scholar] [CrossRef]
  30. Jeffries, H.E.; Tonnesen, G.S. Comparison of two photochemical reaction mechanisms using a mass balance and process analysis. Atmos. Environ. 1994, 28, 2991–3003. [Google Scholar] [CrossRef]
  31. Kitayama, K.; Morino, Y.; Yamaji, K.; Chatani, S. Uncertainties in O3 concentrations simulated by CMAQ over Japan using four chemical mechanisms. Atmos. Environ. 2018, 198, 448–462. [Google Scholar] [CrossRef]
Figure 1. (a) The 36 km (D01) and 12 km (D02) modeling domains, (b) subdivided source regions used in CAMx, and (c) topographic map of the Guanzhong basin and surrounding areas. The triangles represent air quality stations in the five cities of the Guanzhong Basin used in the analysis of the sources of O3 pollution. (Ⅰ: WN_RBS in Weinan; Ⅱ: XA_LTD in Xi’an; Ⅲ: XA_XZ in Xi’an; Ⅳ: XY_NS in Xianyang; Ⅴ: BJ_SLH in Baoji; Ⅵ: TC_NDMC in Tongchuan).
Atmosphere 14 01742 g001
Figure 2. Observed hourly O3 concentration on (a) 12 June (“southeast high-type”), and (b) 15 June (“northeast ridge-type”) in the Guanzhong basin. Grey dot lines in each panel denote the Chinese national air quality standard for O3 (i.e., 200 μg/m3).
Atmosphere 14 01742 g002
Figure 3. Simulated O3 concentration and wind fields at an elevation of (a,b) ~20 m and (c,d) ~1500 m AGL at 14:00 LT on (a,c) 12 June (“southeast high-type”), and (b,d) 15 June (“northeast ridge-type”) in the Guanzhong basin and surrounding areas.
Atmosphere 14 01742 g003
Figure 4. Contributions from different regions to the daytime (10:00–18:00 LT) O3 concentrations in the Guanzhong basin on (a) 12 June (“southeast high-type”), and (b) 15 June (“northeast ridge-type”).
Atmosphere 14 01742 g004
Figure 5. Contributions from five cities in the Guanzhong Basin to the daytime (10:00–18:00 LT) O3 concentrations in six sites on (a,c,e,g,i) 12 June (“southeast high-type”), and (b,d,f,h,j) 15 June (“northeast ridge-type”).
Atmosphere 14 01742 g005
Figure 6. Contributions from key regions outside the Guanzhong Basin to the daytime (10:00–18:00 LT) O3 concentrations in six sites on (a,c,e,g) 12 June (“southeast high-type”), and (b,d,f,h) 15 June (“northeast ridge-type”).
Atmosphere 14 01742 g006
Figure 7. The contributions from the emissions of Xi’an to the daytime (10:00–18:00 LT) O3 processes (~15 m AGL) on 12 June (“southeast high-type”) in the 6 sites in the Guanzhong basin.
Atmosphere 14 01742 g007
Figure 8. Hourly formation/loss chemical pathways of O3 production rates at (a,b) XA_XZ, (c,d) XA_LTD, (e,f) XY_NS, and (g,h) WN_RBS with/without the emissions of Xi’an on 12 June in the GZB (“southeast high-type”). Colored bars stand for different chemical pathways that contribute to O3 production rates at each site, and the red lines are net chemical contribution to O3 production rate at each site.
Atmosphere 14 01742 g008
Figure 9. The contributions from the emissions of Henan province to the daytime (10:00–18:00 LT) O3 processes (~15 m AGL) on 15 June (“northeast ridge-type”) in the Guanzhong basin.
Atmosphere 14 01742 g009
Disclaimer/Publisher’s Note: The statements, opinions and data contained in all publications are solely those of the individual author(s) and contributor(s) and not of MDPI and/or the editor(s). MDPI and/or the editor(s) disclaim responsibility for any injury to people or property resulting from any ideas, methods, instructions or products referred to in the content.

