Article

On the Examination of the Relationship between Mean and Extreme Precipitation and Circulation Types over Southern Romania

by
Konstantia Tolika
1,*,
Myriam Traboulsi
2,3,
Christina Anagnostopoulou
1,
Liliana Zaharia
4,
Ioannis Tegoulias
1,5,
Dana Maria (Oprea) Constantin
4 and
Panagiotis Maheras
1
1
Department of Meteorology and Climatology, School of Geology, Aristotle University of Thessaloniki, 54124 Thessaloniki, Greece
2
Faculty of Arts, Lebanese University, Corniche Mazraa, Beirut P.O. Box 6573/14, Lebanon
3
Archéorient UMR 5133, Maison de l’Orient et de la Méditerranée CNRS-Université Lyon 2. 7, Rue Raulin, 69007 Lyon, France
4
Faculty of Geography, University of Bucharest, 1 N. Bălcescu Boulevard, 010041 Bucharest, Romania
5
LGA—Meteorological Applications Center, International Airport Macedonia, 55103 Thessaloniki, Greece
*
Author to whom correspondence should be addressed.
Atmosphere 2023, 14(9), 1345; https://doi.org/10.3390/atmos14091345
Submission received: 6 July 2023 / Revised: 16 August 2023 / Accepted: 20 August 2023 / Published: 26 August 2023
(This article belongs to the Special Issue Precipitation Observations and Prediction)

Abstract

:
The main goal of the present study is to identify the prevailing atmospheric circulation patterns (circulation types) that are associated with the occurrence of precipitation (both mean and extreme) over southern Romania. A daily circulation type calendar derived from an automatic and objective classification scheme is used in synergy with the daily precipitation time series from five weather stations in the study area for a sixty-year period (1961–2020). Both mean and extreme precipitation do not show statistically significant trends, except for the annual precipitation at Constanța, for the value with daily precipitation totals greater than the 95th percentile at Craiova and the number of days exceeding the 99th percentile at Buzău and Râmnicu -Vâlcea, where significant negative trends were noticed. Moreover, the precipitation trends were analyzed in relation to the atmospheric circulation types. Non-significant positive trends were observed for the precipitation amounts (annually, winter, spring, and autumn) corresponding to very rainy circulation types (C, Cwsw), while for summer, the equivalent trends were negative. Moreover, it became evident that during extreme precipitation events, the predominant circulation types (C, Cwsw) are associated with western or almost western atmospheric circulation and Mediterranean- or Atlantic-originated depressions.

1. Introduction

Located in the central part of Europe (crossed by the parallel of 45 degrees north latitude, with the meridian of 25 degrees east longitude), Romania is a fairly small country (area of about 240,000 km2) with a temperate transitional climate between oceanic and continental. The general climate in Romania is controlled by four main types of air circulation at the European spatial scale: western (the most frequent), polar, tropical, and blocking circulation [1]. These include several types of atmospheric pressure systems (cyclones and anticyclones), of which the highest frequency and influence on the Romanian climate include the Azores and East-European anticyclones and the Mediterranean and Icelandic cyclones. Other baric centers with less influence on the Romanian climate are the Greenlandic, Scandinavian, and North African anticyclones [1,2]. A key role in spatial variability of climate and weather in Romania is the Carpathian Mountains arched chain (reaching the maximum altitude of 2544 m a.s.l.), located in the middle of the country and extends on about 30% of its territory (Figure 1). The Carpathians, due to their orientation and altitude, play an important role in the dynamic atmospheric processes, change in the atmospheric fronts and cyclones trajectories, and induction of spatial weather differences [3]. Regionally, the climate in Romania is influenced by the proximity (closer or more distant) of two large water bodies, namely the Black Sea (to the southeast) and the Mediterranean Sea (to the south), affecting the southeastern and southern regions of the country, respectively. In the western part of Romania, oceanic climatic influences are specific, while the eastern part is exposed to excessive continental influences [1].
In the above-mentioned context, the general climate in Romania is characterized by fairly cold winters, relatively hot and wet summers, and dry early autumn periods, but with significant spatial differences induced by regional and local factors. Thus, in terms of pluviometry, the annual amount of precipitation varies spatially very much, from less than 300 mm to more than 1200 mm, with a precipitation gradient of about 40 mm/100 m [4]. The Carpathians are the wettest region, with the annual rainfall totals exceeding 1000–1200 mm up to 1630 mm in the Western Carpathians at Stâna de Vale. The driest areas in Romania are located in the southeast of the country, in the Danube delta and on the Black Sea coast, where the annual precipitation amount is 300–400 mm or even less (about 270 mm at Sulina) (the annual precipitation data are according to NMA, 2008, for the period 1961–2000). The rainfall regime exhibits the wettest period in late spring–early summer, namely between April and July, with the maximum in May–June (even in July in mountainous areas). The lowest precipitation falls in winter (with minimum in January–February) in the mountainous regions and in autumn (with minimum in September–October) in the lowlands (NMA, 2008). In the southwest and southeast parts of the country, the winter months are more humid as a result of the influence of the maritime air masses from the Mediterranean Sea and the Black Sea, respectively. The pluviometric maximum in May–June is associated with more intense activity of the Atlantic cyclones that advance inside the continent [1]. The maximum rainfall in the spring–summer period could also be associated with intense cyclonic activity over the Mediterranean region [5,6]. A noteworthy number of Mediterranean cyclones pass through Romania from southwest to northeast, causing prolonged rainfall events. Sometimes, these cyclones that arrive over the Black Sea possess a retrograde trajectory and generate significant precipitation in the east and southeast of the country, impacting the Eastern and Curvature Carpathians and Sub Carpathians [2,5,6].
The pluviometric minimum in winter is related to the high frequency in this season of the continental air circulation from the east, while in autumn, the low precipitation is associated with predominantly anticyclonic situations [1]. It should also be mentioned that overall, the frequency of occurrence of the Mediterranean depressions over the southern Romanian region presents a maximum during the period November–December and a minimum during January–February [7]. The temporal variability of precipitation is very high both interannually and during the year. Thus, in the wettest years, the rainfall annual totals can exceed three–four times the ones recorded in the driest years, and during the year, it can be months with no rainfall [8].
In such a climate environment, a reasonable and crucial question is raised: How have precipitation characteristics changed in Romania during the last decades? To provide a robust answer to this question, we have attempted to analyze both mean and extreme precipitation characteristics, as well as their relationship with atmospheric circulation. If, indeed, over the last 60 years, statistically significant trends in precipitation are detected in several weather stations in the study area, then these changes could be attributed either to changes in the frequency of the circulation types or to changes in the intensity of precipitation indices related to these types. Thus, by detecting which circulation types prevail during extreme precipitation days, we can determine whether changes in atmospheric circulation could explain the significant trending characteristics of the precipitation amounts.
Moreover, we also set out to investigate if this automatic classification scheme already used in studies conducted in the Mediterranean region [9,10], in western Europe [11], and in central Europe [12] could be applied in another Balkan country, except Greece, but with a continental climate, such as Romania. Hence, is it possible to compare the results of the present study with the equivalent ones of our previous research applied to a “classic” continental climate country [12]?
In the last more than 100 years (between 1901–2013), no trends have been noted in the variation of the annual amount of precipitation in Romania as a whole [13]. After 1961, some changes were detected regionally in the seasonal variation of rainfall. Thus, significant upward trends were found for several stations in autumn (especially in the central and western parts of Romania, as well as in the extreme south of Romania, close to the Danube River), while a few isolated stations recorded negative trends [14,15,16,17]. During the period 1981–2013, when compared to 1961–1990, a decrease in monthly precipitation in spring and summer months (by 5–8 mm/month in May and June) was found, and there was a rise in the first part of autumn by 8 mm in September and 5 mm in October [13].
Short-duration and high-intensity precipitation have a large impact on society in the form of urban floods and flash floods, depending on several factors, such as duration and the type of storm, season, microphysics, regional atmospheric stability, and large-scale circulation [18]. The relationship between the variability of summer precipitation extremes and atmospheric blocking events in Romania was analyzed by Rimbu et al. [19] for the period 1962–2010. The authors found that the high frequency of extreme precipitation events over Romania is associated with the high frequency of blocking in the 0°–40° E sector. In terms of extreme rainfall, significant upward trends were detected over large areas in Romania in both the frequency of very wet days and the maximum daily amount during autumn and in the maximum duration of dry spells during summer [20]. The average number of days with precipitation exceeding 20 mm between 1991–2020 was higher compared to the period 1961–1990 for most weather stations in Romania [21]. In the study carried out by Croitoru et al. [22], it was found that for the period 1961–2013, at a total of 34 weather stations analyzed, there were decreases in the annual number of days with more than 0.1 mm/day and a predominantly increasing trend for the number of isolated days with moderate (annual number of days with more than 5 mm/day) and heavy precipitation (annual number of days with more than 10 mm/day).
In another study [23] carried out on a national scale, for the period 1980 to 2009, an increase in the number of events of precipitation amounts greater than or equal to 50 and 100 mm, respectively, in 24 h was found. The region inside the Carpathian arc is less affected than the Extracarpathian space, with such amounts of precipitation falling in 24 h.
The main changes in climatic elements in Romania, observed and projected for the future, as well as their impacts, are synthetized in several publications, such as Bojariu et al. [16,21] and Zaharia et al. [24].
The present paper focuses on southern Romania, an intensely populated and well-developed socio-economic region in Romania. This region includes the country’s capital (Bucharest), as well as other large important cities in Romania (county seats). Due to the geographically favorable features, this region is the most important agricultural area in Romania. The high water demands for social-economic needs and agricultural crops make the region vulnerable to drought and water deficit. This vulnerability is likely to be accentuated in conditions where, in recent decades, the south of Romania appears to be affected by aridization trends [25,26,27]. Consequently, studies on precipitation in this part of Romania are of high interest both scientifically and, especially, practically. In this context, the present paper provides updated information on the variation of precipitation in southern Romania and presents original results in this region regarding the relationship between precipitation (mean and extreme) and the atmospheric circulation types (analyses of this kind of relationship are quite limited in the region).

2. Materials and Methods
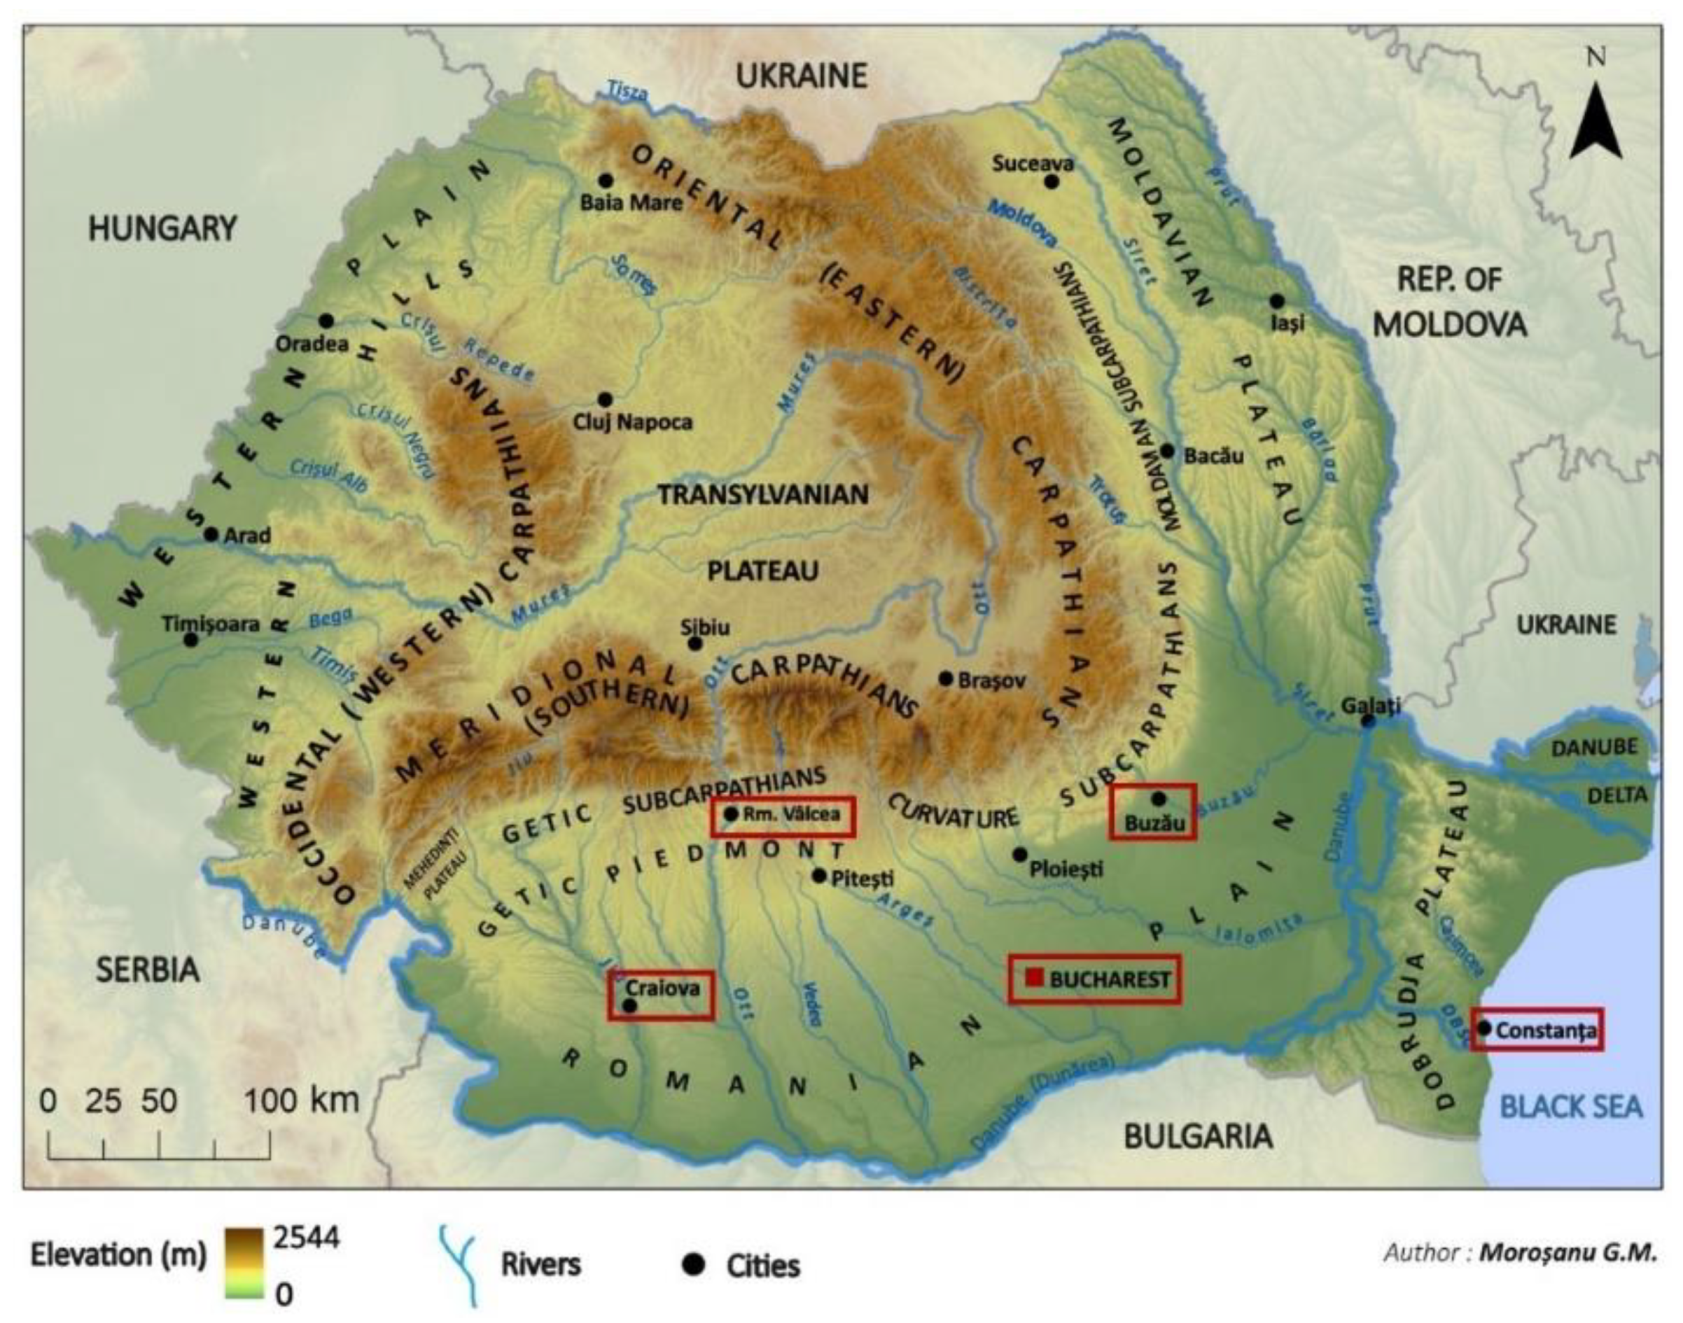
2.1. Study Area

The study area extends between the Carpathians (to the north) and the Danube River (to the south) and mostly overlaps a lowland area, corresponding to the Romania plain (for the most part) with altitudes lower than 300 m a.s.l. and to the hilly area (Getic Piedmont) in the northwest part with heights of 200–700 m a.s.l. (Figure 1). The study area also includes the Dobrogea Plateau/Region located in the southeast of Romania, between the Danube River (to the west and north) and the Black Sea (to the east), with a hilly landscape below 500 m a.s.l. altitude. Despite the relative uniformity of the relief, there are spatial climatic differences induced by local/regional factors and influences. Thus, the western and southern parts are more frequently affected by the Mediterranean circulation, while in the east, the continental (eastern) origin circulation prevails. The Black Sea influences the climate in the east of Dobrogea Region along the coast. The Carpathians play a key role in the climate of southern Romania through their influence on the atmospheric circulation and their role as a barrier to the southern (Mediterranean) circulation [3].

2.2. Data

In this study area, we selected five weather stations located in regions with different geographical and climatic characteristics at altitudes ranging between 13 m a.s.l. and 239 m a.s.l., as follows: Craiova (in the west, 192 m a.s.l.), Râmnicu (Rm.) Vâlcea (located in a hilly area at the foot of the Carpathians, in a valley corridor, at 239 m a.s.l.), București (Bucharest)–Băneasa (nearly in the central part of the Romanian plain, at 90 m a.s.l.), Buzău (in the northeastern part of the study area, at 97 m a.s.l.), and Constanța (in the eastern extremity, on the Black Sea coast, at 13 m a.s.l.) (Figure 1). These weather stations are considered representative of the study area, being part of the Regional Basic Synop Network (RBSN) and belonging to the National Meteorological Administration (NMA).
Daily precipitation time series covering a 60-year period (1961–2020) were extracted for the selected weather stations from the ECA&D (European Climate Assessment & Dataset) [28] database, freely accessible at https://www.ecad.eu/, accessed on 19 August 2023. These data series were used to compute the following:
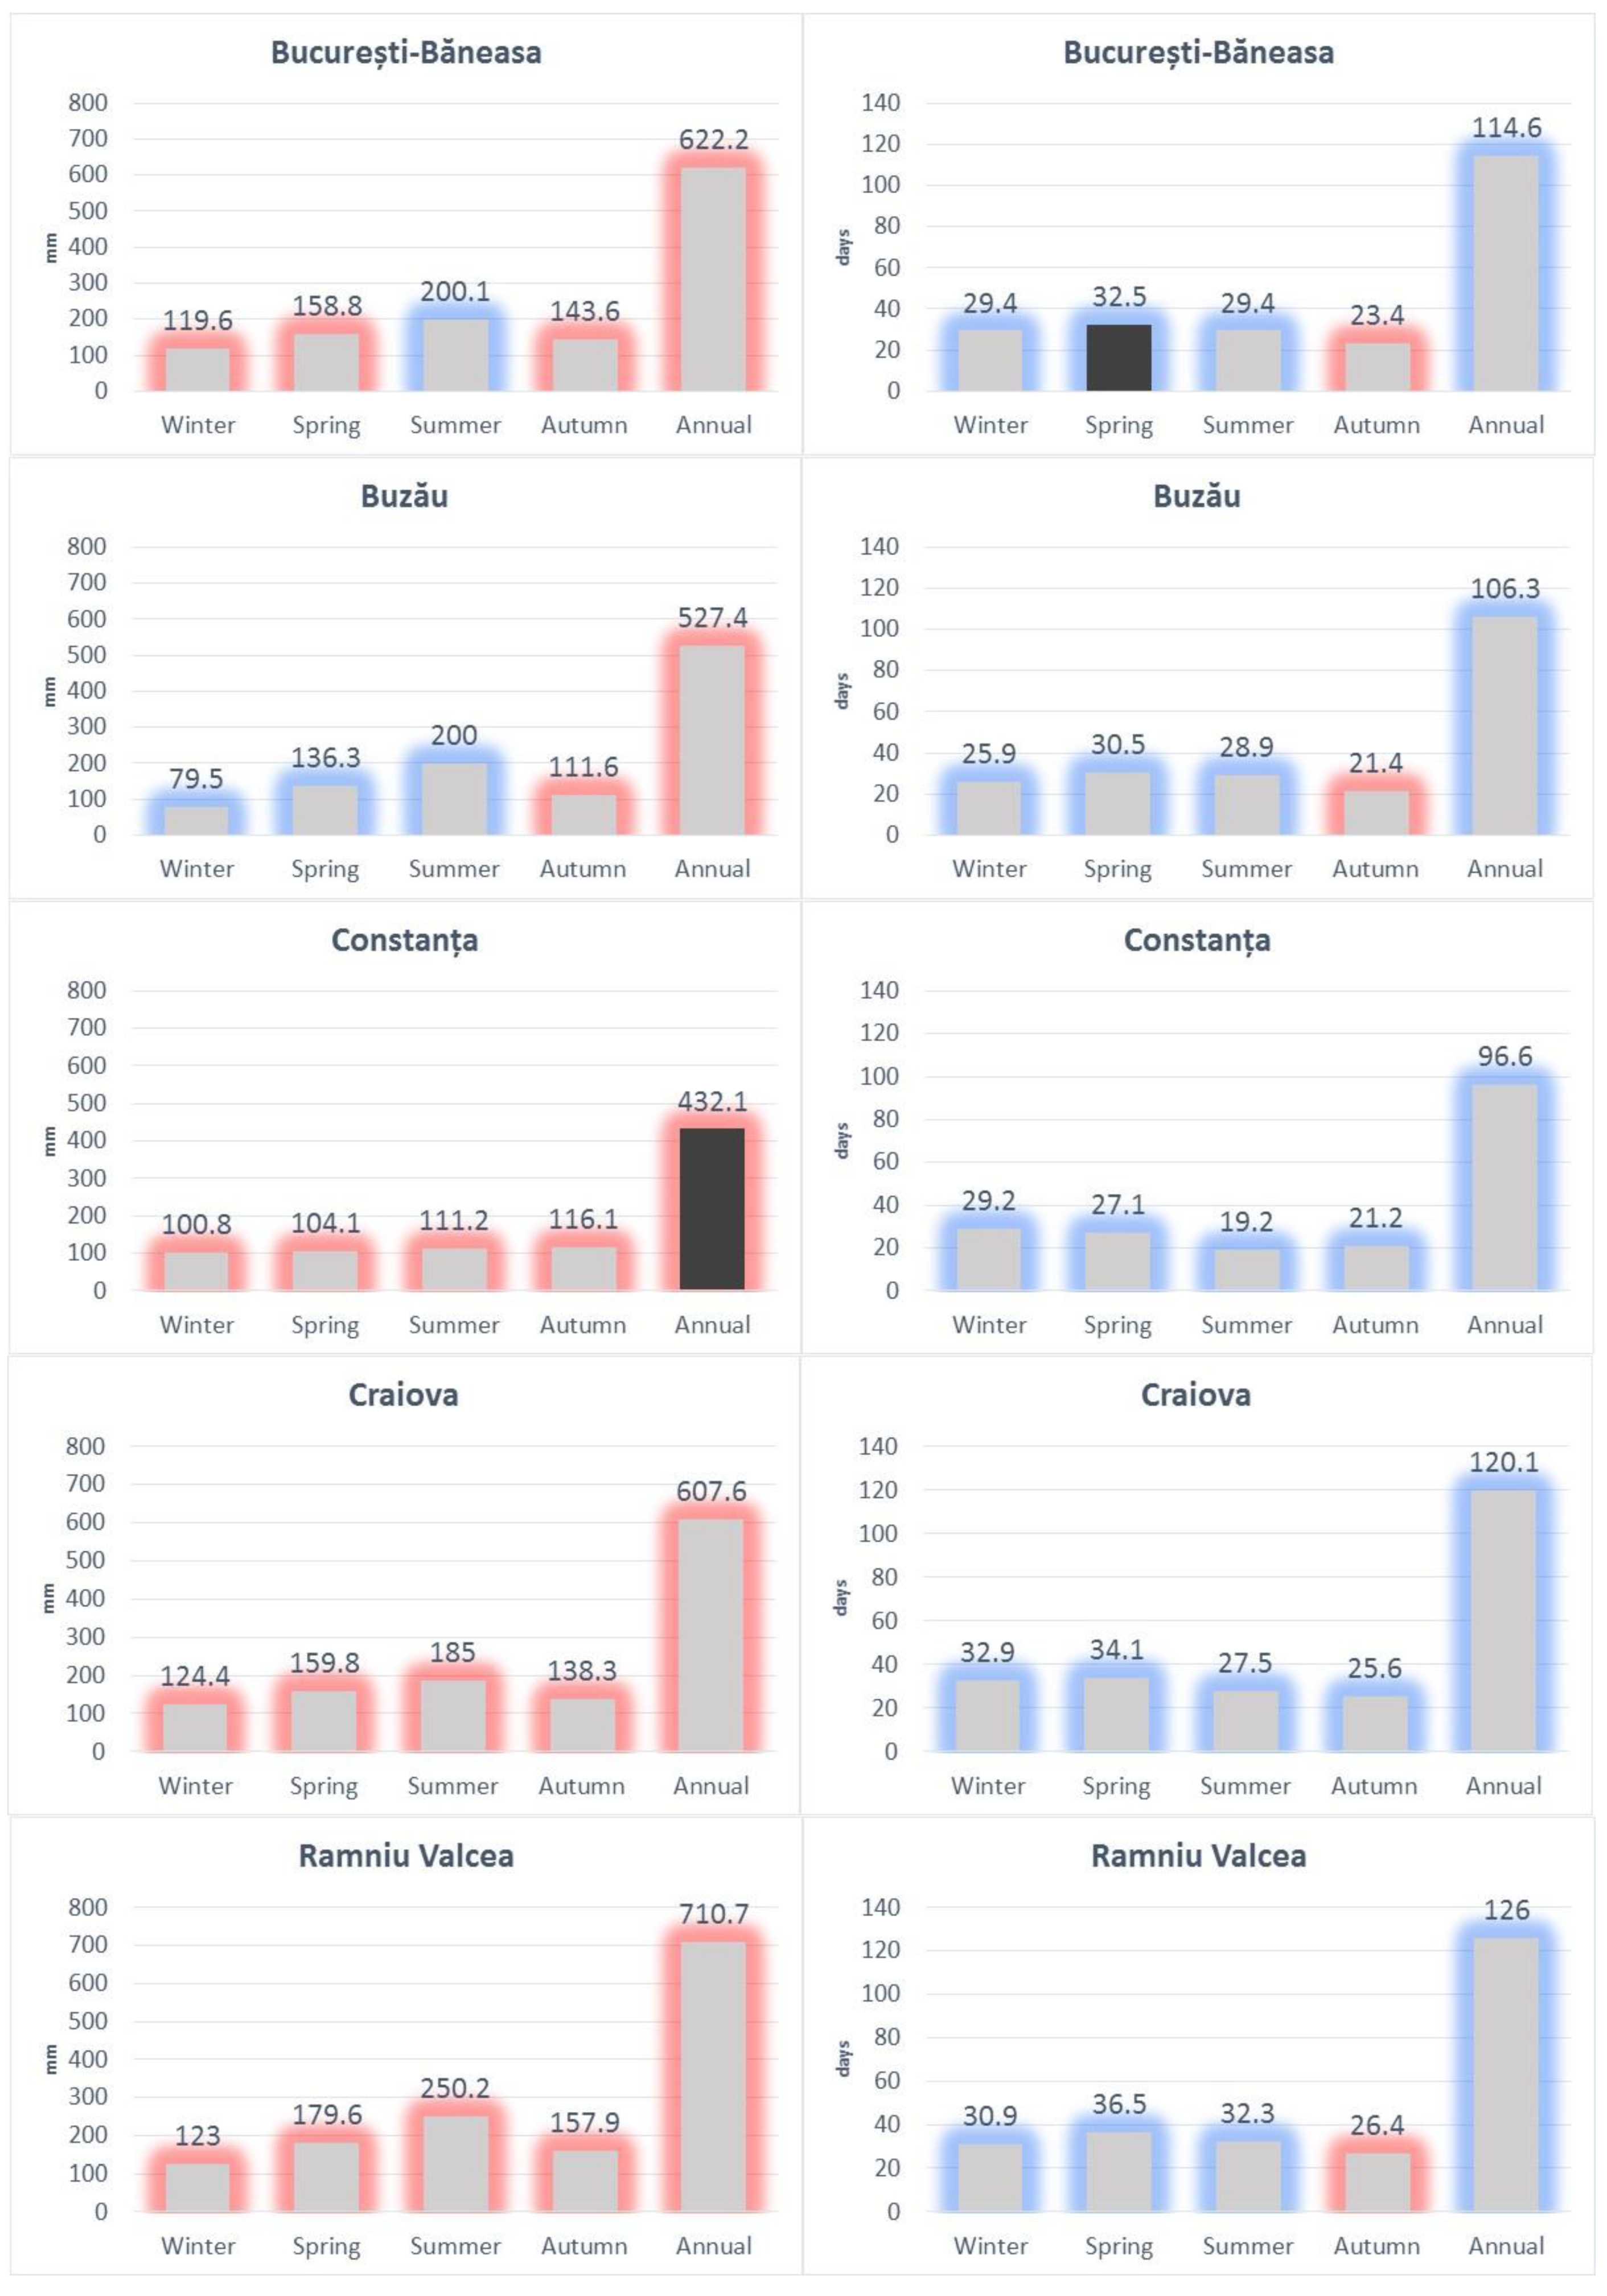
  • Annual and seasonal precipitation amounts.
  • Number of rain days (threshold of 0.1 mm).
  • Precipitation values for the 90th and 95th percentiles.
  • Number of rain days with precipitation exceeding the 95th and 99th percentiles.
  • Daily maximum precipitation.
  • Ratio of the daily maximum to the values of the 95th and 99th percentiles.
  • Trends of the above parameters (their statistical significance was examined with the Mann-Kendall test at a 0.05 significance level).
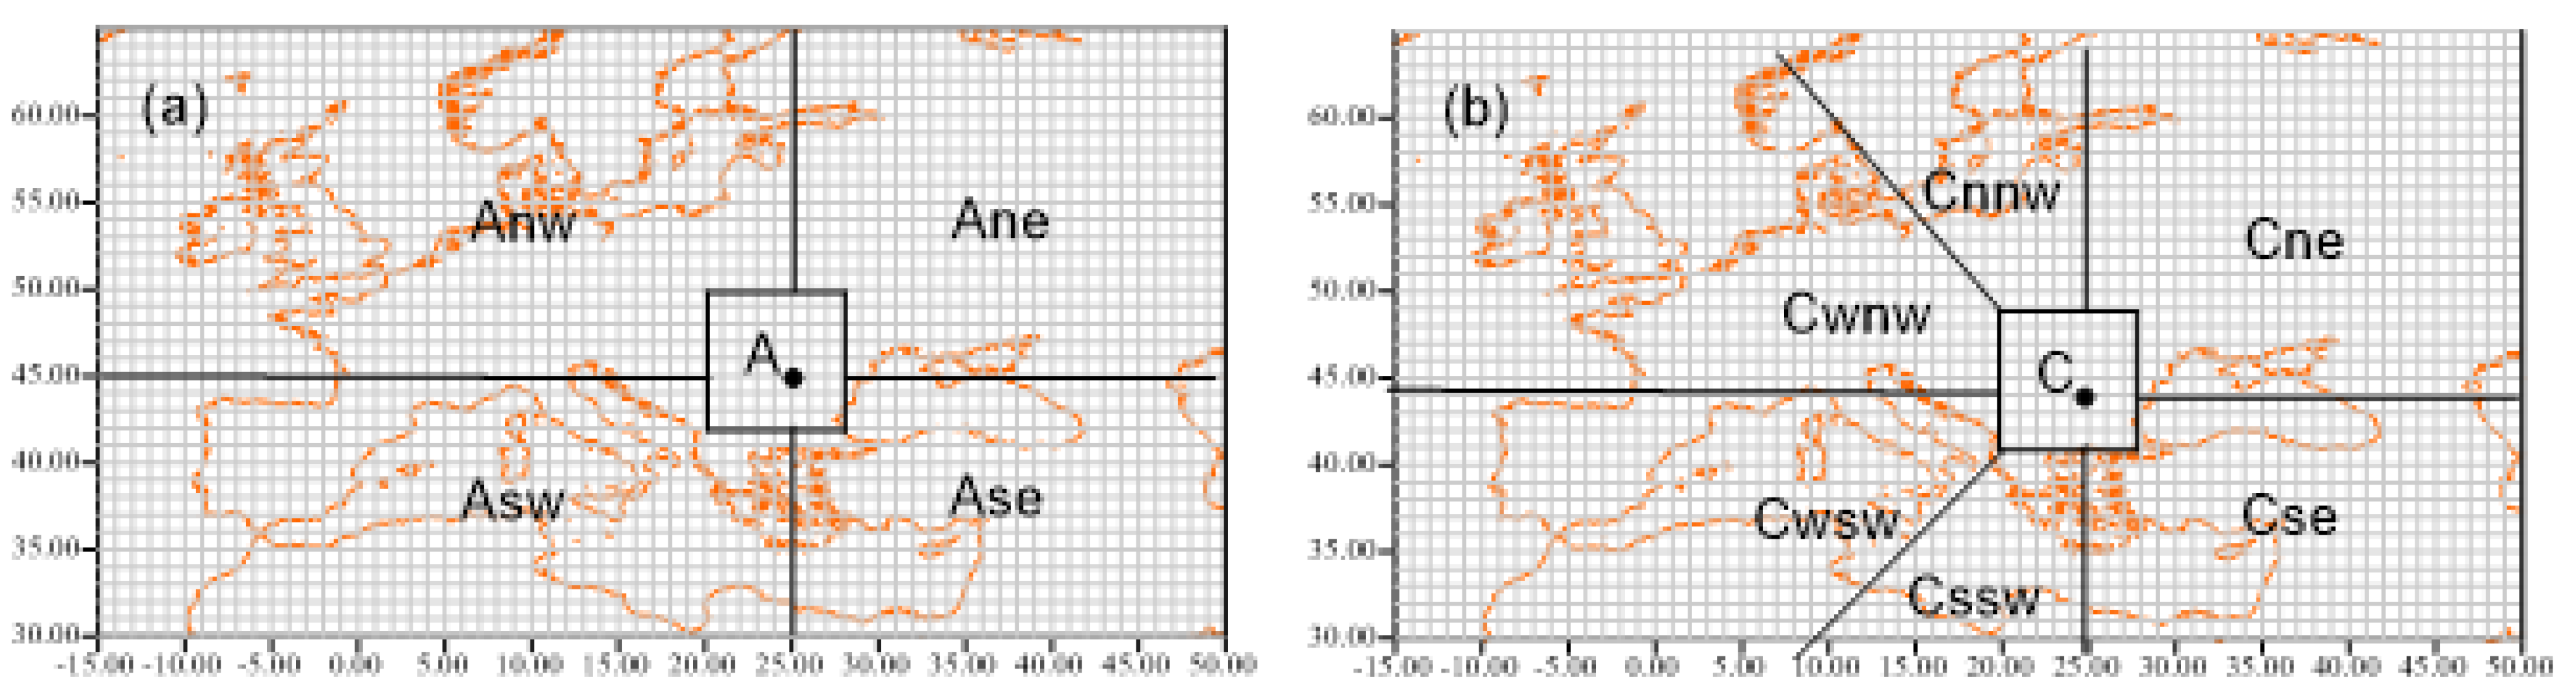
2.3. Methodology

For the computation of a daily circulation type calendar for the analyzed period, we used daily geopotential reanalysis data at the 500 hPa level [29], with a spatial resolution of 2.5° × 2.5° as input data to the updated flexible automatic classification scheme [9]. The selected spatial window extends from 20° N to 75° N and from 25° W to 50° E, whereas the central point for classification was the one that was closer to the five stations log = 45° N, lat = 25° E). It is worth mentioning that the classification scheme is actually applied to the anomalies of the geopotential heights, calculated from the monthly means of the period 1971–2000. To detect the anticyclonic and cyclonic types, all the field anomaly values were compared with the mean anomalies of 9 grid points with the central point included (log = 45° N, lat = 25° E). A day can be characterized as anticyclonic when the average value of the 9 grid points is positive, whereas it is classified as cyclonic if it is negative (Figure 2). Additionally, we examined the entire anomaly field to identify the center of the anticyclone or cyclone that influences the country every day.
After the daily circulation type calendar was identified, we also computed several parameters to extract more information on the characteristics of these types, such as their seasonal and annual frequencies, their trends, and their average pattern maps.
Finally, to investigate the links between the circulation types and precipitation, we computed the following indexes:
8.
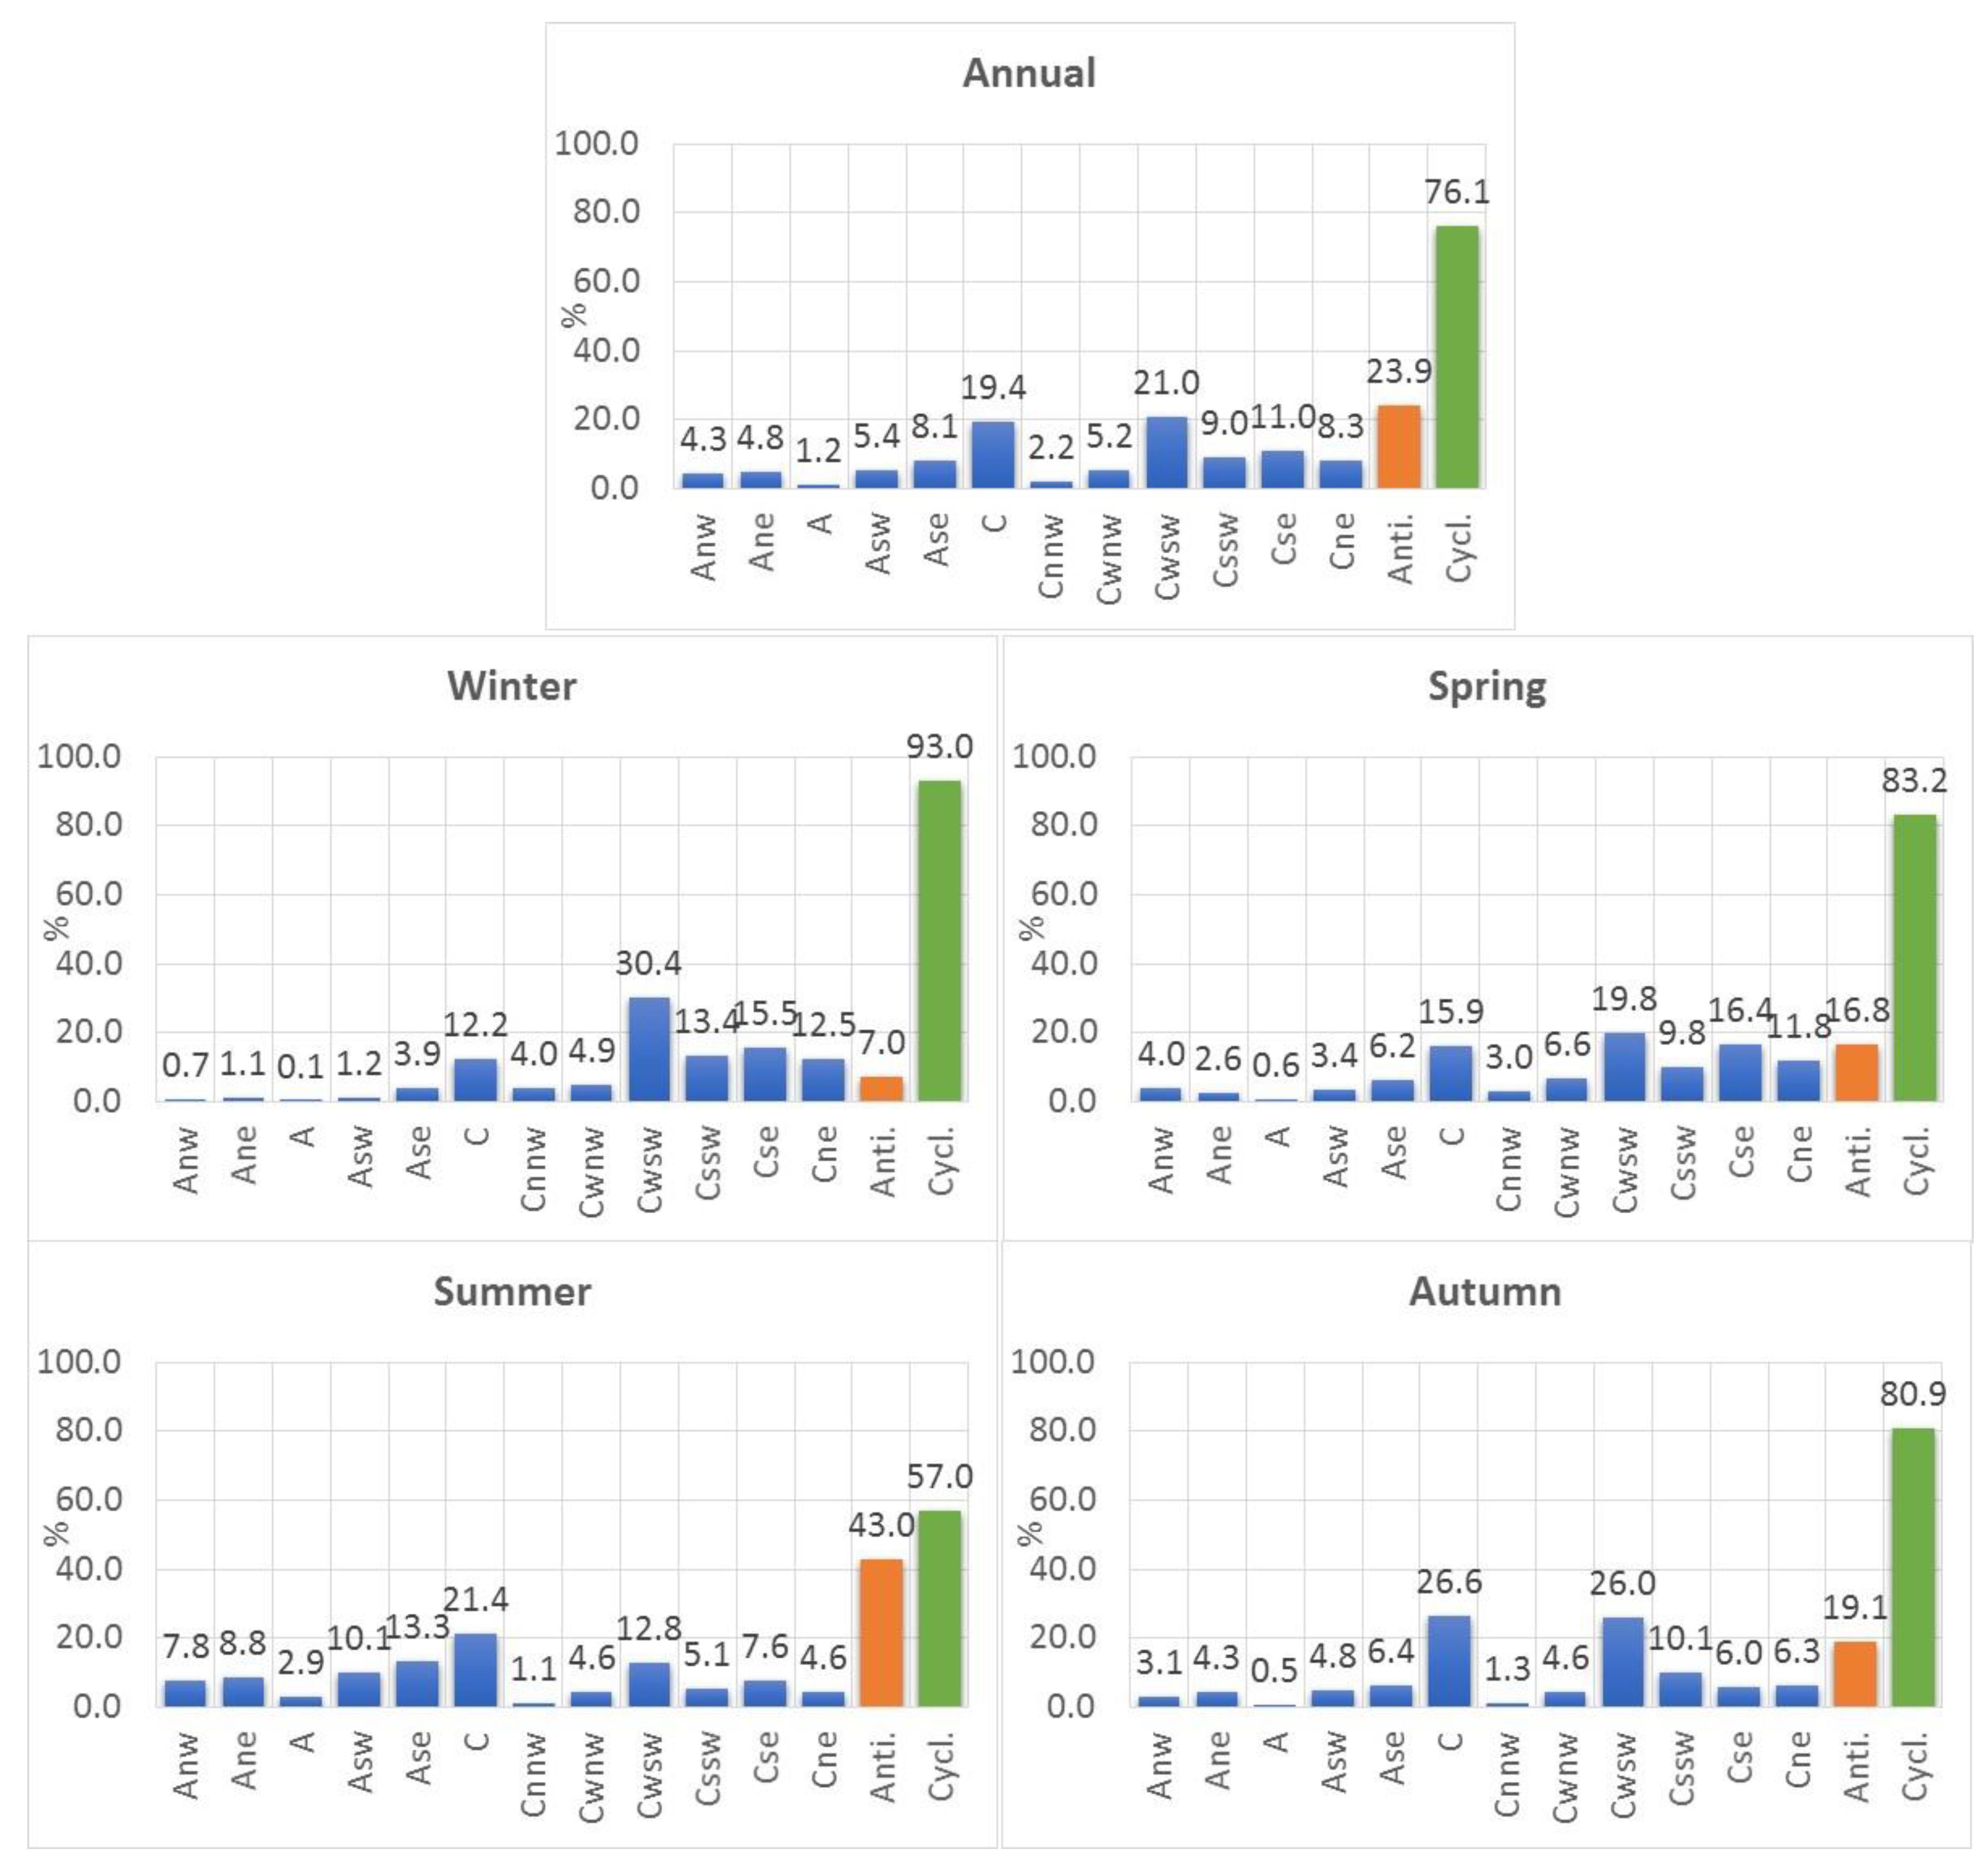
Seasonal precipitation percentages per circulation type to detect the rainiest circulation patterns.
9.
Seasonal precipitation trends per circulation type.
10.
Daily precipitation height for the 95th and 99th percentiles for the two most frequent types during days of heavy and extreme precipitation.
11.
The number of rain days for the 95th and 99th percentiles.
12.
The total mean precipitation (%) of the 95th and 99th percentiles for the above-mentioned circulation types.
13.
Maximum daily precipitation/95th percentile and maximum daily precipitation/99th percentile ratios for the above circulation types.

3. Results

3.1. Variation and Trends in Annual and Seasonal Precipitation

The average annual precipitation amounts recorded in the period 1961–2020 at the selected weather stations vary spatially, ranging from 432.1 mm at Constanța, on the shore of the Black Sea, to 710.7 mm at Rm. Vâlcea (Figure 2). In the northeast of the study region (at Buzău), the annual average precipitation is less than 550 mm (527.4 mm), while at the rest of the stations, it is slightly over 600 mm (607.6 mm at Craiova and 622.2 mm at București–Băneasa).
In terms of seasonal rainfall distribution, the wettest season is summer for all analyzed stations except Constanta. The rainfall amounts of this season contribute to 25–38% of the total annual totals. The wettest station is Rm. Vâlcea (250.2 mm), and the driest one is Constanța (111.2 mm), while at the other stations, the seasonal amounts range between 185.0 mm (at Craiova) and about 200 mm (at București-Băneasa and Buzău) (Figure 2). Spring is the second season in terms of the amount of precipitation (25–26% of the annual totals). During this season, the largest amounts of precipitation fell in Rm. Vâlcea (179.6 mm) and Craiova (159.1 mm), while the lowest were recorded at Buzău and Constanța (136.3 mm and 104.1 mm, respectively). In autumn, the share of precipitation from the annual total is 22–27%. The wettest station is once more Rm Vâlcea (157.9 mm), followed by București–Băneasa (143.6 mm), while the driest are Buzău (111.6 mm) and Constanța (116.1 mm) stations. Winter is the driest season in the study region, with 15–23% of the total annual precipitation. The highest shares are noted at Constanța (23%, namely 100.8 mm) and Craiova (20%, namely 124.4 mm) because of the climatic influences pronounced in this season of the Black Sea and the Mediterranean Sea, respectively. At Craiova (124.4 mm) and Rm. Vâlcea (123.0 mm), the highest seasonal totals were recorded, while the driest station in winter is Buzău (79.5 mm), which is under the influence of the eastern continental circulation. The maximum number of rainy days (30– 36) was detected for most stations in spring, except Constanța, where it is in winter (Figure 2). The minimum number of rainy days occurs in autumn at all analyzed stations, in agreement with that observed in Hungary [12].
Between 1961–2020, positive trends in annual precipitation amounts were identified at all analyzed stations but were statistically insignificant, except for Constanța, where the trend was statistically significant at a 0.05 level (Figure 2). At seasonal time scale, four stations (Constanța, Craiova, Rm. Vâlcea, and București-Băneasa) showed non-significant positive trends for all seasons, except for București, with non-significant negative trend in summer. In the case of Buzău station, non-significant negative trends were found in winter, spring, and summer, while in autumn, the trend was positive but also not statistically significant. It should be noted that previous studies in some stations in southern Romania showed significant positive trends in autumn [15,16]. These findings agree with the positive trends observed during autumn in Hungary [12].

3.2. Extreme Precipitation Analysis (95th and 99th Percentiles)

Extreme precipitation variability was investigated based on the 95th and 99th percentile values computed from the daily precipitation time series and on the daily maximum amounts registered at the selected weather stations during the period 1961–2020. As shown in Table 1, the highest values of the 95th and 99th percentiles were found in three stations: București (21.6 mm and 39 mm), Buzău (20 mm and 38.6 mm), and Rm. Vâlcea (22.2 mm and 38.2 mm). Bucharest and Rm. Vâlcea are the wettest ones in terms of annual precipitation. The equivalent extreme values at the other two stations are 17.6 mm and 36.6 mm at Constanța and Craiova, 20 mm and 37.8 mm, respectively. Regarding the absolute daily maximum totals, the highest ones were noticed at Constanta (201 mm) and the lowest at Craiova (84.8 mm). Comparing these absolute maximum values in Romania with those in Hungary [12], it was found that the Romanian extremes are quite similar to the Hungarian ones (except Constanța), but they are much lower than the Mediterranean extremes [30]. Regarding the ratio Abs Max/percentile, the highest values were found at Constanța, which is the driest station out of the five under study.
The number of cases of extreme precipitation in the 95th percentile exceeds 300 days as a total of stations under study, while for the 99th percentile, the calculated cases were over 60. Regarding the mean number of rain days exceeding the 95th and the 99th percentile, it ranges from 4.8 (at Constanța) to 6.3 (at Rm. Vâlcea) for the first index and from 1.0 (at Constanța) to 1.3 (at Rm. Vâlcea) for the second.

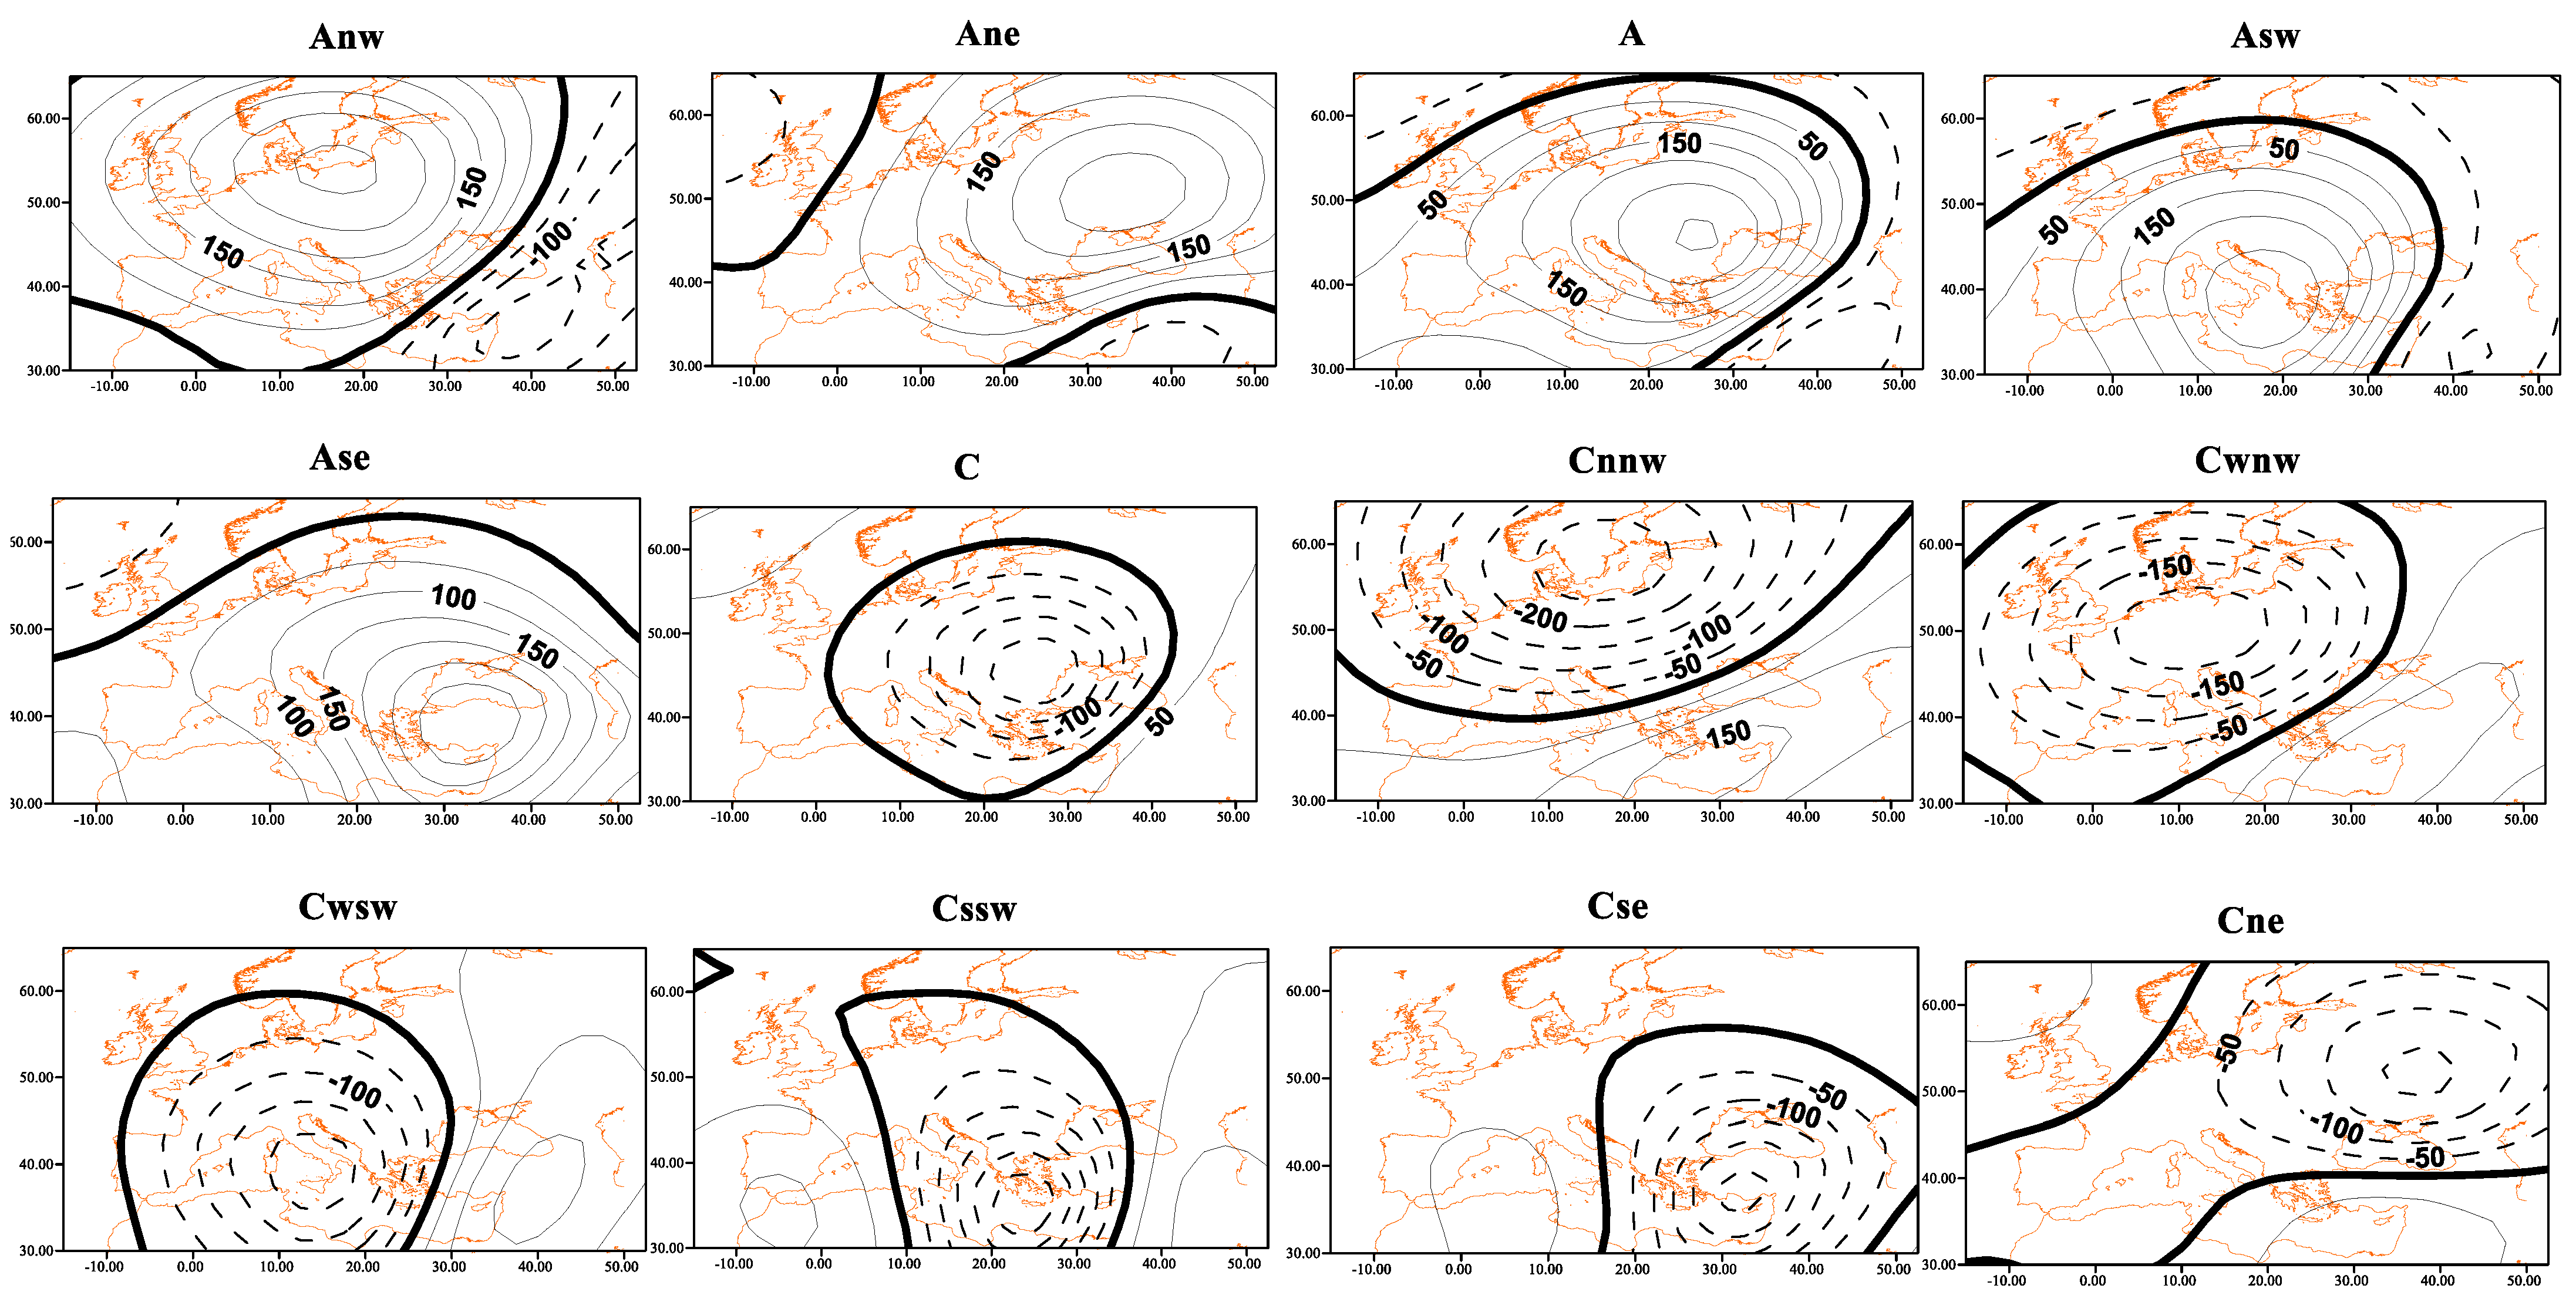
3.3. Atmospheric Circulation Types: Description, Frequencies, and Trends

In Romania, there is a rather limited number of studies on the objective classification of the atmospheric circulation pattern. Among these, the ones published by [31] are worth mentioning. They have used the Jenkinson–Collison objective methodology to achieve the classification over the Romanian territory. Other studies have focused mainly on the links between precipitation (liquid and solid) and large-scale atmospheric circulation [32,33,34], as well as on the precipitation variability related to extratropical Mediterranean-originated cyclones [35,36,37,38].
The classification scheme used in this paper consists of five anticyclonic types and seven cyclonic types (Figure 3), which are classified primarily by their center location (positive center–anticyclonic type and negative center–cyclonic type).
A classification scheme is effective if each type corresponds to a characteristic geopotential pattern, which can easily be distinguished optically from the other types if it can reproduce the wind flows at the surface and different heights or if it can reproduce the meteorological conditions over the domain of interest.
Aiming to address these criteria, we computed the average anomaly seasonal maps (composite maps hereafter) of the 12 circulation types (Figure 4). For all of them, the t-test of a sample of the full range of positive and negative anomaly values, as well as their maximum values, was applied to identify the differentiation among the resulting circulation patterns of each type. It was found that all anomaly fields are significant at the significance level of 0.05. The comparison of the anticyclonic and cyclonic types revealed, as expected, reverse atmospheric circulation conditions. Moreover, the average annual relative frequencies of the circulation types showed that 51.9% of the days correspond to anticyclonic conditions and 48.1% to cyclonic ones (Table 2).
Annually, the most frequent are the anticyclonic types Asw (14.1%) and Ase (13.0%), and the cyclonic types Cne (10.6%) and Cse (10.5%). We should also mention that the two cyclonic types that are mainly related with the highest percentages of precipitation (Cwsw and C) have lower frequency of occurrence (9.5% and 7.4%, respectively).
The seasonal frequencies of the circulation types differ from the annual ones (Table 2). In summer, the anticyclonic types are more frequent (69.7%) than the cyclonic ones (30.3%). The highest frequencies are noted for Asw (17.5%), Ase (15.8%), and A (13.5%), while among the cyclone types, C (8.3%) is the most frequent, followed by Cwsw (6.0%). In winter, the atmospheric circulation is more cyclonic (61.3%) than anticyclonic (38.7%). The cyclonic types with the highest frequencies in this season are Cse (16.8%), Cne (14.9%), and Cwsw (11.3%), while the most frequent anticyclone is of the type Ase (12.7%). During spring, the total frequencies of the anticyclonic and cyclonic types are 42.3% and 57.7%, respectively. As in winter, the most common cyclonic types are Cne (14.4%), Cse (13.7%), and Cwsw (10.3%), while Asw (11.5%) shows the highest frequency among the anticyclonic types. Finally, in autumn, the anticyclonic types (56.9%) prevail over cyclonic ones (43.1%). Asw (17.3%) followed by Ase (12.8%) are the most common anticyclone types, while Cwsw (10.3%) and C (9.0%) showed the highest frequency among cyclones.
The analysis of the annual trends showed that the anticyclonic types tend to increase in frequency (significant positive trends) apart from Anw and Ane, while the cyclonic types present significantly negative trends, except for type C (Table 2). However, examining each type separately, the results differ. Seasonally, the winter cyclonic trends are negative and, in some cases, statistically significant, while the anticyclonic type trends are more complex. The first two anticyclonic types (Anw and Asw) show non-significant negative trends, while the other three show positive trends, but only the last two (Ane and Ase) are statistically significant. Generally, in spring and autumn, the trends are quite similar and negative for cyclonic types (except for C in autumn), while the anticyclonic types showed mixed trends (Ase tends to have a statistically significant increase in both seasons, while Anw has a significant decreasing trend). During summer, all cyclone types show significant decreasing trends, while among the anticyclone types, three show significant increasing trends (Ane, A, and Ase), and two (Anw and Asw) show non-significant negative trends (Table 2).

3.4. Relationship between Circulation Types and Precipitation

Annually, for all the five studied stations, the percentage of precipitation attributed to anticyclonic types is 23.9% (Figure 5). Comparing this finding with the results of our previous studies in other countries, it is found that this percentage is lower than the one noted in Hungary (27.2%) [12], similar to that in Belgium (23.2%) [11], but much higher than the one found for several Mediterranean stations (<10%) [30]. This high percentage of precipitation related to anticyclonic types could probably be associated with the instability of the higher altitudinal air masses over Romania compared to the Mediterranean, especially for summer when the percentage of precipitation attributed to anticyclonic conditions reaches up to 43.0%. In detail, the anticyclonic types associated with the highest precipitation percentages are Ase, Ane, and Asw (Figure 5).
The center of these anticyclonic types is located, in the first case, in the southeast of the country (atmospheric circulation flows from the southwest to all levels), in the second case, in the northeast (atmospheric circulation flows from the northeast to all levels) and in the last case, in the southwest (with the northwest circulation flow) (Figure 3). In all these cases, and even though with a different altitudinal circulation, the surface is characterized by high pressure (generally with slack pressure field) and the prevalence of a cold front, or occluded front, that is more or less active, which contributes to the increase in the instability of the air masses.
On the other hand, it is obvious that annually (Figure 5), the percentage of precipitation associated with the cyclonic conditions in the region is much higher (76.1%), with the rainiest type being Cwsw (21%) followed by C (19.4%) and Cse (11%). Seasonally, the highest percentage of precipitation attributed to cyclone types is in winter (93%) and the lowest in summer (57%). Spring and autumn had almost the same percentage: 83.2% and 80.9%, respectively. The cyclone type Cwsw has the highest percentage of precipitation in winter (30.4%) and spring (19.8%), while type C has the highest rainfall in summer (21.4%) and autumn (26.6%). The second wettest cyclonic type for winter (15.5%) and spring (16.4%) is Cse. It is found that type C, which is one of the wettest cyclonic types in Romania, the Mediterranean region, and Belgium, is only the fifth in the hierarchy of wettest types in Hungary (8.5%) on an annual time scale [12].
Annually, the trends in the precipitation heights associated with the anticyclonic types are found to be positive and statistically significant for all stations, while in the case of the cyclonic types, the trends are mixed but non-significant (Table 3). The seasonal analysis showed significant increasing trends for precipitation of the anticyclonic type in spring and summer (at Bucureși and Buzău) and in autumn (at Buzău), while for cyclone types, only one station (Buzău) showed significant positive trends in autumn. In terms of equivalent rainy days, at the annual scale, significant positive trends were found at all stations for the anticyclonic type and negative for the cyclonic type (Table 3). On a seasonal scale, the trends in rainy days are similar but statistically significant only in some stations, especially in spring and summer.
The analysis of the precipitation trends per atmospheric circulation type at the annual scale showed positive and statistically significant trends for the anticyclonic types Anw, Asw, and Ase (Table 4). Conversely, negative statistically significant trends were found for the cyclonic types Cwnw and Cse. We should also underline that the rainiest types (C and Cwsw) present non-significant positive trends. The seasonal analysis revealed that the precipitation amounts of Ase (spring, summer, and autumn) and Anw (spring) tend to increase (statistically significant). In the case of cyclone-related precipitation, significant negative trends were noticed for Cnnw (in summer and autumn), for Cwnw during spring and summer, and for Cse type in winter. It should also be mentioned that precipitation has non-significant positive trends for types C and Cwsw in winter, spring, and autumn and non-significant negative trends in summer (Table 4).

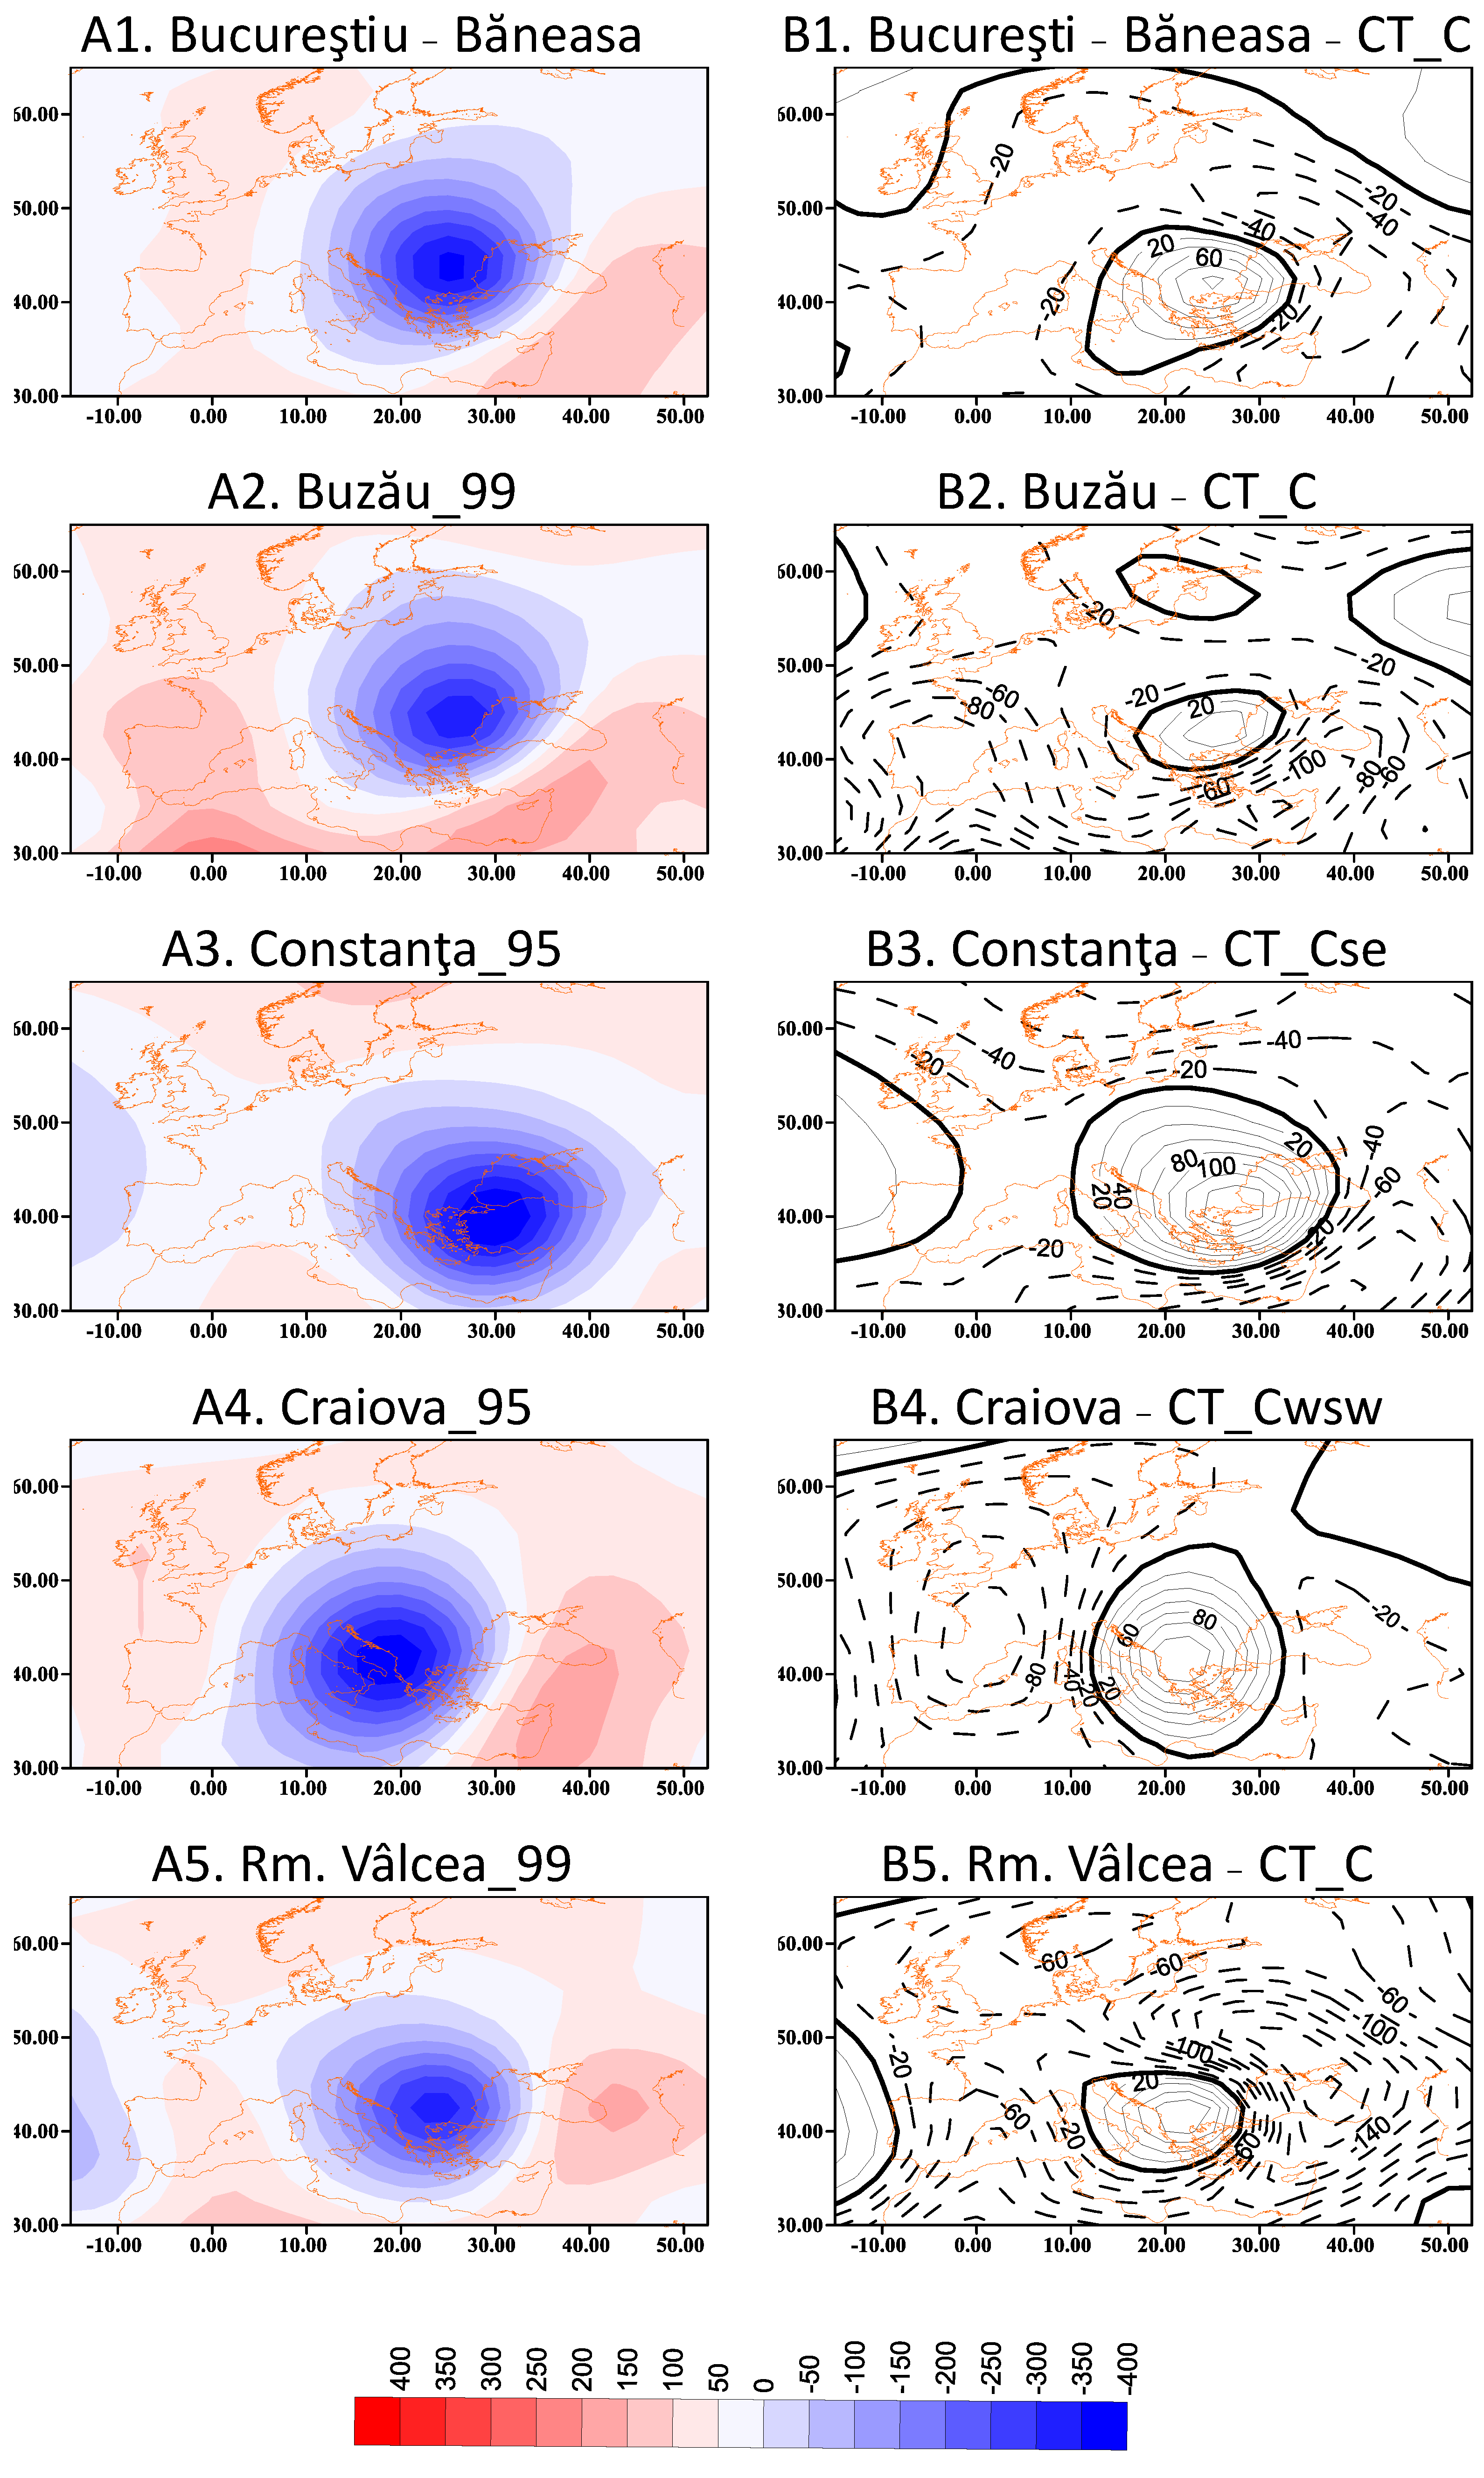
3.5. Analysis of the Circulation Types during Extreme Precipitation Events

Table 5 depicts the four circulation types with the highest absolute frequencies of extreme precipitation (95th and 99th percentile) for each of the analyzed stations. Type C is the most frequent for both percentiles at București–Băneasa, Buzău, and Constanța, and for the 99th percentile at București-Băneasa, Buzău, Constanța, and Rm. Vâlcea. Type Cwsw prevails during these extreme events at Craiova (for 95th and 99th percentile) and Rm. Vâlcea (for 95th percentile). Also, the Cse type has a high frequency of occurrence at Constanța station (both for the 95th and 99th percentile).
Dobri et al. [36] noted that the causes of the 24-hour extreme precipitation differ between the cold and warm semesters in Romania. During the cold period, Atlantic and Mediterranean origin cyclones tend to contribute to extreme precipitation over the country. On the contrary, in the warm season, atmospheric instability is the main extreme precipitation causative factor either because of the trough propagation from west to east or of the cut-off lows located in the Romanian region, causing a very high instability over the whole troposphere.
Aiming at a more thorough examination of the atmospheric characteristics of the extreme events, we computed the mean composite maps of all the circulation types, as well as the composites of the two most common atmospheric circulation types associated with the extreme precipitation events (days with precipitation equal or higher than the two selected percentiles). Additionally, the difference maps (general mean field of type minus mean field of type for extreme precipitation) were also computed to investigate potential changes in the atmospheric circulation during days of extreme precipitation events.
The first case focuses on București–Băneasa station for the 95th index, which, together with the station of Constanța, has the absolute daily maximum. As mentioned above, the dominant circulation type is cyclonic C. The composite analysis showed an extended negative anomaly area that covers central Europe, the Balkans, and part of the Mediterranean region (Figure 6A1). The anomaly center is located in the center of Romania, while positive anomalies are found in western Europe, eastern Mediterranean, and Turkey. The differences map (Figure 6B1) revealed that a relatively large area is covered with positive differences, mainly over the Balkan Peninsula. The center of the differences is over Romania, covering also southern Italy and eastern Mediterranean. This shows that the average anomaly field responsible for the extreme precipitation in the București area is significantly different from the general average field of type C. Extreme precipitation is the result of a perturbation current with fronts, whose main trajectory of this pressure system is either from west to east or from southwest to northeast, driven by the circulation in the altitude.
The second case concerns Buzău station and the 99th index. Type C prevails during these extreme precipitation days, and as previously, the center of the negative anomalies is found in central Romania. However, the area of negative anomalies is not so extended as in the case of București (Figure 6A2). The mean difference composite map (Figure 6B2) depicts that the area of positive anomalies is also located in Romania, but it is more limited in comparison with the București one. Once more, the intense precipitation conditions are associated with the perturbation current that moves from southwest to northeast or from west to east due to atmospheric circulation at altitude.
At Constanța, the predominant circulation type for both indices is cyclonic C, with 67 and 21 cases (days) for the 95th and 99th percentiles, respectively (Table 5). For both extreme indices, the mean anomaly and the difference field do not differ much from those described for the previous two stations for the same circulation type. Thus, we decided to examine type Cse, which is the second most frequent one during the extreme event days (sixty-three and seven cases for the two indices). This cyclonic type has an anomaly center over the southeastern part of the country. In the case of the 95th index, a zone of negative anomalies centered on northwest Turkey covers most of central and eastern Europe as well as the eastern Mediterranean. Another zone of small positive anomalies covers the rest of Europe and Scandinavia (Figure 6A3). The analysis of the difference spatial distribution showed a pole of very strong positive anomalies located over the northwest of Turkey, covering central and eastern Mediterranean, the Balkan peninsula, and part of central Europe (Figure 6B3).
To the north of this positive anomaly pole, there is an extended area of negative anomalies over the entire western, central and northern parts of Europe. The extreme precipitation conditions linked with the Cse type can be partially associated with the perturbation current that moves from the southwest to the northeast or from west to east due to the higher atmospheric circulation, as well as with the perturbation current accompanied by front movement from Scandinavia to the Black Sea [39]. The humidification of the air masses from the Black Sea favors the cyclogenesis or the deepening of the cyclones, resulting in intense precipitation conditions, especially during the warm season when convective pluvio-generic mechanisms dominate [40,41].
In the case of Craiova station, the prevailing circulation type is Cwsw, with 86 and 17 days for the 95th and 99th indices, respectively. The analysis of the composites for the 95th index (Figure 6A4) shows an extended area of negative anomalies (between 30° N and 54° N of latitude and 0° E and 30° E of longitude) covering a large part of Europe and the Mediterranean, except for the Scandinavian Peninsula. This anomaly center is found over the Adriatic Sea. Conversely, positive anomalies are observed over eastern Mediterranean and the Iberian Peninsula. The difference in spatial pattern revealed a prolonged zone of positive values over the Balkan Peninsula, western Turkey, central Mediterranean, and southern Italy (Figure 6B4). To their west, negative anomalies overlap the area from western Mediterranean to the North Sea, as well as western and northern Europe. Thus, extreme precipitation at Craiova is the result of a perturbation related to fronts, where the main trajectory of the prevailing pressure system is from southwest to northeast, conducted by upper-level circulation.
Finally, at Rm. Vâlcea station, type Cwsw prevails during the days of the 95th index (107 days) and type C during the 99th index (21 days). The analysis of the 99th index (Figure 6A5) showed an area of negative anomalies covering the Balkan Peninsula, as well as the central and eastern Mediterranean and European parts. The center of these anomalies is located in the south of Romania. The difference composite map depicts a relatively limited area of positive anomalies, whose center is approximately at the same position as the negative anomaly ones. It is worth mentioning that a part of northern Romania is characterized by negative anomalies that also cover the largest part of eastern and northern Europe and most of the Mediterranean region (Figure 6B5). This finding, as in the case of Buzău station, shows that the anomaly area of the 99th index is not necessarily more intense than the 95th one. Thus, extreme rainfall in these two stations, when type C prevails, is probably not just a result of the intensity of the 500 hPa anomalies, but there seem to be other factors that contribute to the occurrence of these extreme events.

4. Discussion and Conclusions

The overarching goal of the present study is to identify and analyze the links between the atmospheric circulation conditions and precipitation (mean and extreme) in southern Romania. To fulfill this goal, we used an automatic objective classification scheme, which provides a daily calendar of twelve atmospheric circulation types (five anticyclonic and seven cyclonic), and we detected which of them prevail over the area of interest during the days of extreme precipitation events. The study is focused on five weather stations with available daily precipitation data for a sixty-year period (1961–2020).
Primer trend analysis showed that, in general, both mean and extreme precipitation and rain days do not present significant trends, in agreement with the results of other previous studies on precipitation variability in Romania and in the study area [13,42,43]. According to [41], the extreme precipitation indices for the Black Sea western coast do not show a clear pattern of significant trends. Nevertheless, at Constanța, between 1961–2008, a positive statistically significant trend in the annual amounts of precipitation cumulated in the very wet days (rainfall amounts exceeding the 95th percentile) was noted, and non-significant for those exceeding the 99th percentile (extremely wet days) [41]. An increasing statistically significant trend in the annual precipitation amounts exceeding the 95th and 99th percentile was also found at Craiova (1961–2013), while at Rm. Vâlcea and Buzău, decreasing non-significant trends were noticed for the 95th percentile and no trends for the 99th percentile [43]. However, it should be mentioned that neither the general increase of the annual precipitation amounts nor the systematic decrease (increase) of summer (autumn) precipitation had statistically significant shifts, except for Constanța, where a statistically significant positive trend in annual precipitation was found (at 0.05 level). Our findings are similar to the results of other studies on precipitation in Hungary [12,44]. As concerns the frequency and the intensity of extreme precipitation, non-significant changes were found, except Craiova, with a statistically increasing trend in rainfall amounts exceeding the 95th percentile. At Buzău and Rm. Vâlcea, decreasing significant trends were found in the mean number of rain days exceeding the 99th percentile.
Regarding the atmospheric circulation characteristics over Romania, it was found that annually, the anticyclonic and the cyclonic conditions have a similar frequency: 51.9% and 48.1%, respectively. However, the anticyclonic/cyclonic types have positive/negative trends that are almost significant everywhere, a finding that is consistent with other studies in central Europe [12,45,46]. Moreover, the percentage of annual precipitation is mainly attributed to cyclonic types (76.1%). This percentage is among the highest compared to other central European regions [12,47]. On a seasonal scale, winter registers the highest percentage of precipitation associated with cyclonic types (93%), and conversely, summer has the lowest percentage (57%). During summer, precipitation is highly linked with anticyclonic conditions. It is worth mentioning at this point that the maximum precipitation heights of the anticyclonic conditions during summer are attributed mainly to the instability of the atmosphere of weak upper-level anticyclonic conditions, resulting in convective precipitation. Additionally, these conditions may also be observed during weak surface anticyclonic circulation (anticyclonic slack pressure field) due to the prevalence of high temperatures (thermo-convection) [36]. This is a common characteristic in all the continental mid-latitude regions as in Hungary [12], while on the other hand, it is rarely observed in the Mediterranean areas.
Dobri et al. [36] showed that from a total of 312 extreme precipitation days in Romania, 42.6% are related to high atmospheric instability, about 40% are linked to Mediterranean depressions, and 17.1% are associated with Atlantic cyclonic activity. Thus, it seems that the Atlantic cyclones may play a secondary but not at all negligible role in extreme precipitation occurrence in southern Romania. Moreover, their influence is confined to the northern and northwestern regions of Romania [36].
The non-significant precipitation trends in most of the stations (annually, in winter and autumn) could be partially interpreted from the positive non–significant positive precipitation trends in the frequency of the rainiest cyclone types. On the other hand, the general decrease in rain days (except autumn) could be attributed to the significant decrease in the frequency of cyclonic circulation types. It is important to note that the occurrence of the wettest cyclonic types (C, Cwsw, and Cse) generally responsible for extreme rainfall episodes is decreasing, both annually and seasonally (except in autumn for C). The “statistical drivers” of the general lack of significant trends in extreme precipitation could be partially interpreted by: a) the negative frequency trends in the circulation types responsible for extreme rainfall (C, Cwsw, and Cse) and b) the positive trends in the anticyclonic type frequency, in particular the Ase, whose trend compensates, at least partially, the aforementioned negative trend. This anticyclonic type, which is very frequent and is accompanied by extreme precipitation amounts, has both a significant increase of its frequency as well as its precipitation mainly in summer, interpreting at least partially the non-significant trend for extreme precipitation of the expected wetter types C, Cwsw, and Cse. The only exceptions are the stations of Craiova, with a significant positive trend of the value of the 95th percentile, and Buzău and Rm. Vâlcea, with significant negative trends of the mean number of days of the 99th percentile index.
The circulation types with extreme precipitation are characterized by zonal or southwest circulation. These depressions are generated over the Mediterranean region, where especially during the summer period, in the upper atmosphere, cut–off low systems located over Romanian often appear [36]. They arrive over the Black Sea, where they retrospectively shift to the southeastern part of Romania [5,6]. Additionally, for the extreme rainfall at Constanța, most of the depressions originated in northern Europe following a northwest-to-southeast (Scandinavia–Black Sea) trajectory. According to [48] and [49], the Mediterranean depressions along the Vb trajectory (Mediterranean to central Europe) are responsible for more than 40% of central Europe’s 95th percentile rainfall and approximately 15% of the days of extreme precipitation (99th percentile). This could be explained by the deep depressions along the Vb trajectory during all seasons over central Europe, the fact that these depressions remain longer in this area due to the cyclonic path from their center to the surface moving towards the northeast and by the fact that their average precipitation intensity is much higher compared to the Atlantic depressions [47]. According to Nita et al. [37], there is an increase in the cyclonic activity over Romania during the period 1979–2010. We consider that this behavior of the Mediterranean depressions along the Vb trajectory could be attributed to many factors, including their prolonged stay over this area, their greater intensity, and finally, their much heavier accompanied rainfall in comparison to the equivalent Atlantic depressions. All these agree with the results of [47]. Moreover, the retrograde Mediterranean cyclones are one of the main drivers for the precipitation excess over the Sub Carpathians region and the southern part of the country [36].
The atmospheric circulation effect on extreme precipitation is probably related to the simultaneous occurrence of many factors, such as the frontal passage, the distance between the station and the center of the depression [50], the positive vorticity effect, and finally, the deepening degree of the pressure system. Also, there seems to be a strong connection between the positive tendency in vorticity and the decrease in the mean depth of SLP (Sea Level Pressure) cyclones over the area of interest [36]. Previous studies [11,12], fully validated the latter factor; however, the present analysis does not apply in all cases. As mentioned above, the negative anomaly field of the extreme precipitation (99th percentile) at Buzau and Rm.Vâlcea is weaker, even from the equivalent fields of the 95th percentile of the rest of the stations. In any case, the dynamic analysis of the circulation patterns responsible for extreme precipitation only partially explains this phenomenon [11,12]. Therefore, other physical factors and meteorological elements should also be analyzed to obtain a more complete physical interpretation of the present findings.
Cut-off low systems or situations seem to play a significant role in summertime atmospheric instability, resulting in extreme rainfall. Their presence in the upper atmosphere leads to energy exchange between the troposphere and stratosphere, making the interpretation of the adjustment phenomena more complex. This difficulty is due to the fact that these cut-off lows are demonstrated with a weak surface anticyclone with a slack pressure field over the country [51]. So, it should be noted that the occurrence of summer intense/extreme precipitation amounts over certain Romanian weather stations, with the prevalence of Ase type, is attributed mainly to the aforementioned atmospheric conditions (higher cut-off low and weak anticyclone with a slack pressure field in the surface).
As a future work, the authors aim to analyze further the relationships between the circulation types and precipitation over Romania, using data derived from a higher number of weather stations covering the whole of Romania to investigate whether the results of this work apply to all regions of Romania or there is a differentiation in the relationship between circulation types and precipitation in some areas within Romania.

Author Contributions

Conceptualization, K.T. and P.M.; methodology, P.M., K.T. and C.A.; software, P.M. and I.T.; validation, M.T., L.Z. and K.T.; formal analysis, K.T. and C.A.; investigation, P.M., M.T. and L.Z.; writing—original draft preparation, K.T., P.M. and M.T.; writing—review and editing, K.T., P.M. and D.M.C.; supervision, K.T. and P.M. All authors have read and agreed to the published version of the manuscript.

Funding

This research received no external funding.

Institutional Review Board Statement

Not applicable.

Informed Consent Statement

Not applicable.

Data Availability Statement

The authors do not have permission to share data.

Conflicts of Interest

The authors declare no conflict of interest.

References

  1. Bogdan, O.; Niculescu, E. Clima, in România. Spațiu, Societate; Mediu, Ed.; Academiei Române: București, Romania, 2005; pp. 84–106. [Google Scholar]
  2. Bogdan, O. ; Țîștea, Clima, in Geografia României I; Fizică, G., Ed.; Academiei Române (R.P.R): București, Romania, 1983; pp. 195–292. [Google Scholar]
  3. Ion-Bordei, E. Rolul Lantului Alpino-Carpatic in Evolutia Ciclonilor Mediteraneeni; Printhech, Ed.; Academiei Române (R.P.R): București, Romania, 2009; 138p. [Google Scholar]
  4. Zaharia, L.; Beltrando, G. Variabilité et tendances de la pluviométrie et des débits de crue dans la région de la Courbure de l’Arc carpatique (Roumanie). Geogr. Tech. Numéro Spécial 2009, 2009, 471–476. [Google Scholar]
  5. Diaconu, C.; Şerban, P. Sinteze şi Regionalizări Hidrologice; Editura Tehnică: Bucureşti, Romania, 1994; p. 387. [Google Scholar]
  6. Gogu, G.S. Influența Ciclonilor Mediteraneeni cu Traiectorie Transbalcanice Asupra Vremii ܈și Climei pe Teritoriul României, Universitatea din București; Facultatea de Geografie: Bucuresti, Romania, 2007. [Google Scholar]
  7. NMA (National Meteorological Administration). Clima României; Editura Academiei Române: București, Romania, 2008; 365p. [Google Scholar]
  8. Garaba, L.; Sfîcă, L. Climatic features of the romanian territory generated by the action of mediterranean cyclones. Lucr. Semin. Geogr. Dimitrie Cantemir 2015, 39, 11–24. [Google Scholar]
  9. Anagnostopoulou, C.; Tolika, K.; Maheras, P. Classification of circulation types: A new flexible automated approach applicable to NCEP and GCM datasets. Theor. Appl. Climatol. 2009, 96, 3–15. [Google Scholar] [CrossRef]
  10. Traboulsi, M.; Tolika, K.; Anagnostopoulou, C.; Maheras, P. Les précipitations à Beyrouth et leurs relations avec les types de circulation atmosphérique. Actes du XXXIIème colloque de l’Association Internationale de Climatologie. Théssaloniki 2019, 29, 523–528. [Google Scholar]
  11. Maheras, P.; Tolika, K.; Anagnostopouloy, C. Relations entre des précipitations moyennes et extrêmes et les types de circulation atmosphérique en Belgique. (Relationship between mean and extreme precipitation on one hand and the types of atmospheric circulation on the other in Belgium). Bull. De La Société Géographique De Liège 2008, 51, 115–125. (In French) [Google Scholar]
  12. Maheras, P.; Tolika, K.; Anagnostopoulou Ch Makra, M.; Klicasz, S.; Károssy, C. Relationship between mean and extreme precipitation and circulation types over Hungary. Int. J. Climatol. 2018, 38, 4518–4532. [Google Scholar] [CrossRef]
  13. Mateescu, E. ADER 1.1.1. Sistem de Indicatori Geo-Referenţiali la Diferite Scări Spaţiale şi Temporale Pentru Evaluarea Vulnerabilităţii şi Măsurile de Adaptare ale Agroecosistemelor faţă de Schimbările Globale, 45 Pages. 2014. Available online: https://www.madr.ro/attachments/article/139/ANM-ADER-111.pdf (accessed on 10 December 2022).
  14. Bîrsan, M.V.; Zaharia, L.; Chendeş, V.; Brănescu, E. Seasonal trends in Romanian streamflow. Hydrol. Process. 2014, 28, 4496–4505. [Google Scholar] [CrossRef]
  15. Dumitrescu, A.; Bojariu, R.; Bîrsan, M.V.; Marin, L.; Manea, A. Recent climatic changes in Romania from observational data (1961–2013). Theor. Appl. Clim. 2014, 122, 111–119. [Google Scholar] [CrossRef]
  16. Bojariu, R.; Bîrsan, M.V.; Cică, R.; Velea, L.; Burcea, S.; Dumitrescu, A.; Dascălu, S.I.; Gothard, M.; Dobrinescu, A.; Cărbunaru, F. Schimbările Climatice—De la Bazele Fizice la Riscuri și Adaptare; Editura Printech: București, Romania, 2015; 200p. [Google Scholar]
  17. Constantin, D.M.; Onțel, I.; Tișcovschi, A.A.; Irimescu, A.; Grigore, E.; Ilea, R.G.; Dîrloman, G. Observed Changes in the temperature and precipitation regime along the Lower Danube River. In The Lower Danube River; Negm, A., Zaharia, L., Ioana-Toroimac, G., Eds.; Earth and Environmental Sciences Library; Springer: Cham, Switzerland, 2022; pp. 273–297. [Google Scholar] [CrossRef]
  18. Busuioc, A.; Baciu, M.; Breza, T.; Dumitrescu, A.; Stoica, C.; Baghina, N. Changes in Intensity of High Temporal Resolution Precipitation Extremes in Romania: Implications for Clausius-Clapeyron Scaling. Clim. Res. 2017, 72, 239–249. [Google Scholar] [CrossRef]
  19. Rimbu, N.; Stefan, S.; Busuioc, A.; Georgescu, F. Links between Blocking Circulation and Precipitation Extremes over Romania in Summer. Int. J. Climatol. 2015, 36, 369–376. [Google Scholar] [CrossRef]
  20. Busuioc, A.; Dobrinescu, A.; Bîrsan, M.V.; Dumitrescu, A.; Orzan, A. Spatial and temporal variability of climate extremes in Romania and associated large-scale mechanisms. Int. J. Climatol. 2015, 35, 1278–1300. [Google Scholar] [CrossRef]
  21. Bojariu, R.; Bîrsan, M.V.; Cică, R.; Velea, L.; Burcea, S.; Dumitrescu, A.; Dascălu, S.I.; Gothard, M.; Dobrinescu, A.; Cărbunaru, F.; et al. Schimbările Climatice; Editura Printech, Bucures, ti; European Commission: Brussels, Belgium; pp. 68–71.
  22. Croitoru, A.-E.; Piticar, A.; Burada, D.C. Changes in Precipitation Extremes in Romania. Quat. Int. 2016, 415, 325–335. [Google Scholar] [CrossRef]
  23. Stefanescu, V.; Stefan, S.; Georgescu, F. Spatial Distribution of Heavy Precipitation Events in Romania between 1980 and 2009. Meteorol. Appl. 2013, 21, 684–694. [Google Scholar] [CrossRef]
  24. Zaharia, L.; Ioana-Toroimac, G.; Perju, E.R. Hydrological Impacts of Climate Changes in Romania. In Water Resources Management in Romania; Negm, A., Romanescu, G., Zeleňáková, M., Eds.; Springer Water: Cham, Switzerland, 2020; pp. 309–351. [Google Scholar] [CrossRef]
  25. Prăvălie, R.; Piticar, A.; Roșc, B.; Sfîcă, L.; Bandoc, G.; Tiscovschi, A.; Patriche, C. Spatio-temporal changes of the climatic water balance in Romania as a response to precipitation and reference evapotranspiration trends during 1961–2013. Catena 2019, 172, 295–312. [Google Scholar] [CrossRef]
  26. Chelu, A.; Zaharia, L.; Toroimac, G. Temporal and Spatial Variability of Drought Based on SPEI Analysis in Southeastern Romania. In Proceedings of the Air and Water—Components of the Environment Conference Proceedings, Cluj-Napoca, Romania, 28–30 May 2020; pp. 71–80.
  27. Chelu, A.; Zaharia, L.; Dubreuil, V. Estimation of climatic and anthropogenic contributions to streamflow change in southern Romania. Hydrol. Sci. J. 2022, 67, 1598–1608. [Google Scholar] [CrossRef]
  28. ECA&D. European Climate Assessment & Dataset. Available online: https://www.ecad.eu/ (accessed on 10 January 2023).
  29. Kalnay, E.; Kanamitsu, M.; Kistle, R.; Collins, W.; Deaven, D.; Gandin, L.; Iredell, M.; Saha, S.; White, G.; Woollen, J. The NCEP/NCAR 40-year reanalysis project. Bull. Am. Meteorol. Soc. 1996, 77, 437–471. [Google Scholar] [CrossRef]
  30. Tolika, K.; Anagnostopoulou, C.; Maheras, P.; Kutiel, H. Extreme precipitation related to circulation types for four case studies over the eastern Mediterranean. Adv. Geosci. 2007, 12, 87–93. [Google Scholar] [CrossRef]
  31. Diaconu, O.; Jan, M.; Caian, M. Structuri Disjuncte Pentru Sezonul de Primăvară Obținute cu Ajutorul Metodei Cluster pe Sectorul Atlantico-European; Hidrotehnica, Gospodarirea Apelor; Meteorologia: Bucharest, Romania, 1990. [Google Scholar]
  32. Busuioc, A.; von Storch, H. Changes in the winter precipitation in Romania and its relation to the large-scale circulation. Tellus 1996, 48A, 538–555. [Google Scholar] [CrossRef]
  33. Tomozeiu, R.; Stefan, S.; Busuioc, A. Winter precipitation variability and large-scale circulation patterns in Romania. Theor. Appl. Climatol. 2005, 81, 193–201. [Google Scholar] [CrossRef]
  34. Bîrsan, A.; Dumitrescu, A. Snow variability in Romania in connection to large-scale atmospheric circulation. Int. J. Climatol. 2014, 34, 134–144. [Google Scholar] [CrossRef]
  35. Apostol, L. The Mediterranean cyclones–the role in ensuring water resources and their potential of climatic risk, in the east of Romania. Present Environ. Sustain. Dev. 2008, 2, 143–163. [Google Scholar]
  36. Dobri, R.-V.; Sfica, L.; Ichimi, P.; Harpa, G.-V. The distribution of the monthly 24-hour maximum amount of precipitation in Romania according to their synoptic cause. Geogr. Tech. 2017, 12, 62–72. [Google Scholar] [CrossRef]
  37. Nita, I.A.; Sfica, L.; Apostol, L.; Radu, C.; Birsan, M.-V.; Svep, R.; Kereresztes, A. Changes in cyclone intensity οver Romania according to 12 tracking methods. Rom. Rep. Phys. 2020, 72, 2–12. [Google Scholar]
  38. Nita, I.A.; Apostol, L.; Patriche, C.-V.; Sfîc, S.; Bojariu, R.; Bîrsa, M.-V. Frequency of atmospheric circulation types over Romania according to Jenkinson-Collison method based on long-term reanalysis datasets. Rom. J. Phys. 2022, 67, 812. [Google Scholar]
  39. Maheras, P. Climatologie de la Mer Egée et de Ses Marges Continentals; Université de Dijon: Dijon, French, 1979; 784p, ISBN 978-27-295-0029-0. (In French) [Google Scholar]
  40. Chiotoroiu, B.C. Les Tempêtes dans le Basin Occidental de la Mer Noire; Presses Universitaires du Septentrion: Villeneuve d’Ascq, France, 1999. [Google Scholar]
  41. Croitoru, A.E.; Chiotoroiu, B.C.; Ivanova Todorova, V.; Torica, V. Changes in precipitation extremes on the Black Sea Western Coast. Glob. Planet. Change 2013, 102, 10–19. [Google Scholar] [CrossRef]
  42. Croitoru, A.E.; Chiotoroiu, B.; Iancu, I. Precipitation analysis using Mann-Kendal test and WASP cumulated curve in Southeastern Romania. Stud. Univ. Babeş Bolyai—Geogr. 2011, 1, 49–58. [Google Scholar]
  43. Croitoru, A.E.; Piticar, A.; Imbroane, A.M.; Burada, D.C. Spatiotemporal distribution of aridity indices based on temperature and precipitation in the extra-Carpathian regions of Romania. Theor. Appl. Climatol. 2013, 112, 597–607. [Google Scholar] [CrossRef]
  44. Bartholy, J.; Pongrácz, R. Analysis of precipitation conditions for the Carpathian Basin based on extreme indices in the 20th century and climate simulations for 2050 and 2100. Phys. Chem. Earth 2010, 35, 43–51. [Google Scholar] [CrossRef]
  45. Domonkos, P. Recent precipitation trends in Hungary in the context of larger scale climatic changes. Nat. Hazards 2003, 29, 255–271. [Google Scholar] [CrossRef]
  46. Kyselý, J.; Huth, R. Changes in atmospheric circulation over Europe detected by objective and subjective methods. Theor. Appl. Climatol. 2006, 85, 19–36. [Google Scholar] [CrossRef]
  47. Hofstätter, M.; Lexer, A.; Homann, M.; Blöschl, G. Large-scale heavy precipitation over central Europe and the role of the atmospheric cyclone track types. Int. J. Climatol. 2018, 38, e497–e517. [Google Scholar] [CrossRef]
  48. Nissen, K.M.; Ulbrich, U.; Leckebusch, G.C. Vb cyclones and associated rainfall extremes over central Europe under present day and climate change conditions. Meteorol. Z. 2014, 22, 649–660. [Google Scholar] [CrossRef]
  49. Messmer, M.; Gómez-Navarro, J.J.; Raible, C.C. Climatology of Vb cyclones, physical mechanisms and their impact on extreme precipitation over central Europe. Earth Syst. Dyn. 2015, 6, 541–553. [Google Scholar] [CrossRef]
  50. Nowosad, J.; Stach, A. Relation between extensive extreme precipitation in Poland and atmospheric circulation. Quaest. Geogr. 2015, 33, 115–129. [Google Scholar] [CrossRef]
  51. Nieto, R.; Gimeno, L.; de La Torre, L.; Ribera, P.; Gallego, D.; García-Herrera, R.; García, J.A.; Nuñez, M.; Redaño, A.; Lorent, J. Climatological features of cutoff low systems in the Northern Hemisphere. J. Clim. 2005, 18, 3085–3103. [Google Scholar] [CrossRef]
Figure 1. Romania’s physical map and the location of the five selected stations (marked with red rectangles). In Bucharest (București in Romanian), the analyzed station is named București–Băneasa.
Atmosphere 14 01345 g001
Figure 2. Mean seasonal and annual precipitation heights (left column diagrams) and mean seasonal and annual number of rain days (right column diagrams) for the five stations under study. The red shadowed bars represent positive trends, and the blue ones represent negative trends. The black bars represent the values that their trends are statistically significant at a 0.05 confidence level.
Atmosphere 14 01345 g002
Figure 3. The location of the anticyclonic (a) and cyclonic (b) circulation type centers. The first letter of the acronyms indicates the anticyclonic (A) and cyclonic (C) types, and the other letters indicate the position of the type compared to the center of the classification (e.g., Cse is a Cyclonic type located at the southeast of the classification center; C is a Cyclonic type located exactly over the center of the classification).
Atmosphere 14 01345 g003
Figure 4. Mean 500 hPa anomaly maps of the circulation types in winter. The solid lines are the positive anomalies (anticyclonic), and the dashed lines are the negative ones (cyclonic). The bold solid line is the zero anomaly.
Atmosphere 14 01345 g004
Figure 5. Percentage (%) of precipitation attributed to each circulation type, as well as to all anticyclonic and cyclonic ones for all analyzed stations (1961–2020). The blue bars represent the percentage for each circulation type individually. The orange (green) bar is for all the anticyclonic (cyclonic) types.
Atmosphere 14 01345 g005
Figure 6. Anomaly (A1A5) and difference maps (B1B5) for the selected extreme precipitation quantiles of the five analyzed stations.
Atmosphere 14 01345 g006
Table 1. Extreme precipitation values for the five analyzed stations (1961–2020). The trends that are statistically significant at a 0.05 level are marked with an asterisk.
StationPercentileValue of Xth perc. (mm)Mean No. of DaysAbs. Daily Max (mm)Ratio (Abs. Max)/Percentile
București-Băneasa95th Percentile (Trend)21.6 (+)5.7 (-)126.45.9
99th Percentile (Trend)39.0 (-)1.1 (-)3.2
Buzău95th Percentile (Trend)20.0 (-)5.3 (-)90.54.5
99th Percentile (Trend)38.6 (-)1.1 (- *)2.3
Constanța95th Percentile (Trend)17.6 (+)4.8 (+)201.011.4
99th Percentile (Trend)36.6 (+)1.0 (-)5.5
Craiova95th Percentile (Trend)20.0 (+ *)5.9 (+)84.84.2
99th Percentile (Trend)37.8 (+)1. 1(+)2.2
Rm. Vâlcea95th Percentile (Trend)22.2 (+)6.3 (-)97.84.4
99th Percentile (Trend)38.2 (+)1.3 (- *)2.6
Table 2. Frequencies and trends of the twelve circulation types from the automatic classification scheme (1961–2020). The trends (shown in brackets) that are statistically significant at a 0.05 level are marked with an asterisk.
PeriodAnwAneAAswAseCCnnwCwnwCwswCsswCseCne
Annual8.1(+)9.4(+)7.3(+ *)14.1(+ *)13.0(+ *)7.4(-)2.5(- *)4.0(- *)9.5(- *)3.6(- *)10.5(- *)10.6(- *)
Winter6.3(-)6.3(-)3.4(+)10.0(+ *)12.7(+ *)5.6(- *)3.6(-)3.5(- *)11.3(-)5.5(-)16.8(- *)14.9(- *)
Spring9.8(+)6.9(-)3.2(-)11.5(+)10.8(+ *)6.7(-)3.3(- *)5.0(- *)10.3(- *)4.4(- *)13.7(- *)14.4(- *)
Summer10.3(-)12.6(+ *)13.5(+ *)17.5(-)15.8(+ *)8.3(- *)0.8(- *)3.5(- *)6.0(- *)1.6(- *)5.1(- *)4.9(- *)
Autumn6.1(- *)11.7(-)9.0(+)17.3(+)12.8(+ *)9.0(+)2.1(- *)4.0(-)10.3(- *)3.0(- *)6.4(- *)8.2(- *)
Table 3. Trends of the precipitation totals (positive (+) and negative (-) associated with anticyclonic and cyclonic conditions for all analyzed stations (1961–2020). The trends that are statistically significant at a 0.05 level are marked with an asterisk.
StationCirculation ConditionParameterAnnualWinterSpringSummerAutumn
București-BăneasaAnticycl.Prec.+ *++ *+ *+
Rain Days.+ *+++ *+
Cyclon.Prec.-+--+
Rain Days.- *-- *- *-
BuzăuAnticycl.Prec.+ *++ *+ *+ *
Rain Days.+ *+++ *+ *
Cyclon.Prec.---- *+ *
Rain Days.- *- *- *- *-
ConstanțaAnticycl.Prec.+ *++ *++
Rain Days.+ *++ *++
Cyclon.Prec.++--+
Rain Days.- *-- *- *-
CraiovaAnticycl.Prec.+ *-+ *++
Rain Days.+ *++ *++ *
Cyclon.Prec.++0-+
Rain Days.- *-- *- *-
Rm.
Vâlcea
Anticycl.Prec.+ *++ *++
Rain Days.+ *++ *+ *+ *
Cyclon.Prec.++--+
Rain Days.- *-- *- *-
Table 4. Precipitation trends per atmospheric circulation type for all analyzed stations (1961–2020). The trends that are statistically significant at a 0.05 level are marked with an asterisk.
PeriodAnwAneAAswAseCCnnwCwnwCwswCsswCseCneAnti.Cycl.
Annual+ *+++ *+ *++*+-- *-+ *-
Winter-+- *+-++-+-- *+++
Spring+ *+-++ *+-- *++--+ *-
Summer+++++ *--*- *---- *+ **
Autumn-++++ *+-*-+---++
Table 5. Extreme cases (95th percentile (white lines) and 99th percentile (grey lines)) and precipitation amount per atmospheric circulation type for the selected station.
StationPercentileCirculation TypeNumber of DaysPercentage (%) of Days to the Total Extreme DaysPercentage (%) of Precipitation to the Total Annual Amount
București–Băneasa95thC7923.324.4
Cwsw6719.820.0
Cse4914.512.9
Cssw1513.313.1
99thC1928.830.9
Cwsw1421.220.8
Cssw812.111.9
Ase69.18.5
Buzău95thC8326.226.4
Cwsw6219.619.1
Cse3511.011.8
Cssw299.110.0
99thC1930.228.7
Cssw812.713.9
Cse812.712.6
Cwsw711.112.3
Constanța95thC6723.226.2
Cse6321.819.0
Cwsw4515.612.7
Cssw279.38.6
99thC2136.836.8
Cse712.310.4
Anw58.88.9
Ase58.88.0
Craiova95thCwsw8624.223.2
C6518.319.2
Cssw5014.013.9
Ase4512.613.8
99thCwsw1727.023.5
C1320.621.3
Ase1015.918.3
Cssw711.111.2
Rm. Vâlcea95thCwsw10728.527.6
C7620.222.1
Ase4512.011.7
Cssw379.810.0
99thC2128.028.6
Cwsw2026.725.7
Ase810.710.7
Cssw79.39.6
Disclaimer/Publisher’s Note: The statements, opinions and data contained in all publications are solely those of the individual author(s) and contributor(s) and not of MDPI and/or the editor(s). MDPI and/or the editor(s) disclaim responsibility for any injury to people or property resulting from any ideas, methods, instructions or products referred to in the content.

