Article

Assessments of Use of Blended Radar–Numerical Weather Prediction Product in Short-Range Warning of Intense Rainstorms in Localized Systems (SWIRLS) for Quantitative Precipitation Forecast of Tropical Cyclone Landfall on Vietnam’s Coast

1
Vietnam National Center for Hydro-Meteorological Forecasting, 8 Phao Dai Lang Str., Hanoi 100000, Vietnam
2
Institute of Engineering Innovation, The University of Tokyo, Tokyo 113-8656, Japan
3
Institute of Meteorology and Climate Research, Karlsruhe Institute of Technology, 82467 Garmisch-Partenkirchen, Germany
4
Norwegian Meteorological Institute, 5007 Bergen, Norway
*
Author to whom correspondence should be addressed.
Atmosphere 2023, 14(8), 1201; https://doi.org/10.3390/atmos14081201
Submission received: 15 June 2023 / Revised: 20 July 2023 / Accepted: 23 July 2023 / Published: 26 July 2023
(This article belongs to the Special Issue Precipitation Observations and Prediction)

Abstract

:
This research presents a blended system implemented by the Vietnam National Center for Hydro-Meteorological Forecasting to enhance the nowcasting and forecasting services of quantitative precipitation forecasts (QPFs) of tropical cyclone (TC) landfalls on Vietnam’s coast. Firstly, the extrapolations of rain/convective systems from multiple radars in Vietnam in ranges up to 6 h were carried out using Short-Range Warning of Intense Rainstorms in Localized Systems (SWIRLS) developed by the Hong Kong Observatory. Secondly, the forecast from the numerical weather prediction (NWP) system, based on the WRF-ARW model running at 3 km horizontal resolution, was blended with radar-based quantitative precipitation estimates and nowcasts of SWIRLS. The analysis showed that the application of the nowcast system to TC-related cloud forms is complicated, which is related to the TC’s evolution and the different types and multiple layers of storm clouds that can affect the accuracy of the derived motion fields in nowcast systems. With hourly accumulated rainfall observation, skill score validation conducted for several TCs that landed in the center of Vietnam demonstrated that the blending of nowcasting and NWP improve the quality of the QPFs of TCs in forecast ranges up to 3 h compared to the pure NWP forecasts.

1. Introduction

Vietnam is located in Southeast Asia, with a high level of exposure to extreme weather events; this country is hit by an average of 10–12 tropical cyclones (TCs) every year [1,2,3,4,5,6]. Some of the main consequences of TCs in Vietnam are heavy rainfall, strong winds, and storm surges, specifically when TCs make landfall [4,5]. According to a recent survey of loss due to natural disasters, 30–35% of human loss and 50–55% of disaster-damage cost are caused by storms (including flood by storms) [7]. TCs that are active near the coast or landfall will cause torrential precipitation events in association with narrow fields and steep topography, as in Central Vietnam, and this is the primary trigger mechanism for landslide, fast flood, and urban inundation [8,9]. Therefore, it is recognized that TC-induced rainfall forecasts and quantitative TC-induced rainfall forecasts have been considered to be one of the key issues in terms of providing early flood and landslide warnings, preventing disasters, and mitigating flood damage and operating warning systems for TCs. Quantitative TC-induced rainfall forecasts and their accuracy are the most important input data for hydrological predictions.
TC-induced rainfall is associated with convective cloud spiral bands that develop in eye walls and spiral cloud bands that extend outward from the center of the TC. Rainstorm bands can cause prolonged rain when developing continuously and cause moderate-to-heavy rain, especially in areas where the TC makes landfall 12 to 36 h in advance. Consequently, enhancing the nowcasting of quantitative TC-induced rainfall or rainbands when a storm starts to hit the land has a significant role in triggering other early warning/forecasting systems [10,11,12].
Quantitative precipitation forecasts (QPFs), in general, and quantitative TC-induced rainfall forecasts, in particular, are mainly generated by numerical weather prediction (NWP) models. There are two typical types of NWPs: global-scale and regional-scale models. Compared to global-scale models, the regional-scale models or other names are often referred to as limited-area models (LAMs) or high-resolution NWP systems that can provide a better representation of sub-grid processes and the initial conditions via advanced data assimilation technologies [13,14]. With high-spatiotemporal-resolution observation networks such as automatic weather stations (AWSs), radar and lidar data can be rapidly assimilated into high-resolution NWP systems, whereas they cannot be assimilated into global NWP systems [15]. However, the computation costs of a data assimilation system are usually far more expensive than those of a pure model integration, especially for rapid update cycle (RUC) systems with a 1–3 h assimilation cycle. Moreover, the data organization, observation data collection, and data processing in these systems can become very complex. Another issue that arises for the TC prediction problem is a complex spin-up process in the early model initialization times. The spin-up time of the model is also connected to the capacity to reproduce the storm vortex in the model (location, intensity, and moisture/cloud/rain structure of the initial status of TCs) [16,17,18].
To reduce the errors of QPFs from NWPs, especially in short-range forecasts, the use of nowcast products has been proposed [19]. Prior to 2015, there were two typical approaches of using radar data in existing nowcasting methods: extrapolating for very short range forecasts based only on weather radar data (radar-based nowcasting), and blending with forecasting products from NWP (radar–NWP nowcasting). Radar-based nowcasting is carried out through object tracking and extrapolating methodologies in image-processing fields. General algorithms use a time series of radar images to calculate the motion fields. Tracking radar echoes by correlation (TREC) was one of the very first radar-based nowcasting methods [20]. TREC computes the correlation coefficient (CC) matrix between sequential images of radar data based on the maximum CC values to retrieve the motion vectors. In fact, TREC is purely an image-processing methodology and almost neglects the complex motions of the atmosphere, for example, cloud decay or the layer structure of the cloud system. Many improvements for TREC have been proposed, such as continuity of TREC vectors (COTREC) [21], differential image-based TREC (DITREC) [22], and multiscale TREC (MTREC) [23,24].
Conversely, radar–NWP nowcasting does not face the problem of a very short useful lead time, due to the use of physical-constraint rules to forecast a future status [25]. Consequently, its predictions are expected to have robust reliability. Taking advantage of extrapolation techniques and NWP, this approach is now becoming more and more widely used; examples include the Auto-Nowcaster [26], Nowcasting and Initialization of Modelling Using Regional Observation Data System [27], Short-Range Warning of Intense Rainstorms in Localized Systems (SWIRLS) [28], and the Japan Meteorological Agency (JMA) very-short-range forecast (VSRF) of precipitation system [29]. In fact, the second approach, which involves blending the forecasts from high-resolution NWP models with rainfall nowcasting (up to 6 h forecast ranges) based on dense AWS, radar, and satellite data, is the most feasible method to fill the gap between NWP and quantitative precipitation estimation (QPE) [29,30,31].
With the strong application development of machine learning (ML)/deep learning (DL), the weather forecasting problem, in particular, and for rainfall forecast has been studied and has initial positive results at wide forecasting ranges. For example, for short-to-medium range, Ridwan et al. (2020) used ML and station data to provide precipitation prediction for a 10-day forecast range [32]; and for a monthly forecast range, Sedigheh et. al. (2022) showed that multiple/ensemble models of DL can be used as a robust prediction tool [33], and Salaeh et. al. (2022) used the Long-Short-Term Memory technique of ML [34] to provide monthly rainfall forecasting.
For the nowcasting problem, around 2015, ML approaches for nowcasting started to become more popular [35]. Some studies showed that they were superior to extrapolation-based methods [36,37]. The main difference between deep-learning approaches and other methods is the reliance on data fed to the learning network. The launch of convolutional neural networks enabled researchers to better extract features from huge amounts of data [38]. Kim et al. (2021) proposed a 3D convolutional neural network (CNN) model to provide a precipitation nowcast using 3D radar data, while TREC-type methods usually only use radar data at a specific level [38]. Liu et al. (2020) used the self-attentive mechanism with a Convolutional Long-Short-Term Memory model to forecast rainfall for a 3 h forecast range, using radar data, and showed that this system can provide efficiently nowcasting guidance for precipitation for urban regions [39]. In addition, Zhang et al. (2019) introduced a multi-channel 3D-cube successive convolution network named 3D-SCN to nowcast storm initiation, growth, and advection from 3D radar data [40]. Recently, research has confirmed the capability of CNNs to carry out radar-based precipitation nowcasting [41,42]. As a consequence, in parallel with the improvement from radar-based to machine-learning/deep-learning-based systems in nowcast problems, blended NWP-based nowcasting systems can also be improved in terms of quality.
In Vietnam, the National Center for Hydro-Meteorological Forecasting (NCHMF) has implemented a high-resolution NWP system to produce QPFs with a lead time of up to 3 days and an update cycle every 6 h [43]. Establishing a rapid update cycle system is still a challenging task for regional centers such as the NCHMF; consequently, blending QPF products from high-resolution systems with rainfall nowcasting based on radar data is the most feasible approach to improve the reliability of quantitative TC-induced rainfall forecasting in very short term forecasts. In this research, via the World Meteorological Organization (WMO) Severe Weather Forecasting Programme (SWFP) for Southeast Asia (SWFP-SeA), we applied the nowcast system developed by the Hong Kong Observatory (HKO). Under the SWFP-SeA, HKO experts utilized the SWIRLS nowcasting system by using Vietnam’s data, including rain gauge stations, multiple radars, and NWPs.
This research focused on TC-induced heavy rainfall in the central region of Vietnam in recent years, validating the capabilities of blended radar–NWP forecasts in SWIRLS to improve QPFs of TCs.
The structure of the paper is as follows: Section 2 describes, in detail, the numerical model system and the nowcasting system adopted in this paper, and Section 3 explains the observational data, evaluation methods, and experimental design. Section 4 provides the validation results for the nowcasts, NWPs, and blended forecasts in all experiments. Section 5 presents the main conclusions of this research.

2. The Numerical Weather Prediction System at NCHMF and Short-Range Warning of Intense Rainstorms in Localized Systems

2.1. The Numerical Weather Prediction System at NCHMF

At the NCHMF, the regional NWP system is based on the Weather Research and Forecasting (WRF) model using Advanced Research dynamical cores (ARW) version 3.9.1.1. The WRF-ARW model has been developing by the National Center for Atmospheric Research (NCAR) and the National Oceanic and Atmospheric Administration (NOAA) of the United States. A wide research community has contributed to the WRF-ARW, integrating various recent advancements in NWPs, such as physical parameterization schemes and data assimilation [44].
The 3D initial and lateral boundary conditions are provided by the European Centre for Medium-Range Weather Forecasts (ECMWF) Integrated Forecasting System (IFS) with 3 h intervals up to 72 h, a horizontal resolution of 9 km, and up to 1 hPa level, and the IFS data are available for 00UTC and 12UTC. More information about the IFS can be found at https://www.ecmwf.int/en/forecasts/documentation-and-support/changes-ecmwf-model (accessed on 15 June 2023).
The current horizontal resolution run in the WRF-ARW at the NCHMF is 3 km for the domain covering Vietnamese lands and the South China Sea or East Sea of Vietnam (4° N–27° N; 97° E–127° E), and the number of vertical levels is 41 (up to 5 hPa). To enhance the initial condition, the WRF-ARW’s data assimilation system (WRFDA) [44] was used with both the Global Telecommunications System (GTS) data (via the National Centers for Environmental Prediction FTP service in PREBUFR format (link for data: ftp://ftp.ncep.noaa.gov/pub/data/nccf/com/obsproc/prod, accessed on 15 June 2023) and additional surface observations of Vietnam. In the variational data assimilation method, there are two important parts of statistical information needed for optimizing the initial fields: the observation error information and the error of the model’s forecast for a given computing domain, which is termed as background errors. In this research, the background errors were generated using the gen_be package [45] of WRFDA, using the NMC method based on 12 h and 24 h forecast ranges of the WRF-ARW for the domain above Vietnam over 2 weeks [46]. The WRF-ARW was cycled every 6 h, and the initial conditions for the next assimilated runs were taken from the latest run (6 h forecast).
For the post-processing output of the WRF-ARW to the nowcast system, we used the already available theNCAR Command Language (NCL) procedure to calculate the equivalent reflectivity factor (in decibels—dBZ) at each WRF-ARW model grid point based on MM5′s Reisner-2 bulk microphysical scheme [47], using 3D model fields (temperature, pressure, water-vapor-mixing ratio, rain-mixing ratio, snow-mixing ratio, and graupel-mixing ratio).

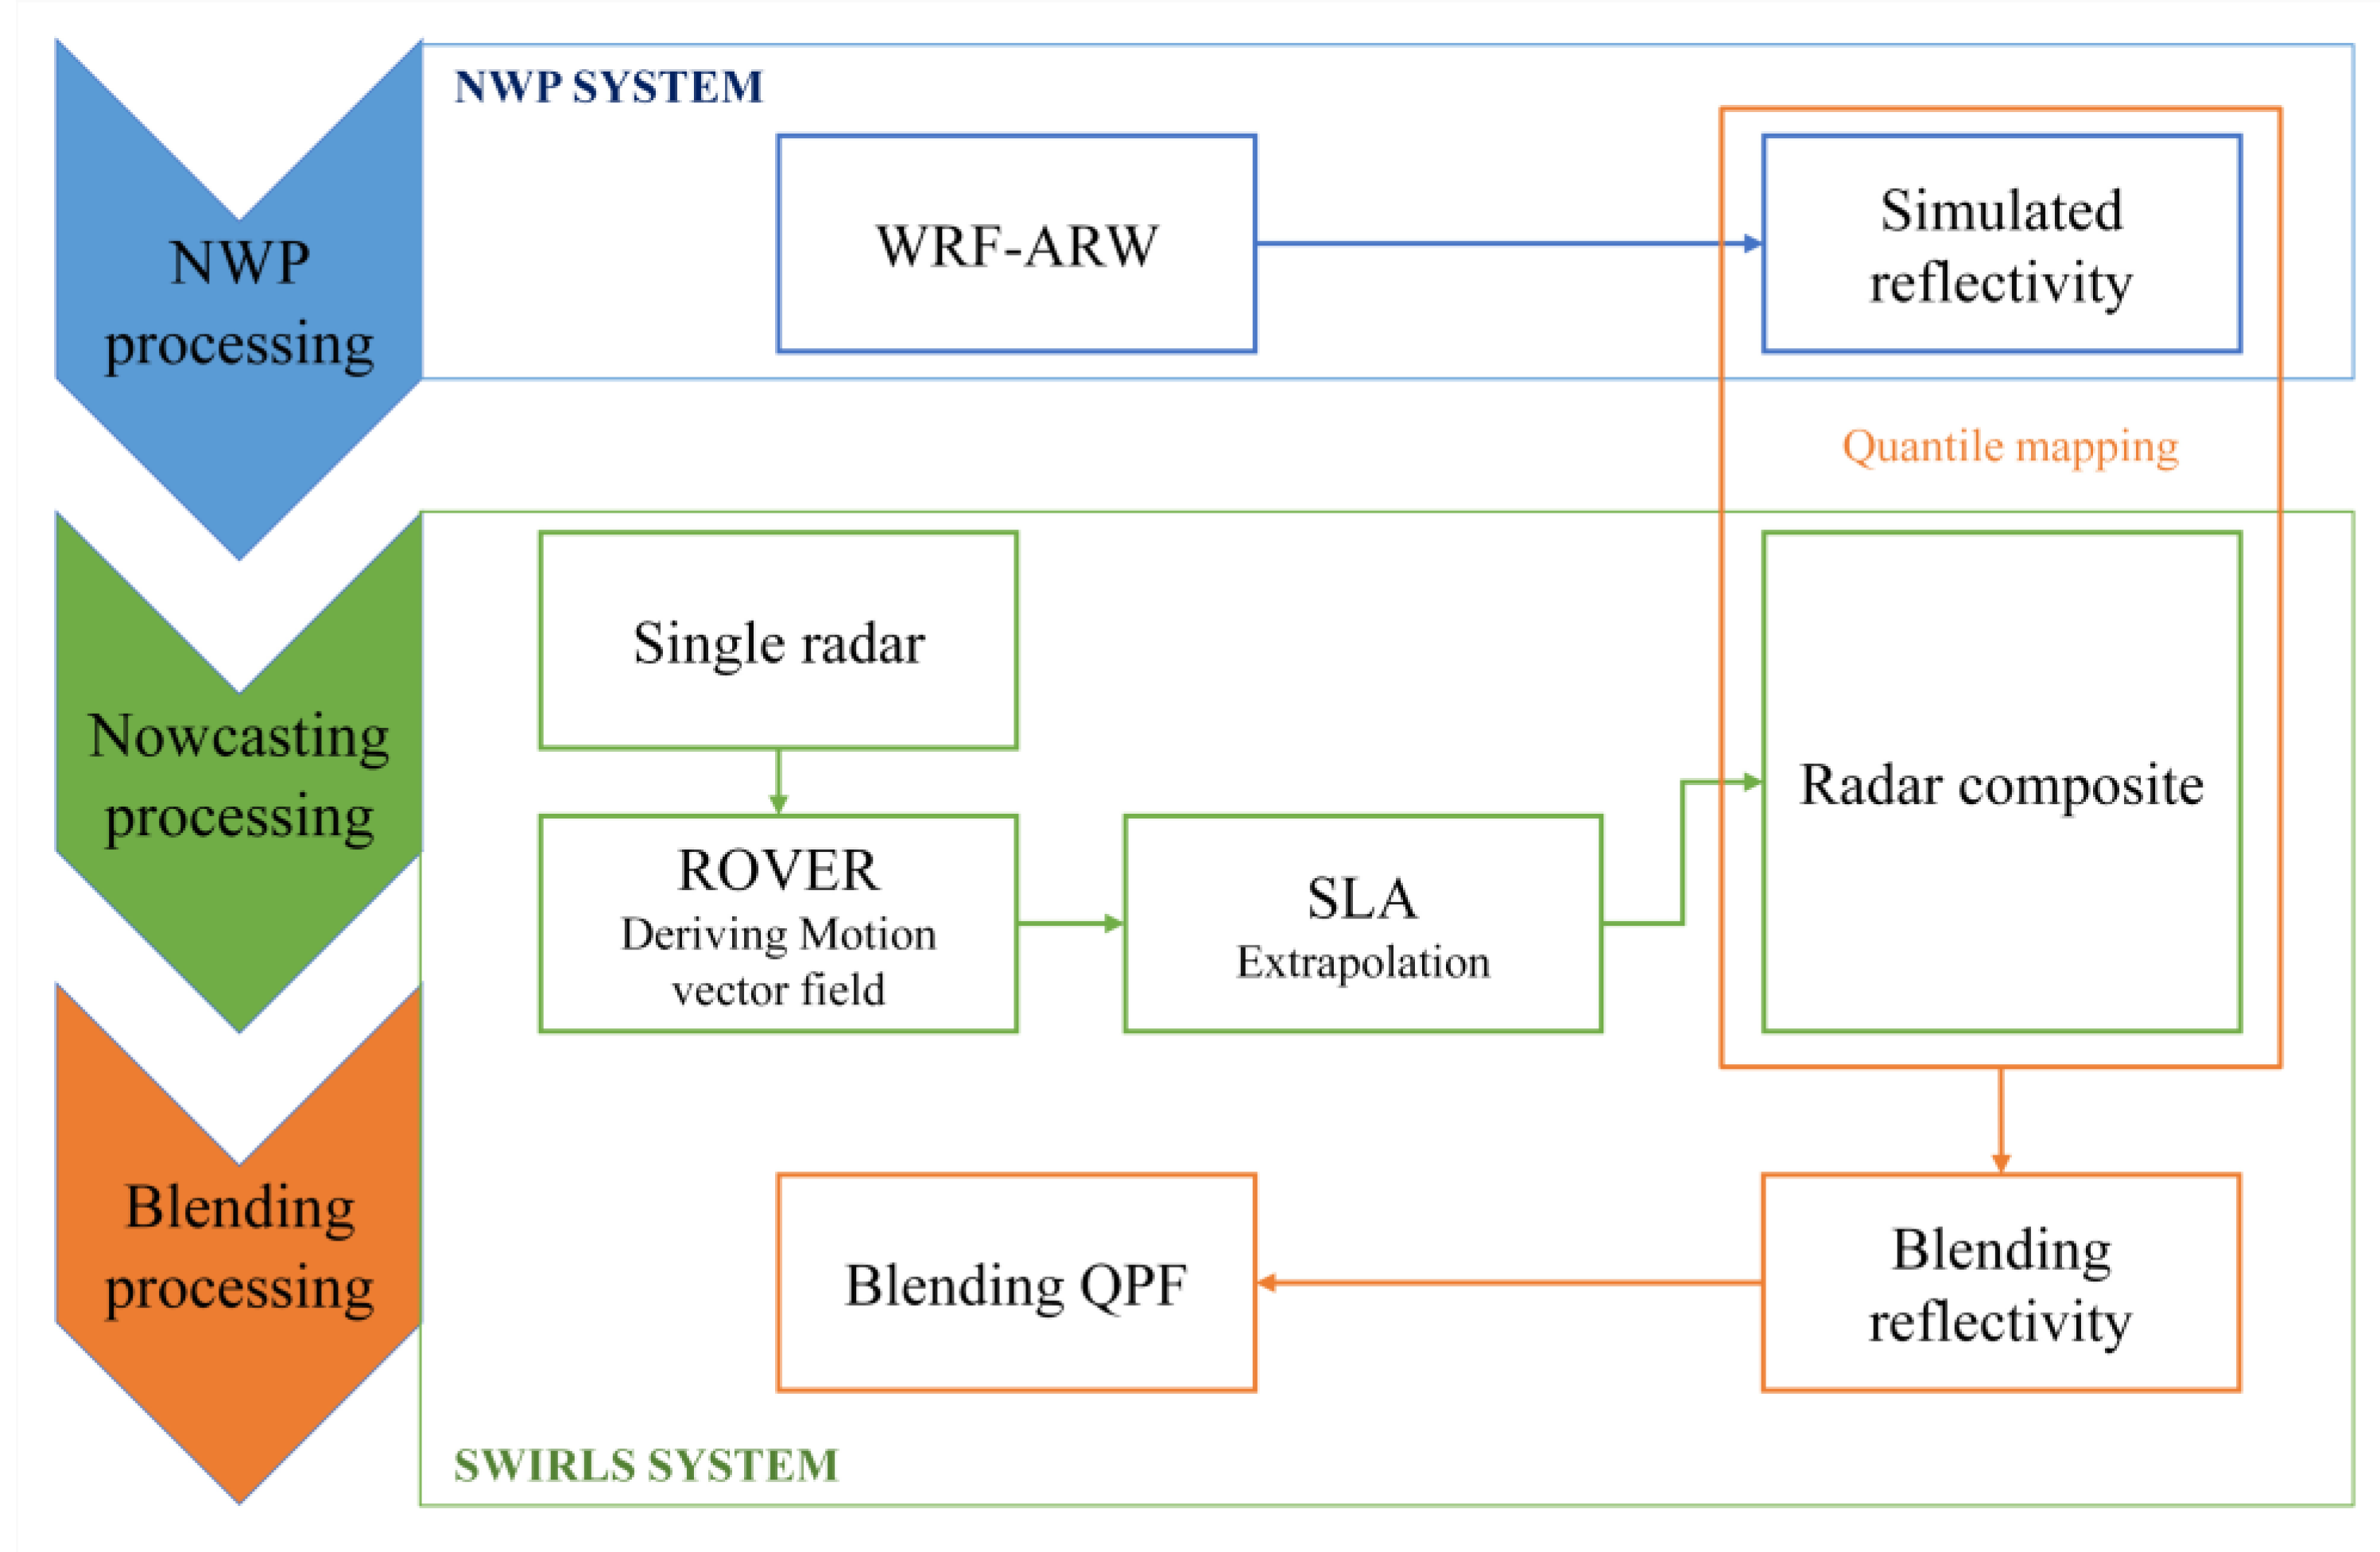
2.2. Short-Range Warning of Intense Rainstorms in Localized Systems (SWIRLS)

The HKO has been developing SWIRLS since 1999 and released the community version named Com-SWIRLS [31,48]. This system has been widely used to provide QPFs, as well as TC-induced rainfall forecasts [49,50,51,52,53].
There are some main steps to using SWIRLS to generate pure nowcast products and blended radar–NWP forecasts:
(1)
Preparing individual radar data in the universal format (UF): This research used data at the 2 km Constant Altitude Plan Projection Indicator (CAPPI) level; the domain is within the radius of influence of 250 km, which then be used to generate a grid of 500 × 500 pixels.
(2)
Generating the main grids with a 3 km horizontal resolution and then composing all individual radar stations by picking the maximum values of radar data at each grid point (in case of an overlap covering two or more radar stations).
(3)
Applying the Real-Time Optical Flow by Variational Methods for Echoes of Radar (ROVER) for each radar station to calculate the motion fields: (i) the radar reflectivity data are converted to the gray level [54], and (ii) the variational optical flow technique [55] is used to calculate 2D motion vectors.
(4)
Based on the 2D motion vectors, the extrapolation or forecast of radar echoes is calculated using the semi-Lagrangian advection scheme.
(5)
Before blending the nowcast data and NWP data, based on the quantile mapping (QM) method, the bias correction is processed using a transfer function that maps quantiles of equivalent reflectivity converted from the NWP output to those of the radar data.
(6)
The blending procedure ( Q P F B L E N D ) for the extrapolation product from SWIRLS ( Q P F S W I R L S ) and NWP data ( Q P F N W P ) is given by a hyperbolic tangent curve weight function of the forecasting time ( t ):
Q P F B L E N D = 1 w t × Q P F S W I R L S + w t × Q P F N W P
where the w t function is formulated as
w t = g × α × β α 2 1 + tan h γ t 9
The values for parameters g, α, β, and γ are 145, 0.01, 0.65, and 0.24, respectively, and the parameter γ has the most effective nowcast skill with the forecast time.
(7)
Finally, the Marshall–Palmer relationship, Z = aRb, is used to revert the echo reflectivity (Z) to the rainfall rate (R, unit mm/h). In this research, the values for the a and b parameters were 200 and 1.6, respectively [56].
The flowchart for generating blended radar–NWP forecasts is shown in Figure 1.

3. Forecasting Verification: Observational Data, Verification Methods, and Experiments

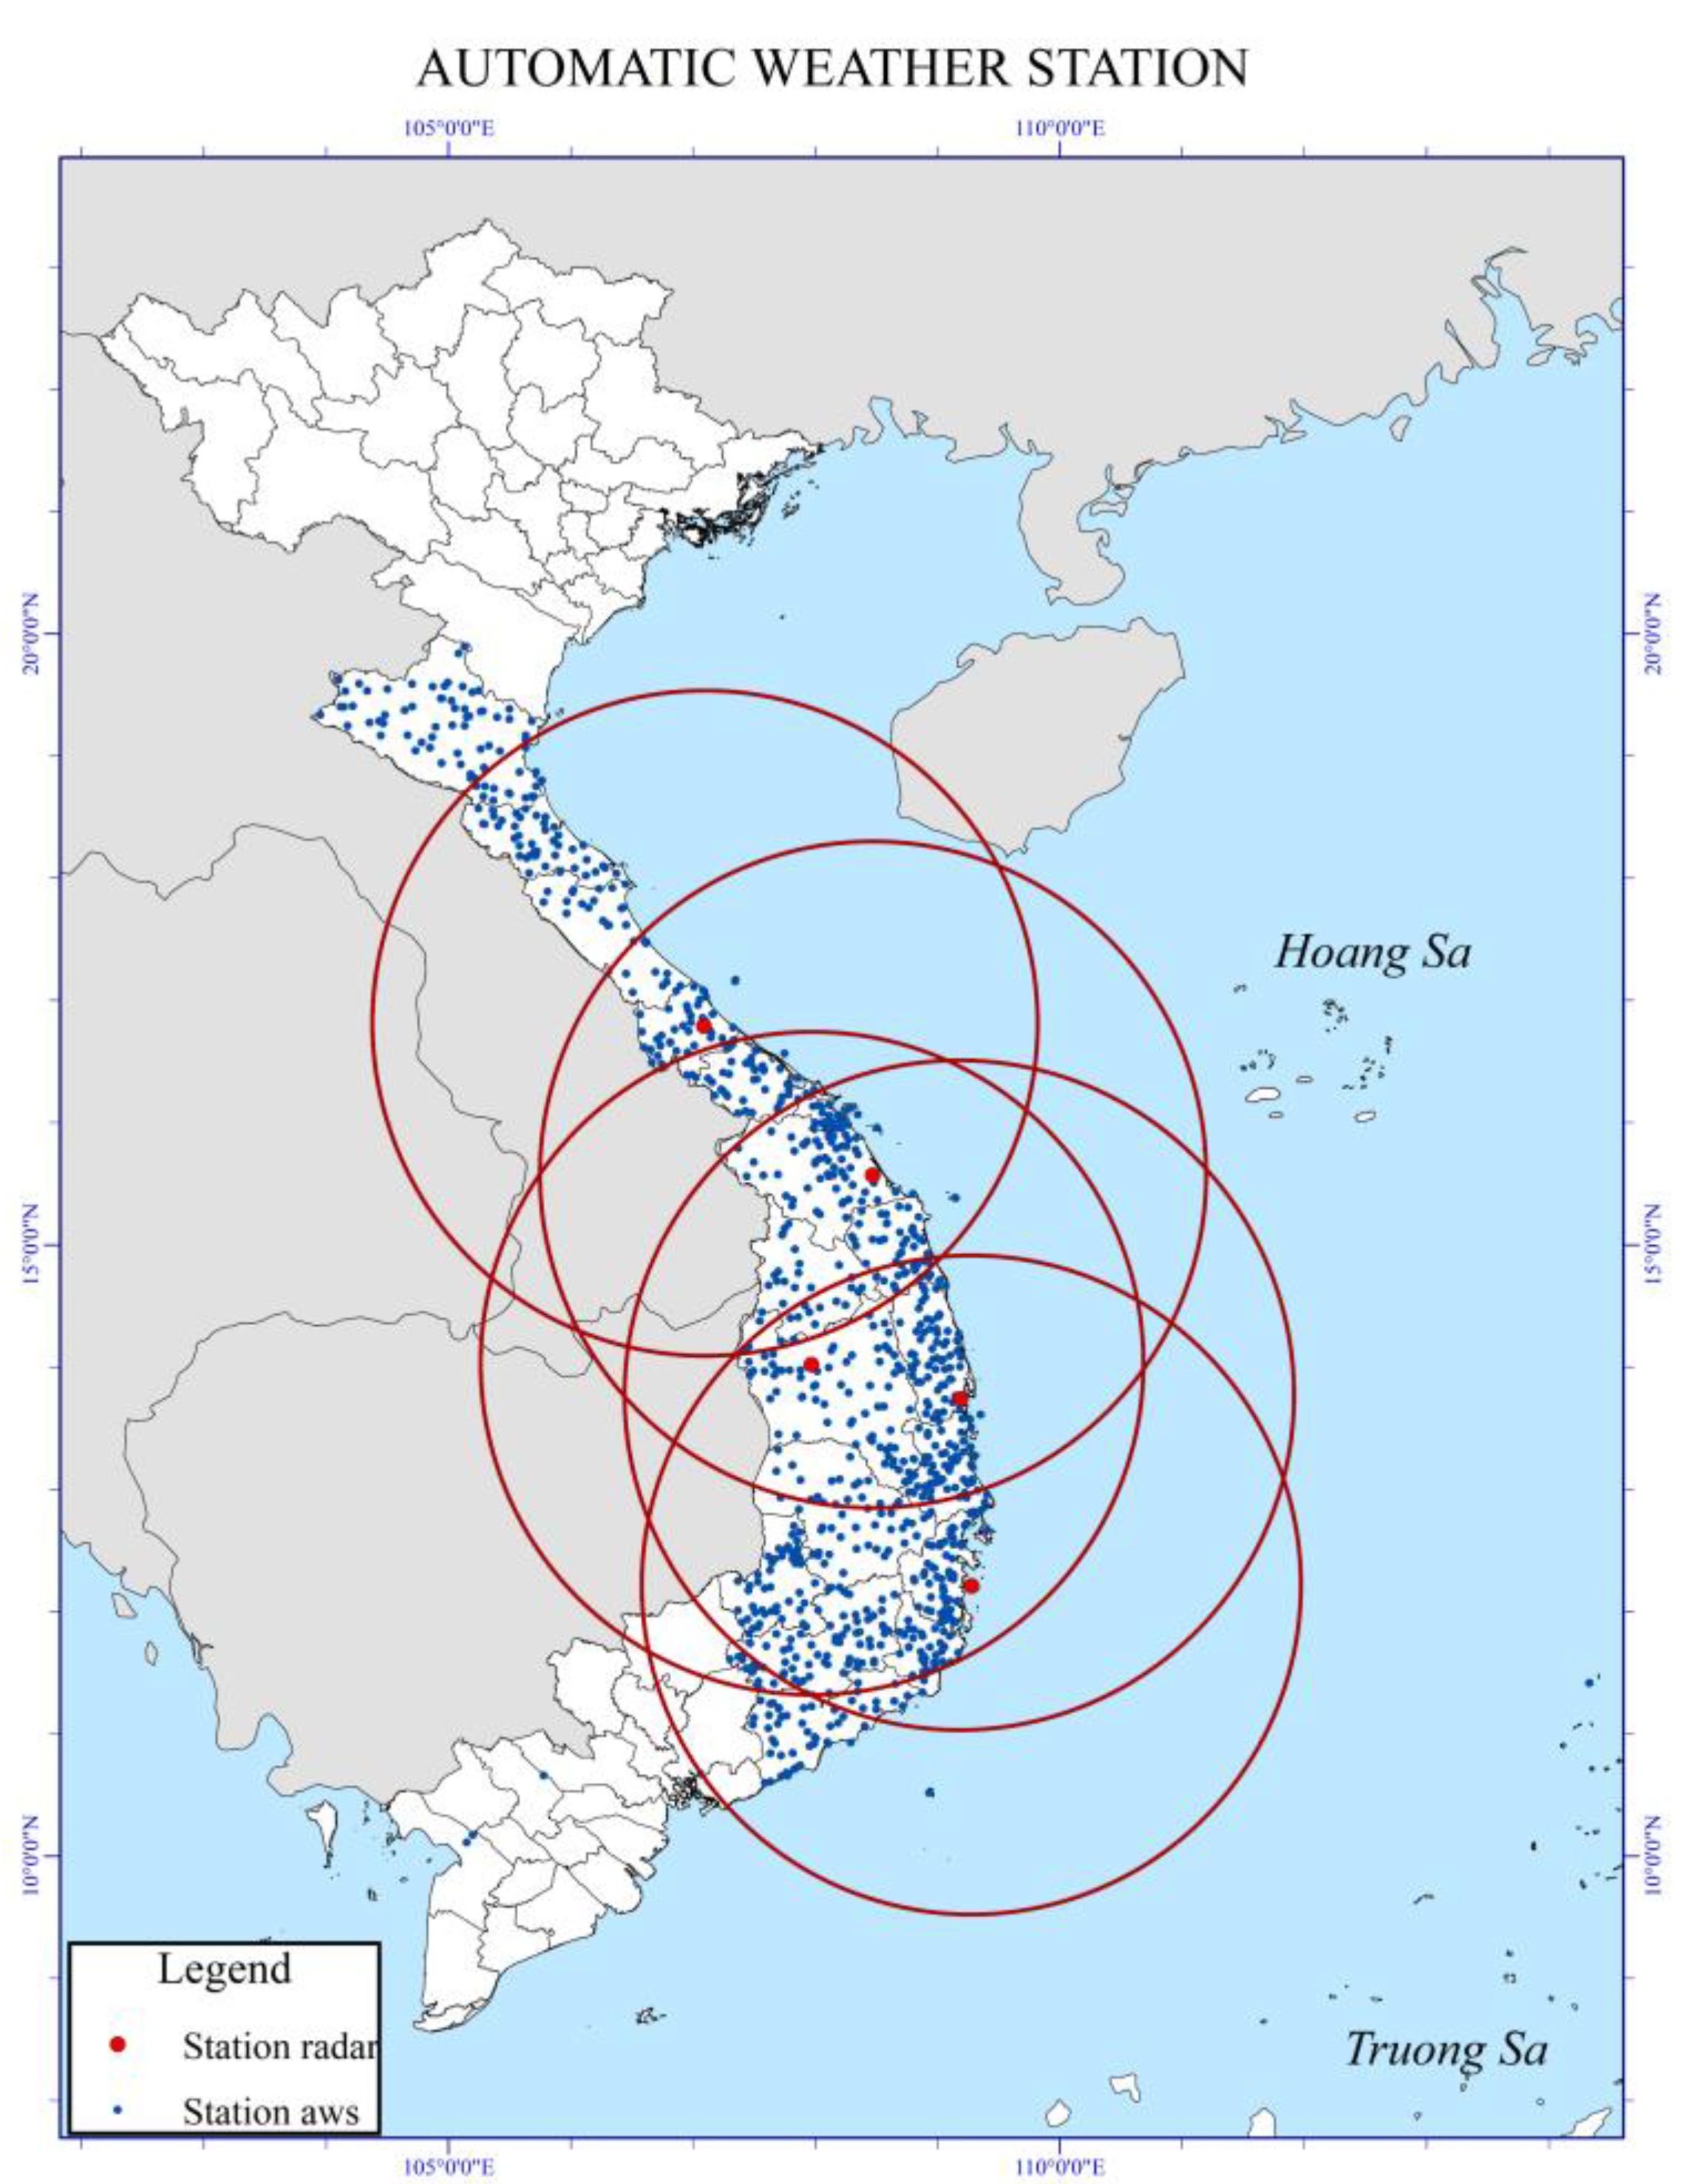
3.1. Precipitation Observation Data

In addition to more than 189 surface rain gauge stations, of which about 21 internationally report to the WMO, in recent years, Vietnam has been equipped with many AWSs with the ability to provide 10 min accumulative rainfall data [57]. AWS systems not only allow increased real-time rain monitoring capabilities but also enable the calibration and generation of gridded rain maps from radar and satellite data.
In this research, AWS rainfall was processed and accumulated at the scale of 1 h to evaluate the 1 h accumulated precipitation forecast of the NWP and nowcast system. A total of 1023 AWSs in the central region and the central highlands of Vietnam were used (Figure 2) which related to landed regions of selected TCs for this research.

3.2. Radar Data

In Vietnam, there are ten meteorological radars operated by the Aero-Meteorological Observatory (AMO), and these almost cover the whole country. The radar network includes two types: S-band radar and eight C-band radars. With the exception of one conventional radar, there are six Doppler radars and three dual-polarized Doppler radars [58]. In this research, we used five radars from the stations of Dong Ha, Tam Ky, Quy Nhon, Tam Ky, Pleiku, and Nha Trang to generate the nowcast and blended products. The locations of these radar stations and their coverages are plotted in Figure 2.

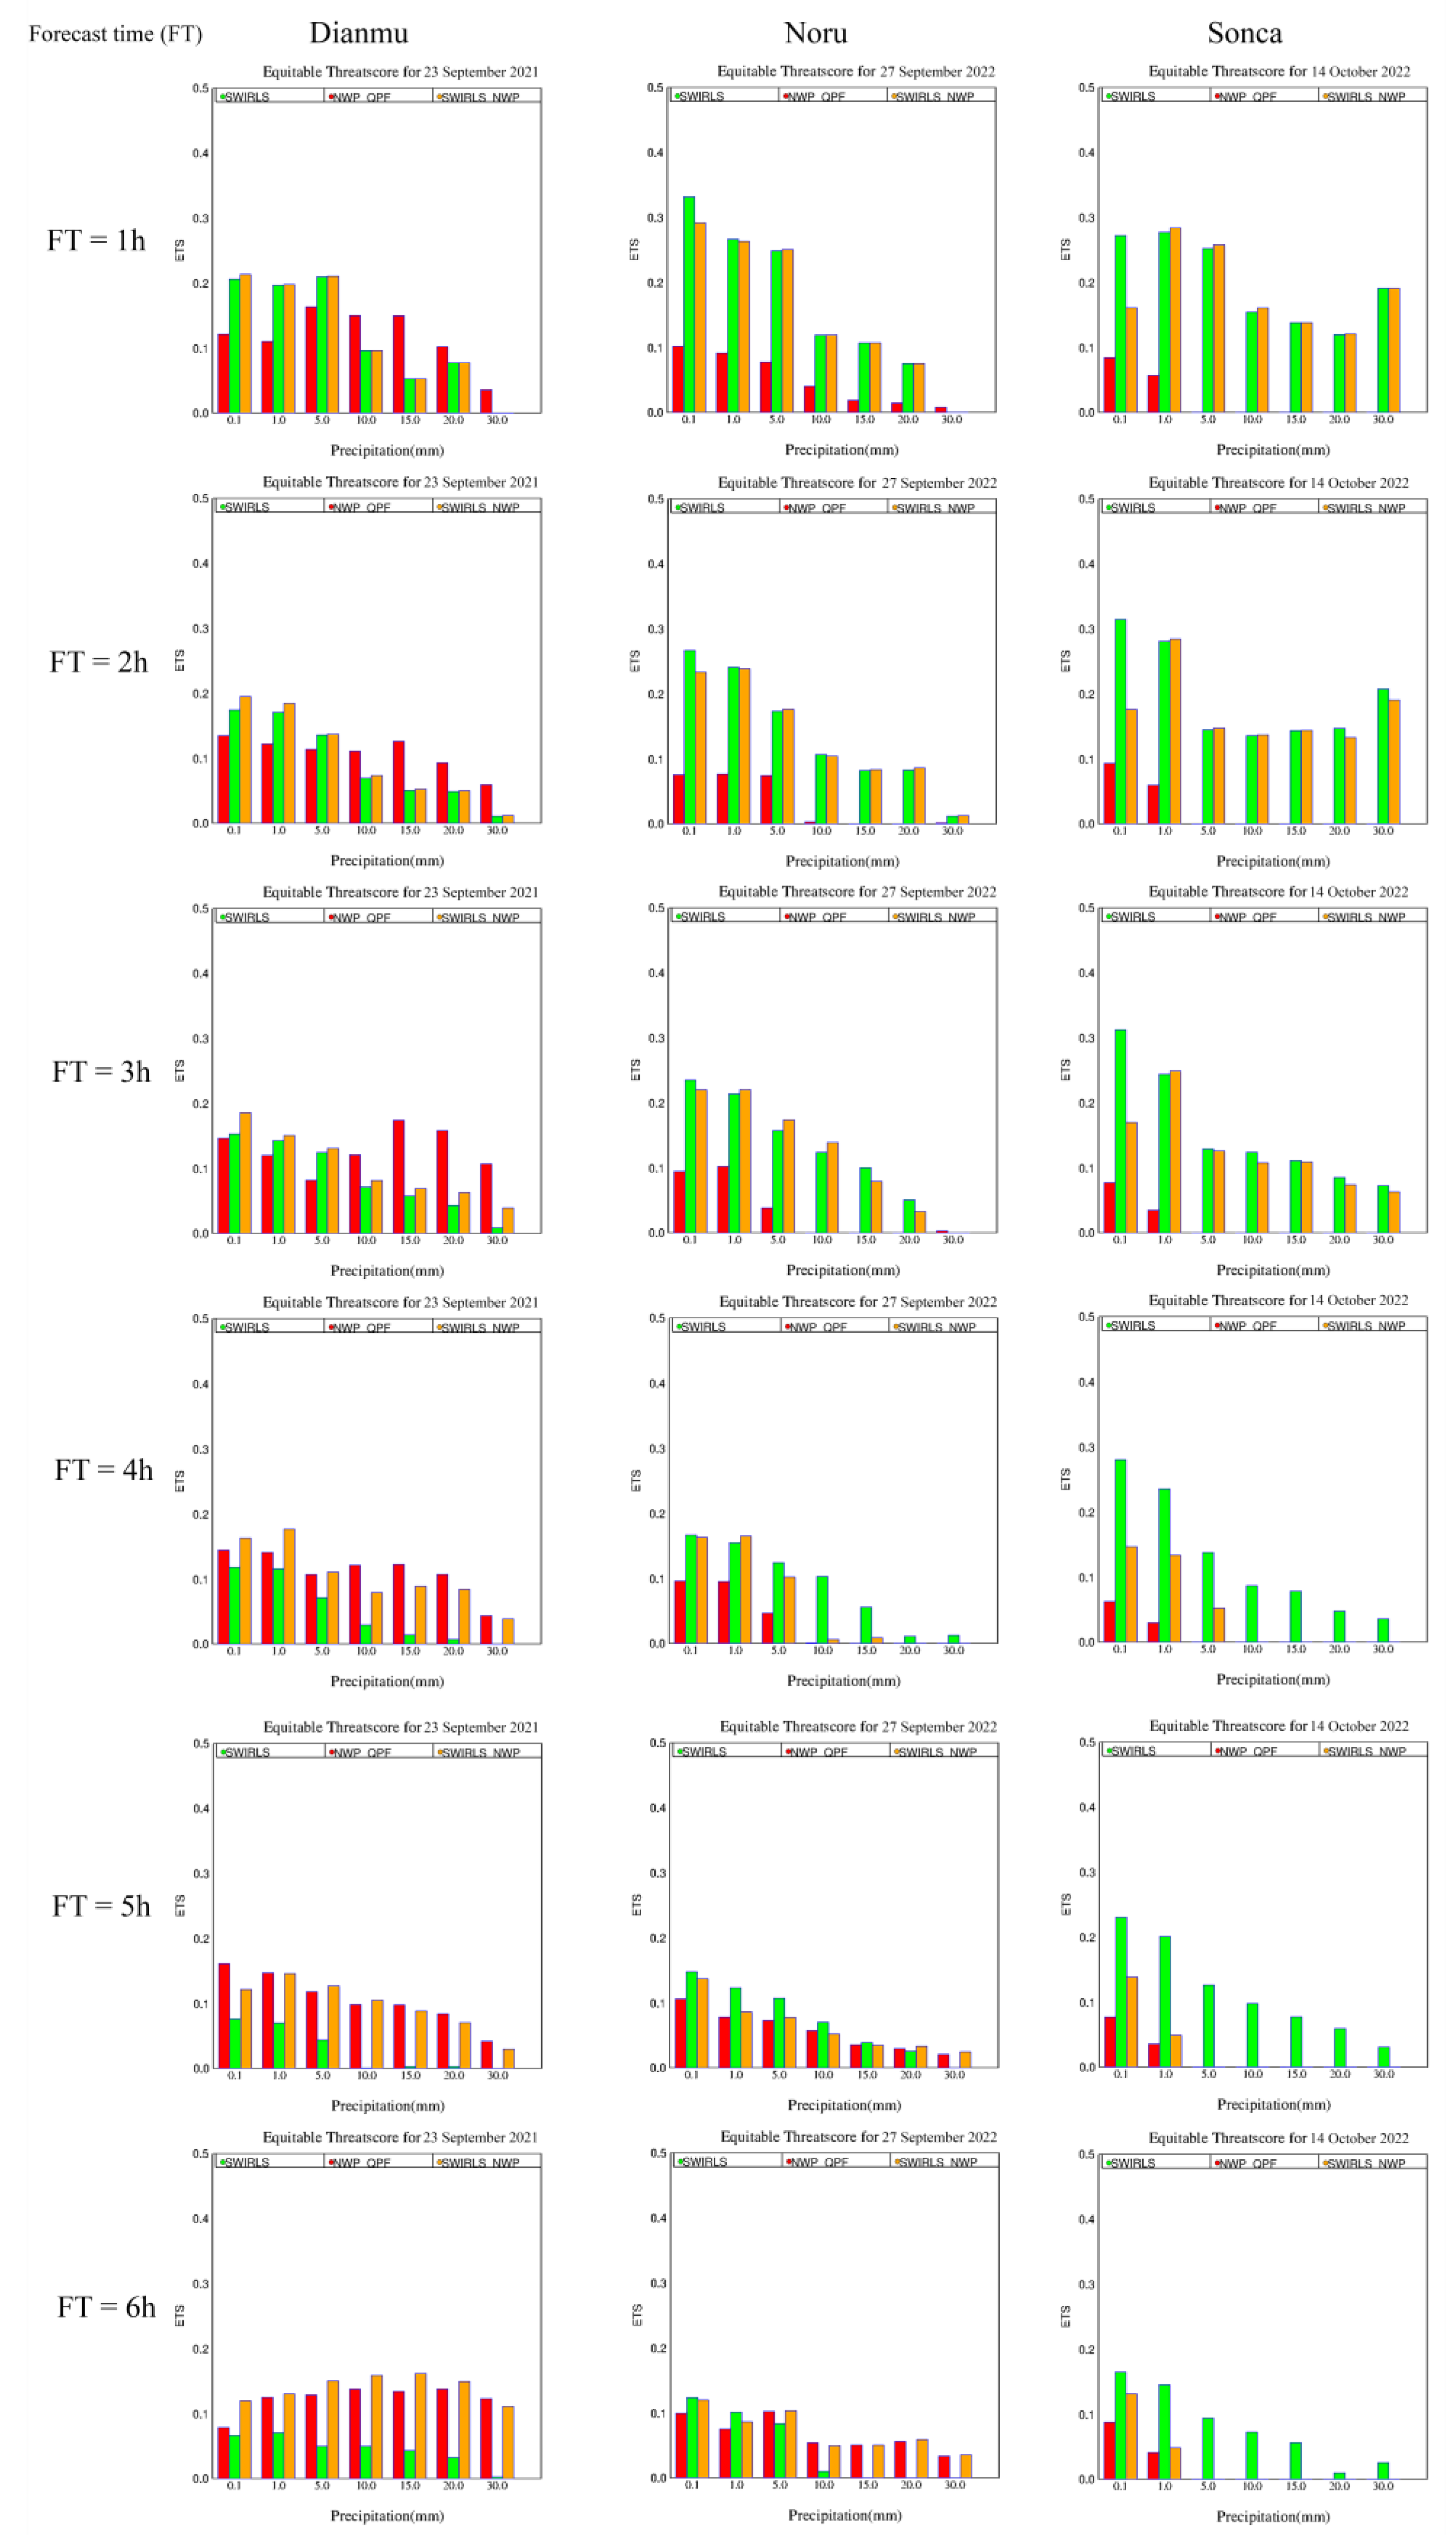
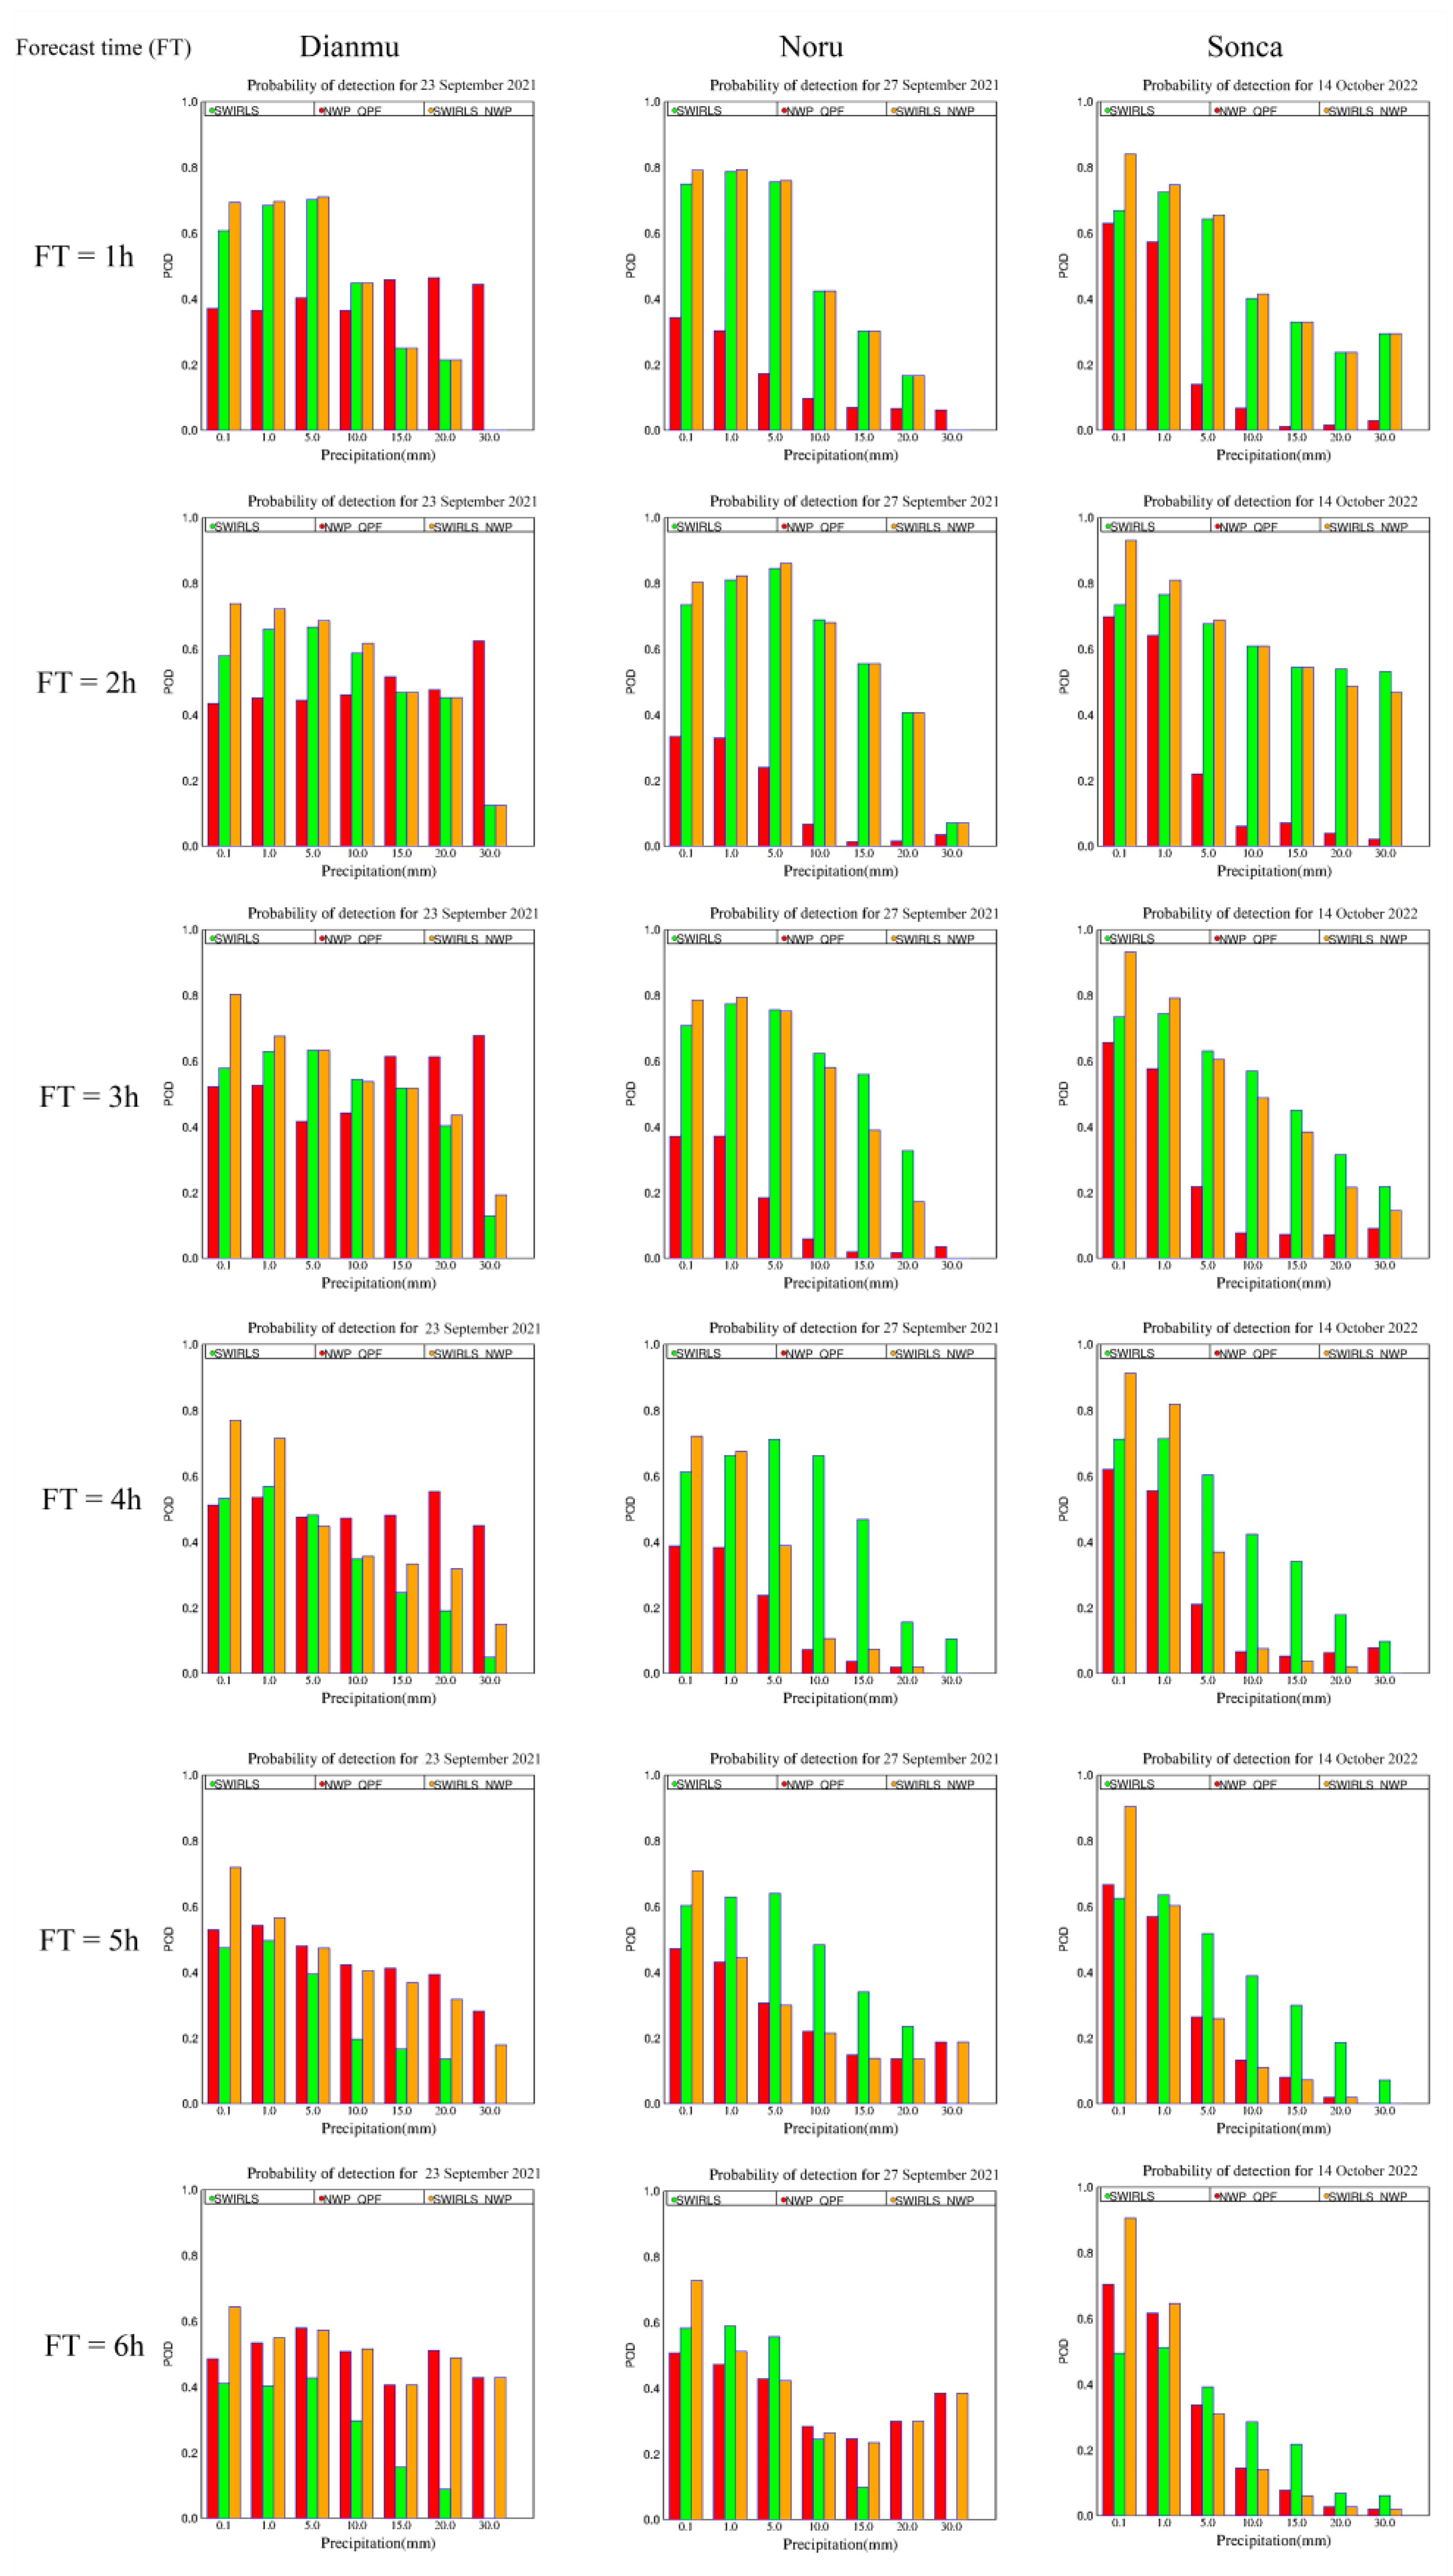
3.3. Validation Methods

When calculating the forecast of a given station, the nearest grids were searched in each station location, and then the accumulated rainfall from the WRF-ARW forecasts, SWIRLS nowcast, and blended products was assigned. The verification was carried out for the 1023 AWSs for 1 h of accumulated rainfall for 1 h in forecast ranges up to 6 h.
The validation scores used in this research were the probability of detection (POD), false-alarm ratio (FAR), threat score (TS) or critical success index (CSI), and equitable threat score (ETS). For a given rainfall threshold, by defining H as the hit rate of occurred rainfall both for the forecast and observation, M as the missed rate of occurred rainfall for the forecast, and F as the false-alarm rate of the forecast, the above scores were calculated using the following equations:
POD = H/(H + M), perfect value = 1
FAR = F/(H + F), perfect value = 0
TS = H/(H + M + F), perfect value = 1, no skill = 0.
Setting Hitsrandom = (H + F) × (H + M)/T, where T is the sum of H, M, F, and the number of non-occurred rainfall events both for the forecast and observation, the ETS was calculated as follows:
ETS = (H-Hitsrandom)/(H + M + F-Hitsrandom), perfect value = 1, no skill ≤ 0.
All information on the validation methods used in this research can be found in [59].

3.4. Experiments

Normally, derived motion vectors related to vortex systems such as tropical cyclones/tropical depressions or other convection systems that develop rapidly and locally will encounter a lot of errors for nowcasting systems. To see this more clearly, this research first explored the performance of SWIRLS for TC ETAU in November 2020 affecting the south center of Vietnam. The assessments considered vortex motion fields consistent with the TC’s main circulation, as well as the outflows of the TC system. This case was only tested with a single radar station from Nha Trang Station.
Then, the skill scores of QPFs of the nowcast for three TCs (DIANMU, NORU, and SONCA) in 2021 and 2022 from SWIRLS and the effectiveness of the blended product between SWIRLS and the high-resolution NWP for the 1 h of accumulated rainfall forecast in Central Vietnam were evaluated, where these three storms caused direct extreme heavy rain, flood, and landslides and made historical widespread damages both to property and lives.
As it is known that the QPFs of TCs are greatly influenced by the track forecast of TCs, the ability to simulate the curved rainbands of clouds and thunderstorms that trail away from the TC’s eye wall in a spiral fashion, determine the tropical cyclone’s size, and analyze the initial location of the storm in the model, as mentioned, was evaluated; therefore, we used three consecutive forecast cycles before ~18 h, where TCs approached the shore. Details of the international names and forecast cycles of these three TCs are presented in Table 1.

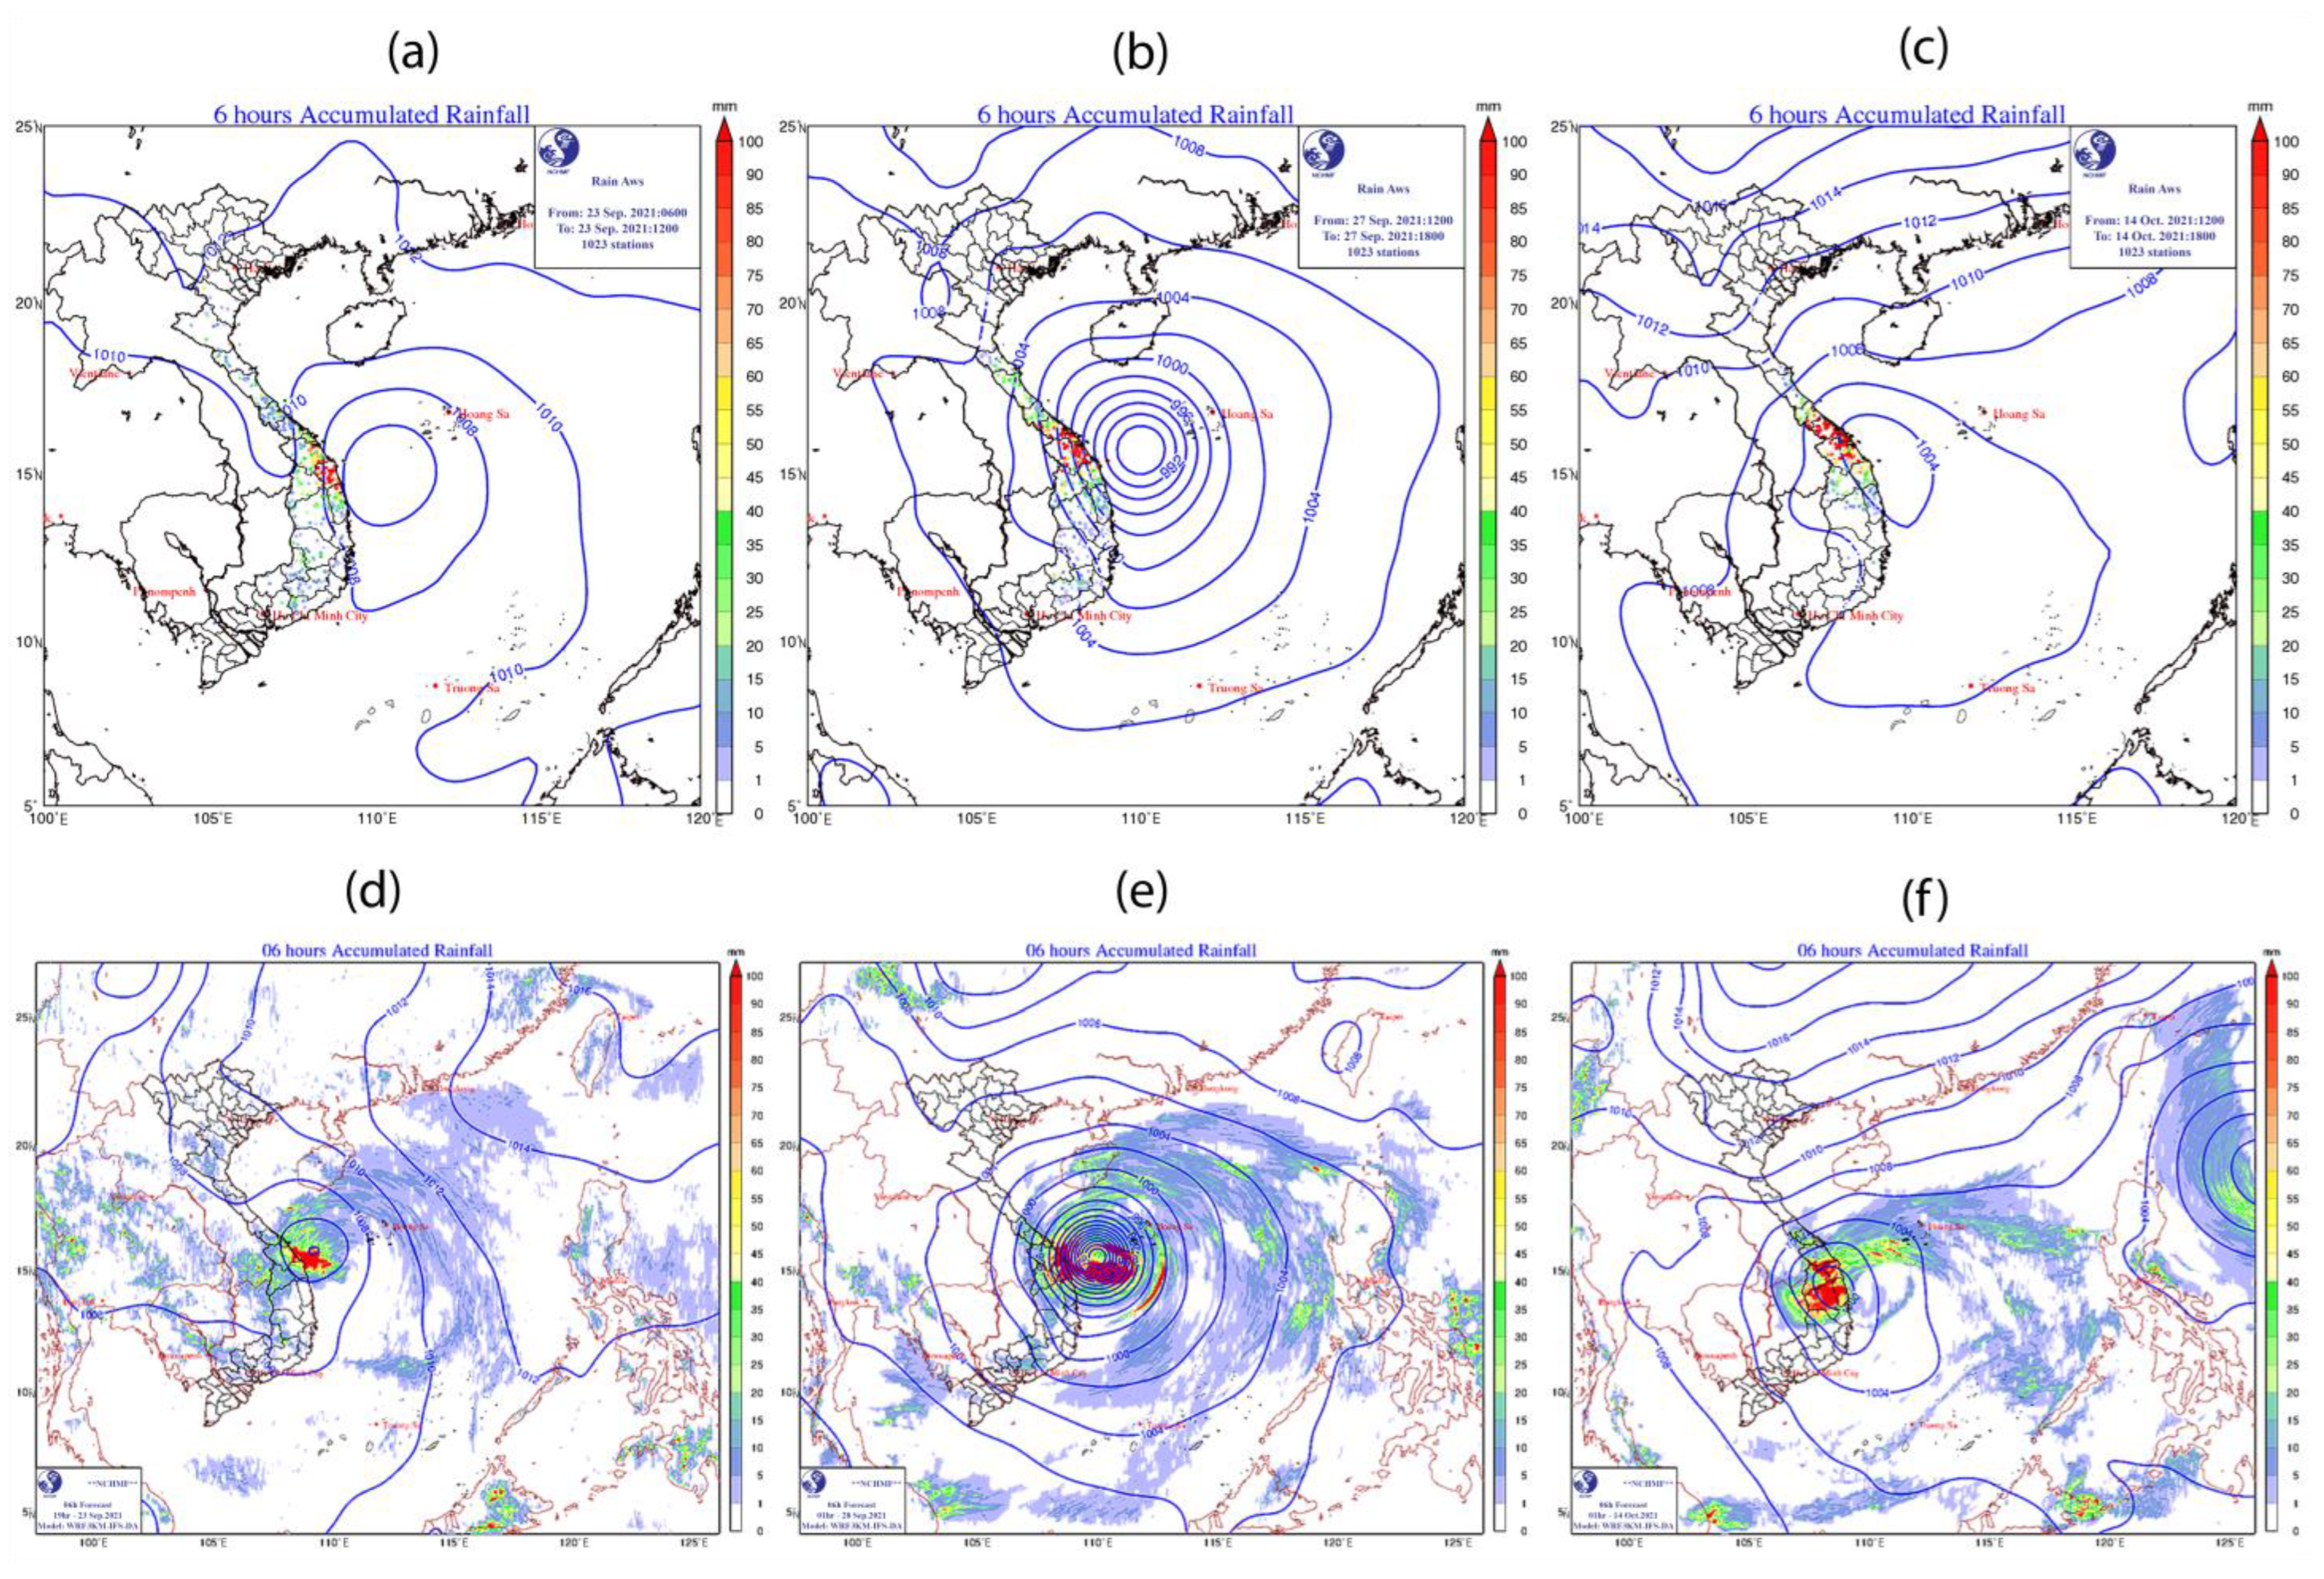
4. Results and Discussions

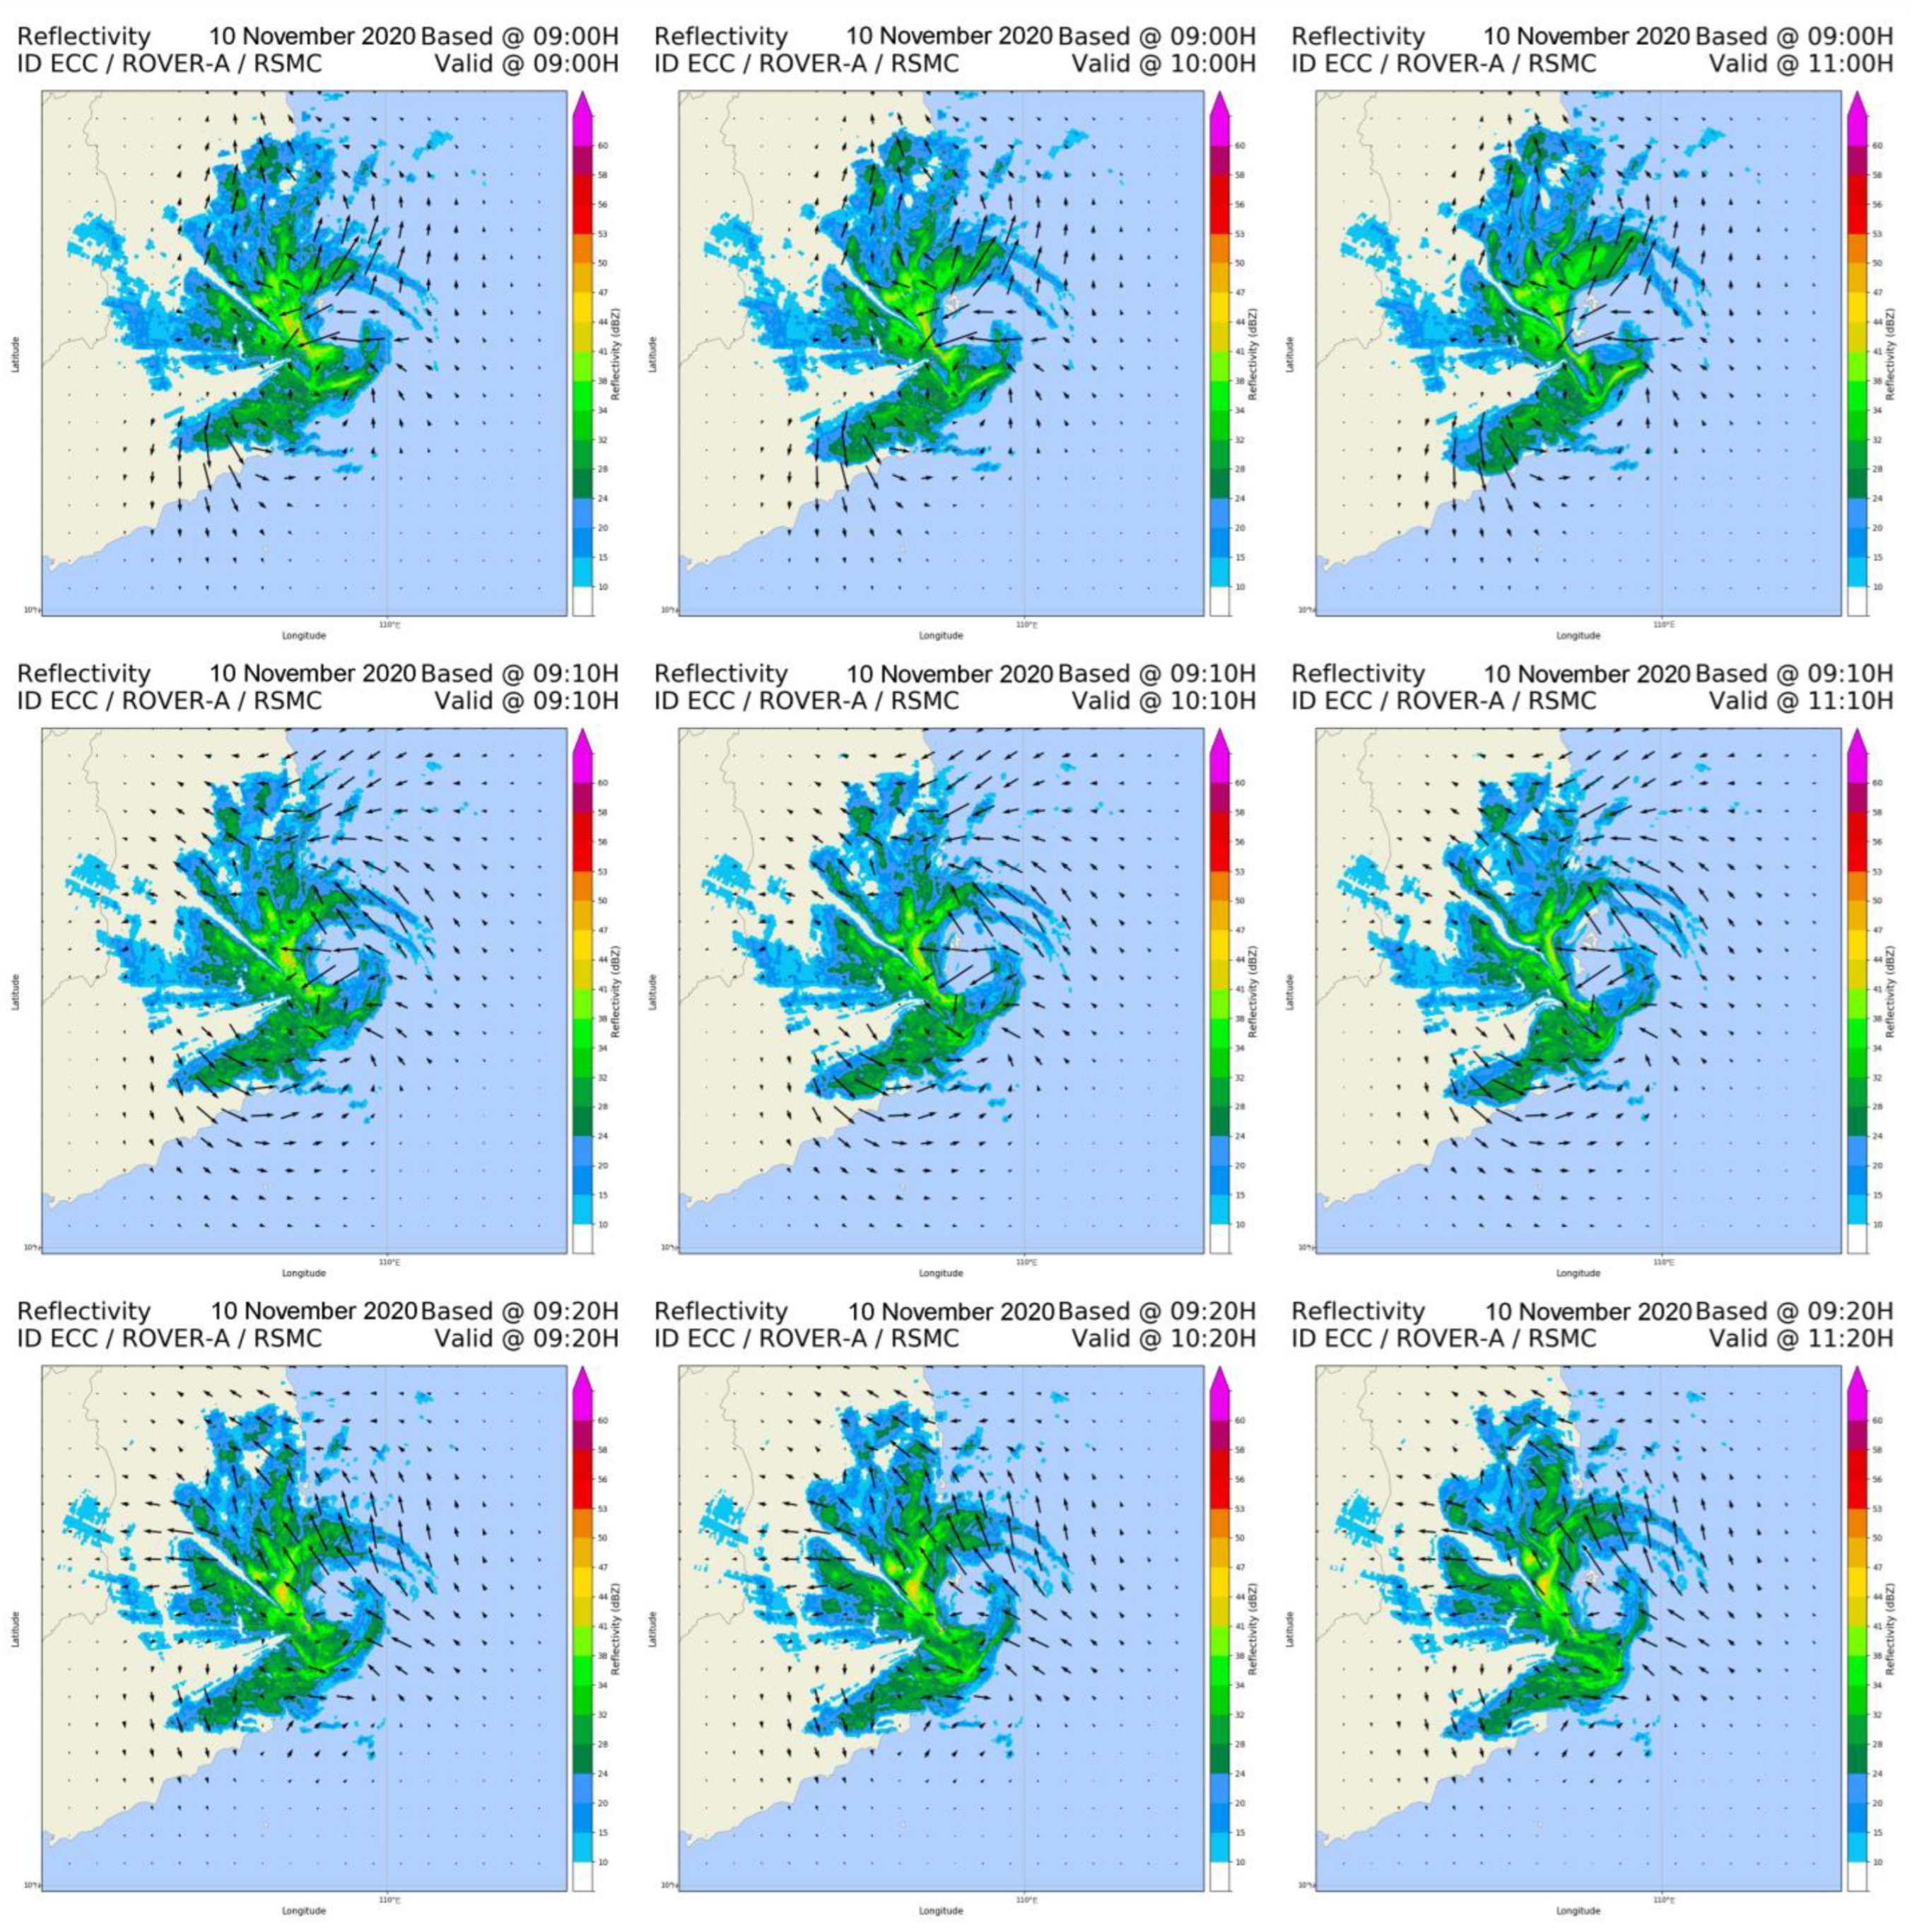
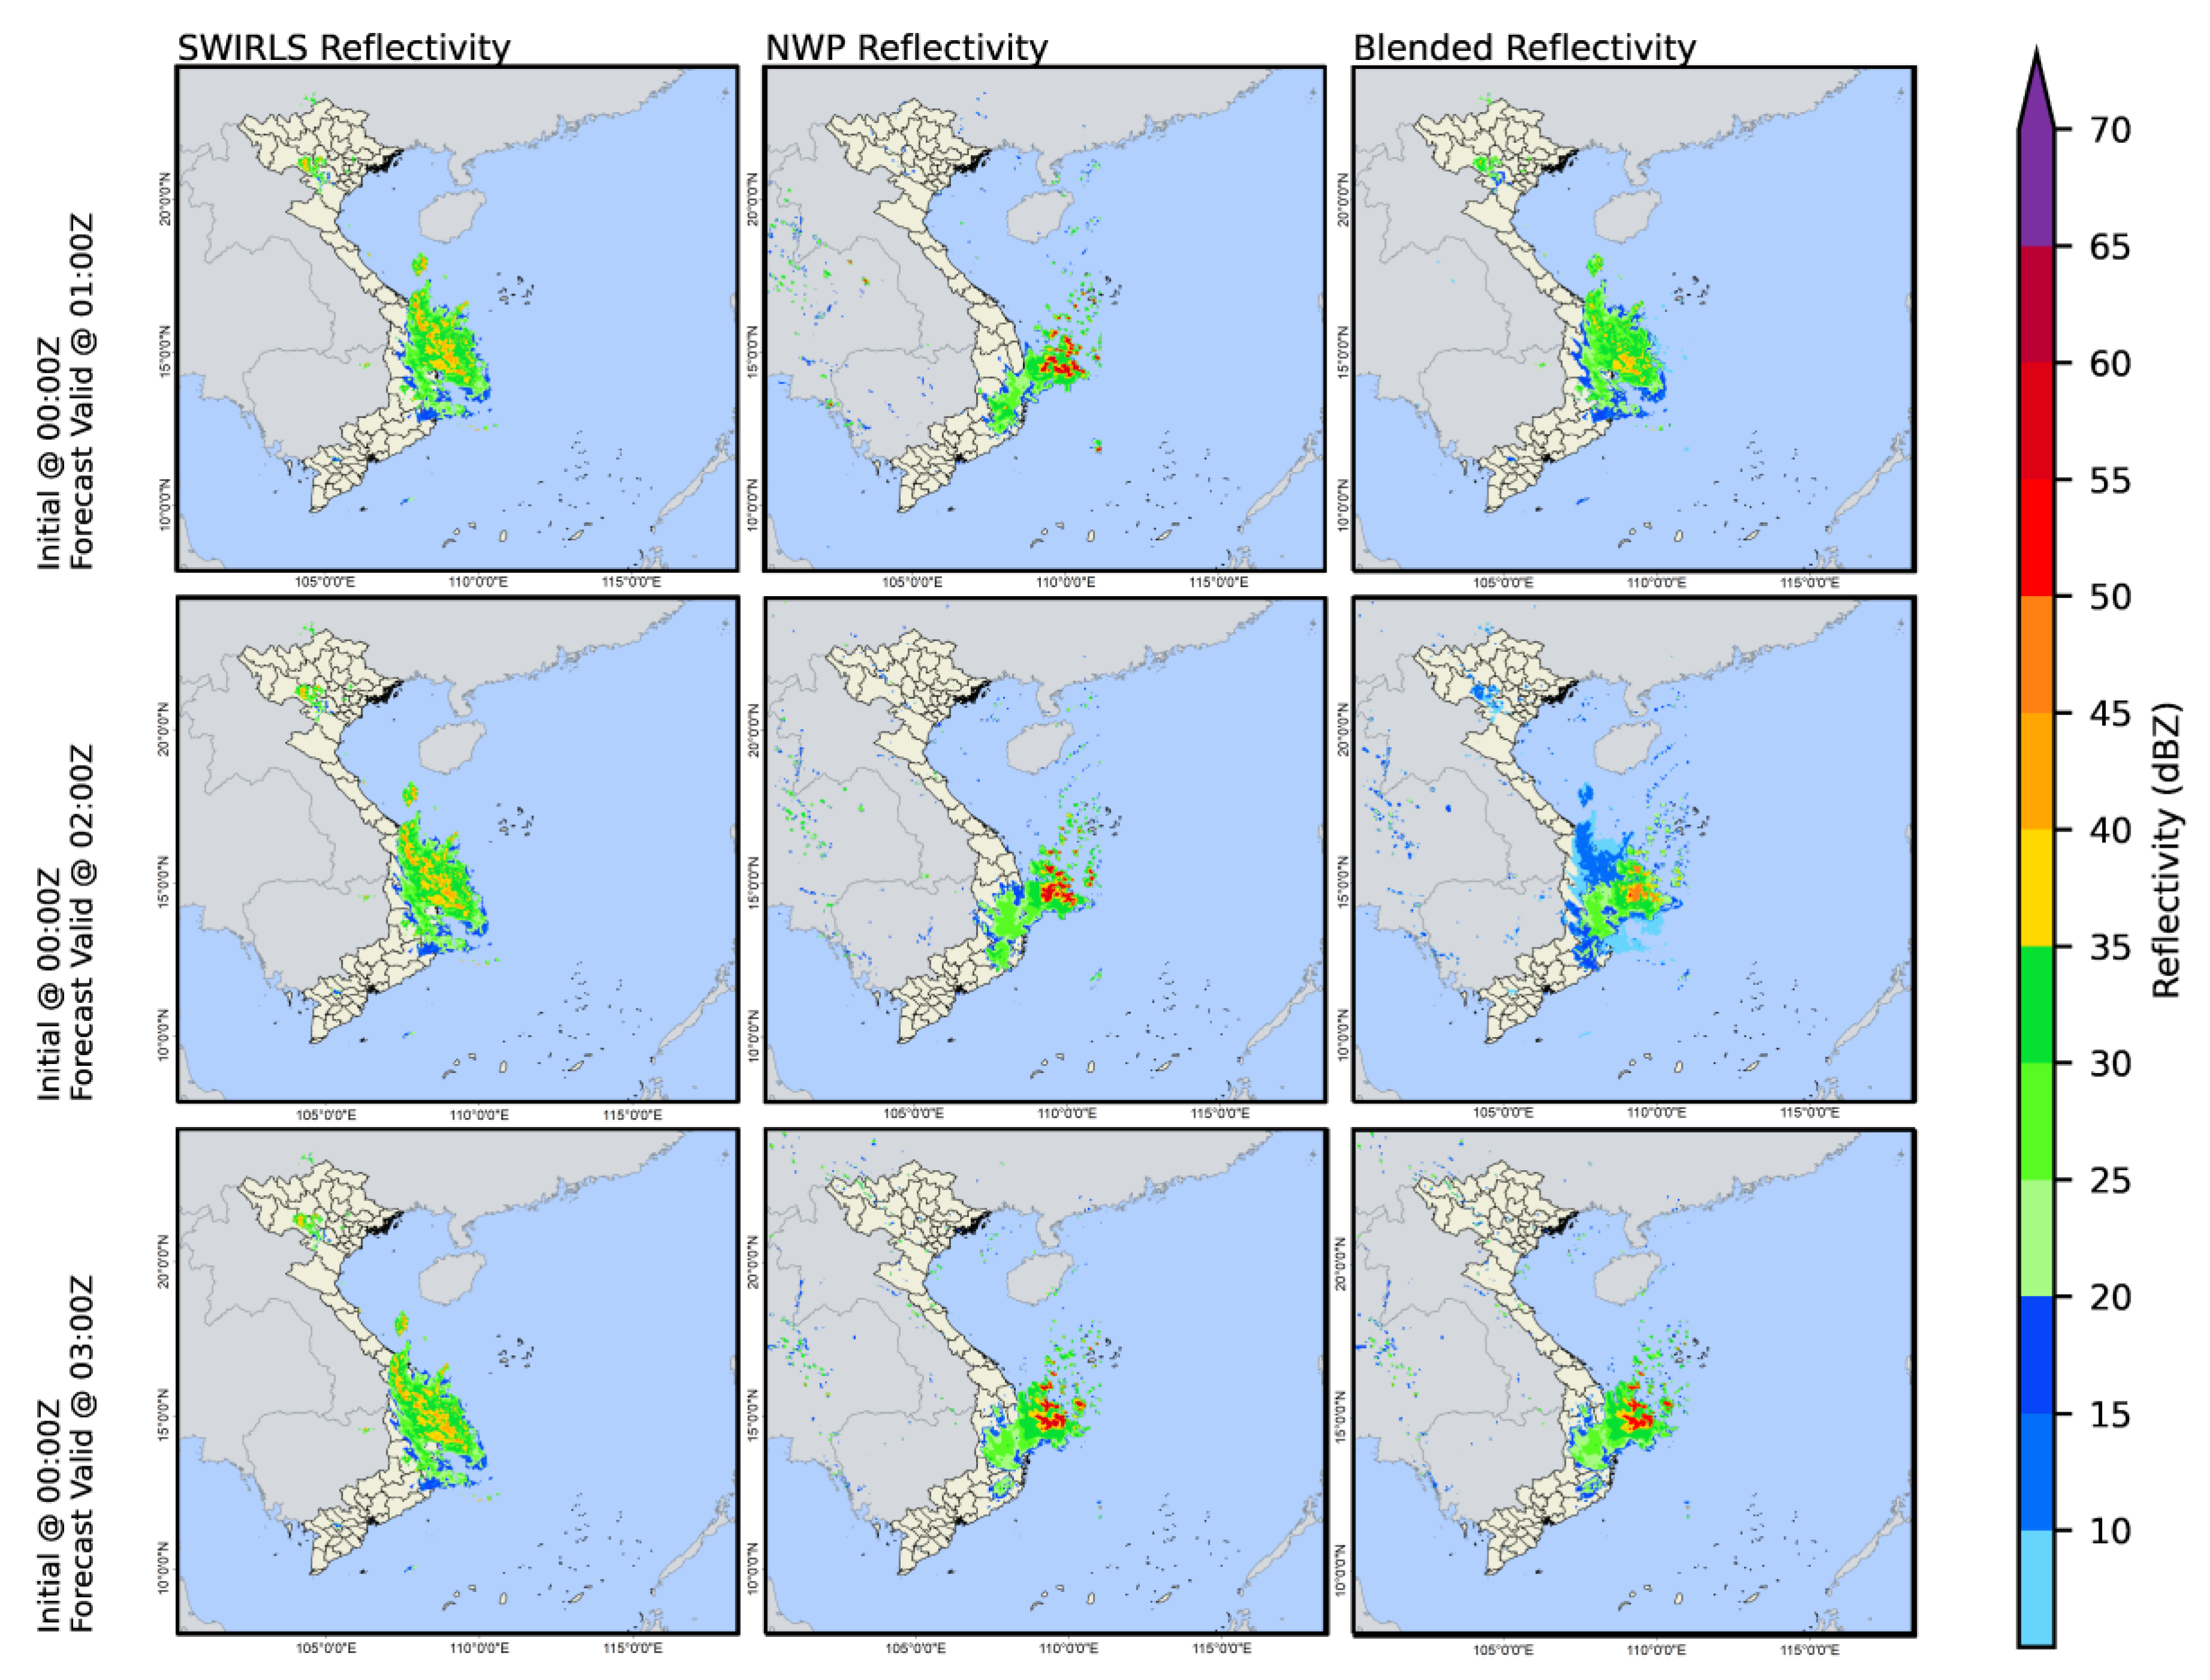
4.1. Nowcast Performances

SWIRLS for TC ETAU was carried out on 10 November 2020, with forecast ranges up to 3 h. Regarding the circulation characteristics of ETAU, based on the 10 m ocean surface wind vector data of 50 km resolution derived from the Level-1B Advanced Scatter meter (ASCAT) instrument on the Metop-A satellite product of the NOAA/National Environmental Satellite, Data, and Information Service (NESDIS)/Center for Satellite Applications and Research [60] shown in Figure 3, circulation is clearly visible to the north of the TC’s center (12.3° N; 109.3° E) with easterly winds, while below the center of the TC are the south and southeast winds.
Figure 4 is an illustration of SWIRLS’s performance for TC ETAU, and it is clear (for example, for the forecast initialized at 09:10 Local Standard Time (LST), middle row of Figure 3) that the motions effectively capture the circulation around the eye and ETAU’s outflow, leading to reasonable shifts in ETAU’s west sector into a deeper territory. Outflow-related rain tends to have an actual effect on the northern and southern areas of ETAU.
Although the ROVER algorithm greatly improves the generating motion vector fields compared to other methods, such as TREC, in reality, calculating the motion suitable for the TC’s circulation is very complicated, and then it affects the semi-Lagrangian advection extrapolating procedure [51]. As shown in the test case at 09:00 LST or at 09:20 LST (Figure 3), the calculated motion field hardly matches the TC’s circulation motion (north is south wind instead of east wind). Here, the main field of motion is captured (dominate) according to the dispersion of the upper cloud rings, instead of following the actual torsion structure of the TC’s cloud bands.
Moreover, after the ~2 and 3 h forecast ranges (Figure 4, third column), the movement effect when assuming brightness constancy in solving the optical flow constraint will lead to unrealism in the extrapolation fields. In reality, the forecast field is like a pseudo-fluid form, not a cloud pattern; therefore, the same issues as those for calculated rainfall fields are encountered, and, thus, keeping the forecasts from the NWP in the blended products will ensure a more reasonable rain field, especially for rainfall from TCs. These issues need to be further investigated, as mentioned in [61], by considering more source/sink terms representing the growth or decay of cloud systems during the extrapolating procedure.
Even when there are issues with the vortex system while generating motion fields for a nowcast system, the estimation of the rain rate from the radar will be very effective in estimating the TC’s precipitation because the main feature of rainstorms is the strongly developed convective cloud system. Returning to the three TC test cases (DIANMU, NORU, and SONCA), which were forecast through NWP and also tested with the blended product of SWIRLS, for each TC, the sample for validation was 3069 (1023 stations × 3 cycles) to calculate the skill scores, which are presented in Table 2 under different thresholds for the first 3 h forecast ranges. Under the threshold of 1–5 mm/1 h, the POD scores were approximately 60–80% in the first 3 h of forecasting, and the TS scores were approximately 0.2 to 0.4. Under a higher threshold of 5 mm/1 h, the TS decreased quite quickly to below 0.2 for most of the forecasting ranges; however, the POD still reached about 40–60% under the 10 mm/1 h threshold. For thresholds >10 mm/h, the PODs reached approximately 30–40%, but the skill of the nowcast was very low (TS and ETS scores << 0.1). Another point to note is that, for each threshold, the change in the value of the skill scores between the forecast ranges of 1 h, 2 h, and 3 h was only about 8–10%, showing a reasonably steady performance of the nowcast products.

4.2. NWP Performances

Figure 5 shows the detailed 6 h rain accumulation maps and the corresponding 6 h accumulated rainfall forecast of the model corresponding to the three times when TCs caused the most extreme rain in the central territory of Vietnam (TC DIANMU affected Quang Ngai Province, TC NORU affected Quang Nam Province, and TC SONCA affected Thua Thien Hue and Quang Nam Provinces). In Figure 5a–c, the mean sea level pressure fields from the fifth-generation ECMWF reanalysis data [62] were additionally contoured with the AWS rainfall. TC DIANMU’s forecast was quite consistent with the reality of the weakening in intensity, narrow TC clouds, and concentrated rainfall to the southwest of the TC’s center. TC NORU was a very strong storm even when moving close to the shore (when close to Da Nang City, it still reached a speed of 160 km/h on 04Z 28 September 2022); thus, the forecast from the WRF-ARW was quite suitable. However, there was a tendency to forecast excessive rain in the southwest of the TC (to Quang Ngai Province), where most of the interior of Quang Ngai had not yet caught the rain. The TC SONCA also returned a good rain distribution forecast in Quang Nam, but due to the forecast of the landfall, it tended to shift to the south compared to the real distribution of precipitation. The extreme rain in Thua Thien Hue was forecast to be less than 50 mm, but the forecast rain for the southern provinces was too high compared to the real observations.
For a more detailed assessment, Figure 6 and Figure 7 show charts of the ETS and POD skill scores for the forecast range of up to 6 h under specific thresholds of the NWP (NWP_QPF, red color charts) and averaged over three forecast cycles for each storm for the 1 h accumulated precipitation forecast. It can be seen that out of the three TCs, TC DIANMU returned better results, with relatively stable skill score values for the first 6 h, where the ETS ranged from 0.1 to 0.15 under thresholds up to 15–20 mm/h. The remaining two TCs, NORU and SONCA, had very low skills, most of which were only significant under thresholds of 1–5 mm/1 h, with ETS values of ~0.1. In terms of detection, the POD of TC DIANMU reached about 40–50% for most thresholds up to 20 mm/h, while the POD of TC NORU reached only 40%, and that of TC SONCA reached 40–60% under a low threshold, <5 mm/h. Under thresholds higher than 1 mm/h, the POD of TCs NORU and SONCA was very low, indicating a very high FAR or missing rate. In the following analysis, the results from blending NWP and SWIRLS clearly show that the NWP forecast error is related to both overestimation when TCs closely approach shore and the missing forecast of TCs’ rainfall when their cloud bands are too narrow or rain sectors are not suitable for real observations, and these are the main sources of error when forecasting these three TCs.

4.3. Blended Product Performances

In the case of TC DIANMU, on 23 September 2021, the first forecast cycle was selected as 00Z when the storm was still more than 100 km from the shore, but it caused 10–15 mm/h of rain over Central Vietnam (Figure 8 for forecast reflectivity, and Figure 9 for forecast rainfall). In this case, the model tended to forecast rainbands near the center of the TC, therefore missing rain over the land (PODs were all below 50%, Figure 7). By blending SWIRLS and WRF-ARW, the blended product allowed the method to take advantage of rain-estimate data from the radar and nowcast from SWIRLS to compensate for the missing rainfall in the model. The only high reliability in the first 1–2 h of the nowcast product led to the possibility of increasing the QPF quality in the first 2 h, after which the missing forecast on land was kept unchanged from the WRF-ARW. In the subsequent forecast cycles, 06Z and 12Z on 23 September 2021, the WRF-ARW tended to overestimate the TC’s rainfall, as shown in the reflectivity simulation in the NWP plots, showing extremes values over 50–55 dBZ, while the reflectivity scanned by the radar and nowcast in the first 3 h was only ~40–45 dBZ (Figure 8). The blended product also helped to reduce the overestimation from the WRF-ARW in the main areas of rainfall and eliminate the high-false-alarm-forecasting areas of the WRF-ARW where no rainfall occurred (Figure 9).
Regarding TC NORU on 27 September 2022, this fast-moving TC results in heavy rain over the territory of Vietnam. In fact, this TC caused rain quite early; however, for fast-moving TCs in a narrow territory such as Central Vietnam, the wrong time to landfall or the wrong landfall location may be estimated, leading to a very low forecasting skill for the WRF-ARW. This is a distinct feature of QPFs of TCs compared to general QPFs. This can be seen clearly for the NORU storm at 00z (Figure 10), where there was rain on land, but the model mainly predicted rain at sea in the first hours. Moreover, the rain areas within the radar’s scanning radius were also corrected through the blending product, which is most clearly shown in the 2 h forecast period (Figure 10, second row). Regarding the skill scores from the three forecast cycles of TC NORU (Figure 6), the WRF-ARW’s skill under thresholds over 10 mm/1 h was almost ~0, as mentioned, while the nowcast system in the forecast range up to 3 h returned an ETS of ~0.2–0.3 for thresholds of 1–5 m/1 h and an ETS of ~0.1–0.15 for thresholds of 10–15 mm/1 h. For the 1–3 h forecast ranges, the blended products for TC NORU increased the POD by 40–50% for thresholds of 10–15 mm/1 h, and the POD remained stable at 70–80% for thresholds of 1–5 mm/1 h.
Regarding TC SONCA (Figure 11), when making landfall, the WRF-ARW in the early forecasting hours tended to overestimate in the southern areas, as mentioned, while there was no actual heavy rain. As a consequence, the application of the nowcast allowed for the overestimation over land to be reduced. The FAR score for the WRF-ARW was mostly greater than 90%, and the application of the blended products helped the FAR score drop to 50–70% in the first 1–2 h forecast range for the thresholds of 5–15 mm/1 h. The ETS scores of the blended products were 0.15–0.2 for thresholds up to 30 mm/h in the +1 h forecast range and approximately 0.1–0.15 in the +2 h and +3 h forecast ranges; these improvements to the models, which initially had almost no skill, were contributed to by the nowcasting parts (Figure 6).
As a brief summary, in the first 2–3 h forecast range, under the threshold below 15 mm/1 h, it is clear to see that the blending was effective in terms of the ability of SWIRLS to capture the distribution, as well as the QPFs, of the TCs.

5. Conclusions

This research presents a nowcast system based on radar data to reduce QPF errors from NWPs in the early hours of forecasting. This is one of the effective solutions for bridging the gap between NWP and QPE in very short range forecasts, thereby effectively inputting the QPF product for early warning of natural disasters associated with extreme rain, in general, and for hydrological problems, in particular. Through the SWIRLS system, this research performed nowcast product blending with the WRF-ARW forecast for storms that caused extreme rain in Central Vietnam in recent years. The results were compared with those of AWSs and clearly showed an improvement with the blended product up to 3 h forecast range compared with the WRF-ARW product. To improve the blending product, the optimizing procedure for converting between reflectivity and precipitation should be considered by using AWS data in calibrating R–Z relationships and take advantages of observations from dual-polarization weather radars [63] or applying ML/DL techniques. This research was tested with strong TCs and needs more performances with weak TCs, which can cause severe rainfall events.
In the context of rainstorms, it is clear that radar observations play an important role when the storm is in the radar’s scanning area and when the model has not been able to update the actual location of the storm (especially for storms close to the coast), as well as the model spin-up time for tropical cyclone simulation. Although there are still limitations when applying the nowcast system to vortex-like rain patterns and complex cloud structures such as storms, the nowcast product’s ability to calibrate through the blending product was shown in both the compensation of early rainfall areas that were not captured (regarding the size of the storm and the storm’s cloud band) and also in areas where the rain was affected by underestimation or overestimation by the model (regarding the storm’s landfall location or the storm’s landfall direction relative to the shoreline). These limitations can be reduced by applying more post-processing for derived vector fields before applying extrapolation procedures, e.g. adding TC’s motion vector to motion fields [51]. Moreover, to extend the reliability of the nowcast contribution to the 3–4 h forecast range, the consideration for the rate of change of source/sink terms is need for the extrapolation scheme [61].

Author Contributions

Writing and original draft preparation, D.D.T. and T.A.D.; review and editing, L.R.H., P.T.P.D. and D.D.T.; calculation and visualization, D.D.Q., H.G.N. and M.K.H.; project administration, D.D.T. and M.K.H. All authors have read and agreed to the published version of the manuscript.

Funding

This research received no external funding.

Institutional Review Board Statement

Not applicable.

Informed Consent Statement

Not applicable.

Data Availability Statement

All data related to this paper can be requested from the authors for research purposes.

Acknowledgments

The authors would like to thank HKO’s experts for helping the NCHMF implement the SWIRLS system with our data. This research was supported by the Ministry of Natural Resources and Environment of Vietnam (intervention code TNMT.2022.06.02, title of the project, “Research and innovate technology to the quantitative forecast of precipitation due to typhoon, tropical depressions by high–resolution numerical model combining data assimilation of radar, satellite, surface and upper–air observations”). Hole was supported by the Norwegian Agency for Development Cooperation (NORAD).

Conflicts of Interest

The authors declare no conflict of interest.

References

  1. Endo, N.; Matsumoto, J.; Lwin, T. Trends in precipitation extremes over Southeast Asia. SOLA 2009, 5, 168–171. [Google Scholar] [CrossRef] [Green Version]
  2. Goh, A.Z.C.; Chan, J.C.L. Interannual and interdecadal variations of tropical cyclone activity in the South China Sea. Int. J. Climatol. 2010, 30, 827–843. [Google Scholar] [CrossRef]
  3. Zhan, R.; Wang, Y.; Ying, M. Seasonal forecasts of tropical cyclone activity over the western north pacific. Wea. Trop. Cyclone Res. Rev. 2012, 1, 307–324. [Google Scholar] [CrossRef]
  4. Tibay, J.; Cruz, F.; Tangang, F.; Juneng, L.; Ngo-Duc, T.; Phan-Van, T.; Santisirisomboon, J.; Singhruck, P.; Gunawan, D.; Aldrian, E.; et al. Climatological characterization of tropical cyclones detected in the regional climate simulations over the CORDEX-SEA domain. Int. J. Climatol. 2021, 41, 4236–4252. [Google Scholar] [CrossRef]
  5. Pham-Thanh, H.; Ngo-Duc, T.; Matsumoto, J.; Phan-Van, T.; Vo-Van, H. Rainfall trends in Vietnam and their associations with tropical cyclones during 1979–2019. Sci. Online Lett. Atmos. 2020, 16, 169–174. [Google Scholar] [CrossRef]
  6. Chen, T.C.; Tsay, J.D.; Yen, M.C.; Matsumoto, J. Interannual variation of the late fall rainfall in central Vietnam. J. Clim. 2012, 25, 392–413. [Google Scholar] [CrossRef]
  7. Japan International Cooperation Agency. Data Collection Survey on Strategy Development of Disaster Risk Reduction and Management in the Socialist Republic of Vietnam; Japan International Cooperation Agency: Tokyo, Japan, 2018; Available online: https://openjicareport.jica.go.jp/pdf/12323879.pdf (accessed on 17 July 2023).
  8. Luu, L.N.; Scussolini, P.; Kew, S.; Philip, S.; Hariadi, M.H.; Vautard, R.; Van Mai, K.; Van Vu, T.; Truong, K.B.; Otto, F.; et al. Attribution of typhoon-induced torrential precipitation in Central Vietnam, October 2020. Clim. Chang. 2021, 169, 24. [Google Scholar] [CrossRef]
  9. Luu, C.; Ha, H.; Duy, Q.B.; Dung, L.; Khuc, D.; Vu, H.; Nguyen, D. Flash flood and landslide susceptibility analysis for a mountainous roadway in Vietnam using spatial modeling. Quat. Sci. Adv. 2023, 11, 100083. [Google Scholar] [CrossRef]
  10. Pham, N.T.T.; Vu, H.H. Characteristics of Tropical Cyclone Precipitating System along Central Coastal Region of Vietnam by TRMM and GSMAP Data. In APAC 2019, Proceedings of the 10th International Conference on Asian and Pacific Coasts, Hanoi, Vietnam, 25–28 September 2019; Trung Viet, N., Xiping, D., Thanh Tung, T., Eds.; Springer: Singapore, 2020; pp. 87–91. [Google Scholar] [CrossRef]
  11. Huang, X.; He, L.; Zhao, H.; Huang, Y. Characteristics of tropical cyclones generated in South China Sea and their landfalls over China and Vietnam. Nat. Hazards 2017, 88, 1043–1057. [Google Scholar] [CrossRef]
  12. Cheung, K.K.W.; Huang, L.-R.; Lee, C.-S. Characteristics of rainfall during tropical cyclone periods in Taiwan. Nat. Hazards Earth Syst. Sci. 2008, 8, 1463–1474. [Google Scholar] [CrossRef]
  13. Cuo, L.; Pagano, T.C.; Wang, Q.J. A review of quantitative precipitation forecasts and their use in short-to medium-range streamflow forecasting. J. Hydrometeorol. 2011, 12, 713–728. [Google Scholar] [CrossRef]
  14. Chen, L.S.; Li, Y.; Cheng, Z.Q. An overview of research and forecasting on rainfall associated with landfalling tropical cyclones. Adv. Atmos. Sci. 2010, 27, 967–976. [Google Scholar] [CrossRef]
  15. Bauer, H.S.; Schwitalla, T.; Wulfmeyer, V.; Bakhshaii, A.; Ehret, U.; Neuper, M.; Caumont, O. Quantitative precipitation estimation based on high-resolution numerical weather prediction and data assimilation with WRF–a performance test. Tellus A Dyn. Meteorol. Oceanogr. 2015, 67, 25047. [Google Scholar] [CrossRef]
  16. Wang, C.C.; Chang, C.S.; Wang, Y.W.; Huang, C.C.; Wang, S.C.; Chen, Y.S.; Tsuboki, K.; Huang, S.Y.; Chen, S.H.; Chiu, H.; et al. Evaluating quantitative precipitation forecasts using the 2.5 km CReSS model for typhoons in Taiwan: An update through the 2015 season. Atmosphere 2021, 12, 1501. [Google Scholar] [CrossRef]
  17. Xue, M.; Kong, F.; Thomas, K.W.; Gao, J.; Wang, Y.; Brewster, K.; Droegemeier, K.K. Prediction of Convective Storms at Convection-Resolving 1 km Resolution over Continental United States with Radar Data Assimilation: An Example Case of 26 May 2008 and Precipitation Forecasts from Spring 2009. Adv. Meteorol. 2013, 2013, 259052. [Google Scholar] [CrossRef] [Green Version]
  18. Tallapragada, V.; Kieu, C.; Trahan, S.; Liu, Q.; Wang, W.; Zhang, Z.; Tong, M.; Zhang, B.; Zhu, L.; Strahl, B. Forecasting tropical cyclones in the western North Pacific basin using the NCEP operational HWRF model: Model upgrades and evaluation of real-time performance in 2013. Weather Forecast. 2016, 31, 877–894. [Google Scholar] [CrossRef]
  19. Kotsuki, S.; Kurosawa, K.; Otsuka, S.; Terasaki, K.; Miyoshi, T. Global precipitation forecasts by merging extrapolation-based nowcast and numerical weather prediction with locally optimized weights. Weather Forecast. 2019, 34, 701–714. [Google Scholar] [CrossRef]
  20. Rinehart, R.E.; Garvey, E.T. Three-dimensional storm motion detection by conventional weather radar. Nature 1978, 273, 287–289. [Google Scholar] [CrossRef]
  21. Li, L.; Schmid, W.; Joss, J. Nowcasting of motion and growth of precipitation with radar over a complex orography. J. Appl. Meteorol. Climatol. 1995, 34, 1286–1300. [Google Scholar] [CrossRef]
  22. Zhang, Y.; Chen, M.; Xia, W.; Cui, Z.; Yang, H. Estimation of weather radar echo motion field and its application to precipitation nowcasting. Acta Meteorol. Sin. 2006, 64, 631–646. [Google Scholar] [CrossRef]
  23. Wang, G.; Wong, W.; Liu, L.; Wang, H. Application of multi-scale tracking radar echoes scheme in quantitative precipitation nowcasting. Adv. Atmos. Sci. 2013, 30, 448–460. [Google Scholar] [CrossRef]
  24. Mecklenburg, S.; Joss, J.; Schmid, W.; Mecklenburg, S.; Joss, J.; Schmid, W. Improving the nowcasting of precipitation in an Alpine region with an enhanced radar echo tracking algorithm. J. Hydrol. 2000, 239, 46–68. [Google Scholar] [CrossRef]
  25. Liang, Q.; Feng, Y.; Deng, W.; Hu, S.; Huang, Y.; Zeng, Q.; Chen, Z. A composite approach of radar echo extrapolation based on TREC vectors in combination with model-predicted winds. Adv. Atmos. Sci. 2010, 27, 1119–1130. [Google Scholar] [CrossRef]
  26. Mueller, C.; Saxen, T.; Roberts, R.; Wilson, J.; Betancourt, T.; Dettling, S.; Oien, N.; Yee, J. NCAR Auto-Nowcast System. Weather Forecast. 2003, 18, 545–561. [Google Scholar] [CrossRef]
  27. Golding, B.; Nimrod, W. A system for generating automated very short range forecasts. Meteorol. Appl. 1998, 5, 1–16. [Google Scholar] [CrossRef]
  28. Yeung, L.H.; Wong, W.K.; Chan, P.K.; Lai, E.S. Applications of the Hong Kong Observatory nowcasting system SWIRLS-2 in support of the 2008 Beijing Olympic Games. In Proceedings of the WMO Symposium on Nowcasting, Whistler, BC, Canada, 30 August–4 September 2009; p. 9. [Google Scholar]
  29. Hatsuzuka, D.; Kato, R.; Shimizu, S.; Shimose, K. Verification of Forecasted Three-Hour Accumulated Precipitation Associated with “Senjo-Kousuitai” from Very-Short-Range Forecasting Operated by the JMAVerification of Forecasted Three-Hour Accumulated Precipitation Associated with “Senjo-Kousuitai” from Very-Short-Range Forecasting Operated by the JMA. J. Meteorol. Soc. Japan. 2022, 100, 995–1005. [Google Scholar] [CrossRef]
  30. Japan Meteorological Agency. Forecasting Technology Training Textbook; Japan Meteorological Agency: Tokyo, Japan, 2019; Volume 24, pp. 146–153. Available online: https://www.jma.go.jp/jma/kishou/books/yohkens/24/chapter7.pdf(In Japanese). (accessed on 15 June 2023). (In Japanese)
  31. Li, P.W.; Wong, W.K.; Cheung, P.; Yeung, H.Y. An overview of nowcasting development, applications, and services in the Hong Kong Observatory. J. Meteorol. Res. 2014, 28, 859–876. [Google Scholar] [CrossRef]
  32. Ridwan, W.M.; Sapitang, M.; Aziz, A.; Kushiar, K.F.; Ahmed, A.N.; El-Shafie, A. Rainfall forecasting model using machine learning methods: Case study Terengganu, Malaysia. Ain Shams Eng. J. 2021, 12, 1651–1663. [Google Scholar] [CrossRef]
  33. Mohamadi, S.; Sheikh, K.Z.; Ehteram, M.; Ahmed, A.N.; El-Shafie, A. Rainfall prediction using multiple inclusive models and large climate indices. Environ. Sci. Pollut. Res. Int. 2022, 29, 85312–85349. [Google Scholar] [CrossRef] [PubMed]
  34. Salaeh, N.; Ditthakit, P.; Pinthong, S.; Hasan, M.A.; Islam, S.; Mohammadi, B.; Linh, N.T.T. Long-Short Term Memory Technique for Monthly Rainfall Prediction in Thale Sap Songkhla River Basin, Thailand. Symmetry 2022, 14, 1599. [Google Scholar] [CrossRef]
  35. Shi, X.; Chen, Z.; Wang, H.; Yeung, D.Y.; Wong, W.K.; Woo, W.C. Convolutional LSTM network: A machine learning approach for precipitation nowcasting. Adv. Neural Inf. Process. Syst. 2015, 28, 802–810. [Google Scholar]
  36. Shi, E.; Li, Q.; Gu, D.; Zhao, Z. A method of weather radar echo extrapolation based on convolutional neural networks. In MultiMedia Modeling, Proceedings of the 24th International Conference, MMM 2018, Bangkok, Thailand, 5–7 February 2018; Springer: Berlin/Heidelberg, Germany, 2018; pp. 16–28. [Google Scholar] [CrossRef]
  37. Akbari Asanjan, A.; Yang, T.; Hsu, K.; Sorooshian, S.; Lin, J.; Peng, Q. Short-term precipitation forecast based on the PERSIANN system and LSTM recurrent neural networks. J. Geophys. Res. Atmos. 2018, 123, 12543–12563. [Google Scholar] [CrossRef]
  38. Kim, D.-K.; Suezawa, T.; Mega, T.; Kikuchi, H.; Yoshikawa, E.; Baron, P.; Ushio, T. Improving precipitation nowcasting using a three-dimensional convolutional neural network model from Multi Parameter Phased Array Weather Radar observations. Atmos. Res. 2021, 262, 105774. [Google Scholar] [CrossRef]
  39. Liu, J.; Xu, L.; Chen, N. A spatiotemporal deep learning model ST-LSTM-SA for hourly rainfall forecasting using radar echo images. J. Hydrol. 2022, 609, 127748. [Google Scholar] [CrossRef]
  40. Zhang, W.; Han, L.; Sun, J.; Guo, H.; Dai, J. Application of multi-channel 3D-cube successive convolution network for convective storm nowcasting. In Proceedings of the 2019 IEEE International Conference on Big Data (Big Data), Los Angeles, CA, USA, 9–12 December 2019; pp. 1705–1710. [Google Scholar] [CrossRef] [Green Version]
  41. Zheng, K.; Liu, Y.; Zhang, J.; Luo, C.; Tang, S.; Ruan, H.; Tan, Q.; Yi, Y.; Ran, X. A generative adversarial model for radar echo extrapolation based on convolutional recurrent units. Geosci. Model Dev. Discuss. 2022, 15, 1467–1475. [Google Scholar] [CrossRef]
  42. Choi, Y.; Cha, K.; Back, M.; Choi, H.; Jeon, T. RAIN-F: A fusion dataset for rainfall prediction using convolutional neural network. In Proceedings of the 2021 IEEE International Geoscience and Remote Sensing Symposium IGARSS, Brussels, Belgium, 11–16 July 2021; pp. 7145–7148. [Google Scholar] [CrossRef]
  43. World Meteorological Organization. Guidelines on High-Resolution Numerical Weather Prediction (WMO-No. 1311); World Meteorological Organization: Geneva, Switzerland, 2023; Available online: https://library.wmo.int/doc_num.php?explnum_id=11654 (accessed on 17 July 2023).
  44. Skamarock, W.C.; Klemp, J.B.; Dudhia, J.; Gill, D.O.; Barker, D.; Duda, M.G.; Huang, X.Y.; Wang, W.; Powers, J.G. A Description of the Advanced Research WRF Version 3 (No. NCAR/TN-475+STR); University Corporation for Atmospheric Research: Boulder, CO, USA, 2008. [Google Scholar] [CrossRef]
  45. Descombes, G.; Auligné, T.; Vandenberghe, F.; Barker, D.M.; Barré, J. Generalized background error covariance matrix model (GEN-BE v2.0). Geosci. Model Dev. 2015, 8, 669–696. [Google Scholar] [CrossRef] [Green Version]
  46. Parrish, D.F.; Derber, J.C. The National Meteorological Center’s spectral statistical-interpolation analysis system. Mon. Weather Rev. 1992, 120, 1747–1763. [Google Scholar] [CrossRef]
  47. Colle, B.A.; Garvert, M.F.; Wolfe, J.B.; Mass, C.F.; Woods, C.P. The 13–14 December 2001 IMPROVE-2 Event. Part III: Simulated Microphysical Budgets and Sensitivity Studies. J. Atmos. Sci. 2005, 62, 3535–3558. [Google Scholar] [CrossRef]
  48. Woo, W.C.; Wong, W.K. Operational application of optical flow techniques to radar-based rainfall nowcasting. Atmosphere 2017, 8, 48. [Google Scholar] [CrossRef] [Green Version]
  49. Yik, D.J.; Sang, Y.W.; Chang, N.K.; Fakaruddin, F.J.; Dindang, A.; Abdullah, M.H. Analysis of the cyclonic vortex and evaluation of the performance of the radar integrated nowcasting system (RaINS) during the heavy rainfall episode which caused flooding in Penang, Malaysia on 5 November 2017. Trop. Cyclone Res. Rev. 2018, 7, 217–229. [Google Scholar]
  50. Srivastava, K.; Lau, S.; Kong Observatory, H.; Bhardwaj, R.; Singh, B.; Kannan, A.M.; Lau, S.S.Y.; Yeung, H.Y.; Cheng, T.L.; Kannan, A.M.; et al. Use of SWIRLS nowcasting system for quantitative precipitation forecast using Indian DWR data. MAUSAM 2012, 63, 1–16. [Google Scholar] [CrossRef]
  51. Woo, W.C.; Li, K.K.; Bala, M. An Algorithm to Enhance nowcast of rainfall brought by tropical cyclones through separation of motions. Trop. Cyclone Res. Rev. 2014, 3, 111–121. [Google Scholar] [CrossRef]
  52. Cheung, P.; Yeung, H.Y. Application of optical-flow technique to significant convection nowcast for terminal areas in Hong Kong. In Proceedings of the 3rd WMO International Symposium on Nowcasting and Very Short-Range Forecasting (WSN12), Rio de Janeiro, Brazil, 6–10 August 2012; p. 10. [Google Scholar]
  53. Wong, W.K.; Yeung, L.H.; Wang, Y.C.; Chen, M. Towards the blending of NWP with nowcast—Operation experience in B08FDP. In Proceedings of the WMO Symposium on Nowcasting, Whistler, BC, Canada, 30 August–4 September 2009; p. 14. [Google Scholar]
  54. Germann, U.; Zawadzki, I. Scale-dependence of the predictability of precipitation from continental radar images. Part I: Description of the methodology. Mon. Weather Rev. 2002, 130, 2859–2873. [Google Scholar] [CrossRef]
  55. Bruhn, A.; Weickert, J.; Feddern, C.; Kohlberger, T.; Schnörr, C. Real-time optic flow computation with variational methods. In Proceedings of the CAIP, Groningen, The Netherlands, 25–27 August 2003; pp. 222–229. [Google Scholar]
  56. Bennett, J.A.; Fang, D.J.; Boston, R.C. The relationship between N 0 and Λ for Marshall–Palmer type raindrop-size distributions. J. Clim. Appl. Meteorol. 1984, 23, 768–771. [Google Scholar] [CrossRef]
  57. Saito, K.; Tien, D.D.; Hung, M.K.; Duc, L. Heavy Rainfall Event in Central Viet Nam in December 2018 and QPE/QPF at VNMHA. In Proceedings of the 100th American Meteorological Society Annual Meeting, Boston, MA, USA, 11–16 January 2020; Available online: https://ams.confex.com/ams/2020Annual/webprogram/Paper362941.html (accessed on 15 June 2023).
  58. Kimpara, C.; Tonouchi, M.; Hoa, B.T.K.; Hung, N.V.; Cuong, N.M.; Akaeda, K. Quantitative Precipitation Estimation by Combining Rain gauge and Meteorological Radar Network in Viet Nam. Vietnam J. Hydrometeorol. 2020, 5, 36–50. [Google Scholar] [CrossRef]
  59. Wilks, D.S. Statistical Methods in the Atmospheric Sciences, 2nd ed.; Elsevier Academic Press: New York, NY, USA, 2006; 630p, ISBN 9780123850225/9780123850232. [Google Scholar]
  60. Wang, H.; Yang, J.; Zhu, J.; Ren, L.; Liu, Y.; Li, W.; Chen, C. Estimation of Significant Wave Heights from ASCAT Scatterometer Data via Deep Learning Network. Remote Sens. 2021, 13, 195. [Google Scholar] [CrossRef]
  61. Tang, J.; Matyas, C. A nowcasting model for tropical cyclone precipitation regions based on the TREC motion vector retrieval with a semi-Lagrangian scheme for Doppler weather radar. Atmosphere 2018, 9, 200. [Google Scholar] [CrossRef] [Green Version]
  62. Hersbach, H.; Bell, B.; Berrisford, P.; Horányi, A.; Sabater, J.M.; Nicolas, J.; Radu, R.; Schepers, D.; Simmons, A.; Cornel Soci, D.D. Global reanalysis: Goodbye ERA-interim, hello ERA5. ECMWF Newsl. 2019, 159, 17–24. [Google Scholar] [CrossRef]
  63. Zhang, J.; Howard, K.W.; Langston, C.; Kaney, B.; Qi, Y.; Tang, L.; Grams, H.; Wang, Y.; Cocks, S.; Martinaitis, S.M.; et al. Multi-Radar Multi-Sensor (MRMS) quantitative precipitation estimation: Initial operating capabilities. Bull. Am. Meteorol. Soc. 2016, 97, 621–638. [Google Scholar] [CrossRef]
Figure 1. The flowchart for generating blended radar–NWP forecasts in this research.
Atmosphere 14 01201 g001
Figure 2. The distribution of AWSs (blue dots) and radar stations used in this research. Red dots and corresponding circles are locations of radar sites and horizontal radar coverages.
Atmosphere 14 01201 g002
Figure 3. Ocean surface satellite winds at the time when the storm ETAU approached to the coast of the south center of Vietnam on 10 November 2020 (source https://manati.star.nesdis.noaa.gov, accessed on 15 June 2023).
Atmosphere 14 01201 g003
Figure 4. Reflectivity nowcasting (dBZ) for the tropical cyclone ETAU on 10 November 2020 issued at three different times (the 1st row is for 09:00 Local Standard Time (LST), the 2nd row is for 09:10 LST, and the 3rd row is for 09:20 LST). The 1st column is the initial derived motion field, and the 2nd and 3rd columns are nowcasting for 1 h and 2 h forecast range products, respectively.
Atmosphere 14 01201 g004
Figure 5. Maps of 06 h accumulated rainfall (unit: mm): (a) AWS rain from 06Z to 12Z 23 September 2021; (b) AWS rain from 12Z to 18Z 27 September 2022; (c) AWS rain from 12Z to 18Z 14 October 2022; (d) WRF-ARW forecast issued at 06Z 23 September 2021 for TC DIANMU; (e) WRF-ARW forecast issued at 12Z 27 September 2022 for TC NORU; (f) WRF-ARW forecast issued at 12Z 14 October 2022 for TC SONCA.
Atmosphere 14 01201 g005
Figure 6. ETS charts for three TC cases (1st, 2nd, and 3rd column are for DIANMU, NORU, and SONCA, respectively) under different thresholds (0.1 mm to 30 mm/1 h, x-axis on each chart) for 1 h (1st row) up to 6 h (6th row) forecast time (FT) of WRF-ARW, SWIRLS, and blended between SWIRLS and WRF-ARW (denoted as NWP_QPF (red), SWIRLS (green), and SWIRLS_NWP (orange), respectively).
Atmosphere 14 01201 g006
Figure 7. Same as Figure 6 but for POD scores.
Atmosphere 14 01201 g007
Figure 8. Forecast reflectivity (in dBZ) from SWIRLS (left column), NWP forecast from WRF-ARW (middle column), and blended product (right column) for +1 h (first row), +2 h (second row), and +3 h (third row) forecast ranges for TC DIANMU in forecast cycle 00Z 23 September 2021.
Atmosphere 14 01201 g008
Figure 9. Same as Figure 8 but for forecast rainfall (in mm) for TC DIANMU in forecast cycle 00Z 23 September 2021.
Atmosphere 14 01201 g009
Figure 10. Same as Figure 8 but for TC NORU in the forecast cycle 00Z 27 September 2022.
Atmosphere 14 01201 g010
Figure 11. Same as Figure 8 but for TC SONCA in the forecast cycle 12Z 14 October 2022.
Atmosphere 14 01201 g011
Table 1. List of the forecast cycles relating to tropical cyclone events used in this research.
Tropical Cyclone NameForecast Cycles
DIANMU00Z, 06Z and 12Z on 23 September 2021
NORU00Z, 06Z and 12Z on 27 September 2022
SONCA00Z, 06Z and 12Z on 14 October 2022
Table 2. Skill scores of SWIRLS performances for 3 TCs under different thresholds (mm) per hour.
ThresholdsForecast TimeDIANMUNORUSONCA
TSETSPODFARTSETSPODFARTSETSPODFAR
1 mm+1 h0.320.200.680.620.380.270.790.570.430.280.750.49
+2 h0.310.170.660.640.370.240.810.600.440.280.810.51
+3 h0.280.140.630.660.350.210.770.610.400.250.790.56
5 mm+1 h0.260.210.700.700.310.250.760.660.320.250.640.62
+2 h0.200.140.670.780.240.170.850.750.230.140.680.74
+3 h0.200.120.630.780.240.160.760.740.220.130.630.75
10 mm+1 h0.120.100.450.860.140.120.420.830.180.150.400.75
+2 h0.100.070.590.890.140.110.690.850.180.140.610.80
+3 h0.110.070.540.880.170.120.620.810.180.120.570.80
15 mm+1 h0.060.050.250.920.120.110.300.840.150.140.330.77
+2 h0.070.050.470.930.100.080.560.890.170.140.540.80
+3 h0.080.060.520.910.130.100.560.860.150.110.450.82
20 mm+1 h0.080.080.210.880.080.080.170.860.130.120.240.78
+2 h0.060.050.450.930.100.080.410.890.170.150.540.81
+3 h0.060.040.400.930.070.050.330.920.110.090.320.85
Disclaimer/Publisher’s Note: The statements, opinions and data contained in all publications are solely those of the individual author(s) and contributor(s) and not of MDPI and/or the editor(s). MDPI and/or the editor(s) disclaim responsibility for any injury to people or property resulting from any ideas, methods, instructions or products referred to in the content.

