Review

Impact of Modern Vehicular Technologies and Emission Regulations on Improving Global Air Quality

by
Sai Sudharshan Ravi
1,*,
Sergey Osipov
2 and
James W. G. Turner
1
1
Clean Combustion Research Centre, King Abdullah University of Science & Technology, Thuwal 23955, Saudi Arabia
2
Atmospheric and Climate Modeling Research Group, King Abdullah University of Science & Technology, Thuwal 23955, Saudi Arabia
*
Author to whom correspondence should be addressed.
Atmosphere 2023, 14(7), 1164; https://doi.org/10.3390/atmos14071164
Submission received: 19 May 2023 / Revised: 18 June 2023 / Accepted: 28 June 2023 / Published: 18 July 2023

Abstract

:
Over the past few decades, criteria emissions such as carbon monoxide (CO), hydrocarbons (HCs), nitrogen oxides (NOx) and particulate matter (PM) from transportation have decreased significantly, thanks to stricter emission standards and the widespread adoption of cleaner technologies. While air quality is a complex problem that is not solely dependent on transportation emissions, it does play a significant role in both regional and global air quality levels. Emission standards such as Euro 1–6 in Europe, Corporate Average Fuel Economy (CAFE) regulations, Tier I—III standards in the US and the low emission vehicle (LEV) program in California have all played a huge role in bringing down transportation emissions and hence improving air quality overall. This article reviews the effect of emissions from transportation, primarily focusing on criteria emissions from road transport emissions and highlights the impact of some of the novel technological advances that have historically helped meet these strict emission norms. The review also notes how modern road engine vehicles emissions compare with national and international aviation and shipping and discusses some of the suggested Euro 7 emissions standards and their potential to improve air quality.

1. Introduction

The urban air quality issue is very complicated and is traditionally associated with emissions from combustion [1,2,3]. These emissions can include both gaseous pollutants and particulates that can adversely affect air quality, climate change and human health [4,5]. Vehicular emissions, especially from combustion, have significantly affected air quality [6]. Over the past 50 years, emissions from road vehicles have decreased significantly due to the introduction of increasingly stricter emission standards [7,8] and the widespread adoption of cleaner emissions-reduction technologies such as the three-way catalytic converter and hybrid vehicles. The primary pollutants of concern, which are regulated by governments around the world, are oxides of nitrogen (NOx), hydrocarbons (HCs), particulate matter (PM), and carbon monoxide (CO) [9]. In addition, the use of catalytic converters, which convert harmful pollutants into less toxic substances before they are released into the atmosphere, has become widespread [10]. Different emissions standards are used across the world to regulate motor vehicle emissions. European emission standards are regulations put in place by the European Union (EU) to limit the amount of pollutants that can be released into the atmosphere by road vehicles. The standards are termed “Euro” and numbered 1 to 6, with each new standard becoming more stringent in terms of emissions’ limits. Euro 6d is the latest and most stringent set of EU regulations for limiting the emission of pollutants from vehicles [11]. It was introduced in January 2021 and applies to all new vehicles (MY2021) sold in the EU. In the United States, the Environmental Protection Agency (EPA) is responsible for setting and enforcing emissions standards for vehicles. These standards apply to cars, trucks and other vehicles with engines. The EPA has established a series of emissions standards for vehicles, known as the Tier system. The Tier standards are similar in concept to the Euro emissions standards and are designed to limit the amount of pollutants that vehicles can release into the atmosphere [12]. The most recent and stringent set of standards (Tier 3, introduced in 2017) has lower limits for all pollutants, particularly NOx and PM, and introduced real-world emissions testing [13]. In the state of California, however, the California Air Resources Board (CARB) established its separate low-emission vehicle (LEV) program, which is a set of regulations aimed at reducing vehicle emissions and improving air quality in the state [14]. The LEV program sets standards for the amount of pollutants that vehicles can emit into the atmosphere, including CO, HC, NOx and PM. The LEV program has been successful in reducing emissions from vehicles and improving air quality in California. It has also served as a model for other states and countries that are looking to implement similar programs. The aim of the LEV program is to protect public health and the environment by reducing emissions from vehicles and promoting the use of clean and efficient transportation options [15]. In just over a decade, there has been significant progress in establishing global standards for greenhouse gas (GHG) emissions and fuel economy for light-duty vehicles (LDVs). By analyzing the characteristics of vehicle fleets in major markets and the policy impact of fuel economy standards on transport GHG emissions worldwide (see Figure 1a), it is evident that the growing disparity between real-world and official fuel economy/CO2 emission values is a pressing concern. This gap undermines the legitimacy and actual benefits of the standards [16]. The direct correlation between CO2 emissions and fuel consumption is a result of the carbon intensity of the fuel; although there is potential for further reductions in GHG emissions as we shift to decarbonized fuels, this paper will only address the impact of criteria emissions on air quality. Comparing the case of Santa Maria-Santa Barbara in California that has had a “good” air quality index since 1980 with that of Delhi (see Figure 1b) gives us as an understanding of the air quality trends in developed and developing economies [17]. While the overall PM10 concentration in the atmosphere cannot be ascribed only to transportation, it does seem to have good bearing on the overall air quality. While the PM10 concentrations in Delhi seem to have decreased over the years [18], thanks to various measures such as the odd–even traffic rationing scheme, promoting the use of electric vehicles and the use of CNG in public transport, the issue of air quality is still persistent due to the continued reliance on fossil resources by the legacy fleet and this is likely to be a huge concern in most of the developing economies that demands action to manage the existing infrastructure to meet the current emission standards.
Because of these increasingly stringent emission norms, overall emissions from road vehicles have decreased, leading to improved air quality and reduced health impacts. Despite this progress, air pollution from vehicles remains a major issue [5,20,21,22] in many urban areas and efforts are ongoing to further reduce emissions and promote sustainable transportation options. Air quality trends have varied depending on the region and the specific pollutants being considered. In many developed countries, air quality has generally improved over the past few decades due to increased regulations and efforts to reduce emissions from industry and power plants, as well as from transportation [23,24]. This has led to reductions in harmful emissions’ pollutants such as lead, sulfur dioxide and PM which might otherwise adversely impact health [25,26,27]. However, in some regions, air quality remains a major concern. Rapidly industrializing countries, such as China and India, continue to experience significant air pollution problems due to the rapid growth of their economies and the associated increase in emissions from industry and transportation [6,28,29,30,31,32]. In addition, emissions from sources such as wildfires and agricultural practices can also have a significant impact on air quality, which makes them a critical environmental and public health issue, and continued efforts are needed to reduce emissions and improve air quality for current and future generations. However, in this review article, we consider only transportation emissions (primarily NOx, HCs and CO) and their effect on overall air quality. This article critically reviews some of the novel concepts such as three-way catalytic converters, downsizing, direct injection for gasoline engines, engine stop–start technology and powertrain hybridization that have brought down emissions in recent years and notes that modern internal combustion engines (ICEs) typically have lower exhaust emissions than battery electric vehicles’ upstream emissions which, despite improving the air quality, do not necessarily help with improving global air quality. However, this will largely depend on the electricity mix. This article also discusses some of the proposed standards for implementation in the Euro emission regulations and suggests future action for improving overall global air quality.

2. Emissions Regulations

Currently, the primary focus of transportation emission regulations is on reducing the emissions of greenhouse gases (other than criteria emissions), such as carbon dioxide, which contribute to climate change. In many countries, including the United States [33] and European Union [34], vehicle manufacturers are required to meet specific emissions standards for their vehicles. The regulations may also include requirements for the use of cleaner fuels, such as low-sulfur gasoline or diesel [35,36], and may include incentives for the development and production of electric or hybrid vehicles [37]. Overall, transportation emission regulations play a crucial role in reducing air pollution and mitigating the effects of climate change [38]. They help to promote the use of cleaner, more efficient technologies and encourage the development of new, more sustainable forms of transportation.

2.1. Current Emission Limits

The European emission standards were introduced in the year 1992 and have been constantly refined over the years with constantly reducing limits on different criteria emissions. The emission limits for each of these pollutants are listed in Table 1. In Europe, the latest emission standard in place is Euro 6d which is a set of emissions standards for vehicles that was introduced by the European Union in January 2021. Therefore, the model year (MY) for Euro 6d compliant vehicles is 2021 and later for passenger cars and light commercial vehicles sold in the European Union. It sets limits on HCs, CO, NOx, PN and PM that can be released into the air from the exhaust. To meet the Euro 6d standard, vehicles must be equipped with advanced exhaust after-treatment systems such as selective catalytic reduction (SCR) [39,40,41] and DPFs [42,43], as well as on-board diagnostic systems that continuously monitor the performance of the emission control systems. The Euro 6d standard is part of a broader effort to improve air quality in the EU and to reduce the health impacts of air pollution, which is a major contributor to respiratory diseases, heart disease and premature deaths. The different stages of the Euro 6 regulations are tabulated in Table 2. Each new standard, represented by a Euro stage, builds on the previous one, introducing more rigorous requirements for various pollutants. The latest Euro 6e-bis standard includes even stricter emissions limits, with extended ambient conditions for real-world driving emissions (RDE) compliance, updated utility factor and on-board fuel/electric energy consumption monitoring (FCM) for certain vehicle categories. RDE testing is a key component of the Euro standards, aimed at ensuring that vehicles meet emissions limits not only in the laboratory but also on the road. RDE testing involves measuring emissions during real-world driving conditions, using a portable emissions measurement system (PEMS) that is installed on the vehicle. The PEMS measures the levels of pollutants such as nitrogen oxides (NOx), PM and PN that are emitted from the vehicle’s exhaust. The RDE testing provides a less repeatable but more realistic assessment of a vehicle’s emissions performance, as it takes into account factors such as driving style, road conditions and temperature that can affect emissions. The Euro 6d standard introduced RDE testing against ‘final’ conformity factors, with reduced limits for NOx and PM emissions, and revised the evaporative emissions test procedure. Some of these regulations are also specific to the vehicle size and design. In the context of the Euro emissions standards, M1 and N1 are vehicle categories based on their weight and design. M1 refers to vehicles with no more than eight passenger seats and a maximum weight lower than 3500 kg, and includes passenger cars, minivans and SUVs. N1 refers to vehicles with a maximum weight lower than 3500 kg that are designed and constructed for the carriage of goods, and includes vans and light commercial vehicles.
Similar to the European emission standards, the US EPA has its Tier system. The current US tier for vehicles is Tier 3. The Tier 3 standards [44,45,46] were finalized by the Environmental Protection Agency (EPA) in 2014 and apply to light-duty vehicles and some medium-duty passenger vehicles. The emissions limits for each of the criteria pollutants in this system are listed in Table 3. The California Air Regulatory Board (CARB) established its own standards through the low emission vehicle program (LEV) which has its own set of limits for the emissions from vehicles that were being sold in California. These limits are summarized in Table 4 and Table 5. Thus, in summary, Tier 3, Euro 6e-bis-FCM, and LEV IV regulations all aim to reduce the emissions of harmful pollutants from vehicles, but they differ in their specific requirements and standards. Tier 3 regulations also include requirements for on-board diagnostic systems, which help to detect and address issues that could affect emissions performance. The Euro 6e-bis-FCM regulation, which applies to vehicles in the European Union, sets even stricter limits on emissions of NOx and particulate matter compared to previous Euro 6 regulations. It also includes requirements for an updated utility factor for vehicles with off-vehicle charging using FCM data [47]. LEV IV regulations also include requirements for on-board diagnostic systems, and they also set standards for zero-emission vehicle (ZEV) sales in certain states [11,48].
Overall, the common theme among these regulations is the focus on reducing emissions of harmful pollutants from vehicles to improve air quality and human health [49,50]. They also all include requirements for on-board diagnostic systems to ensure that vehicles continue to meet emissions standards over their lifetime. However, there are differences in the specific pollutants targeted and the standards set, as well as the additional requirements such as on-board fuel/electric energy consumption monitoring and ZEV sales targets.
Table 3. EPA emission standards for passenger cars Tier 1–Tier 3 [51].
StageYearCOTHCNOx (Diesel)NOx (Gasoline)PM NMHC
g/kmg/kmg/kmg/kmg/kmg/km
Tier 1 (50,000 miles/5 years)19912.110.250.620.250.05 *0.16
Tier 1 (100,000 miles/10 years)19912.61-0.780.370.060.19
Tier 219991.30.060.040.040.010.06
Tier 320140.620.03420.0180.0180.0030.024
* only for diesel.
Table 4. CARB LEV I and II standards for passenger cars [52].
StageCategory50,000 m/5 Years100,000 m/10 Years
NMOGa
g/mi
CO
g/mi
NOx
g/mi
PM
g/mi
HCHO
mg/mi
NMOGa
g/mi
CO
g/mi
NOx
g/mi
PM
g/mi
HCHO
mg/mi
LEV ITier 10.253.40.40.08-0.314.20.6--
TLEV0.1253.40.4-0.0150.1564.20.60.080.018
LEV0.0753.40.2-0.0150.094.20.30.080.018
ULEV0.041.70.2-0.0080.0552.10.30.040.011
LEV IILEV0.0753.40.05-0.0150.094.20.070.010.018
ULEV0.041.70.05-0.0080.0552.10.070.010.011
SULEV-----0.0110.020.010.004
Table 5. CARB LEV III and IV standards for passenger cars [52].
StageEmission CategoryNMOG + NOx COHCHOPM
g/mig/mimg/mig/mi
LEV IIILEV1600.164.240.01
ULEV1250.1252.140.01
ULEV700.071.740.01
ULEV500.051.740.01
SULEV300.03140.01
SULEV200.02140.01
ULEV1250.125/0.1604.2 0.01
LEV IVULEV700.070/0.1052.1
ULEV600.060/0.0901.7
ULEV500.050/0.0701.7
ULEV400.040/0.0601.7
SULEV300.030/0.0501
SULEV250.025/0.0501
SULEV200.020/0.0301
SULEV150.015/0.0301

2.2. Comments on the Proposed Euro 7 Regulations

The Euro 7 emission standard is currently being developed and is expected to be introduced in the European Union in 2025. While the exact requirements of Euro 7 are not yet finalized, some of the key changes that might come with this new system include stricter emissions limits. In 2025, Euro 7 will mandate lower NOx and particle emissions from cars, vans, buses and lorries. Compared to Euro 6, NOx emissions will be reduced by 35% for cars and vans, and by 56% for buses and lorries. Particle emissions from the tailpipe will be reduced by 13% for cars and vans, and 39% for buses and lorries while particles from car brakes will be lowered by 27% [53]. In Figure 2, PM and NOx emissions reduction levels between different Euro regulations can be seen. As we move towards Euro 7 [54], we would inch closer towards the origin in this figure.
All Euro 7 vehicles will have to meet new or lower emissions limits, including for pollutants not previously regulated. The standard will require more representative driving conditions and improved durability of vehicles. Additionally, the Euro 7 standard will tackle brake and tire emissions, which are projected to become the main source of particle emissions from road transport. To simplify compliance checks with the new rules, new digital methods based on on-board sensors measuring emissions over the lifetime of the vehicle will be implemented [53]. The Euro 7 regulation is expected to further refine and strengthen RDE testing, which measures vehicle emissions under real-world driving conditions. This could include more comprehensive testing on the road and a greater focus on the emissions of pollutants such as ammonia, itself a byproduct of selective catalytic reduction (SCR) systems [41,55,56]. It is also expected to encourage the development and use of zero-emission vehicles (ZEVs) such as battery electric vehicles (BEVs) and hydrogen fuel cell vehicles [57]. This could include setting sales targets for ZEVs and providing incentives for consumers and manufacturers to adopt these vehicles [58]. Overall, the proposed regulation is expected to have a greater focus on air quality, with the aim of reducing the impact of vehicle emissions on public health [59]. It is worth noting that the details of Euro 7 are still being developed, and there may be further changes before the standard is finalized and implemented.
These standards are ambitious and will require significant technological advancements to meet the proposed limits. The proposed standards significantly lower the emission limits for NOx, PM, and other pollutants, and require more stringent testing procedures, on-board emissions’ monitoring and improved durability requirements. Meeting the proposed Euro 7 standards will be challenging for many automakers, especially considering that some of the proposed limits are lower than what is currently measurable. It is also important to note that the standards are not expected to come into effect until 2025 at the earliest, with full implementation not expected until 2035. While it is possible that the Euro 7 standards could indirectly lead to the end of internal combustion engines, it is also important to note that the proposal includes provisions for advanced internal combustion engines with improved after-treatment systems, as well as hybrid and plug-in hybrid powertrains.

3. Development of ICE Technologies for Emissions Mitigation

With advances in engine and emissions control technology, vehicular emissions have significantly decreased over the years [60,61]. The introduction of catalytic converters, diesel particulate filters and other emission control devices in the exhaust gas stream has helped to reduce emissions of harmful pollutants such as CO, HCs, NOx, and PM. Additionally, the adoption of fuel-efficient engines and powertrain technologies, such as engine downsizing and increasing hybridization of the powertrain, has also helped to reduce so-called “engine-out” emissions by improving combustion and reducing the amount of fuel consumed by vehicles. This section discusses some of these technologies and their role in emissions’ mitigation over the years.

3.1. Three-Way Catalytic Converters with Gasoline Engines

Three-way catalytic converters (TWCs) are an important component in the emission control systems of most modern gasoline-powered vehicles. They are called “three-way” because they are designed simultaneously to reduce three key pollutants in the vehicle’s exhaust gases: CO, HCs, and NOx [62,63,64]. TWCs use a combination of catalyst elements, such as platinum, palladium and rhodium, to facilitate chemical reactions that convert these pollutants into less harmful substances [10]. For example, CO2 and HCs are converted into carbon dioxide (CO2) and water (H2O), while NOx is converted into nitrogen (N2) and oxygen (O2) through a combination of reduction and oxidation reactions within the TWC [65]. The use of TWCs has been instrumental in reducing emissions from gasoline-powered vehicles and helping to improve air quality. However, TWCs are not perfect and can be affected by factors such as age [66], temperature [67,68] and the quality of the fuel used [69,70]. It is also critical to maintain the engine operation at a stoichiometric ratio as the catalytic converter is most efficient only in a narrow operating range around this value. When the engine is running rich (too much fuel/not enough air for complete combustion), there will not be enough oxygen available for complete combustion, and the excess fuel can cause the TWC to overheat and degrade due to excessive exothermicity within it. On the other hand, when the engine is running lean (too much air, not enough fuel), the high temperature of the exhaust gases under some operating conditions can cause the TWC to degrade and so reduce its effectiveness [71]. Figure 3 below shows the trend in exhaust emissions from the year 1970 to 2021 in the US. As can be seen in the graph, despite the increase in the utilization of fossil fuels, the CO, HCs and NOx emissions have dropped significantly, especially after the widespread adoption of the TWC in the 1990–2000 period.
Thermal management is also a critical aspect when it comes to managing the efficiency of the catalytic converter. Most of the emissions that arise from a gasoline engine occur before the catalyst reaches its “light-off” temperature [74]. This temperature is where the catalyst reaches 50% conversion of the original inlet exhaust gas [67]. ICEs reject almost 50% of the heat generated during the combustion process through the exhaust, coolant and lubricant oil. Gumus [75] used Na2SO4.0H2O as a heat storage material to preheat a 4-cylinder engine before it was switched on. The preheating was applied through the coolant and increased the engine temperature by 17.4 degrees Celsius, giving a 64% and 15% reduction in CO2 and HCs output, respectively. According to the study, the preheating of the engine did not have a particularly strong effect on the catalyst performance and suggests that the technique might be beneficially combined with catalyst preheating to further reduce engine cold-start emissions. Figure 4 shows the reduction in HC and CO2 emissions with engine preheating, and its impact on the catalyst temperatures from the study [76].
Aging also has a profound effect on catalytic convertors. A 2008 study that analyzed this effect on pre-TWC and underfloor TWC (u-TWC) showed different effects of aging in these systems. The specific surface area of the pre-TWC decreased dramatically from 42 m3/g to 3 m3/g. However, this did not lead to a complete deactivation of the catalyst. The catalyst is still active towards to CO2 and methane and the loss in activity is comparable with that of u-TWC which did not lose as much surface area post aging. However with methane, this effect is more pronounced. It was also noted that in the case of diesel oxidation catalysts, the effect was mainly to chemical aging but with TWCs, the aging due to thermal activity and chemical aging was not straightforward. The effect of thermal aging however, seemed stronger than chemical aging in this case [77].

3.2. Engine Downsizing

Generally, engine downsizing refers to the use of a smaller, pressure-charged engine in a vehicle as a means of improving fuel efficiency and reducing emissions versus an original-employed naturally aspirated one. This can yield a reduction in the charge consumption of an engine, which is the volume of air and fuel that the engine can process in each cycle. It can be achieved through various means such as reducing the number of cylinders or reducing the bore and stroke dimensions of each cylinder. Due to the reduction in the throttling loss associated with the 4-stroke Otto cycle, at part load and for equivalent load, smaller displacement engines consume less fuel, which leads to reduced emissions of pollutants such as CO, NOx and PM [78,79,80]. However, the reduction in engine swept volume would usually result in reduced power output. To overcome this, manufacturers use various technologies to maintain or even improve power output. For instance, turbocharging improves the volumetric efficiency of an engine, while also utilizing some of the waste heat from the exhaust gases to drive the air compression and pumping process. Some manufacturers choose direct injection strategies or a combination of the two (for example, BMW N63) because there are beneficial synergies. While downsizing offers a clear reduction in fuel consumption [81], and thereby a reduction in CO2 emissions, the effect of downsizing on the criteria emissions are largely dependent on the downsizing strategy being used in the engine. For example, heavily boosted engines can sometimes lead to more NOx emissions if not properly controlled [82].
In 2008, the European Union (EU) introduced the first CO2 emissions standards for passenger cars, which set a target of 130 g of CO2 per kilometer (g/km) for the average new car sold in the EU by 2015. The target was based on the weight of the vehicle, with heavier vehicles having a higher target. In 2014, the EU introduced the second phase of the standards, which set a target of 95 g/km for the average new car sold in the EU by 2021, again based on the weight of the vehicle. To achieve the targeted 95 g CO2/km [83,84,85] emissions level for vehicles with an average weight of 1372 kg, there must be a significant increase in the efficiency of combustion engines. However, this has also given rise to the unintentional rise in the heavier vehicles that are being sold in today’s market as they do not have to meet a stringent CO2 norm. This can be noted from the rise in the number of SUVs sold globally. This has resulted in an increase in both the oil demand and CO2. Between 2021 and 2022, the oil consumption of SUVs went up by 500,000 barrels per day, accounting for one-third of the total growth in oil demand. The CO2 emissions due to combustion in SUVs also increased by nearly 70 million tons in 2022 [86]. However, we will not discuss the emissions that rose as a result of this effect. One promising method currently being explored is downsizing in combination with part-load dethrottling, which has the potential to substantially reduce fuel consumption [87]. However, this approach could increase the complexity of turbocharged gasoline engines in future powertrains. While pressure charging and dethrottling can offer benefits in terms of fuel consumption, it also raises concerns around gasoline engine knock and auto-ignition as the level of charging increases. To address these issues, Miller cycle strategies can be used, which involve adjusting the timing of the intake valve closure to reduce pumping work and the effective compression ratio. This approach can help reduce the need for mixture enrichment and move towards meeting future Real Driving Emissions requirements [78].
Turbocharging has been widely used in gasoline direct injection (GDI) engines. Cucchi et al. [88] studied the effect of turbocharging on a Euro-IV compliant GDI engine and found that there was a clear difference in the particulate concentration before and after the start of pressure charging. In addition, as the load increases, there is a requirement for an increase in both the fuel injection pressure and injection duration which leads to the generation of many volatile particles. When these particles enter the turbocharger, they nucleate, while the centrifugal motion of exhaust gases in the turbocharger volute promotes the growth, agglomeration and fragmentation of micro-scale particles as well. Under low load conditions, the nucleation is limited leading to a limited particulate number (PN) after turbocharging, for the same total volume due to lower pressure. The dilution ratio (the ratio of the volume of fresh fuel-air mixture to the total volume inside the engine’s combustion chamber) also seems to have a huge bearing on the particulate emissions, but turbocharging had a substantial impact on particulate emissions irrespective of the dilution ratio [89].

3.2.1. Downsizing in Spark Ignition Engines

Downsized SI engines that are power boosted sometimes use port fuel injection methods. Oftentimes, these engines are mechanically supercharged for desired torque characteristics. An increase in power output by increasing the boost typically warrants additional measures to avoid engine knocking. Improved fuel consumption in SI engines achieved by downsizing is often achieved by utilizing technologies such as gasoline direct injection (GDI), Miller cycle operation, charge cooling and EGR combined with systematic charge motion. GDI is often used in conjunction with turbocharging as it offers synergistic advantages. Mixture homogenization improved through variable charge motion and stoichiometric operation helps realize downsizing in SI engine, as it allows usage of a three-way catalytic converter. Charge cooling and other measures to decrease the in-cylinder temperature are mostly beneficial in terms of engine knock. Miller cycle operation in SI engines where the inlet valve is closed when the desired charge is attained. This reduces the need to control engine load through throttling and makes lower compression and combustion temperatures possible. However, this strategy also requires higher boost pressures. This increases the demand on the charging system and also makes it necessary to use a variable valve train [90].

3.2.2. Downsizing in Compression Ignition Engines

Downsizing in CI engines has enabled a reduction in NOx and PM emissions despite increased power densities achieved through injection and boosting. Mixture preparation needs to be quick and intensive to ensure a cold start. A rise in the specific power to 70–80 kW/dm3 cannot be made possible without an increase in peak pressure (180–220 bar). The quality of the mixture, even with the larger injector operating range, needs improvement to meet future legislation. Thus, it can be expected that increased injection pressures, smaller nozzle diameters, variable nozzle geometries and pressure modulation will become inevitable. Low-end torque requirements in downsized CI engines are met by sequential turbocharging and regulated two-stage turbocharging. Typically, one of these turbochargers is smaller than the other and they are operational in different speed regions of the engine. Since this means additional engine components, it makes the overall engine a bit heavier and more expensive, thus offsetting some of the advantages it offers, which is especially true in the lighter road vehicles segment. Electric boosting or e-boosting can offer significant advantages by improving transient performance [90].

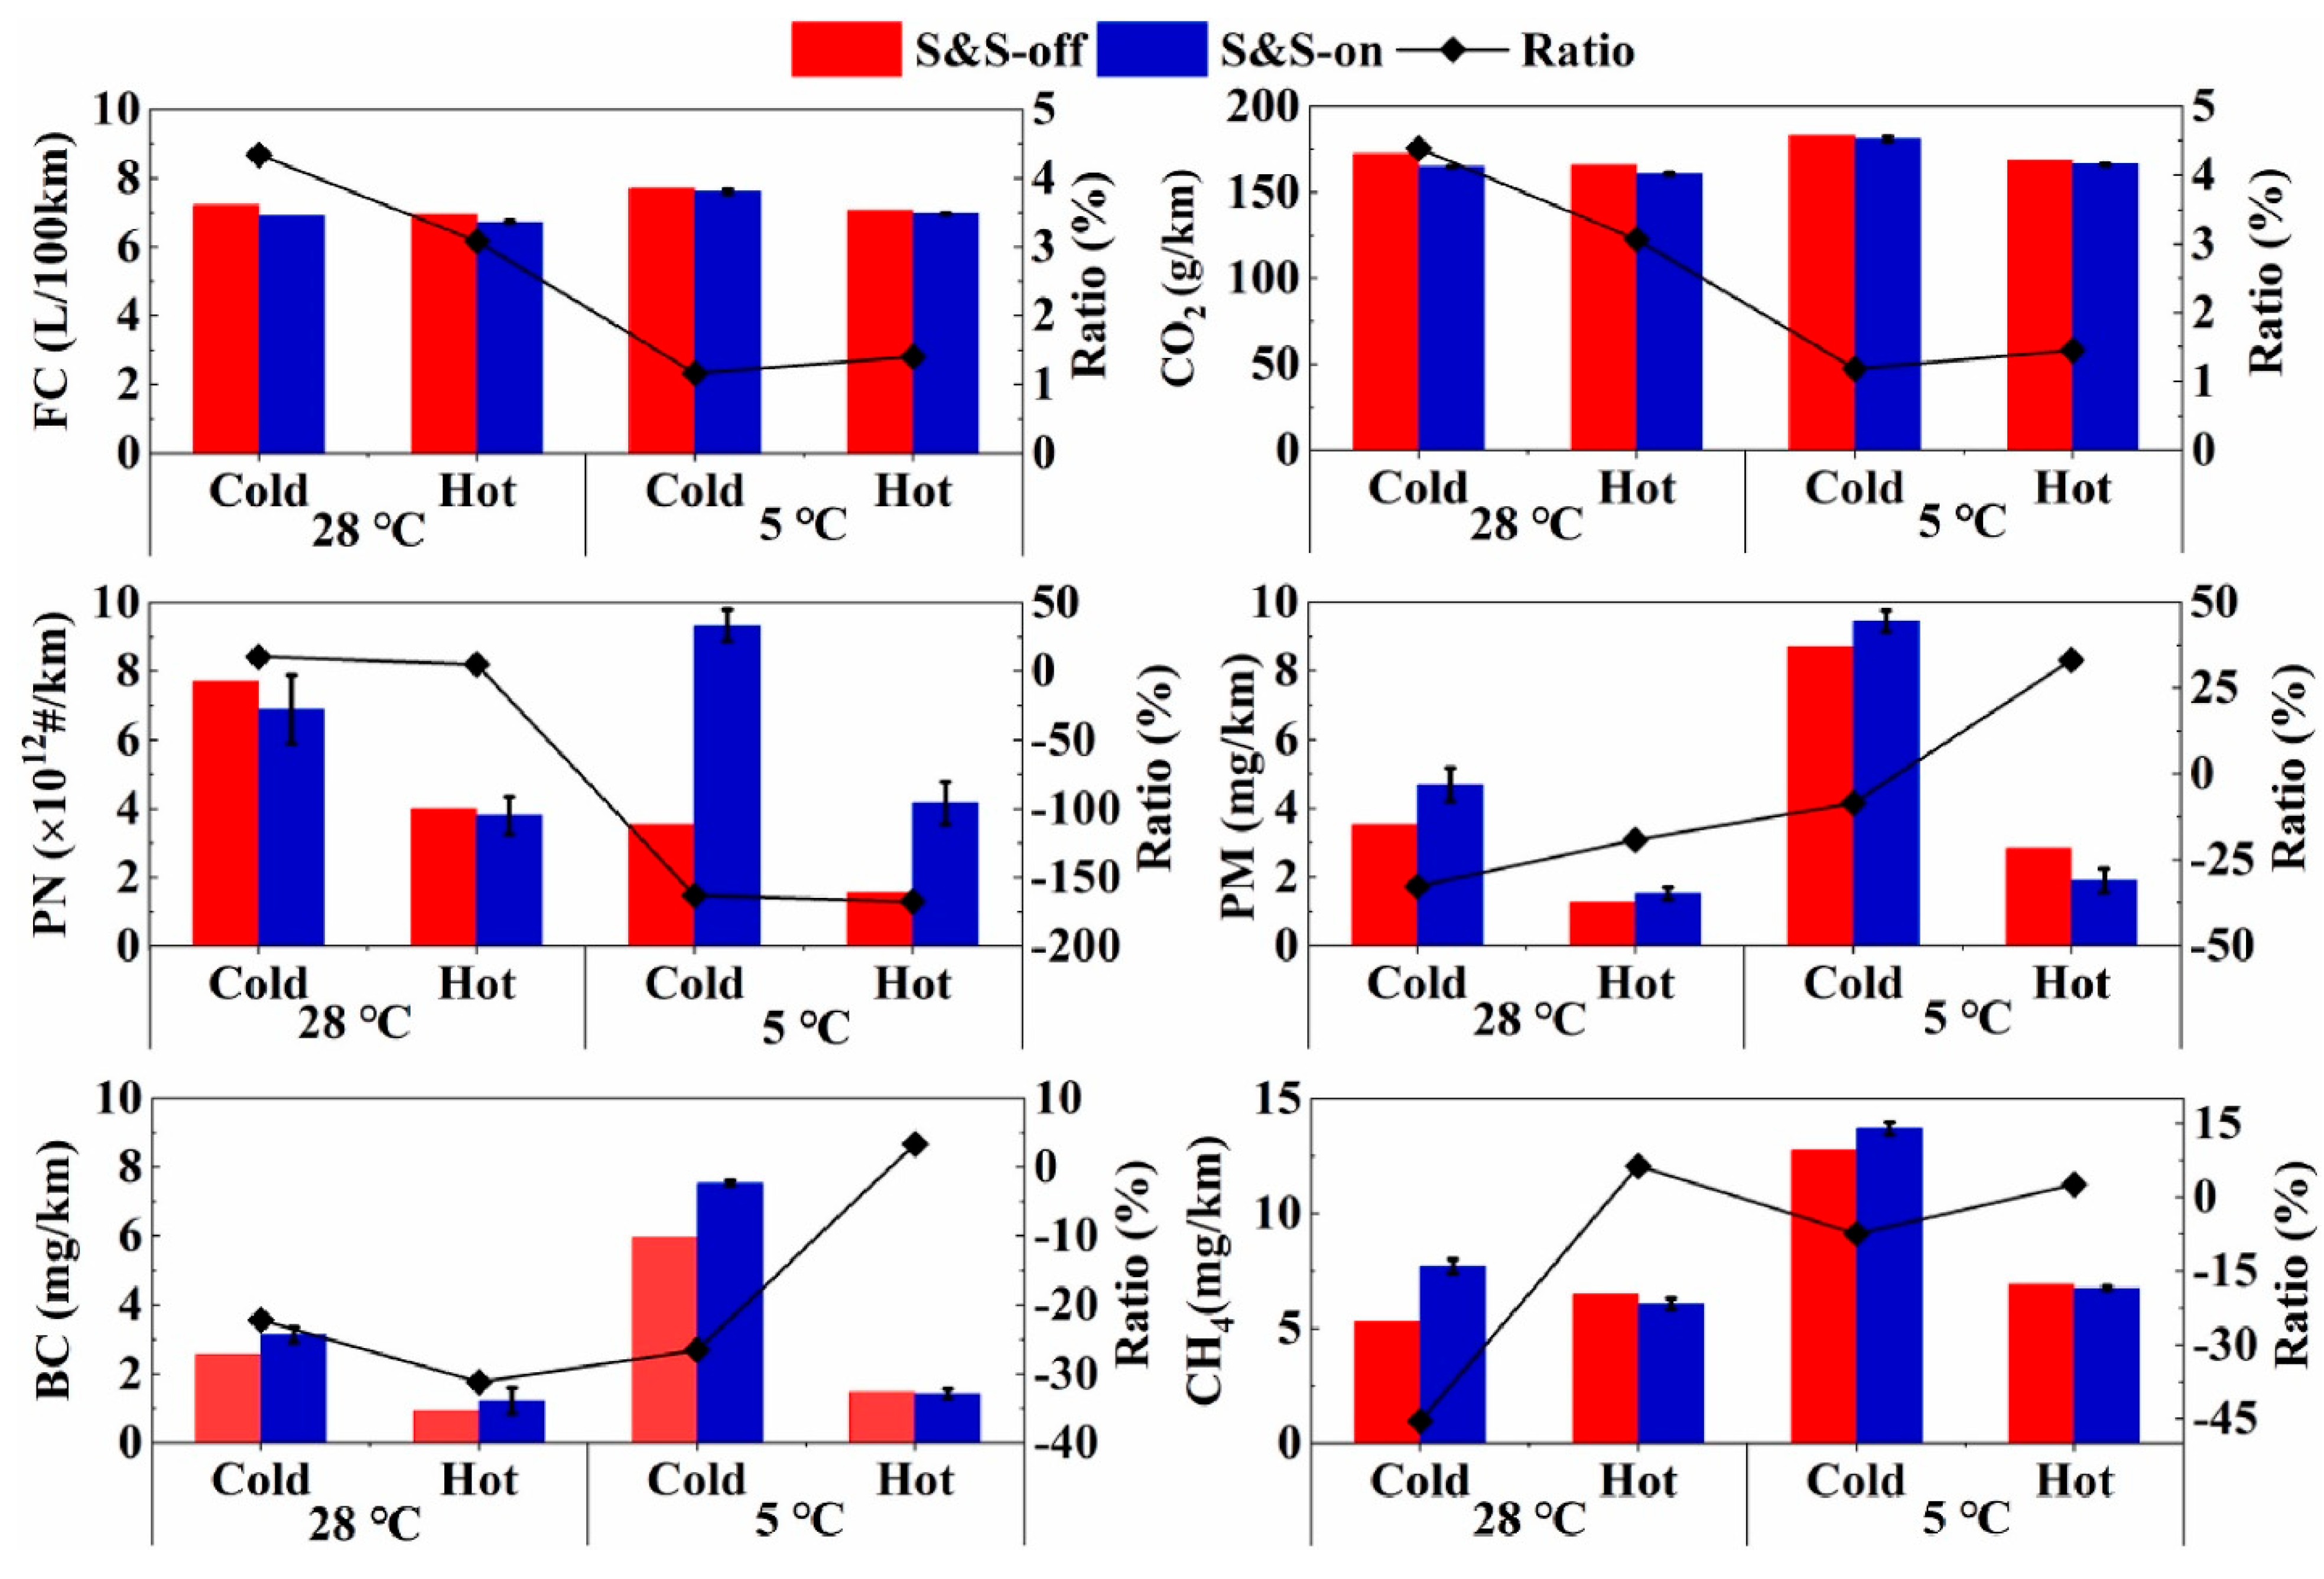
3.3. Engine Start-Stop Systems

The engine start–stop (S&S) system, also known as an idle–stop–start system, is usually employed in modern ICE vehicle emissions to reduce fuel consumption and thereby mitigate emissions’ production. This system automatically turns off the engine when it is idling and usually restarts the engine, as soon as the driver takes his foot off the brake pedal (automatic transmissions) or depresses the clutch pedal (manual transmissions). While this strategy effectively reduces CO2 emissions, its effect when it comes to criteria emissions, especially particulates, is not quite as desirable. Zhu et al. [91] tested the fuel consumption of a GDI vehicle on a chassis dynamometer, which revealed a 3.1–4.3% reduction in fuel consumption and a 3.1–4.4% reduction in CO2 emissions. However, it also showed a 19.2–32.8% spike in the PM emissions and a 21.8–31.8% increase in black carbon emissions, both due to the restart strategy. A comparison of the emissions and fuel consumption with and without the S&S system for cold and hot starts is shown in Figure 5.

3.4. Improvements with Injection Technologies

The practical solution for enhancing performance and decreasing emissions since the implementation of electronic fuel injection equipment has been through the utilization of higher injection pressures. Historically, for light-duty diesel engines, 1000 bar was deemed as high pressure for an inline or rotary pump system. However, more recently the injection pressure has habitually been elevated to levels exceeding 1600–1800 bar and sometimes even beyond 2000 bar. The high pressure could cause a reduction in spray droplet diameters and it leads to droplets (having velocities of up to 200 m/s) travelling further from the nozzle before they break up [92]. As injection pressure was increased from 720 to 960 bar, there was a decrease in PM emissions. When subsequently it was increased to 1220 bar, there was a further notable improvement. However, with a further increase to 1600 bar, the gain was relatively small. This was because the fuel pressure needed to reduce particulate matter could not compensate for the decline in BSFC due to the required driving torque. Additionally, a 3% increase in BSFC was necessary to maintain the NOx level at a constant level [93].
Advancing injection timing generally increases NOx emissions while improving fuel consumption and reducing CO2, HC and smoke emissions while retarding injection timing has an inverse effect. Injection rate shaping is recognized as a better strategy to reduce NOx and also combustion noise to some extent [94]. The nozzle geometry also plays a huge role in determining the cavitation flow regime and atomization. It is understood that as the nozzle hole diameter increases, there is an increase in fuel consumption. This results in an increase in the peak temperature and a decrease in engine torque. This is due to unfavorable combustion activity in the engine. The number of holes in a fixed-rate injector also plays a huge role when it comes to engine performance and pollutant emissions. Taghavifar et al. noted a 40% decrease in NOx concentrations in a D50H50 engine when the number of holes was increased from 1 to 6, however, this also resulted in an increase in CO2 emissions [95].

3.5. Hybridization of the Powertrain

Hybridization of a powertrain involves combining two or more power sources to provide propulsion for a vehicle. Typically, a hybrid powertrain combines an ICE with an electric motor and battery system. A hybrid powertrain can typically operate in various modes depending on the driving conditions and the driver’s behavior. In some situations, the electric motor alone can provide sufficient power to propel the vehicle, while in others, the ICE provides the necessary power. Additionally, both power sources can work together to provide maximum power or improve efficiency. Hybrid powertrains offer several advantages over traditional ICE powertrains, such as improved fuel efficiency, reduced emissions and better performance; this is due to the advantages of one power source mitigating the disadvantages of the other and vice-versa. Lujan et al. [96] used the original engine calibration of a 1.6 l Euro 6d-temp diesel engine, and compared the conventional powertrain to that of a full-hybrid powertrain. The study found that, in the homologation cycles of the WLTP (WLTC and RDE), the hybrid powertrain reduced fuel consumption by 20% and NOx emissions by 8% when compared with conventional engine-only operation. The study highlighted that this difference is more pronounced in urban areas with an improvement of 45% there. A summary of the engine-out NOx emissions and fuel consumption from these configurations can be seen in Table 6.

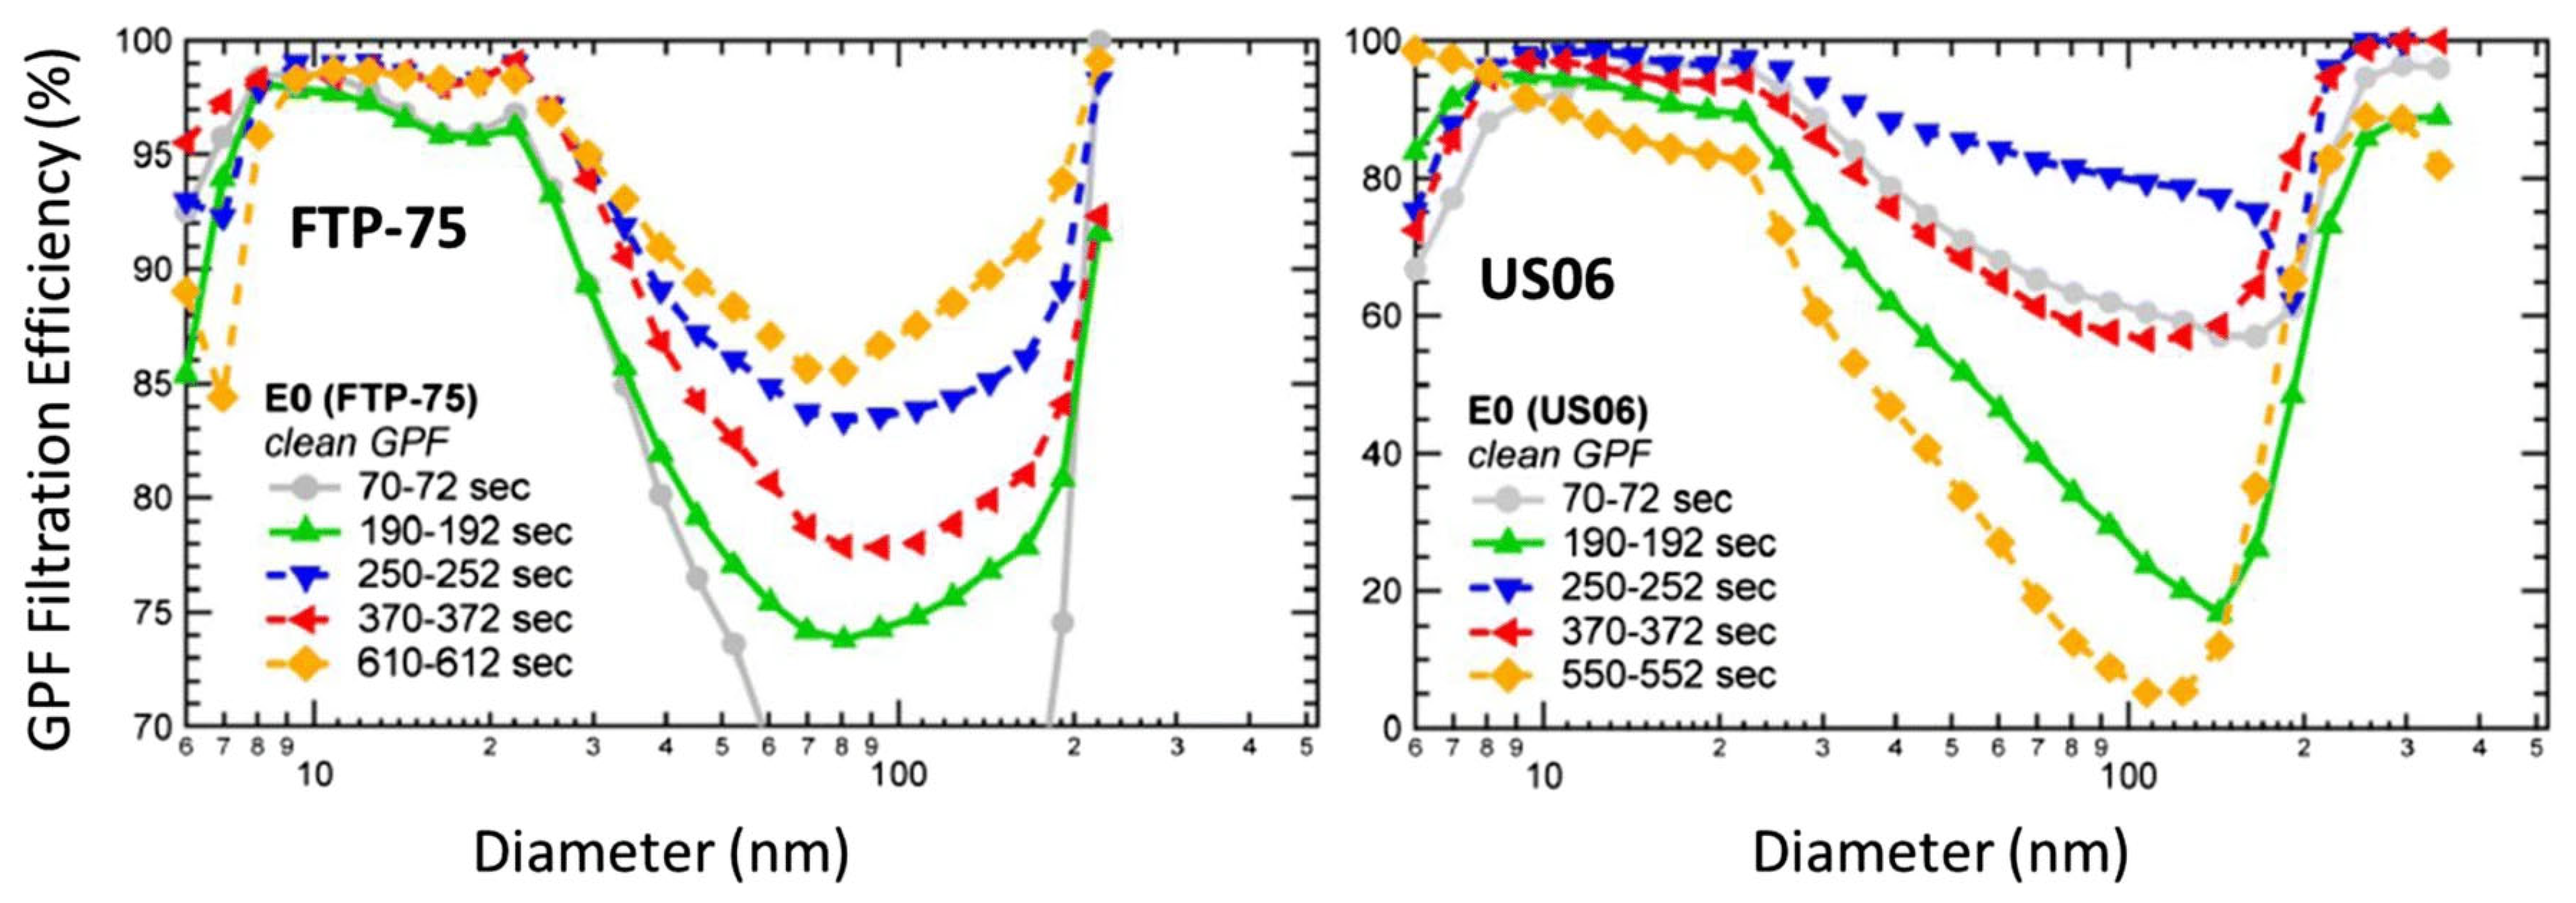
3.6. Particulate Filters

Particulate filters are devices designed to capture and remove particulate matter (PM) from the exhaust of diesel and gasoline engines through their in-operation regeneration [97,98,99,100]. PM is a mixture of solid and liquid particles that are produced during combustion, and it can be harmful to human health and the environment. Diesel particulate filters (DPFs) are used to capture the soot that is produced during the combustion of diesel fuel. These filters are made of a porous ceramic material that traps the soot particles. Over time, the filter becomes clogged with soot, reducing engine performance and fuel economy. To prevent this, the DPF periodically goes through a regeneration process, where the trapped soot is burned off at high temperatures. Gasoline particulate filters (GPFs) are similar to DPFs, but they are used in gasoline engines to capture the smaller particles that are produced during the combustion of gasoline. There are three main mechanisms that regulate the filtration of particles. The first mechanism is Brownian diffusion, which becomes more significant for capturing very small particles (<30 nm) as the particle size decreases. The second mechanism is interception, while the third mechanism is inertial filtration, which becomes more significant for capturing very large particles as the particle size increases. For small, wet particles, thermophoresis also acts as a driving force. The physics underlying these mechanisms is well-documented and understood, particularly for diesel particulate filters [101,102].
The filter’s ability to trap particles, known as filtration efficiency, is not 100% when the filter is new, but it increases with usage. Over time, soot and ash accumulate on the filter walls and create a layer that prevents additional soot from entering the walls and enhances filtration efficiency. However, when the filter regenerates the soot, it also breaks up the soot “cake layer”, leading to a subsequent decrease in filtration efficiency. Nevertheless, for most driving conditions and the vehicle’s lifespan, it is expected that a filter will function with very high (>90%) filtration efficiency [103]. Measuring a GPF’s filtration efficiency over the FTP75 and US06 test cycles, shown in Figure 6, Chan et al. [103] found that the filtration efficiency increased with time over the FTP-75 cycle, possibly due to the accumulation of soot and ash. On the US06 cycle, the high temperatures resulted in passive soot oxidation, which lowered filtration efficiency. Note in Figure 5 that the filtration efficiency is high for both very small particles (<30 nm) and very large particles (>200 nm). However, intermediate-sized particles have a lower filtration efficiency as they are neither small enough to be filtered through Brownian motion nor large enough for inertial filtration [104].

3.7. Advanced Combustion Regimes

Combustion regimes utilized in engines also affect the overall emissions. Many novel combustion regimes such as homogenous charge compression ignition (HCCI), gasoline compression ignition (GCI) and pre-chamber combustion (PCC) have been proposed to improve engine emissions. HCCI combustion offers several advantages. The advantages also vary depending on the fuel that is being used in the engine. NOx emissions in the HCCI engine are almost 10 times lower than in conventional engines. It was also noted that among HCCI engines operated on diesel, gasoline, LPG and natural gas, NOx emissions were the least when the engine was run on natural gas by almost 90–95%. HCCI combustion emissions are also dependent on the intake pressure and engine speed wherein an increase in the intake manifold pressure by 0.4 bar could increase the emissions by 0.17 g/kg and 0.1 g/kg of fuel per 1000 rpm increase. However, the trends were different for different emissions. For instance, HC emissions for natural gas-fueled HCCI are almost 50–60% less than diesel or LPG-run HCCI engines. With CO2 emissions, the emissions were less when the HCCI engines were operated on LPG. The effect of EGR was noted to be beneficial with NOx emissions while the contrary applied with HC and CO2 emissions. Implementing HCCI combustion comes with its own set of challenges such as lower power output, combustion timing control, charge preparation and cold-start [105]. In the pre-chamber combustion technique, the jet penetration must optimize the distance between the flame fronts moving towards the charge. Turbulent jet ignition (TJI) has been found to enable fast and stable combustion and also support high compression ratio operation. An active TJI couple with other strategies such as EGR and Miller cycle operation, can enable operation up to lambda 2 and reduce NOx emission while achieving an indicated thermal efficiency of 47% [59]. When the GCI was compared with the conventional gasoline SI engines, a 24.6% reduction in energy consumption and a 22.8% reduction in greenhouse gas emissions was reported [106]. Increased pre-mixing and lower fuel ignition quality were found to reduce unburned hydrocarbon, smoke and CO2 [107].

4. Recommendations and Future Directions

In terms of automotive emissions management, a synergy of both technological advancements and policy regulations have reduced all emissions to a large extent. This means that the regulations and the technologies have jointly brought down the criteria emissions thereby improving air quality and, by extension, human health. However, it should be noted this graph does not give us a complete picture of the emissions from modern vehicles. Today, with increasing emphasis on global warming and climate change, we are also looking to limit the greenhouse gas emissions, which are increasingly becoming a part of the vehicular emissions regulations [108,109]. Globally, transportation still has the highest reliance on fossil fuel, when compared with any other sector and accounted for almost 37% of the CO2 emissions in 2021 [110]. Although there was a drop in the CO2 levels during the COVID-19 pandemic [111], as the activity rebounded, global CO2 emissions from the transport sector have grown by 8% from the previous year (which is almost 7.7 Gt CO2). A net-zero scenario would require transport emissions to fall by about 20% (i.e., to less than 6 Gt by 2030) [112]. This requires the introduction of new measures such as reformulating the fuel, increased electrification and hybridization and smarter transport planning, while encouraging the use of public transportation, cycling and walking can reduce the number of ICEs on the road and promote cleaner air.
While more stringent norms and avenues for improvement have to be explored with the intention of improving air quality, it has to be noted that road transportation emissions have actually decreased over the years. Although NH3 emissions from road transport have risen, it represents a small proportion of total NH3 emissions [112]. Compared to 1990 levels, NOx emissions from international aviation have more than doubled (an increase of 171%), while emissions of NOx, CO2, and NMVOC from international shipping have increased by around 26%, 25% and 20%, respectively. As emissions of NOx and SOx from land-based sources decrease, there is an increasing recognition of the shipping and aviation sectors’ growing contribution to Europe’s air quality, with these sectors now accounting for 23% and 12% of all NOx and SOx emissions [113]. This calls for increased efforts in reducing emissions from these parts of the transportation sector, and thus to effect meaningful change in terms of global air quality.

5. Conclusions

In summary, with increasingly stricter emission standards across the world and improved emission control systems for road transport vehicles and increased hybridization of the powertrain, the automotive sector is successfully complying with the legislation placed upon it in the interest of improving the overall air quality. While stricter emission norms could indirectly mean the end of ICEs, it does not have to. The criteria emission standards have been met with every regulation; however, the CO2 limit being imposed with the most recent regulations cannot be realized when still using the current fuels that are highly carbon intensive and the means for measuring compliance is to measure tailpipe CO2 emissions (i.e., the “tank-to-wheel” portion). Meeting the greenhouse emission standards while still using a cheap-to-produce technology such as the ICE is only possible with the adoption of synthetic fuels that have a lower (such as methane or methanol) or zero carbon intensity (such as hydrogen or ammonia). It can also be achieved by using smarter transportation planning by promoting public transportation, walking and cycling. While promoting public transportation would require significant investment in many countries, it might be a necessary cost to maintain air quality while also keeping greenhouse gas emissions in check. From a global air quality point of view, it should also noted that the road transport sector has made remarkable progress while the global shipping and aviation sector criteria emissions have almost doubled since the 1990s. This is a cause for concern and means that a meaningful change in terms of global air quality can only be made by regulating the shipping and aviation sectors. The criteria emissions from the aviation and shipping sectors not only affect air quality but also indirectly promote climate change, global warming and adverse health impacts.

Author Contributions

Conceptualization: J.W.G.T., S.S.R.; methodology: S.O.; writing—original draft preparation: S.S.R.; writing—review and editing: S.O., J.W.G.T.; visualization: S.S.R. All authors have read and agreed to the published version of the manuscript.

Funding

This research received no external funding.

Conflicts of Interest

The authors declare no conflict of interest.

Abbreviations

AESAuxiliary Emission System
CAFECorporate Average Fuel Economy
CARBCalifornian Air Resource Board
CNGCompressed Natural Gas
COCarbon monoxide
DPFDiesel Particulate Filter
EPAEnvironmental Protection Agency
EUEuropean Union
FCMFuel Consumption Meter
GHGsGreenhouse gases
HCHydrocarbons
ICEInternal Combustion Engine
LDVsLight Duty Vehicles
LEVLow Emission Vehicles
MYModel Year
NEDCNew European Driving Cycle
NHTSANational Highway Traffic Safety Administration
NOxOxides of Nitrogen
OBFCMOn-board Fuel Consumption Monitor
PMPParticle Measurement Program
PMParticulate Matter
PNParticulate Number
RDEReal Driving Emissions
SCRSelective Catalytic Reduction
SULEVSuper Ultra Low Emission Vehicle
TWCThree-way Catalytic converters
ULEVUltra Low Emission Vehicle
WLTCWorldwide harmonized Light vehicles Test Cycles
WLTPWorldwide Harmonized Light Vehicles Test Procedure

References

  1. Xue, Y.; Zhou, Z.; Nie, T.; Wang, K.; Nie, L.; Pan, T.; Wu, X.; Tian, H.; Zhong, L.; Li, J. Trends of multiple air pollutants emissions from residential coal combustion in Beijing and its implication on improving air quality for control measures. Atmos. Environ. 2016, 142, 303–312. [Google Scholar] [CrossRef]
  2. Gaffney, J.S.; Marley, N.A. The impacts of combustion emissions on air quality and climate—From coal to biofuels and beyond. Atmos. Environ. 2009, 43, 23–36. [Google Scholar] [CrossRef]
  3. Yim, S.H.; Barrett, S.R. Public health impacts of combustion emissions in the United Kingdom. Environ. Sci. Technol. 2012, 46, 4291–4296. [Google Scholar] [CrossRef] [PubMed]
  4. Préndez, M.; Nova, P.; Romero, H.; Mendes, F.; Fuentealba, R. Representativeness of the particulate matter pollution assessed by an official monitoring station of air quality in Santiago, Chile: Projection to human health. Environ. Geochem. Health 2023, 45, 2985–3001. [Google Scholar] [CrossRef]
  5. Megido, L.; Suárez-Peña, B.; Negral, L.; Castrillón, L.; Fernández-Nava, Y. Suburban air quality: Human health hazard assessment of potentially toxic elements in PM10. Chemosphere 2017, 177, 284–291. [Google Scholar] [CrossRef]
  6. Luo, Z.; Wang, Y.; Lv, Z.; He, T.; Zhao, J.; Wang, Y.; Gao, F.; Zhang, Z.; Liu, H. Impacts of vehicle emission on air quality and human health in China. Sci. Total Environ. 2022, 813, 152655. [Google Scholar] [CrossRef]
  7. An, F.; Sauer, A. Comparison of Passenger Vehicle Fuel Economy and Greenhouse Gas Emission Standards around the World; Pew Center on Global Climate Change: 2004; Volume 25. Available online: https://www.c2es.org/wp-content/uploads/2004/12/comparison-passenger-vehicle-fuel-economy-ghg-emission-standards-around-world.pdf (accessed on 20 February 2023).
  8. Li, X.; Nam, K.-M. Environmental regulations as industrial policy: Vehicle emission standards and automotive industry performance. Environ. Sci. Policy 2022, 131, 68–83. [Google Scholar] [CrossRef]
  9. Saxena, P.; Sonwani, S. Criteria Air Pollutants and Their Impact on Environmental Health; Springer: Berlin/Heidelberg, Germany, 2019; Volume 1. [Google Scholar]
  10. Kritsanaviparkporn, E.; Baena-Moreno, F.M.; Reina, T. Catalytic converters for vehicle exhaust: Fundamental aspects and technology overview for newcomers to the field. Chemistry 2021, 3, 630–646. [Google Scholar] [CrossRef]
  11. European Exhaust Emissions Standard For Passenger Cars. 2017. Available online: https://www.theaa.com/driving-advice/fuels-environment/euro-emissions-standards (accessed on 20 February 2023).
  12. All EPA Emission Standards—Light-Duty Vehicles and Trucks and Motorcycles. 2022. Available online: https://www.epa.gov/emission-standards-reference-guide/all-epa-emission-standards (accessed on 20 February 2023).
  13. Final Rule for Control of Air Pollution from Motor Vehicles: Tier 3 Motor Vehicle Emission and Fuel Standards. 2022. Available online: https://www.epa.gov/regulations-emissions-vehicles-and-engines/final-rule-control-air-pollution-motor-vehicles-tier-3 (accessed on 20 February 2023).
  14. CARB—Low-Emission Vehicle Program. 2022. Available online: https://ww2.arb.ca.gov/our-work/programs/low-emission-vehicle-program (accessed on 20 February 2023).
  15. CARB: Proposed Modifications to CA’s Zero Emission Vehicle Program. Available online: https://theicct.org/publication/carb-proposed-modifications-to-cas-zero-emission-vehicle-program/ (accessed on 20 February 2023).
  16. 2017 Global Update: Light-Duty Vehicle Greenhouse Gas and Fuel Economy Standards. 2017. Available online: https://theicct.org/publication/2017-global-update-light-duty-vehicle-greenhouse-gas-and-fuel-economy-standards/ (accessed on 20 February 2023).
  17. Air Data—Multiyear Tile Plot EPA. Available online: https://www.epa.gov/outdoor-air-quality-data/air-data-multiyear-tile-plot (accessed on 20 February 2023).
  18. Guttikunda, S.K.; Dammalapati, S.K.; Pradhan, G.; Krishna, B.; Jethva, H.T.; Jawahar, P. What Is Polluting Delhi’s Air? A Review from 1990 to 2022. Sustainability 2023, 15, 4209. [Google Scholar] [CrossRef]
  19. How Is Air Quality calculated—EPA. Available online: https://www.epa.gov/outdoor-air-quality-data/how-aqi-calculated (accessed on 13 April 2023).
  20. Cohen, A.J.; Anderson, H.R.; Ostro, B.; Pandey, K.D.; Krzyzanowski, M.; Künzli, N.; Gutschmidt, K.; Pope, C.A., III; Romieu, I.; Samet, J.M. Urban air pollution. Comp. Quantif. Health Risks Glob. Reg. Burd. Dis. Attrib. Sel. Major Risk Factors 2004, 2, 1353–1433. [Google Scholar]
  21. Cruz, I.S.; Katz-Gerro, T. Urban public transport companies and strategies to promote sustainable consumption practices. J. Clean. Prod. 2016, 123, 28–33. [Google Scholar] [CrossRef]
  22. Gendron-Carrier, N.; Gonzalez-Navarro, M.; Polloni, S.; Turner, M.A. Subways and urban air pollution. Am. Econ. J. Appl. Econ. 2022, 14, 164–196. [Google Scholar] [CrossRef]
  23. Marked Improvement in Europe’s Air Quality over Past Decade, Fewer Deaths Linked to Pollution. Available online: https://www.eea.europa.eu/highlights/marked-improvement-in-europes-air (accessed on 20 February 2023).
  24. Wolf, M.J.; Esty, D.C.; Kim, H.; Bell, M.L.; Brigham, S.; Nortonsmith, Q.; Zaharieva, S.; Wendling, Z.A.; de Sherbinin, A.; Emerson, J.W. New insights for tracking global and local trends in exposure to air pollutants. Environ. Sci. Technol. 2022, 56, 3984–3996. [Google Scholar] [CrossRef]
  25. Juginović, A.; Vuković, M.; Aranza, I.; Biloš, V. Health impacts of air pollution exposure from 1990 to 2019 in 43 European countries. Sci. Rep. 2021, 11, 22516. [Google Scholar] [CrossRef]
  26. Cicala, S.; Holland, S.P.; Mansur, E.T.; Muller, N.Z.; Yates, A.J. Expected health effects of reduced air pollution from COVID-19 social distancing. Atmosphere 2021, 12, 951. [Google Scholar] [CrossRef]
  27. Gurjar, B.R.; Jain, A.; Sharma, A.; Agarwal, A.; Gupta, P.; Nagpure, A.; Lelieveld, J. Human health risks in megacities due to air pollution. Atmos. Environ. 2010, 44, 4606–4613. [Google Scholar] [CrossRef]
  28. Agarwal, A.; Kaushik, A.; Kumar, S.; Mishra, R.K. Comparative study on air quality status in Indian and Chinese cities before and during the COVID-19 lockdown period. Air Qual. Atmos. Health 2020, 13, 1167–1178. [Google Scholar] [CrossRef]
  29. Badami, M.G. Transport and urban air pollution in India. Environ. Manag. 2005, 36, 195–204. [Google Scholar] [CrossRef]
  30. Guttikunda, S.K.; Kopakka, R.V. Source emissions and health impacts of urban air pollution in Hyderabad, India. Air Qual. Atmos. Health 2014, 7, 195–207. [Google Scholar] [CrossRef]
  31. Hosamane, S.; Desai, G. Urban air pollution trend in India-present scenario. Int. J. Innov. Res. Sci. Eng. Technol. 2013, 2, 3738–3747. [Google Scholar]
  32. Fan, Y.; Ding, X.; Hang, J.; Ge, J. Characteristics of urban air pollution in different regions of China between 2015 and 2019. Build. Environ. 2020, 180, 107048. [Google Scholar] [CrossRef]
  33. US: Light-Duty: Emissions. Available online: https://www.transportpolicy.net/standard/us-light-duty-emissions/ (accessed on 20 February 2023).
  34. EU: Cars and Light Trucks. Available online: https://dieselnet.com/standards/eu/ld.php (accessed on 20 February 2023).
  35. Blumberg, K.O.; Walsh, M.P.; Pera, C. Low-Sulfur Gasoline & Diesel: The Key to Lower Vehicle Emissions. Available online: http://www.theicct.org/documents/Low-Sulfur_Exec_Summ_ICCT_2003.pdf (accessed on 24 April 2023).
  36. Lin, L.; Zhang, Y.; Kong, Y. Recent advances in sulfur removal from gasoline by pervaporation. Fuel 2009, 88, 1799–1809. [Google Scholar] [CrossRef]
  37. Ravi, S.S.; Aziz, M. Utilization of electric vehicles for vehicle-to-grid services: Progress and perspectives. Energies 2022, 15, 589. [Google Scholar] [CrossRef]
  38. Hassan, S.T.; Khan, S.U.-D.; Xia, E.; Fatima, H. Role of institutions in correcting environmental pollution: An empirical investigation. Sustain. Cities Soc. 2020, 53, 101901. [Google Scholar] [CrossRef]
  39. Damma, D.; Ettireddy, P.R.; Reddy, B.M.; Smirniotis, P.G. A review of low temperature NH3-SCR for removal of NOx. Catalysts 2019, 9, 349. [Google Scholar] [CrossRef] [Green Version]
  40. Kim, H.J.; Jo, S.; Kwon, S.; Lee, J.-T.; Park, S. NOX emission analysis according to after-treatment devices (SCR, LNT+ SCR, SDPF), and control strategies in Euro-6 light-duty diesel vehicles. Fuel 2022, 310, 122297. [Google Scholar] [CrossRef]
  41. Latha, H.; Prakash, K.; Veerangouda, M.; Maski, D.; Ramappa, K. A review on scr system for nox reduction in diesel engine. Int. J. Curr. Microbiol. Appl. Sci. 2019, 8, 1553–1559. [Google Scholar] [CrossRef]
  42. Lao, C.T.; Akroyd, J.; Kraft, M. Modelling treatment of deposits in particulate filters for internal combustion emissions. Prog. Energy Combust. Sci. 2023, 96, 101043. [Google Scholar] [CrossRef]
  43. Meng, Z.; Chen, C.; Li, J.; Fang, J.; Tan, J.; Qin, Y.; Jiang, Y.; Qin, Z.; Bai, W.; Liang, K. Particle emission characteristics of DPF regeneration from DPF regeneration bench and diesel engine bench measurements. Fuel 2020, 262, 116589. [Google Scholar] [CrossRef]
  44. Prikhodko, V.Y.; Pihl, J.A.; Toops, T.J.; Parks, J.E. Passive SCR performance under pseudo-transient cycle: Challenges and opportunities for meeting Tier 3 emissions. Emiss. Control Sci. Technol. 2019, 5, 253–262. [Google Scholar] [CrossRef]
  45. Sellnau, M.; Hoyer, K.; Moore, W.; Foster, M.; Sinnamon, J.; Klemm, W. Advancement of GDCI Engine Technology for US 2025 CAFE and Tier 3 Emissions; SAE Technical Paper. 2018. Available online: https://www.sae.org/publications/technical-papers/content/2018-01-0901/?utm_source=google&utm_medium=ppc&utm_campaign=gdthttps://www.sae.org/learn/professional-development/gdt?utm_source=google&utm_medium=ppc&utm_campaign=gdt&gclid=CjwKCAjw44mlBhAQEiwAqP3eVgCFdEMLDNitenYy7J9m2TQkb2736icPIeXijyqFR54wnGcu2JnAbhoCUBsQAvD_BwE (accessed on 23 February 2023).
  46. Wik, C.; Niemi, S. Low emission engine technologies for future tier 3 legislations-options and case studies. J. Shipp. Trade 2016, 1, 3. [Google Scholar] [CrossRef] [Green Version]
  47. Euro 6e: Changes to the European Union Light-Duty Vehicle Type-Approval Procedure. Available online: https://theicct.org/wp-content/uploads/2022/12/euro6e-type-approval-dec22.pdf (accessed on 23 February 2023).
  48. Low Emission Vehicle (LEV) Standards. Available online: https://afdc.energy.gov/laws/6493 (accessed on 23 February 2023).
  49. Anderson, J.O.; Thundiyil, J.G.; Stolbach, A. Clearing the air: A review of the effects of particulate matter air pollution on human health. J. Med. Toxicol. 2012, 8, 166–175. [Google Scholar] [CrossRef] [Green Version]
  50. Lave, L.B.; Seskin, E.P. Air Pollution and Human Health; RFF Press: New York, NY, USA, 2013; Available online: https://www.taylorfrancis.com/books/mono/10.4324/9781315064451/air-pollution-human-health-lester-lave-eugene-seskin (accessed on 20 February 2023).
  51. Federal Standards (US EPA). Available online: https://dieselnet.com/standards/us/ld.php (accessed on 20 February 2023).
  52. United States: Cars and Light-Duty Trucks: California. Available online: https://dieselnet.com/standards/us/ld_ca.php#lev (accessed on 20 February 2023).
  53. Commission Proposal on the New Euro 7 Standards. 2022. Available online: https://ec.europa.eu/commission/presscorner/detail/en/qanda_22_6496 (accessed on 21 February 2023).
  54. Mulholland, E.; Miller, J.; Bernard, Y.; Lee, K.; Rodríguez, F. The role of NOx emission reductions in Euro 7/VII vehicle emission standards to reduce adverse health impacts in the EU27 through 2050. Transp. Eng. 2022, 9, 100133. [Google Scholar] [CrossRef]
  55. Börnhorst, M.; Deutschmann, O. Advances and challenges of ammonia delivery by urea-water sprays in SCR systems. Prog. Energy Combust. Sci. 2021, 87, 100949. [Google Scholar] [CrossRef]
  56. Koebel, M.; Elsener, M.; Madia, G. Recent Advances in the Development of Urea-SCR for Automotive Applications. 2001. Available online: https://www.sae.org/publications/technical-papers/content/2001-01-3625/ (accessed on 20 February 2023).
  57. Ravi, S.S.; Aziz, M. Clean hydrogen for mobility–Quo vadis? Int. J. Hydrogen Energy 2022, 47, 20632–20661. [Google Scholar] [CrossRef]
  58. Proposed Regulated Sales Targets for Zero-Emission Vehicles. Available online: https://www.canada.ca/en/environment-climate-change/news/2022/12/proposed-regulated-sales-targets-for-zero-emission-vehicles.html (accessed on 23 February 2023).
  59. Gu, B.; Zhang, L.; Van Dingenen, R.; Vieno, M.; Van Grinsven, H.J.; Zhang, X.; Zhang, S.; Chen, Y.; Wang, S.; Ren, C. Abating ammonia is more cost-effective than nitrogen oxides for mitigating PM2.5 air pollution. Science 2021, 374, 758–762. [Google Scholar] [CrossRef]
  60. BIELACZyC, P.; Szczotka, A.; PAJdOWSKI, P.; WOOdBURN, J. Development of automotive emissions testing equipment and test methods in response to legislative, technical and commercial requirements. Siln. Spalinowe 2013, 52, 28–41. [Google Scholar] [CrossRef]
  61. Lee, J.; Veloso, F.M.; Hounshell, D.A.; Rubin, E.S. Forcing technological change: A case of automobile emissions control technology development in the US. Technovation 2010, 30, 249–264. [Google Scholar] [CrossRef]
  62. Taylor, K.C. Automobile Catalytic Converters; Springer: Berlin/Heidelberg, Germany, 1984; Available online: https://books.google.rs/books?id=427tCAAAQBAJ&printsec=frontcover&hl=sr&source=gbs_ge_summary_r&cad=0#v=onepage&q&f=false (accessed on 20 February 2023).
  63. Farrauto, R.J.; Heck, R.M. Catalytic converters: State of the art and perspectives. Catal. Today 1999, 51, 351–360. [Google Scholar] [CrossRef]
  64. Kašpar, J.; Fornasiero, P.; Hickey, N. Automotive catalytic converters: Current status and some perspectives. Catal. Today 2003, 77, 419–449. [Google Scholar] [CrossRef]
  65. Santos, H.; Costa, M. Modelling transport phenomena and chemical reactions in automotive three-way catalytic converters. Chem. Eng. J. 2009, 148, 173–183. [Google Scholar] [CrossRef]
  66. Abdolmaleki, S.; Najafi, G.; Ghobadian, B.; Zakeri, A.; Nejat, M. Comparison of Aged and fresh Automotive Three-Way Catalyst in Driving Cycle. J. Engine Res. 2020, 57, 75–83. [Google Scholar]
  67. Mc Grane, L.; Douglas, R.; Irwin, K.; Stewart, J.; Woods, A.; Muehlstaedt, F. A Study of the Effect of Light-off Temperatures and Light-off Curve Shape on the Cumulative Emissions Performance of 3-Way Catalytic Converters; SAE Technical Paper. 2021. Available online: https://www.sae.org/publications/technical-papers/content/2021-01-0594/ (accessed on 23 February 2023).
  68. El-Sharkawy, A.; Arora, D.; Huxford, M.W. Optimization of Catalytic Converter Design to Improve under-Hood Thermal Management. SAE Int. J. Adv. Curr. Pract. Mobil. 2019, 1, 1325–1332. [Google Scholar] [CrossRef]
  69. Oh, S.H. Catalytic converter modeling for automotive emission control. In Computer-Aided Design of Catalysts; CRC Press: Boca Raton, FL, USA, 2020; pp. 259–296. [Google Scholar]
  70. Embiruçua, L.; Lealb, C. Catalytic Processes in the Automotive AREA, VII INTERNATIONAL SYMPOSIUM ON INNOVATION AND TECHNOLOGY (SIINTEC) One Planet, one Ocean and one Health-2021. Available online: https://doity.com.br/siintec-2021 (accessed on 22 February 2023).
  71. Yang, K.; Chen, P. Model-based predictive control and dithering control for an integrated gasoline engine and three-way catalytic converter system. J. Dyn. Syst. Meas. Control 2021, 143, 091007. [Google Scholar] [CrossRef]
  72. Air Pollutant Emissions Trends Data; Environmental Protection Agency—US. 2021. Available online: https://www.epa.gov/ (accessed on 22 February 2023).
  73. Timeline of Major Accomplishments in Transportation, Air Pollution, and Climate Change. 2022. Available online: https://www.epa.gov/transportation-air-pollution-and-climate-change/timeline-major-accomplishments-transportation-air (accessed on 22 February 2023).
  74. Clenci, A.; Berquez, J.; Stoica, R.; Niculescu, R.; Cioc, B.; Zaharia, C.; Iorga-Simăn, V. Experimental investigation of the effect of an afterburner on the light-off performance of an exhaust after-treatment system. Energy Rep. 2022, 8, 406–418. [Google Scholar] [CrossRef]
  75. Gumus, M. Reducing cold-start emission from internal combustion engines by means of thermal energy storage system. Appl. Therm. Eng. 2009, 29, 652–660. [Google Scholar] [CrossRef]
  76. Gao, J.; Tian, G.; Sorniotti, A.; Karci, A.E.; Di Palo, R. Review of thermal management of catalytic converters to decrease engine emissions during cold start and warm up. Appl. Therm. Eng. 2019, 147, 177–187. [Google Scholar] [CrossRef]
  77. Winkler, A.; Dimopoulos, P.; Hauert, R.; Bach, C.; Aguirre, M. Catalytic activity and aging phenomena of three-way catalysts in a compressed natural gas/gasoline powered passenger car. Appl. Catal. B Environ. 2008, 84, 162–169. [Google Scholar] [CrossRef]
  78. Scheidt, M.; Brands, C.; Kratzsch, M.; Günther, M. Combined Miller/Atkinson strategy for future downsizing concepts. MTZ Worldw. 2014, 75, 4–11. [Google Scholar] [CrossRef]
  79. Silva, L.; Silva, J.; Henríquez, J.; de Lira Junior, J. Numerical Analysis of Effects of Engine Downsizing and Turbocharging on the Parameters of Performance and Emissions of an Internal Combustion Engine. Arab. J. Sci. Eng. 2022, 48, 2795–2805. [Google Scholar] [CrossRef]
  80. Szałek, A.; Pielecha, I. The Influence of engine downsizing in hybrid powertrains on the energy flow indicators under actual traffic conditions. Energies 2021, 14, 2872. [Google Scholar] [CrossRef]
  81. Turner, J.; Popplewell, A.; Patel, R.; Johnson, T.; Darnton, N.; Richardson, S.; Bredda, S.; Tudor, R.; Bithell, C.; Jackson, R. Ultra boost for economy: Extending the limits of extreme engine downsizing. SAE Int. J. Engines 2014, 7, 387–417. [Google Scholar] [CrossRef]
  82. Ye, P.; Boehman, A.L. Investigation of the impact of engine injection strategy on the biodiesel NOx effect with a common-rail turbocharged direct injection diesel engine. Energy Fuels 2010, 24, 4215–4225. [Google Scholar] [CrossRef]
  83. Bonalumi, D. Considerations on CO2 and pollutants emissions of modern cars. AIP Conf. Proc. 2019, 2191, 020024. [Google Scholar]
  84. Scheider, W.-H. Plug-in hybrid vehicles—A key technology for CO2 reduction. MTZ Worldw. 2019, 80, 108. [Google Scholar] [CrossRef]
  85. Melaika, M.; Mamikoglu, S.; Dahlander, P. 48V Mild-Hybrid Architecture Types, Fuels and Power Levels Needed to Achieve 75g CO2/km; SAE Technical Paper. 2019. Available online: https://www.sae.org/publications/technical-papers/content/2019-01-0366/ (accessed on 22 February 2023).
  86. IEA. As Their Sales Continue to Rise, SUVs’ Global CO2 Emissions Are Nearing 1 Billion Tonnes. 2023. Available online: https://www.iea.org/commentaries/as-their-sales-continue-to-rise-suvs-global-co2-emissions-are-nearing-1-billion-tonnes (accessed on 22 February 2023).
  87. Kirsten, K.; Brands, C.; Kratzsch, M.; Günther, M. Selektive Umschaltung des Ventilhubs beim Ottomotor. MTZ-Mot. Z. 2012, 73, 834–839. [Google Scholar] [CrossRef]
  88. Cucchi, M.; Samuel, S. Influence of the exhaust gas turbocharger on nano-scale particulate matter emissions from a GDI spark ignition engine. Appl. Therm. Eng. 2015, 76, 167–174. [Google Scholar] [CrossRef] [Green Version]
  89. Qian, Y.; Li, Z.; Yu, L.; Wang, X.; Lu, X. Review of the state-of-the-art of particulate matter emissions from modern gasoline fueled engines. Appl. Energy 2019, 238, 1269–1298. [Google Scholar] [CrossRef]
  90. Golloch, R.; Merker, G. Internal combustion engine downsizing. Fundamentals, state of the art and future concepts; Downsizing bei Verbrennungsmotoren. Grundlagen, Stand der Technik und zukuenftige Konzepte. Mot. Z. 2005, 66, 126–131. [Google Scholar]
  91. Zhu, R.; Fu, Y.; Wang, L.; Hu, J.; He, L.; Wang, M.; Lai, Y.; Su, S. Effects of a start-stop system for gasoline direct injection vehicles on fuel consumption and particulate emissions in hot and cold environments. Environ. Pollut. 2022, 308, 119689. [Google Scholar] [CrossRef]
  92. Hung, C.C.; Martin, J.K.; Koo, J.-Y. Injection pressure effects upon droplet behavior in transient diesel sprays. SAE Trans. 1997, 106, 168–181. [Google Scholar]
  93. Pierpont, D.; Reitz, R.D. Effects of injection pressure and nozzle geometry on DI diesel emissions and performance. SAE Trans. 1995, 104, 1041–1050. [Google Scholar]
  94. Mohan, B.; Yang, W.; kiang Chou, S. Fuel injection strategies for performance improvement and emissions reduction in compression ignition engines—A review. Renew. Sustain. Energy Rev. 2013, 28, 664–676. [Google Scholar] [CrossRef]
  95. Taghavifar, H. Experimental and numerical engine cycle setup for a dual fuel hydrogen, methane, and hythane with diesel to assess the effect of water injection and nozzle geometry. Environ. Prog. Sustain. Energy 2023, 42, e13936. [Google Scholar] [CrossRef]
  96. Luján, J.M.; Garcia, A.; Monsalve-Serrano, J.; Martínez-Boggio, S. Effectiveness of hybrid powertrains to reduce the fuel consumption and NOx emissions of a Euro 6d-temp diesel engine under real-life driving conditions. Energy Convers. Manag. 2019, 199, 111987. [Google Scholar] [CrossRef]
  97. Guan, B.; Zhan, R.; Lin, H.; Huang, Z. Review of the state-of-the-art of exhaust particulate filter technology in internal combustion engines. J. Environ. Manag. 2015, 154, 225–258. [Google Scholar] [CrossRef]
  98. Khair, M.K. A Review of Diesel Particulate Filter Technologies. 2003. Available online: https://www.sae.org/publications/technical-papers/content/2003-01-2303/ (accessed on 22 February 2023).
  99. Stamatellou, A.-M.; Stamatelos, A. Overview of Diesel particulate filter systems sizing approaches. Appl. Therm. Eng. 2017, 121, 537–546. [Google Scholar] [CrossRef]
  100. Samaras, Z.; Rieker, M.; Papaioannou, E.; van Dorp, W.; Kousoulidou, M.; Ntziachristos, L.; Andersson, J.; Bergmann, A.; Hausberger, S.; Keskinen, J. Perspectives for regulating 10 nm particle number emissions based on novel measurement methodologies. J. Aerosol Sci. 2022, 162, 105957. [Google Scholar] [CrossRef]
  101. Tandon, P.; Heibel, A.; Whitmore, J.; Kekre, N.; Chithapragada, K. Measurement and prediction of filtration efficiency evolution of soot loaded diesel particulate filters. Chem. Eng. Sci. 2010, 65, 4751–4760. [Google Scholar] [CrossRef]
  102. Zhong, D.; He, S.; Tandon, P.; Moreno, M.; Boger, T. Measurement and Prediction of Filtration Efficiency Evolution of Soot Loaded Diesel Particulate Filters; SAE Technical Paper. 2012. Available online: https://www.researchgate.net/publication/260000063_Measurement_and_Prediction_of_Filtration_Efficiency_Evolution_of_Soot_Loaded_Diesel_Particulate_Filters (accessed on 22 February 2023).
  103. Chan, T.W.; Lax, D.; Gunter, G.C.; Hendren, J.; Kubsh, J.; Brezny, R. Assessment of the fuel composition impact on black carbon mass, particle number size distributions, solid particle number, organic materials, and regulated gaseous emissions from a light-duty gasoline direct injection truck and passenger car. Energy Fuels 2017, 31, 10452–10466. [Google Scholar] [CrossRef]
  104. Joshi, A.; Johnson, T.V. Gasoline particulate filters—A review. Emiss. Control Sci. Technol. 2018, 4, 219–239. [Google Scholar] [CrossRef]
  105. Mofijur, M.; Hasan, M.M.; Mahlia, T.; Rahman, S.A.; Silitonga, A.; Ong, H.C. Performance and emission parameters of homogeneous charge compression ignition (HCCI) engine: A review. Energies 2019, 12, 3557. [Google Scholar] [CrossRef] [Green Version]
  106. Hao, H.; Liu, F.; Liu, Z.; Zhao, F. Compression ignition of low-octane gasoline: Life cycle energy consumption and greenhouse gas emissions. Appl. Energy 2016, 181, 391–398. [Google Scholar] [CrossRef]
  107. Wang, Y.; Wang, X.; Pan, J.; Wei, H.; Zhou, X.; Pan, M. Effects of different injection strategies on mixing, combustion and emission behavior of gasoline compression ignition (GCI) engines. Fuel 2022, 317, 123486. [Google Scholar] [CrossRef]
  108. CO2 Emission Performance Standards for Cars and Vans. Available online: https://climate.ec.europa.eu/eu-action/transport-emissions/road-transport-reducing-co2-emissions-vehicles/co2-emission-performance-standards-cars-and-vans_en (accessed on 22 February 2023).
  109. Fit for 55: Zero CO2 Emissions for New Cars and Vans in 2035. Available online: https://www.europarl.europa.eu/news/en/press-room/20230210IPR74715/fit-for-55-zero-co2-emissions-for-new-cars-and-vans-in-2035#:~:text=The%20new%20legislation%20sets%20the,cars%20and%2050%25%20for%20vans (accessed on 22 February 2023).
  110. Improving the Sustainability of Passenger and Freight Transport. 2023. Available online: https://www.iea.org/topics/transport (accessed on 22 February 2023).
  111. Liu, Z.; Ciais, P.; Deng, Z.; Lei, R.; Davis, S.J.; Feng, S.; Zheng, B.; Cui, D.; Dou, X.; Zhu, B. Near-real-time monitoring of global CO2 emissions reveals the effects of the COVID-19 pandemic. Nat. Commun. 2020, 11, 5172. [Google Scholar] [CrossRef]
  112. Farren, N.J.; Davison, J.; Rose, R.A.; Wagner, R.L.; Carslaw, D.C. Underestimated ammonia emissions from road vehicles. Environ. Sci. Technol. 2020, 54, 15689–15697. [Google Scholar] [CrossRef]
  113. Emissions of Air Pollutants from Transport. Available online: https://www.eea.europa.eu/data-and-maps/indicators/transport-emissions-of-air-pollutants-8/transport-emissions-of-air-pollutants-8 (accessed on 22 February 2023).
Figure 1. (a) Historical fleet CO2 emissions performance and current standards (g CO2/km normalized to NEDC) for passenger cars. Reproduced from [16]. (b) A case comparison of air quality in terms of PM10 in Santa Maria-Santa Barbara, California and Delhi [17,18,19].
Atmosphere 14 01164 g001
Figure 2. Euro 1–6 emission standards for PM and NOx from heavy-duty vehicles.
Atmosphere 14 01164 g002
Figure 3. Criteria emissions and petroleum consumption in the US between 1970 and 2021 showing some of the key policy changes and technology adoptions that affected the emission trends. Data taken from [72,73].
Atmosphere 14 01164 g003
Figure 4. Reduction in HC and CO2 emissions with engine coolant preheating and its effect on the catalyst temperature. Reproduced from [76].
Atmosphere 14 01164 g004
Figure 5. Comparison of FC and pollutant emissions with S&S-on and S&S-off for cold starts and hot starts at 28 °C and 5 °C ambient temperature. Reproduced from [91].
Atmosphere 14 01164 g005
Figure 6. Filtration efficiency measured over the FTP-75 cycle (left) and US06 cycle (right) (reproduced from [104]).
Atmosphere 14 01164 g006
Table 1. EU emission standards for passenger cars [34].
StageYearCOHCsHCs + NOxNOxPMPN
g/kmg/kmg/kmg/kmg/km#/km
Positive Ignition (Gasoline)
Euro 119922.72-0.97---
Euro 219962.2-0.5---
Euro 320002.30.2-0.15--
Euro 4200510.1-0.08--
Euro 5200910.1-0.060.005-
Euro 6201410.1-0.060.0056.0 × 1011
Compression Ignition (Diesel)
Euro 119922.72-0.97-0.14-
Euro 2, IDI19961-0.7-0.08-
Euro 2, DI19961-0.9-0.1-
Euro 320000.64-0.560.50.05-
Euro 420050.5-0.30.250.025-
Euro 5a20090.5-0.230.180.005-
Euro 5b20110.5-0.230.180.0056.0 × 1011
Euro 620140.5-0.170.080.0056.0 × 1011
Table 2. Different stages in the implementation of the Euro 6 regulations [34].
Euro StageRequirements
Euro 6aExcludes PMP measurement procedure for PM, PN standard and flex fuel vehicle low temperature emission testing with biofuel (this stage applicable to vehicles that meet Euro 6 standards ahead of regulatory deadlines).
Euro 6bEuro 6 emission requirements including PMP measurement procedure for PM; PN standards (preliminary values for PI vehicles); and flex fuel vehicle low temperature emission testing with biofuels (E10 and B7).
Euro 6cEuro 6b requirements plus final PN standards for PI vehicles; RDE NOx testing for monitoring only; OBD Euro 6-2; use of E10 and B7 reference fuels.
Euro 6c-EVAPEuro 6c requirements plus revised evaporative emissions test procedure.
Euro 6d-TEMPEuro 6c requirements plus RDE type approval testing against ‘temporary’ conformity factors (NOx = 2.1, PN = 1.5).
Euro 6d-TEMP-EVAPEuro 6d-TEMP requirements plus revised evaporative emissions test procedure.
Euro 6d-TEMP-ISCEuro 6d-TEMP requirements plus new ISC procedure, including RDE ISC, type 4 and type 6 tests.
Euro 6dRDE testing against ‘final’ conformity factors (NOx = 1.43, PM = 1.5) plus revised evaporative emissions test procedure.
Euro 6d-ISCEuro 6d requirements plus 48 h evaporative emissions test procedure and new ISC procedure.
Euro 6d-ISC-FCMEuro 6d-ISC requirements plus on-board fuel/electric energy consumption monitoring (OBFCM or just FCM) requirements for M1 and N1 ICE-only, hybrid and plug-in hybrid vehicles. End of series flexibilities by member states allowed vehicles meeting earlier sub-stages to still be sold after Euro 6d-ISC-FCM requirements became effective to offset the impacts of the COVID-19 pandemic on the auto industry.
Euro 6eEuro 6d-ISC requirements plus RDE compliance considering updated PEMS error margins (NOx margin of 0.10, i.e., CF = 1.10; PN margin of 0.34, i.e., CF = 1.34); on-board FCM for category N2 vehicles.
Euro 6e-bisEuro 6e requirements plus increased extended ambient conditions for RDE compliance (the upper RDE temperature limit for moderate temperature changes to 35 °C from 30 °C and the upper limit for extended temperature to 38 °C from 35 °C), Auxiliary Emission System (AES) flag and updated utility factor for vehicles with off-vehicle charging using updated assumptions.
Euro 6e-bis-FCMEuro 6e-bis requirements plus updated utility factor for vehicles with off-vehicle charging using FCM data.
Table 6. Engine-out NOx and CO2 emissions of a 1.6 l diesel engine in different homologation and real-life driving cycles [96].
ParameterOEMHybridImprovement with Hybrid
NOx (g/km)CO2 (g/km)NOx (g/km)CO2 (g/km)NOx (%)CO2 (%)
WLTC1.341431.1911711.618.4
RDE1.031360.991133.717.1
Urban 11.172391.18121−0.649.2
Urban 21.052011.09117−4.141.9
Urban 30.672010.88107−31.646.8
Combined 11.221421.28128−4.79.8
Combined 21.491421.53131−2.57.7
Combined 31.121231.111100.510.5
Combined 41.641381.611321.94.2
Highway2.251602.181593.30.4
Disclaimer/Publisher’s Note: The statements, opinions and data contained in all publications are solely those of the individual author(s) and contributor(s) and not of MDPI and/or the editor(s). MDPI and/or the editor(s) disclaim responsibility for any injury to people or property resulting from any ideas, methods, instructions or products referred to in the content.

