Article

Spatial–Temporal Variations in Temperature and Precipitation Extremes during 1960–2019 in Guizhou Province, China

Department of Ecology, College of Life Science, Guizhou University, Guiyang 550025, China
*
Author to whom correspondence should be addressed.
Atmosphere 2023, 14(7), 1162; https://doi.org/10.3390/atmos14071162
Submission received: 17 June 2023 / Revised: 3 July 2023 / Accepted: 10 July 2023 / Published: 18 July 2023

Abstract

:
Under the background of global warming, climate extremes have become a crucial issue with distinct heterogeneity features in different regions. Hence, spatial–temporal changes in temperature and precipitation extremes in Guizhou Province were investigated utilizing daily maximums and minimums of temperature and daily precipitation data during 1960–2019 based on trend analysis. It was concluded that, firstly, all warm extremes but warm spell duration indicator (WSDI) are significantly enhanced, whereas for cold extremes, the monthly minimum value of daily minimum temperature (TNn) is significantly enhanced, while cool nights (TN10P), frost days (FD0), ice days (ID0), and cold spell duration indicator (CSDI) are significantly decreased. And all precipitation extremes but consecutive wet days (CWD) have no significant variational trend in Guizhou Province. Secondly, variational trends of temperature extremes are more prominent and robust in western Guizhou Province. Temperature and precipitation extremes show large differences from spring to winter. Thirdly, temperature extremes are closely correlated with strength, area, and the westernmost ridge point index of western Pacific subtropical high (WPSH), whereas precipitation extremes show no distinct correlation with WPSH. The WPSH has significantly strengthened and shifted westward in the past 60 years, leading to less total cloud cover and more downward solar wave flux reaching Earth’s surface, accordingly, exacerbating warm extremes and weakening cold extremes. These results will benefit understanding the heterogeneity of climate extremes at a regional scale.

1. Introduction

Globally averaged temperature has become successively warmer in each of the last four decades than any decade that preceded it since 1850, with an increasing of 0.99 °C being detected in 2001–2020 higher than 1850–1900, and global precipitation over land has also likely increased since 1950 [1]. Climate change could exert significant impacts on the strength and frequency of weather and climate extremes, for instance, flooding, heat waves, drought, cold waves, and hailstorms [1,2]. Furthermore, climatic extremes can also exert severe impacts on the ecological environment and human activities including vegetation greenness, the terrestrial carbon cycle, agricultural production, and human health around the world [3,4,5,6,7,8,9,10]. Considering the spatial–temporal heterogeneity of climatic changes and extremes, the Intergovernmental Panel on Climate Change (IPCC) suggested that it was of significance to investigate climatic changes and extremes at a regional and local scale to better service nations’ and economic organizations’ response to climate change [11]. Globally, over 530,000 people lost their lives owing to 15,000 extreme climate and weather events during 1993–2012 [12]. Thereby, further analysis of long-term variations of climatic extremes such as their magnitude, duration, and frequency, is not only significant for scientific development but is also needed for sustainable economic and social development [13].
China is one of regions in the world where climate change is most evident, and variations of climatic extremes exert significant impacts on the ecological environment, local people’s livelihood, and economic development [14]. Several researchers investigated variations in temperature and precipitation in the whole of China [15,16,17,18,19]. The regional mean temperature in China has increased with a rate of 1.3–1.7 °C (100 yr)−1 [15], and heavy precipitation will enhance the following warming climate across China [16]. Meanwhile, the regionally averaged extreme temperature trends in China are in line with global warming, with significantly upward trends in warmth-related indices and obviously decrease trends occurring in cold-related indices [20]. The extreme precipitation events in China show prominent spatial heterogeneity, which increases with increasing longitude but decreases significantly with increasing latitude [20]. Shi et al. (2018) also pointed out that distinct discrepancies were observed in the spatial pattern of trends in temperature and precipitation extremes across China [18]. In terms of the spatial heterogeneity features of climatic extremes, numerous existing studies were conducted on temperature and precipitation extremes including their magnitude, duration, frequency, and long-term changing trends at a regional or local scale for central and eastern China, Loss Plateau, and North China [21,22,23,24,25,26,27,28,29,30]. For instance, extreme warm events tend to be enhanced while cold events prefer to weaken; by contrast, extreme precipitation events such as erosive rainfall, heavy rainfall, and rainstorm display insignificant variation trend in most regions of Loss Plateau [21]. Gansu Province shows a warmer and more extreme climate in recent years, and variations in precipitation extremes tend to increase, leading to more severe floods and droughts in the future in its northern regions [30]. The temperature extremes increase faster in northern Hunan than those of other regions, and the extreme precipitation indices show a large spatial heterogeneity in Hunan Province [26]. In Inner Mongolia, precipitation extremes slightly decrease overall, warm extremes significantly increase, and cold extremes significantly decrease [29]. A few studies have also investigated spatial and temporal changes of climatic extremes in Southwestern China [31,32,33,34,35]. Li et al. (2012a,b) examined the long-term trend and spatial pattern of climatic extremes and the altitude dependency of trends based on 110 stations in southwestern China in the period of 1961–2008 [31,32]. They found that the warming intensities over Hengduan Mountains and Tibet Plateau were greater comparing to those over the Sichuan basin and Yunnan–Guizhou Plateau. Qin et al. (2015) employed a dataset consisting of 116 meteorological station records in Southwestern China to analyze the features of climatic extremes during 1960–2009 [33]. The above-mentioned studies primarily concerned changes of annual mean climatic extremes, employing weather station data with relatively rough horizontal resolution in Southwestern China.
Karst regions of the world are often termed as being particularly sensitive and vulnerable to climatic extremes due to global warming. Guizhou Province (24°37′ N–29°13′ N and 103°36′ E–109°35′ E, Figure 1) is located at the eastern part of the Yunnan–Guizhou Plateau, China, and is characterized by karst rocky desertification [36,37]. Although a few studies have examined variations of climatic extremes in Southwestern China, there have so far been not enough efforts made on variations of climatic extremes in Guizhou Province. Meanwhile, with the accessibility of real-time updated observation data, the long-term trends and spatial patterns of climatic extremes need to be re-investigated to involve the latest climatic information for better service to adaption strategies in the background of climate change and sustainable development. Hence, it is of significant to carry out a study on the temperature and precipitation extremes in Guizhou Province at an annual scale, employing real-time updated observation data with a more precise resolution. In addition, most of the existing studies were mainly conducted on variations in annual mean climatic indices in Southwestern China, and ignored varied characteristics of climatic extremes among different seasons. Thereby, we also try to examine variation characteristics in climatic extremes in Guizhou Province from spring to winter.
According to the above ideas, the present study has more comprehensively investigated spatial–temporal variations of climatic extremes for the annual and seasonal time scale in Guizhou Province based on meteorological observation data at 61 weather stations across Guizhou Province from 1960 to 2019. The primary objectives here are to (1) characterize the climatology of climatic extremes in Guizhou Province; (2) examine long-term trends of climatic extremes at an annual and seasonal scale employed real-time updated stations observational data up to 2019; and (3) investigate the linkages of climatic extremes in Guizhou Province to several oceanic and atmospheric factors.

2. Datasets and Methodologies

2.1. Study Area and Data

Guizhou Province (24°37′–29°13′ N, 103°36′–109°35′ E, Figure 1) is situated in the middle and upper reaches of the Yangtze River and covers a total area of 176,167 km2. The topography over Guizhou Province increases from east to west and ranges from 121 m to 2887 m, with an average altitude of 1100 m. Carbonate rocks in the karst region are widely distributed and account for 62% of the total area in Guizhou Province [37,38]. The region is a typical subtropical humid monsoon climate area, not merely affected by eastern Asian monsoon, but the Indian monsoon [39]. The mean annual temperature is 15 °C and annual cumulative precipitation is about 1200 mm, mostly occurring during April–September. Guizhou Province has suffered from a variety of extreme climate and weather disasters such as flooding, hailstones, freezing rain, drought, and rainstorms. In order to better understand the heterogeneity of climatic extremes, Guizhou province was divided into four subregions: western Guizhou (WG, including 18 stations of Bijie, Liupanshui, Qianxinan, and Anshun), northern Guizhou (NG, including 11 stations of Zunyi), eastern Guizhou (EG, including 20 stations of Tongren and Qiandongnan), and southern Guizhou (SG, including 12 stations of Guiyang and Qiannan). Meteorological observational data from 84 stations collected from the China Meteorological Administration (CMA) were employed to evaluate spatial–temporal variations of climatic extremes. The stations for which the portion of missing values was greater than 5% during the study period (1960–2019) were eliminated. Meanwhile, data homogeneity evaluation and quality check were conducted based on RClimDex software [40] and RHtest V4 software [41], respectively. These programs were obtained from the website http://etccdi.pacificclimate (accessed on 21 December 2022). Finally, considering the missing value, quality, and homogeneity of the meteorological data, only 61 stations (see Figure 1) were selected to evaluate spatial–temporal variations of climatic extremes during 1960–2019 in Guizhou Province in this study. In addition, the 500 hPa geopotential height (HGT), total cloud cover, downward solar wave flux, and 2 m air temperature were employed by National Centers for Environmental Prediction/National Centers for Atmospheric Research reanalysis products [42]. The topographic data were obtained from ASTER GDEM V3 and downloaded from geospatial data cloud platform (http://www.gscloud.cn, accessed on 10 December 2022).

2.2. Definitions of Climatic Extremes

The 27 climatic extremes consisting of sixteen temperature extremes and eleven precipitation extremes are listed in Table 1. For the convenience of analysis, the temperature indices were divided into two groups: warm extremes (TXx, TNx, TX90p, TN90p, SU25, TR20, GSL, and WSDI), and cold extremes (TXn, TNn, TX10p, TN10p, FD0, ID0, DTR, and CSDI). The eleven precipitation indices consist in ten wet indices (including PRCPTOT, SDII, R50, CWD, R10, R20, R95p, R99p, RX1day, and RX5day), and one dry index of CDD. More specific information about these climatic extremes is accessible on the website http://etccdi.pacificclimate.org/list_27_indices.shtml (accessed on 10 December 2022). All the extremes are obtained from daily maximum and minimum temperatures and precipitations at 61 chosen meteorological stations by RClimDex.

2.3. Oceanic and Atmospheric Indices

With the aim of connecting several oceanic and atmospheric factors to climate extremes, we selected Niño3.4, PDO, and several western Pacific subtropical high (WPSH) indices (e.g., Istr, Iar, Irl, and Iwe). The Niño3.4 index was defined as the area-averaged SST in 5° S–5° N and 170° W–120° W during winter and was employed to indicate El Niño–Southern Oscillation (ENSO) variability. The Pacific decadal oscillation (PDO) index was obtained from http://www.esrl.noaa.gov/psd/data/correlation/pdo.data (accessed on 9 December 2022). The National Climate Center of the CMA provided the WPHS indices, which can well represent the intensity and location of WPSH [43,44,45]. The sum of the difference between HGT ≥ 5880 geopotential meters (gpm) and the 5870 gpm in 10° N–60° N and 110° E–180° E was calculated as the strength index (Istr). The cumulative grids with HGT ≥ 5880 gpm in the above-mentioned region was defined as the area index (Iar). Ridgeline index (Irl) was the mean latitude where u = 0 and u y > 0 , over the corresponding region and the westernmost longitude where the contour of 5880 gpm could reach was termed as the westernmost ridge point index (Iwe).

2.4. Studying Methodologies

2.4.1. Trend Analysis Method

The Theil–Sen (TS) trend and Mann–Kendall (M-K) test were employed to investigate variational trend and significance of climatic extremes. The TS trend is obtained as follows:
T S = m e d i a n ( ( M j M i ) / ( j i ) )   ;   0 < i < j < n  
where M j and M i represent climatic extremes of years   j   and i , respectively. n indicates the length of the focusing period (1960–2019, n = 60). Climatic extremes increase when TS > 0, and vice versa.
The M-K test was utilized to estimate significance for the trend of climatic extremes. The M-K test was obtained as follows:
Z =   H 1 V a r H   ( H > 0 )   0   ( H = 0 ) H + 1 V a r ( H )   ( H < 0 )
where H = j = 1 n 1 i = j + 1 n s g n ( M j M i )
s g n M j M i =   1   ( M j M i > 0 )   0   ( M j M i = 0 ) 1   ( M j M i < 0 )
V a r H = n ( n 1 ) ( 2 n + 5 ) 18
where M j and M i indicate climatic extremes of years j   and i , n indicates length of focusing period (1960–2019, n = 60), and s g n represents the s g n function. The value of statistic Z changes between −∞ and +∞. When the value of Z is larger than 0, it indicates an increasing trend, and vice versa. The trend is significant at p < 0.05 and p < 0.01 when the value of |Z| is greater than 1.96 and 2.58.

2.4.2. Other Methodologies

To investigate connection of several oceanic and atmospheric factors to climate extremes in Guizhou Province, a correlation-analyzing method was conducted on correlations of climatic extremes and several oceanic and atmospheric factors. In addition, a nine-year moving average method was employed to analyze interdecadal variations of climatic extremes. The two-tailed Student’s test was applied to evaluate the significance confidence of correlation and composite [46]. The data processing and maps were conducted by NCAR Command Language (NCL, https://www.ncl.ucar.edu, accessed on 20 January 2023) and ArcGIS 10.5.

3. Results

3.1. Climatology of Temperature and Precipitation Extremes

Figure 2 displays the probability density distribution of 27 climatic extremes across stations in four subsections of Guizhou Province. As seen, for the eight warm indices (Figure 2(a1–a8)), the mean values of annual average TXx of eastern Guizhou are largest (36.36 °C), followed by northern Guizhou (35.65 °C), southern Guizhou (33.78 °C), and western Guizhou (32.32 °C), and they have a similar probability distribution pattern. The spatial variation of mean values of TNx and TR20 is similar to TXx, but with higher maxima of probabilities in TNx over western and northern Guizhou (more than 10%). The mean values of the TX90P, TN90P, GSL, and WSDI and their probability distributions are nearly equal over the four subsections of Guizhou (about 10–11 days for TX90P and TN90P, 340–345 days for GSL, and 4–6 days for WSDI). The mean values of SU25 are largest over eastern Guizhou (145.84 days), followed by southern Guizhou (134.25 days), northern Guizhou (125.55 days), and western Guizhou (107.19 days). Based on probability density distributions of eight warm indices, mean values of TXx, TNx, SU25, GSL, and WDSI are distinctly weaker in western Guizhou than those of eastern and northern Guizhou. For the eight cold indices (Figure 2(b1–b8)), the mean values of TXn, TNn, TX10P, TN10P, DTR, and CSDI show little fluctuation in different subsections. The FD0 and ID0 shows largest mean values in western Guizhou (19.01 and 3.08 days), followed by southern Guizhou (17.76 and 2.21 days), eastern Guizhou (13.02 and 1.36 days), and northern Guizhou (11.84 and 1.00 days). Based on these cold indices, western and southern Guizhou is colder than northern and eastern Guizhou based on the TXn, TNn, FD0, ID0, and CSDI indices.
For the eleven extreme precipitation indices (Figure 2(c1–c11)), the mean values of SDII of the eastern, southern, and western Guizhou are close (though eastern Guizhou receives an average value of about 40 mm (PRCPTOT) than the latter), and greater (by 1 mm/day) than that of the northern Guizhou. The western Guizhou has stronger (e.g., R50, CWD, R95P, and R99P) precipitation extremes and drought (e.g., CDD) than those of other subsections. The mean values of the R10 and R20 tend to be stronger in eastern Guizhou than those of western and southern Guizhou. Although northern Guizhou has the weakest R10 and R20, it receives the strongest RX1day and RX5day compared to other subsections. Based on the probability density distributions in the four subsections of Guizhou, we found that the climatic extremes in Guizhou Province show a distinct spatial heterogeneity.

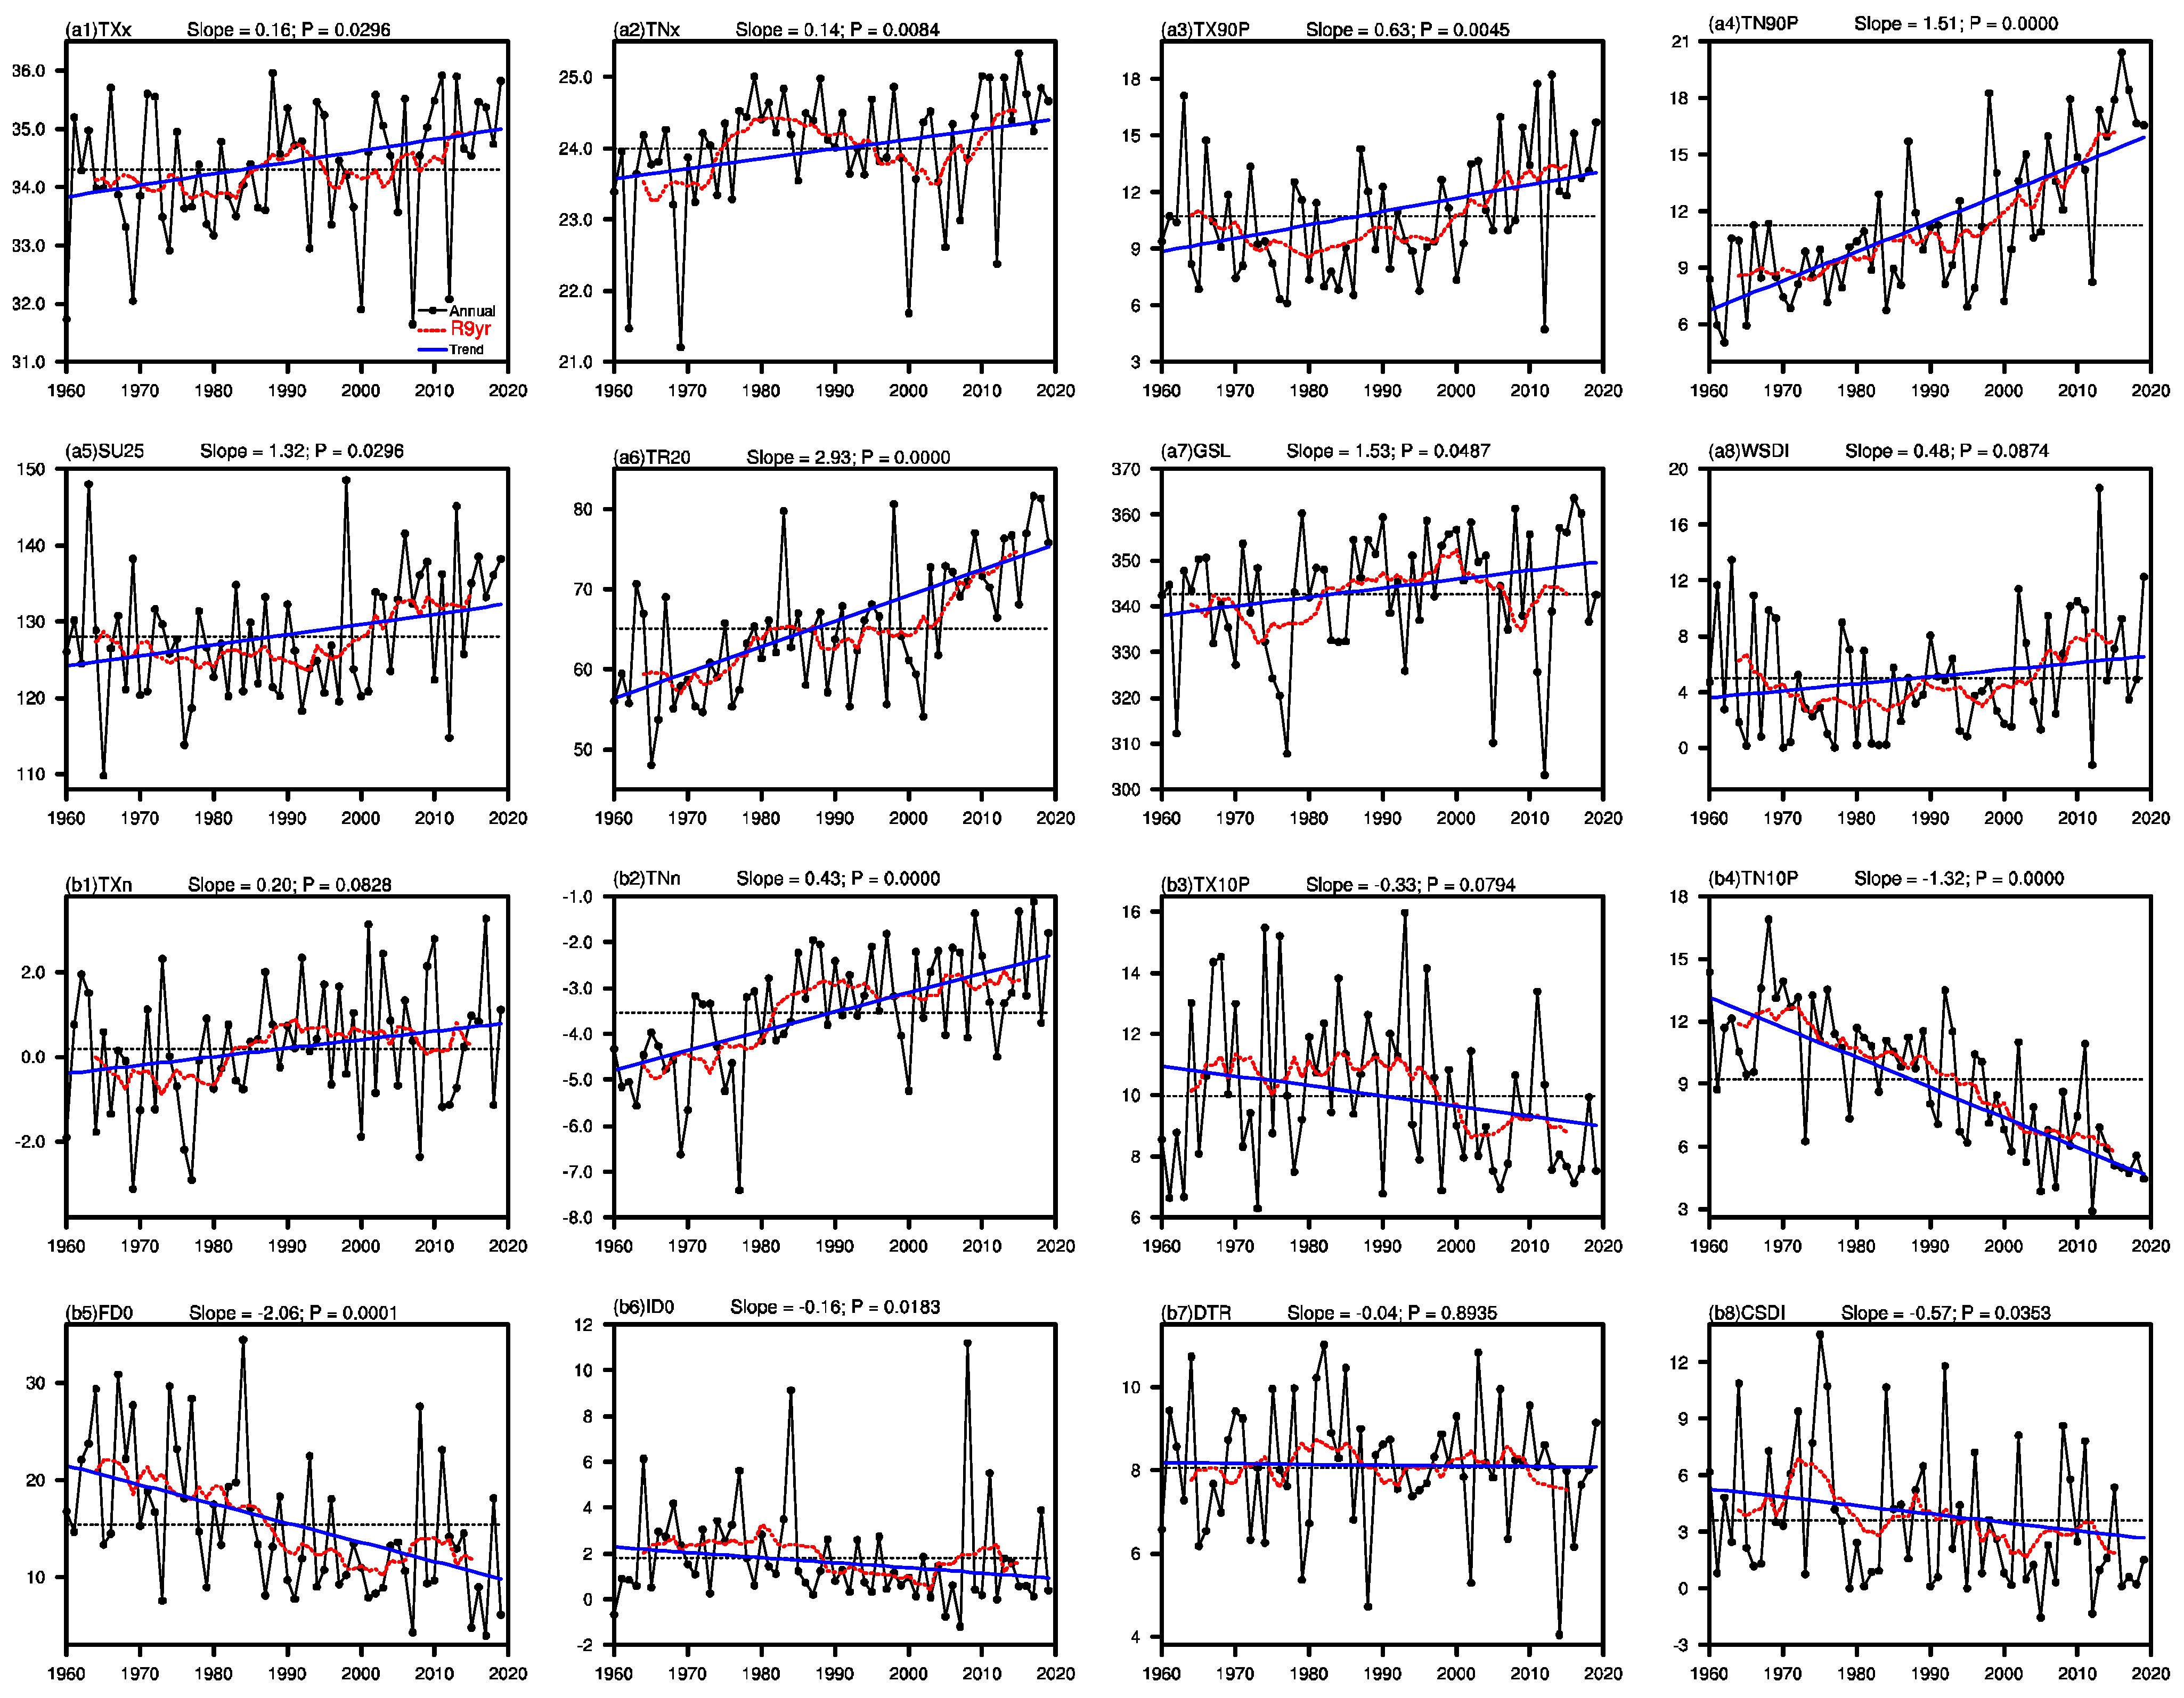
3.2. Variability of Temperature Extremes

3.2.1. Annual Variations in Warm Extremes

We present long-term trends of regional mean for the eight warm indices over Guizhou Province in Figure 3(a1–a8). As see from Figure 3(a1–a8), all warm indices but WSDI show a prominent increasing trend during 1960 to 2019 in Guizhou Province. Specifically, TNx, TX90P, TN90P, and TR20 significantly increase (p < 0.01) at a rate of 0.14 °C/decade, 0.63 °C/decade, 1.51 °C/decade, and 2.93 days/decade, respectively. TXx, SU25, and GSL significantly increase (p < 0.05) by 0.16 °C/decade, 1.32 days/decade, and 1.53 days/decade, respectively. Additionally, distinct interdecadal variations are also observed in the warm extreme indices. For instance, TXx shows a weakening phase during the 1960s to 1970s, increasing in the 1980s, and weakening in the 1990s to early 2000s, then increasing during the 2010s. The TNx displays a strong phase during the mid-1970s to the mid-1990s and after the 2010s, and a weak phase before the mid-1970s and mid-1990s to the 2000s. The TX90P, TN90P, SU25, TR20, and WDSI show a weak phase before the early 2000s and increase after the 2000s. The GSL shows a weak phase during the 1960s to early 1980s, and a strong phase during the early 1980s to mid-2000s, then decreases from the mid-2000s.
Figure 4(a1–a7) present spatial pattern of long-term variational trends in the seven warm indices over Guizhou Province. Note that the WSDI has not been considered here, owing to it having a large scope of zero values in most parts of stations in Guizhou Province throughout the years. Simultaneously, the statistical percentage of meteorological stations with positive or negative trends in Guizhou province is shown in Figure 5a. As seen from Figure 4(a1–a7) and Figure 5, most stations in Guizhou Province show a positive trend in TXx (93.4%), TNx (90.2%), TX90P (95.1%), TN90P (98.4%), SU25 (90.2%), TR20 (86.9%), and GSL (62.3%). And the TXx, TNx, TX90P, TN90P, and TR20 significantly increase (p < 0.05) in the 55.7%, 77.0%, 68.9%, 90.16%, and 82.0% of stations across Guizhou Province. The SU25 with a significant upward trend accounts for 44.3% of stations mainly distributed over western and southeastern Guizhou Province. The GSL shows a significant increasing trend in the 11.5% of stations mainly distributed over western and northern Guizhou Province. In addition, several stations show a significant decreasing trend, for instance, Panxian (TXx, TX90P, and SU25), Guiyang City (TX90P and SU25), and Duyun city (SU25). These results indicate that warm extremes (e.g., TXx, TNx, TX90P, TN90P, SU25, TR20, and GSL) over Guizhou Province significantly increase during 1960–2019. The results here are in line with Zhang et al. (2022), who pointed out a significantly increasing trend in extreme temperature intensities in the Yunnan–Guizhou Plateau based on relatively rough resolution data [35].

3.2.2. Annual Variations in Cold Extremes

Figure 3(b1–b8) display the long-term variational trend of the regional mean cold extremes. As seen from Figure 3(b1–b8), TNn shows a significant increasing trend (p < 0.0001) with a rate of 0.43 °C/decade, and TXn displays insignificant upward trend. TN10P and FD0 significantly decrease (p < 0.0001) at a rate of −1.32 °C/decade and −2.06 days/decade. ID0 and CSDI significantly decrease (p < 0.05) with a rate of −0.16 °C/decade and −0.57 °C/decade. TX10P and DTR have an insignificant downward trend. Distinct interdecadal variations are also seen in the cold extremes, for instance, the TXn and TNn indices weakened before early 1980s, and strengthened after the early 1980s. TX10P, TN10P, FD0, and ID0 enhanced before the 1990s and weakened after the 1990s.
The spatial distribution patterns and statistical percentage are shown in Figure 4(b1–b7) and Figure 5a. Note that the CSDI has not been considered here. Most stations in Guizhou Province show a positive trend in TXn (95.08%) and TNn (98.36%). Specifically, TXn significantly increases (p < 0.05) in the 42.62% stations mainly distributed over western Guizhou, western Qiandongnan, and some scattered stations of Qianxinan and Zunyi. TNn displays a significant upward trend (p < 0.05) in 93.44% of stations spread all over Guizhou Province. Most stations of Guizhou Province display a decreasing trend in TN10P (98.36%), FD0 (98.36%), TX10P (88.52%), and DTR (85.25%), respectively. And 95.08%, 91.80%, and 62.30% of stations significantly decreased (p < 0.05) in TN10P, FD0, and DTR spread all over Guizhou Province, respectively. TX10P shows a significant downward trend in 50.82% stations mainly distributed over western Guizhou and northern Qiannan. The ID0 significantly decreased in 13.11% of stations over western Guizhou.
Figure 5b–e also display the statistical percentage of meteorological stations with a positive or negative trend in the four subsections of Guizhou. In western Guizhou, TN90P and TNn (TN10P and FD0) significantly increased (decreased) in all the 18 stations, and TNx, TX90P, and TR20 significantly increased in more than 80% of 18 stations. Concurrently, TXx and SU25 (DTR) significantly increased over 60% of the stations in western Guizhou. In the northern Guizhou, only TNn and FD0 showed a significant change in trend in about 80% of the 11 stations, and about 60% of stations had a significant increasing trend in TNx, TX90P, and TR20. In eastern Guizhou, TN90P, TR20, and TNn (TN10P and FD0) significantly increased (decreased) in more than 80% of stations, and TXx, TNx, TX90P, and DTR significantly increased (decreased) in about 60% of stations. Furthermore, in southern Guizhou, TNn and TN10P had a significant variation trend in all the 12 stations, and TNx, TN90P, TR20 (FD0) significantly increased (decreased) in about 60% of the stations. Based on the above results, the long-term trend of these climatic extremes is most significant and robust in western Guizhou.
Figure 6 also presents the correlation coefficients among temperature extremes. Annual mean temperature (Tave) is significantly positively correlated with the warm extreme indices including TXx (0.37), TNx (0.35), TX90 (0.35), TN90 (0.82), SU25 (0.69), TR20 (0.57), GSL (0.44), and WSDI (0.55). Simultaneously, Tave is significantly positively associated with the cold extremes of TXn (0.41) and TNn (0.48), but negatively correlated with TX10 (−0.69), TN10 (−0.62), FD0 (−0.64), ID0 (−0.41), and CSDI (−0.40). Warm extremes are positively correlated with each other and two series of cold extremes (e.g., TXn and TNn), and negatively linked with six series of cold extremes (e.g., TX10, TN10, FD0, ID0, DTR, and CSDI). For example, TN90P is significantly positively correlated with TXx (0.37), TNx (0.51), TX90P (0.66), SU25 (0.63), TR20 (0.74), GSL (0.34), WSDI (0.46), and TNn (0.51), and negatively linked with TN10 (−0.54), FD0 (−0.46). The two series of cold extremes such as TXn and TNn are positively correlated with each other, and negatively linked with another six cold extremes (TX10P, TN10P, FD0, ID0, DTR, and CSDI). Concurrently, TX10P, TN10P, FD0, ID0, and CSDI are positively correlated with each other, but DTR has no correlation with the other warm and cold extremes.

3.2.3. Seasonal Variations in Temperature Extremes

Among sixteen temperature extremes, there are eight indices (i.e., TXx, TNx, TX90P, TN90P, TXn, TNn, TX10P, and TN10P) that have a monthly time resolution which inspires us to investigate their seasonal variational features. Spatial distribution patterns and statistical percentage from spring to winter in Guizhou Province are shown in Figure 7(a1–d4) and Figure 8. For four warm extremes, most stations in Guizhou Province show a positive trend during spring to autumn in TXx (86.88%, 96.72%, and 95.08%), TNx (95.08%, 96.72%, and 95.08%), TX90P (91.80%, 93.44%, and 93.44%), and TN90P (96.72%, 96.72%, and 98.36%). Specifically, in spring, TNx and TN90P display a significant upward trend in 55.74% and 63.93% stations mainly distributed over Bijie, Anshun, northern Qiannan, and eastern Qiandongnan. However, stations with a significant increasing trend in TXx and TX90P only account for 14.75% and 31.15%, and stations with a significant decreasing trend accounting for 1.64% in spring. In summer and autumn, TXx (TNx, TX90P, and TN90P) show a significant increasing trend in 83.61% and 60.66% (85.25% and 62.30%, 75.41% and 59.02%, 86.89% and 83.61%) of stations spread all over Guizhou Province. In winter, most stations of Guizhou Province have a positive trend in TNx (90.16%) and TN90P (93.44%), and there are 34.43% and 11.48% of stations where the increasing trend is significant. In addition, the TXx and TX90P increase in northern Guizhou and decrease in southern Guizhou, and these changes are insignificant in most stations. Therefore, the four warm extremes have had an increasing tendency in the recent 60 years in most stations of Guizhou Province from spring to autumn (Figure 8). However, the TNx and TN90P display an insignificant increasing trend over northern Guizhou Province, but show an opposite variational feature in the southern part.
For four cold extremes Figure 7(e1–h4) and Figure 8, TXn shows a positive trend in most of stations in spring and winter, with 67.2% stations having a significant increasing trend in spring. Concurrently, TXn significantly decreased in 21.31% of stations mainly distributed over northwestern Guizhou during summer, and significantly increased in 31.15% of stations, mainly distributed over southwestern Guizhou in autumn. Analogously, the TX10P significantly decreased in 56% of stations during spring, and only several stations display a significant negative trend during summer to winter. TNn shows a positive trend in most stations in Guizhou Province from spring to winter; for instance, stations that significantly increase account for about 92%, 84%, 87%, and 75% of the total stations and spread all over the Guizhou Province during spring to winter, respectively. Analogously, TN10P also significantly decreased within the stations of significant negative trend, accounting for about 85%,70%, 84%, and 84% of the total stations during spring to winter. According to the above results, the long-term variation trend of warm and cold extremes displays obvious differences among the seasons. For instance, TXx, TNx, TX90P, TN90P, TXn, and TNn (TX10P and TN10P) regionally averaged over Guizhou significantly increased (decreased) in spring (Table 2). During summer and autumn, TXx, TNx, TX90P, TN90P, TNn, and TN10P showed significant variational trend, whereas only TN90P, TNn, and TN10P had a significant change trend in winter.

3.3. Variations of Precipitation Extremes

Figure 9 displays the regional annual series of eleven precipitation extremes. As seen from Figure 9, only consecutive wet days (CWD) significantly decreased (p < 0.01) with a rate of −0.14 days/decade. R50mm, R99P, RX1day, SDII, CDD, R95P, and RX5day display an insignificant increasing trend. Concurrently, PRCPTOT, R10mm, and R20mm show an insignificant negative trend. Precipitation extremes also show distinct interdecadal variations. For instance, PRCPTOT, SDII, R10mm, and R20mm enhanced before 1980 and 1995–2001, and decreased in 1980–1994 and 2002–2012. R50mm, R95P, R99P, PX1day, and RX5day weakened before 1990 and 2000–2010, and increased during 1990–2000. In addition, the CDD weakened before 1980 and then weakly increased.
The spatial distributions of precipitation extremes are exhibited in Figure 10. The stations with significant decreasing trend for CWD account for about 31% of stations in Guizhou and are primarily distributed over Bijie, Liupanshui, Zunyi, Tongren, northern Guiyang, and central Qiandongnan. R50mm shows significant upward trend along central Guizhou Province, and a negative trend in Panxian, and the trend in other stations is zero. R99P and RX1day display significant positive trend in several scattered stations. Although the regional means of R20mm and R10mm do not show a significant trend, there are several stations that display a significant negative trend primarily distributed over Liupanshui, Zunyi, and Bijie. Owing to these significant negative trends in R20mm, R10mm, and CWD, PRCPTOT shows a negative trend in the corresponding region. The positive trend in R95P, R50mm, RX1day, and R99P over northern Qiannan and eastern Qiandongnan may lead to a significant positive trend in PRCPTOP. The spatial variations of RX1day and RX5day during spring to summer were also analyzed. The spatial distribution of RX1day and RX5day are quite close during spring and autumn. Specifically, they exhibit an insignificant weakening trend in most parts of Guizhou during spring and autumn, except the station of Meitan and Xingyi (Panxian, Meitan, and Dejiang), which may contribution to the obviously negative trend in annual mean PRCPTOT. During summer and winter, RX1day and RX5day increases over western Bijie, Guiyang, northern Qiannan, Qiandongnan, and Tongren, which may account for the prominent increasing of annual average PRCPTOT.

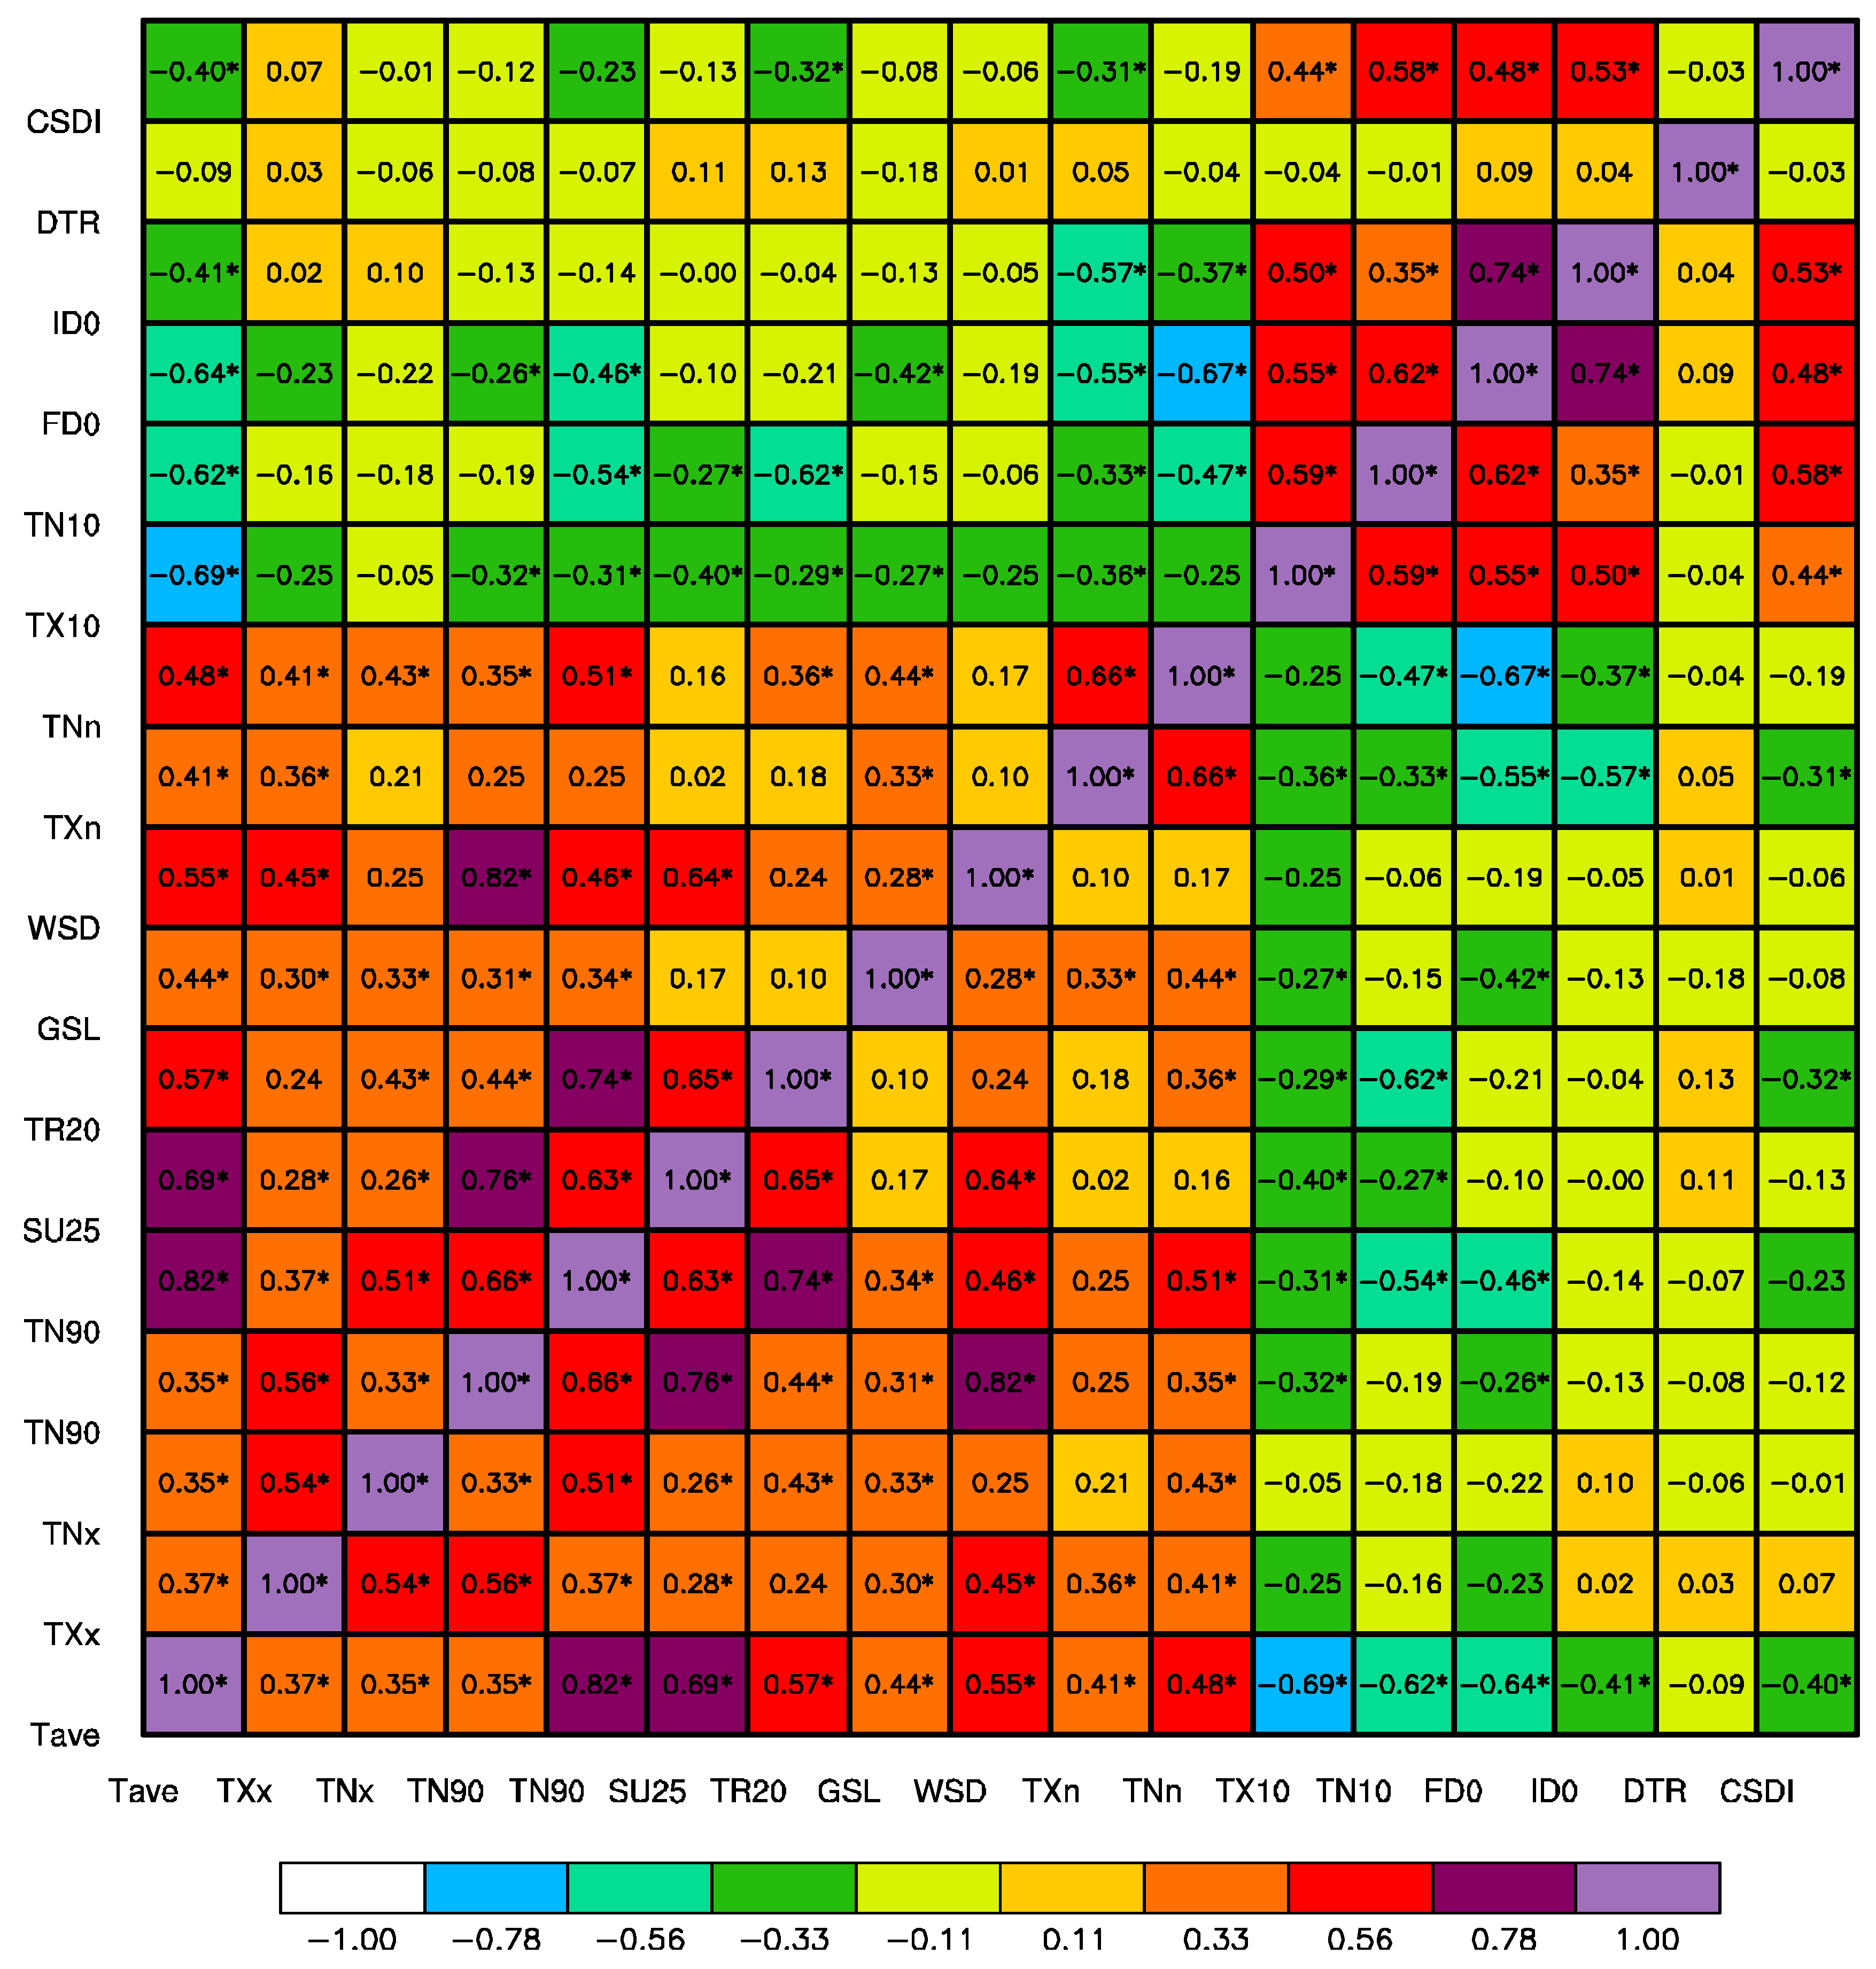
3.4. Correlations with Several Oceanic and Atmospheric Indices

Considering the variations of atmospheric circulation would exert some impact on climatic extremes, we have analyzed the correlations between climatic extremes and some representative atmospheric circulation indices in Table 3, for instance, the Niño3.4, PDO, strength and the position indices of WPSH (strength, area, ridgeline latitude, and westernmost ridge index). Among the warm extremes, TXx and TX90P are significantly positively correlated with Niño3.4, and five of the cold extremes (TNn, TN10P, FD0, DTR, and CSDI) are significantly negatively connected with Niño3.4. PDO is significantly positively related to TNx, TN90P, and TNn, and negatively linked to FD0. What is noteworthy is that Istr and Iar are significantly positively connected with Tave, TX90P, TN90P, SU25, TR20, TXn, and TNn, and show a significant negative correlation with TX10P, TN10P, FD0, ID0, and CSDI. In addition, Iwe also displays a semblable but opposite correlation the above-mentioned twelve indices compared to the strength and area index. Irl has a significant negative correlation with TX10P, TN10P, and a positive connection with DTR. The precipitation extremes have no significant correlation with the selected six atmospheric circulation indices. The strong and close connection of the WPSH indices with temperature extremes inspire us to further explore long-term variation trends in WPSH. The Istr and Iar show a significant increasing trend at a rate of 3.71 gpm/decade and 1.83 grids/decade, respectively, and the westernmost ridge point has a distinct downward trend at a rate of −2.18 longitude/decade. Concurrently, distinct interdecadal variations are also observed in the three indices, for instance, the WPSH weakened and shifted eastward before the early 1980s and enhanced and moved westward after early 1980s. The ridge latitude has a weak and insignificant increasing trend and weak interdecadal variations.
Based on the close correlation between climatic extremes and strength, area, and westernmost ridge point index of the WPSH, composite differences of 500-HGT, total cloud cover, downward solar wave flux, and 2 m air temperature between the west and east years of the WPSH are further discussed in Figure 11. Nine west WPSH years (1967, 1968, 1971, 1972, 1974, 1975, 1989, and 2000) and ten east WPSH years (1979, 1983, 1987, 1994, 1995, 1998, 2003, 2005, 2010, and 2016) during 1960–2016 were chosen according to the ±1 standard deviations of the Iwe index. For the west years, the WPSH is obviously enhanced and shifted more westward, with the westernmost point reaching the western Indo-China peninsula. Significant positive HGT at 500 hPa is distinctly observed over eastern Asia and the tropical and subtropical Pacific (Figure 11a). Under the impacts of high-pressure systems, the total cloud cover is significantly weakened and leads to a more downward solar wave flux reaching Earth’s surface in northern and southwestern China (Figure 11b). In addition, the adiabatic warming caused by a stronger WPSH is also one of the important causes of warming extreme temperature. Hence, significant warming temperature is observed over the corresponding regions, and is of benefit to an increasing or decreasing trend of the warm or cold extremes.

4. Conclusions and Discussion

In this study, 27 climatic extremes were chosen to examine the spatial and temporal variations of climatic extremes based on the Theil–Sen trend and Mann–Kendall test method from 1960 to 2019 in Guizhou province at annual and seasonal time scales. Concurrently, their correlations to some representative atmospheric circulations were also analyzed. Under the background of global warming, the spatial distribution of climatic extremes has a feature of distinct heterogeneity. For instance, warm extremes (indicated by TXx, TNx, SU25, GSL, and WDSI) and cold extremes (indicated by TXn, TNn, FD0, ID0, and CSDI) tend to be weaker (stronger) in western and southern Guizhou than those of eastern and northern Guizhou. Concurrently, western Guizhou has stronger (e.g., R50, CWD, R95P, and R99P) precipitation extremes and drought (indicated by the CDD) than those of other subsections. In the past 60 years, at an annual time scale, all the warm indices, except for the WSDI, were significantly enhanced, while among the cold extremes, the TNn was significantly enhanced, the TN10P, FD0, ID0, and CSDI significantly decreased, and the TXn, TX10P, and DTR insignificantly decreased. The spatial variations of the climatic temperature extremes in Guizhou show a distinct heterogeneity, with most significant and robust long-term variation trends in western Guizhou. The long-term variation trend of the warm and cold extremes displays an obvious difference among the seasons. In spring, all the extremes show a significant variational trend; during summer and autumn, seven of the eight extremes (TXx, TNx, TX90P, TN90P, TNn, and TN10P) show a significant variational trend, whereas only three of them (TN90P, TNn, and TN10P) have a significant change trend in winter. Among the eleven precipitation extremes, only the CWD significantly decreased, the R50mm, R99P, RX1day, SDII, CDD, R95P, and RX5day insignificantly weakly increased, and the PRCPTOT, R10mm, and R20mm weakly decreased. The spatial pattern of the precipitation extremes showed significant negative trends in R20mm, R10mm, and CWD over western and northern Guizhou and a positive trend of R95P, R50mm, RX1day, and R99P over northern Qiannan and eastern Qiandongnan may lead to a significant variational trend of PRCPTOT. The temperature extremes have a close correlation with Niño3.4, PDO, and WPSH, especially strength, area, and westernmost ridge point index of the WPSH. When the WPSH is obviously enhanced and shifted more westward, a high-pressure system controlled East Asia, resulting in the significant weakening of total cloud cover and more downward solar wave flux reaching Earth’s surface in northern and southwestern China. Hence, significant warming air temperature was observed over the corresponding regions, and was of benefit to the increasing or decreasing trend of the warm or cold extremes.
Global warming is deteriorating the climate and inducing special climatic extremes, enhancing the frequency of warm days and nights, and weakening the frequency of cold days and nights [11]. In this study, all the warm extremes but WSDI significantly increased, while, for cold extremes, TNn significantly enhanced, whereas TN10P, FD0, ID0, and CSDI significantly decreased, and TXn, TX10P, and DTR insignificantly decreased in Guizhou province in the past 60 years (Figure 3 and Figure 6). Variations of climatic extremes in Guizhou Province have been similar to those elsewhere, but there exist some differences. Compared to the regional average of the entirety of China’s mainland during 1960–2016 [40], the long-term variational trend of TXx, TNX, SU25, TX10P, ID0, DTR, and CSDI in Guizhou is obviously weaker, and that for TN90P, TR20, WSDI, and TN10P is stronger. Concurrently, TX90P, TN90P, SU25, WSDI, TX10P, TN10P, FD0, and CSDI are distinctly weaker than those in Inner Mongolia based on the period of 1960–2017 [29]. The weaker long-term variation trends in Guizhou Province might be associated with relatively slow urbanization and increasing vegetation greenness [47]. In addition, the warm extremes of TXx, TX90P, TN90P, and SU25 are distinctly weaker, and the TR20, TNn, and FD0 are stronger than those regionally averaged by the Yunnan–Guizhou Plateau (1960–2019; Zhang et al., 2022 [35]). Although there are some previous studies considering the long-term variations of climatic extremes over southwestern China or the Yunnan–Guizhou Plateau, including Guizhou Province, their spatial variations have a prominent heterogeneity. Hence, it is necessary and of significance to separately examine variations of climatic extremes in Guizhou Province in this study. As was expected, spatial variations of climatic extremes also exhibit a distinct heterogeneity within the scope of Guizhou Province, with most significant and robust long-term variation trends in western Guizhou Province. Concurrently, numerous studies primarily concerned annual averages of climatic extremes; this study has also analyzed long-term variation features during spring to winter and found that there were no obvious differences among different seasons. However, this study mainly focused on examining the spatial–temporal variations of climatic extremes. More works in the future need be devoted to exploring the possible causes and physical mechanisms of the specific extreme climatic events in Guizhou Province.

Author Contributions

Conceptualization, X.X.; methodology, X.X.; data analysis, X.X. and C.M.; data curation, X.X. and S.H.; writing—review and editing X.X. and S.H.; writing—original draft preparation, X.X.; visualization, X.X. and S.H.; supervision, X.X.; project administration, X.X.; funding acquisition, X.X. All authors have read and agreed to the published version of the manuscript.

Funding

This research was supported by the National Natural Science Foundation of China Grants 41965004, 41705069.

Institutional Review Board Statement

Not applicable.

Informed Consent Statement

Not applicable.

Data Availability Statement

Meteorological data were taken from http://data.cma.cn/ (accessed on 10 November 2022). Atmospheric temperature and geopotential height data were taken from https://psl.noaa.gov/data/gridded/data.ncep.reanalysis.html (accessed on 10 November 2022).

Acknowledgments

We thank two anonymous reviewers for their constructive suggestion, which had led to a significant improvement of the manuscript. We are grateful for all providers of open-source datasets used in this study.

Conflicts of Interest

The authors have no relevant financial or non-financial interest to disclose.

References

  1. IPCC. Summary for policymakers. In Climate Change 2021: The Physical Science Basis. Contribution of Working Group I to the Sixth Assessment Report of the Intergovernmental Panel on Climate Change; Masson-Delmotte, V., Zhai, P., Pirani, A., Connors, S.L., Péan, C., Berger, S., Caud, N., Chen, Y., Goldfarb, L., Gomis, M.I., Eds.; Cambridge University Press: Cambridge, UK; New York, NY, USA, 2021; pp. 3–32. [Google Scholar]
  2. IPCC. A Special Report of Working Groups I and II of the Intergovernmental Panel on Climate Change. In Managing the Risks of Extreme Events and Disasters to Advance Climate Change Adaptation; Cambridge University Press: Cambridge, UK; New York, NY, USA, 2012; p. 582. [Google Scholar]
  3. Lloret, F.; Escudero, A.; Iriondo, J.; Vilalta, J.; Valladares, F. Extreme climatic events and vegetation: The role of stabilizing processes. Glob. Chang. Biol. 2012, 18, 797–805. [Google Scholar] [CrossRef]
  4. Hutyra, L.R.; Munger, J.W.; Nobre, C.A.; Saleska, S.R.; Vieira, S.A.; Wofsy, S.C. Climatic variability and vegetation vulnerability in Amazonia. Geophys. Res. Lett. 2005, 32, L24712. [Google Scholar] [CrossRef] [Green Version]
  5. Li, S.; Wei, F.L.; Wang, Z.; Shen, J.S.; Liang, Z.; Wang, H.; Li, S.C. Spatial heterogeneity and complexity of the impact of extreme climate on vegetation in China. Sustainability 2021, 13, 5748. [Google Scholar] [CrossRef]
  6. Reichstein, M.; Bahn, M.; Ciais, P.; Frank, D.; Mahecha, M.D.; Seneviratne, S.I.; Zscheischler, J.; Beer, C.; Buchmann, N.; Frank, D.C.; et al. Climate extremes and the carbon cycle. Nature 2013, 500, 287–295. [Google Scholar] [CrossRef]
  7. Frank, D.; Reichstein, M.; Bahn, M.; Thonicke, K.; Frank, D.; Mahecha, M.D.; Smith, P.; Van der Velde, M.; Vicca, S.; Babst, F.; et al. Effects of climate extremes on the terrestrial carbon cycle: Concepts, processes and potential future impacts. Glob. Chang. Biol. 2015, 21, 2861–2880. [Google Scholar] [CrossRef] [Green Version]
  8. Piao, S.L.; Zhang, X.P.; Chen, A.P.; Liu, Q.; Lian, X.; Wang, X.H.; Peng, S.S.; Wu, X.C. The impacts of climate extremes on the terrestrial carbon cycle: A review. Sci. China Earth Sci. 2019, 62, 1551–1563. [Google Scholar] [CrossRef]
  9. Aryal, J.P.; Sapkota, T.B.; Stirling, C.M.; Jat, M.L.; Jat, H.S.; Rai, M.; Mittal, S.; Sutaliya, J.M. Conservation agriculture-based wheat production better copes with extreme climate events than conventional tillage-based systems: A case of untimely excess rainfall Haryana, India. Agric. Ecosyst. Environ. 2016, 233, 325–335. [Google Scholar] [CrossRef]
  10. Epstein, P.R. Climate change and human health. N. Engl. J. Med. 2005, 353, 1433–1436. [Google Scholar] [CrossRef] [PubMed] [Green Version]
  11. IPCC. Summary for policymakers. In Climate Change 2007: The Physical Science Basis, Contribution of Working Group I to the Forth Assessment Report of the Intergovernmental Panel on Climate Change; Solomon, S., Qin, D., Manning, M., Chen, Z., Marquis, M., Averyt, K.B., Tignor, M., Miller, H.L., Eds.; Cambridge University Press: Cambridge, UK; New York, NY, USA, 2007. [Google Scholar]
  12. Hashim, J.H.; Hashim, Z. Climate change, extreme weather events, and human health implications in the Asia Pacific region. Asia Pac. J. Public Health 2016, 28, 8S–14S. [Google Scholar] [CrossRef]
  13. Barrett, B.; Charles, J.W.; Temte, J.I. Climate change, human health, and epidemiological transition. Prev. Med. 2015, 70, 69–75. [Google Scholar] [CrossRef] [Green Version]
  14. Brown, P.J.; Bradley, R.S.; Keimig, F.T. Changes in extreme climate indices for the northeastern United States, 1870–2005. J. Clim. 2010, 23, 6555–6572. [Google Scholar] [CrossRef]
  15. Yan, Z.W.; Ding, Y.H.; Zhai, P.M.; Song, L.C.; Cao, L.J.; Li, Z. Re-assessing climatic warming in China since 1900. J. Meteorol. Res. 2020, 34, 243–251. [Google Scholar] [CrossRef]
  16. Zhang, W.X.; Zhou, T.J. Increasing impacts from extreme precipitation on population over China with global warming. Sci. Bull. 2020, 65, 243–252. [Google Scholar] [CrossRef]
  17. Sun, J.Q.; Ao, J. Changes in precipitation and extreme precipitation in a warming environment in China. Chin. Sci. Bull. 2012, 58, 1395–1401. [Google Scholar] [CrossRef] [Green Version]
  18. Shi, J.; Cui, L.L.; Wen, K.M.; Tian, Z.; Wei, P.P.; Zhang, B.W. Trends in the consecutive days of temperature and precipitation extremes in China during 1961–2015. Environ. Res. 2018, 161, 381–391. [Google Scholar] [CrossRef]
  19. Yang, X.L.; Zhou, B.T.; Xu, Y.; Han, Z.Y. CMIP6 evaluation and projection of temperature and precipitation over China. Adv. Atmos. Sci. 2021, 38, 817–830. [Google Scholar] [CrossRef]
  20. Wang, X.Y.; Li, X.Q.; Wang, M.M.; Li, Y.L.; Gong, X.W.; Chen, Y.P.; Chen, Y.; Cao, W.J. Changes in daily extreme temperature and precipitation events in mainland China from 1960 to 2016 under global warming. Int. J. Climatol. 2020, 41, 1465–1483. [Google Scholar] [CrossRef]
  21. Sun, W.Y.; Mu, X.M.; Song, X.Y.; Wu, D.; Cheng, A.F.; Qiu, B. Changes in extreme temperature and precipitation events in the Loess Plateau (China) during 1960–2013 under global warming. Atmos. Res. 2016, 168, 33–48. [Google Scholar] [CrossRef]
  22. Fan, X.H.; Wang, M.B. Change trends of air temperature and precipitation over Shanxi Province, China. Theor. Appl. Climatol. 2011, 103, 519–531. [Google Scholar] [CrossRef]
  23. Fan, X.H.; Wang, Q.X.; Wang, M.B. Changes in temperature and precipitation extremes during 1959-2008 in Shanxi, China. Theor. Appl. Climatol. 2012, 109, 283–303. [Google Scholar] [CrossRef]
  24. Du, M.C.; Zhang, J.Y.; Yang, Q.L.; Wang, Z.L.; Bao, Z.X.; Liu, Y.L.; Jin, J.L.; Liu, C.S.; Wang, G.Q. Spatial and temporal variation of rainfall extremes for the North Anhui Province Plain of China over 1976–2018. Nat. Hazards 2021, 105, 2777–2797. [Google Scholar] [CrossRef]
  25. Wen, X.H.; Wu, X.Q.; Gao, M. Spatiotemporal variability of temperature and precipitation in Gansu Province (Northwest China) during 1951–2015. Atmos. Res. 2017, 197, 132–149. [Google Scholar] [CrossRef]
  26. Chen, A.J.; He, X.G.; Guan, H.D.; Cai, Y. Trends and periodicity of daily temperature and precipitation extremes during 1960–2013 in Hunan Province, central south China. Theor. Appl. Climatol. 2018, 132, 71–88. [Google Scholar] [CrossRef]
  27. Xu, F.; Zhou, Y.Y.; Zhao, L.L. Spatial and temporal variability in extreme precipitation in the Pearl River Basin, China from 1960 to 2018. Int. J. Climatol. 2021, 42, 797–816. [Google Scholar] [CrossRef]
  28. Li, X.; Zhang, K.; Gu, P.R.; Feng, H.T.; Yin, Y.F.; Chen, W.; Cheng, B.C. Changes in precipitation extremes in the Yangtze River Basin during 1960–2019 and the association with global warming, ENSO, and local effects. Sci. Total Environ. 2022, 760, 144244. [Google Scholar] [CrossRef] [PubMed]
  29. Tong, S.Q.; Li, X.Q.; Zhang, J.Q.; Bao, Y.H.; Bao, Y.B.; Na, L.; Si, A.L. Spatial and temporal variability in extreme temperature and precipitation events in Inner Mongolia (China) during 1960–2017. Sci. Total Environ. 2019, 649, 75–89. [Google Scholar] [CrossRef]
  30. An, D.; Du, Y.H.; Berndtsson, R.; Niu, Z.R.; Zhang, L.; Yuan, F.F. Evidence of climate shift for temperature and precipitation extremes across Gansu Province in China. Theor. Appl. Climatol. 2020, 139, 1137–1149. [Google Scholar] [CrossRef] [Green Version]
  31. Li, Z.X.; He, Y.Q.; Wang, P.Y.; Theakstone, W.H.; An, W.L.; Wang, X.F.; Lu, A.G.; Zhang, W.; Cao, W.H. Changes of daily climate extremes in southwestern China during 1961–2008. Glob. Planet Chang. 2012, 80–81, 255–272. [Google Scholar] [CrossRef]
  32. Li, Z.X.; He, Y.Q.; Therkstone, W.H.; Wang, X.F.; Zhang, W.; Cao, W.H.; Du, J.K.; Xin, H.J.; Chang, L. Altitude dependency of trends of daily climate extremes in southwestern China, 1961–2008. J. Geogr. Sci. 2012, 22, 416–430. [Google Scholar] [CrossRef]
  33. Qin, N.X.; Wang, J.N.; Yang, G.S.; Chen, X.; Liang, H.Y.; Zhang, J.B. Spatial and temporal variations of extreme precipitation and temperature events for the Southwest China in 1960–2009. Geoenviron. Disasters 2015, 2, 4. [Google Scholar] [CrossRef] [Green Version]
  34. Wang, S.J.; Jia, S.T.; Xin, H.J. Spatio-temporal characteristics of temperature and precipitation in Sichuan Province, Southwestern China, 1960–2009. Quatern. Int. 2013, 286, 103–115. [Google Scholar] [CrossRef]
  35. Zhang, K.X.; Luo, J.J.; Peng, J.T.; Zhang, H.C.; Ji, Y.; Wang, H. Analysis of extreme temperature variations on the Yunnan-Guizhou Plateau in Southwestern China over the Past 60 years. Sustainability 2022, 14, 8291. [Google Scholar] [CrossRef]
  36. Song, L.H.; Zhang, Y.G.; Fang, J.F.; Gu, Z.X. Karst development and the distribution of karst drainage systems in Dejiang, Guizhou Province, China. J. Hydrol. 1983, 61, 3–17. [Google Scholar] [CrossRef]
  37. Wang, S.J.; Liu, Q.M.; Zhang, D.F. Karst rock desertification in Southwestern China: Geomorphology, landuse, impact and rehabilitation. Land Degrad. Dev. 2004, 15, 115–121. [Google Scholar] [CrossRef]
  38. Bai, X.Y.; Wang, S.J.; Xiong, K.N. Assessing spatial-temporal evolution processes of karst rocky desertification and indications for restoration strategies. Land Degrad. Dev. 2013, 24, 47–56. [Google Scholar] [CrossRef]
  39. Cao, J.; Wen, D.Y.; Yang, R.W.; Zhu, Y.M. Impact of Indian and East Asian summer monsoons on the diurnal temperature range of the low-latitude highlands of China in the rainy season. J. Clim. 2022, 35, 2161–2172. [Google Scholar] [CrossRef]
  40. Zhang, X.; Yang, F. RClimDex (1.1) 2013, User Manual. Available online: https://www.wcrp-climate.org/etccdi (accessed on 1 December 2022).
  41. Wang, X.L.; Chen, H.; Wu, Y.; Feng, Y.; Pu, Q. New techniques for detection and adjustment of shifts in daily precipitation data series. J. Appl. Meteor. Clim. 2010, 49, 2416–2436. [Google Scholar] [CrossRef]
  42. Kalnay, E.; Kanamitsu, M.; Kistler, R.; Collins, W.; Deaven, D.; Gandin, L.; Iredell, M.; Saha, S.; White, G.; Woollen, J.; et al. The NCEP/NCAR 40-year reanalysis project. Bull. Am. Meteorol. Soc. 1996, 77, 437–471. [Google Scholar] [CrossRef]
  43. Duan, A.M.; Sun, R.Z. Impact of surface sensible heating over the Tibetan Plateau on the western Pacific subtropical high: A land-air-sea interaction perspective. Adv. Atmos. Sci. 2017, 34, 157–168. [Google Scholar] [CrossRef]
  44. Li, J.N.; Meng, W.G.; Wang, A.Y.; Liu, Y.M.; Feng, R.Q.; Hou, E.B. Climatic characteristics of the intensity and position of the subtropical high in the western Pacific. Trop. Geogr. 2003, 23, 35–39. (In Chinese) [Google Scholar]
  45. Gao, T.; Yu, J.Y.; Peak, H. Impacts of four northern-hemisphere teleconnection patterns on atmospheric circulation over Eurasia and the Pacific. Theor. Appl. Climatol. 2017, 129, 815–831. [Google Scholar] [CrossRef] [Green Version]
  46. Wilks, D.S. Statistical Methods in the Atmospheric Science; Academic Press: San Diego, CA, USA, 2006; p. 648. [Google Scholar]
  47. Xue, X.; Wang, Z.J.; Hou, S.S. NDVI-based vegetation dynamics and response to climate changes and human activities in Guizhou Province, China. Forests 2023, 14, 753. [Google Scholar] [CrossRef]
Figure 1. Location, provincial/municipal boundaries, elevation (shading), and spatial distribution of the 61 meteorological stations in Guizhou province.
Atmosphere 14 01162 g001
Figure 2. Probability density curves of extreme temperature indices for (a1a8) warm extremes, (b1b8) cold extremes, and (c1c11) precipitation extremes across western Guizhou (WG, including 18 stations of Bijie, Liupanshui, Qianxinan, and Anshun), northern Guizhou (NG, including 11 stations of Zunyi), eastern Guizhou (EG, including 20 stations of Tongren and Qiandongnan), and southern Guizhou (SG, including 12 stations of Guiyang and Qiannan). The mean values of climatic extremes are listed in each density plot, and red, purple, brown, and blue curves represent the WG, NG, EG, and SG, respectively.
Atmosphere 14 01162 g002
Figure 3. Time series of regional mean of annual average warm (a1a8) and cold (b1b8) extremes (black circled line) as well as linear trends (blue solid line) and 9-year moving averages (red dashed line) in Guizhou province from 1960 to 2019: (a1) TXx, (a2) TNx, (a3) TX90P, (a4) TN90P, (a5) SU25, (a6) TR20, (a7) GSL, and (a8) WSDI, (b1) TXn, (b2) TNn, (b3) TX10P, (b4) TN10P, (b5) FD0, (b6) ID0, (b7) DTR, and (b8) CSDI. The corresponding slope, and probability (p) are displayed in the top right corner.
Atmosphere 14 01162 g003
Figure 4. Spatial patterns of Mann–Kendall trends (shadings) for warm (a1a7) and cold (b1b7) extremes: (a1) TXx, (a2) TNx, (a3) TX90P, (a4) TN90P, (a5) SU25, (a6) TR20, (a7) GSL, (b1) TXn, (b2) TNn, (b3) TX10P, (b4) TN10P, (b5) FD0, (b6) ID0, and (b7) DTR. The purple (green) dots indicate significant positive (negative) trends (p < 0.05), whereas insignificant trends are shown by gray dots. (a1,a2), (a3,a4), (a5a7), (b1,b2), (b3,b4), and (b5b7) share a common color bar.
Atmosphere 14 01162 g004
Figure 5. Statistics for proportions of meteorological stations in Guizhou province that show increasing or decreasing trends in the extreme climate indices from 1960 to 2019. Black portions of the bar indicate stations at which the trend is significantly above the 95% confidence level, and gray portions of bar represent stations at which the trend is insignificant. The west, north, east, and south regions represent western Guizhou (WG, including 18 stations of Bijie, Liupanshui, Qianxinan, and Anshun), northern Guizhou (NG, including 11 stations of Zunyi), eastern Guizhou (EG, including 20 stations of Tongren and Qiandongnan), and southern Guizhou (SG, including 12 stations of Guiyang and Qiannan).
Atmosphere 14 01162 g005
Figure 6. Correlations among annual mean temperature and temperature extremes from 1960 to 2019. * indicates a significant correlation coefficient (p < 0.05).
Atmosphere 14 01162 g006
Figure 7. Same as Figure 4, but for seasonal mean of warm (a1d4) and cold (e1h4) extreme temperature indices (a1a4) TXx, (b1b4) TNx, (c1c4) TX90P, (d1d4) TN90P, TXn (e1e4), TNn (f1f4), TX10P (g1g4), and TN10P (h1h4) during (a1, b1, c1, d1, e1, f1, g1, and h1) spring, (a2, b2, c2, d2, e2, f2, g2, and h2) summer, (a3, b3, c3, d3, e3, f3, g3, and h3) autumn, and (a4, b4, c4, d4, e4, f4, g4, and h4) winter. (a1b4), (c1d4), (e1f4), and (g1h4) share a common color bar.
Atmosphere 14 01162 g007
Figure 8. Statistics for proportions of meteorological stations in Guizhou Province that show increasing or decreasing trends of seasonal mean climatic extremes (TXx, TNx, TX90P, TN90P, TXn, TNn, TX10P, TN10P, RX1day, RX5day) during (a) spring, (b) summer, (c) autumn, and (d) winter, respectively, from 1960 to 2019. Black and gray portions of the bar indicate stations at which the trend is significant (p < 0.05) and insignificant, respectively.
Atmosphere 14 01162 g008
Figure 9. Time series of regionally averaged indices of precipitation extremes (circled line) as well as the linear trends (solid gray line) and the 9-year moving averages (dashed line) in Guizhou province from 1960 to 2019 (a) SDII, (b) R20, (c) R50, (d) CWD, (e) R10, (f) CDD, (g) R95P, (h)PRCRTOT, (i) RX1day, (j) RX5day, and (k) R99P. The corresponding slope, and probability (p) are displayed in the top right corner.
Atmosphere 14 01162 g009
Figure 10. Spatial patterns of Mann–Kendall trends (shadings) for annual mean precipitation extremes based on (a) SDII, (b) R20, (c) R50, (d) CWD, (e) R10, (f) CDD, (g) R95P, (h)PRCRTOT, (i) RX1day, (j) RX5day, and (k) R99P. The purple (green) dots indicate significant positive (negative) trends exceeding the 0.05 confidence level, whereas insignificant trends are shown by gray dots. (ad), (e,f), (g,h), and (ik) share a common color bar.
Atmosphere 14 01162 g010
Figure 11. Composite differences between the west and east of the WPSH over years for (a) 500 hPa HGT, (b) downward solar radiation flux (Dswrf, unit: W/m2, color) and total cloud cover (TCDC, unit: %, contour), and (c) 2 m air temperature (unit: °C). Black solid and blue dashed lines in (a) indicate the contour of 5870 gpm (west years) and 5860 gpm (east years), respectively. The dotted regions represent the difference of 500 hPa HGT, downward solar radiation flux, and 2 m air temperature as significant (p < 0.05) in (a), (b), and (c), respectively.
Atmosphere 14 01162 g011
Table 1. Definitions of the 27 extreme temperature and precipitation indices applied in this study.
IDIndicator NameDefinitionsClassification
TXxMax TmaxMonthly maximum value of daily maximum tempWarm/°C
TNxMax TminMonthly maximum value of daily minimum tempWarm/°C
TX90pWarm daysPercentage of days when TX > 90th percentileWarm/days
TN90pWarm nightsPercentage of days when TN > 90th percentileWarm/days
SU25Summer daysAnnual count when TX > 25 °CWarm/days
TR20Tropical nightsAnnual count when TN > 20 °CWarm/days
GSLGrowing season lengthAnnual count between first span of at least 6 days with TG > 5 °C and first span after 1 July of 6 days with TG < 5 °CWarm/days
WSDIWarm spell duration indicatorAnnual count of days with at least 6 consecutive days when TX > 90th percentileWarm/days
TXnMin TmaxMonthly minimum value of daily maximum tempCold/°C
TNnMin TminMonthly minimum value of daily minimum tempCold/°C
TX10pCool daysPercentage of days when TX < 10th percentileCold/days
TN10pCool nightsPercentage of days when TN < 10th percentileCold/days
FD0Frost daysAnnual count when TN (daily minimum) < 0 °CCold/days
ID0Ice daysAnnual count when TX (daily maximum) > 0 °CCold/days
DTRDiurnal temperature rangeMonthly mean difference between TX and TNCold/°C
CSDICold spell duration indicatorAnnual count of days with at least 6 consecutive days when TN < 10th percentileCold/days
PRCPTOTAnnual total wet-day precipitationAnnual total PRCP when RR > 95th percentileWet/mm
SDIISimple daily intensity indexAnnual total precipitation divided by the number of wet days (defined as PRCP ≥ 1 mm) in the yearWet/mm/day
R50Number of days above 50 mmAnnual count of days when PRCP ≥ 50 mm, 50 is user defined thresholdWet/days
CWDConsecutive wet daysMaximum number of consecutive days with RR ≥ 1 mmWet/days
R10Number of heavy precipitation daysAnnul count of days when PRCP ≥ 10 mmWet/days
R25Very wet daysAnnul count of days when PRCP ≥ 25 mmWet/days
R95pExtremely wet daysAnnual total PRCP when RR > 95th percentileWet/mm
R99pMax 1-day precipitation amountAnnual total PRCP when RR > 99th percentileWet/mm
RX1dayMax 5-day precipitation amountMonthly maximum 1-day precipitationWet/days
RX5dayConsecutive dry daysMonthly maximum consecutive 5-day precipitationWet/days
CDDMax 1-day precipitation amountMaximum number of consecutive days with RR < 1 mmDry/days
Table 2. Linear trend of regional mean of extreme temperature indices during spring, summer, autumn, and winter, respectively.
IndicesUnitSpringSummerAutumnWinter
TXx°C/decade0.28 *0.23 **0.34 **0.05
TNx°C/decade0.30 **0.12 *0.24 *0.25
TX90Days/decade1.53 **1.91 **1.71 **0.35
TN90Days/decade2.07 **2.11 **2.03 **1.34 *
TXn°C/decade0.41 **0.040.060.26
TNn°C/decade0.42 **0.24 **0.48 **0.31 *
TX10Days/decade−1.51 **−0.35−0.29−1.00
TN10Days/decade−1.63 **−1.80 **−1.95 **−2.28 **
** significant above the 0.01 confidence level; * significant above the 0.05 confidence level.
Table 3. Correlation coefficients among temperature indices and several oceanic and atmospheric indices.
IndicesNino3.4PDOTHATHITHRTHW
Tave0.060.160.53 **0.48 **0.22−0.57 **
TXx0.27 *−0.040.200.200.06−0.18
TNx0.140.36 **0.28 *0.29 *−0.15−0.33 *
TX90P0.28 *0.010.34 **0.28 *0.10−0.29 *
TN90P0.240.30 *0.52 **0.49 **0.05−0.48 **
SU250.240.030.37 **0.34 **0.05−0.34 **
TR200.090.210.48 **0.51 **0.09−0.46 **
GSL0.090.190.180.150.03−0.19
WSDI0.18−0.030.190.130.08−0.18
TXn0.110.190.29 *0.31 *0.01−0.36 **
TNn−0.32 *0.40 **0.45 **0.43 **−0.01−0.43 **
TX10−0.210.01−0.34 **−0.33 *−0.26 *0.45 **
TN10−0.31 *−0.13−0.47 **−0.45 **−0.35 **0.52 **
FD0−0.27 *−0.28 *−0.52 **−0.48 **−0.180.54 **
ID00.02−0.17−0.29 *−0.30 *−0.100.35 **
DTR−0.28 *−0.12−0.04−0.050.27 *−0.01
CSDI0.35 **−0.21−0.40 **−0.37 **−0.040.42 **
** Significant above the 0.01 confidence level; * Significant above the 0.05 confidence level.
Disclaimer/Publisher’s Note: The statements, opinions and data contained in all publications are solely those of the individual author(s) and contributor(s) and not of MDPI and/or the editor(s). MDPI and/or the editor(s) disclaim responsibility for any injury to people or property resulting from any ideas, methods, instructions or products referred to in the content.

