Review

Recent Research Progress on Black Carbon Emissions from Marine Diesel Engines

by
Gang Wu
1,2,*,
Jalloh Alpha Umar
1,
Tie Li
2,*,
Xinyi Zhou
2,
Changsheng Chen
3,
Jiaqi Li
1 and
Biwen Chen
3
1
Merchant Marine College, Shanghai Maritime University, Shanghai 201306, China
2
State Key Laboratory of Ocean Engineering, Shanghai Jiao Tong University, Shanghai 210016, China
3
Shanghai Marine Equipment Research Institute, Shanghai 200031, China
*
Authors to whom correspondence should be addressed.
Atmosphere 2024, 15(1), 22; https://doi.org/10.3390/atmos15010022
Submission received: 16 November 2023 / Revised: 15 December 2023 / Accepted: 17 December 2023 / Published: 24 December 2023

Abstract

:
Black carbon (BC) emissions from shipboard diesel engines are the next potentially important issue of interest to the International Maritime Organization (IMO) and are considered to have a significant impact on the climate environment and human health. However, theories and technologies regarding the mechanisms of black carbon formation, oxidizing and influencing factors, emission detection methods, and abatement techniques are still missing in science and engineering. This paper provides a comprehensive overview of relevant advances in international maritime regulations, the frontier theory on formation mechanisms, comprehensive physical and chemical properties, and the potential reduction measures and control measures of emissions. These results suggest that BC is produced in the combustion flame of fuel and is related to the nucleation as well as the formation of PAHs. It helps to understand the initial generation process of black carbon and reduce its emission by studying it in detail and revealing some key factors, including micromorphology, nanostructural features, surface functional groups, oxidizing activity, size distribution, and elemental composition. Further, an in-depth understanding of the complex characteristics of BC can also help to identify viable BC measurement techniques and instrumentation for marine engines, thereby enhancing emission regulation. Overall, extensive technology can reduce BC emissions from marine diesel engines by approximately 50%. The information contained in this report can be used as a significant reference to further explore the BC formation mechanism and develop exclusive BC emission control strategies.

1. Introduction

In previous years, researchers and policymakers on marine environmental protection were primarily focused on preventing oil pollution caused by large ocean-going ships, ballast water treatment, and anti-fouling fungicides [1,2]. And the air pollution from these vessels was neglected since it is indiscernible and has a weak connection to maritime accidents and disasters. However, concerning the long-term hazards and effects of ship air pollution on public health and the environment, societies are now paying more attention to air pollution emissions produced by marine merchant ships. The IMO has approved active countermeasures to address the marine air emission problem. Presently, all ocean-going ships must conform to the MARPOL 73/78/97 Convention and carry the International Air Pollution Prevention (IAPP) certificates to verify that they meet the emission requirements for nitrogen oxides, sulfur oxides, volatile organic substances, etc. [3].
Unlike air emissions from road vehicles, marine ship air emissions are much larger because of the amount of energy output required to operate the vessel. These emissions spread into proximate coastlines within less than 400 km radius [4]. As a major source of air pollution in cities and port areas, ship emissions have severe harmful effects on the surrounding air quality and considerably contribute to the increase in particulate matter (PMs) in the surrounding areas. Consequently, the shipping industry accounts for the higher PM concentrations in port areas than in inland municipalities. A mathematical model estimates that the PM emissions from ships are approximately 799,000 to 912,000 tons per annum [5]. The intensity of the harmful substances released by the engines into the atmosphere correlates well with the engine types. Specifically, the intensity of the emissions from low-speed marine engines is six times more than that from high-speed marine engines. In coastal areas of Europe (Mediterranean), the Gulf of Mexico, Asia (China, Japan, India, and Indonesia), and North Africa, the 2.5 PM concentrations increased by more than 2 µg/m3 as a result of the various shipping activities transpiring in these areas [6]. When these harmful substances enter the human respiratory system, it is difficult for ultra-fine carbonaceous matter to pass out, which may lead to cardiovascular diseases and lung cancer. It is believed that about 60,000 cardiopulmonary and lung cancer deaths in a year are caused by emissions from shipping activities [6]. However, considering the adverse effects of PM emissions on the environment, the current policies to mitigate marine PM emissions are unsatisfactory. Only the United States, China, and a few countries in Europe are actively enforcing regional emission control regulations in relation to marine PM emissions. According to the IMO, after January 2020, only ultra-low sulfur fuel (below 0.1%) is allowed to be used by ships when navigating ECAs and low sulfur fuel (below 0.5%) in international waters. Although this policy was not originally developed to mitigate marine PM emissions, it was proposed to intensify the NOx and SOx emission control, as low sulfur fuels are proven to reduce sulfate particles released into the environment.
An emerging concept reveals that carbonaceous particles emitted from ships must be described and distinguished further. For carbonaceous particles emitted from ships, BC can be described as a ubiquitous type with distinct physical properties and contains almost all carbonaceous particles. These carbonaceous particles are a product of combustion in engines combined with other substances like brown organic carbon [7]. This BC mixture includes, but is not limited to, dust and BC particles, as well as separate soluble fractions internally and externally. Due to the condensation and liquid dispersion effects of water vapor on the nucleus and moist air, respectively, BC is usually detected in atmospheric aerosol particles consisting of many other substances that are co-emitted with BC from various sources.
BC emissions significantly impact the Earth’s climate, thereby negatively affecting the Earth’s climate and causing global warming [8,9]. Over the last decade, the amount of ice formed in glacial regions has gradually decreased. As a result, ships have a wider navigable area, and these areas are transformed from inaccessible icy areas to seasonally navigable oceans, thereby providing more opportunities for shipping activities [10]. The continual increase in shipping activities leads to an increase in BC emissions in glacial regions, thereby accelerating the melting process and threatening the safety of glacial environments [11]. In 2015, Arctic shipping activities accounted for over 3% of the global total BC emissions, and this amount is gradually increasing [12,13]. Over time, BC is released into the atmosphere deposits on Arctic snow and sea ice, affecting cloud cover properties and sunlight absorption. In recent decades, BC has significantly impacted ice formation to the extent that summer sea ice in the Arctic regions has considerably declined [14]. This has been a massive challenge for the shipping industry. Additionally, the specific complex characteristics of BC and other aerosols in the atmosphere are related to the modifications in the formation and radiative properties of moist and icy clouds [8]. When the nucleation capacity of the clouds is altered, marine stratus clouds are significantly affected. This likely causes the deterioration of precipitation and fishing activities in various coastal countries.
Previous studies have demonstrated the link between the particles produced by combustion engines and their effects on human health. However, further epidemiologic studies have unequivocally linked these health effects to BC exposure. Refs [15,16] described, in their reports, that BC has been shown to be associated with fatal respiratory diseases such as lung cancer and cardiopulmonary and cardiovascular diseases. However, toxicological studies on BC and toxicity assessments need to further illustrate the potential toxicity mechanism of BC as a component of particulate matter. BC is described as a universal carrier for various toxic chemical components produced during combustion that affect the lungs and cardiovascular tissues. Common combustion products include semi-volatile organic compounds, metals, and minerals. Therefore, BC, rather than particulate matter, can be considered a suitable indicator of air pollution, as the toxicity of particulate matter can vary depending on its different constituents [17]. It has been proven that BC and virus-laden aerosols easily combine after a certain time in the atmosphere by Brownian motion. This contributes to the wide spread of certain viral respiratory diseases [18,19].
In general, mitigating BC pollution from ships is a major concern and must be actioned through combined efforts of all regions, countries, and the world. However, the current investigations and reports related to BC emissions from ships are tremendously insufficient. There are several uncovered theories and understandings of BC, including comprehensive generation mechanisms, various physical and chemical characteristics, measurement technologies, and emission-reducing technologies. It is essential to delve into further investigations and explore realistic measures to considerably decrease BC emissions from ships. This paper presents a comprehensive review of the latest research status on BC definition, emission regulations, generation, characteristics, measurements, and controls and tends to provide references for the formulation of relevant regulations and the advancement of emission reduction technology.

2. Marine BC Emissions

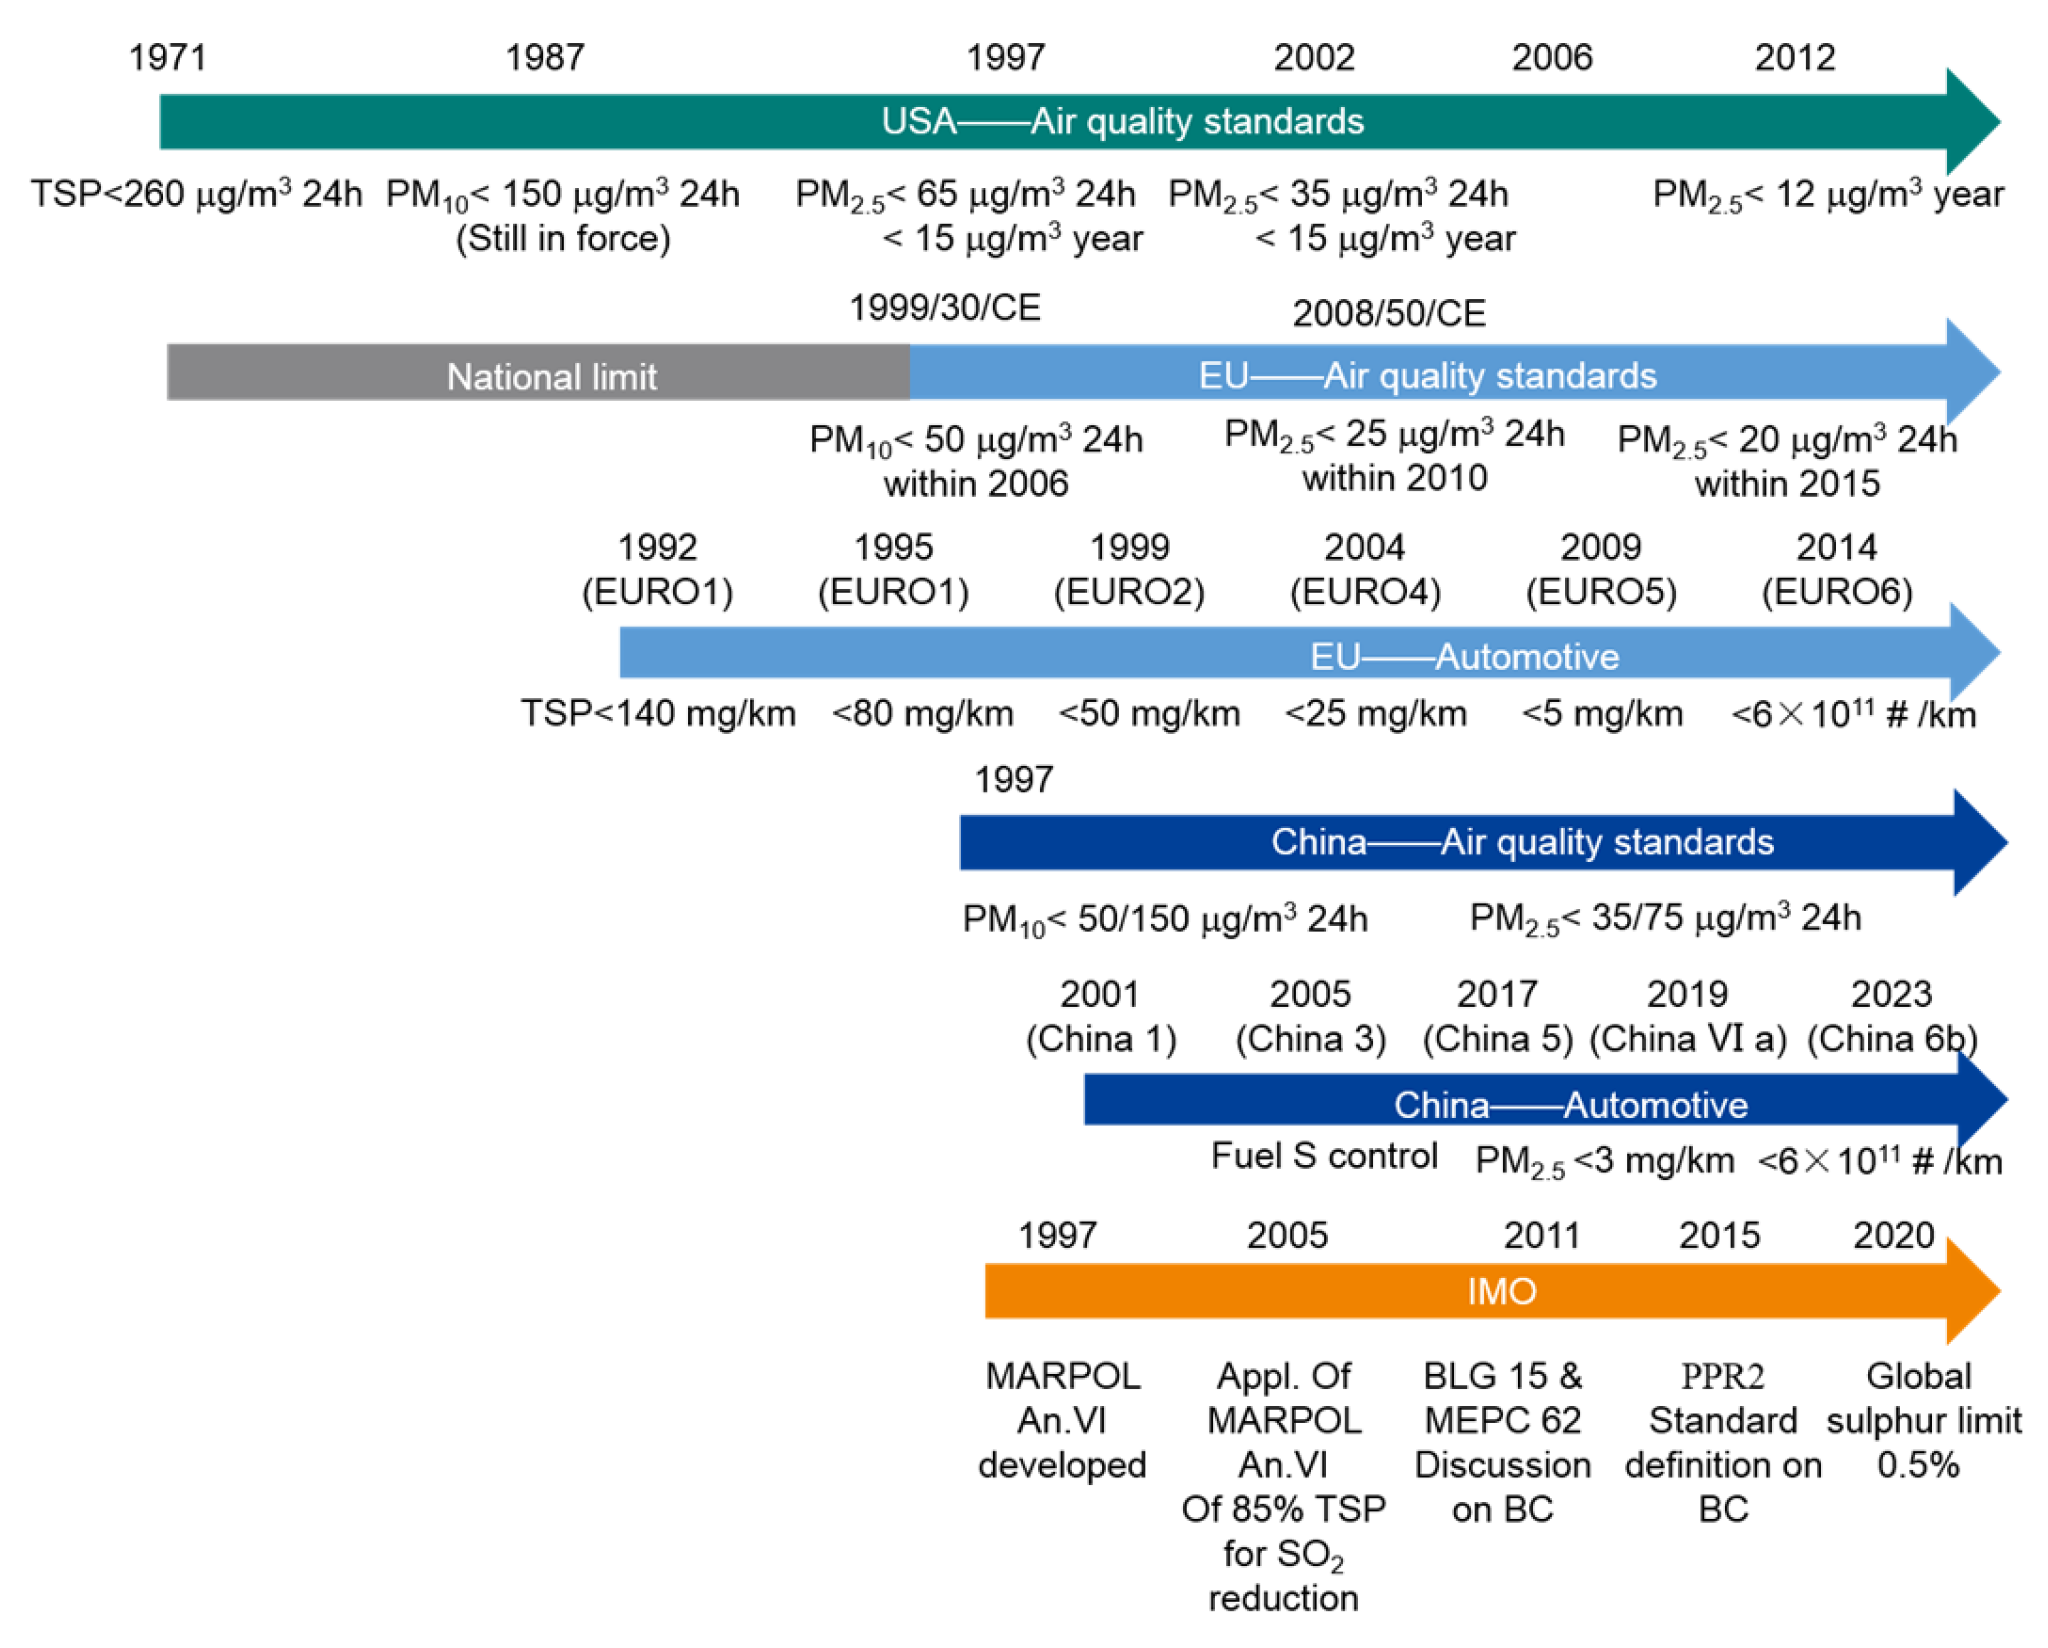
2.1. Current Ships Emission Regulations

Recently, most countries and regions have continuously introduced emission controls for all categories of vehicle traffic. The United States, Europe, and China have all adopted relevant standards and regulations to limit PM emissions from road vehicle engines and improve air quality. While these standards may vary by region and technical limitations, the general trend is to implement stricter guidelines and regulations for PM emissions. An evolving representation of these standards and regulations for PM emissions from road vehicles has been summarized and shown in the upper part of Figure 1 below, The symbol # in Figure 1 stands for the number of particles. It is expected that PM emissions from on-road diesel engines in these regions will decrease significantly as a result of these regulations. To achieve the expected reduction in PM emissions, continuous implementation and monitoring are essential. Recent trends show that the PM reduction rate is mainly influenced by the replacement of older vehicles with new, cleaner vehicles.
In order to further improve air quality, the regulations for particulate emissions from marine engines must be improved and tightened. So far, only a few emission regulations have been issued for non-road vehicles, and only in a few regions. Since 2009, the United States has tightened the Environmental Protection Agency’s (EPA) emission control standards to regulate PM emissions from marine engines. According to the EPA, these standards apply to certain categories of CI marine engines. Category 2 engines with an output of 1400 kW or more must alternatively meet Tier 3 and Tier 4 standards, depending on the displacement category [20]. However, these EPA standards do not apply to Category 2 engines with a power output of 2000 kW or more and a displacement of 15 L or more or to Category 2 engines with a power output of 3700 kW or more. Similarly, in 2016, the Chinese Ministry of Environmental Protection (CMEP) issued special regulations for exhaust pollutants from marine engines (GB15097-2016), which apply to ferries and fishing vessels in inland navigation, coastal vessels, and river–sea vessels [21]. The application of these regulations was also inadequate for category 1 and 2 diesel engines with a displacement of 30 L. Since July 1, 2021, these regulations have provided for a strict limit value for the second stage. The limit values of the second stage of the PM emission regulations are listed in Table 1 below.
Furthermore, in 2016, the European Parliament and the Council adopted Regulation (EU) 2016/1628 on emission limits and type-approval of internal combustion engines for non-road mobile machinery, which replaces the previous Directive 97/68/EC [22]. These measures to reduce PM emissions will help to a certain extent in some coastal areas. However, these measures and regulations were not applicable to larger marine engines, especially low-speed engines in large ships. However, they contain clear restrictions in terms of sailing areas, engine size, and engine power configuration.
As most large coastal vessels and ocean-going vessels are equipped with medium- or low-speed marine engines, there are hardly any specific limit values for PM emissions. According to current IMO regulations, the prevention of air pollution from merchant ships in international maritime traffic is essentially based on Annex VI of the International Convention for the Prevention of Pollution from Ships (MARPOL 73/78) [23]. Regulation 14 in Annex VI prescribes the use of better, low-sulfur fuels in order to reduce PM mass emissions. This fuel switching is enforced in nominal Emission Control Areas (ECAs) such as the Baltic Sea, the North Sea, and the English Channel. Currently, other coastal areas are recognized as ECAs, including the USA, Canada, the Mediterranean Sea [24], the Turkish Sea of Marmara [25], China, Japan, and Australia. These are the currently achievable positive actions being taken to minimize PM emissions in the ocean.

2.2. Marine Diesel Engine

Marine diesel engines include two-stroke diesel engines for marine propulsion and four-stroke diesel engines for ship generators. Both engines have a higher output and differ greatly in their characteristics from diesel engines for shipping. A typical marine diesel engine for propulsion usually requires a higher output of over 3000 kW. This leads to higher fuel consumption and higher engine emissions. Due to the enormous power requirements of marine engines, they are designed with larger cylinder bores and longer strokes. The cylinder bore and stroke of a standard two-stroke marine diesel engine can be up to 960 mm and 3700 mm, respectively, resulting in a displacement of up to 1800 L. The ratio of stroke to bore (S/D) can be over 3:1 for most marine engines, especially two-stroke engines. However, for diesel engines for inland navigation, the S/D ratio is generally less than 1.3:1 [26]. In addition, two-stroke engines are widely used in naval vessels due to their greater working capacity. A typical propulsion marine two-stroke engine usually runs at very low operating speed, normally below 130 Revolutions Per Minute (RPM) in all conditions. The low operating speed of the engine promotes the propulsion efficiency of the propeller; hence, they are often referred to as low-speed engines. Marine generator diesel engines also normally operate at a relatively low speed. For instance, the normal rated speed of a marine generator does not exceed 1000 RPM; hence, this engine type is normally referred to as a medium-speed engine. The speed and power variance of marine diesel engines significantly affect engine fuel injection characteristics and the resultant combustion performance.
The different structures and geometry of marine diesel engines have a significant impact on the thermodynamic processes in the engines, which changes the combustion processes and engine emissions. Considering that marine diesel engines are usually larger, their combustion processes are relatively long, and an excess air coefficient is essential for their operation to support mixing with the Heavy Fuel Oil (HFO). The air/fuel ratio for a standard marine engine is about 40:1, while it does not exceed 20:1 for road diesel engines [26]. Due to the enormous power requirements and characteristics of low-speed engines, more fuel can be injected during the combustion process, which increases the combustion duration of the engine. Under the influence of temperature and oxygen concentration in the engine cylinders, the formation and oxidation of combustion products change accordingly.

2.3. Marine Fuel

Marine engine fuels are very different from inland engine fuels. Ref. [27] shows that shipping accounts for 71% of the total global Heavy Fuel Oil (HFO) consumption, and this consumption is increasing at a rate of 2.1% per annum. HFO is a relatively low-cost but poor-quality fuel mixture with a significant number of impurities, such as heavy residuals, ashes, and metals. These impurities are difficult to burn during the combustion process and cannot be totally removed even when subjected to onboard purification treatment before being impelled into the fuel injector. HFO has very high viscosity and density, which causes poor atomization and an incomplete combustion process. Unlike HFO, Marine Diesel Oil (MDO) also known as distilled fuel, is a quality-improved fuel containing relatively less impurities. The properties of HFO and MDO differ and essentially depend on the original blend components. However, MDO is not completely pure; it contains a relatively low sulfur content and fewer residuals and metals as compared to HFO. According to the current IMO Tire Ⅲ regulation of MARPOL VI, the sulfur content for marine fuel must be below 0.1% in all ECAs and 0.5% in global oceans, which will significantly decrease sulfate particle emissions. As for road vehicles, it must be less than 10 (10 mg/Kg) as per EPAs’ and Chinese regulations.
Fuel switching in any marine engine influences its combustion and emission process accordingly. For instance, the delay in the regular MDO fuel ignition process is usually lower than that of HFO fuel due to the higher density and viscosity of the latter. This affects the evaporation, formation, and flammability of the gas mixture. Therefore, the chemical properties of the fuel should completely match the engine operating conditions, such as injection timing and duration. Being that the geometry of the marine engine remains the same, fuel switching affects emissions under various conditions and the inconsistent emission results are difficult to assess. Thus, this fuel property difference is a potential challenge for researchers investigating BC from marine engines.

2.4. Marine BC Legislative Trends

So far, there are virtually no approved specific regulations to separate BC from PMs and lower BC emissions. Most current policies address PMs regarding improved air quality and public health. Therefore, lots of studies focus on PM emissions reduction and fail to mention BC emission mitigation possibilities, specifically from marine low-speed engines with unique working cycles, fuel types, and combustion requirements. Previously, PM emission reduction control measures for the international shipping industries were established based on the revised MARPOL Convention [23].
As the administrative and legislative body for the international shipping industries, IMO is aware of and currently concerned about the insufficient regulations regarding the protection of the marine environment. The amendment process of these regulations is shown in Figure 1. As of the 62nd session of the Marine Environmental Protection Committee (MEPC-62), the IMO focused on the climate issues caused by BC emissions from ships in Arctic regions [13,28]. Subsequently, the issue of pollution from ships to Polar Regions was continuously considered and discussed by MEPC.
In 2015, during the IMO Sub-Committee on Pollution Prevention and Response 2nd session, they concurred to use the “Bond et al.” definition of “Black Carbon” as the accepted BC definition for international shipping [29]. According to “Bond et al.”, BC is a unique type of carbon element that is only produced in the combustion process of carbon-based fuels. This definition was then submitted to the MEPC and was approved in the 68th session of the MEPC [30].
During the MEPC-74th session, the committee approved and accepted a comprehensive set of regulations and guidelines to enforce the consistent application of the below 0.50% limit on sulfur content in marine fuel oil. These regulations came into effect on 1 January 2020 [31]. These issued recommendations have raised public awareness of BC emissions from ships. However, only a few studies have been performed on large marine vessels, and there is insufficient data at this time. Therefore, characteristics of BC emission from large low-speed marine engines are currently not fully clear. This makes it a great challenge to reduce the impact of BC emissions from international shipping on the Arctic regions.

2.5. Definition of BC and Carbon Aerosol

Although BC and PM are widely and interchangeably used, they quite differ in characteristics [32,33]. According to the IMO, BC is mainly described by its optical absorption property by Bond et al. [34]. It has a Mass Absorption Cross (MAC) of over 5 m2 g−1 at 550 nm with a specific wavelength. In addition, BC also has a combined refractive characteristic at a vaporization temperature of approximately 4000 K [35], aggregate morphology of small carbon spherules [8,17,36], and it is insoluble in water and other organic solvents [37]. Bond et al. [8] further described “brown carbon” as a subset of OA. However, the light absorption property of “brown carbon” is relatively weak, and its effect depends on the wavelength. The normal MAC of brown carbon is less than 1 m2 g−1 at 550 nm [38]. The strong wavelength dependency of “brown carbon” can be manipulated to distinguish its absorption from that of BC. Even though “brown carbon” and BC are almost the same in size, the former is soluble in certain organic compounds and responds to analytical techniques that use solubility to separate humic-like substances [39,40].
The term “organic carbon (OC)” was commonly used in previous studies as it was convenient for the actual measurement; hence, OC was operationally defined. Mostly, the FTIR spectroscopy technique can be used to determine the functional group and approximate the OC mass based on the type and number of carbon bonds. Owing to the mixed carbonaceous aerosol of BCs in actual engine exhaust, it becomes a complex organic carbon compound, including co-emitted OC and OA, which are a collection of light-absorbing carbon constituents. From the elemental point, OC refers to the carbon mass within OA, excluding oxygen, hydrogen, and other elements. As a result, pure BC is like OC in terms of element composition. According to Ref. [41], the mass ratio between OA (Organic Mass (OM)) and OC (organic compound) in mixed BCs varies from 1.4 to 1.7 with approximately 50% uncertainty, depending on the quantity of oxygen combined in the organic molecules.
Currently, it is a great challenge to research BC characteristics and emissions from diesel engines due to their inadequate measuring capability, erroneous measuring instruments, and inconsistent methods of measurement. As a result, it is difficult to achieve consistent results, especially for large marine diesel engines. Hence, it is essential to develop effective measuring instruments and measurement methods to deliver satisfactory findings on the characteristics of BC and perform further comprehensive research. However, in the general scientific literature and practical applications, it is difficult to associate the BC properties and conform to its definition simultaneously due to the limitations of the methods of measurement. Most of the test instruments are designed to perform only one test per characteristic of BC accordingly; hence, it is difficult to relate the various measurements in terms of the measuring instruments utilized.
Therefore, it is strongly recommended to unify the nominal nomenclature based on each BC property. A feasible approach is to modify the term of the operational definition based on the underlying definitions and measurement methods. For instance, the term “eBC (equivalent BC)” is used to describe light-absorbing constituents of the carbonaceous combustion particles since its light absorption property is normally measured by the Light Attenuation Method (LAM) [28]. Similarly, the term “rBC (refractory BC)” refers to the most refractive component of the carbonaceous combustion particles, based on its refractive property normally measured by Laser-Induced Incandescence (LII) at high temperatures [33]. The term “soot” refers to the combination of particles (i.e., the sum of black carbon and organic carbon) emitted during an incomplete combustion process [33]. However, soot is generally used to illustrate the microscopic morphology of carbonaceous properties in small-sized high-speed engines instead of the large-bored low-speed engines. When considering the properties of carbonaceous aggregated particles, it is found that it is quite like that of BC generated by marine diesel engines. The microscopic morphology and nanostructure of these carbonaceous particles can be analyzed through Transmission Electron Microscopy (TEM). Furthermore, for better operability, Elemental Carbon (EC) measurement is normally used instead of the BC measurement as EC refers to the substance containing carbon only and is not bonded to other elements. This is very similar to the elemental property of BC. EC is also an operational definition through the detection of CO2 produced by volatile and combusting material collected on a filter, as a function of temperature.
Studies have shown that there is a reliable correlation in the results of EC and BC when measuring the same emission source [42]. Even though the underlying definitions and measurement methods are different, in most instances, the term “black carbon”, “equivalent black carbon”, “refractory black carbon”, “soot” and “elemental carbon” are wrongly synonymously and interchangeably used to characterize the carbonaceous substance [32,33]. It is very significant to note that different measurement methods, engine types and fuel types may as well lead to inconsistent results. The comprehensive description of these measurement methods will be discussed further in Section 4.

3. The Formation and Characterizations of BC

3.1. Formation and Oxidation

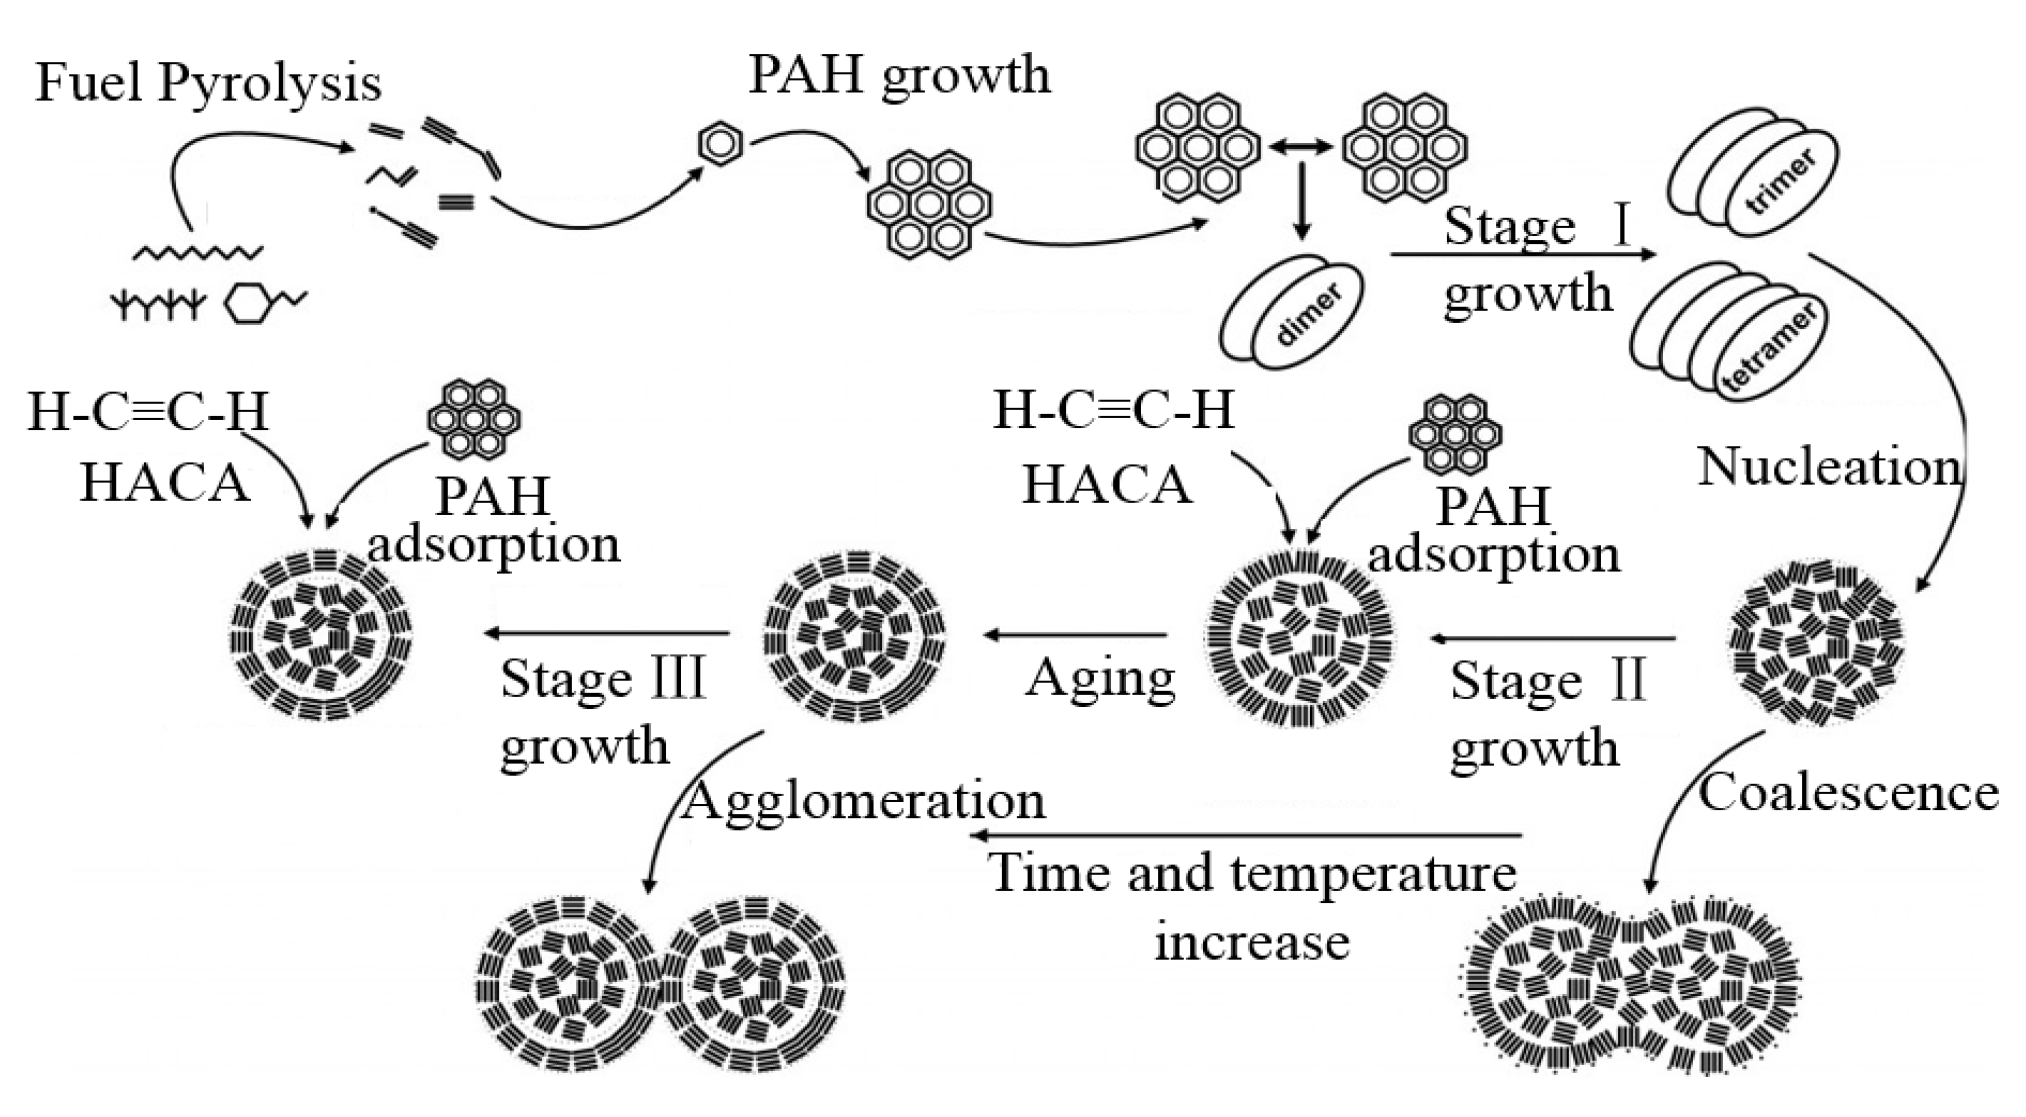
3.1.1. Formation and Oxidation Mechanism

The formation process of BC is complicated and instantaneous. This process includes gas-phase chemistry, surface heterogeneous reactions, phase transition of gas-phase precursors to solid particles, the nucleation and growth of solid particles. In the previous decades, the academic society has developed detailed practical models to describe the relationship between combustion chemistry and BC (soot particle) formation. Most of the models are established based on simple gaseous fuels such as methane and ethylene, via which the gas phase chemical reactions can be constructed. However, most engines and combustion devices use various liquid fuels such as diesel, hence it is challenging to fully model the actual combustion process. A basic BC formation mechanism from typical liquid fuel is summarized in Figure 2 below.
The formation of BC can be summarized into six main process steps. They include fuel pyrolysis process, gas-phase precursors generation process such as polycyclic aromatic hydrocarbons (PAHs) which is accelerated by the hydrogen abstraction acetylene addition (HACA) process, particle nucleation process, surface growth process, coalescence and aggregation process and oxidation process. However, there are still lot of unsolved problems and controversies on gas-solid phase transition, nuclei formation, the growth and oxidation mechanism. Reilly et al. [43] stated a doubt and claimed that the mature agglomerates were produced directly in micron-sized particles containing PAH and the appearance of primary particles was because of decomposition in flame of the PAH-containing micron-sized particles. The carbonaceous particles were formed by the carbonization process in the PAH-containing particles. A hydrogen exchange process occurred between the PAHs and part of small hydrocarbons of pyrolysis. This addition reactions result in forming larger PAHs, rearranging carbon-carbon bonds and produce carbonaceous soot. Kholghy et al. [44] proposed that dehydrogenation was the driving force for particle maturity and graphitic shell formation, and this results in subsequent development of PAH molecules and the formation of chemical bonds between them.
This view aligns with the mechanism by Lahaye et al. [45], which was based on the results from unsaturated low-hydrocarbon fuel-rich flames. According to their theory, the hydrocarbon species were produced in the initial gas-phase reactions and were condensed into droplets, striking on the solidified substrate. Johansson et al. [46] proposed a radical chain reaction pathway through which radicals react with other hydrocarbon to form covalently bound complexes, and then regenerate resonance and stable radicals through low-barrier hydrogen-abstraction and hydrogen-ejection reactions to promote further growth and clustering. Presently, these studies indicate enormous challenges on BC formation description. Hence, further comprehensive foundation research involving the formation mechanism of BC particles is still vital to be explored.

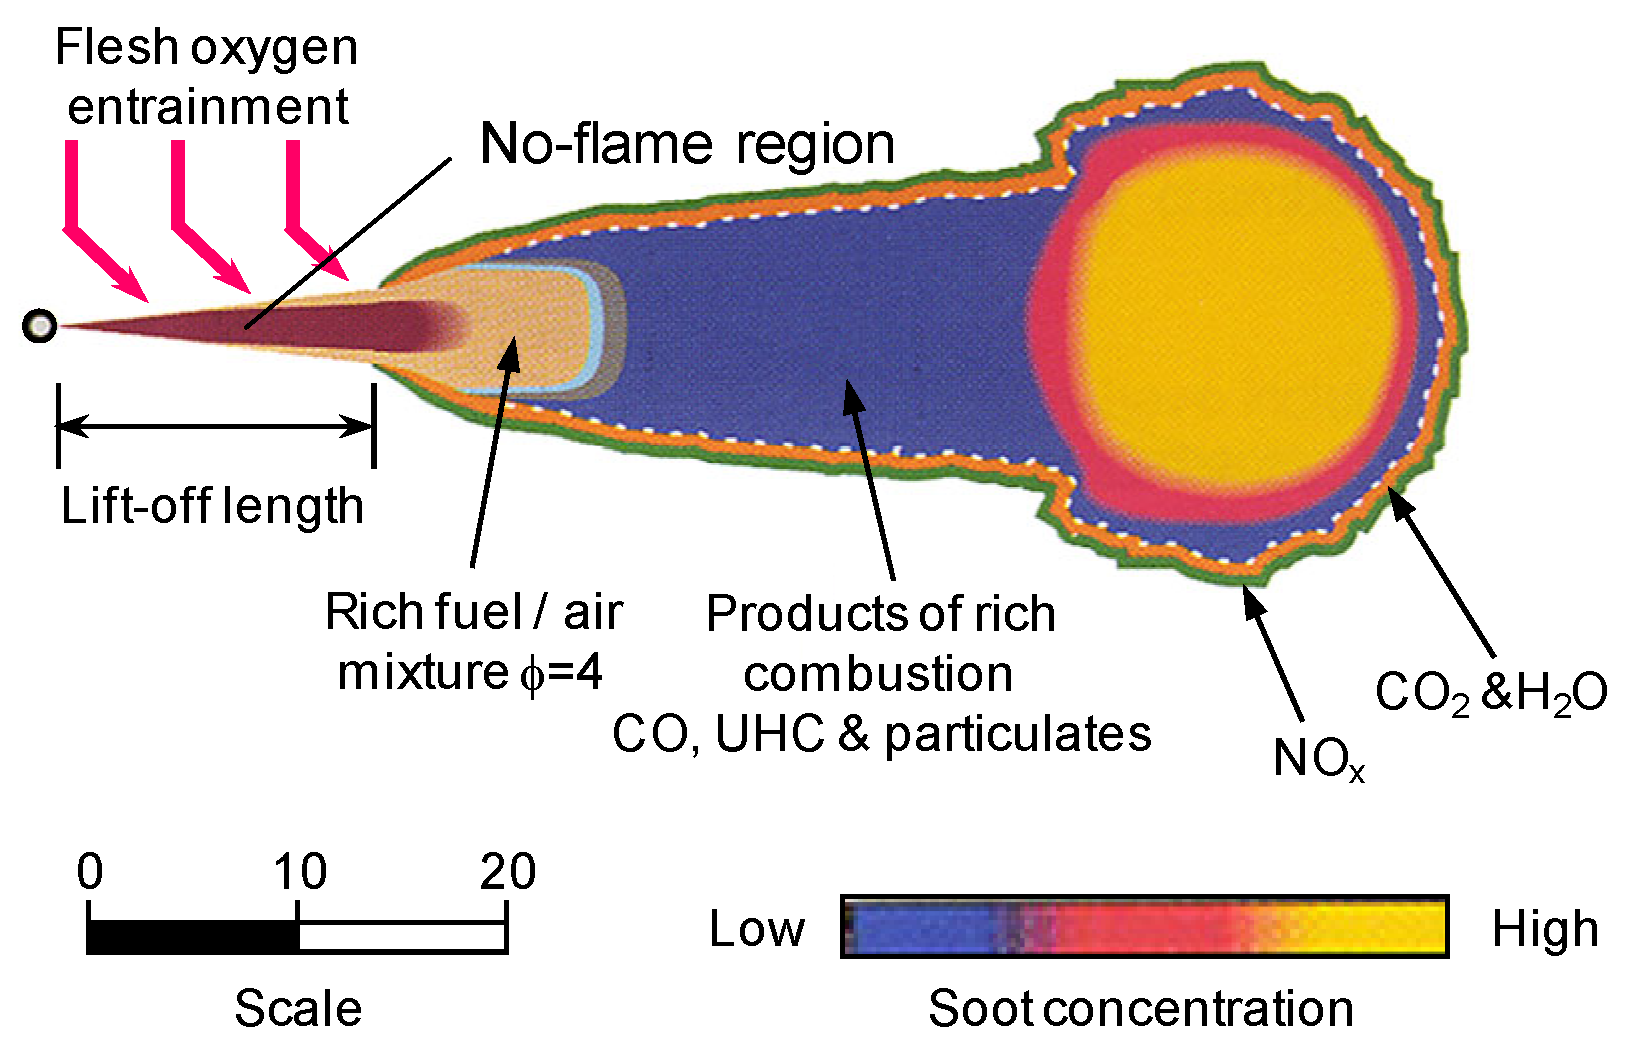
3.1.2. Formation and Oxidation Progress in Diesel Spray Flame

Generally, in a marine diesel engine, the combustion process can usually be divided into four main stages. They include the ignition delay period, premixed combustion period, diffusion combustion period and the after-combustion period [47]. Usually, the diffusion combustion of spray flame controls the heat release process. Figure 3 depicts a conceptual model of spray flame which helps to illustrate the formation of BC in diesel engines [48]. Pressurized fuel is injected into the combustion chamber to rapidly atomize and evaporate, forming a fuel-rich mixture approximating maximum liquid-phase penetration distance. Under the influence of high temperatures, the fuel in fuel-rich areas containing Unburnt Hydrocarbon (UHC) goes through the pyrolysis and dehydrogenation process to generate large number of PAHs. As a result, carbonaceous particles are produced downstream. As the spray jets move downstream, the carbonaceous particles develop and re-agglomerate gradually. Hence, they form a more developed graphite structure. Through the action of jet motion and strong turbulent mixing, particles and oil-rich mixture penetrate high-temperature diffusion flame zone, close to the spray boundary, where they are eventually oxidized by environmental oxygen and OH radicals. This process results in the formation of CO2, water, and Nitrogen oxides (NOx) accompanied by a large amount of heat released. Most of the carbonaceous particles in combustion chamber of diesel engine generate CO2 through the oxidation and burning process mentioned above. Only a little of them escape oxidation under the action of flame impinging, expansion and during the cooling process of the operating medium.
In most non-premixed systems, the oxidation of carbon fumes occurs after it has been mixed with air.
C n H m + k O 2 2 k C O + m 2 H 2 + ( n 2 k ) C ( s )
where, C(s)—carbon in the solid state.
In fact, the carbon smoke generated during combustion of combustible mixtures, which is due to the fact that the flame oxidizing radicals are quickly consumed
H 2 + O H H + H 2 O
C O + O H H + C O 2
The model shown in Figure 3. above is limited to quasi-steady combustion phase. According to Wei et al. [49], larger spray angle was noticed in injection transients than quasi-steady phase. Due to the close relationship between the air entrainment velocity and the spray angle, the air entrainment rate during the transient phase is enhanced. Presently, there is inadequate data on this type of transient injection process to perform further studies. With the application of increased injection pressure and multi-stage injection, the injection pulse width tends to be decreased. Hence, more discussion is required on the start and end transient phase of the injection process [50].

3.1.3. Effect of Engine Lubricating Oil

The lubricating oil for diesel engines is of great importance for the service life and smooth operation of the engine. Its main task is to lubricate, cool, clean, seal and protect the engine against wear and corrosion. However, its relatively low consumption in the engine cylinder makes it a contributing factor to the formation of BC and BC-aerosol compounds. There are few studies on the effects of lubricating oil on BC formation, most of which focused on high-speed street engines. Zhao et al. [51] used organic solvent extraction and gas chromatography to determine the molecular weight of hydrocarbons in BC aerosol compounds released from a high-speed engine. It was found that the major molecular components of these hydrocarbons were a range of molecular weights of lubricating oil and much more than that of fuel. This result suggests that lubricating oil and BC aerosol compounds have some common molecular components. Similarly, another study has found the similarity of organic components from engine exhaust and engine lubricating oil [52,53]. Although these studies ultimately found that lubricating oil tends to increase BC emissions, the degree of contribution has not been determined and quantified.
The degree of contribution of lubricating oil can be quantify by tracing the source of combustion products by using labeling isotope technology Eveleigh et al. [54] presented a review on the application of isotope tracers for combustion science and deliberated on the advantages of the various technologies. An initial measuring technique involves adding radioactive Carbon-14 (C14) isotope label into the engine lubricating oil and evaluates the radioactive decay in the BC aerosol compound samples. Using this measuring technique, Mayer et al. [55] established that 7–14% carbon in BC aerosol compounds, from high-speed engines, originate from lubricating oil. However, due to the inconsiderateness to small changes in many of the C14 isotopes and the extensive half-life period of C14, this method of measurement might produce erroneous values. The Accelerator Mass Spectrometry (AMS) is a relatively more efficient method to determine the number of single C14 nuclei as an alternative to relying on radioactive decay. However, adding C14 to lubricating oil may also hinder the accuracy of the results as lubricating oil may be accumulated on the surface of PM samples or sampling device. Subsequent studies have described the application of AMS technique and natural radioactive biofuel as the isotope label to quantify the effect of lubricating oil in relation to BC emission. This method established that the quantified contribution of lubricating oil to BC emission (non-volatile organic fraction) to be 4%. Buchholz et al. [56] revealed that materials from the engine oil made up 1.5 to 25 mass percent of the PM released by an automotive diesel engine and the percentage of oil in the attainable organic matter in the PM varied from 16 to 80 percent. Jones et al. [57] determined the total contribution rate of lubricating oil and natural gas to BC (soot) to range from 60 to 96% in a dual fuel engine under high load and the remaining contribution rate is obtained from pilot diesel oil, that contributes additional BC generation under low load. Miller et al. [58] observed that the metals emitted by internal combustion engines are mainly derived from burning lubrication oil. However, this conclusion should be verified whether the metal originates from the lubricant itself or worn engine cylinder. Furthermore, the size of the BC aerosol compound produced ranges from 105 cm−3 to 107 cm−3 and geometric mean diameters (GMD) of 18 nm to 31 nm. However, using hydrogen as fuel confirms that the only possible source of BC aerosol compound (PMs) formation is from lubrication oil.
To summarise, it can be concluded from this section that it is almost certain that engine lubricating oil contributes to the formation of BC, but this has not been confirmed for slow-running marine engines. A special cylinder lubrication system in low-speed marine engines can be used to determine the different effects of lubrication compared to conventional high-speed engines. And this can potentially cause an excessive change in BC emissions. So far, there is no explicit research on the contribution of lubricants to the BC emissions of low-speed marine engines.

3.2. Physical and Chemical Characteristics

In Section 3.1.1, we discussed that BC formation increases through very complex reactions involving several physical and chemical processes, such as fuel pyrolysis, PAH formation, nucleation, surface growth, aggregation and oxidation. To fully understand these processes, it is important to study the various physical and chemical properties of BC and BC aerosol compounds to further clarify and characterise the detailed formation and oxidation process and ultimately reduce its production and emission. Although many studies based on laboratory experiments and/or high-speed engines have focused on these properties, only a few of them are related to low-speed engines.

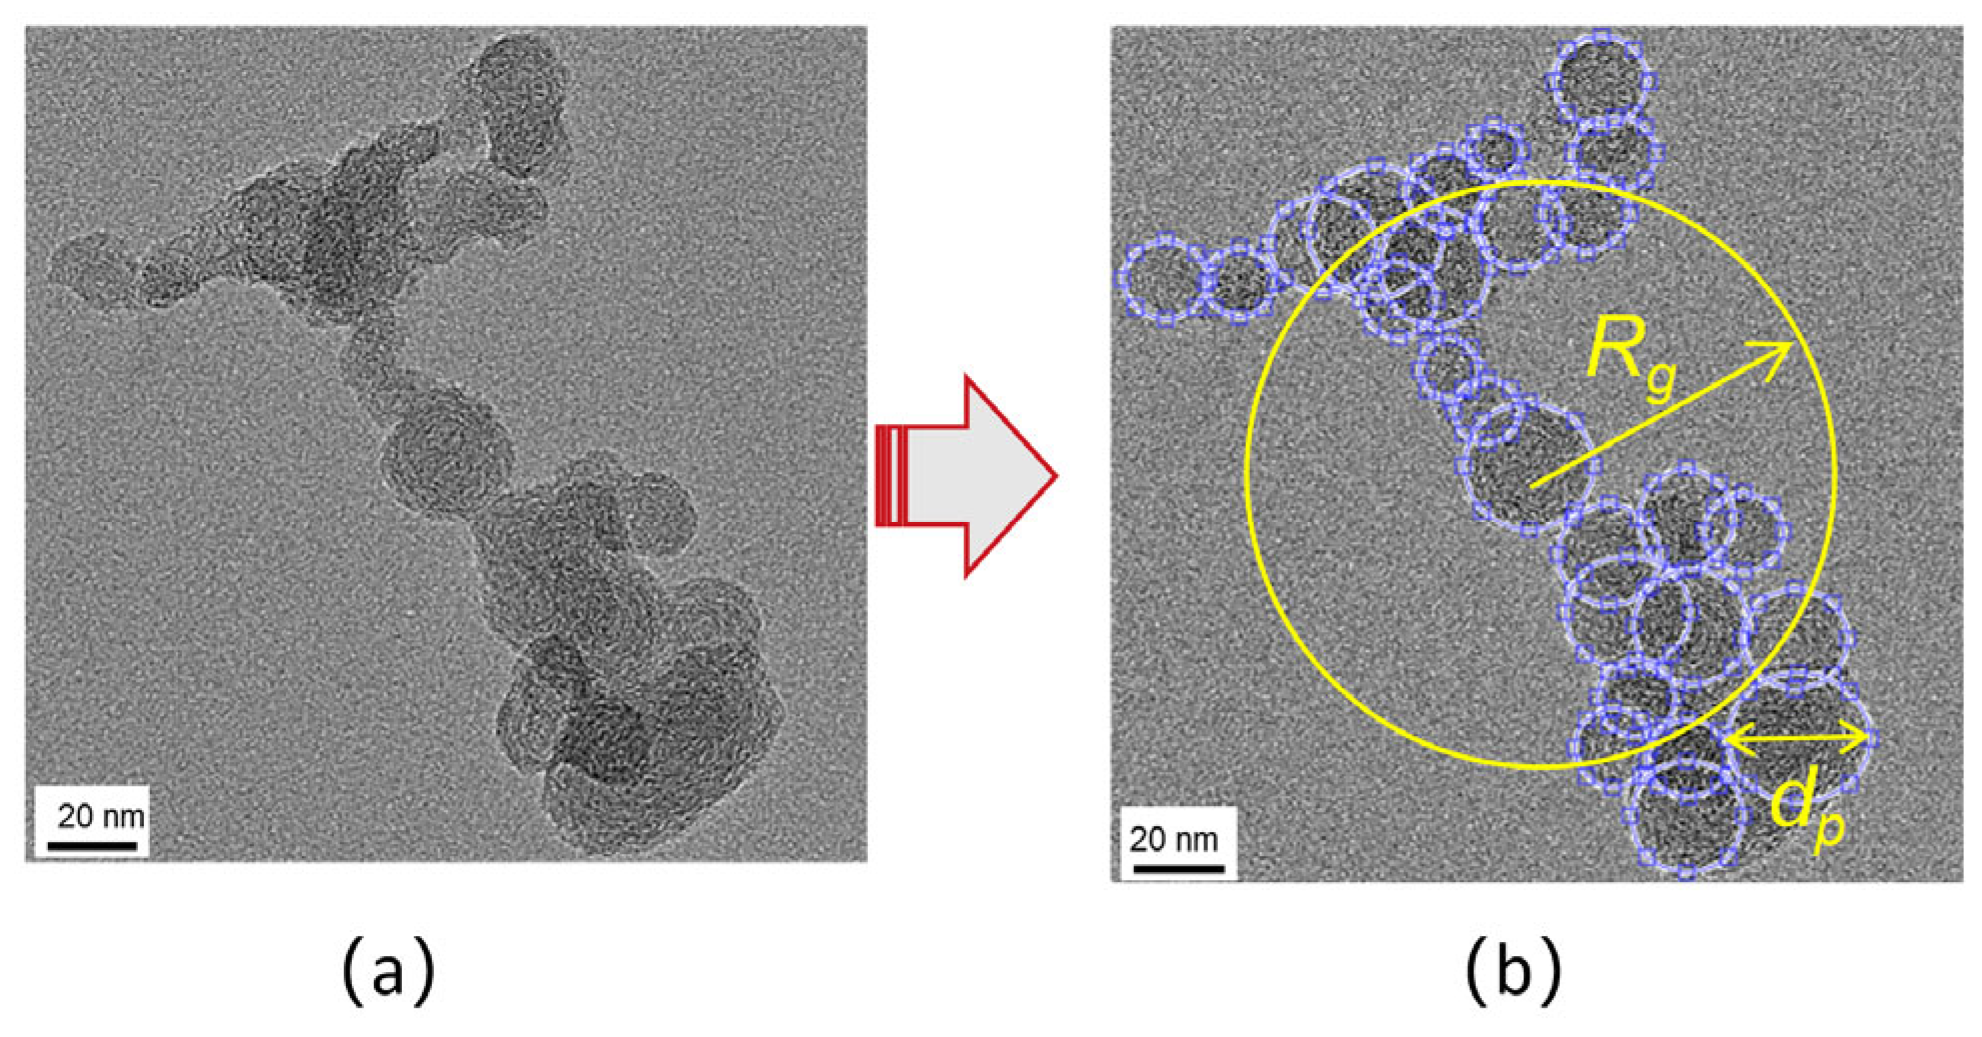
3.2.1. BC Particles Evolution

Morphology and Nanostructure

The study of the morphology of BC particles can be used to verify their formation and development process and is an important reference in the development of cleaning devices such as diesel particulate filters (DPF). The morphology of BC agglomerates sampled from high-speed diesel engines and laminar diffusion flames was found to be similar in structure [59,60,61]. They are usually irregular, chain-like clusters with branched structures. Figure 4a shows a two-dimensional (2D) illustration of a typical morphological result of BC particle agglomerates. The image was taken with a transmission electron microscope (TEM). Each agglomerate of the TEM image contains hundreds of spatially or nearly spherical carbonaceous particles, which are classified as primary particles. Due to their actual spatial structure, the primary particles overlap with each other to a considerable extent in the 2D plane projection. Therefore, the structure of the microscopic agglomerate can be described in detail by introducing certain parameters using a set of defined morphological ratios.
Processing and analyzing the TEM images helps to achieve various key parameters of the microscopic agglomerates. Each primary particle is assumed to be a spherule so that most of its diameters can be obtained in a 2D plane. However, the overlap projection areas of some parts of the primary particles lead to full edge detection which makes it challenging to analyze them.
Furthermore, an ellipse fitting can be used to measure the detecting apparent arc outline close to the boundaries of the primary particle accordingly, as shown in the yellow Rg in Figure 4b. Hence, using the area of an equivalent circle equation, the evaluated area of the ellipse is converted to the diameter of the primary particle. Also, the total projected areas of the agglomerates in the 2-D plane can be directly obtained by separating the agglomerates from background. Subsequently, the mean primary particle diameter (dp) as shown in the yellow line segment with arrow, maximum length of the particle (L) and radius of gyration of the agglomerates (Rg) can be achieved by computing these parameters further. Here, Rg is applied to calculate the average size of aggregates and is defined below in Equation (4) as:
R g = 1 n i = 1 n r i 2
where, ri is the distance between the center of a single primary particle and the center of mass of the aggregates, and n is the number of primary particles.
Ref. [62] indicated that the number of primary particles involved in the statistics should be enough to ensure their normal distribution. However, many of the primary particles render the calculated process of Rg from Equation (1) to be more complicated. Also, the overlapped projection of the primary particles increases the estimated uncertainty Rg value. Ref. [63] and Ref. [64] suggested a simple equivalent relationship between L and Rg as defined in Equation (5) below:
L / ( 2 R g ) = 1.5 ± 0.05
The above equivalent ratio is approximately 1.5 when there are more primary particles involved in the statistics.
Furthermore, based on statistical principles, Ref. [65] achieved the results regarding number of particles (N) and maximum aggregate length (L) under all engine conditions. These results have proven that N and L have an effective statistical relationship. Based on the least-square fitting, the slope of N to L/dp indicate the fractal dimension (Df). This was used to show the complex geometric structure of typical aggregates. In another literature, Df was computed by the linear regression of ln (N) versus ln (Rg/dp) accordingly [66].
However, Df is generally used to define the morphology and aggregated degree of agglomerates as shown below in Equation (6): Fractal-equation.
N = k L ( L d p ) D f = k f ( R g d p ) D f
where, kf or kL are both referred to as the fractal pre-factors. When the two results are compared further, it is observed that the two parameters are unequal. When N is constant, a decrease in Df value affects the ratio of Rg to dp to increase, indicating more dispersed structure and apparent branching.
There have been studies already on the parameters of microscopic BC agglomerates and fractal characteristics in diesel engines and combustion flames. In our previous study, the microscopic parameters from a high-power low-speed marine engine were investigated [67].
The results indicated that the average diameter (dp) of agglomerates was 34~40 nm. With an increase in temperature, more mature primary particles are formed due to oxidation. Hence, in high engine load, the dp and Rg values decrease and Df values increase. Ref. [68] discovered that the exhaust gas scrubber on aboard affects BC agglomerates and established similar dp result, approximately 30 to 50 nm for low-speed engine. It was found that the Df increased from 1.88 to 2.13 after exhaust gas scrubbing. In comparison, the dp and Df results of high-speed engine are 28.5~34.4 nm and 1.80~1.88. This clearly indicates that the results from a high-speed engine are relatively smaller [69]. In diesel spray flame, the average diameter dp varies significantly according to position. It gradually increases from downstream to upstream. In upstream area, the “liquid-like” transparent particles have larger diameters [70]. In downstream area, the mature particles are difficult to oxidize, resulting in the particle size to be likely similar. Hence, Df in diesel spray flame was further proven to be the smallest, approximately 1.59~1.73.

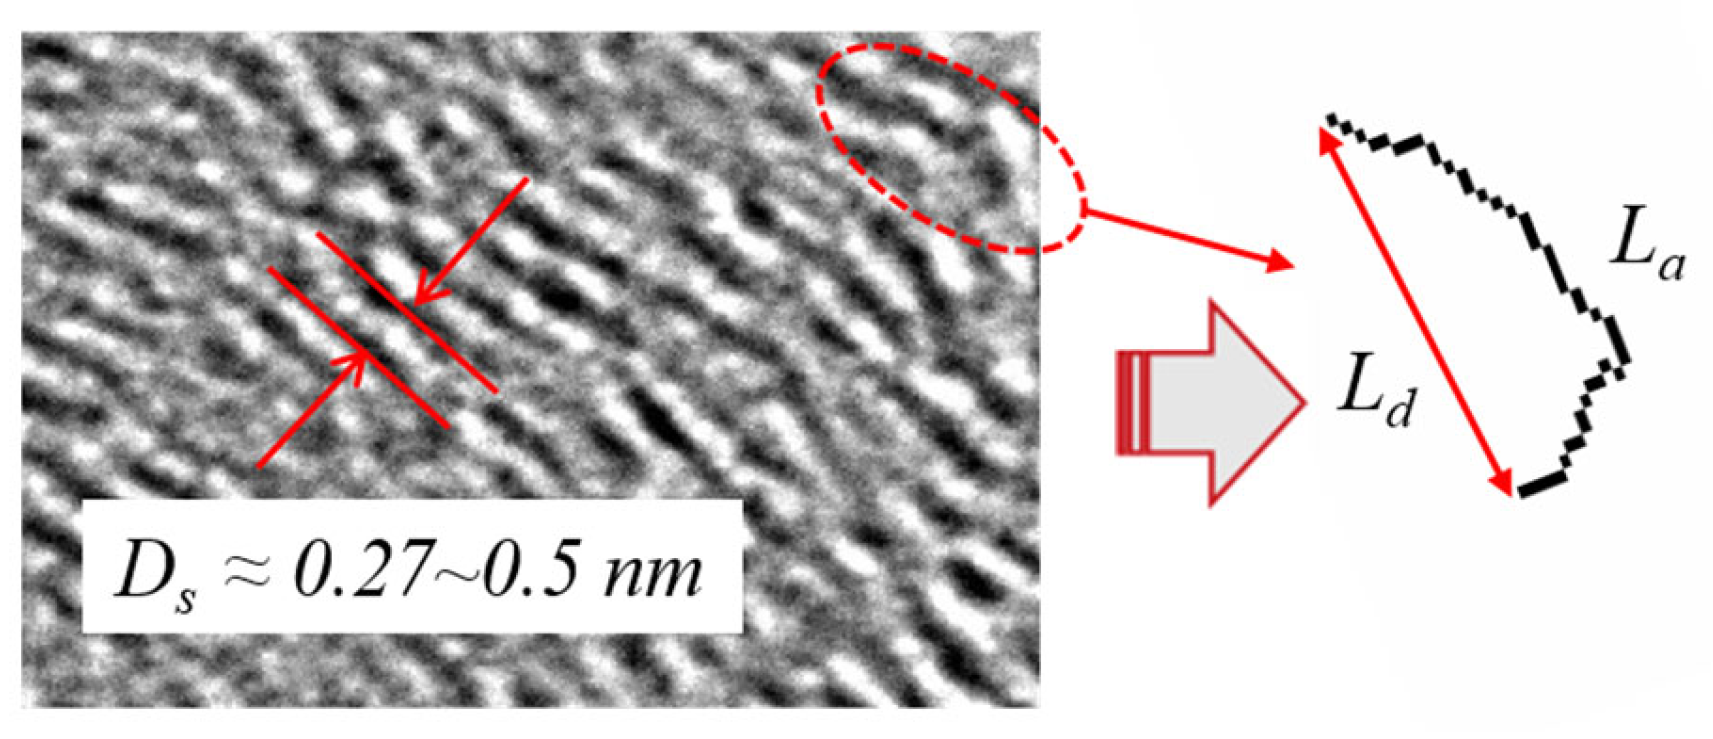
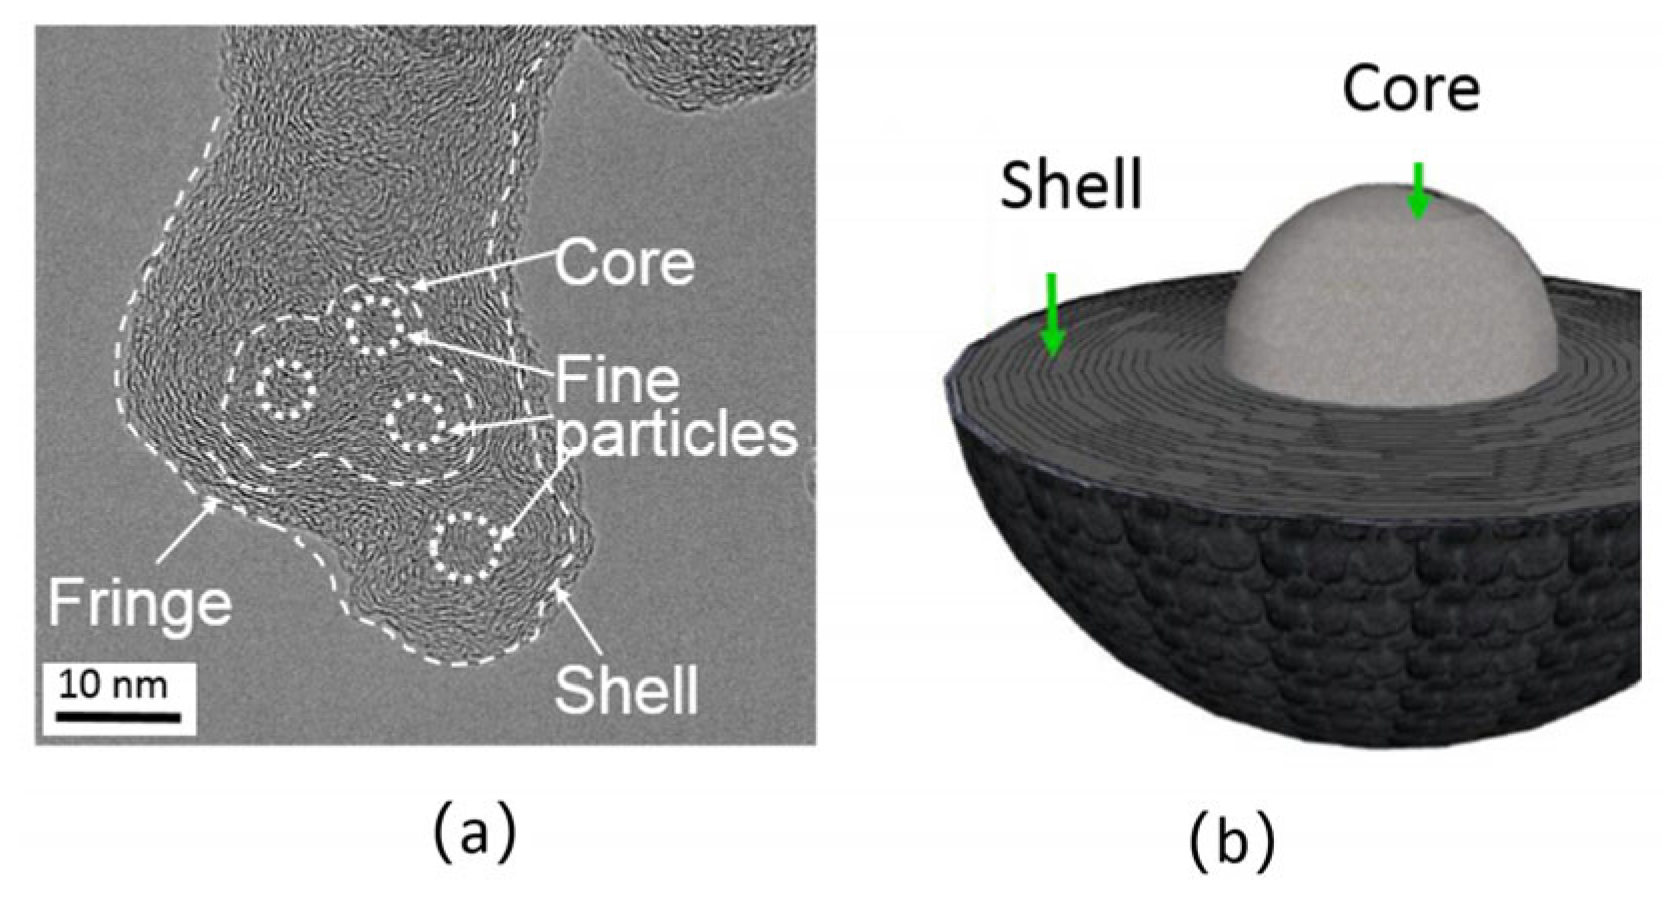
3.2.2. Nanostructure of Primary Particle

As already mentioned in Section 3.1, BC consists of primary particle agglomerates formed by the pyrolysis kinetics of PAHs. Generally, it is a single-layered graphitization or a combination of several piled-up layers of fragments, as observed by high-resolution Transmission Electron Microscopy (HRTEM). Regardless of the properties of the graphitic fragments, the nanostructure exhibits a high degree of similarity in formation. A typical nanostructure consists of small, orderly, stacked graphite fragments randomly arranged in a hybrid “onion-like” structure [71]. This is influenced by the combustion conditions and the properties of the precursor. In addition, the initial nanostructure of the particles has a marked influence on their oxidation reactivity [72], which significantly affects the regeneration efficiency of particulate filters [73,74]. Ref [74] describes the technology for the mathematical extraction of nanostructure parameters from HRTEM images. In our recent research [70], we have developed our own program using MATLAB 2014b software to measure three typical parameters of primary particles from HRTEM images with relatively high accuracy, as shown in Figure 5.
As shown in Figure 6, the Fringe Length (La) represents the physical projection of a spatial graphitic layer fragment on the 2-D plane and reflects the size of the graphitic layer fragment consisting of carbon atoms.
The longer the Fringe Length (La), the lesser the carbon atoms at edge reaction sites, leading to less reactivity, and this implies a higher degree of graphite formation. The Separation Distance (Ds) refers to the distance between two adjacent graphitic layers. The smaller the Separation Distance (Ds) as shown in the red lines in Figure 5, the harder it is for oxygen atoms to flow into the gap between the layers from the edge sites [74,75]. This also means a lower reactivity and a higher degree of graphite formation. Tortuosity (Tf) refers to the ratio of the Fringe Length (La) to the distance between the endpoints (Ld). Ld, as shown in Figure 5, represents the straight-line distance between the end points. Tortuosity weakens the C–C chemical bonds and makes them more susceptible to oxidative attack by stressing the bonds and ultimately reducing the electronic resonance stabilization in the orbital overlap [70,76,77]. As a result, a higher tortuosity means a higher reactivity and more curved fragments in space. In contrast, a lower tortuosity means straighter graphitic edges, a higher degree of graphite formation, and more mature structures in the primary particles.
The ordered nanostructure tends to represent a higher degree of graphite formation, a mature structure, and lower oxidation activity. A curved or disordered nanostructure, on the other hand, represents a lower degree of graphite formation and higher oxidation activity. This result was confirmed by Ref [78], who states that disordered carbon is more susceptible to oxygen attack. However, while there are many studies on the nanostructure of flame and high-speed marine engines, there is currently almost no nanostructure research for low-speed marine engines. Using our previous unpublished experimental data, we found an average value of tortuosity of 1.349 for a low-speed marine engine fueled by HFO, which is higher than the average value for a high-speed marine engine of 1.082. This suggests that the BC particles from low-speed engines may be less mature. We will investigate this further in our next work.
The core–shell structure model was created using the HRTEM nanostructure analysis method to elucidate the early formation process of diesel dust particles before aggregation. Zhang et al. [79] determined the inner core and outer shell structure of diesel soot particles in a direct-injection diesel engine. Jiang et al. [70] also found, in a developed spray study, that the mature core–shell structure exists downstream of the flame, consisting of one or more inner cores with a diameter of 4–6 nm as shown in Figure 6. These inner cores are enclosed by several ordered concentric graphitized shells, reflecting the combined effect of coalescence and surface growth. In a related study, it was reported that the core–shell structures were detected under certain conditions and were related to the combustion process in the engine [80]. At high speed and low load, shorter combustion duration and lower temperature in the cylinder can easily generate the core–shell structure. In contrast, at a low speed and high load, as well as a longer diffusion combustion duration, a larger initial carbon ‘core–shell’ with a higher degree of graphite formation at a high temperature cannot easily form.
Using X-ray diffraction (XRD) and HRTEM, Ref. [81] measured the degree of graphite formation and compared the results. The results obtained with the two methods showed exact agreement. Since the sensitive spectral signal is related to the degree of disorder, Raman spectroscopy (RS) can also be used as an effective complementary method to describe the degree of graphite formation.
The first-order Raman spectrum of carbonaceous particles had two peaks with wavelengths of 1350 cm−1 (D peak) and 1580 cm−1 (G peak), indicating the disordered and ordered fragments, respectively [82].

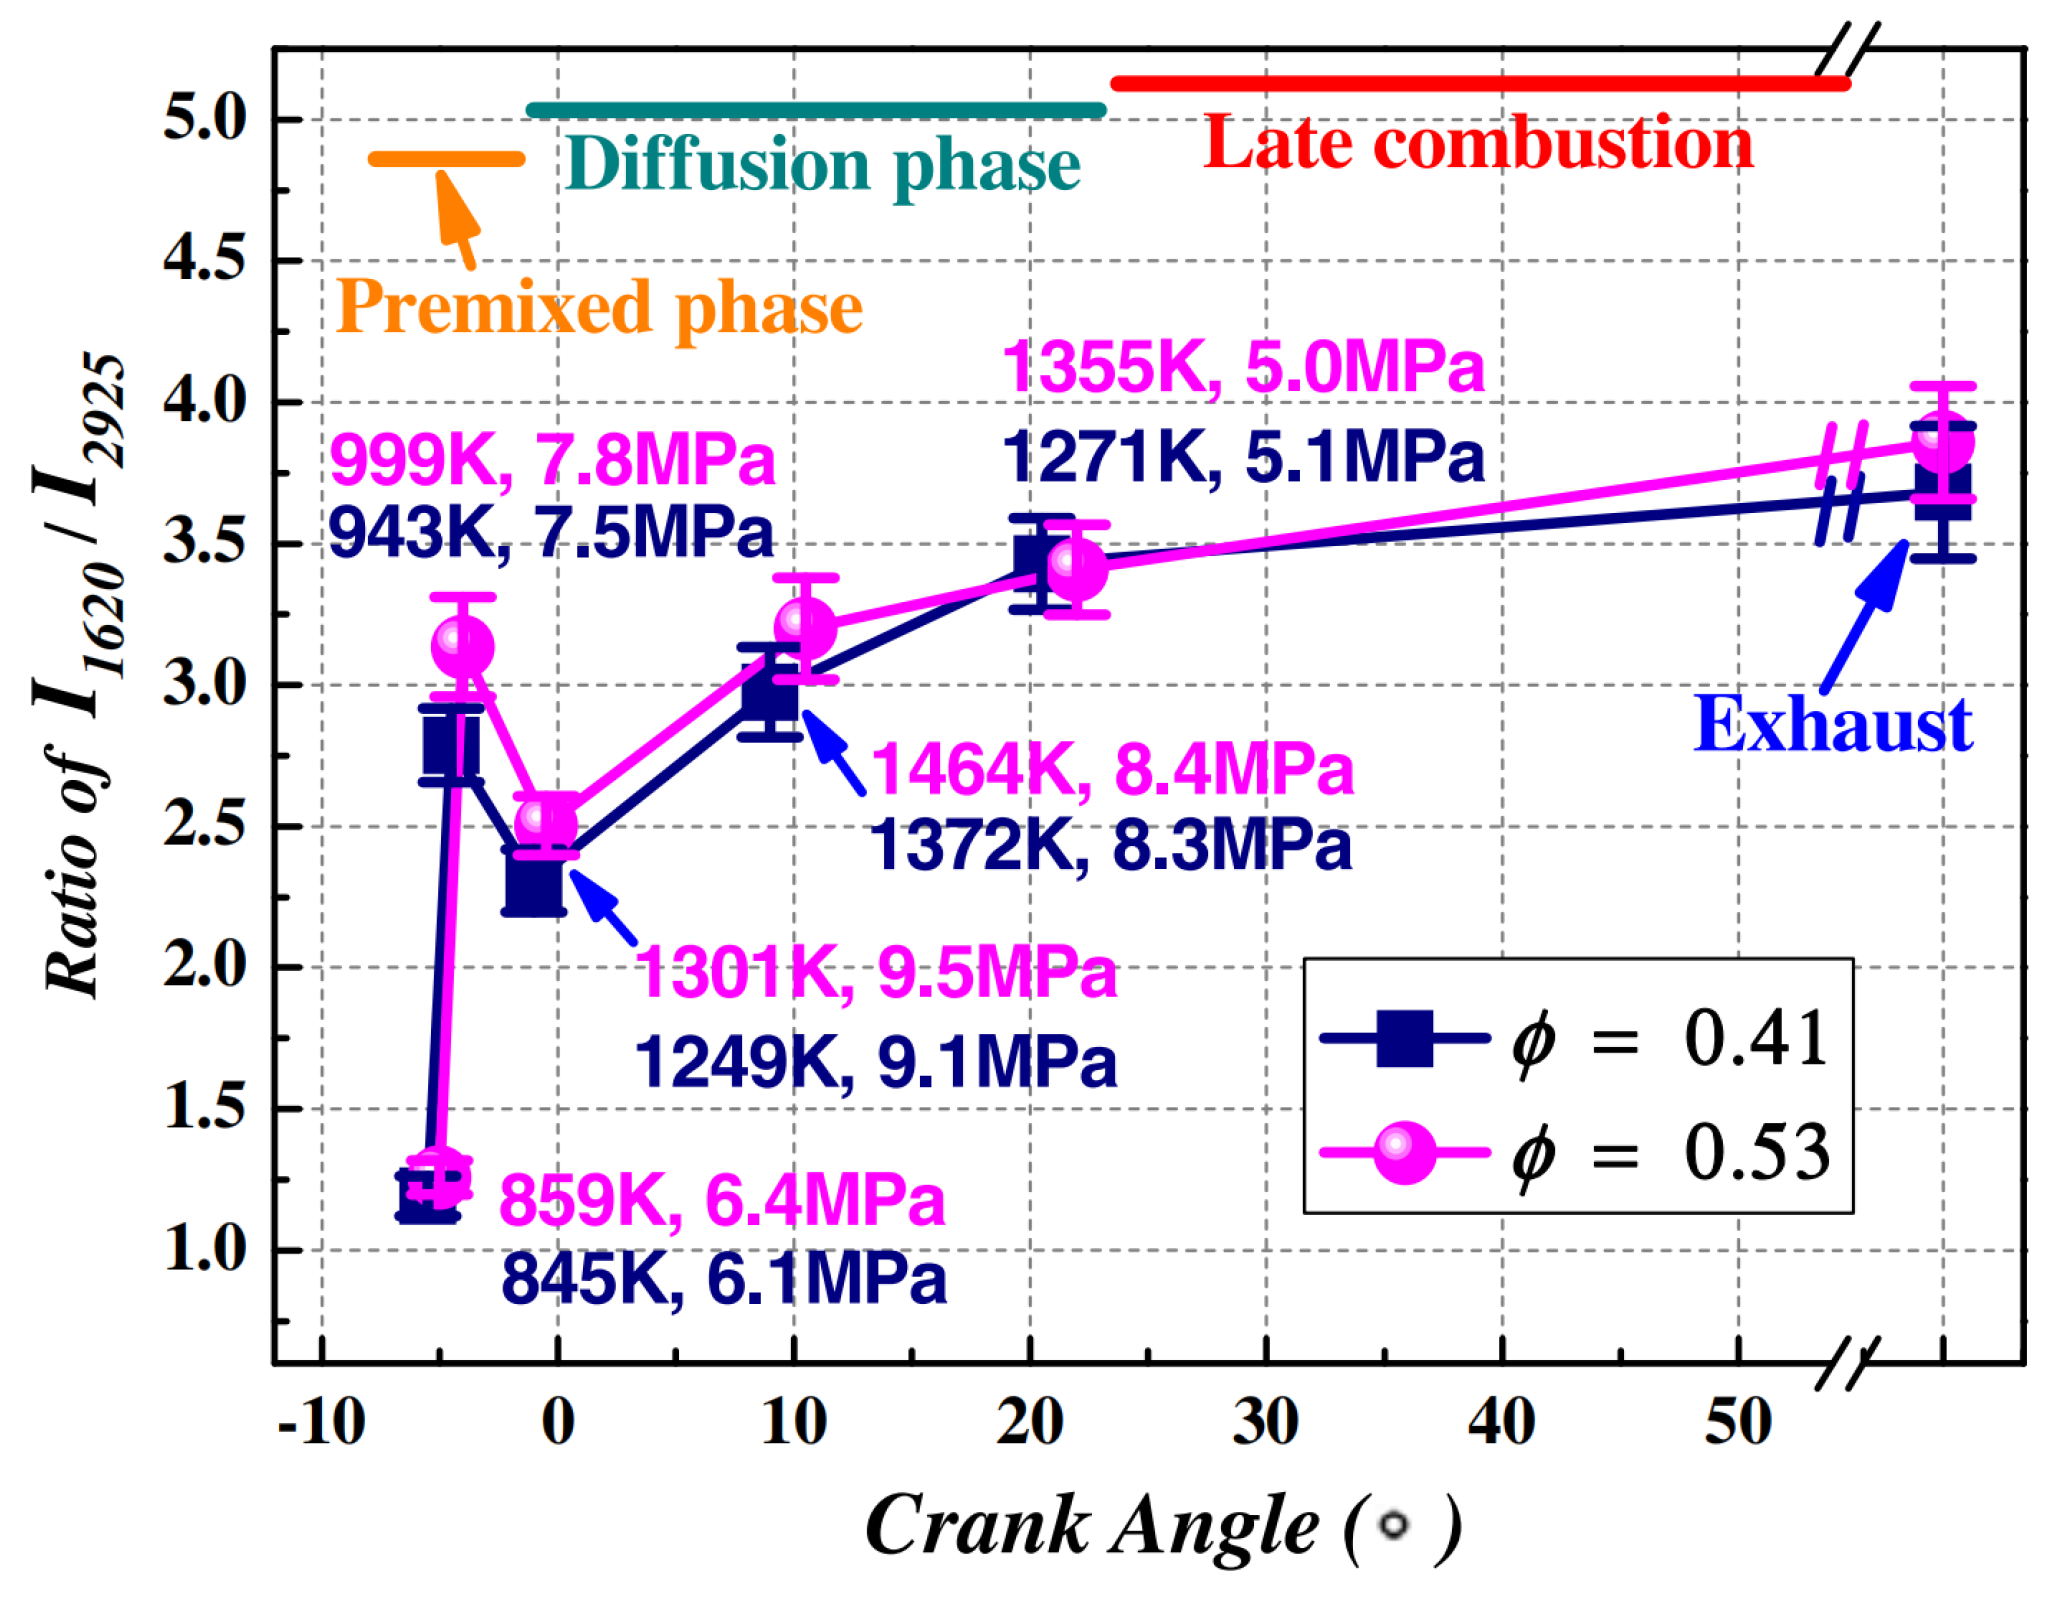
3.2.3. Surface Functional Groups

Surface functional groups play a significant role in determining the oxidation reactivity and soot nanostructure. Fourier Transform Infrared Spectroscopy (FT-IR) and X-ray Photoelectron Spectroscopy (XPS) are commonly used in many reports to study surface functional groups and the heterogeneous reactions with gases.According to molecular orbital theory, two atomic orbitals can form two molecular orbitals through a linear combination of atomic orbitals if they are close enough to each other. * stands for the antibonding orbital with the internuclear axis as the axis of symmetry. Results of XPS show that the C K-ionization edge indicates a major deviation range from 285 eV to 313 eV, which can be attributed to 1s−π* transitions and 1s−σ* transitions [83,84,85]. The maximum intensity occurs at around a binding energy of 284.4 eV of C1s spectra [86], signifying the dominant C-C bonding of the carbon atoms. Vander et al. [87,88] stated that the C1s peak at 284.5 eV and 285.4 eV are related to the sp2 and sp3 hybridization components, respectively. This result indicates that the graphitized structures are related to the functional groups. Since the functional groups easily bond with carbon atoms in the edges and gaps in the form of sp3 and sp2 chemical bonds, this results in increased reaction and oxidation rates in edge sites than in the basal planes [89]. Hence, the sp2 can be used to indicate graphitic carbon and defect sites, whiles the sp3 is used to indicate organic carbon. Refs. [87,88] established that there is a clear bond between the oxygen content of surface functional groups and soot reactivity. Due to the presence of oxygen in the surface functional groups, the C1s spectrum tends to show a higher binding energy of approximately 288.8 eV.
Furthermore, it was found that the aliphatic C–H groups are also present in nascent BC particles (soot) produced in flames. This is new evidence for the original formation of BC. Ref [90] and Ref [91] claim that the aliphatic C–H groups on the particle surface are determined by the high-temperature reactions of unsaturated hydrocarbons related to the formation of the initial graphitic cores and aliphatic shell structures. In the premixed initial stage of the engine combustion process, many particles produced cause the amount of aliphatic C–H groups to increase, as shown in Figure 7. However, during the transition from premixed combustion to diffusion combustion, the aliphatic C–H groups decrease rapidly and then increase gradually. The possible reasons for the decrease in aliphatic C–H groups are dehydrogenation and carbonization. The two different lines represent two conditions of the fuel-air equivalence ratio. Cain et al. [92] also found that numerous aliphatic hydrocarbons are present in the primary particles, which increase with increasing temperature. These aliphatic hydrocarbons consist of chain-structured alkylates with molecular weights between 200 and 900 amu. These facts indicate numerous aliphatic hydrocarbons in the primary particles, which means that the primary particles can be considered “liquid-like”. The aliphatic C-H groups on the particle surface are related to the combustion stage of the diesel engine [85].
The oxidation process of the particles is influenced by their nanostructure, and this occurs at the appropriate heating temperature. However, the detailed understanding of the functional groups involved in the oxidation and growth of BC is still limited. During the oxidation process, the thermal decomposition and rearrangement of the functional groups occur, leading to changes in the nanostructure and degree of order [93]. This has an effect on the oxidation activity of the particles. When the size of the graphite layer is reduced, or the amorphous structure inside the primary particle increases, the population density at the edge sites can easily increase, leading to an increase in reaction activity. This phenomenon is determined by the initial structural properties of the particles. However, when the carbon atoms in the oxidized regions are in the form of sp3 hybridization components instead of the original honeycomb structure with sp2 bonds, the disordered structures lead to a decrease in the degree of graphite formation. The higher the density of the dangling bonds [94,95], the more reactive the amorphous carbon with sp3 bonds becomes compared to the graphitic carbon with sp2 bonds. Therefore, carbon bonds with O or H, such as carboxyl (C–O–C), carbonyl (C=O), and hydroxyl (C–OH), are extremely important for increasing chemical reactivity.

3.2.4. Oxidation Activity

Oxidation activity is a key factor influencing the progress of surface growth and the size of the particles eventually formed, and this is effectively related to temperature changes. If the engine is equipped with a DPF cleaning system, this should be considered a critical indicator, as the high oxidation activity of the carbonaceous particles can improve the regeneration performance of the equipment and extend the life of the catalysts in the equipment. However, studying the oxidation processes is not easy due to the overlapping effect, as the oxidation process usually competes with the formation and growth of the carbonaceous particles. In most studies on flames or engines, the results of the oxidation and formation processes are usually combined. Typically, the carbonaceous particles formed during combustion lead to changes in nanostructure and relatively low oxidation reactivity. In addition, volatile substances such as hydrocarbons can alter the oxidation activity by filling the microspores or surrounding the outer surface of the particles [96,97].
During the oxidation process, two postulated oxidation fragmentation processes stimulate the results of breaking up aggregates of primary particles, either by preferential burning at the bridging sites or by direct internal burning [98,99].
The breaking up of bridging sites in the aggregate structure is followed by the removal of small fragments from the edges of the particle surface. The surface process specifically initiates the oxide species to break up the large aggregates and particles into smaller aggregates or smaller particles by removing the carbon atoms from the weak points of the particles. In the latter process, oxygen penetrates the particles, causing internal combustion and breaking the bond between the carbonaceous phases. Ref [87] confirmed the latter process and proposed a key mechanism of oxidation involving the alteration of the outer microcrystal structure, causing hollowing in the core.
The type and relative abundance of oxidizing agents have a major influence on oxidation reactivity and depend largely on the combustion conditions. Under normal combustion conditions, hydroxyl radicals (OH) and oxygen molecules (O2) are the most important oxidizing agents. In comparison, the oxidation contribution of insignificant amounts of O, CO, CO2, and H2O is negligible. Under fuel-rich conditions, the relatively high content of OH makes it the most influential species in the oxidation process, competing with generation and growth [100]. However, under fuel-poor conditions, O2 contributes significantly to the overall oxidation rate. The particles generated under fuel-rich conditions can eventually be oxidized under fuel-lean conditions due to the large amount of molecular fractions [101,102].
In general, a thermogravimetric analyzer (TGA) can be used to study the oxidation activity of the particles [81,103]. This procedure involves two steps: the elimination of volatile substances in the inert gas atmosphere (nitrogen or argon) and the oxidation in the oxygen atmosphere (air or oxygen).
According to Ref. [104], the modified version of the Arrhenius formula shows the relationship between the reaction rate and the temperature, and this expression can be used to calculate the activation energy as shown in Equation (7) below:
k = A e x p ( E a R T )
Based on thermo-gravimetric analysis, the ignition temperature (T) can be measured, where the maximum mass loss rate occurs during the volatilization process. The activation energy (Ea) can be calculated in combination with the factor (A) and gas constant (R) to evaluate the oxidation activity. Theoretically, the ignition temperature is inversely proportional to the oxidation activity. This implies that the lower the ignition temperature, the higher the oxidation activity. Generally, the oxidation activity is highly dependent on the structural characteristics of the particles and is related to the temperature, oxidation time, and surroundings. Assuming the oxygen concentration in the environment is decreased, a reasonable assumption is that the oxidation process will be hindered, resulting in a higher mean diameter of primary particles (dp) and radius of gyration of the agglomerates (Rg) as well as a shorter Fringe Length (La) of primary particles with a reduced degree of graphite formation.

3.2.5. Particle Size Distribution

As discussed in Section 2.1, several new policies and standards of PMs have been introduced by numerous governments. These policies and standards aimed to maintain the allowable level of the annual average concentration of PMs10 (aerodynamic diameter less than 10 μm), no more than 50 μg/m3, and maintain the level of the annual average concentration of PMs 2.5 (with aerodynamic diameter less than 2.5 μm) at no more than 15 μg/m3. Kittelson et al. [105] identified the three size distribution modes typically for diesel exhaust particles; they include (1). nuclei mode with a 5~50 nm diameter range, wherein the particle number is approximately over 90% and only accounts for 5~20% of the particle mass; (2). the accumulation mode with a 30~100 nm diameter range, dominating the largest proportion of particle mass and containing large amounts of carbonaceous agglomerates and related adsorbed materials; and (3). the coarse particle mode with a diameter over 100 nm. It was composed of particle accumulation obtained from the cylinder and exhaust.
Scanning Mobility Particle Size (SMPS) or Electrical Low-Pressure Impactor (ELPI) can be used to determine the particle size distribution and the number of concentrations in engine exhaust gases. However, SMPS has a better steady-state sensitivity than ELPI, while the latter has a higher measurement range. Maricq and Kinsey et al. [106,107] conducted a study to compare the instruments and proved that ELPI and SMPS provide a general analogous result.
Previous studies have confirmed that the particle size distribution of marine engines differs from that of normal car engines due to the duty cycle and heavy residual fuel. Kasper et al. [26] reported higher peak concentration numbers and found the average particle diameter of a large, low-speed marine engine to be 20~40 nm, which is smaller than that of high-speed four-stroke engines. In this study, the sampled gases were heated to 400 °C by thermal desorption to vaporize most of the volatile substances. However, 400 °C is still not sufficient to eliminate the interference of volatiles. According to the description of the refractory properties of BC particles, the gasification temperature of BC particles is around 4000 K. In the alternative measurement of elemental carbon (EC), the temperature range should be greater than 850 °C. Therefore, the difference in particle size distribution may be influenced by the presence of volatile substances or other impurities in the fuel. It may also be due to the high molecular weight hydrocarbons of the cylinder lubricating oil and unburned fuel. In a recent study, Chu-Van et al. [108] investigated the particle size and number of two large cargo ships equipped with low-speed marine engines and fueled with similar HFO. It was found that the particle size distribution was quite different for the two ships. In addition, there was a monomodal distribution of particle number concentration and a bimodal distribution of particle number concentration with a peak value of about 40–50 nm and 20–60 nm. The result, thus, shows a difference in the particle size distribution, which indicates further challenges and shortcomings in the measurement of PM and BC emissions from large ships. Due to the inconsistent measurements, the particle size of particulate matter from large ships may face a number of technical challenges, especially when considering the effects of dilution and condensation conditions [109]. An independent measurement of carbonaceous BC particles is more meaningful and helps to determine the composition of PMs and reduce ship emissions. However, there are some specificities, such as effective separation methods, sampling locations, and characteristics of ship engines (age, fuel, and technology), which need further clarification. In addition, further research is needed as particle size is related to nucleation and aggregation, and the design of after-treatment systems depends significantly on it.

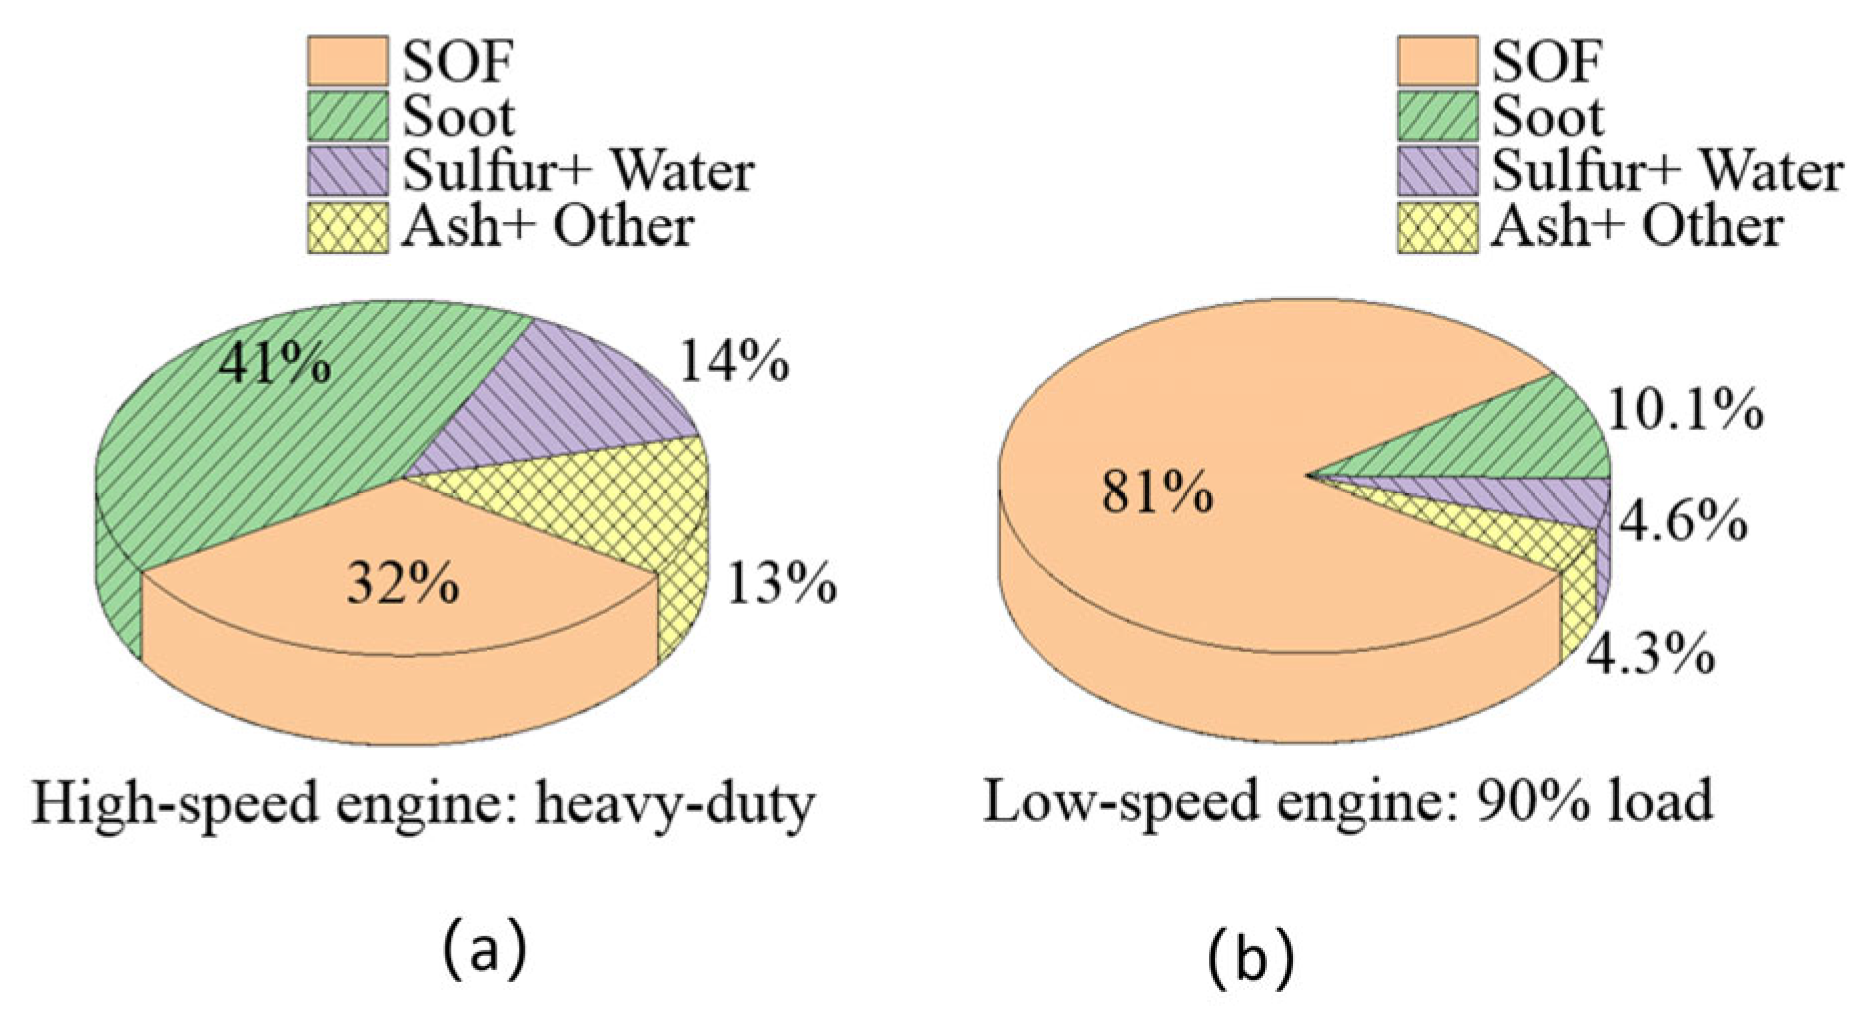
3.2.6. Chemical Composition and Element of BC Aerosol Compounds

The composition of BC aerosol compounds consists mainly of carbon elements, sulfates, nitrates, metals, and traces of other elements [110]. Elemental carbon (EC) and organic carbon (OC) are the main components of carbon in BC aerosol compounds and are associated with the quality of the environment and human health [54]. EC is a component that comes closest to the properties of BC and is produced by the pyrolysis of fuels. However, OC is mainly derived from unburned fuel or lubricating oil [111]. Mayer et al. [55] found that 30–50% of OC comes from lubricating oil in high-speed engines. Currently, it is not possible to determine the contribution of lubricating oil to BC emissions in low-speed engines. A thermo-optical carbon analyzer can be used to study carbon elements and contents [112,113], where OC1, OC2, OC3, and OC4 denote the volatile, semi-volatile, non-volatile, and carbonized organic substances. EC1 stands for charcoal, which is formed during the pyrolysis of fuels at low temperatures, and EC2 + EC3 are formed in the conversion phase at high temperatures, from the gas phase to solid particles [114]. Gradual heating from 323.15 K to 853.15 K in a helium atmosphere can separate various OC components from BC aerosol compounds [70]. Heating to 1223.15 K in an atmosphere of 2% oxygen and 98% helium can also further separate various EC components.
Like the results of the particle size distribution, the compositions of the BC aerosol compounds for low-speed marine engines differ greatly from that of a high-speed vehicle. For a high-power, high-speed engine, the aerosol compound consists of more than 70% carbon elements, and the EC (soot) fraction exceeds 40%, as shown in Figure 8a [105]. In our earlier studies [70], it was found that the total content of carbon elements in low-speed marine engines is about 90%, which is higher than in high-speed engines, as shown in Figure 8b. Soluble organic fraction (SOF) elements account for more than 80% and are usually the main component of PM, followed by the BC component (soot) with a mass fraction of aerosol compounds of 7–12% at high load, which is less than the fraction in high-speed engines. In the study of low-speed engines, increasing the load from 25% to 90% led to a slight increase in the EC and OC fractions. The engine load, therefore, has an influence on the chemical composition of the fuel.
In addition to element C, BC aerosol compounds also contain various other elements that influence their toxicity. Wu et al. [115] studied four fuels widely used in the transportation industry and indicated that the cytotoxicity of heavy marine fuel is higher than that of gasoline and light diesel oil. As shown in Figure 9, carbon black is considered the main type of BC in the aerosol sample. The morphology and nanostructure of carbon black are consistent with the description of spherical aggregates and disordered graphitic fragments above. In the BC aerosol compound sample, C and O dominate the elemental composition. Similarly, Ca and Si are the typical elements from vehicle exhaust samples [116,117], indicating the clear relationship between BC and fuel. Due to the Ca-containing additives added to the fuel or the production process, large amounts of Ca and Si elements are inevitably found in the fuel. Fe was also easily found in the compounds, usually in combination with other metals [118]. The element S in aerosol samples is normally found in coal and residual oil [119]. Ashraful et al. [120] determined the quantitative elemental composition at a given speed of a high-speed engine as O (19.18 mg/g), S (3.7 mg/g), Si (29.6 mg/g), Ca (18 mg/g), Zn (5.34 mg/g), Cr (3.5 mg/g), Fe (4.58 mg/g), Na (32.12 mg/g), Mg (5.082 mg/g), Pb (0.87 mg/g). These complex results of inorganic species and elemental compositions indicate the various possible sources of BC. It is necessary to conduct further studies to determine and identify the original source of BC.
The different elemental compositions and properties also contribute significantly to the reactivity of BC. Muehlbauer et al. [121] claimed that the structure and size of the particles have little obvious correlation with their reactivity. According to the results, there is a recognized correlation between the reactivity of carbon black and the elemental composition, such as ash content resulting from fuel, lubricating oil, and engine wear.
Liati et al. [122] detected traces of metal constituents in the compound and confirmed that the wear of the engine lining also increases the ash content in BC aerosol compounds. Ref. [123] found that the lubricating oil influences the oxidation kinetics. Hansen et al. [124] found that Na and K species cause oxidation temperature deterioration.
In summary, it can be confirmed that the ash content has a varying influence on the oxidation behavior of the particles. Nevertheless, the influence of these inorganic elements on particle formation, oxidation behavior, and the design of exhaust gas aftertreatment devices needs to be further investigated. Inductively coupled plasma mass spectrometry (ICP-MS) [125,126], inductively coupled plasma optical emission spectrometry (ICP-OES) [127], and scanning electron microscopy (SEM) in combination with energy dispersive X-ray spectroscopy (EDX) [120,125,127] were used to identify and analyze the composition of BC aerosol compounds.

4. Measurement Technologies

4.1. Alternative Measurements of the BC Aerosol Compound

The Scanning Mobile Particle Sizer (SMPS) and the Electro-Low Pressure Impactor (ELPI) can be used to measure the number and size of PMs by sampling them directly from the engine exhaust system. The size distribution results of SMPS and ELPI are expected to be similar at a steady state, although SMPS has better sensitivity, while ELPI has a wider measurement range [106,107]. The collection of PMs from quartz filters or Teflon membrane filters over a period can be used as an alternative measurement for BC aerosol compounds. A Tapered Element Oscillating Micro-balance (TEOM) equipped with a conical micro-balance can be used as an instrument to weigh the filter samples. These filter samples are repeatedly used for further analysis of the detailed OC and EC composition by thermo-gravimetric analysis. This is a clear and important recommendation in many PM emission regulations, such as the US EPA and China’s GB15097-2016.
Currently, test methods for PMs in ocean-going, low-speed engines are not harmonized, and standardized sampling and emission regulations have not yet been established. The main challenge lies in a standardized sampling of low-speed engine types and displacements, as well as the structure and location of the exhaust system. There is a lack of data to support test environments, such as temperature, humidity, flow rate, and dilution conditions. Furthermore, it is difficult to realize full-flow sampling in a vehicle sampling system due to the high exhaust flow rate of low-speed engines.
Figure 10 shows the partial flow sampling system developed by our team for a marine two-stroke, low-speed engine. Based on this sampling design, the PM sample was successfully obtained from the emissions of the low-speed engine, and the properties of BC were analyzed by OC/EC, thermo-gravimetric analysis, and TEM imaging. In future studies, the effects of the sampling temperature, flow, rate, and dilution ratio will be investigated in detail to further evaluate the properties of PMs in a ship with a low-speed engine.

4.2. BC Measurement from Exhaust

It appears that the methods for detecting BC (or EC) emissions from ships are more difficult than PMs, so regulations for BC emissions from ocean-going, low-speed engines may appear somewhat later than regulations for PM. The main challenge lies in the uncertainty of the test methods. Currently, particle mass properties and optical properties are the two main measurement targets. Measurement methods include a combination of weighing, light absorption (LA), thermal radiation (TR), and thermo-optical (TO) methods. In addition, the structure of carbonaceous particles is similar to that of graphite as both are linked by sp2 chemical bonds. Therefore, experiments were also measured and analyzed by microaggregate morphology or Raman spectroscopy [8,84].

4.2.1. Weighing Method

The weighing method is generally applicable to many high-speed engines. It is applied directly to the exhaust gases without affecting the combustion process of the engine. As previously mentioned in Section 4.1, the sampling procedure and the weighing method procedure can be used to describe various PM emission regulations. Quartz fibers are used to collect samples and then weighed and analyzed using a TEOM. More comprehensive properties and chemical compositions of the collected compounds can be further analyzed using thermo-gravimetric and other analytical instruments. However, the actual sampling process is limited due to the location and structure of the marine diesel engine. This makes it difficult to fully standardize the sampling conditions on different engines. In addition, the measurement results of the collected samples cannot determine the mass fraction of the BC components. Ashes, metallic elements, volatile substances, etc., can cause significant errors in the results.

4.2.2. Light Absorption Method

The light absorption (LA) method is a widely used technology for measuring BC components based on the principle of optical diagnosis. In this method, the light intensity is measured through the exhaust gas sample, and the coefficient related to the mass fraction of BC can be quantified. Currently, many measurement devices have been developed based on light absorption properties, and the measured result is generally referred to as equivalent BC (eBC).
The Particle Soot Absorption Photometer (PSAP) and the Multi-angle Absorption Photometer (MAP) are both typical devices that contain light absorption filters that can be used to determine the light intensity in the exhaust gas. BC was calculated as the ratio of Light Absorption Coefficients (LAC) to Wavelength-Dependent Mass Absorption Coefficient (WMAC). Photoacoustic Absorption Spectroscopy (PAS) is a more effective measurement method compared to PSAP and MAP (light absorption filter). PAS not only measures the attenuation light but also measures the photoacoustic response to the ozone of light with two wavelengths at 532 and 405 nm according to the calibration. Also, the Filter Smoke Number (FSN) can estimate the amount of adsorbed BC by measuring the light absorption of the smoke filter. It is also an optical technique for measuring the opacity of exhaust gases. However, as experience shows that it needs to be calibrated, the accuracy depends on the empirical data prepared [128]. In addition, the composition of light-absorbing carbonaceous substances in exhaust gases includes not only BC but also brown carbon, which necessitated an evaluation and redefinition of light-absorbing carbonaceous substances in exhaust gases [39]. This can lead to a preference for “BC” and “EC” measurements and ultimately to the mass concentration of brown carbon being higher.

4.2.3. Laser-Induced Incandescence Method

The Laser-Induced Incandescence (LII) measurement method is an inconspicuous diagnostic method with a high temporal resolution and a large dynamic range. This method is suitable for BC measurement in diesel spray flames [129,130,131], in the turbulent combustion chamber [132,133] of an engine, and in engine exhaust gases [134,135].
The basic principle of LII is that the soot concentration is proportional to the generated glow signal, and this method belongs to the category of measurements with light absorption and thermal properties. A short-time high laser pulse is used to vaporize the particles along the laser plane by heating the generated soot in flames. After a few seconds, some of the energy absorbed by the particles is released in the form of quasi-black body radiation. This produces a strong glow signal with an estimated mass-equivalent diameter. Single Particle Soot Photometer (SP2) works on the principle of LII and is also designed to measure BC emissions from engines. This device can continuously obtain real-time information on the concentration and size of the particles. However, the size measurement range is limited and ranges from 80 to 700 nm. At the same time, there is a relative error of about 15% due to the sensitivity [135,136]. The limited detection range makes it unattainable to measure smaller particles. The measured result is generally referred to as refractory BC (rBC).

4.2.4. Thermal Radiation Analysis (TRA) and Thermal–Optical Analysis (TOA)

Thermal Radiation Analysis (TRA) is often used because it is a convenient method for measuring thermal properties. Based on the refractoriness of BC, various thermally stable carbon constituents can be obtained by analyzing the carbon dioxide product from the samples during the stepwise heating process to separate the assumed BC constituents from the samples at higher temperatures. In the first stage of the heating process, the OC components volatilize in an inert gas environment. In the second stage, after stabilization, oxygen is introduced into the environment to maintain the combustion process of the sample. The result is usually referred to as elemental carbon (EC).”Charring” is the phenomenon of the conversion of OC to EC components at high temperatures when exposed to oxygen for a prolonged period of time and simply leads to an overestimation of the measured EC results [137]. However, the “charring” phenomenon can be reduced to a certain extent by correcting the optical transmission correction. This improved detection method is called the Thermal–Optical Analysis (TOA). However, even this method cannot eliminate the measurement error, as the distribution of the deposit in the sample and the temperature ranges have an influence on the different operating results [138,139].
There are only a few recognized standard methods for BC and EC measurements, which is due to the large differences in the respective concentration data [138]. The Interagency Monitoring of Protected Visual Environments (IMPROVE) and the National Institute of Occupational Safety and Health (NIOSH) have both used the Thermal Evolution method, with EC results varying due to differences in temperature and optical monitoring. In a study by Chow et al. [138,139], the EC result of the NIOSH method was found to be half that of the IMPROVE method. The reason for this is that the NIOSH method distributes the carbon fraction to OC at 1123.15 K in the helium atmosphere. When the carbon fractions are redistributed to EC at this temperature, the NIOSH and IMPROVE results agree. Some common BC measurement methods and instruments are summarized in Table 2 below.

4.3. BC Measurement in Flames

The measurement of BC in the flame is also important because it not only helps to determine the initial formation and reaction in a short time but also allows a systematic study of the two-dimensional distribution of the temperature field and the material concentration field during the combustion process.

4.3.1. Light Extinction Method

The principle of light extinction for measuring BC concentrations in flames is that the amount of absorbed light is proportional to the amount of BC aerosol compounds in the flame. The scattering vector Q combines the diffraction, reflection, and refraction properties of light to measure the degree of absorption by particles [140,141] and can be calculated by the following Equation (8).
Q = π 4 4 λ 2 d 6 f ( m , N )
where λ is the wavelength, d is the particle diameter, and f is a function that depends on the soot refractive index m and the particle density N. The absorption can be determined using the associated absorption coefficient Ka, which is given in Equation (9) [141].
K a = π 2 λ E ( m ) N d 3
where E (m) is the function of the soot refractive index.
The measured results may contain errors due to the varying refractive index in the flame field. Under the influence of high-pressure conditions, the temperature gradient causes a significant increase in the density gradient [142].

4.3.2. Two-Color Method

The two-color method provides a convenient measurement for time and space-resolved values based on the temperature and soot concentration of the spray flame. For any two-color channels, the absolute radiation intensity Is,R (T) can be expressed by Equation (10).
I s , R ( T ) = λ 1 λ 2 f ( λ ) ε λ I b ( λ , T ) d λ
wher, λ1, λ2 are the two corresponding wavelengths; Ib (λ, T) is the radiant intensity of soot at wavelength λ and temperature T; ελ is the monochromatic emissivity and can be calculated. Ref. [143] has explained the two-color measurement method in more detail.

4.3.3. Full Cylinder Sampling Method

In the Full Cylinder Sampling method, BC samples are measured directly from the combustion chamber of the engine. The engine is modified so that BC samples can be collected through a valve and analyzed to reflect the initial BC formation and prevent its chemical and physical properties from changing in the exhaust pipe. The combustion chamber must open at a certain crank angle θ (° CA) during the combustion process. The solenoid valve is installed to open the sealing plate at the front end of the gas duct so that the high-temperature gas can flow out of the combustion chamber quickly due to the pressure difference. A plume of high-pressure nitrogen flows at room temperature and accelerates the “freezing chemical reaction” of the extracted high-temperature gases [59,89] to obtain the time evolution information of BC generation. However, it is uncertain whether the high-pressure nitrogen affects the formation of BC particles. Moreover, the formation and oxidation of BC particles are closely related to the local concentration and temperature of the mixed gases. Therefore, this measurement will be more effective when combined with other techniques.

4.3.4. In Situ Sampling and Measurement

The optical diagnostic method can provide the necessary information about the temperature and BC concentration distribution in the flame to recognize the generation and oxidation characteristics of BC by the in situ technique. However, optical measurement methods cannot capture the actual detailed generation information based on the microscopic morphology and nanostructure of the particle, as described in Section 3.2. Since BC is present in the combustion flame in the form of aerosol compounds [70,71], it can be collected with a sampling probe [70]. The initial temperature of the sampling probe is usually at the temperature, and if you quickly introduce the surface of the probe into the high-temperature flame, a large temperature gradient is created according to the principle of thermophoresis. Under the influence of thermophoretic force, the rapid reaction process of BC formation is reduced. Some parameters, such as the morphology of micro-agglomeration, the nanostructure, and the mechanical properties of BC, can be measured and analyzed using High-Resolution Transmission Electron Microscopy (HRTEM) and Atomic Force Microscope (AFM). Based on the principle of thermophoresis and temperature gradient, a new thermophoresis sampling probe was developed and combined with in situ sampling at different locations of the diesel spray flame. A characteristic analysis of BC has been achieved and presented in our previous publications [67,70]. Figure 11 shows the thermophoretic probing and experimental setup of a constant volume combustion explosive to generate the diesel spray flame used to sample the BC particles. In the future, we plan to carry out an in situ sampling and BC analysis in a single-cylinder marine engine testing bench.

4.4. Measurement Method Discussion

For different BC measurement methods, the accuracy and repeatability of results vary depending on environmental conditions, sampling methods and sampling techniques. To distinguish the results when using different measuring devices, it is recommended to refer to the results in standardized terms such as eBC, rBC, EC, and BC Refs. [8,28]. EC is not synonymous with light-absorbing carbon but is often referred to as BC congruently [8,141,144,145]. However, the measured values of eBC, rBC, EC, and BC show certain similarities.
BCPAS derived from photo-acoustic, BC Filter derived from filter absorption, and rBC obtained from LII are the available measurement methods for BC emissions from ships. These three categories of measurement results indicate a relative agreement at a conclusive level [28]. In the actual measurement of ship exhaust, the ECTOA results did not always agree with the measurement results of the BC Filter. The measured ECTOA results are more than twice as high as the BC Filter results (MAAP) [146,147]. This difference in the results was attributed to the presence of a high OC content (POM) in the exhaust gas [148,149,150]. In addition, the TOA method does not have the temporal resolution required for plume analysis. Therefore, these results suggest that ECTOA may not be a reliable measurement method for ship exhaust.

5. Control Technologies for Reducing BC Emissions

Due to the integrity of ship systems, it is, therefore, possible to increase the efficiency of marine engines and reduce fuel consumption by optimizing the design of the ship and operation in the following ways: (1) improving the ship’s design and structure; (2) alternative propulsion systems or energy recovery devices; (3) reducing fuel consumption through energy-efficient operation. Detailed measures to improve the energy efficiency of ships are listed in Table 3.
The improvement of engine combustion and the reduction of fuel consumption are of great importance and are promoted regardless of the type of technology. Improving in-cylinder combustion is not limited to combustion improvement techniques and theories, but fuel injection can also be improved by improving and optimizing the injection device, developing new effective engine energy conservation technology, and improving and replacing fuel. The development and implementation of effective lubrication and cooling systems, the use of the correct lubricant formula [151,152], and the use of clean green energy all contribute to the reduction of BC emissions. Comprehensive technological improvements can reduce BC emissions from ships by about 50% [28]. Thus, there is still much room for improvement to reduce BC emissions from ships. It is recommended to consider the above control technologies first, as they are reliable and economically feasible.

5.1. Purification before Engine

5.1.1. Traditional Marine Fuels

Reducing the use of Heavy Fuel Oil and improving fuel quality plays an important role in reducing emissions. Ref. [28] showed that the type of marine fuel, as well as the ship’s operating conditions, have a significant impact on the ship’s BC emissions. When the ship’s speed is reduced and the fuel is switched from HFO to MGO, OC, and BC, emissions are estimated to decrease by 70% and 41%, respectively. This is due to fewer aromatic and long-chain hydrocarbons. PM, SO2, and other types of sulfates have also been significantly reduced. The sulfur content is an important factor. Switching the fuel [149] from one that is high sulfur (1.12% S HFO) to one that is low sulfur (0.38% S DO) reduced PM, OC, sulfate, and PAH emissions by 12%, 20%, 71%, and 94%, respectively. Similarly, slowing the ship operation from 11 to 8 knots reduced PM, OC, EC, sulfate, and PAHs by 36%, 34%, 83%, 29%, and 11%, respectively [28]. It is estimated that switching marine fuels from residual HFO to distillate fuels would reduce BC emissions by at least 30% at least. It is currently believed that the sampling location and exhaust gas temperature are related to the accuracy of BC test results [112,152].
The use of ultra-low sulfur fuel oils can reduce particulate emissions by 85% and reduce the size to less than 500 nm [22]. However, there is a lack of scientific explanation on how low-sulfur oils affect BC formation. Although many literatures, such as Ref. [28], claim that Marine Diesel Oil (MDO) emits less BC than Heavy Fuel Oil (HFO). However, this conclusion remains controversial. The majority view is that low sulfur content reduces OC and sulfate emissions [153,154,155,156]. However, it is actually a reduction in emissions of BC aerosol compounds. Including aromatic hydrocarbons, metallic elements, ash, water, and cetane number, varies between HFO and MDO. However, it is also likely that sulfur content has no effect on BC emissions from large marine low-speed diesel. Reference [157] it is claimed that fuel switching from HFO to distillate fuel does not reduce BC emissions from large marine engines and should be related to engine type and fuel quality.
Furthermore, differences in test methods may influence the results. According to Wärtsilä by Ristimaki et al. [158], differences in test methods can also influence the results. According to Wärtsilä Ristimaki et al. [158], the two test methods gave completely different results at low loads (10% and 25%). Although optical analysis is commonly used by both EC and FSN as an alternative to BC measurements, the results can indeed be quite different.

5.1.2. Low Carbon and Zero Carbon Fuels

The development of new low carbon and zero carbon fuels makes it possible to achieve lower GHG and BC emissions. Biodiesel, butanol fuel and emulsified fuel are all eco-friendly fuels derived from fossil fuels. They are capable of significantly reducing BC emissions from marine engines throughout their lifetime.
In our previous study [159], we conducted durability and emission tests on a four-stroke inland marine engine running on a B10 biodiesel blend of used cooking oil and diesel. We found a significant reduction in multiple gas emissions and PMs emission, and the engine can operate safely for more than 100 h, making it fully scalable for the application. Next, we will conduct durability and emissions tests of blends of biodiesel and marineHFO in low-speed engines, the results of which will be published for the first time in the near future. In addition, fuels with butanol blends produce lower carbon, EC, and PM emissions [160]. Recently, it was announces that the high-power methanol-fueled four-stroke medium speed marine engine will be built by WinGD Corp in 2024. However, our team is also developing new fuel injectors and a common rail fuel system for low-speed two-stroke, methanol engines. In particular, the double-tube design of the fuel supply system requires the injection of nitrogen into the fuel reservoir for safety reasons.
Among alternative fuels for large ships, the most mature dual-fuel marine engines currently exist, combining liquefied natural gas (LNG) fuel and conventional diesel fuel [161]. LNG dual-fuel ships have very low carbon and BC emissions, with only a small proportion of emissions caused by the pilot diesel [162]. However, due to the increased emissions of methane, hydrocarbons and carbon monoxide (CO), the introduction of an exhaust gas recirculation (EGR) system is recommended [163]. Recently, Wärtsilä has developed a new spark ignition LNG engine system for marine applications [164]. It is expected that the effective dissemination and utilisation of this engine will help to reduce carbon emissions from ships. In addition, hydrogen fuel and pure electric fuel are developing rapidly on short-haul and small vessels. Fuel technologies such as an ammonia fuel. Ammonia is a very promising fuel for large ships. Our team is currently developing an ammonia ignition technology, ammonia flame combustion optimization technology, and an ammonia escape treatment technology.

5.2. Purification Inside Engine

5.2.1. High-Pressure Fuel Injection and Small-Hole Nozzle

The BC emission process is directly related to the combustion process and the type of engine, as well as the injection timing, pressure, quantity, and strategies. In general, a n increase in injection pressure leads to an increase in spray penetration. This improves, atomization and air flow processes. The results of a soot zone in a flame were reported by Ref. [165] under 30~110 MPa. It was deduced that soot formation is reduced at higher pressure. Although the liquid penetration in the vaporisation spray flame was almost not affected by the injection pressure, the pressure was useful to promote the vaporisation process and reduce the combustion time due to the improved atomization and air flow process. İçıngür et al. [166] found that an increase in injection pressure led to a reduction in smoke levels in a real high-speed four-stroke engine. However, at an the injection pressure of 10 MPa, a very high smoke value was observed This is due to poor premixing during combustion, as fuel droplets drip into the combustion chamber. The opposite was the case when the injection pressure was increased to 25 MPa. Wang et al. [167] conducted an experiment on the effects of ultra-high injection pressure on soot formation. The results showed that at an ultra-high injection pressure (300 MPa) for a normal nozzle hole (0.16 mm), soot formation was significantly reduced. When the nozzle hole size is reduced to half its normal size (0.08 mm micro-hole nozzle), at 100 MPa, lesser amount of soot was noticed. However, it is almost impossible to notice the optical shoot at 200 MPa to 300 MPa. It is evident that increasing the ultra-high injection pressure and modifying the normal injection nozzle to a micro-hole nozzle design will significantly reduce BC formation.
Although high injection pressure facilitates the reduction of BC emissions, Çelıkten et al. [168] indicated that this result is related to the engine type. A study conducted on an engine without direct injection found that engine performance was excellent at an injection pressure of 15 MPa. Above this injection pressure, engine performance gradually deteriorated. It was concluded that more fuel was burned in the engine’s pre-combustion chamber at this injection pressure.Consequently, BC emissions increased, and engine performance decreased. While the number and concentration of particles decreases at higher injection pressure, the number of particles increases in nuclear mode. It is therefore recommended to choose the best injection pressure for actual engines based on the experimental test results.

5.2.2. Optimizing Injection Timing

The injection timing also plays an important rolein the engine combustion process and BC generation. Due to the changes in air temperature and air pressure, it is obvious that the ignition delay time is affected by the injection timing when the piston is close to Top Dead Center(TDC). If the injection timing is advanced, the initial temperature and the initial pressure of the combustible mixture decreased, which increases the ignition delay time On the contrary, if the injection timing is delayed, the initial temperature and initial pressure of the mixture are increased in order to shorten the ignition delay time. In any case, advancing or delaying the injection timing beyond the normal range worses the combustion process and consequently increases BC emissions. Therefore, only optimum injection timing can improve engine performance and reduce BC emissions.

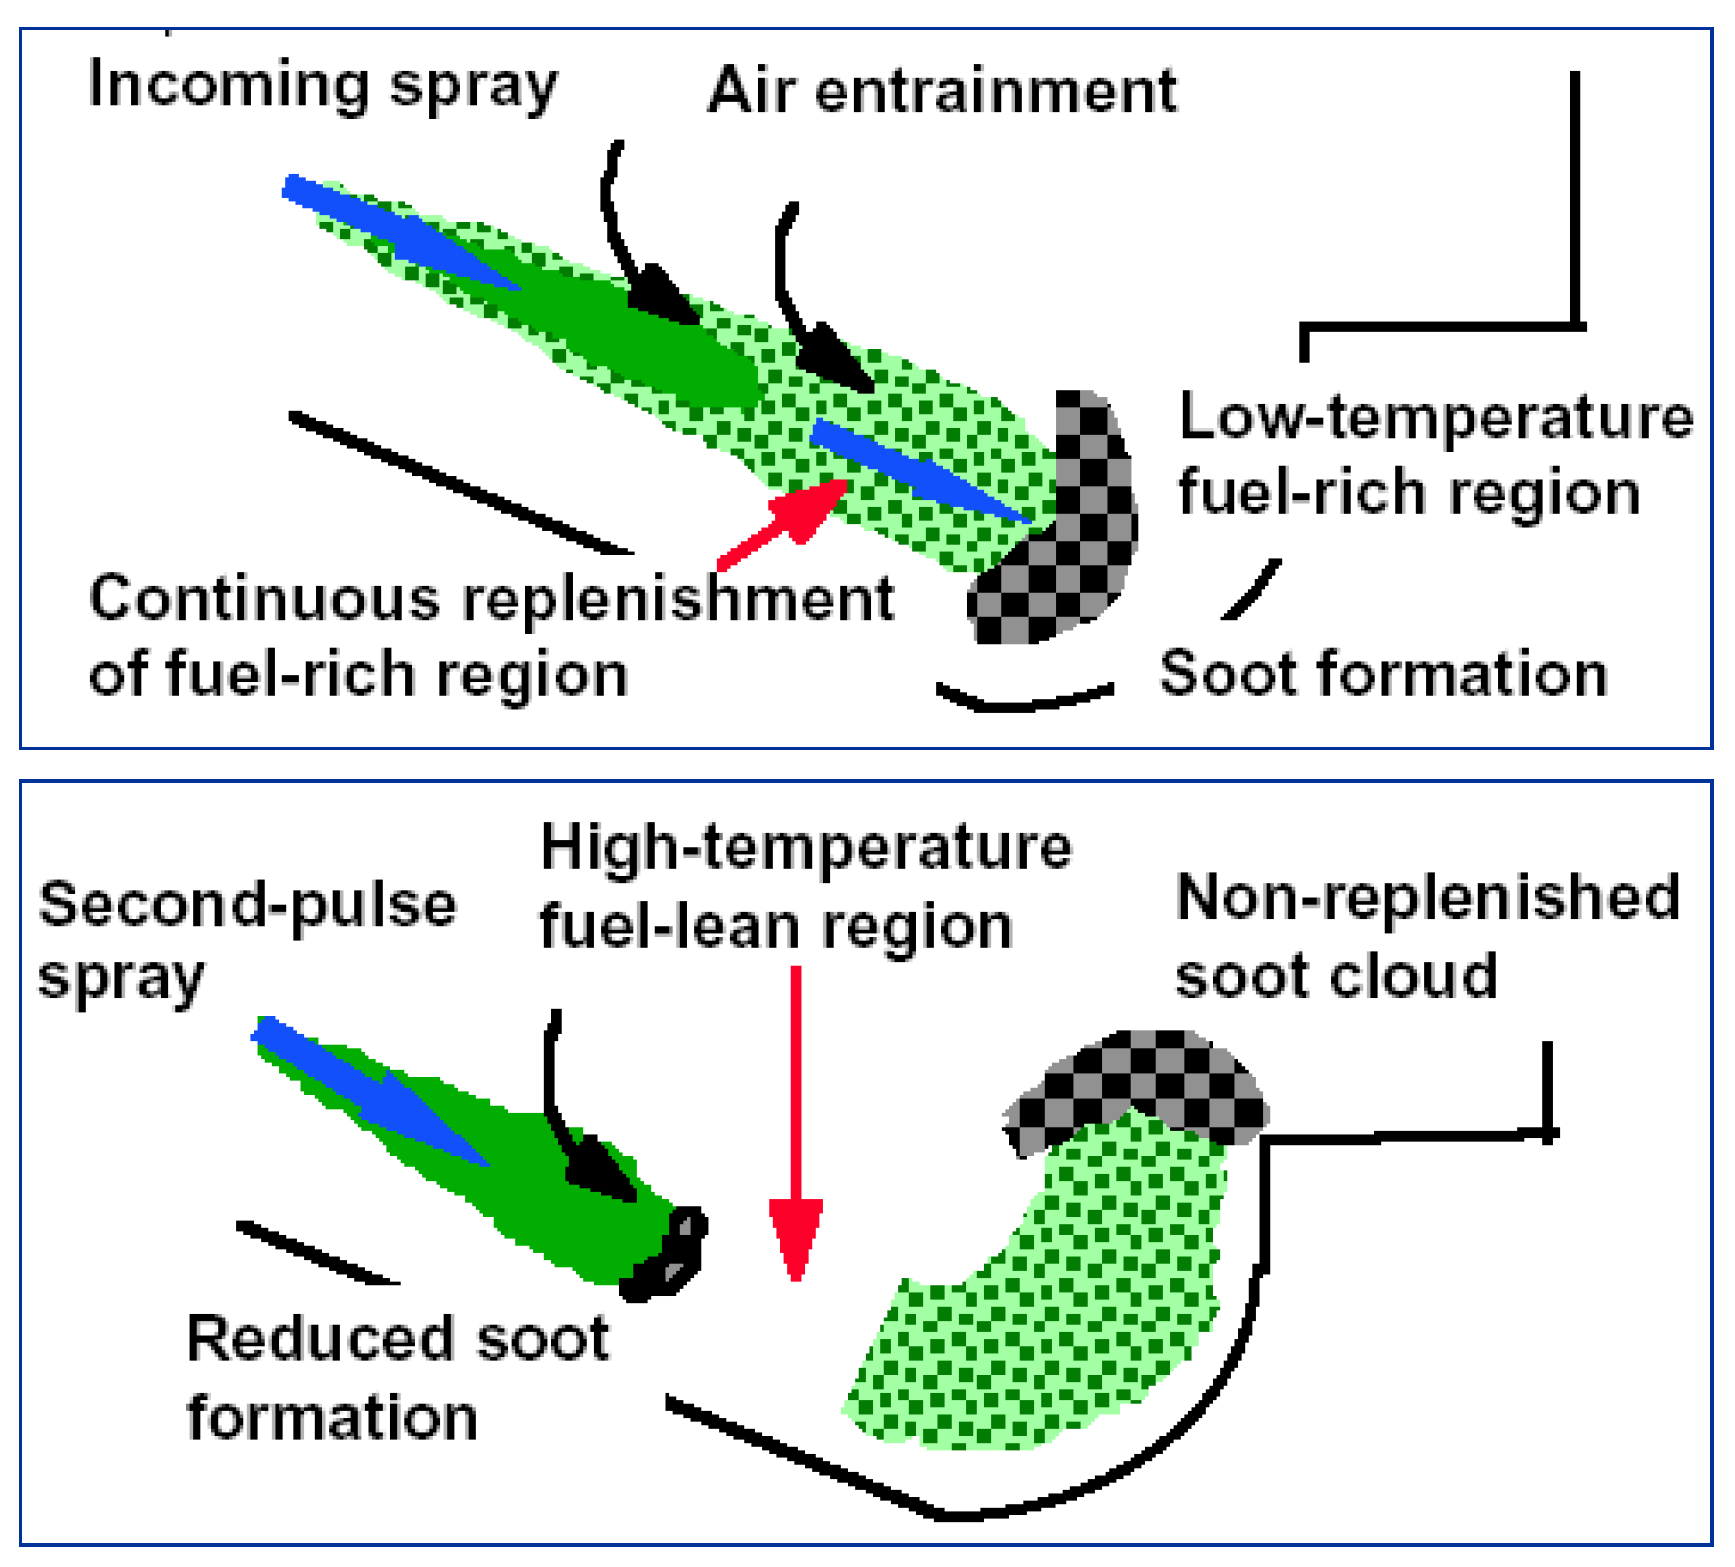
5.2.3. Injection Strategy

The design of the injection rate shaping is crucial for improving the combustion process and reducing BC emissions. The latest nozzle designs, actuators, and Electronic Control Modules (ECMs), make it simple to regulate the changes of fuel injection rate in each cycle to obtain the best injection rate shaping. Merker et al. [169] suggested that the injection rate should be small during the ignition delay period. With the engine load increased, injection rate and volume should increase correspondingly. To mitigate the specific engine emission, the injection strategy requires to be re-optimized and redesigned, with specific consideration on the injector parameters such as injection pressure, diameter of injection ports, number of injection hole, etc. Huang et al. [170] determined that when the injection rate was gradually increased, BC emission and the fuel mass at the initial injection stage was reduced. Similarly, Desantes et al. [171] supported this view and found that the application of longer boot-length of injection rate shaping will leads to higher fuel consumption and BC emissions, the boot-length are shown in Figure 12.
As already mentioned, modern diesel engines are extremely flexible and precise in the control of injection pressure, rate, and time. This has contributed to the development of the high-pressure fuel shared rail injection system. However, the use of high-pressure multiple injection or split injection technology can further reduce BC emissions. Optimizing the injection timing and duration can reduce BC and NOx emissions, respectively.
Split injection strategies can be divided into initial, main, and final injection. The first injection can be shortened to delay the main injection by injecting a small amount of fuel into the combustion chamber, to produce a premixed combustible gas. The reduced pressure, increased injection rate, and localized temperature help to reduce combustion noise and NOx emissions. According to Shundoh et al. [172], it was found that combination of pre-injection and high-pressure injection in a high-speed engine leads to a significant reduction in NOx and smoke emissions by 35% and 60–80%, respectively. The main injection is split several times to improve the mixture formation process [173] and prevent the formation of BC. As shown in Figure 13, splitting the main injection or post injection can prevent the accumulation of excessively rich fuel and promote the accelerated oxidation of the high-concentration BC particles in the spray head. This reduces the BC emissions. It should be noted that when BC particles are formed, combustion and oxidation cleaning in the cylinder requires a sufficiently high temperature and time to reduce the formation of NOx [174].
Although the correct injection strategy can improve engine performance and reduce BC emissions, an incorrect injection strategy setting will produce a non-optimal emission. Therefore, it is crucial that the injection strategy is set correctly to achieve optimal results.
It is recommended that some important factors such as dwell time and injection mass ratio are checked in advance and optimized accordingly Reducing the dwell time even slightly will help to reduce BC emissions Choosing the appropriate fuel mass rate injection ratio is also important for the influence and development of the spray boundaries, air–fuel mixture, and the subsequently heat released.
As mentioned above, injection characteristics have a major influence on the engine’ BC generation. It is recommended to apply appropriate injection strategies to improve engine performance and reduce BC emission reduction. Currently, there are numerous high-speed diesel engines that use these injection strategies as well as some low-speed diesel engines. For example, emission control, economic control and emergency control technology were applied to the latest two stroke low-speed marine engines.

5.3. Other

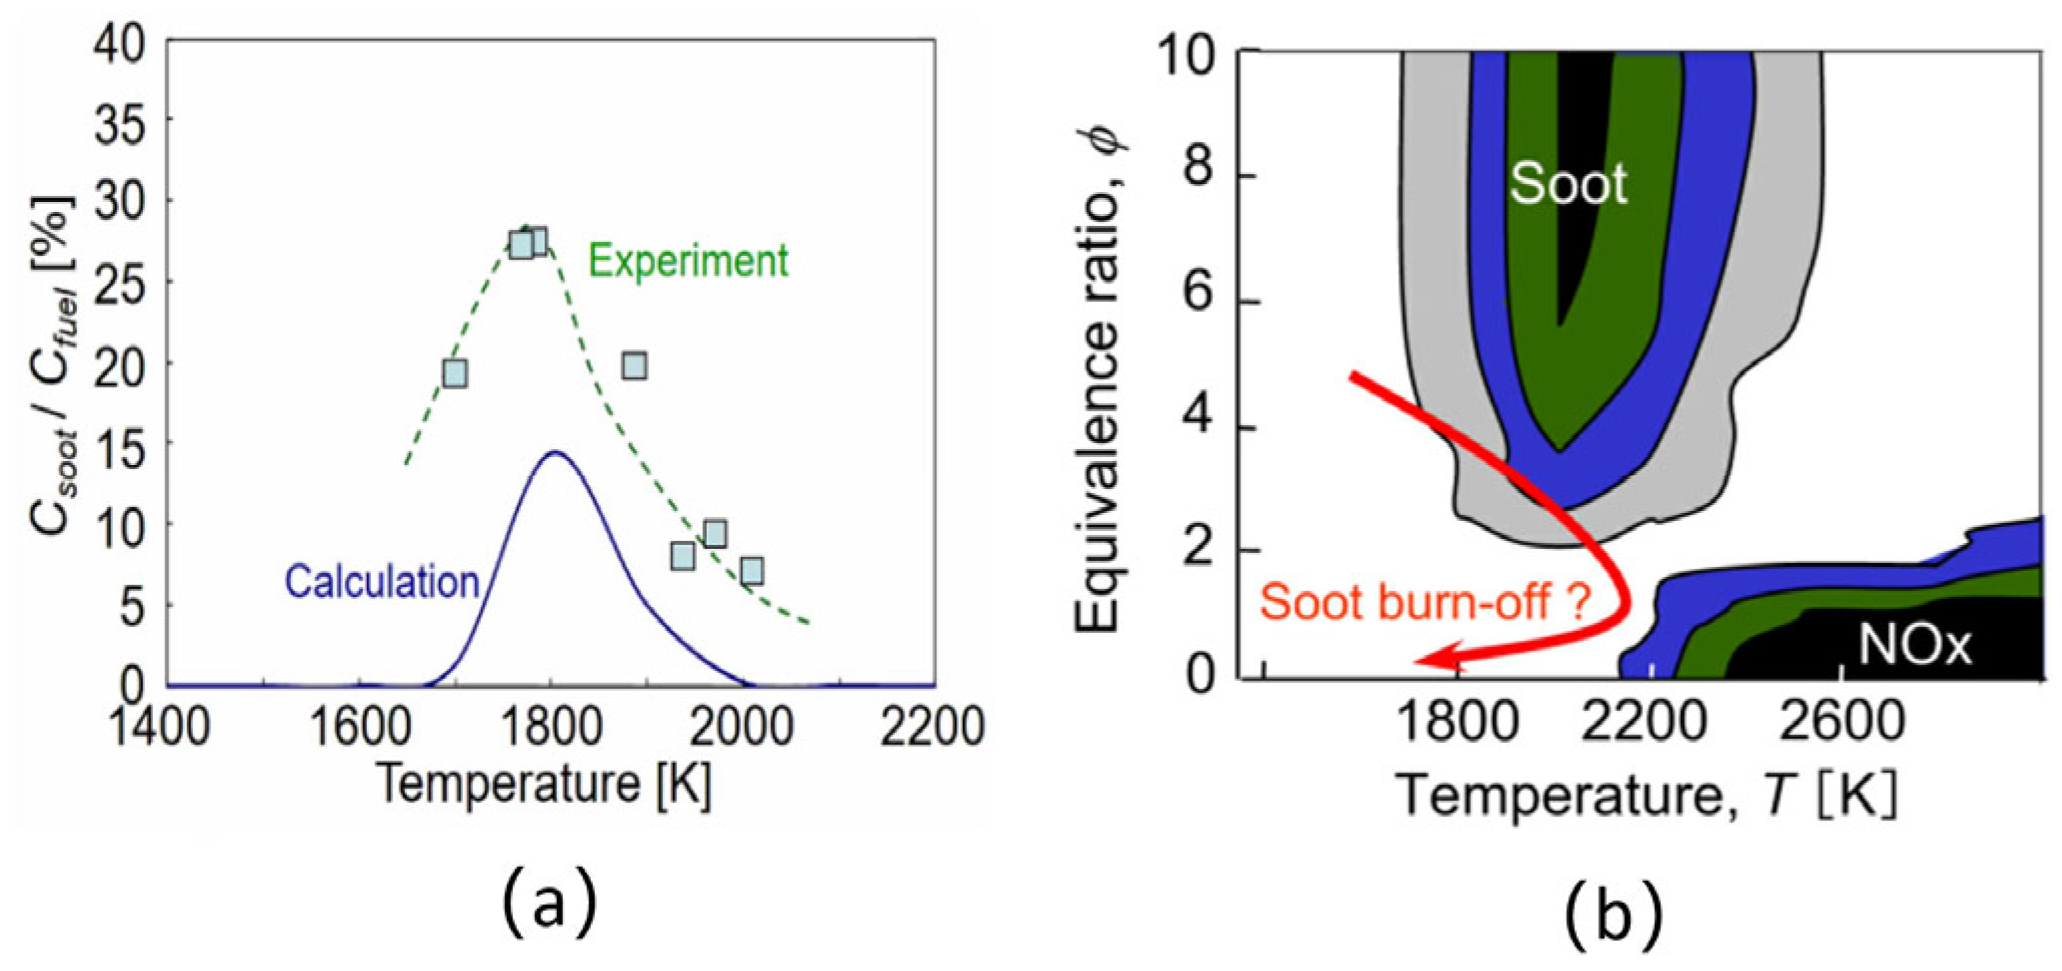
5.3.1. Ambient Temperature

It is assumed that environment factors have a major influence on the formation and oxidation of particles. The ambient temperature can change the reaction rate during both the formation and oxidation of particles. As the formation and oxidation of the particles take place simultaneously, the temperature increases. However, the oxidation rate is usually faster than the incipient particle rate of formation. In addition, temperature also leads to changes in depletion. At high temperatures, the soot formation and exhaustion rates are considered to increase accordingly [175]. Consequently, after taking into account the formation and exhaustion rate, which is influenced by the flame temperature, the nature of the final emitted particles depends on the combination of these influences. According to Glassman et al. [176], the formation of incipient particles can be used to determine the soot yield and can be controlled by the temperature. The soot inception occurs approximately at a temperature of 1400 K and is associated with the H atoms diffusion process. However, the exhaustion stops at 1300 K. Sato et al. [177] found a similar result and pointed out that a large amount of soot occurred at lower temperatures and maximum concentration of the particles occurred at about 1200~1400 K in a jet stimulated combustion chamber. As the temperature increases, the size of the particles and the growth rate of their specific surface area increases, while the number of nucleation particles decreases. The fragmentation of the agglomerates could possibly make a further contribute to explaining the influence of temperature on the particles, since at higher temperatures, only a small number of particles were produced during the exhaustion process.
According to the oxidation-induced fragmentation mechanism, the formation process of the few particles cannot be completely oxidized at reduced temperature [98]. However, when the temperature is increased, the small particles are effectively oxidized, and the concentration of emitted particles decreases. Thus, from the above results, increasing the temperature after the maximum soot yield peak is certainly an effective way to reduce BC emissions. As can be seen in Figure 14a, the calculated and actual soot peaks have similar temperatures. [174]. In a general diesel engine, however, it is not possible to increase the temperature indefinitely, as the trade-off between soot and NOx must be taken into account. As shown in Figure 14b, the black color has the highest emission concentration, followed by green, blue and gray [175].

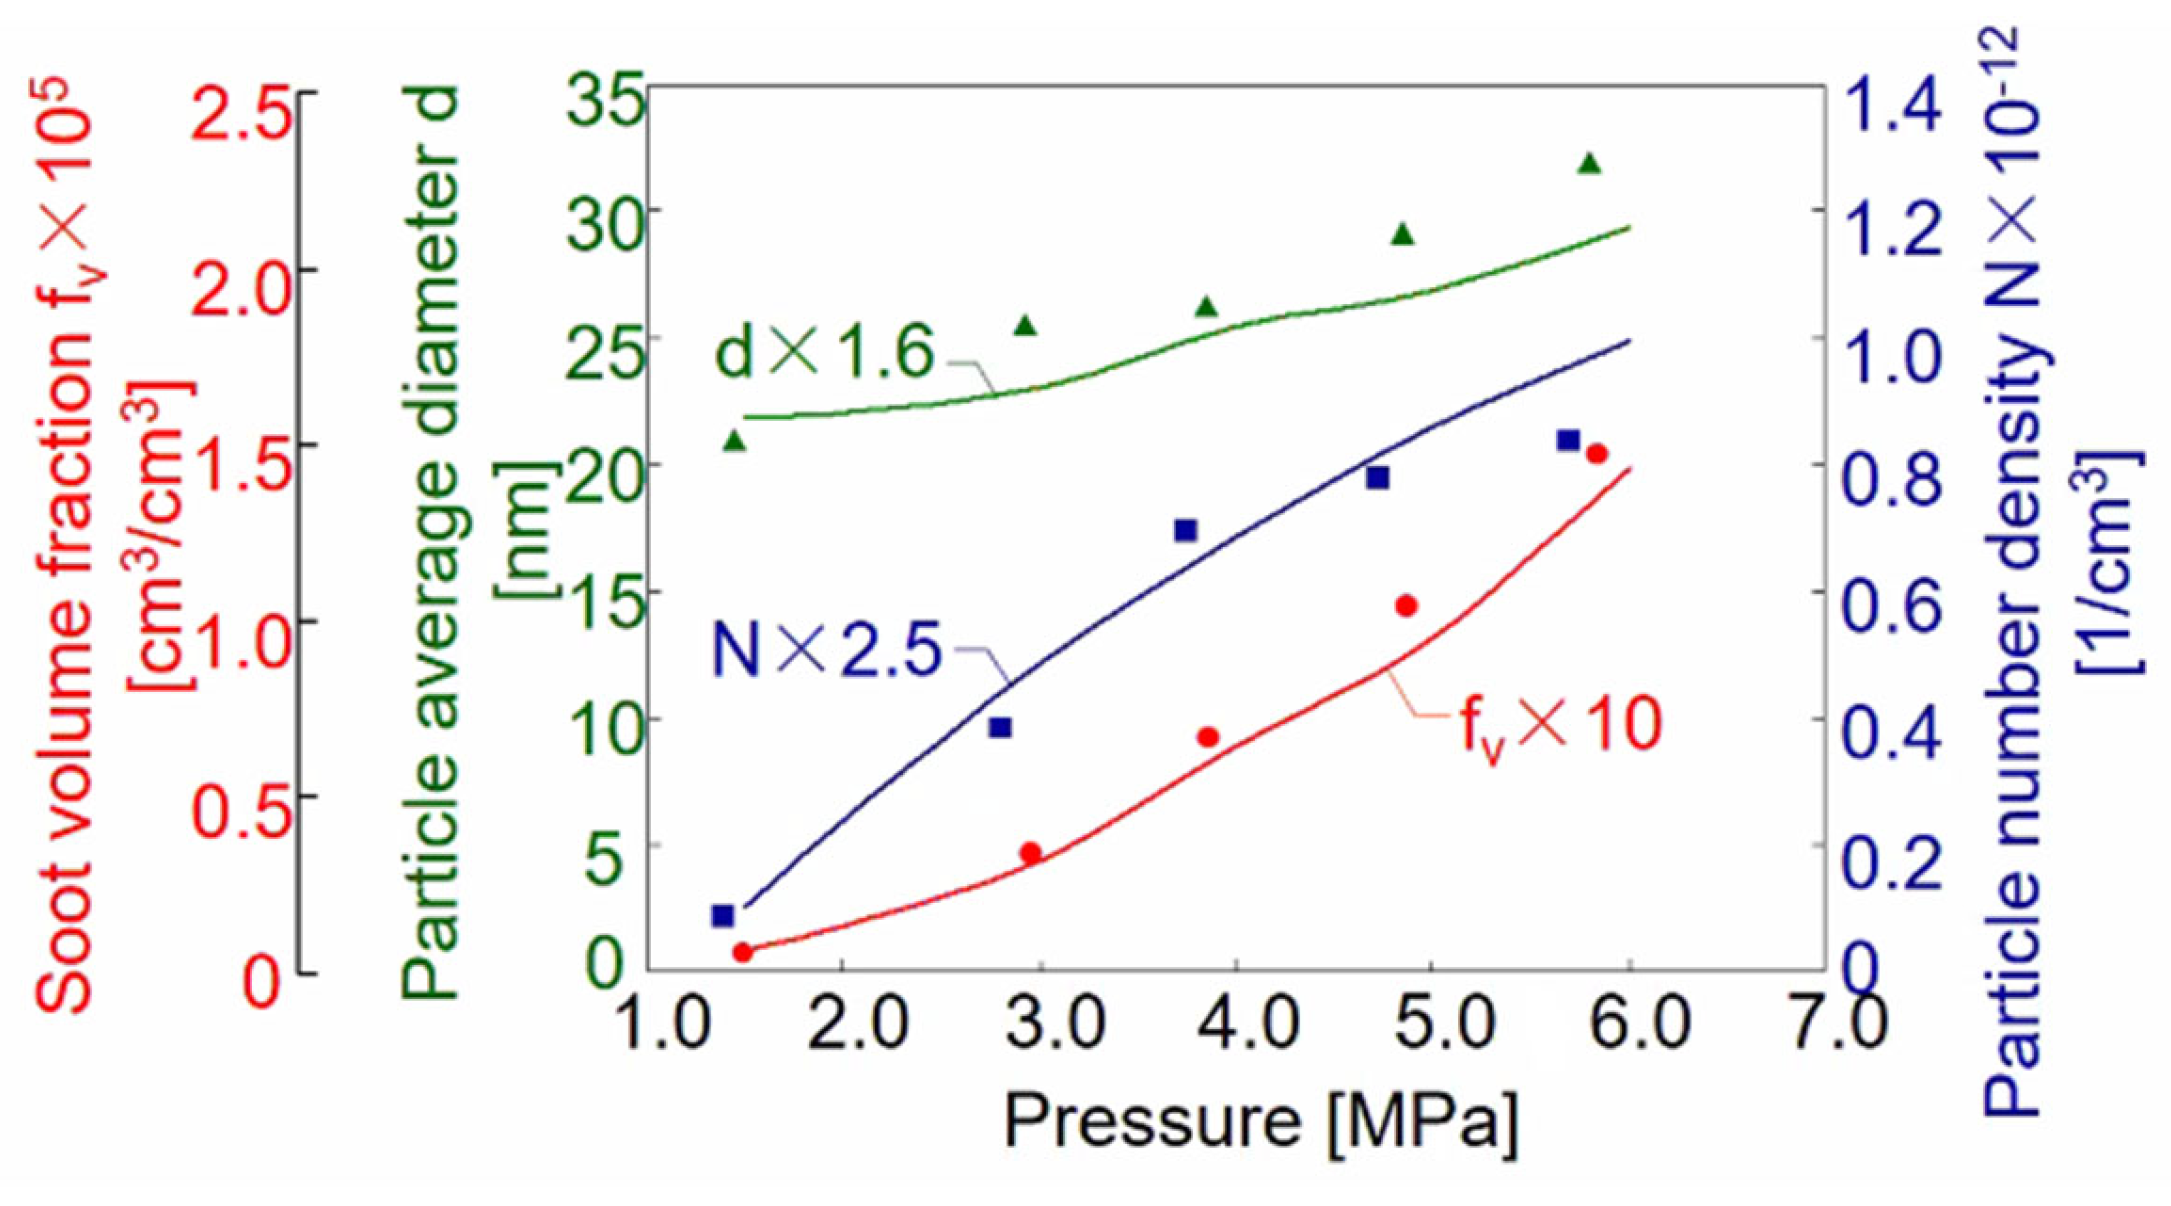
5.3.2. Ambient Pressure

Ambient pressure is another environmental factor that affects soot formation. Environmental pressure variations generally change the flame structure, which is reflected in temperature changes, flow resistance and flame propagation rate. Several studies [174,178,179] have shown that the soot quantity increases with increasing pressure, and that the larger particles are found at higher ambient pressure condition. As can be seen in Figure 15, the particle average diameter (green triangle), the particle number density (blue square) and the soot volume fraction (red circle) increase with increasing pressure.
An experiment was performed based on the light scattering approach in a premixed flame [178]. The result showed that the soot quantity increases with an increase in ambient pressure. It was found that the final formation of the soot volume fraction with pressure depends on the pressure p2. This was carried out at a constant flame temperature of over 1650 K and C/O ratio of up to 0.75.
Similar results were also obtained in other studies at pressures between 0.1 and 1.0 MPa. In this range, the pressure dependence is p1.2–p1.4 [179,180]. These studies of the pressure factor have shown that the pressure sensitivity to the soot volume fraction in a premixed or laminar flame is more than first order. However, in real diesel engines, the control pathway of soot based on the ambient pressure is not yet fully understood. The presence of turbulence and higher pressure contribute to a strong combustion intensity in the cylinder. It must also be taken into account that the fuel composition in a real engine is complicated and does not consist of a single component. Therefore, the studies conducted in this area are insufficient and need further research.

5.3.3. Stoichiometry

Previous studies on combustion theory [111,181] have proven that there is a clear relationship between soot formation and oxygen concentration in the combustion process. The oxygen concentration is normally determined by the air/fuel ratio, i.e., the stoichiometry. Nishida et al. [175] reported that the generated soot in a propane fuel flame is concentrated in the local fuel-rich region where many unburned hydrocarbons including CH4, C2H4, C2H6 and C2H2 are produced indicating the fuel pyrolysis process. This study also found that soot burnout occurs under stoichiometric or lean-burn conditions. It is clear that the soot ultimately produced is also affected by the flame temperature, considering the combined effect of formation and burnout. The results of this study are significant as they suggest ways to control smoke generation in internal combustion engines.
As the generation of particles from the diesel burnout flame normally occurs in areas of high fuel concentration, also referred to as the downstream region of maximum liquid phase penetration in a diesel spray flame. Before the lift-off length, a non-soot combustion containing the characteristics of a lean fuel-air mixture, can be achieved with the help of a fast air flow process. The key to controlling diesel particles generation therefore lies in improving the air flow within the lift-off length and increasing the air–fuel stoichiometry to reduce the concentration of fuel in the fuel-rich zones. Inaba et al. [181] reports the amount of BC (KL) generated in the spray flame with an excess air coefficient (1/ϕH) through a series of experiments is shown in Figure 16. Here, 1/ϕH is defined as the ratio of the air flow within the lift-off length to the theoretical amount of air required for combustion with the amount of fuel injected. The results show that the amount of BC produced decreases significantly with increasing 1/ϕH, and smokeless combustion occurs when 1/ϕH is greater than 0.6.
In this state, the fuel was relatively lean, which prevented the formation of high-temperature diffusion flames in an approximate stoichiometry. In general, there are some immediate reliable conclusions to improve the air entrainments within the lift-off length and increase the stoichiometry to reduce soot. In real diesel engines, increasing the injection pressure and decreasing the ambient temperature or oxygen concentration can increase the air entrainment within the lift-off length.

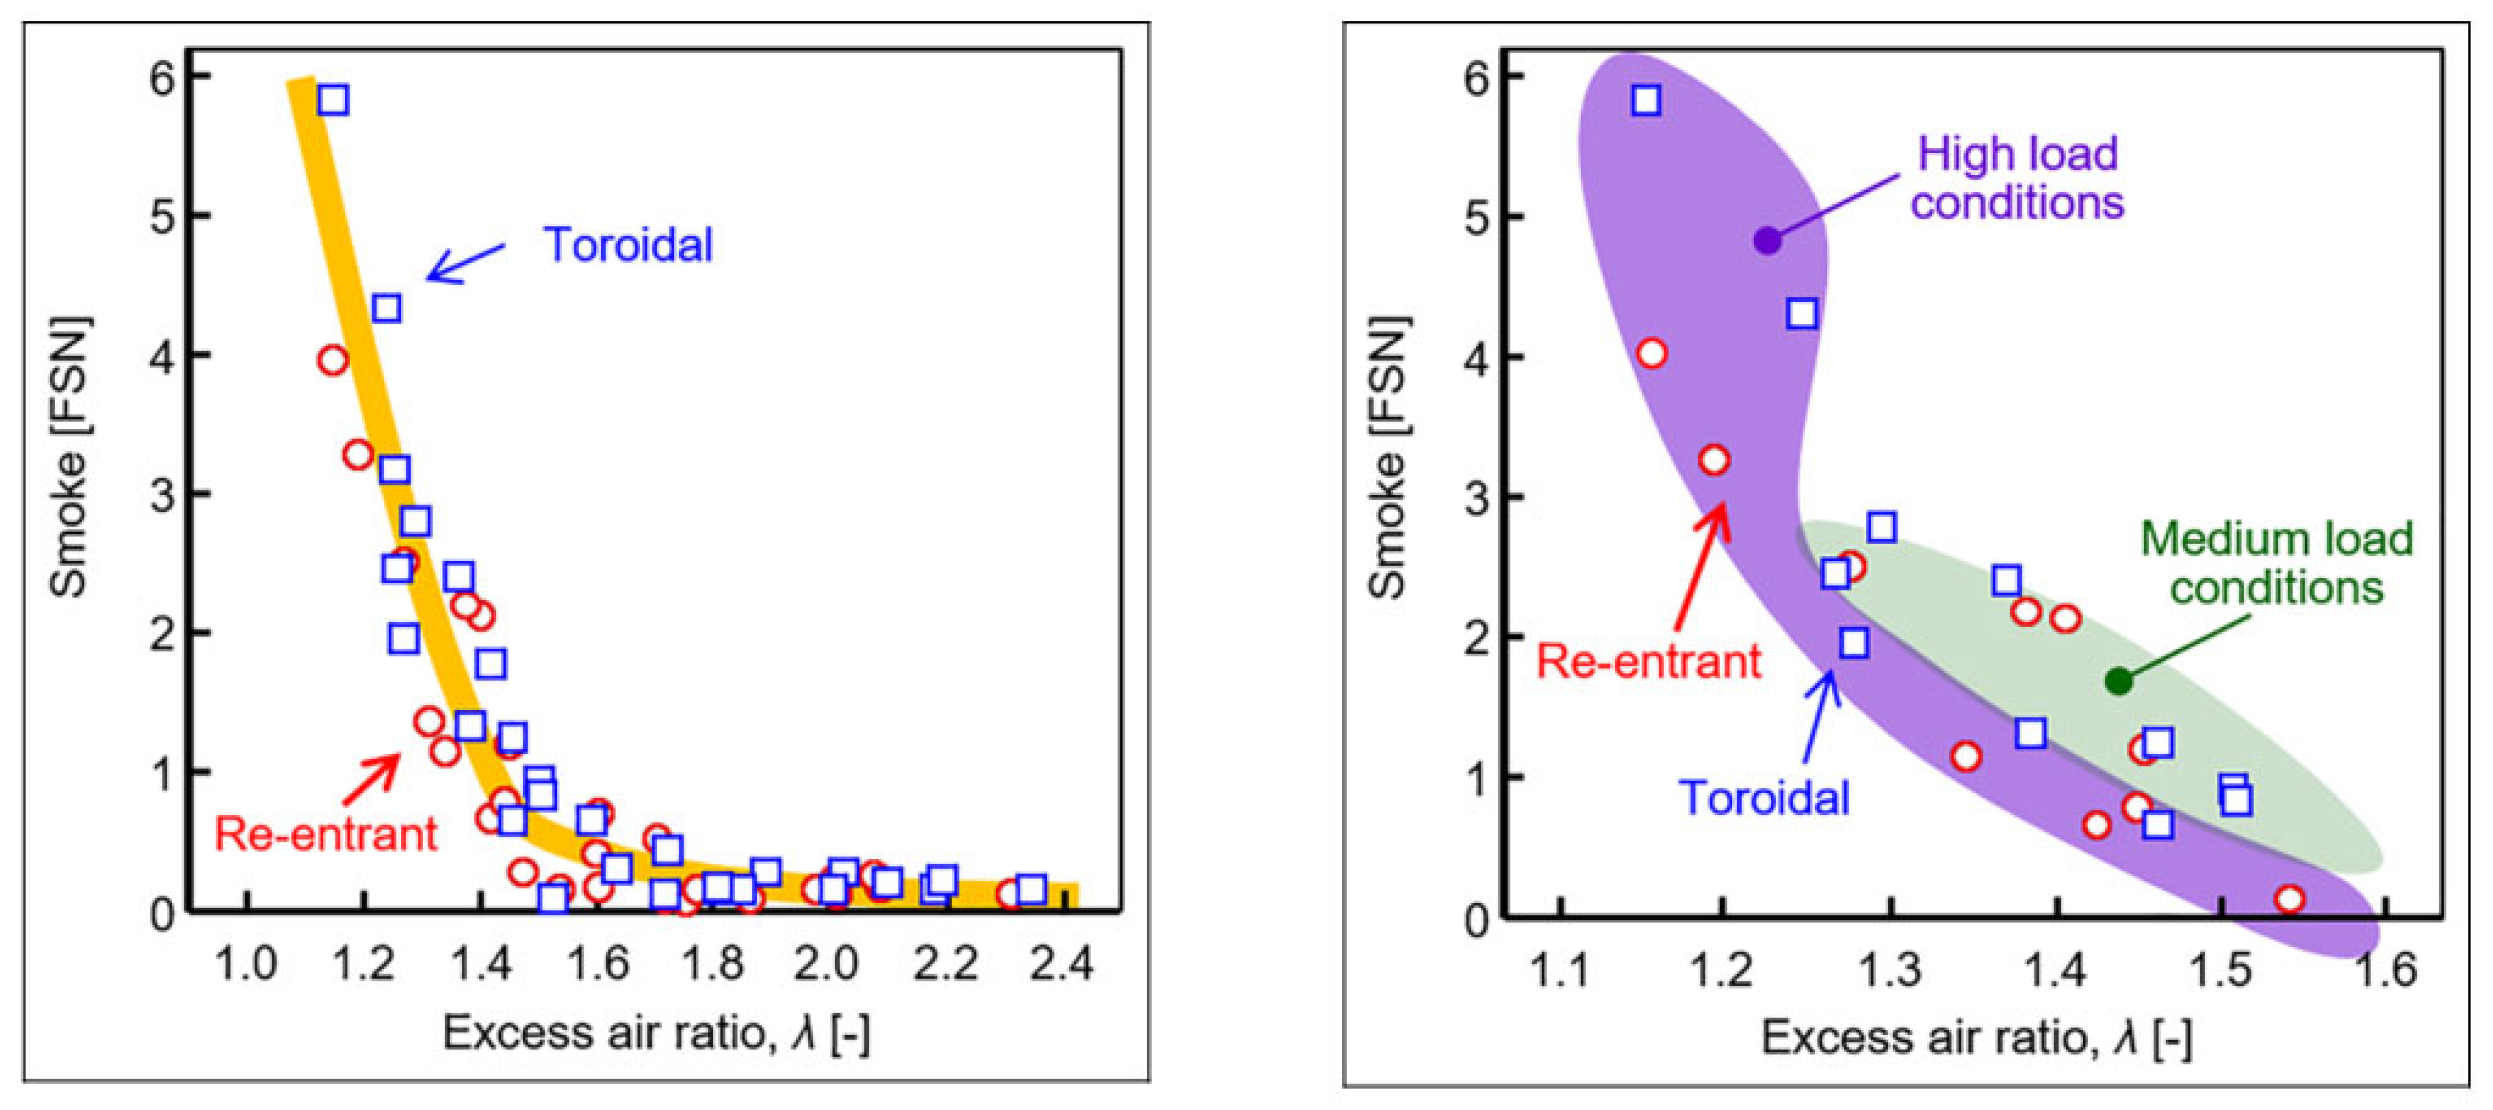
5.3.4. Combustion Chamber: Structure and Geometry

The structure and geometry of the combustion chamber is also a key aspect in terms of BC generation and the influence on vortex and fuel spray impinging. Since the jet airflow is controlled by the injection rate and spray pattern, the combustion chamber shape and geometry, the airflow is not extremely affected.
The tendency of the new optimized design of the combustion chamber shape is to allow the generation of swirls to increase turbulence and mixing, which can accelerate combustion, and especially improve, the spray during the end of the fuel injection process and reduce BC. Appropriate high temperatures during the expansion phase are conducive to inducing soot combustion. However, if the vortex is too high, spray bending and impingement are not conducive to soot burnout [173]. Delayed mixing of oil-rich and air entrainment near the initial spray boundary increases carbon soot emission if not sufficiently utilized [182]. When the combustion and oxidation process slows down, the particle generation increases accordingly.
A large marine diesel engine with an appropriate combustion chamber offers more opportunities to improve fuel injection, because a large combustion chamber prevents the fuel spray from impinging on the cylinder wall. Although there are relatively few studies for large combustion chamber optimization, studies of flow and combustion in large combustion chambers are essential for well-designed engines. In addition, a large combustion chamber usually indicates a larger surface area and more dissolution of cylinder lubricant oil, which can lead to increased particle formation. Therefore, it is also very important to improve the lubrication system designs and conditions to achieve cleaner combustion.

5.4. The Processing outside Engine

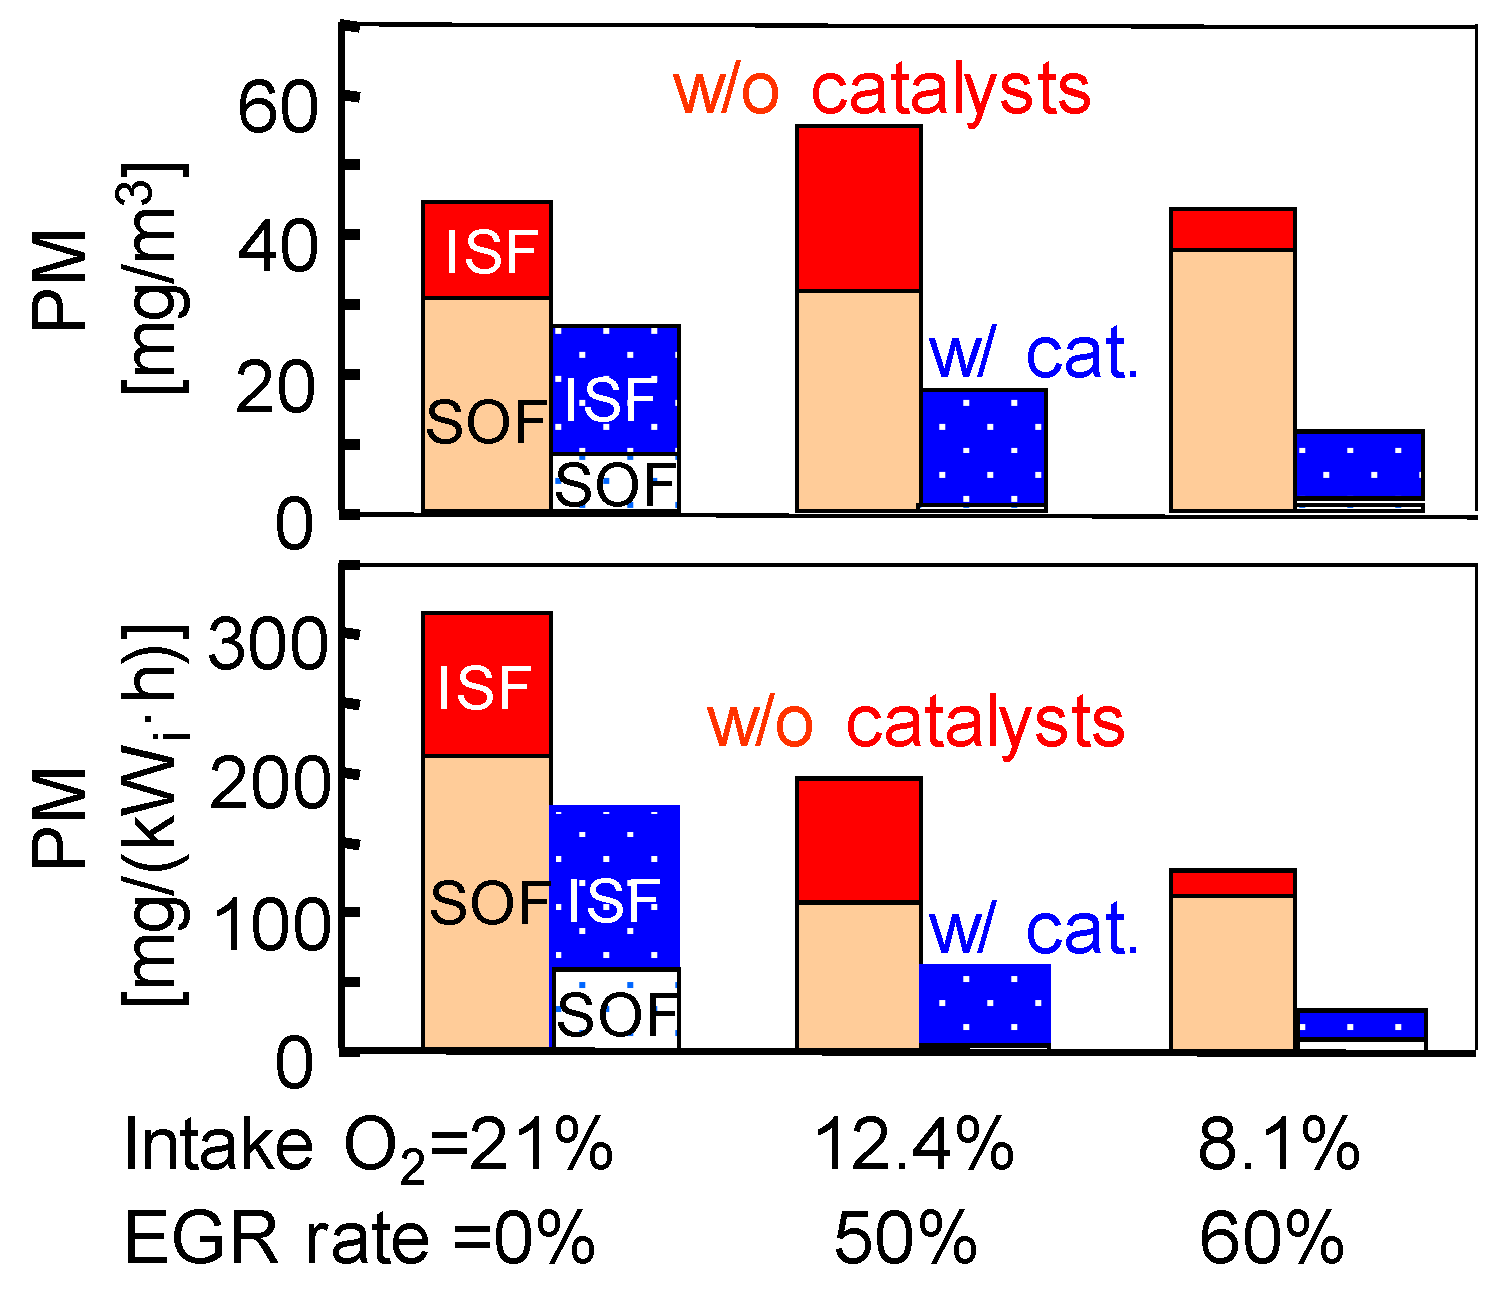
5.4.1. Exhaust Gas Re-Circulation (EGR)

The EGR system is used extensively in high-speed engines and can undoubtedly reduce NOx emissions effectively. However, increasing the EGR rate can increase the emission of diesel particles. Even a reasonable EGR rate can change the oxygen concentration and ambient temperature in the cylinder, affecting the conditions for soot formation and activity activity. In recent years, some research [174,175] has decided to increase the engine EGR rate to approach the theoretical excess air coefficient in order to achieve the ultra-low NOx and smokeless low-temperature diesel combustion path. This low soot performance is due to the low combustion temperature, of below 2000 K. The fuel-rich range inhibited the soot inception.This offers the possibility to the reduce engine BC particles and NOx emission simultaneously.
Furthermore, the effect of EGR on soot formation is only slightly influenced by fuel changes. It depends primarily on the soot formation tendency of the fuel itself [177]. In general, improved cooling of the EGR system is essential to achieve optimum operating conditions and effectively reduce soot formation. However, soot formation increases when the ambient temperature exceeds certain operating conditions. This occurs rapidly under high EGR rates and operating conditions and must be considered when in the design of the engine.
Ref. [182] it is found that the insoluble fraction (ISF) varies with the EGR rate of an engine as shown in Figure 17. As already defined in Section 2.5, the ISF factor is assumed to be the BC component. At an EGR rate of 60%,it drops to a low level. However, in combination with an oxidation catalyst, the ISF factor can be purified to a minimum.It can therefore be concluded that a suitable EGR is certainly suitable for reducing BC emissions. Currently, however, smokeless and low-temperature EGR combustion technologies are limited and are only used in certain engine types and at partial loads. At the same time, the feasibility and effect also need to be further verified for actual marine engines which are usually equipped with larger nozzles and more complex multiple spray patterns. How to improve the application range for higher loads is a major challenge.
In summary, some techniques based on in-engine combustion process optimization have been used to varying degrees to control soot emissions from diesel fuel in high-speed diesel engines. The results show that combustion process optimization has the potential to reduce emissions in internal combustion engines. However, for high-power marine diesel engines, only few studies have been reported on the above-mentioned BC emission control technique, especially for low-speed two-stroke engines burning heavy fuel. With the recognition of high-pressure common rail technology in modern marine low-speed diesel engines, it has been suggested that further studies on low-speed engine using HFO fuel should be conducted without delay.

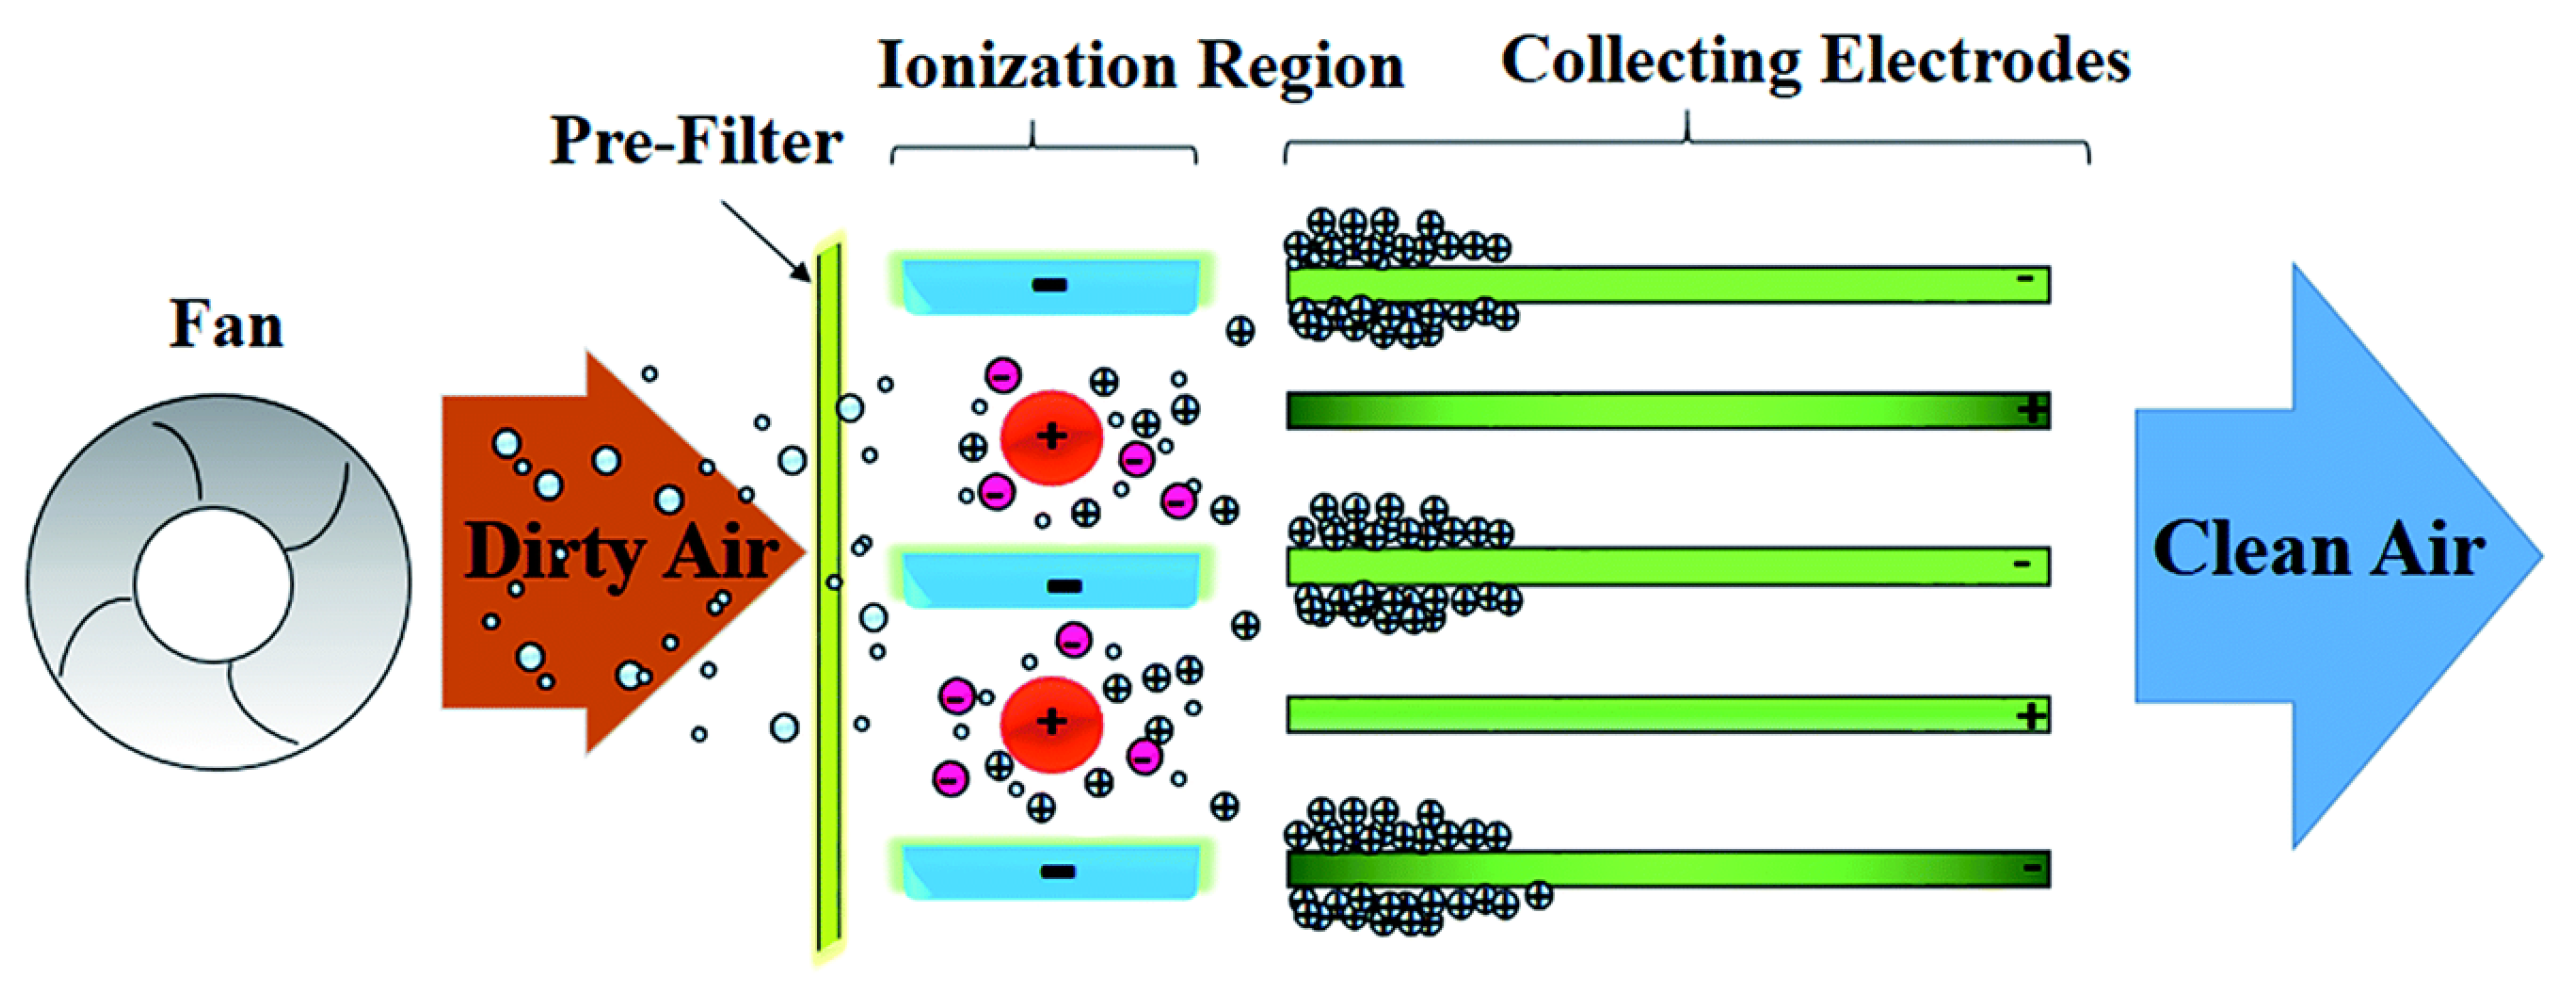
5.4.2. Particle Treatment System

The removal and cleaning of carbonaceous particles from exhaust gas is related to the size of the particles.There are two important size ranges to consider: (1) Coarse particles (with a diameter of more than 2 μm),which usually consist of volatile organic compounds, metal particles, ash particles, sulfate particles, etc.; (2) aggregated particles (with diameter of 0.1 μm~2 μm), which consist of fine ash, sulfate particles and ultrafine nano-carbonaceous particles (with a diameter of less than 200 nm).
For coarse particles, a relatively large size (with a diameterof more than 2 μm) means that sufficient inertia is required to flow in the exhaust gas. Therefore, these particles can be captured by a wet scrubber or cyclone. This mechanism is related to the liquid movement by gas streamlines in the boundary layer of the surface. Based on the conversion of the current Exhaust Gas Cleaning System of ships, coarse particles can be partially captured by a Selective Catalytic Reactor (SCR) and a wet or dry scrubber, although these were originally designed for the absorption of NOx and SO2 and not carbonaceous particles.
However, for aggregated particles, the inertial effect is negligible as their size is below the threshold (diameter of 2 μm) [22]. Under these conditions, the particles are trapped by Brownian diffusion phenomena, the transfer effect, or the application of electromagnetic forces, although these are not efficient enough. Typical equipment such as an Electrostatic Precipitator (ESP) and Fabric Filter (FF) have been used in various land industries to specifically reduce PM 2.5, even if they are larger in size. In a new study, a collecting electrode for the removal of fine particles was produced by preparing conductive polyaniline (PANI) on a polypropylene (PP) plate, as shown in Figure 18 [183].
Some other novel technologies are designed to provide good particle separation and offer additional options. These typically include wet electric scrubbers, heterogeneous condensation scrubbers, and bubble towers. The mutual limitation of these technologies is the need for a suitable rinse water treatment system. This is because it increases the pressure of the ship’s wastewater.

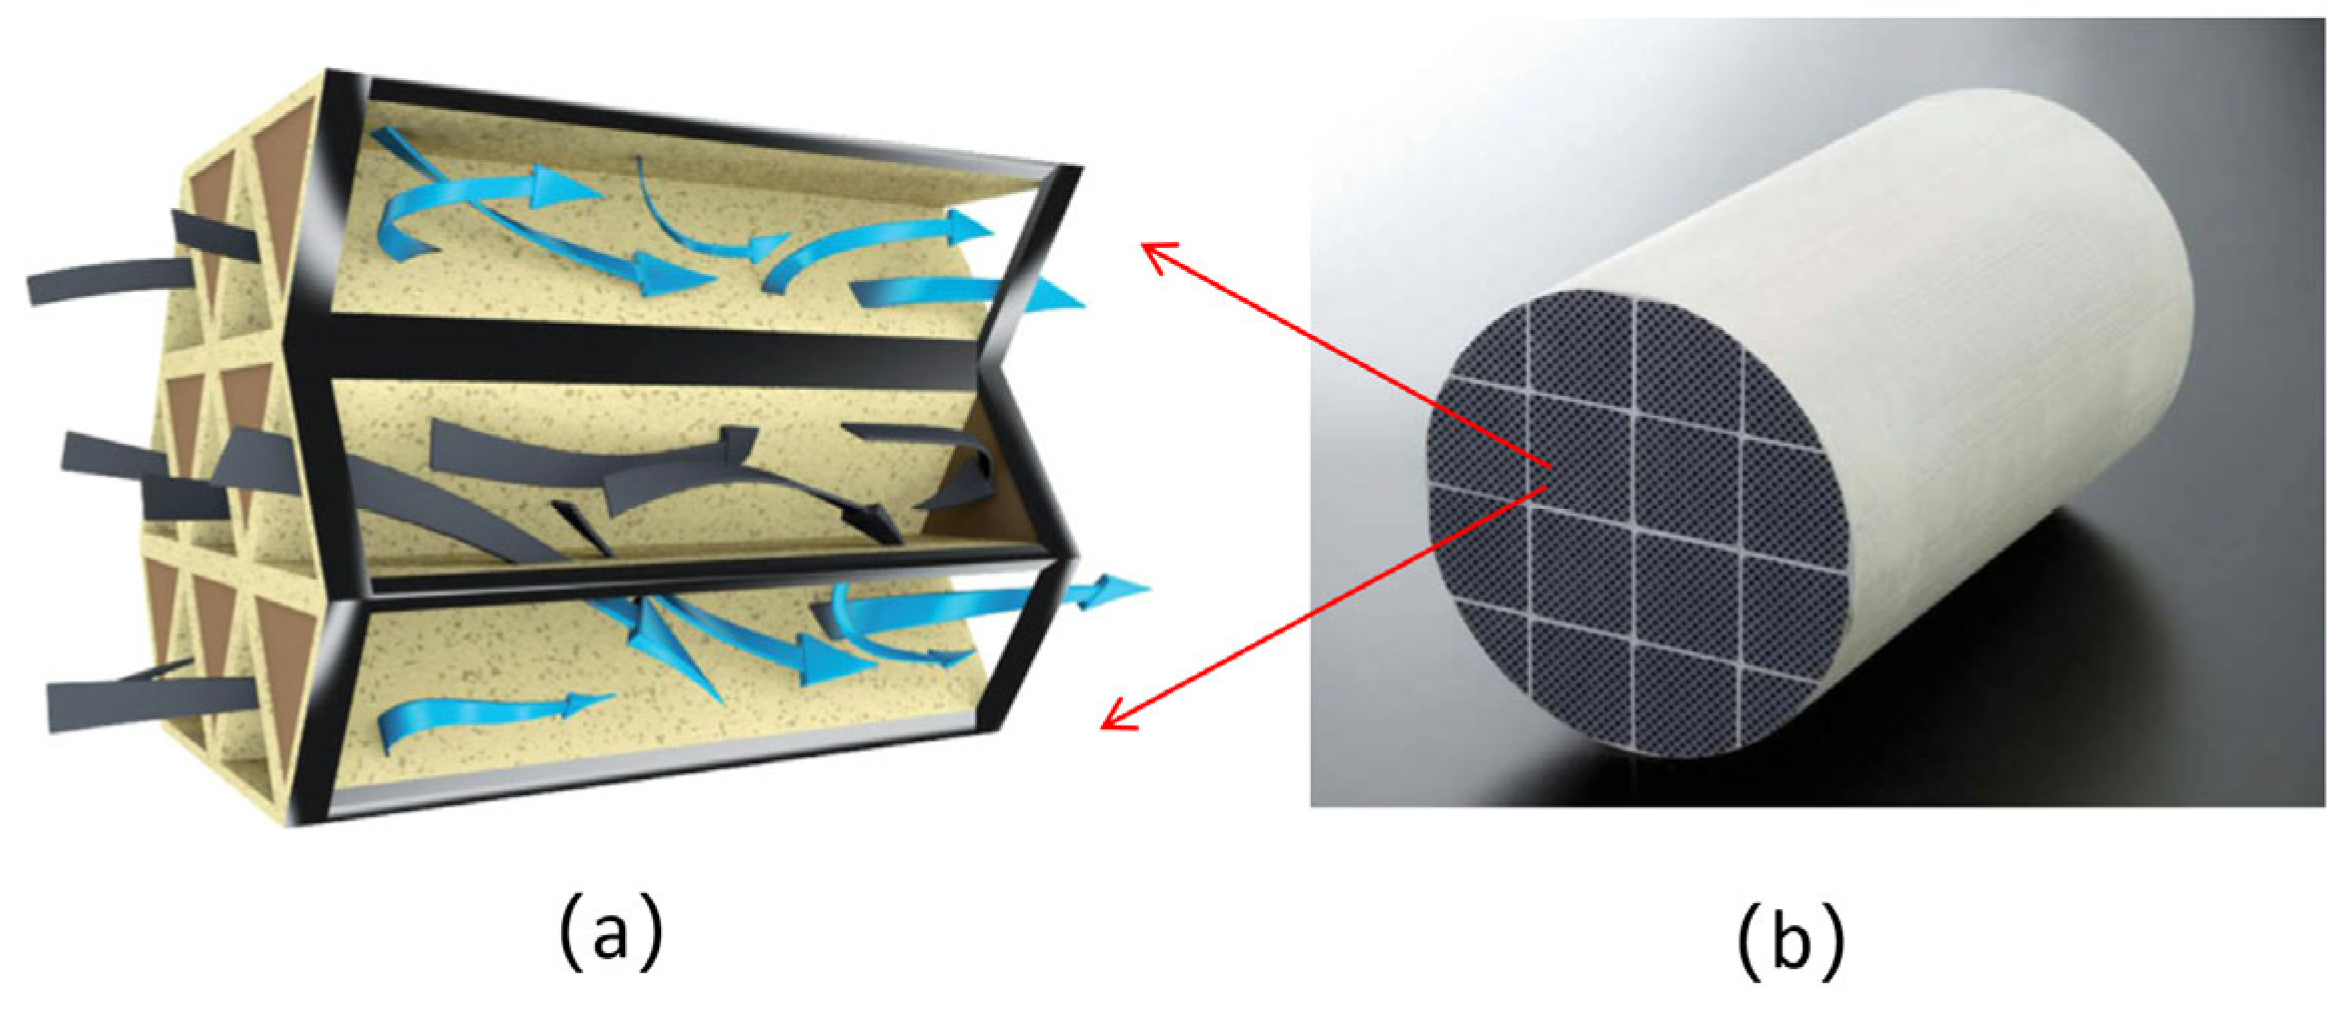
5.4.3. Diesel Particulate Filters (DPFs) and Diesel Oxidation Catalysts (DOCs)

DPFs and DOCs are important post-processing equipment installed to eliminate particles from automotive engines. As important equipment for the purification of exhaust gas from engines, the expected purification rate of PMs can be up to 90% [22]. DPF is a wall flow filter, usually made of honeycomb ceramic, as shown in Figure 19. The main components include cordierite, silicon carbide, and other porous media materials. When the exhaust gas passes through the DPF, the pores trap some of the PMs in the exhaust gas, thus reducing emissions accordingly.
The particle separation efficiency of the DPF depends on the mesh density of the filter body. If the diameter of the PMs in the exhaust is smaller than the pore size of the filter, the PMs are deposited inside the porous medium, which is known as deep filtration. If the diameter is larger, the PMs are deposited on the surface of the filter and are referred to as surface filtration. In addition, the PMs deposited by the deep filter gradually reach saturation and begin to be deposited on the wall of the ceramic filter. As the capacity of the porous medium of the filter body is relatively smaller, it is easier to saturate. As a result, the deep filtration quickly turns into surface filtration.
Note that, continuous accumulation of PMs on the surface of the DPF will lead to an increase in exhaust back pressure, which will affect the overall performance of the engine. At this point, the accumulated PMs must be ignited and converted into non-hazardous exhaust gas. This process is known as regeneration. In active regeneration, the PMs are ignited by actively increasing the temperature in the front row of the DPF to achieve the PMs’ light-off temperature, and passive regeneration requires the installation of a DOC device on the DPF inlet channel to reduce BC particles and other pollutants by catalytic oxidation once the oxidation temperature is reached. As a result, the combination of DOC and DPF is the most commonly used method of engine after-treatment.
However, these devices are susceptible to humidity and viscosity caused by the oil droplets in the exhaust gas. In order to maintain the function of the post-processing system, catalysts are required to be replaced regularly. To prevent the filter from clogging, it is also necessary to regenerate the hydrocarbons deposited on the filter by catalytic oxidation or thermal decomposition before a pressure drop. The recommended pressure drop is less than 100 bar before regeneration [22]. It will, therefore, be difficult to apply this system directly to a large marine engine. The size and cost of the system is a major challenge for both ship owners and operators. In addition, the filter clogs easily, which makes the whole unit very ineffective, causing an increase in pressure in the exhaust line, which reduces the efficiency of the ship engine.

5.4.4. Scrubber

Heavy Fuel Oil from the sea usually has a high sulfur content, which leads to high sulfur dioxide emissions in the exhaust gases. Scrubbers offer an alternative way to reduce these emissions without switching to distillate fuels onboard. In 2020, International shipping regulations stipulated that the sulfur content must be limited to 0.5% in 2020. The scrubber, also known as an Exhaust Gas Cleaning System (EGCS), can be used in three variants: open, closed, and combined. The open scrubber uses seawater directly to wash and desulfurize the exhaust gas, and the washed wastewater liquid is treated and discharged into the sea. The closed scrubber uses an aqueous solution of a desulfurization agent (usually NaOH solution) to clean the exhaust gas, and the reactants are treated and stored onboard or discharged into the sea. The combined scrubber, as the name suggests, is a system that combines the open and closed types and can be selected according to requirements. A typical Dry-EGCS desulfurization system uses calcium hydroxide as the adsorbent. Although not originally designed to reduce PM emissions, this system should reduce SOX and PM emissions by over 98%. Wartsila has developed a scrubber system that uses freshwater scrubber technology and NaOH to neutralize SOX in the exhaust gas. When the system was tested, it was expected to eliminate 99% SOX, 5%~11% NOX, and 30%~60% PM in diesel engine exhaust gas.
However, from the limited data available, the effect of scrubbers on the BC elimination rate is still uncertain. The estimated elimination rate is between 40 and 70%, depending on the sulfur content of the fuel [28]. Further work is required to determine the BC reduction effect of the scrubber at different marine engine loads. In addition to the uncertainty of the BC removal effect, scrubbers have other potential problems. Currently, 80% of ships equipped with scrubbers use the open system because it is a relatively simple system. With this system, the scrubbing liquid is simply drained into the sea. Several critics are of the opinion that the scrubber tower only discharges sulfur and PM discharge from the air into the sea and does not make shipping more environmentally friendly. The economic viability and feasibility of using the exhaust gas scrubber over the entire life cycle of a ship is, therefore, questionable and must be carefully examined.

6. Conclusions

Questions related to BC emissions from ships are of utmost importance. However, further details are needed on the characterization of BC, its formation in internal combustion engines, emission detection methods, and possible emission reduction strategies. In this paper, the relevant topics mentioned above have been reviewed and summarized. The main conclusions are as follows:
  • The detection and control of BC emissions from ships are more difficult than that of PM emissions. This is mainly due to the fact that their characteristics are very complex, and the existing detection methods can only recognize one of these characteristics. Therefore, the harmonization and standardization of measurement methods and terminology is a top priority. It is recommended to use the definition “Equivalent BC (eBC)” when using the light attenuation measurement method. Use the definition “Soot BC” when using particle characteristics or micro-morphology measurement methods. Use the definition “refractory rBC” if you use the laser-induced incandescence measurement method. The “Element Carbon” (EC) can also be used instead of the BC detection. The FSN measurement method is the recommended test method for ships due to its optical properties.
  • The technology for controlling BC emissions in marine low-speed engines should be different from the technology for controlling PM emissions in another high-speed engine. The simultaneous optimization of energy efficiency in both ship and engine technology (energy efficiency design of ships and in-combustion cleaning technologies) has great potential to control BC emissions. Improving fuel quality is key to reducing BC emissions. At present, the feasible solutions for low-speed engines are optimizing ship design, using biofuel, increasing common rail high-pressure injection pressure, reducing orifice diameter, introducing adoption of boot-length injection patterns, split injection, increasing air entrainment in the lift-off flame, improving air–oil mixture through new combustion chamber design, after-treatment systems, etc. The combined effect of the BC emission reduction should be more than 50%.

Author Contributions

Conceptualization, T.L. and G.W.; methodology, G.W. and T.L.; software, G.W.; validation, J.A.U. and J.L.; formal analysis, C.C.; investigation, B.C.; resources, J.L.; data curation, X.Z.; writing—original draft preparation, G.W. and J.A.U.; writing—review and editing, G.W., J.A.U. and J.L.; visualization, G.W.; supervision, G.W.; project administration, G.W.; funding acquisition, T.L. All authors have read and agreed to the published version of the manuscript.

Funding

The support by the Major International (Regional) Joint Research Project of the National Natural Science Foundation of China (52020105009) and National Natural Science Foundation of China (52271325) is gratefully acknowledged.

Institutional Review Board Statement

Not applicable.

Informed Consent Statement

Not applicable.

Data Availability Statement

Data sharing not applicable. No new data were created or analyzed in this study. Data sharing is not applicable to this article.

Conflicts of Interest

The authors declare no conflicts of interest.

Nomenclature

IMOInternational Maritime Organization
BCBlack Carbons
IAPPInternational Air Pollution Prevention
PMsParticulate Matters
EPAEnvironmental Protection Agency
CICompression-Ignition
ICInternal Combustion
MARPOLInternational Convention for the Prevention of Pollution from Ships
ECAEmission Control Areas
RPMRevolutions Per Minute
HFOHeavy Fuel Oil
MDOMarine Diesel Oil
MEPCMarine Environmental Protection Committee
MACMass Absorption Cross
OMOrganic Mass
OCOrganic Compound
eBCequivalent Black Carbons
rBCrefractory Black Carbons
TEMTransmission Electron Microscopy
ECElemental Carbon
PAHsPolycyclic Aromatic Hydrocarbons
HACAHydrogen Abstraction Acetylene Addition
UHCUnburnt Hydrocarbon
NOxNitrogen Oxides
AMSAccelerator Mass Spectrometry
GMDGeometric Mean Diameters
DPFsDiesel Particulate Filters
2-DTwo-Dimensional
DPDiametral Pitch
XRDX-Ray Diffraction
HRTEMHigh-Resolution Transmission Electron Microscopy
RSRaman Spectroscopy
FT-IRFourier Transform Infrared Spectroscopy
XPSX-ray Photoelectron Spectroscopy
TGAThermo-Gravimetric Analyzer
TTemperature
SMPSScanning Mobility Particle Size
ELPIElectrical Low-Pressure Impactor
SOFSoluble Organic Fraction
ICP-MSInductively Coupled Plasma Mass Spectrometry
ICP-OESInductively Coupled Plasma Optical Emission Spectrometry
SMPSScanning Mobility Particle Size
SEMScanning Electron Microscopy
EDXEnergy Dispersive X-Ray Spectroscopy
TEOMTapered Element Oscillating Micro-balance
ELPIElectrical Low-Pressure Impactor
PSAPParticle Soot Absorption Photometer
TRThermal Radiation
LALight Absorption
TOThermal–Optical
MAPMulti-angle Absorption Photometer
LACLight Absorption Coefficients
WMACWavelength-Dependent Mass Absorption Coefficient
PASPhotoacoustic Absorption Spectroscopy
FSNFilter Smoke Number
LIILaser-Induced Incandescence
SP2Single Particle Soot Photometer
TRAThermal Radiation Analysis
TOAThermal–Optical Analysis
IMPROVEInteragency Monitoring of Protected Visual Environments
NIOSHNational Institute of Occupational Safety and Health
AFMAtomic Force Microscope
FSNFilter Smoke Number
LNGLiquid Natural Gas
COCarbon Monoxide
EGRExhaust Gas Recirculation
TDCTop Dead Center
ECMsElectronic Control Modules
ISFInsoluble Fraction
SCRSelective Catalytic Reactor
ESPElectrostatic Precipitator
FFFabric Filter
WESWet Electrostatic Scrubber
EGCSExhaust Gas Cleaning System
DOCsDiesel Oxidation Catalysts

References

  1. Zhu, M.; Li, K.X.; Shi, W.; Lam, S.L. Incentive policy for reduction of emission from ships: A case study of China. Mar. Policy 2017, 86, 253–258. [Google Scholar] [CrossRef]
  2. Corbett, J.J. Updated emissions from ocean shipping. J. Geophys. Res. 2003, 108, 20–30. [Google Scholar] [CrossRef]
  3. Lin, B.; Lin, C. Compliance with international emission regulations: Reducing the air pollution from merchant vessels. Mar. Policy 2006, 30, 220–225. [Google Scholar] [CrossRef]
  4. Goldsworthy, L. Exhaust Emissions from Ship Engines—Significance, Regulations, Control Technologies. Aust. N. Z. Marit. Law J. 2010, 24, 21–30. [Google Scholar]
  5. Wan, Z.; Zhu, M.; Chen, S.; Sperling, D. Pollution: Three steps to a green shipping industry. Nature 2016, 530, 275–277. [Google Scholar] [CrossRef] [PubMed]
  6. Endresen, Ø. Emission from international sea transportation and environmental impact. J. Geophys. Res. 2003, 108, 17–28. [Google Scholar] [CrossRef]
  7. Corbett, J.J.; Winebrake, J.J.; Green, E.H.; Kasibhatla, P.; Eyring, V.; Lauer, A. Mortality from Ship Emissions: A Global Assessment. Environ. Sci. Technol. 2007, 41, 8512–8518. [Google Scholar] [CrossRef]
  8. Bond, T.C.; Doherty, S.J.; Fahey, D.W.; Forster, P.M.; Berntsen, T.; Deangelo, B.J.; Flanner, M.G.; Ghan, S.; Kärcher, B.; Koch, D.; et al. Bounding the role of black carbon in the climate system: A scientific assessment. J. Geophys. Res. Atmos. 2013, 118, 5380–5552. [Google Scholar] [CrossRef]
  9. U.S. EPA (U.S. Environmental Protection Agency). Report to Congress on Black Carbon. EPA-450/R-12-001; 2012. Available online: https://19january2017snapshot.epa.gov/www3/airquality/blackcarbon/2012report/fullreport.pdf (accessed on 16 December 2023).
  10. Humpert, M.; Raspotnik, A. The future of Arctic shipping. Port. Technol. Int. 2012, 55, 10–11. Available online: https://wpassets.porttechnology.org/wp-content/uploads/2019/05/25182025/The_future_of_Arctic_shipping.pdf (accessed on 16 December 2023).
  11. Ellis, B.; Brigham, L. Arctic Marine Shipping Assessment 2009 Report. Oaarchivearctic-Councilorg. 2009. Available online: https://oaarchive.arctic-council.org/handle/11374/54 (accessed on 16 December 2023).
  12. Brunila, O.; Inkinen, T. Black carbon measurement in the Arctic—Is there a business potential? In Final Report of the Work Package 3 in the Sea Effects; Centre for Maritime Studies: Singapore, 2017. [Google Scholar]
  13. Lack, D.; Thuesen, J.; Elliot, R. Investigation of appropriate control measures (abatement technologies) to reduce Black Carbon emissions from international shipping. In International Maritime Organization Study Report and Prepared by Litehauz; ERRIAZ; International Maritime Organization: London, UK, 2012. [Google Scholar]
  14. National Snow and Ice Data Center. Arctic vs. Antarctic National Snow and Ice Data Center. Nsidcorg. 2000. Available online: https://nsidc.org/cryosphere/seaice/characteristics/difference.html (accessed on 16 December 2023).
  15. Grahame, T.J.; Klemm, R.; Schlesinger, R.B. Public health and components of particulate matter: The changing assessment of black carbon. J. Air Waste Manag. Assoc. 2014, 64, 620–660. [Google Scholar] [CrossRef]
  16. Janssen, N.A.H.; Gerlofs-Nijland, M.E.; Lanki, T. Health Effects of Black Carbon. World Health Organization. 2012. Available online: https://www.euro.who.int/__data/assets/pdf_file/0004/162535/e96541.pdf (accessed on 16 December 2023).
  17. Briggs, N.L.; Long, C.M. Critical review of black carbon and elemental carbon source apportionment in Europe and the United States. Atmos. Environ. 2016, 144, 409–427. [Google Scholar] [CrossRef]
  18. Vuorinen, V.; Aarnio, M.; Alava, M.; Alopaeus, V.; Atanasova, N.; Auvinen, M.; Balasubramanian, N.; Bordbar, H.; Erästö, P.; Grande, R.; et al. Modelling aerosol transport and virus exposure with numerical simulations in relation to SARS-CoV-2 transmission by inhalation indoors. Saf. Sci. 2020, 130, 104866. [Google Scholar] [CrossRef] [PubMed]
  19. Jayaweera, M.; Perera, H.; Gunawardana, B.; Manatunge, J. Transmission of COVID-19 virus by droplets and aerosols: A critical review on the unresolved dichotomy. Environ. Res. 2020, 188, 109819. [Google Scholar] [CrossRef] [PubMed]
  20. U.S. EPA. Domestic Regulations for Emissions from Marine Compression-ignition (Diesel) Engines. United States Environmental Protection Agency: Washington, DC, USA, 2019. Available online: https://www.epa.gov/regulations-emissions-vehicles-and-engines/domestic-regulations-emissions-marine-compression (accessed on 16 December 2023).
  21. Chinese Standard. Limits and Measurement Methods for Exhaust Pollutants from Marine engines (China Ⅰ, Ⅱ). GB 15097-2016; PDF in English; 2016. Available online: https://https://english.mee.gov.cn/Resources/standards/Air_Environment/emission_mobile/201705/t20170523_414595.shtml (accessed on 16 December 2023).
  22. Di Natale, F.; Carotenuto, C. Particulate matter in marine diesel engines exhausts: Emissions and control strategies. Transp. Res. Part D Transp. Environ. 2015, 40, 166–191. [Google Scholar] [CrossRef]
  23. IMO. Resolution MEPC.176 (58). Amendments to the Annex of the Protocol of 1997 to Amend the International Convention for the Prevention of Pollution from Ships, 1973, as Modified by the Protocol of 1978 Relating Thereto. International Maritime Organization. 2008. Available online: http://refhub.elsevier.com/S1364-0321(20)30436-6/sref84 (accessed on 16 December 2023).
  24. Panagakos, G.P.; Stamatopoulou, E.V.; Psaraftis, H.N. The possible designation of the Mediterranean Sea as a SECA: A case study. Transp. Res. Part D Transp. Environ. 2014, 28, 74–90. [Google Scholar] [CrossRef]
  25. Viana, M.; Fann, N.; Tobías, A.; Querol, X.; Rojas-Rueda, D.; Plaza, A. Environmental and Health Benefits from Designating the Marmara Sea and the Turkish Straits as an Emission Control Area (ECA). Environ. Sci. Technol. 2015, 49, 3304–3313. [Google Scholar] [CrossRef] [PubMed]
  26. Kasper, A.; Aufdenblatten, S.; Forss, A.; Mohr, M.; Burtscher, H. Particulate Emissions from a Low-Speed Marine Diesel Engine. Aerosol Sci. Technol. 2007, 41, 24–32. [Google Scholar] [CrossRef]
  27. Johansson, L.; Jalkanen, J.-P.; Kukkonen, J. Global assessment of shipping emissions in 2015 on a high spatial and temporal resolution. Atmos. Environ. 2017, 167, 403–415. [Google Scholar] [CrossRef]
  28. Lack, D.A.; Corbett, J.J. Black carbon from ships: A review of the effects of ship speed, fuel quality and exhaust gas scrubbing. Atmos. Chem. Phys. 2012, 12, 3985–4000. [Google Scholar] [CrossRef]
  29. IMO. Sub-Committee on Pollution Prevention and Response (PPR), 2nd Session, 19 to 23 January 2015. Wwwimoorg. 2015. Available online: https://www.imo.org/en/MediaCentre/MeetingSummaries/Pages/PPR-2.aspx (accessed on 19 August 2022).
  30. IMO. Marine Environment Protection Committee (MEPC), 68th Session, 11 to 15 May 2015. Wwwimoorg. 2015. Available online: https://www.imo.org/en/MediaCentre/MeetingSummaries/Pages/MEPC-68th-session.aspx (accessed on 19 August 2022).
  31. IMO. Marine Environment Protection Committee (MEPC), 74th Session, 13–17 May 2019. Wwwimoorg. 2019. Available online: https://www.imo.org/en/MediaCentre/MeetingSummaries/Pages/MEPC-74th-session.aspx (accessed on 26 November 2021).
  32. Maricq, M.M. Examining the Relationship Between Black Carbon and Soot in Flames and Engine Exhaust. Aerosol Sci. Technol. 2014, 48, 620–629. [Google Scholar] [CrossRef]
  33. Petzold, A.; Ogren, J.A.; Fiebig, M.; Laj, P.; Li, S.-M.; Baltensperger, U. Recommendations for reporting “black carbon” measurements. Atmos. Chem. Phys. 2013, 13, 8365–8379. [Google Scholar] [CrossRef]
  34. Bond, T.C.; Habib, G.; Bergstrom, R.W. Limitations in the enhancement of visible light absorption due to mixing state. J. Geophys. Res. 2006, 111, 120–129. [Google Scholar] [CrossRef]
  35. Schwarz, J.P.; Gao, R.S.; Fahey, D.W.; Thomson, D.S.; Watts, L.A.; Wilson, J.C. Single-particle measurements of midlatitude black carbon and light-scattering aerosols from the boundary layer to the lower stratosphere. J. Geophys. Res. 2006, 111, 116–131. [Google Scholar] [CrossRef]
  36. Medalia, A.I.; Heckman, F.A. Morphology of aggregates—II. Size and shape factors of carbon black aggregates from electron microscopy. Carbon 1969, 7, 567–582. [Google Scholar] [CrossRef]
  37. Fung, K. Particulate Carbon Speciation by MnO2Oxidation. Aerosol Sci. Technol. 1990, 12, 122–127. [Google Scholar] [CrossRef]
  38. Wonaschütz, A.; Hitzenberger, R.; Bauer, H.; Pouresmaeil, P.; Klatzer, B.; Caseiro, A. Application of the Integrating Sphere Method to Separate the Contributions of Brown and Black Carbon in Atmospheric Aerosols. Environ. Sci. Technol. 2009, 43, 1141–1146. [Google Scholar] [CrossRef]
  39. Andreae, M.O.; Gelencsér, A. Black carbon or brown carbon? The nature of light-absorbing carbonaceous aerosols. Atmos. Chem. Phys. 2006, 6, 3131–3148. [Google Scholar] [CrossRef]
  40. Graber, E.R.; Rudich, Y. Atmospheric HULIS: How humic-like are they? A comprehensive and critical review. Atmos. Chem. Phys. 2006, 6, 729–753. [Google Scholar] [CrossRef]
  41. Russell, L.M. Aerosol Organic-Mass-to-Organic-Carbon Ratio Measurements. Environ. Sci. Technol. 2003, 37, 2982–2987. [Google Scholar] [CrossRef]
  42. Sakurai, H.; Tobias, H.J.; Park, K.; Zarling, D.; Docherty, K.S.; Kittelson, D.B. On-line measurements of diesel nanoparticle composition and volatility. Atmos. Environ. 2003, 37, 1199–1210. [Google Scholar] [CrossRef]
  43. Reilly, P.T.A.; Gieray, R.A.; Whitten, W.B.; Ramsey, J.M. Direct observation of the evolution of the soot carbonization process in an acetylene diffusion flame via real-time aerosol mass spectrometry. Combust. Flame 2000, 122, 90–104. [Google Scholar] [CrossRef]
  44. Kholghy, M.R.; Veshkini, A.; Thomson, M.J. The core–shell internal nanostructure of soot—A criterion to model soot maturity. Carbon 2016, 100, 508–536. [Google Scholar] [CrossRef]
  45. Lahaye, J.; Badie, P.; Ducret, J. Mechanism of carbon formation during steamcracking of hydrocarbons. Carbon 1977, 15, 87–93. [Google Scholar] [CrossRef]
  46. Johansson, K.O.; Head-Gordon, M.P.; Schrader, P.E.; Wilson, K.R.; Michelsen, H.A. Resonance-stabilized hydrocarbon-radical chain reactions may explain soot inception and growth. Science 2018, 361, 997–1000. [Google Scholar] [CrossRef] [PubMed]
  47. Heywood, J.B. Internal Combustion Engine Fundamentals; Mcgraw-Hill Education: New York, NY, USA, 2018. [Google Scholar]
  48. Dec, J.E. A Conceptual Model of DI Diesel Combustion Based on Laser-Sheet Imaging*. SAE Tech. Pap. 1997, 342–358. [Google Scholar] [CrossRef]
  49. Wei, Y.; Li, T.; Zhou, X.; Zhang, Z. Time-resolved measurement of the near-nozzle air entrainment of high-pressure diesel spray by high-speed micro-PTV technique. Fuel 2020, 268, 117343. [Google Scholar] [CrossRef]
  50. Zhou, X.; Li, T.; Lai, Z.; Wei, Y. Modeling diesel spray tip and tail penetrations after end-of-injection. Fuel 2019, 237, 442–456. [Google Scholar] [CrossRef]
  51. Zhao, Y.; Nguyen, T.; Presto, A.; Christopher, J.; Andrew, A.; Allen, L. Intermediate volatility organic compound emissions from on-road diesel vehicles: Chemical composition, emission factors, and estimated secondary organic aerosol production. Environ. Sci. Technol. 2015, 49, 11516–11526. [Google Scholar] [CrossRef]
  52. Black, F.; High, L. Methodology for Determining Particulate and Gaseous Diesel Hydrocarbon Emissions. SAE Tech. Pap. 790422 1979, 12, 232–238. [Google Scholar] [CrossRef]
  53. Kageyama, K.; Kinehara, N. Characterization of Particulate Emission from Swirl Chamber Type Light-Duty Diesel Engine as a Function of Engine Parameters. SAE Tech. Pap. 1982, 91, 754–766. Available online: https://www.jstor.org/stable/44631980 (accessed on 16 December 2023).
  54. Eveleigh, A.; Ladommatos, N. Isotopic Tracers for Combustion Research. Combust. Sci. Technol. 2016, 189, 660–682. [Google Scholar] [CrossRef]
  55. Mayer, W.J.; Lechman, D.C.; Hilden, D.L. The Contribution of Engine Oil to Diesel Exhaust Particulate Emissions. SAE Tech. Paper 1980, 553–565. [Google Scholar] [CrossRef]
  56. Buchholz, B.A.; Dibble, R.W.; Rich, D.; Cheng, A.S. Quantifying the Contribution of Lubrication Oil Carbon to Particulate Emissions from a Diesel Engine. SAE Tech. Paper 2003, 112, 1874–1879. [Google Scholar] [CrossRef]
  57. Jones, H.L.; Mctaggart-Cowan, G.P.; Rogak, S.N.; Bushe, W.K.; Munshi, S.R.; Buchholz, B.A. Source Apportionment of Particulate Matter from a Diesel Pilot-Ignited Natural Gas Fuelled Heavy Duty DI Engine. SAE Technical Paper Series. SAE Tech. Paper 2005, 114, 944–954. [Google Scholar] [CrossRef]
  58. Miller, A.L.; Stipe, C.B.; Habjan, M.C.; Ahlstrand, G.G. Role of lubrication oil in particulate emissions from a hydrogen-powered internal combustion engine. Environ. Sci. Technol. 2007, 41, 6828–6835. [Google Scholar] [CrossRef] [PubMed]
  59. Li, Z.; Song, C.; Song, J.; Lv, G.; Dong, S.; Zhao, Z. Evolution of the nanostructure, fractal dimension and size of in-cylinder soot during diesel combustion process. Combust. Flame 2011, 158, 1624–1630. [Google Scholar] [CrossRef]
  60. Zhang, R.; Kook, S. Structural evolution of soot particles during diesel combustion in a single-cylinder light-duty engine. Combust. Flame 2015, 162, 2720–2728. [Google Scholar] [CrossRef]
  61. Si, M.; Cheng, Q.; Song, J.; Liu, Y.; Tao, M.; Lou, C. Study on inversion of morphological parameters of soot aggregates in hydrocarbon flames. Combust. Flame 2017, 183, 261–270. [Google Scholar] [CrossRef]
  62. Gaddam, C.K.; Vander Wal, R.L. Physical and chemical characterization of SIDI engine particulates. Combust. Flame 2013, 160, 2517–2528. [Google Scholar] [CrossRef]
  63. Brasil, A.M.; Farias, T.L.; Carvalho, M.G. A Recipe for Image Characterization of Fractal-Like Aggregates. J. Aerosol Sci. 1999, 30, 1379–1389. [Google Scholar] [CrossRef]
  64. Wei, J.; Zeng, Y.; Pan, M.; Zhuang, Y.; Qiu, L.; Zhou, T. Morphology analysis of soot particles from a modern diesel engine fueled with different types of oxygenated fuels. Fuel 2020, 267, 117248. [Google Scholar] [CrossRef]
  65. Neer, A.; Koylu, U.O. Effect of operating conditions on the size, morphology, and concentration of submicrometer particulates emitted from a diesel engine. Combust. Flame 2006, 146, 142–154. [Google Scholar] [CrossRef]
  66. Rohani, B.; Bae, C. Morphology and nano-structure of soot in diesel spray and in engine exhaust. Fuel 2017, 203, 47–56. [Google Scholar] [CrossRef]
  67. Jiang, H.; Wu, G.; Li, T.; He, P.; Chen, R. Characteristics of Particulate Matter Emissions from a Low-Speed Marine Diesel Engine at Various Loads. Environ. Sci. Technol. 2019, 53, 11552–11559. [Google Scholar] [CrossRef] [PubMed]
  68. Lieke, K.I.; Rosenørn, T.; Pedersen, J.; Larsson, D.; Kling, J.; Fuglsang, K. Micro- and Nanostructural Characteristics of Particles Before and After an Exhaust Gas Recirculation System Scrubber. Aerosol Sci. Technol. 2013, 47, 1038–1046. [Google Scholar] [CrossRef]
  69. Lee, K.O.; Cole, R.; Sekar, R.; Choi, M.Y.; Kang, J.S.; Bae, C.S. Morphological investigation of the microstructure, dimensions, and fractal geometry of diesel particulates. Proc. Combust. Inst. 2002, 29, 647–653. [Google Scholar] [CrossRef]
  70. Jiang, H.; Li, T.; Wang, Y.; He, P.; Wang, B. The evolution of soot morphology and nanostructure along axial direction in diesel spray jet flames. Combust. Flame 2019, 199, 204–212. [Google Scholar] [CrossRef]
  71. Vander Wal, R.L.; Tomasek, A.J. Soot nanostructure: Dependence upon synthesis conditions. Combust. Flame 2004, 136, 129–140. [Google Scholar] [CrossRef]
  72. Vander Wal, R.L.; Tomasek, A.J. Soot oxidation. Combust. Flame 2003, 134, 1–9. [Google Scholar] [CrossRef]
  73. Rodríguez-Fernández, J.; Hernández, J.J.; Sánchez-Valdepeñas, J. Effect of oxygenated and paraffinic alternative diesel fuels on soot reactivity and implications on DPF regeneration. Fuel 2016, 185, 460–467. [Google Scholar] [CrossRef]
  74. Sharma, M.; Agarwal, A.; Bharathi, K. Characterization of exhaust particulates from diesel engine. Atmos. Environ. 2005, 39, 3023–3028. [Google Scholar] [CrossRef]
  75. Jiang, H.; Li, T.; Wang, Y.; He, P. Morphology and nano-structure analysis of soot particles sampled from high pressure diesel jet flames under diesel-like conditions. Meas. Sci. Technol. 2018, 29, 045801. [Google Scholar] [CrossRef]
  76. Toth, P.; Palotas, A.B.; Ring, T.A.; Eddings, E.G.; Vander Wal, R.; Lighty, J.S. The effect of oxidation pressure on the equilibrium nanostructure of soot particles. Combust. Flame 2015, 162, 2422–2430. [Google Scholar] [CrossRef]
  77. Vander Wal, R.L.; Mueller, C.J. Initial Investigation of Effects of Fuel Oxygenation on Nanostructure of Soot from a Direct-Injection Diesel Engine. Energy Fuels 2006, 20, 2364–2369. [Google Scholar] [CrossRef]
  78. Agudelo, J.R.; Álvarez, A.; Armas, O. Impact of crude vegetable oils on the oxidation reactivity and nanostructure of diesel particulate matter. Combust. Flame 2014, 161, 2904–2915. [Google Scholar] [CrossRef]
  79. Zhang, Y.; Zhang, R.; Rao, L.; Kook, S. A Comparison between In-Flame and Exhaust Soot Nanostructures in a Light-Duty Diesel Engine. SAE Tech. Paper 2017-01-0710 2017, 12, 654–657. [Google Scholar] [CrossRef]
  80. Pahalagedara, L.; Sharma, H.; Kuo, C.-H.; Dharmarathna, S.; Joshi, A.; Suib, S.L.; Mhadeshwar, A.B. Structure and oxidation activity correlations for carbon blacks and diesel soot. Energy Fuels 2012, 26, 6757–6764. [Google Scholar] [CrossRef]
  81. Ying, Y.; Liu, D. Nanostructure evolution and reactivity of nascent soot from inverse diffusion flames in CO2, N2, and He atmospheres. Carbon 2018, 139, 172–180. [Google Scholar] [CrossRef]
  82. Sadezky, A.; Muckenhuber, H.; Grothe, H.; Niessner, R.; Pöschl, U. Raman microspectroscopy of soot and related carbonaceous materials: Spectral analysis and structural information. Carbon 2005, 43, 1731–1742. [Google Scholar] [CrossRef]
  83. Lu, T.; Cheung, C.S.; Huang, Z. Effects of engine operating conditions on the size and nanostructure of diesel particles. J. Aerosol Sci. 2012, 47, 27–38. [Google Scholar] [CrossRef]
  84. Liu, Y.; Wu, S.; Fan, C. Variations in surface functional groups, carbon chemical state and graphitization degree during thermal deactivation of diesel soot particles. J. Environ. Sci. 2023, 124, 678–687. [Google Scholar] [CrossRef] [PubMed]
  85. Wang, H. Formation of nascent soot and other condensed-phase materials in flames. Proc. Combust. Inst. 2011, 33, 41–67. [Google Scholar] [CrossRef]
  86. Müller, J.-O.; Su, D.S.; Jentoft, R.E.; Wild, U.; Schlögl, R. Diesel Engine Exhaust Emission:  Oxidative Behavior and Microstructure of Black Smoke Soot Particulate. Environ. Sci. Technol. 2006, 40, 1231–1236. [Google Scholar] [CrossRef]
  87. Vander Wal, R.L.; Bryg, V.M.; Huang, C.-H. Aircraft engine particulate matter: Macro- micro- and nanostructure by HRTEM and chemistry by, X.P.S. Combust. Flame 2014, 161, 602–611. [Google Scholar] [CrossRef]
  88. Vander Wal, R.L.; Bryg, V.M.; Hays, M.D. XPS Analysis of Combustion Aerosols for Chemical Composition, Surface Chemistry, and Carbon Chemical State. Anal. Chem. 2011, 83, 1924–1930. [Google Scholar] [CrossRef]
  89. Song, J.; Alam, M.; Boehman, A.L.; Kim, U. Examination of the oxidation behavior of biodiesel soot. Combust. Flame 2006, 146, 589–604. [Google Scholar] [CrossRef]
  90. Müller, J.-O.; Su, D.S.; Wild, U.; Schlögl, R. Bulk and surface structural investigations of diesel engine soot and carbon black. Phys. Chem. Chem. Phys. 2007, 9, 4018–4025. [Google Scholar] [CrossRef]
  91. Wang, L.; Song, C.; Song, J.; Lv, G.; Pang, H.; Zhang, W. Aliphatic C–H and oxygenated surface functional groups of diesel in-cylinder soot: Characterizations and impact on soot oxidation behavior. Proc. Combust. Inst. 2013, 34, 3099–3106. [Google Scholar] [CrossRef]
  92. Cain, J.P.; Gassman, P.L.; Wang, H.; Laskin, A. Micro-FTIR study of soot chemical composition—Evidence of aliphatic hydrocarbons on nascent soot surfaces. Phys. Chem. Chem. Phys. 2010, 12, 5206. [Google Scholar] [CrossRef]
  93. Vander Wal, R.L.; Yezerets, A.; Currier, N.W.; Kim, D.H.; Wang, C.M. HRTEM Study of diesel soot collected from diesel particulate filters. Carbon 2007, 45, 70–77. [Google Scholar] [CrossRef]
  94. Sun, C.; Martin, J.; Boehman, A.L. Nanostructure and reactivity of soot produced from a turbodiesel engine using post injection. Proc. Combust. Inst. 2019, 37, 1169–1176. [Google Scholar] [CrossRef]
  95. Yokomichi, H.; Hayashi, T.; Masuda, A. Changes in structure and nature of defects by annealing of fluorinated amorphous carbon thin films with low dielectric constant. Appl. Phys. Lett. 1998, 72, 2704–2706. [Google Scholar] [CrossRef]
  96. Kandas, A.W.; Gokhan Senel, I.; Levendis, Y.; Sarofim, A.F. Soot surface area evolution during air oxidation as evaluated by small angle X-ray scattering and CO2 adsorption. Carbon 2005, 43, 241–251. [Google Scholar] [CrossRef]
  97. Stanmore, B.R.; Brilhac, J.F.; Gilot, P. The oxidation of soot: A review of experiments, mechanisms and models. Carbon 2001, 39, 2247–2268. [Google Scholar] [CrossRef]
  98. Ghiassi, H.; Toth, P.; Jaramillo, I.C.; Lighty, J.S. Soot oxidation-induced fragmentation: Part 1: The relationship between soot nanostructure and oxidation-induced fragmentation. Combust. Flame 2016, 163, 179–187. [Google Scholar] [CrossRef]
  99. Ghiassi, H.; Jaramillo, I.C.; Toth, P.; Lighty, J.S. Soot oxidation-induced fragmentation: Part 2: Experimental investigation of the mechanism of fragmentation. Combust. Flame 2016, 163, 170–178. [Google Scholar] [CrossRef]
  100. Sirignano, M.; Ghiassi, H.; D’Anna, A.; Lighty, J.S. Temperature and oxygen effects on oxidation-induced fragmentation of soot particles. Combust. Flame 2016, 171, 15–26. [Google Scholar] [CrossRef]
  101. Mueller, M.E.; Chan, Q.N.; Qamar, N.H.; Dally, B.B.; Pitsch, H.; Alwahabi, Z.T. Experimental and computational study of soot evolution in a turbulent nonpremixed bluff body ethylene flame. Combust. Flame 2013, 160, 1298–1309. [Google Scholar] [CrossRef]
  102. Attili, A.; Bisetti, F.; Mueller, M.E.; Pitsch, H. Formation, growth, and transport of soot in a three-dimensional turbulent non-premixed jet flame. Combust. Flame 2014, 161, 1849–1865. [Google Scholar] [CrossRef]
  103. Li, X.; Xu, Z.; Guan, C.; Huang, Z. Impact of exhaust gas recirculation (EGR) on soot reactivity from a diesel engine operating at high load. Appl. Therm. Eng. 2014, 68, 100–106. [Google Scholar] [CrossRef]
  104. Stratakis, G. Thermogravimetric analysis of soot emitted by a modern diesel engine run on catalyst-doped fuel. Combust. Flame 2003, 132, 157–169. [Google Scholar] [CrossRef]
  105. Kittelson, D.B. Engines and nanoparticles: A review. J. Aerosol Sci. 1998, 29, 575–588. [Google Scholar] [CrossRef]
  106. Maricq, M.M.; Podsiadlik, D.H.; Chase, R.E. Size Distributions of Motor Vehicle Exhaust PM: A Comparison Between ELPI and SMPS Measurements. Aerosol Sci. Technol. 2000, 33, 239–260. [Google Scholar] [CrossRef]
  107. Kinsey, J.S.; Mitchell, W.A.; Squier, W.C.; Linna, K.; King, F.G.; Logan, R. Evaluation of methods for the determination of diesel-generated fine particulate matter: Physical characterization results. J. Aerosol Sci. 2006, 37, 63–87. [Google Scholar] [CrossRef]
  108. Chu-Van, T.; Ristovski, Z.; Pourkhesalian, A.M.; Rainey, T.; Garaniya, V.; Abbassi, R. A comparison of particulate matter and gaseous emission factors from two large cargo vessels during manoeuvring conditions. Energy Rep. 2019, 5, 1390–1398. [Google Scholar] [CrossRef]
  109. Wei, Q.; Kittelson, D.B.; Watts, W.F. Single-Stage Dilution Tunnel Design. SAE Tech. Pap. 2001, 110, 259–271. [Google Scholar] [CrossRef]
  110. Wichmann, H.-E. Diesel Exhaust Particles. Inhal. Toxicol. 2007, 19, 241–244. [Google Scholar] [CrossRef] [PubMed]
  111. Wang, Y.; Liang, X.; Tang, G.; Chen, Y.; Dong, L.; Shu, G. Impact of lubricating oil combustion on nanostructure, composition and graphitization of diesel particles. Fuel 2017, 190, 237–244. [Google Scholar] [CrossRef]
  112. Zhang, Z.-H.; Balasubramanian, R. Effects of oxygenated fuel blends on carbonaceous particulate composition and particle size distributions from a stationary diesel engine. Fuel 2015, 141, 1–8. [Google Scholar] [CrossRef]
  113. Yang, K.; Wei, L.; Cheung, C.S.; Tang, C.; Huang, Z. The effect of pentanol addition on the particulate emission characteristics of a biodiesel operated diesel engine. Fuel 2017, 209, 132–140. [Google Scholar] [CrossRef]
  114. Choi, J.-H.; Cho, I.; Lee, J.S.; Park, S.-K.; Lee, W.-J.; Kim, H. Characterization of carbonaceous particulate matter emitted from marine diesel engine. J. Mech. Sci. Technol. 2016, 30, 2011–2017. [Google Scholar] [CrossRef]
  115. Wu, D.; Zhang, F.; Lou, W.; Li, D.; Chen, J. Chemical characterization and toxicity assessment of fine particulate matters emitted from the combustion of petrol and diesel fuels. Sci. Total Environ. 2017, 605–606, 172–179. [Google Scholar] [CrossRef] [PubMed]
  116. Kocbach, A.; Johansen, B.V.; Schwarze, P.E.; Namork, E. Analytical electron microscopy of combustion particles: A comparison of vehicle exhaust and residential wood smoke. Sci. Total Environ. 2005, 346, 231–243. [Google Scholar] [CrossRef]
  117. Vernooij, M.G.C.; Mohr, M.; Tzvetkov, G.; Zelenay, V.; Huthwelker, T.; Kaegi, R. On Source Identification and Alteration of Single Diesel and Wood Smoke Soot Particles in the Atmosphere; An X-Ray Microspectroscopy Study. Environ. Sci. Technol. 2009, 43, 5339–5344. [Google Scholar] [CrossRef] [PubMed]
  118. Chen, Y.; Shah, N.; Braun, A.; Huggins, F.E.; Huffman, G.P. Electron Microscopy Investigation of Carbonaceous Particulate Matter Generated by Combustion of Fossil Fuels. Energy Fuels 2005, 19, 1644–1651. [Google Scholar] [CrossRef]
  119. Chen, Y.; Shah, N.; Huggins, F.E.; Huffman, G.P. Microanalysis of ambient particles from Lexington, KY, by electron microscopy. Atmos. Environ. 2006, 40, 651–663. [Google Scholar] [CrossRef]
  120. Ashraful, A.M.; Masjuki, H.H.; Kalam, M.A. Particulate matter, carbon emissions and elemental compositions from a diesel engine exhaust fuelled with diesel–biodiesel blends. Atmos. Environ. 2015, 120, 463–474. [Google Scholar] [CrossRef]
  121. Mühlbauer, W.; Zöllner, C.; Lehmann, S.; Lorenz, S.; Brüggemann, D. Correlations between physicochemical properties of emitted diesel particulate matter and its reactivity. Combust. Flame 2016, 167, 39–51. [Google Scholar] [CrossRef]
  122. Liati, A.; Spiteri, A.; Dimopoulos Eggenschwiler, P.; Vogel-Schäuble, N. Microscopic investigation of soot and ash particulate matter derived from biofuel and diesel: Implications for the reactivity of soot. J. Nanoparticle Res. 2012, 14, 12–24. [Google Scholar] [CrossRef]
  123. Jung, H.; Kittelson, D.B.; Zachariah, M.R. The Influence of Engine Lubricating Oil on Diesel Nanoparticle Emissions and Kinetics of Oxidation. SAE Tech. Paper 2003-01-3179 2003. [CrossRef]
  124. Hansen, B.B.; Jensen, A.D.; Jensen, P.A. Performance of diesel particulate filter catalysts in the presence of biodiesel ash species. Fuel 2013, 106, 234–240. [Google Scholar] [CrossRef]
  125. Kweon, C.-B.; Foster, D.E.; Schauer, J.J.; Okada, S. Detailed Chemical Composition and Particle Size Assessment of Diesel Engine Exhaust. SAE Technical Paper 2002-01-2670 2002, 16, 221–234. [Google Scholar] [CrossRef]
  126. Jin, T.; Qu, L.; Liu, S.; Gao, J.; Wang, J.; Wang, F.; Zhang, P.; Bai, Z.; Xu, X. Chemical characteristics of particulate matter emitted from a heavy duty diesel engine and correlation among inorganic and PAH components. Fuel 2014, 116, 655–661. [Google Scholar] [CrossRef]
  127. Luo, C.-H.; Lee, W.-M.; Liaw, J.-J. Morphological and semi-quantitative characteristics of diesel soot agglomerates emitted from commercial vehicles and a dynamometer. J. Environ. Sci. 2009, 21, 452–457. [Google Scholar] [CrossRef] [PubMed]
  128. Janosik, S.M. Background Information on Black Carbon Emissions from Large Marine and Stationary Diesel En-gines-Definition, Measurement Method, Emission Factors and Abatement Technologies. Int. Counc. Combust. Engines 2005, 42, 1. [Google Scholar]
  129. Crua, C. Laser-induced incandescence study of diesel soot formation in a rapid compression machine at elevated pressures. Combust. Flame 2003, 135, 475–488. [Google Scholar] [CrossRef]
  130. Dreier, T.; Bougie, B.; Dam, N.; Gerber, T. Modeling of time-resolved laser-induced incandescence transients for particle sizing in high-pressure spray combustion environments: A comparative study. Appl. Phys. B 2006, 83, 403–411. [Google Scholar] [CrossRef]
  131. Ryser, R.; Gerber, T.; Dreier, T. Soot particle sizing during high-pressure Diesel spray combustion via time-resolved laser-induced incandescence. Combust. Flame 2009, 156, 120–129. [Google Scholar] [CrossRef]
  132. Bougie, B.; Ganippa, L.C.; van Vliet, A.P.; Meerts, W.L.; Dam, N.J.; ter Meulen, J.J. Laser-induced incandescence particle size measurements in a heavy-duty diesel engine. Combust. Flame 2006, 145, 635–637. [Google Scholar] [CrossRef]
  133. Bougie, B.; Ganippa, L.C.; van Vliet, A.P.; Meerts, W.L.; Dam, N.J.; ter Meulen, J.J. Soot particulate size characterization in a heavy-duty diesel engine for different engine loads by laser-induced incandescence. Proc. Combust. Inst. 2007, 31, 685–691. [Google Scholar] [CrossRef]
  134. Schwarz, J.P.; Spackman, J.R.; Fahey, D.W.; Gao, R.S.; Lohmann, U.; Stier, P. Coatings and their enhancement of black carbon light absorption in the tropical atmosphere. J. Geophys. Res. 2008, 113, 223–245. [Google Scholar] [CrossRef]
  135. Moteki, N.; Kondo, Y. Dependence of Laser-Induced Incandescence on Physical Properties of Black Carbon Aerosols: Measurements and Theoretical Interpretation. Aerosol Sci. Technol. 2010, 44, 663–675. [Google Scholar] [CrossRef]
  136. Laborde, M.; Schnaiter, M.; Linke, C.; Saathoff, H.; Naumann, K.-H.; Möhler, O. Single Particle Soot Photometer intercomparison at the AIDA chamber. Atmos. Meas. Tech. 2012, 5, 3077–3097. [Google Scholar] [CrossRef]
  137. Petzold, A.; Hasselbach, J.; Lauer, P.; Baumann, R.; Franke, K.; Gurk, C. Experimental studies on particle emissions from cruising ship, their characteristic properties, transformation and atmospheric lifetime in the marine boundary layer. Atmos. Chem. Phys. 2008, 8, 2387–2403. [Google Scholar] [CrossRef]
  138. Chow, J.C.; Watson, J.G.; Crow, D.; Lowenthal, D.H.; Merrifield, T. Comparison of IMPROVE and NIOSH Carbon Measurements. Aerosol Sci. Technol. 2001, 34, 23–34. [Google Scholar] [CrossRef]
  139. Chow, J.C.; Watson, J.G.; Chen, L.-W.A.; Arnott, W.P.; Moosmüller, H.; Fung, K. Equivalence of Elemental Carbon by Thermal/Optical Reflectance and Transmittance with Different Temperature Protocols. Environ. Sci. Technol. 2004, 38, 4414–4422. [Google Scholar] [CrossRef] [PubMed]
  140. Modest, M.F. Radiative Heat Transfer, 2nd ed.; Academic Press: Boston, MA, USA, 2003. [Google Scholar]
  141. Kevin, A.T.; Matthew, R.J.; David, R.S.; Gregory, J.S. Diffuse-light two-dimensional line-of-sight attenuation for soot concentration measurements. Appl. Opt. 2008, 47, 694–703. [Google Scholar]
  142. Karataş, A.E.; Gülder, Ö.L. Soot formation in high pressure laminar diffusion flames. Prog. Energy Combust. Sci. 2012, 38, 818–845. [Google Scholar] [CrossRef]
  143. Zhang, X.; Li, T.; Ma, P.; Wang, B. Spray Combustion Characteristics and Soot Emission Reduction of Hydrous Ethanol Diesel Emulsion Fuel Using Color-Ratio Pyrometry. Energies 2017, 10, 2062. [Google Scholar] [CrossRef]
  144. Hitzenberger, R.; Petzold, A.; Bauer, H.; Ctyroky, P.; Pouresmaeil, P.; Laskus, L. Intercomparison of Thermal and Optical Measurement Methods for Elemental Carbon and Black Carbon at an Urban Location. Environ. Sci. Technol. 2006, 40, 6377–6383. [Google Scholar] [CrossRef]
  145. Köylü, Ü.Ö. Quantitative analysis of in situ optical diagnostics for inferring particle/aggregate parameters in flames: Implications for soot surface growth and total emissivity. Combust. Flame 1997, 109, 488–500. [Google Scholar] [CrossRef]
  146. Knox, A.; Evans, G.J.; Brook, J.R.; Yao, X.; Jeong, C.-H.; Godri, K.J. Mass Absorption Cross-Section of Ambient Black Carbon Aerosol in Relation to Chemical Age. Aerosol Sci. Technol. 2009, 43, 522–532. [Google Scholar] [CrossRef]
  147. Kondo, Y.; Sahu, L.; Kuwata, M.; Miyazaki, Y.; Takegawa, N.; Moteki, N. Stabilization of the Mass Absorption Cross Section of Black Carbon for Filter-Based Absorption Photometry by the use of a Heated Inlet. Aerosol Sci. Technol. 2009, 43, 741–756. [Google Scholar] [CrossRef]
  148. Subramanian, R.; Khlystov, A.Y.; Robinson, A.L. Effect of Peak Inert-Mode Temperature on Elemental Carbon Measured Using Thermal-Optical Analysis. Aerosol Sci. Technol. 2006, 40, 763–780. [Google Scholar] [CrossRef]
  149. Schmid, H. Results of the “carbon conference” international aerosol carbon round robin test stage I. Atmos. Environ. 2001, 35, 2111–2121. [Google Scholar] [CrossRef]
  150. Novakov, T.; Corrigan, C.E. Thermal characterization of biomass smoke particles. Mikrochim. Acta 1995, 119, 157–166. [Google Scholar] [CrossRef]
  151. Petzold, A.; Lauer, P.; Fritsche, U.; Hasselbach, J.; Lichtenstern, M.; Schlager, H. Operation of Marine Diesel Engines on Biogenic Fuels: Modification of Emissions and Resulting Climate Effects. Environ. Sci. Technol. 2011, 45, 10394–10400. [Google Scholar] [CrossRef]
  152. Cai, M.; Guo, R.; Zhou, F.; Liu, W. Lubricating a bright future: Lubrication contribution to energy saving and low carbon emission. Sci. China Technol. Sci. 2013, 56, 2888–2913. [Google Scholar] [CrossRef]
  153. Huang, C.; Hu, Q.; Wang, H.; Qiao, L.; Jing, S.; Wang, H. Emission factors of particulate and gaseous compounds from a large cargo vessel operated under real-world conditions. Environ. Pollut. 2018, 242, 667–674. [Google Scholar] [CrossRef]
  154. Mueller, L.; Jakobi, G.; Czech, H.; Stengel, B.; Orasche, J.; Arteaga-Salas, J.M. Characteristics and temporal evolution of particulate emissions from a ship diesel engine. Appl. Energy 2015, 155, 204–217. [Google Scholar] [CrossRef]
  155. Zhou, S.; Zhou, J.; Zhu, Y. Chemical composition and size distribution of particulate matters from marine diesel engines with different fuel oils. Fuel 2019, 235, 972–983. [Google Scholar] [CrossRef]
  156. Zetterdahl, M.; Moldanová, J.; Pei, X.; Pathak, R.K.; Demirdjian, B. Impact of the 0.1% fuel sulfur content limit in SECA on particle and gaseous emissions from marine vessels. Atmos. Environ. 2016, 145, 338–345. [Google Scholar] [CrossRef]
  157. CIMAC WG05. Background Information on Black Carbon Emissions. Wwwcimaccom. 2013. Available online: https://www.cimac.com/publications/publications350/cimac-wg05-background-information-on-black-carbon-emissions.html (accessed on 20 August 2022).
  158. Ristimaki, J.; Hellen, G.; Lappi, M. Chemical and physical characterization of exhaust particulate matter from a marine medium speed diesel engine. In Proceedings of the 26th CIMAC World Congress on Combustion Engines, Bergen, Norway, 14–17 June 2010; Volume 73, pp. 11–32. Available online: https://cris.vtt.fi/en/publications/chemical-and-physical-characterization-of-exhaust-particulate-mat (accessed on 16 December 2023).
  159. Wu, G.; Jiang, G.; Yang, Z.; Huang, Z. Emission Characteristics for Waste Cooking Oil Biodiesel Blend in a Marine Diesel Propulsion Engine. Pol. J. Environ. Stud. 2019, 28, 2911–2921. [Google Scholar] [CrossRef] [PubMed]
  160. Kim, S.-A.; Wang, W.-G. A study on exhaust emission characteristics according to operating conditions and butanol blended fuels in a small diesel engine for fishing vessel. J. Korean Soc. Fish. Technol. 2021, 57, 256–263. [Google Scholar] [CrossRef]
  161. Brynolf, S.; Fridell, E.; Andersson, K. Environmental assessment of marine fuels: Liquefied natural gas, liquefied biogas, methanol and bio-methanol. J. Clean. Prod. 2014, 74, 86–95. [Google Scholar] [CrossRef]
  162. Cheenkachorn, K.; Poompipatpong, C.; Ho, C.G. Performance and emissions of a heavy-duty diesel engine fuelled with diesel and LNG (liquid natural gas). Energy 2013, 53, 52–57. [Google Scholar] [CrossRef]
  163. Abdelaal, M.M.; Hegab, A.H. Combustion and emission characteristics of a natural gas-fueled diesel engine with EGR. Energy Convers. Manag. 2012, 64, 301–312. [Google Scholar] [CrossRef]
  164. Wartsila. Marine Market Emissions Reduced with New Wärtsilä 31SG Pure Gas Engine. Wartsilacom. 2021. Available online: https://www.wartsila.com/media/news/17-09-2019-marine-market-emissions-reduced-with-new-wartsila-31sg-pure-gas-engine-2528265 (accessed on 20 August 2022).
  165. Kamimoto, T.; Yokota, H.; Kobayashi, H. Effect of High Pressure Injection on Soot Formation Processes in a Rapid Compression Machine to Simulate Diesel Flames. SAE Technical Paper Series. SAE Tech. Paper 871610 1987, 96, 783–791. [Google Scholar] [CrossRef]
  166. İçıngür, Y.; Altiparmak, D. Effect of fuel cetane number and injection pressure on a DI Diesel engine performance and emissions. Energy Convers. Manag. 2003, 44, 389–397. [Google Scholar] [CrossRef]
  167. Wang, X.; Huang, Z.; Zhang, W.; Kuti, O.A.; Nishida, K. Effects of ultra-high injection pressure and micro-hole nozzle on flame structure and soot formation of impinging diesel spray. Appl. Energy 2011, 88, 1620–1628. [Google Scholar] [CrossRef]
  168. Çelıkten, İ. An experimental investigation of the effect of the injection pressure on engine performance and exhaust emission in indirect injection diesel engines. Appl. Therm. Eng. 2003, 23, 2051–2060. [Google Scholar] [CrossRef]
  169. Merker, G.P.; Delebinski, T. Injection rate shaping for diesel engines assisted by optical measurement systems. MTZ Worldw. 2007, 68, 22–25. [Google Scholar] [CrossRef]
  170. Huang, G.; Li, Z.; Zhao, W.; Zhang, Y.; Li, J.; He, Z. Effects of fuel injection strategies on combustion and emissions of intelligent charge compression ignition (ICCI) mode fueled with methanol and biodiesel. Fuel 2020, 274, 117851. [Google Scholar] [CrossRef]
  171. Desantes, J.M.; Benajes, J.; Molina, S.; González, C.A. The modification of the fuel injection rate in heavy-duty diesel engines. Part 1: Effects on engine performance and emissions. Appl. Therm. Eng. 2004, 24, 2701–2714. [Google Scholar] [CrossRef]
  172. Shundoh, S.; Komori, M.; Tsujimura, K.; Kobayashi, S. NOx Reduction from Diesel Combustion Using Pilot Injection with High Pressure Fuel Injection; SAE Technical Paper Series. SAE Tech. Paper 920461 1992, 12, 222–232. [Google Scholar] [CrossRef]
  173. Wu, G.; Zhou, X.; Li, T. Temporal Evolution of Split-Injected Fuel Spray at Elevated Chamber Pressures. Energies 2019, 12, 4284. [Google Scholar] [CrossRef]
  174. Li, T.; Ogawa, H. Analysis of the Trade-off between Soot and Nitrogen Oxides in Diesel-Like Combustion by Chemical Kinetic Calculation. SAE Int. J. Engines 2011, 5, 94–101. [Google Scholar] [CrossRef]
  175. Nishida, O.; Mukōhara, S. Characteristics of soot formation and decomposition in turbulent diffusion flames. Combust. Flame 1982, 47, 269–279. [Google Scholar] [CrossRef]
  176. Glassman, I. Soot formation in combustion processes. Symp. (Int.) Combust. 1989, 22, 295–311. [Google Scholar] [CrossRef]
  177. Sato, T.; Shirabe, N.; Anezaki, Y.; Okamoto, A. Spatial Distribution of Droplet Diameter of Wall-Impinging-Spray for Direct Injection Gasoline Engines. SAE Tech. Pap. 2003, 112, 246–254. [Google Scholar] [CrossRef]
  178. Böhm, H.; Hesse, D.; Jander, H.; Lüers, B.; Pietscher, J.; Wagner, H.G.G. The influence of pressure and temperature on soot formation in premixed flames. Symp. (Int.) Combust. 1989, 22, 403–411. [Google Scholar] [CrossRef]
  179. Flower, W.L. An investigation of soot formation in axisymmetric turbulent diffusion flames at elevated pressure. Symp. (Int.) Combust. 1989, 22, 425–435. [Google Scholar] [CrossRef]
  180. Flower, W.L.; Bowman, C.T. Soot production in axisymmetric laminar diffusion flames at pressures from one to ten atmospheres. Symp. (Int.) Combust. 1988, 21, 1115–1124. [Google Scholar] [CrossRef]
  181. Inaba, K.; Ojima, Y.; Masuko, Y.; Kobashi, Y.; Shibata, G.; Ogawa, H. Thermal efficiency improvement with super-charging and cooled exhaust gas recirculation in semi-premixed diesel combustion with a twin peak shaped heat release. Int. J. Engine Res. 2019, 20, 80–91. [Google Scholar] [CrossRef]
  182. Li, T.; Suzuki, M.; Shudo, T.; Ogawa, H. Characteristics of Nano-Particulate Matter from ultra-high EGR low temperature diesel combustion. JSME Trans. (B) 2008, 74, 207–212. [Google Scholar] [CrossRef]
  183. Kang, G.; Li, L.; Wang, W.; Dan, Y. Study of a polyaniline/polypropylene collecting electrode and its particle removal efficiency. RSC Adv. 2016, 6, 75038–75044. [Google Scholar] [CrossRef]
Figure 1. Development of air quality standards and regulations over the past decades.
Atmosphere 15 00022 g001
Figure 2. Sketch of simplified formation mechanism from liquid fuel.
Atmosphere 15 00022 g002
Figure 3. Conceptual model of diesel spray combustion. Figure has been reorganized according to Ref. [48].
Atmosphere 15 00022 g003
Figure 4. Typical two-dimensional morphological result of BC particle agglomeratesa (a); Parameters schematic of microscopic agglomerates (b).
Atmosphere 15 00022 g004
Figure 5. Nanostructure parameters from HRTEM.
Atmosphere 15 00022 g005
Figure 6. 2D diagram of Core-Shell structure (a); 3D diagram of Core-Shell structure (b) [70].
Atmosphere 15 00022 g006
Figure 7. Aliphatic C–H groups content related to combustion stage of diesel engine [91].
Atmosphere 15 00022 g007
Figure 8. PMs of high-speed engines (a); PMs of low-speed engines (b). Data adapted from Refs. [70,105].
Atmosphere 15 00022 g008
Figure 9. Morphology (a); nanostructure (b); BC aggregates and elemental composition (c) [115].
Atmosphere 15 00022 g009
Figure 10. PMs sampling from a low-speed marine engine.
Atmosphere 15 00022 g010
Figure 11. Thermophoretic probing of soot particles in diesel spray flame [70].
Atmosphere 15 00022 g011
Figure 12. Lift shape and boot-length of injection rate shaping [171].
Atmosphere 15 00022 g012
Figure 13. Mechanism of soot reduction by split injection.
Atmosphere 15 00022 g013
Figure 14. Dependence of soot yield on ambient temperature in a diesel-like combustion flame (a); Soot and NOx formation region (b) [174,175].
Atmosphere 15 00022 g014
Figure 15. Dependence of particle diameter (d), number density (N), and soot volume fraction (fv) on ambient pressure in asel-like combustion flame [174].
Atmosphere 15 00022 g015
Figure 16. Soot can be reduced by improving air entrainment and stoichiometry [181].
Atmosphere 15 00022 g016
Figure 17. Effects of the catalysts on characteristics of PMs emissions with large rates of cooled EGR [182].
Atmosphere 15 00022 g017
Figure 18. Polypropylene collecting electrode [183].
Atmosphere 15 00022 g018
Figure 19. Honey comb wall flow structure (a); catalytic diesel particulate filters (b).
Atmosphere 15 00022 g019
Table 1. Stage-II PMs emission limits of China marine engines regulation.
Engine TypeCylinder Volume/(L/cyl)Rated Power/(kW)PMs/(g/kW·h)
Category 1SV < 0.9p ≥ 370.30
0.9 ≤ SV < 1.20.14
1.2 ≤ SV < 50.12
Category 25 ≤ SV < 15p < 20000.14
2000 ≤ p < 37000.14
p ≥ 37000.27
15 ≤ SV < 20p < 20000.34
2000 ≤ p < 33000.50
p ≥ 33000.50
20 ≤ SV < 25p < 20000.27
p ≥ 20000.50
25 ≤ SV < 30p < 20000.27
p ≥ 20000.50
Table 2. Common BC measurement techniques and instruments.
TypeMethod DescriptionInstrument NameMeasuring Range
Light Absorption Coefficient
(LAC)
(eBC)
Filter measurement:
The light absorption of the particle pair is measured by the filter; the BC is quantified by the coefficient related to the mass concentration.
BC sensor (PAS/PSAP, AVL 483)0.001~150 mg/m3
Smoke meter (FSN, AVL 415SE)0~10 FSN
BC measuring instrument (Magee Scientific AE21 type)2.2~12.5 µg/m3
Photoacoustic counter measurement:
By heating particles, energy is transferred to the surrounding air, and sound waves are generated to measure the light absorption of the particle pair and quantify BC with coefficients related to light absorption and mass concentration.
Multi-angle absorber (MAAP, Thermo Scientific 5012 Type)0~180 µg/m3
Thermal Radiation (rBC)Measurement of Incandescent light:
Non-contact particle (luminescence) measurement; BC is quantified by comparing the incandescent signal with the standard laboratory BC particle signal.
Single particle photometer (SP2);100~800 nm
BC particle aerosol mass spectrum (SP-AMS)40~1 µm
Laser-induced incandescence (LII, Artium 300 Type)10~100 nm
Thermal-
Optical (EC)
Measurement of the thermal properties:
Refractory carbon component when heated to high temperatures; BC is quantified as the mass of carbon formed during heating.
Quartz fiber filter membrane/
Thermal properties and optical measurements:
Components of refractory carbon when heated to high temperatures and laser correction of carbonized carbon during analysis; BC is quantified as the mass of carbon formed during heating.
Quartz fiber filter membrane; TOA semi-continuous thermo-optic analyzer (TOA-ES, American Sunset Laboratory 5040 method)/
SootThermal properties and optical measurement, imaging observation of ECTransmission electron microscope TEM10 nm~10 µm
Table 3. Detailed measures to improve energy efficiency of ships.
ClassificationItem
Improve the design of ship structureOptimization design of propeller
Improvement of ship fluid mechanics and aerodynamics
Hull painting and cleaning
Power plant design
Optimization of ballast water and draught
Weight reduction
Alternative propulsion systems or energy recovery devicesWind energy propulsion
Solar energy propulsion
Hybrid energy storage
Waste heat recovery
Energy-saving operationsEconomic speed
Disclaimer/Publisher’s Note: The statements, opinions and data contained in all publications are solely those of the individual author(s) and contributor(s) and not of MDPI and/or the editor(s). MDPI and/or the editor(s) disclaim responsibility for any injury to people or property resulting from any ideas, methods, instructions or products referred to in the content.

