Article

Present and Future of Heavy Rain Events in the Sahel and West Africa

by
Inoussa Abdou Saley
1,* and
Seyni Salack
2
1
Faculté des Sciences et Techniques, Université Abdou Moumouni de Niamey, Niamey 10662, Niger
2
WASCAL Competence Center, Ouagadougou 06BP 9507, Burkina Faso
*
Author to whom correspondence should be addressed.
Atmosphere 2023, 14(6), 965; https://doi.org/10.3390/atmos14060965
Submission received: 1 March 2023 / Revised: 21 May 2023 / Accepted: 23 May 2023 / Published: 31 May 2023
(This article belongs to the Special Issue Precipitation in Africa)

Abstract

:
Gridding precipitation datasets for climate information services in the semi-arid regions of West Africa has some advantages due to the limited spatial coverage of rain gauges, the limited accessibility to in situ gauge data, and the important progress in earth observation and climate modelling systems. Can accurate information on the occurrence of heavy precipitation in this area be provided using gridded datasets? Furthermore, what about the future of heavy rain events (HRE) under the shared socioeconomic pathways (SSP) of the Inter-Sectoral Impact Model Intercomparison Project (i.e., SSP126 and SSP370)? To address these questions, daily precipitation records from 17 datasets, including satellite estimates, interpolated rain gauge data, reanalysis, merged products, a regional climate model, and global circulation models, are examined and compared to quality-controlled in situ data from 69 rain gauges evenly distributed across West Africa’s semi-arid region. The results show a consensus increase in the occurrence of HRE, between observational and gridded data. All datasets showed three categories of HRE every season, but these categories had lower intensities and an overstated frequency of occurrence in gridded datasets compared to in situ rain gauge data. Eight out of 17 databases (~47%) show significant positive trends and only one showed a significant negative trend, indicating an increase in HRE for all categories in this region. The future evolution of HRE considered under the shared socioeconomic pathways SSP1-2.6 and SSP3-7.0, showed a trend toward the intensification of these events. In fact, the mean of the ensemble of the models showed significant changes toward higher values in the probability distribution function of the future HRE in West Africa, which may likely trigger more floods and landslides in the region. The use of gridded data sets can provide accurate information on the occurrence of heavy precipitation in the West African Sahel. However, it is important to consider the representation of heavy rain events in each data set when monitoring extreme precipitation, although in situ gauge records are preferred to define extreme rainfall locally.

1. Introduction

With a deplorable and sparse observation network, the availability of high-resolution and high-quality observation data remains a significant challenge for the scientific community and users in the semiarid regions of West Africa, here called the Sudan-Savanah/Sahel (WASS). Recent studies reported that near-surface networks of manual stations have substantially deteriorated and still exhibit functionally obsolete, damaged, and uncalibrated instruments [1]. However, the available high-quality observation data are not freely accessible and are often restricted, even for the scientific community [2,3]. On the other hand, the observation and monitoring component of the Global Framework for Climate Services (GFCS) constitutes one of the foundational pillars upon which the success of this framework will rest [4]. Thus, observational data are essential to provide accurate climate information and services by monitoring hydroclimate extremes; evaluating the impact of hydroclimate events; conducting climate change, trend, and variability analysis, and evaluating climate models [5,6]. However, inaccessibility of some remote areas, limited spatial coverage of rain gauges, and advances in earth observation systems favor the increased use of gridded precipitation datasets to provide hydroclimate information and services, particularly over WASS.
Several grid precipitation datasets have been developed and widely used for hydroclimate monitoring and evaluation [7,8,9,10]. They include, but are not limited to, reanalysis data, satellite and remote sensing-based data, merged products, and interpolated gauges’ data. Several studies, around the world and specifically in Africa, have reported uncertainties related to most of these gridded precipitation data [11,12,13]. The uncertainties are mainly related to the data resolution, gridding/interpolation techniques, the density of observation stations (in situ), the quality of the data of origin (raw data), and instrumental errors. These sources of uncertainty can also play an essential role in the reliability and accuracy of gridded products, mainly in representing high impact hydroclimate events that, in turn, can affect the reliability and precision of the information and climate services provided [13,14,15,16]. There is a well-established sensitivity of gridded products specific to moderate and extreme rainfall [16], as well as to wet and dry spells [17,18,19]. In addition, despite studies carried out in West Africa and the Sahel, the Intergovernmental Panel on Climate Change (IPCC) reports that, in West Africa, the observed change in heavy precipitation is tainted with uncertainty due to limited data and literature [20]. This study aims to contribute to a better understanding of the distribution and evolution of intense rainfall by using various historical and future grid databases. Hence, we are tempted to ask the following question, “Are gridded datasets reliable for monitoring heavy rain events over the West African Sahel region?”.
Some of the most used gridded datasets, that are also used in this study, are climate model output datasets. These outputs are products with high or coarse resolution (regional and global models, respectively) and are used for past and future hydroclimate analyses [21,22]. For future periods, model outputs constitute the best databases available to produce climate information in a region that can be useful to communities. The future of rainfall and rainfall extremes in the Sahel region remains a mystery, as recent variabilities are very pronounced [23,24] and future projections seem uncertain [25,26,27]. Hence, the challenges related to the frequency and intensity of HRE in the Sahel are of vital importance for agriculture, energy, and human security, especially in the context of the upsurge in flood phenomena. Results were obtained for intense rainfall events, which indicate a significant increase in the intensity of extreme rainfall events [27,28]. Other results in the Philippines predicted that relative increases in annual maximum daily precipitation from the past to the year 2100 will be approximately 8.5% in the SSP2-4.5, 11.6% in the SSP3-7.0, and 17% in the SSP5-8.5 scenarios, respectively [29]. The increase in annual maximums of daily rainfall can be more attributable to stronger storm intensities (80%) than to more frequent storm (20%) occurrences [30]. This study is motivated by the growing need for climate information and climate services to develop and use gridded products in monitoring and early warning systems, planning, and investment guides against pluviometric extremes [11,19,21,31,32]. The aim of this article is to evaluate the reliability and precision of 17 gridded data sets to represent heavy rain events (HRE) in the western African portion of Sahel and suggest a customized investigation of the future of HRE under shared socioeconomic pathways (SSP) of the Inter-Sectoral Impact Model Intercomparison Project (i.e., SSP1-2.6 and SSP3-7.0). Section 2 describes the datasets used in this study and gives details about the data extraction, and the detection approaches of HRE in the gridded database. Section 3 gives the main results, and the future diagnostics of HRE, followed by discussion and conclusion in Section 4, respectively.

2. Data and Methods

2.1. Data

2.1.1. In-Situ Rain Gauge Records

Since the beginning of meteorological data records, in situ observations constitute the most comprehensive and high-quality data used in hydroclimate related sciences and applications [2]. Rain gauges are used to measure precipitation at a given point and remain the standard and relatively accurate information source for hydroclimatic investigations, despite the limitation of their spatial coverage and density throughout the world [2,13,33]. This study uses rain gauge precipitation data as reference data to assess how gridded data represent HRE in semi-arid West Africa. These in situ rainfall data are from observation networks of sixty-nine stations in the region. The data set consists of historical daily accumulated rainfall recorded by standard and tipping bucket gauges spread over the Sahel and covering 1960 to 2016 (Figure 1). This dataset is quality checked and used extensively for different research purposes [1,34,35]. It was made available through a strong collaboration between the West African Science Service Center on Climate Change and Adapted Land Use (WASCAL, www.wascal.org) and the National Meteorological and Hydrological Services (NMHS) of the member countries, as described by Salack et al. [3].
The semiarid subregion of West Africa known as the Sahel is characterized by a long dry season followed by a unique rainy season that starts in May–June and peaks in August–September. The spatial distribution of the total annual rainfall decreases northward from ∼1200 mm to 200 mm [36]. Most rainfed cereals and a few tubers are grown in this zone. The regional atmospheric circulation features that influence the seasonal rainfall patterns include the latitudinal movement of the intertropical convergence zone (ITCZ), the Saharan heat low (SHL), the variability of lower-to-upper-tropospheric factors such as the African Easterly Jet (AEJ), the Tropical Easterly Jet (TEJ), the African easterly waves, and other low-level westerly jets. The global oceans also play a significant role in modulating rainfall changes of the past climate signal. At the same time, greenhouse gases are the main factors explaining the future climate patterns of the region [37]. Other natural factors that affect the intra-seasonal variability of the rainfall regime in the Sahel include local forcing of the Saharan dry air masses, dust, and pollution aerosols [38].
Previously, Salack et al. [34] discussed some aspects of spatial and temporal variability of observed heavy rain events over the Sahel. These showed an increasing trend of HRE, the recent years’ features being like the early 1960s. It appears that the northern Sahel stations are highly exposed to category 1 rainfall types with specifically higher potential exposure of eastern and western corners of the subregion. The southern parts are more likely to be exposed to category 2 of HRE types at a quasi-equal percentage probability of occurrence as category 3 in the southern and western subregions. Category 2 may occur everywhere in the Sahel with equal probability of occurrence, but its timing is different from one location to another.

2.1.2. Gridded Data

Daily rainfall data were recovered from 17 gridded databases with relatively long-term records, including reanalysis, satellite estimates, interpolated rain gauge data, merged products, a regional climate model, and global circulation models (Table 1). The reanalysis data are from the National Center for Environmental Prediction (NCEP version 2; [39]), ERA-Interim reanalysis (ERAI [7]) and ERA version 5 (ERA5 [40]) of the European Center for Medium-Range Weather Forecasts (ECMWF). Reanalysis data are constructed from the assimilation of available information, including observations, satellites, and airplanes, among other data. They use a numerical weather prediction (NWP) model to estimate the state of the earth system [41]. Depending on the type of reanalysis and the development center, observed data sources are somehow different, and model configurations lead to some discrepancies in the simulated precipitation between the reanalysis products [42,43]. Two additional datasets derived from reanalysis data were also used, namely the WATCH Forcing Data methodology applied to ERA-Interim data (WFDEI; [9]) and the Merged and Bias-corrected EartH2Observe, WFDEI and ERA-Interim data for ISIMIP (EWEMBI [10]). The WFDEI data are generated using the number of wet days from the Climate Research Unit data (CRU TS3.1; [8]), the monthly precipitation totals from the Global Precipitation Climatology Center product (GPCCv5/v6; [44]), the ERA-Interim rainfall/precipitation ratio and rainfall gauge correction [9]. EWEMBI data cover the entire world and use data sources from the ERA interim reanalysis, WFDEI, EartH2Observe, and NASA/GeWEX surface radiation budget [10].
Two near-surface gauge-derived datasets were also used. The Full Data Daily Product V2018 is the last daily global land surface precipitation developed by the Global Precipitation Climatology Center (GPCC) from 1982 to 2016. It is based on more than 35,000 stations per month worldwide [44]. The GPCC product is based on precipitation data provided by the National Meteorological and Hydrological Services, the regional and global data collections of the World Meteorological Organization (WMO) through the Global Telecommunication System (GTS). Another data set derived from the Climate Prediction Center (CPC), which develops a unified data set-based analysis of global land daily precipitation using fewer stations (i.e., 17,000–30,000 stations) than the GPCC product.
The satellite data sets used in this study are from Tropical Applications of Meteorology using satellite and ground-based observations (TAMSAT version 3 [6]), Climate Hazards Infrared Precipitation with Stations version 2 (CHIRPS [45]) and African Rainfall Climatology version 2 (ARC2 [46]). The estimated rainfall data are derived from thermal infra-red (TIR) imagery and cold cloud duration (CCD) with calibration from ground observations for TAMSAT and ARC2. However, CHIRPS uses ground observations and the Tropical Rainfall Measuring Mission Multi-Satellite Precipitation Analysis version 7 (TMPA 3B42 v7 [33]) to calibrate CCD rainfall estimates. Significant limitations of satellite data are mainly indirect measurements of rain events, satellite coverage (particularly for West Africa), and interpolation methods that can constitute potential error sources [13]. Indeed, Basheer and Elagib [46], compared five satellite and GPCC rainfall products with rain gauge observations over the Nile basin, and reported the best performance of GPCC data.
Finally, regional climate model (RCM) outputs are used from WASCAL high-resolution simulations based on the Weather Research and Forecasting (WRF) model. The simulations combine a control simulation, over 1979–2014, based on ERAI forcing data, with a horizontal resolution of 12 km [48]. This study uses the control simulations of the RCM to assess its performance in representing HRE. Additional detailed information on spatial resolution, domain setup, physical parameterizations, and boundary conditions is discussed in [48].

2.1.3. Downscaled and Bias-Corrected Scenarios

Global Circulation Models (GCMs) used for the study were downscaled and bias adjusted in the Inter-Sectoral Impact Model Intercomparison Project (ISIMIP3b). The bias adjustment method is described in Lange [10], and the basis for the bias adjustment in ISIMIP3b was the WATCH-ERA5 dataset (W5E5) [49]. The selection of these models was motivated by (i) structural independence in terms of their ocean and atmospheric model components, and (ii) process representation which was reported in an informal survey among experts to be fair (IPSL-CM6A-LR, MPI-ESM1-2-HR) and sound (GFDL-ESM4, MRI-ESM2-0, UKESM1-0-LL). Moreover, the selected GCMs represent the whole CMIP6 ensemble as they include three models with low climate sensitivity (GFDL-ESM4, MPI-ESM1-2-HR, MRI-ESM2-0) and two models with high climate sensitivity (IPSL-CM6A-LR, UKESM1-0-LL).
In this work, only the historical simulations were used for the performance assessment of the GCMs. Future projections focus on two different combination scenarios representing different shared socio-economic pathways (SSPs) and representative concentration paths (RCPs). The SSP1-RCP2.6 (SSP126), known as ‘the sustainability’ scenario (i.e., Taking the Green Road), describes a world marked by strong international cooperation, prioritizing sustainable development. The underlying assumption of the radiative forcing is based on RCP2.6. It is likely to keep global temperature rise below 2 °C with substantial change in land use (increased international forest cover), low emissions, and 445 ppm CO2 by 2100. RCP2.6 requires carbon dioxide (CO2) emissions to decline by 2020 and zero by 2100. The SSP3-RCP7.0 (SSP370), known as ‘the Regional Rivalry” (i.e., A Rocky Road), depicts a fragmented world affected by competition between countries, slow economic growth, policies oriented towards security and industrial production, and little concern for the environment. The underlying assumption of radiative forcing is based on RCP7.0 with substantial change in land use (decreased global forest cover), medium-high emissions, 871 ppm of CO2 in 2100. More combinations of SSP/RCP scenarios that provide narratives describing alternative socioeconomic developments can be found in Meinshausen et al. [50].

2.2. Methods

2.2.1. From Grid-Cell-to-Point Data Extractions

There are many differences in an objective performance assessment’s observations and gridded data. One of the significant differences is that the in situ observation data represents only the point of measurement, while the grid cell data cover a larger spatial area of the grid scale and are derived using numerical interpolation techniques [14,15,16]. Therefore, to limit the influence of this scale mismatch and reduce the uncertainties in our analyses, a direct method was applied based on the native resolution of each data set. We extracted their nearest-neighbor grid points for the 69 point measurements of the rain gauge stations in each data set (Figure 1). This approach has the advantage of preserving the intrinsic values of the rain rate estimated by each dataset and seems to be the best interpolation method [51]. The analysis was carried out over the most extended standard period of all datasets. Missing values are systematically removed from all the datasets (observation and gridded data). Outliers are examined in a case-by-case manner where values greater than 263 mm are discarded as this threshold represents the highest daily rainfall amount recorded in the past 60 in the region. The comparative analysis for seasonal rainfall amounts and the total number of rainy days (i.e., for RR ≥1 mm) very clearly shows good performance of the different datasets with relatively small standard deviations and significant correlations greater than 0.8 (Figure 2). The gauge-based and satellite-based gridded data sets have the best performance, with CHIRPS outperforming with total rainy days and total rainfall. It also appears that the reanalysis datasets (e.g., NCEP, ERAI) and their derivatives (e.g., EWEMBI, WRF-12) exhibit the lowest correlations with larger spreads (highest standard deviation and bias-corrected root mean square errors) that are more like the high variabilities reported by Sun et al. [13]. However, the ERA5 data set shows a significant improvement in representing all rainy days compared to ERAI (Figure 2). It is also noted that the horizontal resolution of the gridded data sets does not play a significant role in performance over the seasonal totals of both rainy days and rainfall amounts. Comparing the GCMs with each other, it appears that UKESM1 better represents the seasonal totals for rainy days and rainfall amounts with higher correlation and lower standard deviation and root mean square error.

2.2.2. Detection and Performance Assessment

  • Intensity
HRE is defined as the exceeding of a threshold that corresponds to the 99th percentile of daily rainfall amounts (i.e., all daily cumulative values ≥1 mm) that are observed in a season, from May to October, following the work done on station data by Salack et al. [34]. We considered all rainfall amounts and their corresponding extracted grid cell values for all in situ data points and their occurrence dates. Then, an unsupervised K-partition clustering algorithm was applied to identify the most dominant classes of daily intensity. As widely described in Salack et al. [34], the unsupervised clustering algorithm groups data based on the Euclidean distance between sample elements in order to find common patterns. The general procedure is to search for a K-partition with an optimal local sum of squares within the cluster by moving points from one cluster to another [52]. As we need to specify the number of clusters to be used to group the data, we computed the percent variance explained as a function of a possible number of clusters ranging from 2 to 15. The first two clusters explain the maximum, followed by the third, the fourth, and so on until the marginal gain drops, giving an angle in the scree plot. The number of clusters is chosen at this point of the scree plot called the “elbow”. Once the optimum number of clusters is chosen, cluster centroids are calculated iteratively by reassigning data points, ordered by their distances to the overall mean of the sample, until the within-cluster variation cannot be reduced any further. The variation within the cluster is calculated as the sum of the Euclidean distance between the data values and their respective cluster centroids, which correspond to the mean values assigned to each cluster [52]. For an explained variance exceeding 60%, all gridded datasets exhibited 03 dominant classes of different daily intensity (see Table 2). The scree plot shows the explained variance of the first 12 HRE classes found in each data set. The cumulative explained variance of the first three classes is 60–95% between data sets. These three classes are analyzed to identify the three most important categories of HRE intensities in the study area.
b.
Timing
How are seasonal HREs distributed in each dataset? To answer this question, dichotomous vectors of each category of HRE are generated using the gridded and in situ datasets. A given HRE category (among cat 1, 2 and 3) takes the value one when detected, and zero when not seen, in each dataset. In other words, zero is considered when the “no” HRE category is found, and one is for “yes” following detection. A two-entry contingency table is developed to compute performance indices for each gridded data set (as a test field) concerning in situ observations (as a reference field). From each contingency table, four indices are calculated, namely the probability of detection (POD) estimating the hit rate; the success ratio (SR) that gives the fraction of “yes” events correctly detected; the frequency bias (BIAS) and the critical success index (CSI) grouped into a single performance diagram [53]. The POD is the proportion of events correctly depicted in a given HRE category (POD varies from zero to one with POD = 1, meaning that the HRE category in a gridded database is like the in situ observation). The SR is one minus the false alarm rate (SR varies between zero and one; a category of HRE is ideally detected by a gridded data set relative to the in situ data set when SR = 1.). The BIAS is the ratio of the total HRE category in a gridded dataset and the number in the in-situ dataset (BIAS > 1 means an overestimation, and BIAS < 1 characterizes an underestimation). The Critical Success Index (CSI) is the number of events of a given HRE category in a gridded database detected by chance (CSI goes from zero for a poor detection to one for an excellent detection). All gridded datasets are evaluated relative to the in situ observations using the performance diagram.

3. Results

3.1. Are Gridded Datasets Reliable for Monitoring Heavy Rainfall?

Table 2 summarizes the main HRE categories found in each data set and their relative prevalence rate. The color code depicts the rate of most of these categories. Daily accumulated rains of category one, which has a confidence interval of 37 mm to 65 mm, and category two, which has a confidence interval of 65 mm to 85 mm, represent ~90% probability of occurrence in the Sahel compared to ~10% probability for category 3 (more than 85 mm/day). It appears that these 03 categories are also observed in situ, such as those found by Salack et al. [34].
The data sources and techniques used to generate rain events in each gridded database are different. The quantitative valuation of HRE is also different in terms of confidence intervals and centroids. For all the gridded data (except TAMSAT), category 1 has the highest probability of prevalence, followed by category two and category three, respectively (Table 2). The HRE intensities of the satellite-derived dataset ARC2, show the best agreement with the in situ observations. This is not the case with the very high resolution of the TAMSAT and CHIRPS datasets, which show significantly lower intensities of HRE for all three categories. From the group of gauge-based datasets, GPCC05 better represents in situ HRE intensities than GPCC1 and CPC. The ERAI and related datasets EWEMBI and WFDEI also exhibit weak HRE intensities, mainly for the first two categories. The WRF12, using initial conditions from ERAI has a more improved representation than ERAI itself and is closer to the in situ observations. The reanalysis data, NCEP and ERA5, also have better HRE intensity performance than ERAI.
The lower intensities of all HRE categories are usually caused by smoothing during interpolation, and higher precipitation values are significantly reduced in the data [17]. It is also essential to note that the native resolution of the gridded data is not affected, as shown by the slightly different results found between GPCC05 and GPCC1. Previously, Herold et al. [16] argued that moderate values are relatively insensitive to product, resolution choice, and region, while extremes can be very sensitive. In the GCMs datasets, the distribution of the three categories of HRE are like the results depicted by the reanalysis and adjusted reanalysis data sets (Table 2).
In the Sahel, the strong relationship and interplay between different climate characteristics, including natural factors (global oceans, the intertropical convergence zone (ITCZ), low Saharan heat (SHL), African and Tropical Easterly Jets (AEJ and TEJ), among others), and human-induced (global warming, aerosols re-greening activities, etc.) play an essential role in interannual to interdecadal variability, mainly for extreme events [21,23].
Figure 3 presents the performance diagram of each category of HRE for each dataset. The frequency BIAS is above unity for almost all the analyzed gridded datasets. Relative to in situ observations, all gridded datasets, except ARC2, overestimate the frequency of the HRE of category 1, more than was observed. However, previous work reported that gridding significantly increased the frequency of low-precipitation events, while greatly reducing the frequency of heavy precipitation events [17]. This difference can be related to the customized definition of HRE for each dataset. However, ARC2 underestimates the frequency of categories 2 and 3. For category 1 and 3, the gridded rain gauge data (e.g., GPCC05, GPCC1, CPC) and the satellite-based rainfall dataset, ARC2, show the higher POD (>0.4) and SR (≥0.2), showing an overestimation in the frequency BIAS. Category 2 shows lower levels, mainly for the same dataset (GPCC05, GPCC1, CPC and ARC2) as categories 1 and 3. Satellite-derived, reanalysis data and their derivatives (i.e., CHIRPS, TAMSAT, ERAI, ERA5, NCEP, WFDEI, EWEMBI and WRF12) show the lowest levels for each category.
Table 3 presents the trend, root mean square error (RMSE), mean bias error (MBE), and standard deviation (SD) of HRE thresholds for each dataset over the common period of 1983–2010. The statistical significance of the trends is evaluated according to the Mann Kendal test at a 95% confidence level. Observation data show a significant positive trend, meaning that the HREs are becoming more intense. This is in line with previous results found by Salack et al. [34] and Taylor et al. [54]. Like observations, the gridded datasets ERA5, EWEMBI, GPCC1, GPCC0.5, NCEP, TAMSAT, WFDEI, and WRF12 show significant positive trends. This represents around 47% of the analyzed gridded datasets. Only ERAI gives a significant negative trend which mismatches, both to observations and ERA5. Otherwise, all the gridded datasets underestimate the intensity of HRE and ARC2, CPC, GFDL, GPCC1, and GPCC05 have the lowest bias (Table 3). Across the reanalysis datasets (ERAI, ERA5, NCEP), ERA5 better represents the distribution of the observed HRE.

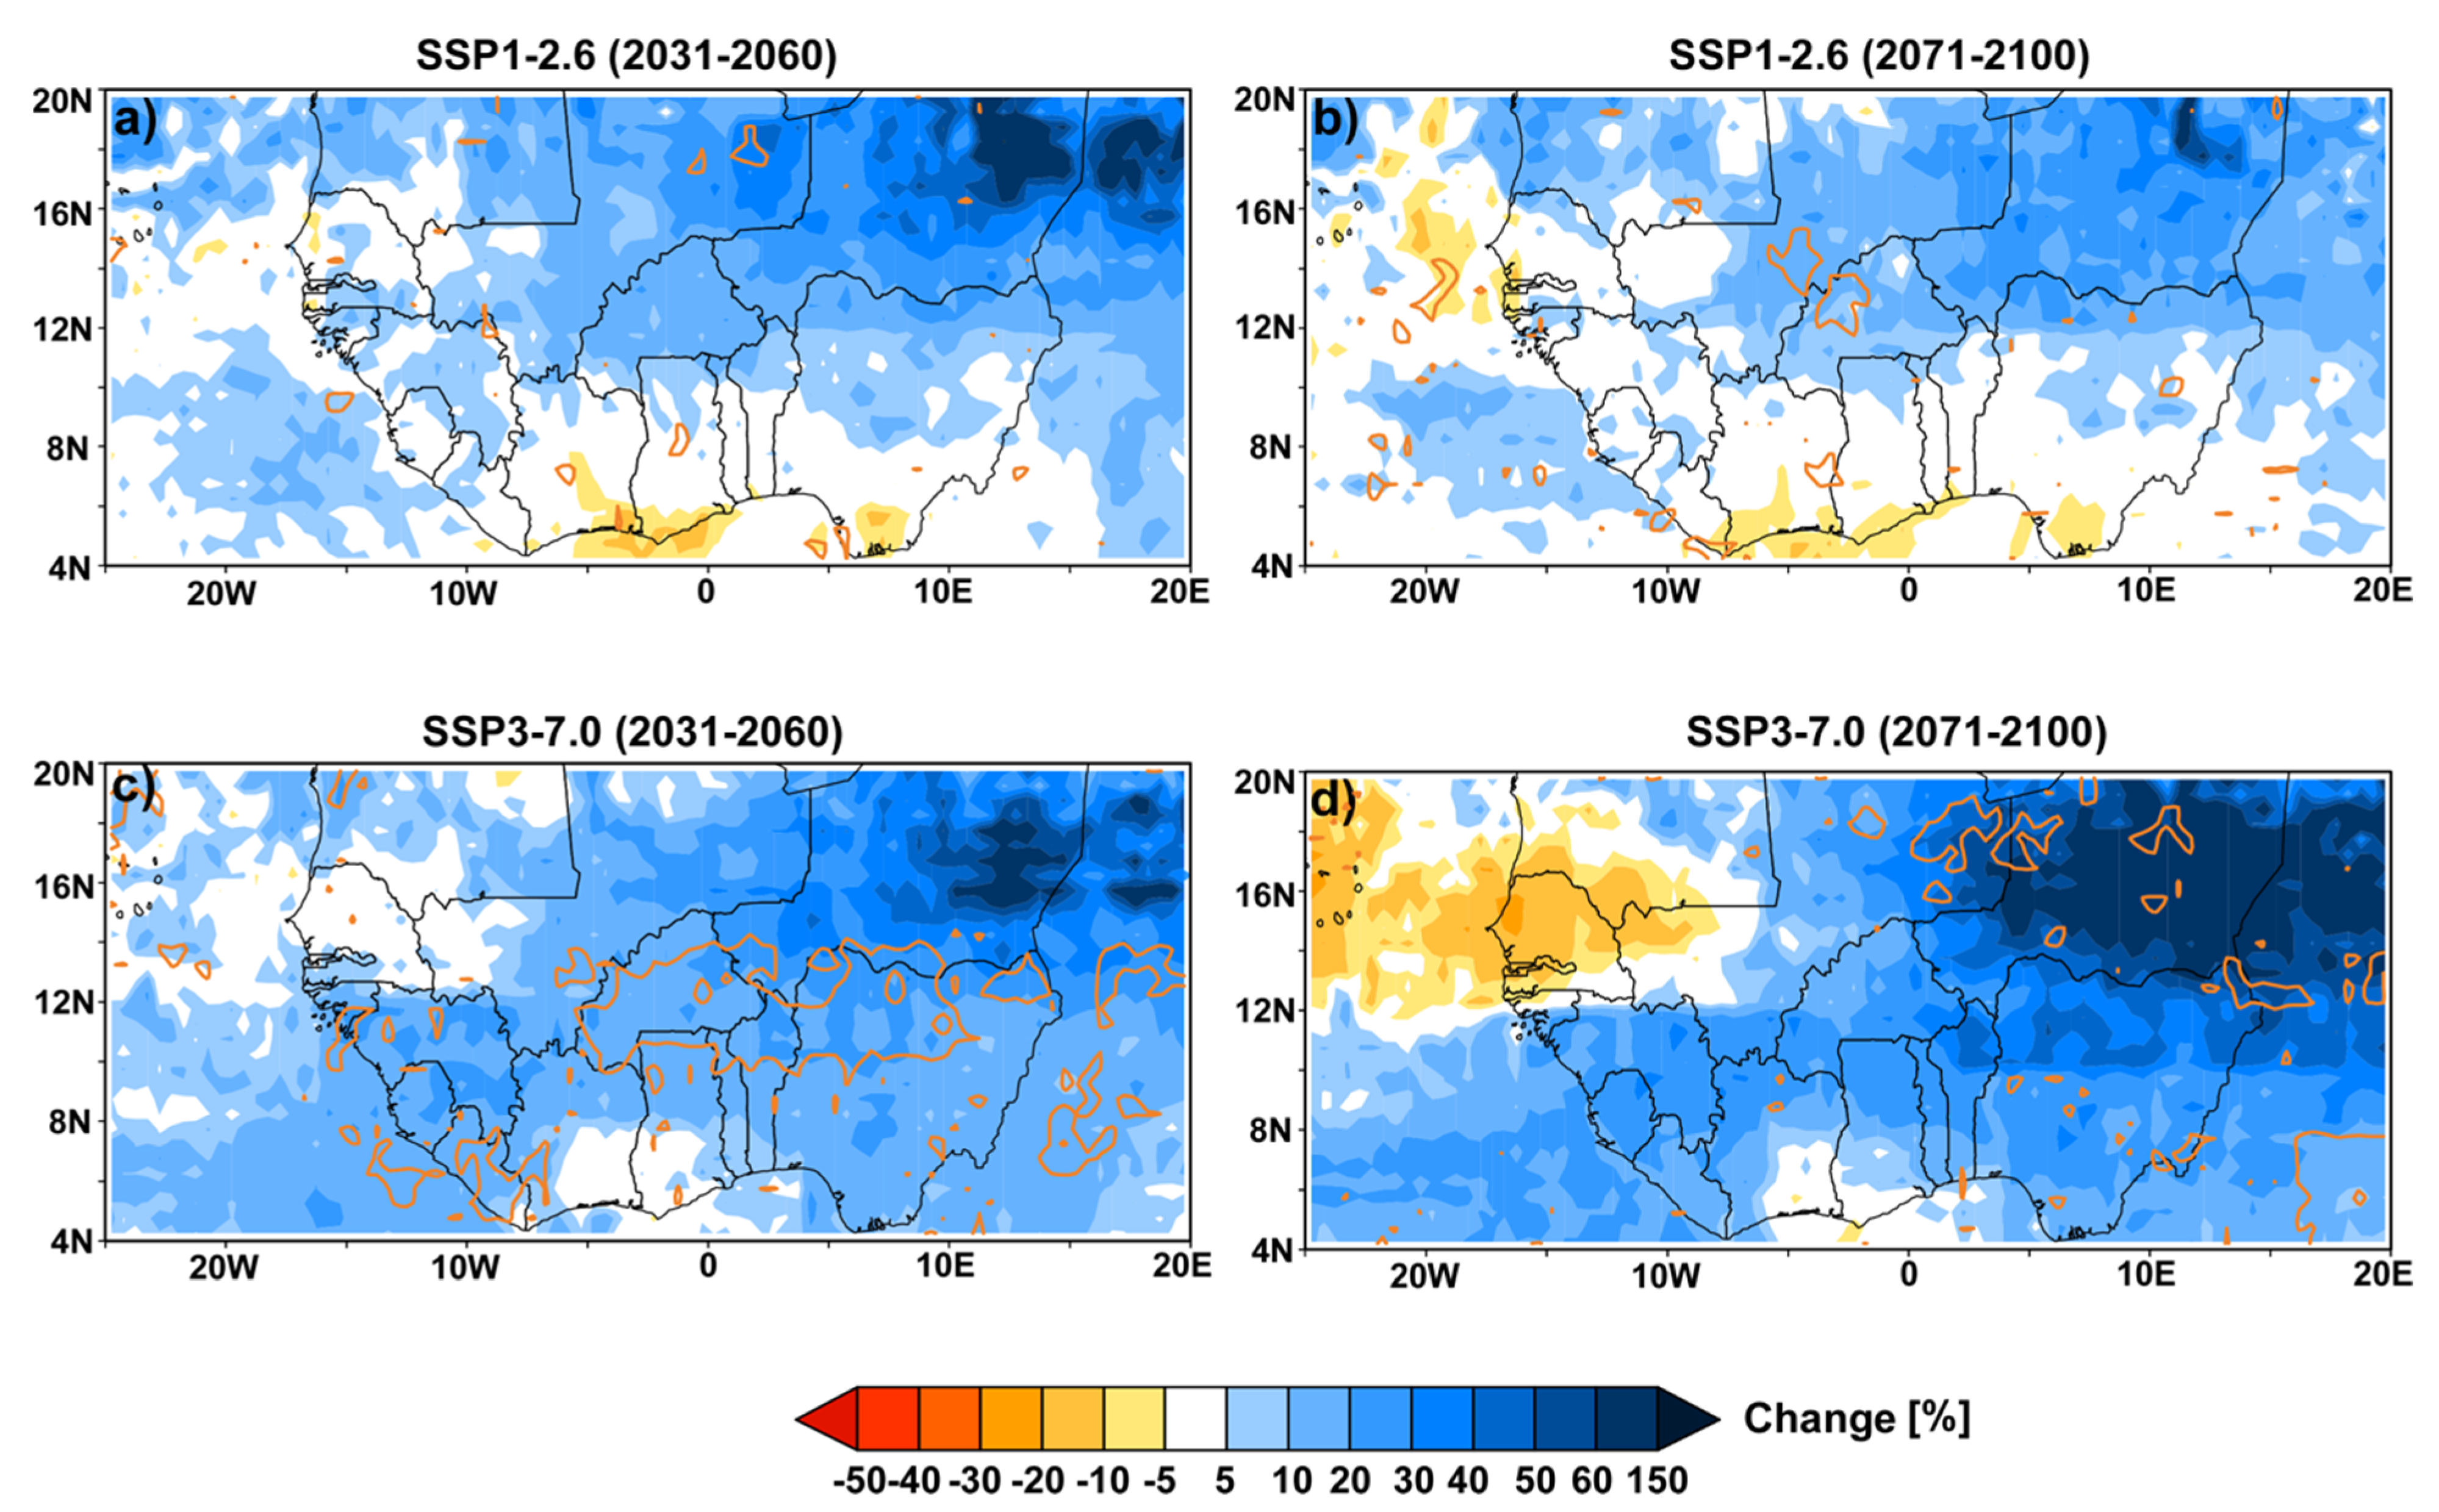
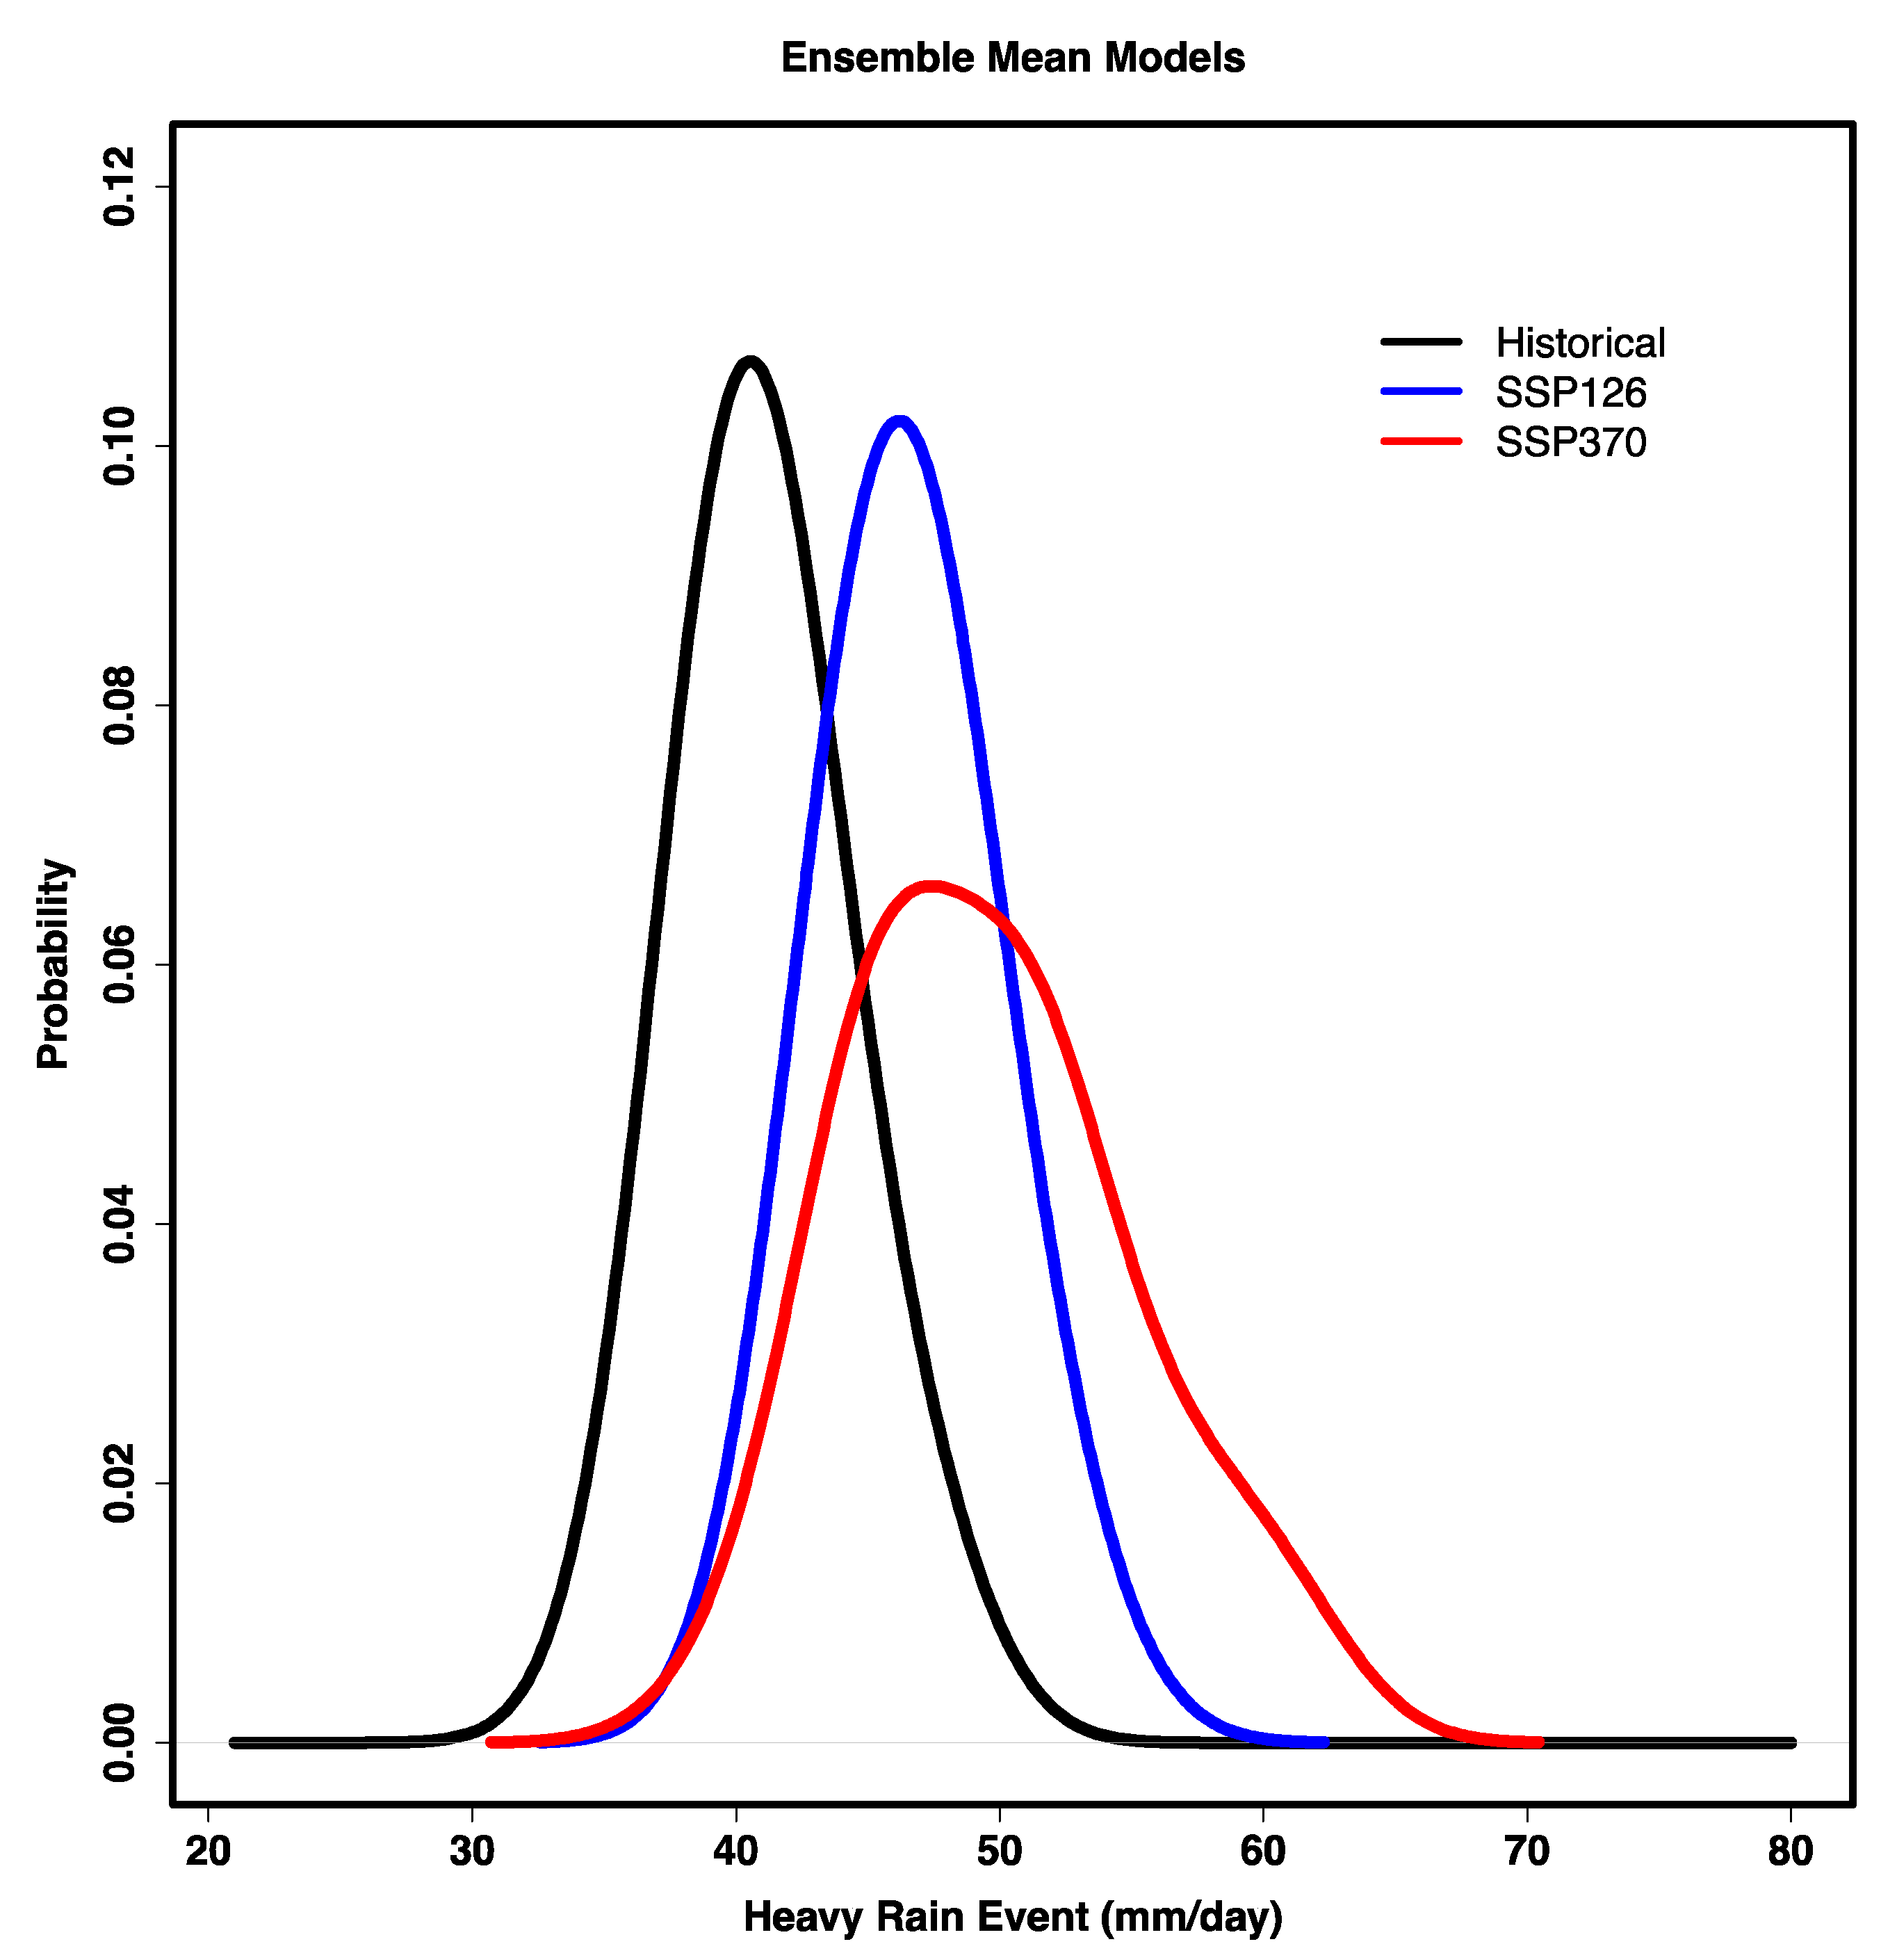
3.2. Projected Variability and Trend of Heavy Rain Events

Figure 4 shows the percentage changes for the intensity of heavy rain events in the SSP126 and SSP370 scenarios, respectively. It appears that statistically significant differences are projected in areas where average rainfall is expected to increase for the mid-term (2031–2060) and the long-term (2071–2100) in both SSP scenarios. This pattern is also observed in convection permitting simulations, which provide a more detailed representation of convective processes [55]. However, in the “rocky road” scenario (SSP370), a significant hotspot of HRE is depicted over the central Sudan/Sahel zone during the period 2031–2060. In 2071–2100, a decreasing trend of these events is more likely in the western subregions over most of Senegal–Gambia and western Mali, as identified in Figure 4 (upper panel). In addition, there is a potential change in the seasonality of the Sahelian rainy season, with a later onset and the potential for a mid-season break period at the end of the twenty-first century [56,57]. These projected changes in rainfall seasonality in Africa will result in detrimental socioeconomic impacts on livelihoods, due to high societal dependence on rainfall.
Figure 5 illustrates the interannual variability of the distribution of heavy rain events (HRE) during the period from 1951 to 2100. The data presented in the figure are derived from 69 stations located in the Sahel region and obtained from five Global Climate Models (GCMs). The ensemble mean of these models indicates an overall increase in heavy rain events for both the SSP1-2.6 and SSP3-7.0 scenarios, with a greater degree of variability towards the end of the century. Furthermore, the magnitude of the mean ensemble is higher for the SSP3-7.0 scenario, which represents the “Regional Rivalry” scenario. Notably, the ensemble mean models demonstrate a significant positive trend for the SSP3-7.0 scenario, suggesting a clear upward trend in heavy rain events. Conversely, the SSP1-2.6 scenario shows a quasi-equilibrium situation, implying a relatively stable pattern of heavy rain events.
When comparing the present and future distributions of HRE over the 69 extracted grid points of the Sahel region for both scenarios, it appears there is a tremendous change in terms of the shift in the distributions (Figure 6). The probability density functions in Figure 6 point toward a future climate with less frequent, but more intense rainfall, according to SSP3-7.0. This has the potential to increase floods, runoff [58], as well as the potential for crop losses due to flooding, waterlogging and other loss and damage of life and properties.

4. Discussion and Conclusions

Based on different types and sources of datasets, our investigation aims to contribute to a better understanding of the distribution and evolution of intense rainfall by using various historical and future gridded data sets. The result reveals that the different gridded data sets and in situ observations result in three dominant HRE intensity categories regardless of the database considered. This shows a certain consensus between the different databases in the representation of HRE in the Sahel, although the intensity levels differ from one database to another for the same category. For the provision of climate services, these results suggest that the definition of a heavy rain event must be determined relative to the gridded data set used. This approach can help NMHS use gridded data to monitor of heavy rain events.
Furthermore, in terms of observation data, eight of the seventeen databases (~47%) evaluated show significant positive trends and only one gives a significant negative trend. This consensus across the HRE trends agrees with previous studies which have shown that the frequency and intensity of intense rains have increased in recent decades, particularly in the Sahel [34,54,59]. This increase could be linked to several factors, including but not limited to the warming of the Sahara Desert and oceans [37,54,60], the regreening of the Sahel [21,59], and the increasing concentration of aerosols and greenhouse gases [61] in the atmosphere. In fact, Min et al. [62] argued that the human-induced increase in greenhouse gases contributed to the observed intensification of heavy precipitation events. However, according to the IPCC [20], there is low confidence in the human contribution to the observed change in heavy precipitation due to the lack of evidence in West Africa.
Despite the good performance of the gridded data, they do not reproduce both the intensity and the frequency of occurrence of the observed events. Only the GPCC05 database provides a good representation of both the intensity and frequency of HRE independent of the category considered. Previously, Basheer and Elagib [47] reported good performance of GPCCs in the Nile region. In conclusion, gridded data sets can provide reliable information on the occurrence of heavy precipitation in the semi-arid regions of West Africa. However, it is crucial to consider the representation of heavy rain events in each dataset when monitoring extreme precipitation. In situ gauge records are still the preferred method for defining extreme rainfall at the local level.
When we analyze the future evolution of HRE over all the stations considered, and under SSP1-2.6 and SSP3-7.0 scenarios, the ensemble mean of models shows a trend towards the intensification of these events. Furthermore, their probability distribution functions clearly show a shift of the mean towards greater intensity values. This confirms previous studies that pointed to a significant increase in the intensity of extreme rainfall events [27,28]. In fact, global warming should lead to the intensification of the hydrological cycle [62,63]. The Clausius–Clapeyron relationship shows that increasing the temperature would favor an increase in the intensity of rainfall [54,55,64]. Indeed, Fitzpatrick et al. [55] stated that the Sahel moisture change on average follows Clausius–Clapeyron scaling but has regional heterogeneity. According to Klutse et al. [65], in the future, fewer rainfall events and a reduction in consecutive wet days are projected for most parts of West Africa. Despite the reduction in the number of rain events, an increase in the precipitation was predicted near the Guinea coast and Nigeria by the end of the twentieth century [66]. Therefore, future rainy seasons in West Africa may record torrential rains, which in turn would lead to flooding and landslide situations in some parts of the region. Floods could trigger waterlogging in low-laying agricultural areas and other disaster risks in various sectors thus increasing crop losses and damage in this already largely vulnerable region.

Author Contributions

I.A.S. and S.S.: Conceptualization; methodology; validation; formal analysis; investigation; writing—original draft preparation. All authors have read and agreed to the published version of the manuscript.

Funding

This work was funded by the German Federal Ministry of Education and Research (BMBF) through the West African Science Center for Climate Change and Adapted Land Use (WASCAL). The author S.S was partially supported by the UPSCALERS project (“Upscaling Site-Specific Climate-Smart Agriculture and Land Use Practices to Enhance Regional Production Systems in West Africa,” #AURGII-1-074-2016), which is part of the African Union Research Grants financed through the Financing Agreement between the European Commission and the African Union Commission (DCI-PANAF/2015/307-078). The author S. IA was also funded in the framework of the CIREG project (https://cireg.pik-potsdam.de/en/) by the ERA-NET co-fund action initiated by JPI Climate, which was funded by BMBF (DE), FORMAS (SE), BELSPO (BE), and IFD (DK) with co-funding by the European Union’s Horizon 2020 Framework Program (Grant 690462).

Institutional Review Board Statement

Not applicable.

Informed Consent Statement

Not applicable.

Data Availability Statement

This study was based on open access gridded data available at each data provider center as indicated in the manuscript. To obtain access to each dataset, refer to the conditions of use provided by the authors of the gridded data. The in situ rain gauge datasets can be made available upon request to S. Salack (salack.s@wascal.org, accessed on 13 December 2022), and following the WASCAL data-sharing policy (wwwascal.org, accessed on 13 December 2022).

Acknowledgments

This work was funded by the German Federal Ministry of Education and Research (BMBF) through the West African Science Center for Climate Change and Adapted Land Use (WASCAL). The author S.S was partially supported by the UPSCALERS project (“Upscaling Site-Specific Climate-Smart Agriculture and Land Use Practices to Enhance Regional Production Systems in West Africa,” #AURGII-1-074-2016), which is part of the African Union Research Grants financed through the Financing Agreement between the European Commission and the African Union Commission (DCI-PANAF/2015/307-078). The author S. IA was funded in the framework of the CIREG project (https://cireg.pik-potsdam.de/en/, accessed on 13 December 2022) by the ERA-NET co-fund action initiated by JPI Climate, which was funded by BMBF (DE), FORMAS (SE), BELSPO (BE), and IFD (DK) with co-funding by the European Union’s Horizon 2020 Framework Program (Grant 690462). We are thankful to all national meteorological services and agencies, of WASCAL member countries, for contributing the observed in-situ data.

Conflicts of Interest

The authors declare no conflict of interest.

References

  1. Bliefernicht, J.; Berger, S.; Salack, S.; Guug, S.; Hingerl, L.; Heinzeller, D.; Mauder, M.; Steinbrecher, R.; Steup, G.; Bossa, A.; et al. The WASCAL Hydrometeorological Observatory in the Sudan Savanna of Burkina Faso and Ghana. Vadose Zone J. 2018, 17, 1–20. [Google Scholar] [CrossRef]
  2. Kidd, C.; Becker, A.; Huffman, G.J.; Muller, C.L.; Joe, P.; Skofronick-Jackson, G.; Kirschbaum, D.B. So, How Much of the Earth’s Surface Is Covered by Rain Gauges? Bull. Am. Meteorol. Soc. 2017, 98, 69–78. [Google Scholar] [CrossRef] [PubMed]
  3. Salack, S.; Bossa, A.; Bliefernicht, J.; Berger, S.; Yira, Y.; Sanoussi, K.A.; Guug, S.; Heinzeller, D.; Avocanh, A.S.; Hamadou, B.; et al. Designing Transnational Hydroclimatological Observation Networks and Data Sharing Policies in West Africa. Data Sci. J. 2019, 18, 33. [Google Scholar] [CrossRef]
  4. World Meteorological Organization (WMO). Valuing Weather and Climate: Economic Assessment of Meteorological and Hydrological Services; WMO: Geneva, Switzerland, 2015; 308p. [Google Scholar]
  5. Feng, S.; Hu, Q.; Qian, W. Quality control of daily meteorological data in China, 1951–2000: A new dataset. Int. J. Clim. 2004, 24, 853–870. [Google Scholar] [CrossRef]
  6. Maidment, R.I.; Grimes, D.; Black, E.; Tarnavsky, E.; Young, M.; Greatrex, H.; Allan, R.P.; Stein, T.; Nkonde, E.; Senkunda, S.; et al. A new, long-term daily satellite-based rainfall dataset for operational monitoring in Africa. Sci. Data 2017, 4, 170063. [Google Scholar] [CrossRef] [PubMed]
  7. Dee, D.P.; Uppala, S.M.; Simmons, A.J.; Berrisford, P.; Poli, P.; Kobayashi, S.; Andrae, U.; Balmaseda, M.A.; Balsamo, G.; Bauer, P.; et al. The ERA-Interim reanalysis: Configuration and performance of the data assimilation system. Q. J. R. Meteorol. Soc. 2011, 137, 553–597. [Google Scholar] [CrossRef]
  8. Harris, I.P.D.J.; Jones, P.D.; Osborn, T.J.; Lister, D.H. Updated high-resolution grids of monthly climatic observations–the CRU TS3. 10 Dataset. Int. J. Climatol. 2014, 34, 623–642. [Google Scholar] [CrossRef]
  9. Weedon, G.P.; Balsamo, G.; Bellouin, N.; Gomes, S.; Best, M.J.; Viterbo, P. The WFDEI meteorological forcing data set: WATCH Forcing Data methodology applied to ERA-Interim reanalysis data. Water Resour. Res. 2014, 50, 7505–7514. [Google Scholar] [CrossRef]
  10. Lange, S. EartH2Observe, WFDEI, and ERA-Interim data Merged and Bias-corrected for ISIMIP (EWEMBI). Earth Syst. Dynam. 2016, 9, 627–645. [Google Scholar] [CrossRef]
  11. Sylla, M.B.; Giorgi, F.; Coppola, E.; Mariotti, L. Uncertainties in daily rainfall over Africa: Assessment of gridded observation products and evaluation of a regional climate model simulation. Int. J. Clim. 2013, 33, 1805–1817. [Google Scholar] [CrossRef]
  12. Gehne, M.; Hamill, T.M.; Kiladis, G.N.; Trenberth, K.E. Comparison of Global Precipitation Estimates across a Range of Temporal and Spatial Scales. J. Clim. 2016, 29, 7773–7795. [Google Scholar] [CrossRef]
  13. Sun, Q.; Miao, C.; Duan, Q.; Ashouri, H.; Sorooshian, S.; Hsu, K.-L. A review of global precipitation data sets: Data sources, estimation, and intercomparisons. Rev. Geophys. 2018, 56, 79–107. [Google Scholar] [CrossRef]
  14. Chen, M.; Shi, W.; Xie, P.; Silva, V.B.S.; Kousky, V.E.; Higgins, R.W.; Janowiak, J.E. Assessing objective techniques for gauge-based analyses of global daily precipitation. J. Geophys. Res. Atmos. 2008, 113. [Google Scholar] [CrossRef]
  15. Gervais, M.; Tremblay, L.B.; Gyakum, J.R.; Atallah, E. Representing Extremes in a Daily Gridded Precipitation Analysis over the United States: Impacts of Station Density, Resolution, and Gridding Methods. J. Clim. 2014, 27, 5201–5218. [Google Scholar] [CrossRef]
  16. Herold, N.; Behrangi, A.; Alexander, L.V. Large uncertainties in observed daily precipitation extremes over land. J. Geophys. Res. Atmos. 2017, 122, 668–681. [Google Scholar] [CrossRef]
  17. Ensor, L.A.; Robeson, S.M. Statistical Characteristics of Daily Precipitation: Comparisons of Gridded and Point Datasets. J. Appl. Meteorol. Clim. 2008, 47, 2468–2476. [Google Scholar] [CrossRef]
  18. Tozer, C.R.; Kiem, A.S.; Verdon-Kidd, D.C. On the uncertainties associated with using gridded rainfall data as a proxy for observed. Hydrol. Earth Syst. Sci. 2012, 16, 1481–1499. [Google Scholar] [CrossRef]
  19. Harrison, L.; Funk, C.; Peterson, P. Identifying changing precipitation extremes in Sub-Saharan Africa with gauge and satellite products. Environ. Res. Lett. 2019, 14, 085007. [Google Scholar] [CrossRef]
  20. IPCC. 2021: Summary for Policymakers. In Climate Change 2021: The Physical Science Basis. Contribution of Working Group I to the Sixth Assessment Report of the Intergovernmental Panel on Climate Change; Masson-Delmotte, V., Zhai, P., Pirani, A., Connors, S.L., Péan, C., Berger, S., Caud, N., Chen, Y., Goldfarb, L., Gomis, M.I., et al., Eds.; Cambridge University Press: Cambridge, UK; New York, NY, USA, 2021; pp. 3–32. [Google Scholar]
  21. Saley, A.I.; Salack, S.; Seidou, I.S.; Moussa, M.S.; Latif, B.A.; Ly, M.; Fodé, M. The Possible Role of the Great Green Wall Activities on the Occurrence of Climate Extremes Over the West African Sahel. Atmos. Sci. Lett. 2019, 20, e927. [Google Scholar] [CrossRef]
  22. Dosio, A.; Jones, R.G.; Jack, C.; Lennard, C.; Nikulin, G.; Hewitson, B. What can we know about future precipitation in Africa? Robustness, significance and added value of projections from a large ensemble of regional climate models. Clim. Dyn. 2019, 53, 5833–5858. [Google Scholar] [CrossRef]
  23. Salack, S.; Cornelia, K.; Giannini, A.; Sarr, B.; Omonlola, N.W.; Nouhoun, B.; Bliefernicht, J.; Kunstmann, H. Global warming-induced hybrid rainy seasons in the Sahel. Environ. Res. Lett. 2016, 11, 104008. [Google Scholar] [CrossRef]
  24. Sanogo, S.; Fink, A.H.; Omotosho, J.A.; Ba, A.; Redl, R.; Ermert, V. Spatio-temporal characteristics of the recent rainfall recovery in West Africa. Int. J. Clim. 2015, 35, 4589–4605. [Google Scholar] [CrossRef]
  25. Power, S.B.; Delage, F.; Colman, R.; Moise, A. Consensus on Twenty-First-Century Rainfall Projections in Climate Models More Widespread than Previously Thought. J. Clim. 2012, 25, 3792–3809. [Google Scholar] [CrossRef]
  26. Sylla, M.B.; Giorgi, F.; Pal, J.S.; Gibba, P.; Kebe, I.; Nikiema, M. Projected Changes in the Annual Cycle of High-Intensity Precipitation Events over West Africa for the Late Twenty-First Century*. J. Clim. 2015, 28, 6475–6488. [Google Scholar] [CrossRef]
  27. Amoussou, E.; Awoye, H.; Vodounon, H.S.T.; Obahoundje, S.; Camberlin, P.; Diedhiou, A.; Kouadio, K.; Mahé, G.; Houndénou, C.; Boko, M. Climate and Extreme Rainfall Events in the Mono River Basin (West Africa): Investigating Future Changes with Regional Climate Models. Water 2020, 12, 833. [Google Scholar] [CrossRef]
  28. Quenum, G.M.L.D.; Nkrumah, F.; Klutse, N.A.B.; Sylla, M.B. Spatiotemporal Changes in Temperature and Precipitation in West Africa. Part I: Analysis with the CMIP6 Historical Dataset. Water 2021, 13, 3506. [Google Scholar] [CrossRef]
  29. Hong, J.; Agustin, W.; Yoon, S.; Park, J.-S. Changes of extreme precipitation in the Philippines, projected from the CMIP6 multi-model ensemble. Weather. Clim. Extrem. 2022, 37, 100480. [Google Scholar] [CrossRef]
  30. Chagnaud, G.; Panthou, G.; Vischel, T.; Lebel, T. A synthetic view of rainfall intensification in the West African Sahel. Environ. Res. Lett. 2022, 17, 044005. [Google Scholar] [CrossRef]
  31. Ta, S.; Kouadio, K.Y.; Ali, K.E.; Toualy, E.; Aman, A.; Yoroba, F. West Africa Extreme Rainfall Events and Large-Scale Ocean Surface and Atmospheric Conditions in the Tropical Atlantic. Adv. Meteorol. 2016, 2016, 1940456. [Google Scholar] [CrossRef]
  32. Froidurot, S.; Diedhiou, A. Characteristics of wet and dry spells in the West African monsoon system. Atmos. Sci. Lett. 2017, 18, 125–131. [Google Scholar] [CrossRef]
  33. Huffman, G.J.; Bolvin, D.T.; Nelkin, E.J.; Wolff, D.B.; Adler, R.F.; Gu, G.; Hong, Y.; Bowman, K.P.; Stocker, E.F. The TRMM Multisatellite Precipitation Analysis (TMPA): Quasi-Global, Multiyear, Combined-Sensor Precipitation Estimates at Fine Scales. J. Hydrometeorol. 2007, 8, 38–55. [Google Scholar] [CrossRef]
  34. Salack, S.; Saley, I.A.; Lawson, N.Z.; Zabré, I.; Daku, E.K. Scales for rating heavy rainfall events in the West African Sahel. Weather. Clim. Extrem. 2018, 21, 36–42. [Google Scholar] [CrossRef]
  35. Bliefernicht, J.; Salack, S.; Waongo, M.; Annor, T.; Laux, P.; Kunstmann, H. Towards a historical precipitation database for West Africa: Overview, quality control and harmonization. Int. J. Clim. 2021, 42, 4001–4023. [Google Scholar] [CrossRef]
  36. Giannini, A.; Kaplan, A. The role of aerosols and greenhouse gases in Sahel drought and recovery. Clim. Chang. 2018, 152, 449–466. [Google Scholar] [CrossRef] [PubMed]
  37. Knippertz, P.; Evans, M.J.; Field, P.R.; Fink, A.H.; Liousse, C.; Marsham, J.H. The possible role of local air pollution in climate change in West Africa. Nat. Clim. Chang. 2015, 5, 815–822. [Google Scholar] [CrossRef]
  38. Kanamitsu, M.; Ebisuzaki, W.; Woollen, J.; Yang, S.K.; Hnilo, J.J.; Fiorino, M.; Potter, G.L. Sep–doe amp-ii reanalysis (r-2). Bull. Am. Meteorol. Soc. 2002, 83, 1631–1643. [Google Scholar] [CrossRef]
  39. Hersbach, H.; Bell, B.; Berrisford, P.; Hirahara, S.; Horányi, A.; Muñoz-Sabater, J.; Nicolas, J.; Peubey, C.; Radu, R.; Schepers, D.; et al. The ERA5 global reanalysis. Q. J. R. Meteorol. Soc. 2020, 146, 1999–2049. [Google Scholar] [CrossRef]
  40. Talagrand, O. Assimilation of observations: An introduction. J. Meteor. Soc. 1997, 75, 191–209. [Google Scholar] [CrossRef]
  41. Bosilovich, M.G.; Chen, J.; Robertson, F.R.; Adler, R.F. Evaluation of Global Precipitation in Reanalyses. J. Appl. Meteorol. Climatol. 2008, 47, 2279–2299. [Google Scholar] [CrossRef]
  42. Hofer, M.; Marzeion, B.; Mölg, T. Comparing the skill of different reanalyses and their ensembles as predictors for daily air temperature on a glaciated mountain (Peru). Clim. Dyn. 2012, 39, 1969–1980. [Google Scholar] [CrossRef]
  43. Schneider, U.; Finger, P.; Meyer-Christoffer, A.; Ziese, M.; Becker, A. Global Precipitation Analysis Products of the GPCC. Global Precipitation Climatology Centre (GPCC); Deutscher Wetterdienst: Offenbach, Germany, 2018. [Google Scholar]
  44. Funk, C.; Peterson, P.; Landsfeld, M.; Pedreros, D.; Verdin, J.; Shukla, S.; Husak, G.; Rowland, J.; Harrison, L.; Hoell, A.; et al. The climate hazards infrared precipitation with stations—A new environmental record for monitoring extremes. Sci. Data 2015, 2, 150066. [Google Scholar] [CrossRef] [PubMed]
  45. Novella, N.S.; Thiaw, W.M. African Rainfall Climatology Version 2 for Famine Early Warning Systems. J. Appl. Meteorol. Clim. 2013, 52, 588–606. [Google Scholar] [CrossRef]
  46. Basheer, M.; Elagib, N.A. Performance of satellite-based and GPCC 7.0 rainfall products in an extremely data-scarce country in the Nile Basin. Atmos. Res. 2019, 215, 128–140. [Google Scholar] [CrossRef]
  47. Heinzeller, D.; Dieng, D.; Smiatek, G.; Olusegun, C.; Klein, C.; Hamann, I.; Salack, S.; Bliefernicht, J.; Kunstmann, H. The WASCAL high-resolution regional climate simulation ensemble for West Africa: Concept, dissemination and assessment. Earth Syst. Sci. Data 2018, 10, 815–835. [Google Scholar] [CrossRef]
  48. Cucchi, M.; Weedon, G.P.; Amici, A.; Bellouin, N.; Lange, S.; Schmied, H.M.; Hersbach, H.; Buontempo, C. WFDE5: Bias-adjusted ERA5 reanalysis data for impact studies. Earth Syst. Sci. Data 2020, 12, 2097–2120. [Google Scholar] [CrossRef]
  49. Meinshausen, M.; Nicholls, Z.R.J.; Lewis, J.; Gidden, M.J.; Vogel, E.; Freund, M.; Beyerle, U.; Gessner, C.; Nauels, A.; Bauer, N.; et al. The shared socio-economic pathway (SSP) greenhouse gas concentrations and their extensions to 2500. Geosci. Model Dev. 2020, 13, 3571–3605. [Google Scholar] [CrossRef]
  50. Carley, I.E.; Robert, V.; Jane, S.; Sylvie, J.; Bernd, E.R.; Chris, H.D. The benefits of increasing global and regional climate simulations for European climate extremes. Geosci. Model Dev. Discuss. 2019, 13, 5583–5607. [Google Scholar] [CrossRef]
  51. Hartigan, J.A.; Wong, M.A. A K-means clustering algorithm. Appl. Stat. 1979, 28, 100–108. [Google Scholar] [CrossRef]
  52. Roebber, P.J. Visualizing Multiple Measures of Forecast Quality. Weather. Forecast. 2009, 24, 601–608. [Google Scholar] [CrossRef]
  53. Taylor, C.M.; Belušić, D.; Guichard, F.; Parker, D.J.; Vischel, T.; Bock, O.; Harris, P.P.; Janicot, S.; Klein, C.; Panthou, G. Frequency of extreme Sahelian storms tripled since 1982 in satellite observations. Nature 2017, 544, 475–478. [Google Scholar] [CrossRef]
  54. Fitzpatrick, R.G.J.; Parker, D.J.; Marsham, J.H.; Rowell, D.P.; Guichard, F.M.; Taylor, C.M.; Cook, K.H.; Vizy, E.K.; Jackson, L.S.; Finney, D.; et al. What Drives the Intensification of Mesoscale Convective Systems over the West African Sahel under Climate Change? J. Clim. 2020, 33, 3151–3172. [Google Scholar] [CrossRef]
  55. Riede, J.O.; Posada, R.; Fink, A.H.; Kasper, F. What’s on the 5th IPCC report for West Africa? Adaption to Climate Change and Variability in Rural West Africa; Yaro, J.A., Hesselberg, J., Eds.; Springer: Berlin/Heidelberg, Germany, 2016; pp. 7–24. [Google Scholar]
  56. Dunning, C.M.; Black, E.; Allan, R.P. Later Wet Seasons with More Intense Rainfall over Africa under Future Climate Change. J. Clim. 2018, 31, 9719–9738. [Google Scholar] [CrossRef]
  57. Roudier, P.; Muller, B.; D’aquino, P.; Roncoli, C.; Soumaré, M.; Batté, L.; Sultan, B. The role of climate forecasts in smallholder agriculture: Lessons from participatory research in two communities in Senegal. Clim. Risk Manag. 2014, 2, 42–55. [Google Scholar] [CrossRef]
  58. Hoscilo, A.; Balzter, H.; Bartholomé, E.; Boschetti, M.; Brivio, P.A.; Brink, A.; Clerici, M.; Pekel, J.F. A conceptual model for assessing rainfall and vegetation trends in sub-Saharan Africa from satellite data. Int. J. Clim. 2014, 35, 3582–3592. [Google Scholar] [CrossRef]
  59. Park, J.-Y.; Bader, J.; Matei, J.-Y.P.J.B.D. Anthropogenic Mediterranean warming essential driver for present and future Sahel rainfall. Nat. Clim. Chang. 2016, 6, 941–945. [Google Scholar] [CrossRef]
  60. Dong, B.; Sutton, R. Dominant role of greenhouse-gas forcing in the recovery of Sahel rainfall. Nat. Clim. Chang. 2015, 5, 757–760. [Google Scholar] [CrossRef]
  61. Min, S.-K.; Zhang, X.; Zwiers, F.W.; Hegerl, G.C. Human contribution to more-intense precipitation extremes. Nature 2011, 470, 378–381. [Google Scholar] [CrossRef] [PubMed]
  62. Cook, B.I.; Smerdon, J.E.; Seager, R.; Coats, S. Constraints on future changes in climate and the hydrologic cycle. Nature 2002, 419, 224. [Google Scholar]
  63. O’gorman, P.A. Precipitation Extremes Under Climate Change. Curr. Clim. Chang. Rep. 2015, 1, 49–59. [Google Scholar] [CrossRef]
  64. Klutse, N.A.B.; Ajayi, V.O.; Gbobaniyi, E.O.; Egbebiyi, T.S.; Kouadio, K.; Nkrumah, F.; Quagraine, K.A.; Olusegun, C.; Diasso, U.; Dosio, A.; et al. Potential impact of 1.5 C and 2 C global warming on consecutive dry and wet days over West Africa. Environ. Res. Lett. 2018, 13, 055013. [Google Scholar] [CrossRef]
  65. Diallo, I.; Giorgi, F.; Deme, A.; Tall, M.; Mariotti, L.; Gaye, A.T. Projected changes of summer monsoon extremes and hydroclimatic regimes over West Africa for the twenty-first century. Clim. Dyn. 2016, 47, 3931–3954. [Google Scholar] [CrossRef]
  66. Nikulin, G.; Lennard, C.; Dosio, A.; Kjellström, E.; Chen, Y.; Hänsler, A.; Kupiainen, M.; Laprise, R.; Mariotti, L.; Maule, C.F.; et al. The effects of 1.5 and 2 degrees of global warming on Africa in the CORDEX ensemble. Environ. Res. Lett. 2018, 13, 065003. [Google Scholar] [CrossRef]
Figure 1. Study area with the location coordinates of different stations. The red box refers to the area of interpolation of the in-situ data covering the West African Sahel.
Atmosphere 14 00965 g001
Figure 2. Intercomparison annual rainfall amount and annual rainy days of different gridded datasets. The reference is the in-situ rain gauge observation.
Atmosphere 14 00965 g002
Figure 3. Performance of the gridded data sets in predicting the occurrence of heavy rain events of category 1 (a), category 2 (b), and category 3 (c) in the semi-arid regions of West Africa called Sudan-Savannah-Sahel (WASS).
Atmosphere 14 00965 g003aAtmosphere 14 00965 g003b
Figure 4. Percentage of future projected changes (relative to the 1981–2010 baseline) in the intensity of heavy rainfall events under shared socioeconomic pathways SSP1-2.6 and SSP3-7.0 (upper panel (a,b)), in the period 2031–2060 and in the period 2071–2100 (lower panel (c,d)). The brown contours denote statistically significant changes at a 95% confidence level according to the Mann Kendal test.
Atmosphere 14 00965 g004
Figure 5. Interannual variability of heavy rain events (HRE) from the mean of the model ensemble. The trends are estimated over the project’s future using the two scenarios of shared socioeconomic pathways SSP1-2.6 and SSP3-7.0. (*) Positive trend value statistically significant at 95% confidence level.
Atmosphere 14 00965 g005
Figure 6. Shifts in intensity of heavy rain events at a seasonal scale under the shared socioeconomic pathways SSP1-2.6 and SSP3-7.0.
Atmosphere 14 00965 g006
Table 1. Types, resolutions, and timelines of the different datasets.
TypeDataResolution (°)PeriodReference
In-situObservation-1960–2016National meteorology and hydrology services/agencies of WASCAL member countries (www.wascal.org)
ReanalysisNCEP21.875° × 1.875°1979-presentKanamitsu et al. [39]
ERA-Interim0.75° × 0.75°1979-presentDee et al. [7]
ERA50.25° × 0.25°1979-presentHersbach et al. [40]
Reanalysis adjustedWFDEI0.44° × 0.44°1979–2012Weedon et al. [9]
EWEMBI0.5° × 0.5°1979–2013Lange [10]
Rain-gauges basedCPC0.5° × 0.5°1979-presentChen et al. [14]
GPCC1° × 1°
0.5° × 0.5°
1982–2016Schneider et al. [44]
Satellite derivedTAMSAT30.0375° × 0.03751983-presentMaidment et al. [6]
CHIRPSv20.05° × 0.05°1981–2016Funk et al. [45]
ARC20.1° × 0.1°1983-presentNovella and Thiaw [46]
Regional climate modelWRF12-CRTL0.1056° × 0.1056°1979–2014Heinzeller et al. [47]
Earth system model/global circulation modelGFDL-ESM4
IPSL-CM6A-LR
MPI-ESM1-2-HR
MRI-ESM2-0
UKESM1-0-LL
0.5° × 0.5°1960–2010 (Historical)
2015–2100 (SSP126 and 370 Projections)
https://www.isimip.org (accessed on 1 October 2022)
Table 2. Heavy rain event (HRE) categories with their confidence interval for each data set. The colors indicate the relative proportion of the categories of HRE in each data set.
DatasetCategory 1 (mm/Day)Category 2 (mm/Day)Category 3 (mm/Day)
Centroid Confidence IntervalCentroidConfidence IntervalCentroidConfidence Interval
In-situ47[37;65]74[65;85]120>85
ARC240[30;65]77[65;91]151>91
CHIRPS27[22;37]42[37;47]63>47
CPC35[27;50]57[50;64]93>64
ERA523[17;35]44[35;70]93>70
ERAI17[11;39]53[39;67]120>67
EWEMBI25[18;41]51[41;61]97>61
GFDL34[25;49]57[49;65]90>65
GPCC0.538[30;55]65[55;75]111>75
GPCC137[29;53]62[53;71]105>71
IPSL30[22;49]62[49,75]130>75
MPI27[21;37]42[37,48]67>48
MRI31[23;46]55[46,63]93>63
NCEP30[19;51]62[51;73]114>73
TAMSAT16[13;21]24[21;27]35>27
UKESM31[24;45]53[45,60]86>60
WFDEI25[15;46]53[46;60]102>60
WRF1230[19;57]71[57;85]131>85
1–55–1010–1515–2020–2525–3030–3535–4040–4545–5050–5555–6060–6565–7070–7575–8080–8585–9090–9595–100%
Table 3. Trends, mean bias error (MBE), root mean square error (RMSE) and standard deviation (SD) of the intensity of HRE calculated over 1983–2010 for all the datasets (gridded and observation). In bold are the statistically significant trends at a 95% the confidence level according to a Mann Kendal test.
DatabaseTrendRMSEMBESD
Obs0.44--------4.51
ARC2−0.2411.71−9.694.14
CHIRPS−0.0925.75−25.43.36
CPC0.1215.13−14.653.89
ERA50.3133.24−33.124.57
ERAI−0.3942.5−42.093.88
EWEMBI0.3932.19−32.014.24
GFDL−0.0517.02−15.474.82
GPCC0.50.5614.33−12.885.97
GPCC10.5116.25−15.295.09
IPSL−0.127.03−23.9610.63
MPI−0.0326.69−25.954.48
MRI0.1123.78−22.297.88
NCEP0.320.1−18.917.55
TAMSAT0.2839.43−39.141.29
UKESM10.2121.57−20.744.71
WFDEI0.3732.27−32.074.1
WRF120.3720.27−19.575.69
Disclaimer/Publisher’s Note: The statements, opinions and data contained in all publications are solely those of the individual author(s) and contributor(s) and not of MDPI and/or the editor(s). MDPI and/or the editor(s) disclaim responsibility for any injury to people or property resulting from any ideas, methods, instructions or products referred to in the content.

