Article

Analysis of the Influence of Flood on the L4 Combination Observation of GPS and GLONASS Satellites

1
School of Communication Engineering, Hangzhou Dianzi University, Hangzhou 310018, China
2
Zhejiang Earthquake Agency, Hangzhou Dianzi University, Hangzhou 310018, China
3
School of Electronic Information Engineering, Beihang University, Beijing 100191, China
*
Author to whom correspondence should be addressed.
Atmosphere 2023, 14(6), 934; https://doi.org/10.3390/atmos14060934
Submission received: 5 May 2023 / Revised: 21 May 2023 / Accepted: 25 May 2023 / Published: 26 May 2023
(This article belongs to the Special Issue GNSS Remote Sensing in Atmosphere and Environment)

Abstract

:
With global warming, extreme weather such as floods and waterlogging occurs more frequently and seriously in recent years. During the flood, the surrounding environment of the GNSS (Global Navigation Satellite System) station will change as the volume of water increases. Considering the multipath error is directly relevant to the observation environment, thus, the influence of flood on the L4 combination observation (a geometry-free ionosphere-free linear combination of carrier phase) which is related to the multipath error of GPS (Global Positioning System) and GLONASS satellites is investigated in depth. In addition, the ground track repetition periods of GPS and GLONASS satellites are analyzed in the sky plot to illustrate the rationality of chosen reference day. Based on the results of the satellite sky plot, one and eight days are adopted to demonstrate the influence of flood on L4 combination observation for GPS and GLONASS satellites, respectively. Real data sets collected at the ZHNZ GNSS observation station during the flood from DOY (Day of Year) 193 to DOY 204, 2021 are used. Experimental results show that the flood has a significant impact on the L4 combination observation of GPS and GLONASS satellites, and the fluctuation of L4 under flood performs much larger than that of without flood. For GPS satellites, the maximum RMS (root mean square) increase rate of L4 under flood is approximately 186.67% on the G31 satellite. Even for the minimum RMS increase rate, it can reach approximately 23.52%, which is the G02 satellite. Moreover, the average RMS increase rate of GPS and GLONASS satellites can reach approximately 109.53% and 43.65%, respectively. In addition, the influence of rainfall and hardware device are also investigated, which can further demonstrate that the fluctuation of L4 is mainly caused by the flood but not by the rainfall and hardware device elements. Thus, based on the above results, the influence of flood on L4 observation should be taken into account during the applications of L4 used, such as the retrieval of soil moisture and vegetation water content based on GNSS L4 combination observations

1. Introduction

Floods are one of the common natural disasters, mainly caused by short periods of extremely heavy precipitation, which seriously threaten the safety of people’s property and life. For example, the flood in South Asia in 2020 lasts for about six months [1], and the flood in Zhengzhou, China in 2021 caused damage to many buildings [2,3]. Thus, accurate temporal and spatial information based on GNSS technology should be provided in order to improve the efficiency of rescue during floods and to protect human life and property [4,5]. For example, providing an accurate location for the people affected by the flood based on the GNSS technique can improve real-time rescue. However, whether the GNSS signal will be affected by flood needs to be analyzed and investigated.
During a flood, the GNSS (Global Navigation Satellite System) observation station is surrounded by water, which is different from the environment without flooding. The multipath error is caused by different transmission paths of signal, which is mainly related to the reflection and refraction coefficient of objects around the station [6,7,8]. The influence of water on GPS (Global Positioning System) pseudorange multipath has been analyzed by Cai et al. and the results show that the multipath error in the water environment performs more seriously compared with without water [9]. After investigating the relationship between multipath error and common surfaces at normal incidences on GPS L1 frequency, Michael indicated that the reflection coefficient of water is approximately three times greater than that of dry soil, and the attenuation factor of water is approximately 9.45 dB larger than that of dry soil [10]. Su et al. demonstrated the relationship between flood and multipath error in theory, both theoretical and experimental results show that the multipath error performs more seriously during the flood compared with dry soil [11]. Based on the above analysis, the characteristics of multipath error are closely related to the environment of observation and will be influenced during the flood. Thus, the GNSS observation related to multipath error should be re-evaluated and analyzed during the flood.
In the field of GNSS, although original pseudorange and carrier phase observations are largely affected by the multipath error, it is difficult to extract multipath errors from these two observations [12]. Thus, considering the characteristics of multipath error, two types of observation named CNR (Carrier-to-noise Ratio) and L4 are usually used to reflect the multipath error in the field of GNSS. The CNR can be obtained directly from the observation file, which is denoted as SNR (Signal-to-noise Ratio) in the RINEX (Receiver Independent Exchange Format) file [13]. In terms of CNR observation, the relationship between multipath error and CNR is illustrated by Axelrad et al. [14], and a new method based on CNR is proposed to detect the multipath effect for GPS satellites. Similar methods can also be found in Strode and Groves [15], Zhang et al. [16], and Su et al. [8]. Considering that the multipath error performs more seriously during the flood, Su et al. investigated the influence of flood on the CNR of GPS satellites, the results indicate that the CNR during the flood performs lower than that without flood [17,18]. In addition, Su et al. demonstrated that not only the CNR of GPS satellites was affected during the flood, but also the CNR of GLONASS satellites [11]. Based on previous references, the CNR related to multipath error is significantly affected during floods.
Considering that some of the low-cost receivers cannot provide the CNR observation, thus, the L4 combination observation is also used to reflect the multipath error. However, the influence of flood on L4 combination observation has not been analyzed. L4 combination observation is obtained by making the difference between L1 and L2 frequency [19]. Considering that L4 is an ionosphere-free geometry-free linear combination, thus, it is widely used for studying ionospheric disturbance, multipath effect, and parameter retrieval [20,21,22]. Based on the triple frequency signal of GPS satellite, an improved L4 linear combination of geometry-free phase observations is developed to detect snow depth by Yu et al. [23]. Meanwhile, Qian et al. proposed using the L4 observation of the GLONASS satellite to detect the snow depth [24]. By considering the influence of regional ionosphere disturbance, Li et al. developed a new method using L4 observation to establish TEC (Total Electron Content) model [22]. In addition, Zhou et al. presented a new sea-surface altimetry method by using dual-frequency ionosphere-free carrier phase L4 combination observation [25]. Based on the above analysis, it can be found that the L4 observation can be used in many applications, thus, it is necessary to analyze the influence of flood on L4 observation.
Taking the above into account, the relationship between multipath error, flood, and L4 combination observation is illustrated in theory. Then, the influence of flood on L4 combination observation of GPS and GLONASS satellites is analyzed in depth. In order to ensure the accuracy of comparison results, the satellite ground track repeat period of GPS and GLONASS is presented in the sky plot. In addition, the influence of other elements such as rainfall and hardware device is also investigated.

2. Relationship between Multipath Error, Flood, and L4

The multipath error means that both direct and indirect (such as reflection and refraction) signals can be received during the process of GNSS signal receiving. The amplitude of the indirect signal is affected by the size, shape, and reflection coefficient of the object surface, as well as the incident angle. The reflection coefficient is also dependent on the characteristics of the reflective surface. For example, when the incident angle is 90°, the reflection coefficient of dry soil is 0.27 and the attenuation of the signal is approximately −11.4 dB on GPS L1 frequency. However, the reflection coefficient of fresh water is 0.80 and the attenuation is −1.95 dB [10]. Thus, the multipath error during the flood is different from that of under dry soil.
To demonstrate the relationship between multipath error and L4 observation, a schematic multipath error model is given first. In addition, the reflection signal is taken as an example to analyze the multipath error for convenience. The simple multipath error model on the GNSS receiver is presented in Figure 1.
For a given incident angle θ and the height h of the antenna from the reflection surface, the delay δ of the reflection signal relative to the direct signal can be calculated by the trigonometric function, which is expressed as follows:
δ = 2 h sin θ
In theory, the angle in Equation (1) is not a fixed value, but a value that changes over time. Moreover, the difference in phase between the reflection signal and the direct signal can be calculated as follows [26]:
φ t = 2 π δ ( t ) λ = 4 π h λ sin θ t
where h is the height of the antenna; λ is the wavelength of the signal; θ t denotes the satellite elevation angle. The phase of the direct signal is defined as follows [27]:
ψ ( t ) = 2 π φ ( t ) + N
where N represents the integer ambiguity. The relationship between the direct signal, reflection signal, and the received signal is given by [23]:
S t = A d sin ψ t + α A m sin ψ t + φ t
where A d and A m are the amplitude of the direct and reflected signals; α denotes the amplitude of attenuation factor (AAF), which is related to the elevation angle, antenna surrounding environment, and the antenna gain [21]. Equation (4) can be written as:
S t = A d + α A m cos φ t sin ψ t + α A m sin φ t cos ψ t
It should be noted that the above analysis mainly discusses the relationship between multipath error and GNSS received signal in theory. However, in the practical application, L4 can be directly obtained by making a difference between L1 and L2 frequency, which is expressed as follows [19]:
L 4 = L 1 L 2
where L1 and L2 denote the GNSS signal on different frequencies. The L4 consists of the constant bias (integer ambiguity), ionospheric error, and multipath error. Thus, to analyze the multipath error, the average moving model and low-pass filter method are used to remove the constant bias and the ionospheric error component in Equation (6). Based on the above analysis, the relationship between multipath error and L4 can be denoted by the residuals of L4. Thus, the residuals of L4 are used to analyze the influence of flood on L4 in this experiment.

3. Site, Data, and Rainfall Description

Data sets collected during the flood at Zhengzhou ZHNZ station, China (34.5° N, 113.1° E) from DOY 193 to DOY 204, 2021 are used. The station is operated by the Crustal Movement Observation Network of China. Both GPS and GLONASS signals can be received by a geodetic dual-frequency receiver. The sample rate of data sets is 30 s. The surrounding environment of the receiver is dry soil. The geographical location of the GNSS ZHNZ observation station located in Zhengzhou City, Henan Province, China is shown in Figure 2.
The accumulative rainfall from DOY 193 to DOY 204, 2021 in Zhengzhou, China is obtained by the weather station, as presented in Figure 3. The rainfall data can be downloaded from the website: https://q-weather.info/weather/57083/history/ (12–23 July 2021). The weather station was established by the National Meteorological Information Center of China. The distance between the weather station and the GNSS observation station is about 5 km.
From Figure 3, it can be seen that the rainfall mainly occurred on DOY 200 and DOY 201, 2021. From DOY 200, the rainfall began to increase sharply, and the peak of rainfall reached 188.72 mm on DOY 201. The rainfall began to decrease from DOY 202 and stopped on DOY 204, 2021. The flood is caused by the heavy rain which lasted for two days from DOY 201 to DOY 202, 2021. In addition, it should be noted that the flood is not only caused by the rainfall, but also caused by the discharge of water from the adjacent reservoir. The geographical location of the reservoir and the GNSS station are demonstrated in Figure 4.

4. Experiment Analysis and Results

Based on the real data sets collected during the flood, the influence of flood on L4 combination observation of GPS and GLONASS satellites is analyzed. In addition, considering that the characteristic of L4 is related to the surrounding environment of the observation station, the azimuth and elevation should keep consistent during the comparison. Thus, the satellite ground track repeat period is presented in the view of the sky plot. Both the influence of rainfall and hardware device are investigated to further demonstrate that the influence of flood on L4 is mainly caused by the flood but not by other elements.

4.1. Influence of Flood on L4 for GPS Satellites

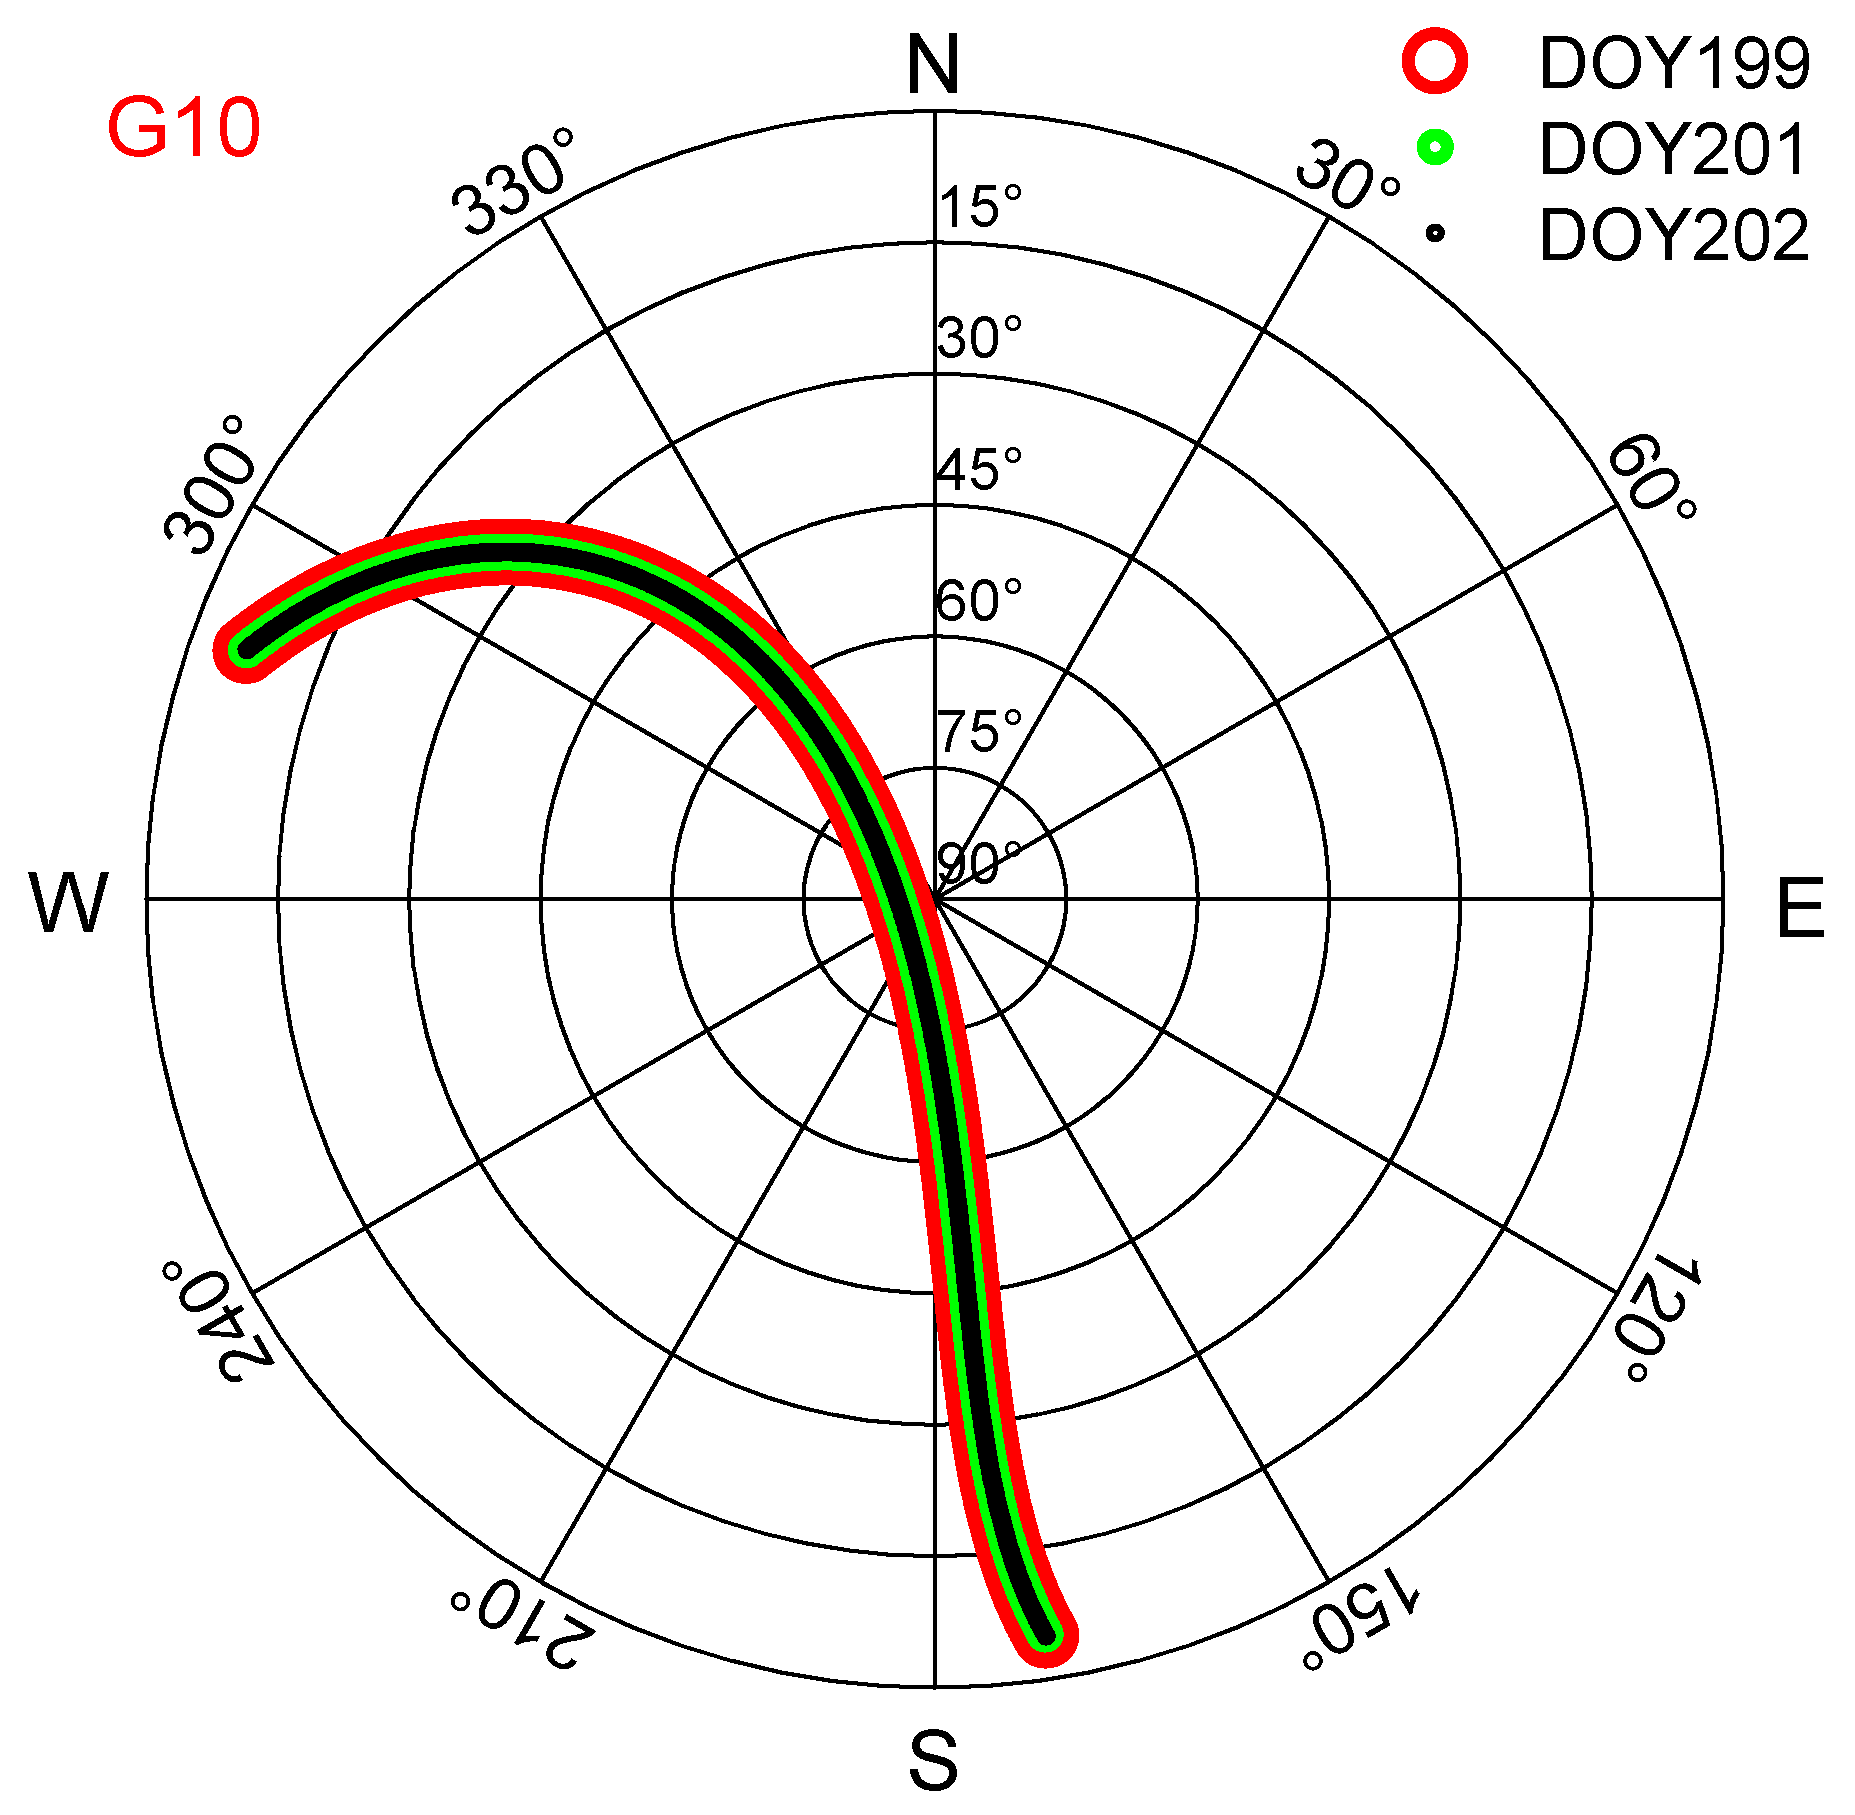
4.1.1. Ground Track Repeat Period of GPS Satellite

To analyze the influence of flood on L4 combination observation for GPS satellites, the ground track repeat period of GPS satellite is investigated first. As is well known, the repeat period of the satellite relative to the ground stationary receiver is twice as long as the operation period of the satellite. The operation period of a GPS satellite is approximately 11 h and 58 min. Thus, the ground track repeat period of a GPS satellite is almost equal to one solar day. The ground track of the G10 satellite on DOY 199, DOY 201, and DOY 202, 2021 in the view of the sky plot is presented in Figure 5.
From Figure 5, it can be observed that the satellite elevation angle and azimuth of the G10 satellite on these three days are totally consistent with each other. This phenomenon denotes that the ground track of the G10 satellite on DOY 199, DOY 201, and DOY 202, 2021 is identical. Based on the relationship between multipath error and L4 observation, if the surrounding environment of the observation station keeps constant, the L4 should also remain stable. This can indicate that the changes in L4 are caused by the environment around the observation station, not by the satellites. Thus, to analyze the influence of flood on L4, data sets collected from two adjacent days can be used to compare and analyze. In addition, considering that DOY 200 and DOY 201 are affected by rainfall and local small-scale floods, DOY 199 is used to compare with DOY 202 in this experiment.

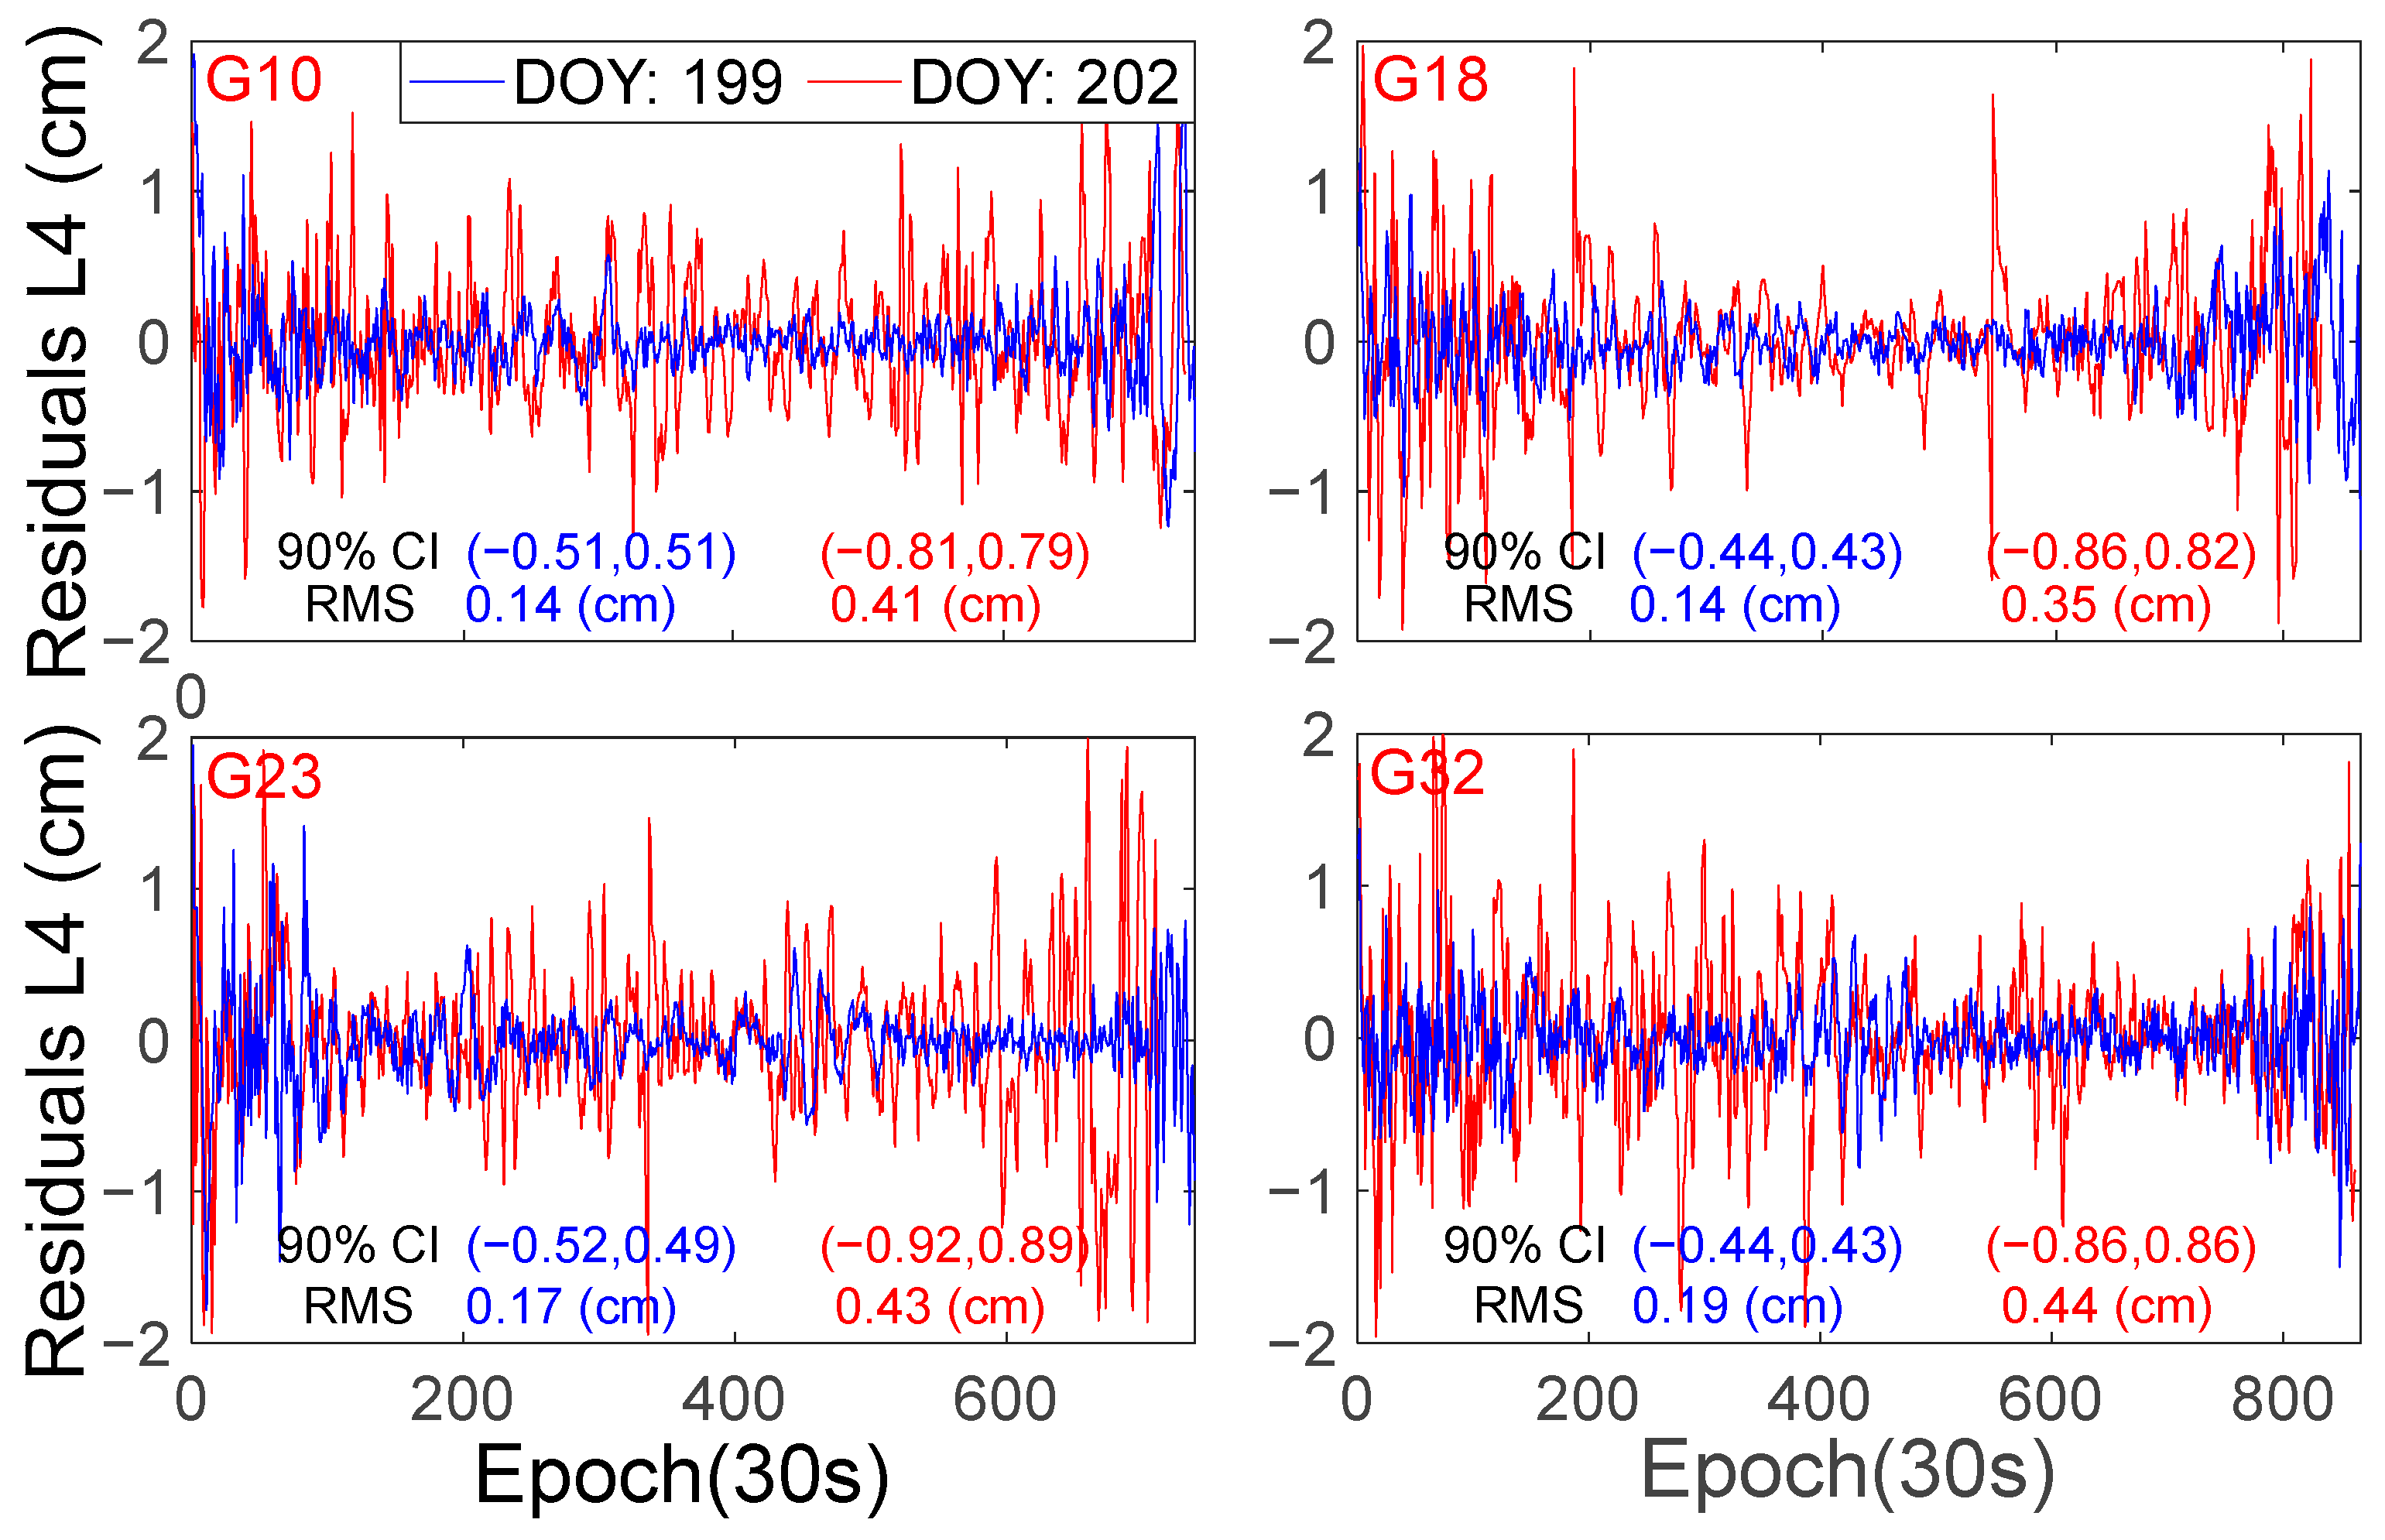
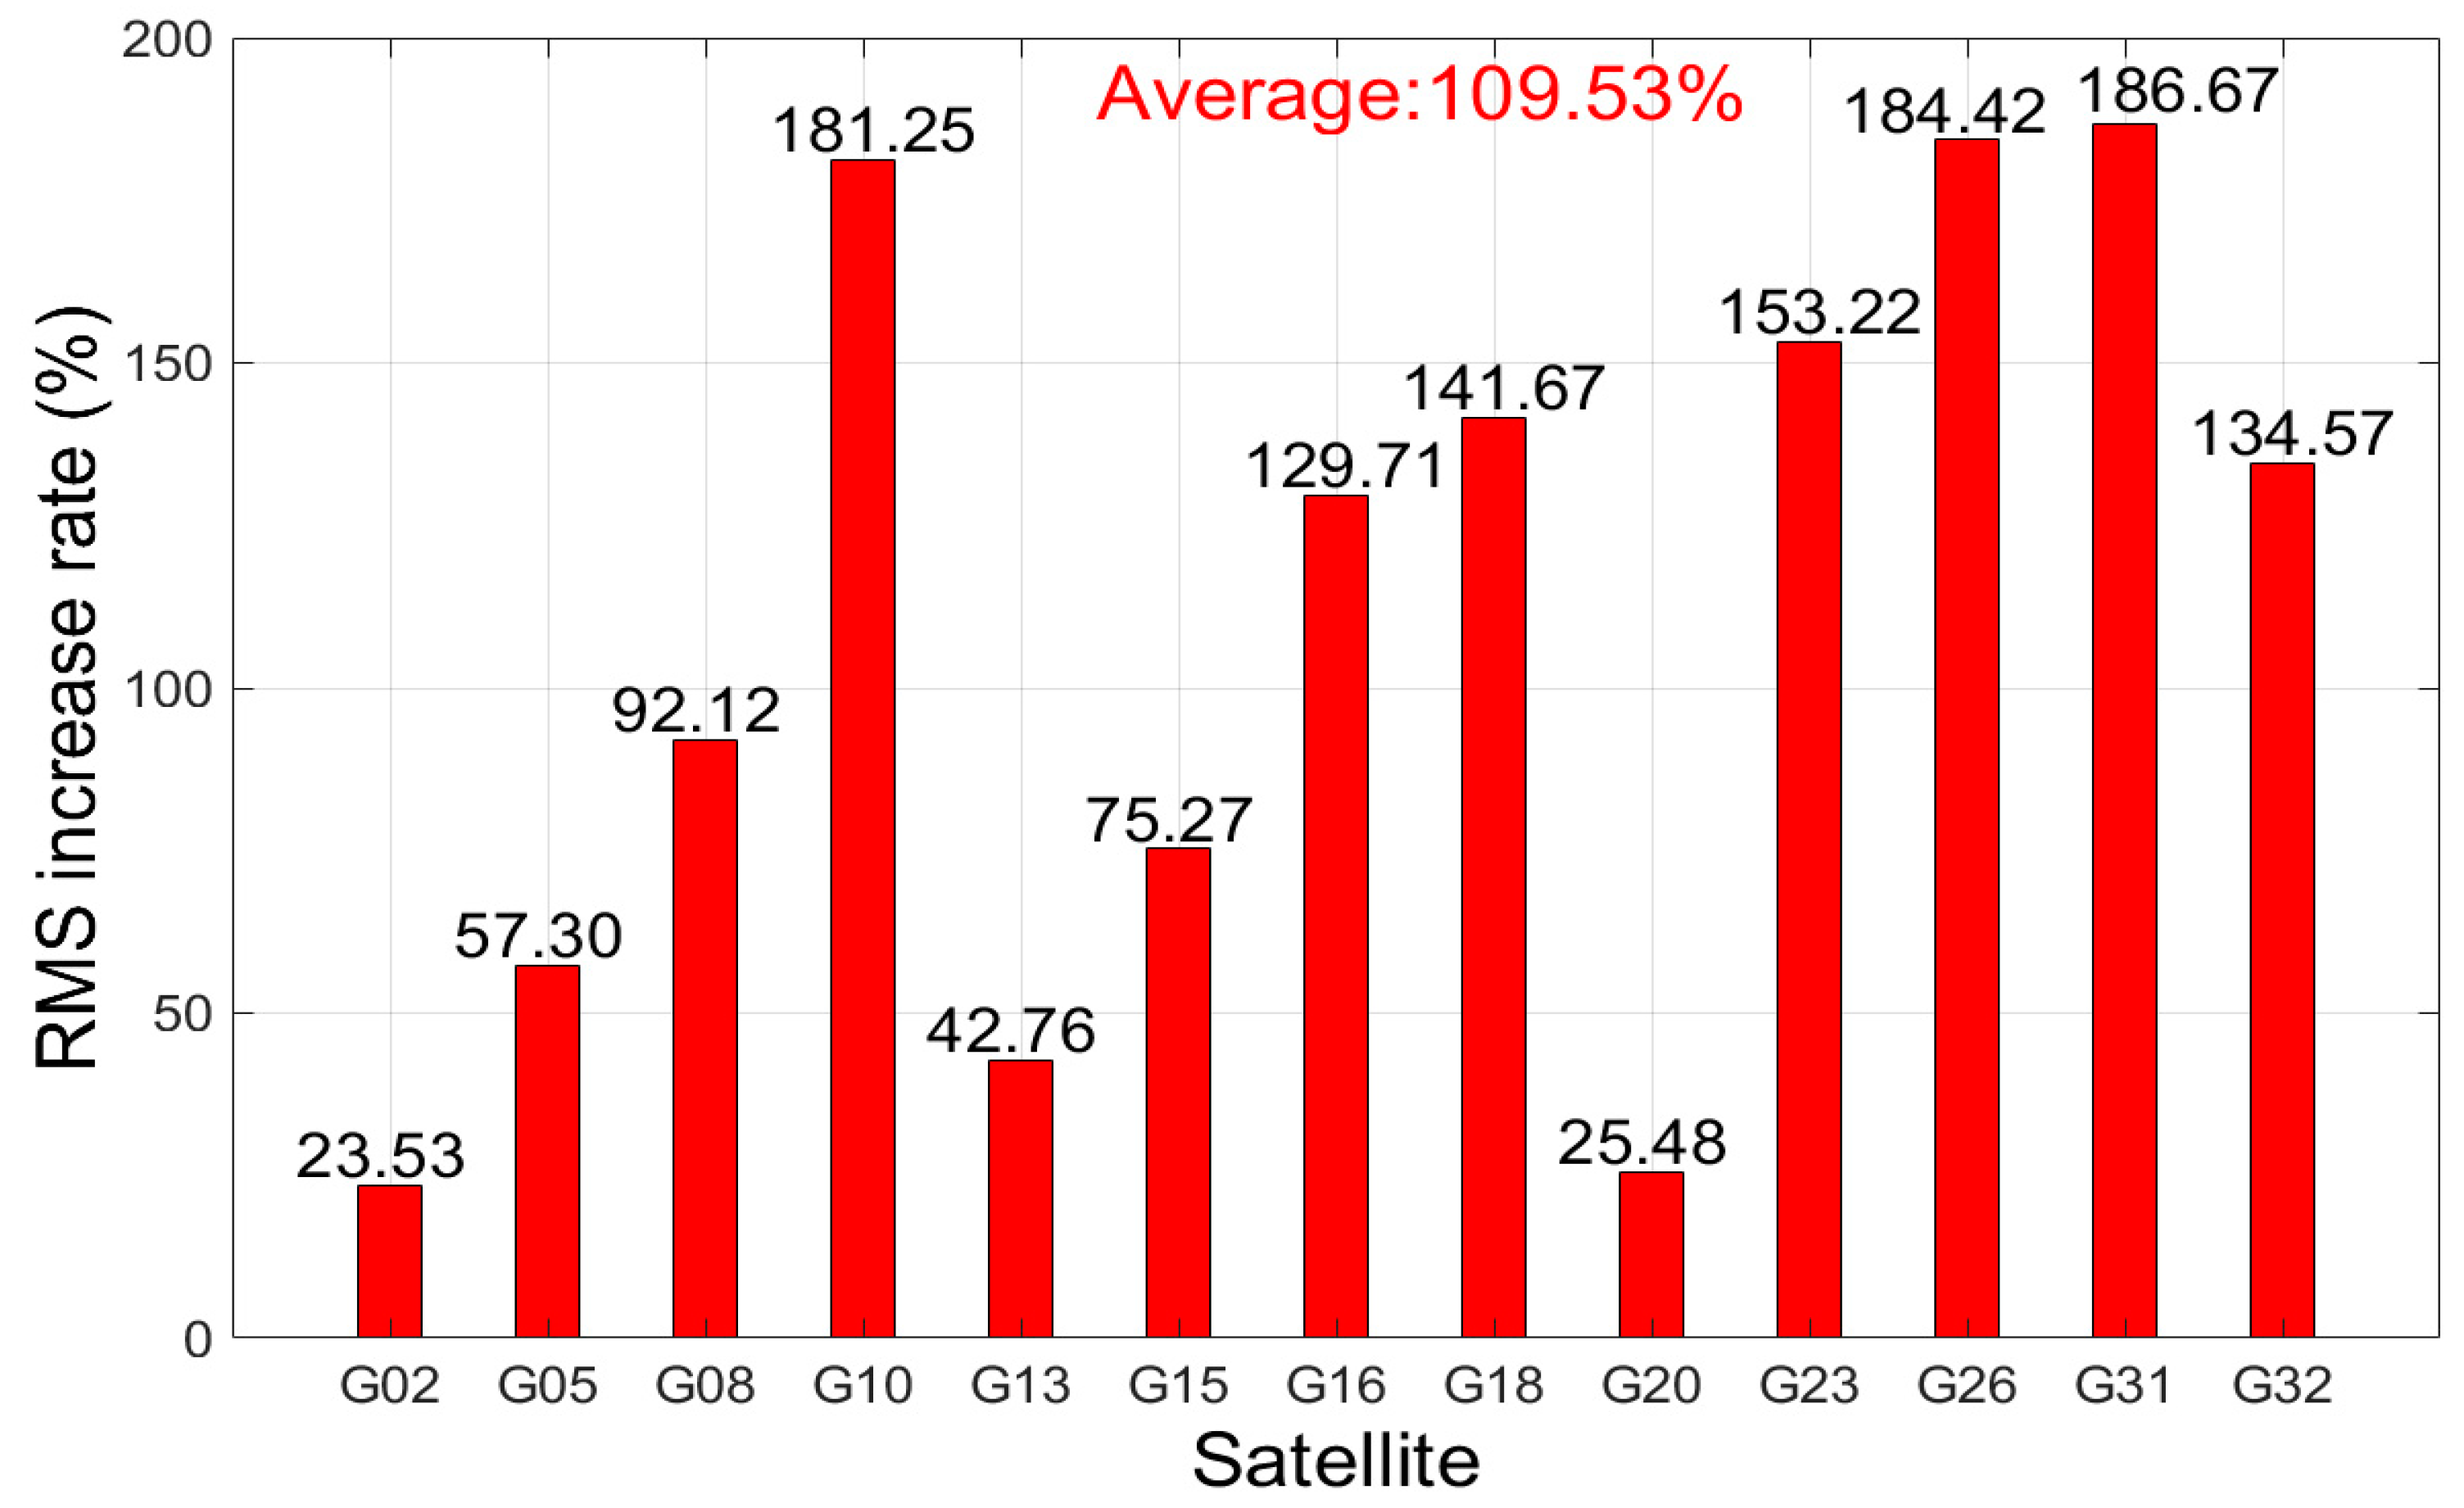
4.1.2. Influence of Flood on GPS L4 Observation

The comparison results of L4 residuals on G10, G18, G23, and G32 satellites between DOY 199 and DOY 202, 2021 are presented in Figure 6. The red line denotes the residuals of L4 on DOY 202 (with the flood), and the blue line denotes the residuals of L4 on DOY 199 (without flood). It can be seen that the fluctuation of L4 residuals on DOY 202 performs obviously higher than that of DOY 199 for these four satellites. To better demonstrate this phenomenon, the RMS of L4 residuals on DOY 199 and DOY 202 are given in each subplot. For example, the RMS of L4 residuals on the G10 satellite increases from 0.14 cm to 0.41 cm during the flood on DOY 202, and the increase rate of RMS reached approximately 192.86% compared with DOY 199. In addition, the 90% confidence intervals (CI) of the L4 residuals are also calculated. By comparing the CI for the same satellite on DOY 199 and DOY 202, it can be concluded that the range of fluctuation of the L4 residuals is significantly larger on DOY 202 than on DOY 199. It should be noted that, in order to eliminate the influence of random noise, only data sets which elevation between 30° and 90° are used for calculations and comparisons. Based on the above analysis, it can be drawn that the presence of floods increases the fluctuations of the L4 residuals for these satellites.
To better demonstrate the difference in L4 residuals between DOY 199 and DOY 202, 2021, the histogram of the amplitude of L4 residuals and relative frequency are shown in Figure 7. The residuals of L4 combination observation can be divided into four categories. From Figure 7, it can be observed that the distribution of L4 residuals on DOY 199 and DOY 202, 2021 is significantly different from each other. The residuals of L4 which are larger than 0.25 cm on DOY 202 are more than that of DOY 199. The maximum difference is approximately 0.35. Considering that the total number of G10 satellite epochs is 754, thus, the difference between them can reach approximately 261 epochs, which accounts for 34.60% of the total epochs. Thus, it can be concluded that the residuals of L4 on DOY 202 fluctuate more significantly than the residuals of DOY 199. In addition, it should be noted that the same phenomenon can also be found in other satellites.
In order to further analyze the influence of flood on L4 of GPS satellites, the RMS increase rate of other GPS satellites is presented in Figure 8. The RMS increase rate can be expressed by the following equation:
R M S   i n c r e a s e   r a t e = R M S 202 R M S 199 R M S 199
where R M S 202 refers to the RMS of the L4 residuals of a certain satellite on DOY 202; R M S 199 refers to the RMS of the L4 residuals of a certain satellite on DOY 199.
It should be noted that to ensure the accuracy and convenience of data processing, the satellites selected here are all satellites with high elevation angles and continuous observations. It can be seen that the residuals of L4 of all these satellites on DOY 202 increased to a certain degree compared with DOY 199. The average RMS increase rate is approximately 109.53% for all GPS satellites. In addition, the maximum increase rate is G31 satellite, and the RMS increase rate of L4 residuals is approximately 186.67% compared with DOY 199. It should be noted that the RMS increase rate of G02 and G20 is relatively lower than that of other satellites. For example, in terms of the G02 satellite, the RMS increase rate of L4 residuals is only approximately 23.52%. This is mainly because the flood is very small in the starting stage of these two satellites. A similar phenomenon can also be found on the G13 satellite.
Based on the above analysis, it can be inferred that the influence of flood on L4 is significant, and the residuals of L4 perform obviously greater fluctuation during the flood. However, there is rainfall on DOY 202, 2021, and whether this abnormal phenomenon is caused by the rainfall or hardware device is not considered. Thus, further analysis should be provided to eliminate the effects of rainfall and hardware devices.

4.1.3. Influence of Rainfall on L4

In order to eliminate the influence of rainfall on L4 observation, data sets collected on DOY 198 and DOY 200, 2021 are used. The rainfall on DOY 200 is 73.91 mm, but there is no rainfall on DOY 198. This information can be observed in Figure 3. There is no flood in these two days. Thus, whether the increase of L4 residuals is caused by the rainfall can be analyzed by using data sets from these two days. The comparison results of the G10 satellite on DOY 198 and DOY 200, 2021 are presented in Figure 9.
From Figure 9, it can be seen that the fluctuation of L4 residuals on DOY 200 is almost the same as that of DOY 198. The slight difference between them is mainly caused by the random noise. This result can be further reflected by the RMS of these two series, which are 0.18 and 0.22 cm for DOY 198 and DOY 200, respectively. In addition, it is obvious that there is a large fluctuation both at the beginning and the end of these two series. The reason for this phenomenon is that the elevation angle of these two stages is low, and the multipath error and random noise perform more seriously than that at high elevation. This result can also be found in Su et al. [28]. Moreover, it should be noted that the same phenomenon can also be found on other satellites. Based on the above analysis, it can be concluded that the influence of rainfall on L4 is very small and can be ignored. Thus, the increase of L4 residuals during the flood is not caused by rainfall.

4.1.4. Influence of Hardware Receiver on L4

In order to analyze whether the increase of L4 residuals is caused by the hardware device, the residuals of L4 on the G10 satellite between DOY 199, 2021, and DOY 204, 2021 are compared. The reason for choosing these two days is because DOY 200, DOY 201, DOY 202, and DOY 203 are influenced by rainfall and local small-scale floods. The comparison results are demonstrated in Figure 10. The blue and red lines denote the residuals of L4 on DOY 199 and DOY 204, 2021, respectively.
From Figure 10, it can be found that the residuals of L4 of the G10 satellite on DOY 199 and DOY 204 almost keep exactly the same as each other. This phenomenon is similar to the results of L4 on DOY 198 and DOY 200, which are presented in Figure 9. The RMS of residuals of L4 on DOY 199 and DOY 204 are 0.14 and 0.16 cm, respectively. These results indicate that the performance of the hardware device before and after the flood is stable and keep normal during these days. The data sets collected from this observation station are processed and uploaded automatically, and there are no maintenance and malfunction record reports during the flood. Considering that the probability of automatic recovery of the receiver damaged on the day of the flood is extremely low, thus, the increase of L4 residuals during the flood is not caused by the hardware device.
Based on the above analysis, it can be found that the influence of rainfall and hardware device on L4 is very small and can be ignored. Thus, it can be concluded that the influence of flood on L4 combination observation is significant for GPS satellites, and the residuals of L4 perform obviously increasingly during the flood. This result is consistent with the theoretical analysis.

4.2. Influence of Flood on L4 for GLONASS Satellites

4.2.1. Ground Track Repeat Period of GLONASS Satellite

Different from GPS satellites, the orbital period of GLONASS satellites is approximately 11 h and 16 min. Thus, based on the simplest fraction method [17,29], the ground track repeat period of GLONASS satellites for the stationary receiver is approximately 8 solar days. In order to demonstrate this phenomenon, the ground track of the GLONASS R24 satellite on DOY 193, DOY 201, and DOY 194, DOY 202 are presented in the view of the sky plot. The width of lines on DOY 201 and DOY 202 is narrower than that of DOY 193 and DOY 194 to make it clear that these two lines overlap almost exactly.
From Figure 11, we can find that the satellite elevation angle and the azimuth of R24 satellite on DOY 194 perform consistently to that of DOY 202. In addition, it is obvious that the ground track of DOY 193 and DOY 201 is totally different between DOY 194 and DOY 202. This is different from GPS satellites, in which the ground track repeat period is approximately one solar day. Thus, to analyze the influence of flood on L4 for GLONASS satellites, data sets collected on DOY 194, 2021 should be used to compare and analyze.

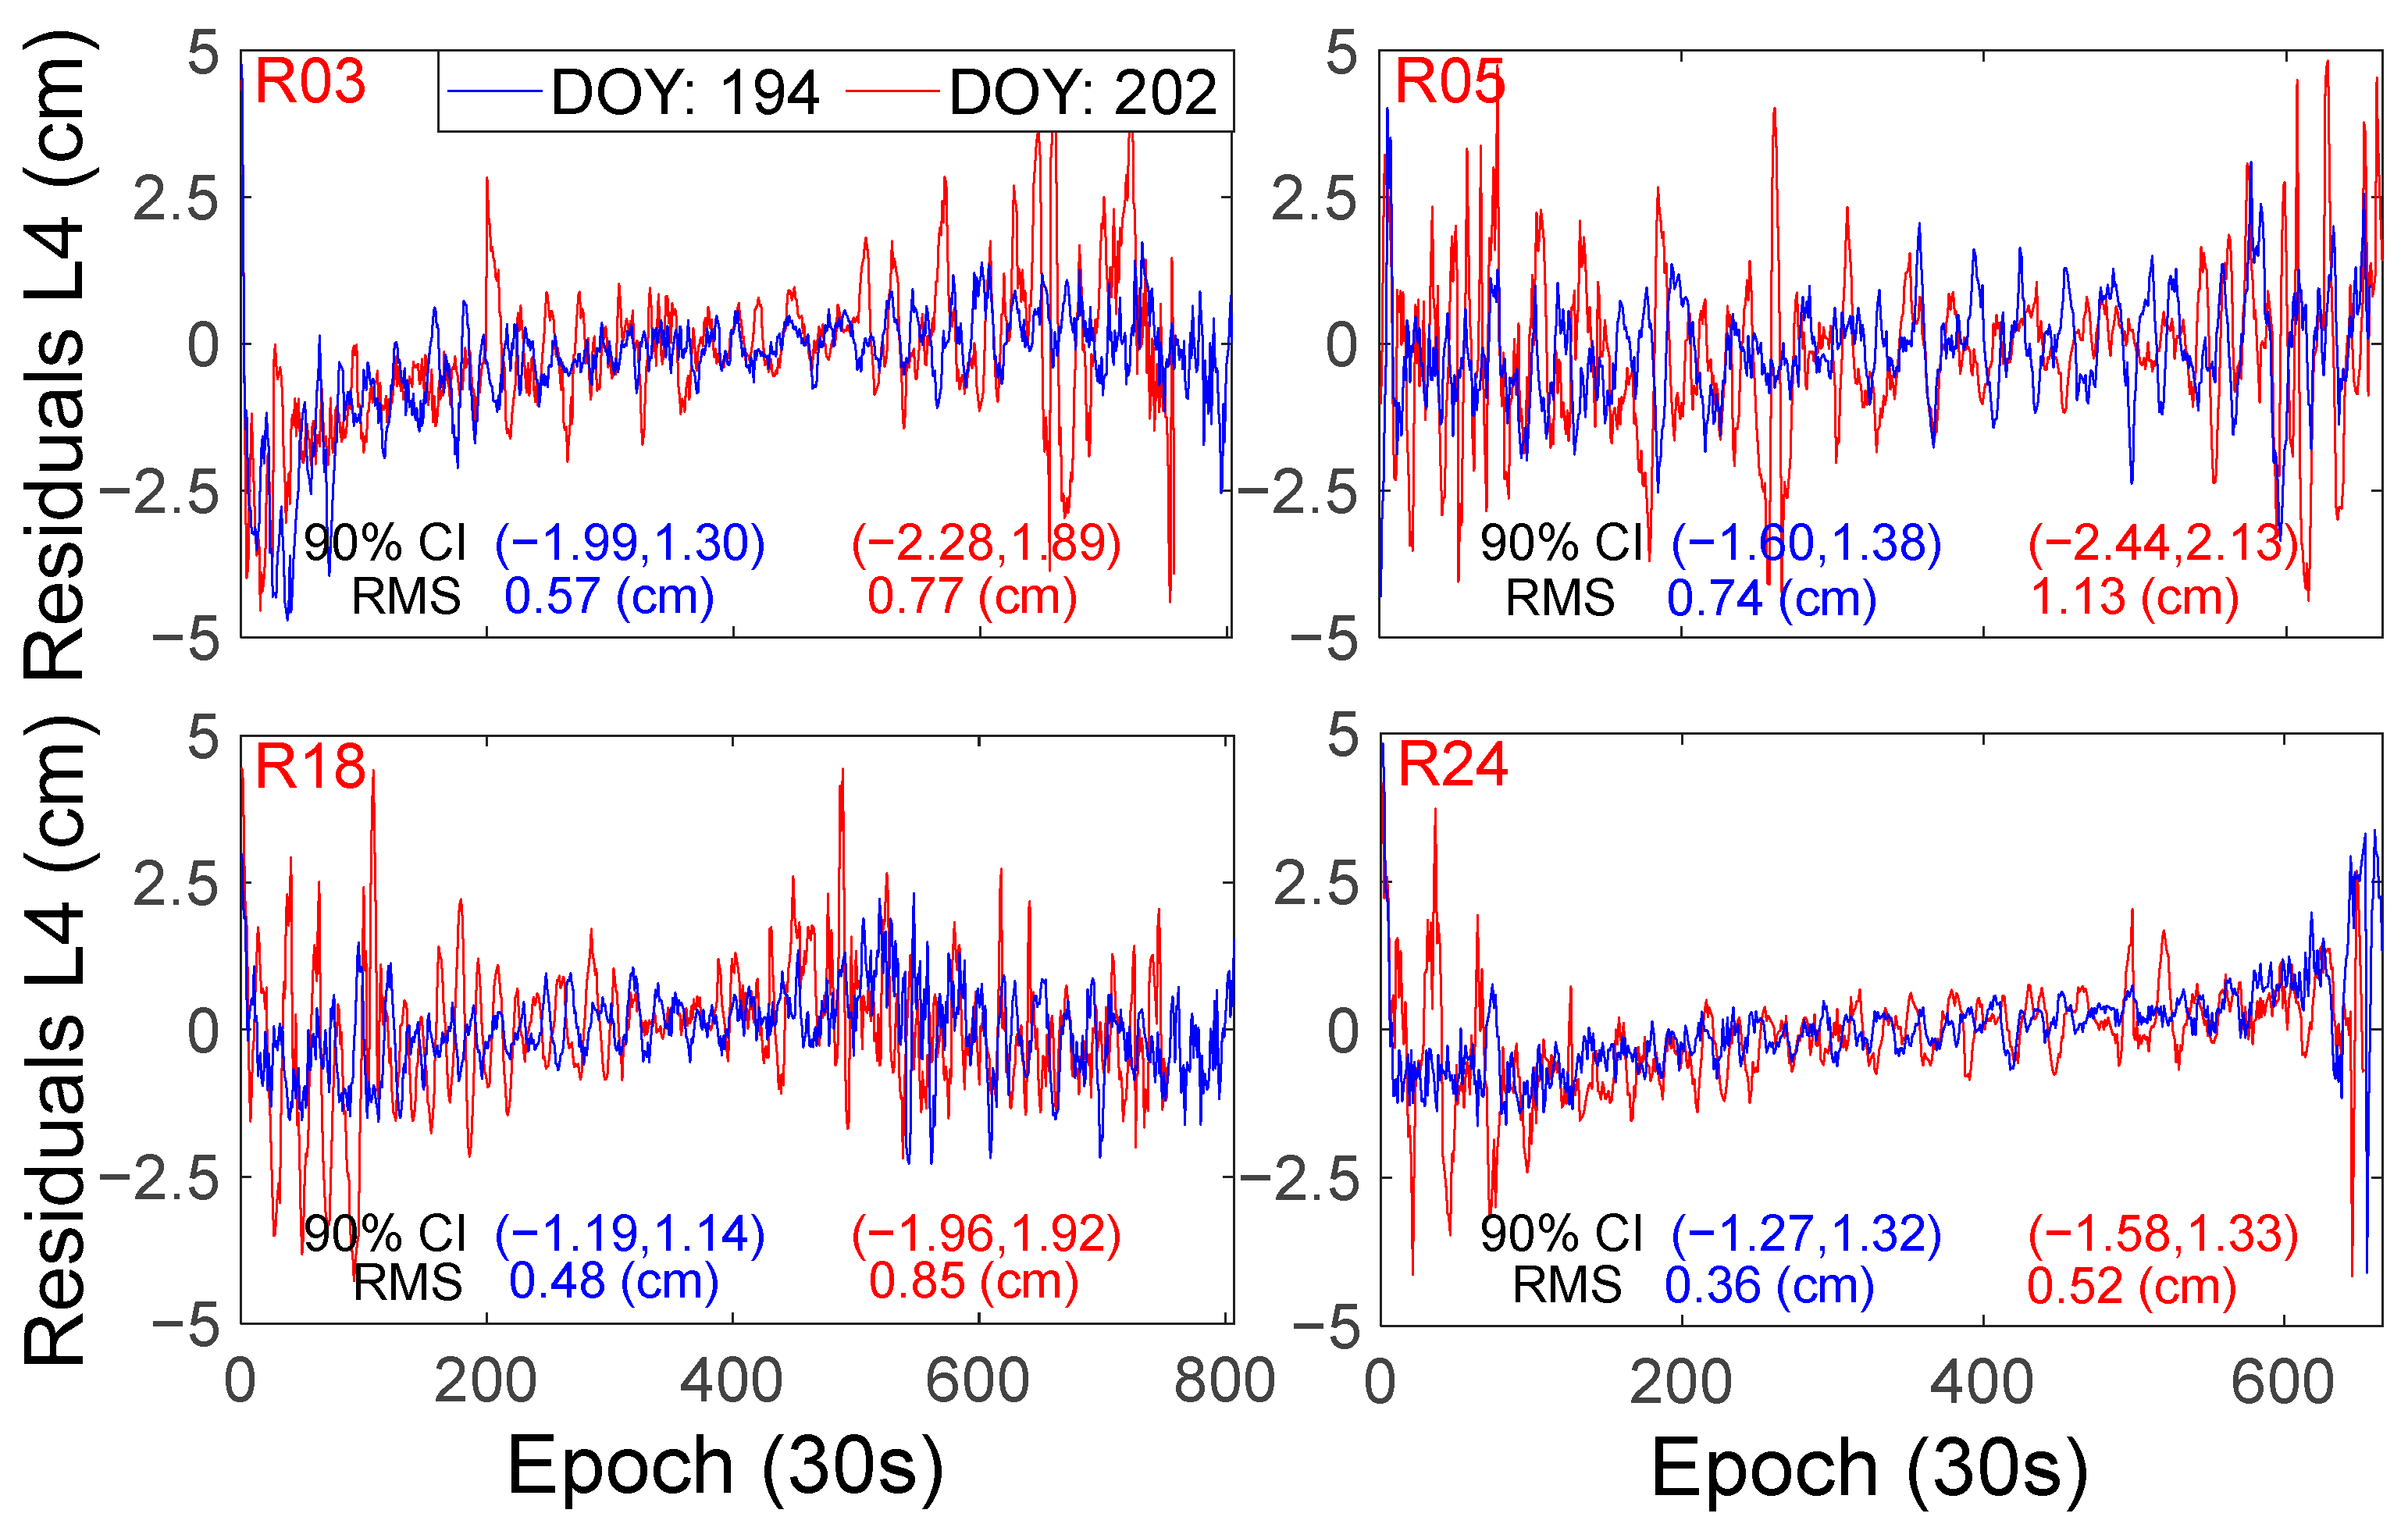
4.2.2. Influence of Flood on GLONASS L4 Combination Observation

The influence of flood on GLONASS L4 combination observation is analyzed, and the results are presented in Figure 12. The blue and red lines denote the results of L4 residuals on DOY 194 and DOY 202, respectively. Four satellites including R03, R05, R18, and R24 are selected to illustrate this phenomenon in this experiment. From Figure 12, it is obvious that the residuals of L4 of all these four satellites on DOY 202 (with the flood) perform larger than that of DOY 194 (without flood). The RMS of all these series is given at the bottom of each subplot to further demonstrate the influence of flood on L4. For example, it can be seen that the RMS of the R18 satellite on DOY 194 is only 0.48 cm. However, the RMS increased to 0.85 cm during the flood on DOY 202. The increase rate of RMS of L4 residuals on the R18 satellite is approximately 77.95%. Moreover, this trend can also be found according to the range of 90% CI. In addition, it should be noted that the same phenomenon can also be found in other GLONASS satellites.
In order to further analyze the influence of flood on L4 of GLONASS satellites, the RMS increase rates of all other GLONASS satellites are presented in Figure 13. It can be seen that the residuals of L4 of all these satellites on DOY 202 perform obviously larger than that of DOY 199. The average RMS increase rate can reach approximately 43.65% for all satellites. In addition, the maximum increase rate is R19 satellite, and it is approximately 79.84% compared with DOY 199, 2021. Although the increase rate of the same satellites is relatively small, such as R04 satellite, it is mainly because the flood is small in the starting stage of this satellite.
Based on the above analysis, it can be concluded that the influence of flood on L4 observation is obvious for GLONASS satellites, and the residuals of L4 perform a significant increase during the flood. This phenomenon is consistent with GPS satellites. Thus, the influence of flood on L4 combination observation should be considered in the related applications.

5. Conclusions

The L4 combination observation can be used to analyze the ionosphere delay, multipath error, and parameter retrieval. However, whether the characteristic of L4 will be influenced during the flood has not been researched in depth. Thus, by using real datasets collected during the flood, this research investigated and analyzed the impact of the flood on GPS and GLONASS satellites on L4 observations.
First, the relationship between the multipath error, flood, and L4 combination observation is illustrated in theory. The multipath error performs more severely during the flood because the reflection coefficient of water is three times larger than that of dry soil. Furthermore, after adopting the averaging and filtering methods, the multipath error can be reflected by L4 combination observation. Thus, the influence of flood on L4 observation can be analyzed by the residuals of L4. To ensure the accuracy of comparison results, the ground track repeat period of GPS and GLONASS satellites is investigated in the view of the sky plot. The results indicate that the one and eight solar days should be used to analyze the influence of flood on L4 for GPS and GLONASS satellites, respectively.
Real data sets collected during the flood in Zhengzhou, China from DOY 193 to DOY 204, 2021 are used. The flood appeared on DOY 202. Experimental results show that the influence of flood on L4 observation is obvious, and the RMS of L4 residuals during the flood performs significantly larger than that of without flood. For example, the average RMS increase rate of all GPS satellites under flood can reach approximately 109.53% compared to without flood, and even the smallest RMS increase rate is approximately 23.53%. In terms of GLONASS satellites, the average RMS increase rate is 43.65%, while the maximum RMS increase rate is 79.84%. In addition, the influence of rainfall and hardware device is analyzed, and the results indicate that the influence of these two elements is very small and can be ignored. Based on the above analysis, it can be drawn that the increase in L4 residuals during floods is mainly caused by floods and not by other factors.
In conclusion, the influence of flood on L4 combination observation of GPS and GLONASS satellites is obvious, and the fluctuation of L4 performs more severely during the flood. Thus, when L4 observation is used to mitigate multipath error or parameter retrieval (such as soil moisture or vegetation water content) under a flood environment, the influence of flood should be considered.

Author Contributions

J.W. worked out technical details; M.S. proposed the idea; J.G. wrote the main manuscript; L.P. and J.L. drew the figures; F.Z. provided the data set. All authors have read and agreed to the published version of the manuscript.

Funding

This research was supported by Zhejiang Provincial Natural Science Foundation of China under grant No.LQ22D040001.

Institutional Review Board Statement

Not applicable.

Informed Consent Statement

Not applicable.

Data Availability Statement

The data set used in this study is collected from the Infrastructure of National Earthquake Data Center, China. Readers in China can apply for the data set from the Agency of Crustal Movement Observation Network of China on their own, and the website is: http://data.earthquake.cn.

Acknowledgments

We appreciate the author Zheng Fu for providing the data sets. Thanks to the author Juntao Wu, and hope he and his good friend can pass the exam of postgraduate. In addition, thanks to the editors and reviewers for their contributions to the improvement of this manuscript.

Conflicts of Interest

The authors declare no conflict of interest.

References

  1. Song, D.; Zhang, Q.; Wang, B.; Yin, C.; Xia, J. A Novel Dual-Branch Neural Network Model for Flood Monitoring in South Asia Based on CYGNSS Data. Remote Sens. 2022, 14, 5129. [Google Scholar] [CrossRef]
  2. Zhang, S.; Ma, Z.; Liu, Q.; Hu, S.; Feng, Y.; Zhao, H.; Guo, Q. POBI interpolation algorithm for CYGNSS near real time flood detection research: A case study of extreme precipitation events in Henan, China in 2021. Adv. Space Res. 2022, 54, 818–829. [Google Scholar] [CrossRef]
  3. Song, H.; Wu, H.; Huang, J.; Zhong, H.; He, M.; Su, M.; Yu, G.; Wang, M.; Zhang, J. HA-Unet: A Modified Unet Based on Hybrid Attention for Urban Water Extraction in SAR Images. Electronics 2022, 11, 3787. [Google Scholar] [CrossRef]
  4. Yang, W.; Gao, F.; Xu, T.; Wang, N.; Tu, J.; Jing, L.; Kong, Y. Daily Flood Monitoring Based on Spaceborne GNSS-R Data: A Case Study on Henan, China. Remote Sens. 2021, 13, 4561. [Google Scholar] [CrossRef]
  5. Zhou, F.; Cao, X.; Ge, Y.; Li, W. Assessment of the positioning performance and tropospheric delay retrieval with precise point positioning using products from different analysis centers. GPS Solut. 2019, 24, 12. [Google Scholar] [CrossRef]
  6. Ray, J. Mitigation of GPS Code and Carrier Phase Multipath Effects Using a Multi-Antenna System. Ph.D. Thesis, University of Calgary, Calgary, AB, Canada, 2000. [Google Scholar]
  7. Zheng, K.; Tan, L.; Liu, K.; Li, P.; Chen, M.; Zeng, X. Multipath mitigation for improving GPS narrow-lane uncalibrated phase delay estimation and speeding up PPP ambiguity resolution. Measurement 2022, 206, 112243. [Google Scholar] [CrossRef]
  8. Su, M.; Yang, Y.; Qiao, L.; Ma, H.; Feng, W.; Qiu, Z.; Zheng, J. Multipath extraction and mitigation for static relative postitioning based on adaptive layer wavelet packets, bootstrapped searches, and CNR constraints. GPS Solut. 2021, 25, 123. [Google Scholar] [CrossRef]
  9. Cai, C.; Gao, Y.; Pan, L.; Dai, W. An analysis on combined GPS/COMPASS data quality and its effect on single point positioning accuracy under different observing conditions. Adv. Space Res. 2014, 54, 818–829. [Google Scholar] [CrossRef]
  10. Michael, S. Multipath. In Springer Handbook of Global Navigation Satellite Systems; Teunissen, P., Montenbruck, O., Eds.; Springer: New York, NY, USA, 2017; pp. 444–466. [Google Scholar]
  11. Su, M.; Chang, X.; Zheng, F.; Shang, J.; Qiao, L.; Teng, X.; Sun, M. Theory and Experiment Analysis on the Influence of Floods on a GNSS Pseudo-Range Multipath and CNR Signal Based on Two Cases Study in China. Remote Sens. 2022, 14, 5874. [Google Scholar] [CrossRef]
  12. Su, M.; Zheng, J.; Yang, Y.; Wu, Q. A new multipath mitigation method based on adaptive thresholding wavelet denoising and double reference shift strategy. GPS Solut. 2018, 22, 40. [Google Scholar] [CrossRef]
  13. Su, M.; Yang, Y.; Qiao, L.; Teng, X.; Song, H. Enhanced multipath mitigation method based on multi-resolution CNR model and adaptive statistical test strategy for real-time kinematic PPP. Adv. Space Res. 2020, 67, 868–882. [Google Scholar] [CrossRef]
  14. Axelrad, P.; Comp, C.; Macdoran, P. SNR based multipath error correction for GPS differential phase. IEEE Trans. Aerosp. Electron. Syst. 1996, 32, 650–660. [Google Scholar] [CrossRef]
  15. Strode, R.; Groves, P. GNSS multipath detection using three-frequency signal-to-noise measurements. GPS Solut. 2016, 20, 399–412. [Google Scholar] [CrossRef]
  16. Zhang, Z.; Li, B.; Gao, Y.; Shen, Y. Real-time carrier phase multipath detection based on dual-frequency C/N0 data. GPS Solut. 2019, 23, 7. [Google Scholar] [CrossRef]
  17. Su, M.; Zheng, F.; Shang, J.; Qiao, L.; Qiu, Z.; Zhang, H.; Zheng, J. Influence of flood on GPS carrier-to-noise ratio and water content variation analysis: A case study in Zhengzhou, China. GPS Solut. 2023, 27, 21. [Google Scholar] [CrossRef]
  18. Tong, Z.; Su, M.; Zheng, F.; Shang, J.; Wu, J.; Shen, X.; Chang, X. Accurate Retrieval of the Whole Flood Process from Occurrence to Recession Based on GPS Original CNR, Fitted CNR, and Seamless CNR Series. Remote Sens. 2023, 15, 2316. [Google Scholar] [CrossRef]
  19. Ozeki, M.; Heki, K. GPS snow depth meter with geometry-free linear combinations of carrier phases. J. Geod. 2012, 86, 209–219. [Google Scholar] [CrossRef]
  20. Heki, K.; Ping, J. Directivity and apparent velocity of the coseismic ionospheric disturbances observed with a dense GPS array. Earth Planet. Sci. Lett. 2005, 236, 845–855. [Google Scholar] [CrossRef]
  21. Nievinski, F.; Larson, K. An open source GPS multipath simulator in Matlab/Octave. GPS Solut. 2014, 18, 473–481. [Google Scholar] [CrossRef]
  22. Li, B.; Wang, M.; Wang, Y.; Guo, H. Model assessment of GNSS-based regional TEC modeling: Polynomial, trigonometric series, spherical harmonic and multi-surface function. Acta Geod. Geophys. 2019, 54, 333–357. [Google Scholar] [CrossRef]
  23. Yu, K.; Ban, W.; Zhang, X.; Yu, X. Snow Depth Estimation Based on Multipath Phase Combination of GPS Triple-Frequency Signals. IEEE Trans. Geosci. Electron. 2015, 53, 5100–5109. [Google Scholar] [CrossRef]
  24. Qian, X.; Jin, S. Estimation of Snow Depth From GLONASS SNR and Phase-Based Multipath Reflectometry. IEEE J.-STARS. 2016, 9, 4817–4823. [Google Scholar] [CrossRef]
  25. Zhou, W.; Bian, S.; Liu, Y.; Huang, L.; Liu, L.; Chen, C.; Li, H.; Zhai, G. Coastal High-Temporal Sea-Surface Altimetry Using the Posterior Error Estimations of Ionosphere-Free PPP and Information Fusion for Multi-GNSS Retrievals. Remote Sens. 2022, 14, 5599. [Google Scholar] [CrossRef]
  26. Bilich, A.; Larson, K. Mapping the GPS multipath environment using the signal-to-noise ratio (SNR). Radio Sci. 2007, 42, 1–16. [Google Scholar] [CrossRef]
  27. Wang, N.; Xu, T.; Gao, F.; Xu, G. Sea Level Estimation Based on GNSS Dual-Frequency Carrier Phase Linear Combinations and SNR. Remote Sens. 2018, 10, 470. [Google Scholar] [CrossRef]
  28. Su, M.; Feng, W.; Qiao, L.; Qiu, Z.; Zhang, H.; Zheng, J.; Yang, Y. An improved time-domain multipath mitigation method based on the constraint of satellite elevation for low-cost single frequency receiver. Adv. Space Res. 2022, 69, 3597–3608. [Google Scholar] [CrossRef]
  29. Yang, Y.; Jiang, J.; Su, M. Comparison of Satellite Repeat Shift Time for GPS, BDS, and Galileo Navigation Systems by Three Methods. Algorithms 2019, 12, 233. [Google Scholar] [CrossRef]
Figure 1. Simple multipath error model on the GNSS receiver.
Atmosphere 14 00934 g001
Figure 2. The geographical location of ZHNZ station, located in Zhengzhou City, Henan Province, China.
Atmosphere 14 00934 g002
Figure 3. Accumulative rainfall from DOY 193 to DOY 204, 2021 in Zhengzhou, China.
Atmosphere 14 00934 g003
Figure 4. (a) The blue and green dots are the GNSS station and the reservoir; (b) The arrow in the subplot indicates the reservoir management station; (c) The view of the reservoir at 8:00 a.m. on DOY 202, 2021; (d) The hourly rainfall on DOY 202, 2021.
Atmosphere 14 00934 g004
Figure 5. Ground track of G10 satellite on DOY 199 (red), DOY 201 (green), and DOY 202 (black), 2021 in the view of sky plot.
Atmosphere 14 00934 g005
Figure 6. Residuals of L4 on G10, G18, G23, and G32 satellites. The blue line denotes the L4 residuals collected on DOY 199 (without flood), and the red line denotes the L4 residuals collected on DOY 202 (with flood).
Atmosphere 14 00934 g006
Figure 7. Histogram of L4 combination observation residuals and relative frequency. The blue and red bars denote the L4 collected on DOY 199 and DOY 202, 2021. |−,25) denotes that the amplitude of L4 residuals is lower than 0.25 cm. |0.75,+) means that the amplitude of L4 residuals is larger than 0.75 cm. Symbol|and) denote the inclusion and non-inclusion, respectively.
Atmosphere 14 00934 g007
Figure 8. RMS increase rate of L4 residuals on DOY 202 (with the flood) of GPS satellites compared with DOY 199 (without flood), 2021.
Atmosphere 14 00934 g008
Figure 9. Residuals of L4 on DOY 198 and DOY 200, 2021 for G10 satellite. The blue and red lines denote the residuals of L4 on DOY 198 (no rainfall) and DOY 200 (with rainfall), respectively. The green line means the elevation angle.
Atmosphere 14 00934 g009
Figure 10. Residuals of L4 on DOY 199 and DOY 204, 2021 for G10 satellite. The blue and red lines denote the residuals of L4 on DOY 199 and DOY 204, respectively.
Atmosphere 14 00934 g010
Figure 11. Sky plot of the GLONASS R24 satellites on DOY 193, DOY 194, and DOY 201, DOY 202, 2021.
Atmosphere 14 00934 g011
Figure 12. Residuals of L4 on R03, R05, R18, and R24 satellites. The blue line denotes the residuals of L4 collected on DOY 194 (without flood).
Atmosphere 14 00934 g012
Figure 13. RMS increase rate of L4 residuals on DOY 202 compared with DOY 194 for GLONASS satellites.
Atmosphere 14 00934 g013
Disclaimer/Publisher’s Note: The statements, opinions and data contained in all publications are solely those of the individual author(s) and contributor(s) and not of MDPI and/or the editor(s). MDPI and/or the editor(s) disclaim responsibility for any injury to people or property resulting from any ideas, methods, instructions or products referred to in the content.

