Article

Global Navigation Satellite System-Based Retrieval of Precipitable Water Vapor and Its Relationship with Rainfall and Drought in Qinghai, China

1
College of Geographical Sciences, Qinghai Normal University, Xining 810008, China
2
Big Data Center of Geospatial and Nature Resources of Qinghai Province, Xining 810008, China
3
Qinghai Basic Surveying and Mapping Institute, Xining 810001, China
4
Academy of Plateau Science and Sustainability, Xining 810008, China
*
Author to whom correspondence should be addressed.
Atmosphere 2023, 14(3), 517; https://doi.org/10.3390/atmos14030517
Submission received: 16 February 2023 / Revised: 27 February 2023 / Accepted: 3 March 2023 / Published: 7 March 2023
(This article belongs to the Special Issue GNSS Remote Sensing in Atmosphere and Environment)

Abstract

:
Qinghai Province is situated deep in inland China, on the Qinghai-Tibet plateau, and it has unique climate change characteristics. Therefore, understanding the temporal and spatial distributions of water vapor in this region can be of great significance. The present study applied global navigation satellite system (GNSS) technology to retrieve precipitable water vapor (PWV) in Qinghai and analyzed its relationship with rainfall and drought. Firstly, radiosonde (RS) data is used to verify the precision of the surface pressure (P) and temperature (T) from the fifth-generation atmosphere reanalysis data set (ERA5) of the European Centre for Medium-Range Weather Forecasts (ECMWF), as well as the zenith troposphere delay (ZTD), calculated based on the data from continuously operating reference stations (CORS) in Qinghai. Secondly, a regional atmospheric weighted mean temperature (Tm) (QH-Tm) model was developed for Qinghai based on P, T, and relative humidity, as well as the consideration of the influence of seasonal changes in Tm. Finally, the PWV of each CORS in Qinghai was calculated using the GNSS-derived ZTD and ERA5-derived meteorological data, and its relationship with rainfall and drought was evaluated. The results show that the ERA5-derived P and T have high precision, and their average root mean square (RMS), mean absolute error (MAE) and bias were 1.06/0.85/0.01 hPa and 2.98/2.42/0.03 K, respectively. The RMS, MAE and bias of GNSS-derived ZTD were 13.2 mm, 10.3 mm and −1.8 mm, respectively. The theoretical error for PWV was 1.98 mm; compared with that of RS- and ERA5-derived PWV, the actual error was 2.69 mm and 2.16 mm, respectively. In addition, the changing trend of GNSS-derived PWV was consistent with that of rainfall events, and it closely and negatively correlated with the standardized precipitation evapotranspiration index. Therefore, the PWV retrieved from GNSS data in this study offers high precision and good feasibility for practical applications; thus, it can serve as a crucial tool for investigating water vapor distribution and climate change in Qinghai.

1. Introduction

As a vital component of the atmospheric system, atmospheric water vapor plays an essential role in the study of extreme weather events and climate changes [1]. Precipitable water vapor (PWV) is an important indicator for evaluating the water vapor content in the atmosphere. Therefore, acquiring PWV with high precision is important. PWV is defined as the total amount of water vapor (converted to liquid) in a vertical air column per unit of cross-sectional area from the ground to the tropopause level. It is generally used to describe the temporal and spatial variations and distributions of water vapor in the troposphere [2]. In addition, it is an essential parameter for analyzing the distribution of water vapor and changes of precipitation in specific areas [3].
The traditional techniques for measuring atmospheric water vapor mainly include radiosonde (RS), remote sensing satellites, and microwave radiometers [4]. Among them, RS offers the advantages of rich historical observation data and the global distribution of measurement stations [5]. However, the temporal and spatial resolutions of RS are relatively low, and it is expensive to operate. In contrast, microwave radiometer offers high temporal resolution and high precision, but its spatial resolution is low, and it is expensive and susceptible to changes in weather [6,7]. Remote sensing satellites have the advantages of all-weather capability and high precision, but it is also susceptible to weather conditions and cannot generate vertical profiles of water vapor [8]. Thus, the above traditional techniques of detecting water vapor have several limitations, namely, low temporal and spatial resolutions, susceptibility to weather conditions and excessive costs, which have become critical bottlenecks in weather forecasting or climate studies.
Global navigation satellite system (GNSS) technique has the advantages of high precision, high temporal and spatial resolutions, weather resistance and low operating costs, which can compensate for the limitations of traditional techniques [9,10]. Bevis et al. [11] proposed the concept of GNSS meteorology, demonstrating the ability of GNSS technology to retrieve PWV. This technology has since been widely adopted worldwide to derive PWV. Zhang et al. [12] retrieved PWV from the GNSS data of more than 260 stations in the Crustal Movement Observation Network of China (CMONOC) over the period of 1 March 1999 to 30 April 2015, with a precision of ~0.75 mm. Zhao et al. [13] derived a PWV dataset over the period of 2005–2016 with RMS values of approximately 1.3 mm based on zenith troposphere delay (ZTD) data from 269 International GNSS Service (IGS) stations worldwide. Wu et al. [14] obtained a PWV dataset using GNSS data generated from 377 CMONOC stations over the period of 2011 to 2019 and found that PWV were increasing in most parts of the country but declining in Northern China. Furthermore, GNSS-derived PWV datasets have been widely used to analyze extreme weather events and long-term climate changes, including heavy rainfalls [15], floods [16], droughts [17,18], and typhoons [19].
Since the most GNSS stations are not equipped with meteorological sensors (or have difficulties with acquiring meteorological data), PWV datasets with high spatial and temporal resolutions and precision cannot be obtained. Thus, PWV is often calculated based on meteorological parameters from reanalyzed data. To ensure the precision of the PWV dataset, related calculation parameters, such as pressure (P), temperature (T) and ZTD, should be considered. Atmospheric weighted mean temperature (Tm) is another critical parameter for PWV retrieval, and its precision also plays a key role in determining the PWV level. Current mainstream models for calculating Tm are linear [9], global pressure and temperature 3 (GPT3) [20], global weighted mean temperature-height (GTm-H) [21], global tropospheric model (GTrop) [22] and China Tm model (CTm) [23]. Bevis et al. [9] proposed a linear model and GPT3 is an empirical model of global P and T model constructed based on relevant parameters trained with ERA-interim, the fourth-generation reanalysis product of the European Centre for Medium-Range Weather Forecasts (ECMWF). The GTm-H incorporates nonlinear elevation reduction, and GTrop is a global ZTD and Tm model that considers the ZTD, Tm vertical lapse rates, and linear, annual and semi-annual variations.
Qinghai Province is located in the northeastern region of the Qinghai-Tibet Plateau. It has a large elevation difference and is in the plateau continental climate zone. The unique topography and variable climate of Qinghai significantly affect climate change in China. Therefore, the acquisition of high-precision and high-resolution PWV data would be significant to studies of precipitation and climate change in Qinghai. In this study, GNSS observation data from 74 continuously operating reference stations (CORS) in Qinghai and P and T data from ERA5 (fifth-generation atmosphere reanalysis dataset of ECMWF) are used to calculate hourly PWV data from January 2018 to February 2021. The applicability of GNSS-derived PWV to rainfall and drought is then explored. To ensure the precision of the obtained PWV dataset, the precision of GNSS-derived ZTD and ERA5-provided P and T based on the RS-derived ZTD, P, and T are first evaluated. A regional Tm model (QH-Tm), specifically for Qinghai, based on the P, T and relative humidity (RH) at eight RS stations located in and around Qinghai, is then developed. Finally, the precision of GNSS-derived PWV from each CORS was verified, and its relationship with extreme rainfall and drought, using hourly rainfall data and the standardized precipitation evapotranspiration index (SPEI), respectively, was analyzed.

2. Data and Methods

2.1. Data Description

2.1.1. CORS in Qinghai Province

Qinghai Province is located on the Qinghai-Tibet Plateau, between latitude 31°36′ to 39°19′ N and longitude 89°35 to103°04′ E. It is bordered by Gansu to the north and east, Xinjiang to the northwest, Tibet to the south and southwest and Sichuan to the southeast. In general, the terrain of Qinghai Province is high in the west and low in the east. It consists of three landforms and topographies, namely the Qinghai-Tibet Plateau, the arid inland basin and the Loess Plateau, and it is characterized by a plateau continental climate. By 2019, 74 provincial CORS and 6 national GNSS stations had been constructed in Qinghai. Therefore, this study was determined and used to investigate the precision of GNSS-derived PWV as well as its applicability for rainfall and drought. Figure 1 shows the geographical distribution of the GNSS and RS stations.

2.1.2. CORS in Qinghai Province

The ERA5 was released by ECMWF on 31 August 2018, and its temporal and spatial resolution are 1 h and 0.25° × 0.25°, respectively. The ERA5 data cover a time range from 1950 to today. The data were generated through 4D-Var data assimilation by the ECMWF integrated forecast system CY41R2 (IFS Cycle 41R2) [24]. The atmosphere from the ground to an altitude of 80 km was divided into 137 layers for analysis [25]. Due to the hourly P, T and other meteorological data provided by the ERA5 dataset, the difficulties associated with obtaining meteorological data at GNSS stations were greatly resolved. Therefore, the ERA5-provided P and T data from January 2018 to February 2021 is selected in this study as important parameters for calculating PWV.

2.1.3. CORS in Qinghai Province

RS is currently recognized as an independent way for measuring meteorological data. Through meteorological sensors on an air-sounding balloon, they can collect P, T, RH and other data at various heights along the path of the balloon’s ascent. Generally, it has served as a benchmark for verifying other detection methods [26]. The RS data were mainly sourced from the Integrated Global Radiosonde Archive Version 2 (IGRA2) dataset, which was released by the US National Climatic Data Center (NCDC) in 2016. The IGRA2 dataset contains more RS stations and data accumulated over a longer period than its predecessor, IGRA1, and its longest record dates back to 1905. The IGRA2 dataset contains tropospheric parameters, such as geopotential height, P, T and RH, which can be downloaded from ftp://ftp.ncdc.noaa.gov/pub/data/igra (accessed on 3 August 2022) [27,28]. In this study, the precision of the ERA5-provided P and T, as well as the GNSS-derived ZTD and PWV, are evaluated using data from eight RS stations in and around Qinghai.

2.2. Data Description

One of the key parameters used to calculate PWV is ZTD, which mainly consists of zenith dry delay (ZHD) and zenith wet delay (ZWD). In this study, the precise point positioning (PPP) technology is used to process the GNSS observation data of the CORS in Qinghai. When estimating ZTD using the PPP technique, the GNSS observation values of known stations were included to rule out the influence of coordinate parameters.
Given that the CORS in Qinghai lack corresponding meteorological data, the hourly P and T provided by ERA5 is used to obtain meteorological data for the corresponding CORS via bilinear interpolation. The P and T data of four grid points nearby the GNSS station in the vertical direction were converted to obtain P and T at the height of the corresponding station. The specific conversion formula is as follows [29]:
P = P 0 ( 1 0.0000226 ( h h 0 ) ) 5.225
T = T 0 0.0065 ( h h 0 )
where P and P0 represent the pressures of the CORS and the ERA5 grid point at the corresponding height in hPa, respectively; T and T0 represent temperatures (K) at the CORS and the ERA5 grid point at the corresponding height, respectively, and h and h0 represent the height (m) of the GNSS station and of the ERA5 grid point, respectively. Based on the P data of CORS station, the ZHD of the corresponding stations was obtained using the Saastamoinen model, as expressed by the following formula [30]:
Z H D = 0.002277 P 1 0.00266 cos ( 2 φ ) 0.00028 H
where P represents the pressure of the GNSS station, and H represents the latitude (rad) and height (km) of the GNSS station, respectively. After determining ZHD, ZWD was then obtained by separating ZHD from ZTD, and further converted to PWV using the following formula [31]:
P W V = 10 6 K 2 + K 3 / T m R V ρ Z W D
where K2, K3 and RV are constants with values of 16.48 K·hPa−1, 3.776 ± 0.014 × 10⁵ K2·hPa−1 and 461 J·kg−1·K−1, respectively; ρ ′ is water vapor density and Tm is the atmospheric weighted mean temperature. In addition, an empirical correction formula is also introduced to unify the PWV values at the height of grid point to the height of GNSS station according to the previous study [32].

3. Retrieval and Evaluation of PWV from GNSS

3.1. Evaluation of the ERA5-Provided P and T

The P and T data of eight RS stations in and around Qinghai is selected to evaluate the precision of the ERA5-provided P and T. Figure 2 gives the compared results of ERA5-provided P and T at the eight RS stations over the period of January 2018 to February 2021. It can be observed that ERA5-provided P and T have relatively high precision in general. Among the eight stations, the root mean square (RMS) of P and T at the CHM029, CHM137 and CHM146 stations were relatively high, whereas those of the other stations were relatively low. The primary reason of this phenomenon is the relatively high altitudes of these three stations, all of which are above 3000 m, which results in poor-quality meteorological data. Table 1 shows the average RMS, mean absolute error (MAE), and bias for ERA5-provided P and T at the eight RS stations; statistical results were 1.06/0.85/0.01 hPa and 2.98/2.42/0.03 K, respectively. These values confirmed the high precision of P and T derived from ERA5. Thus, ERA5-provided P and T can be used for PWV retrieval in the following study.

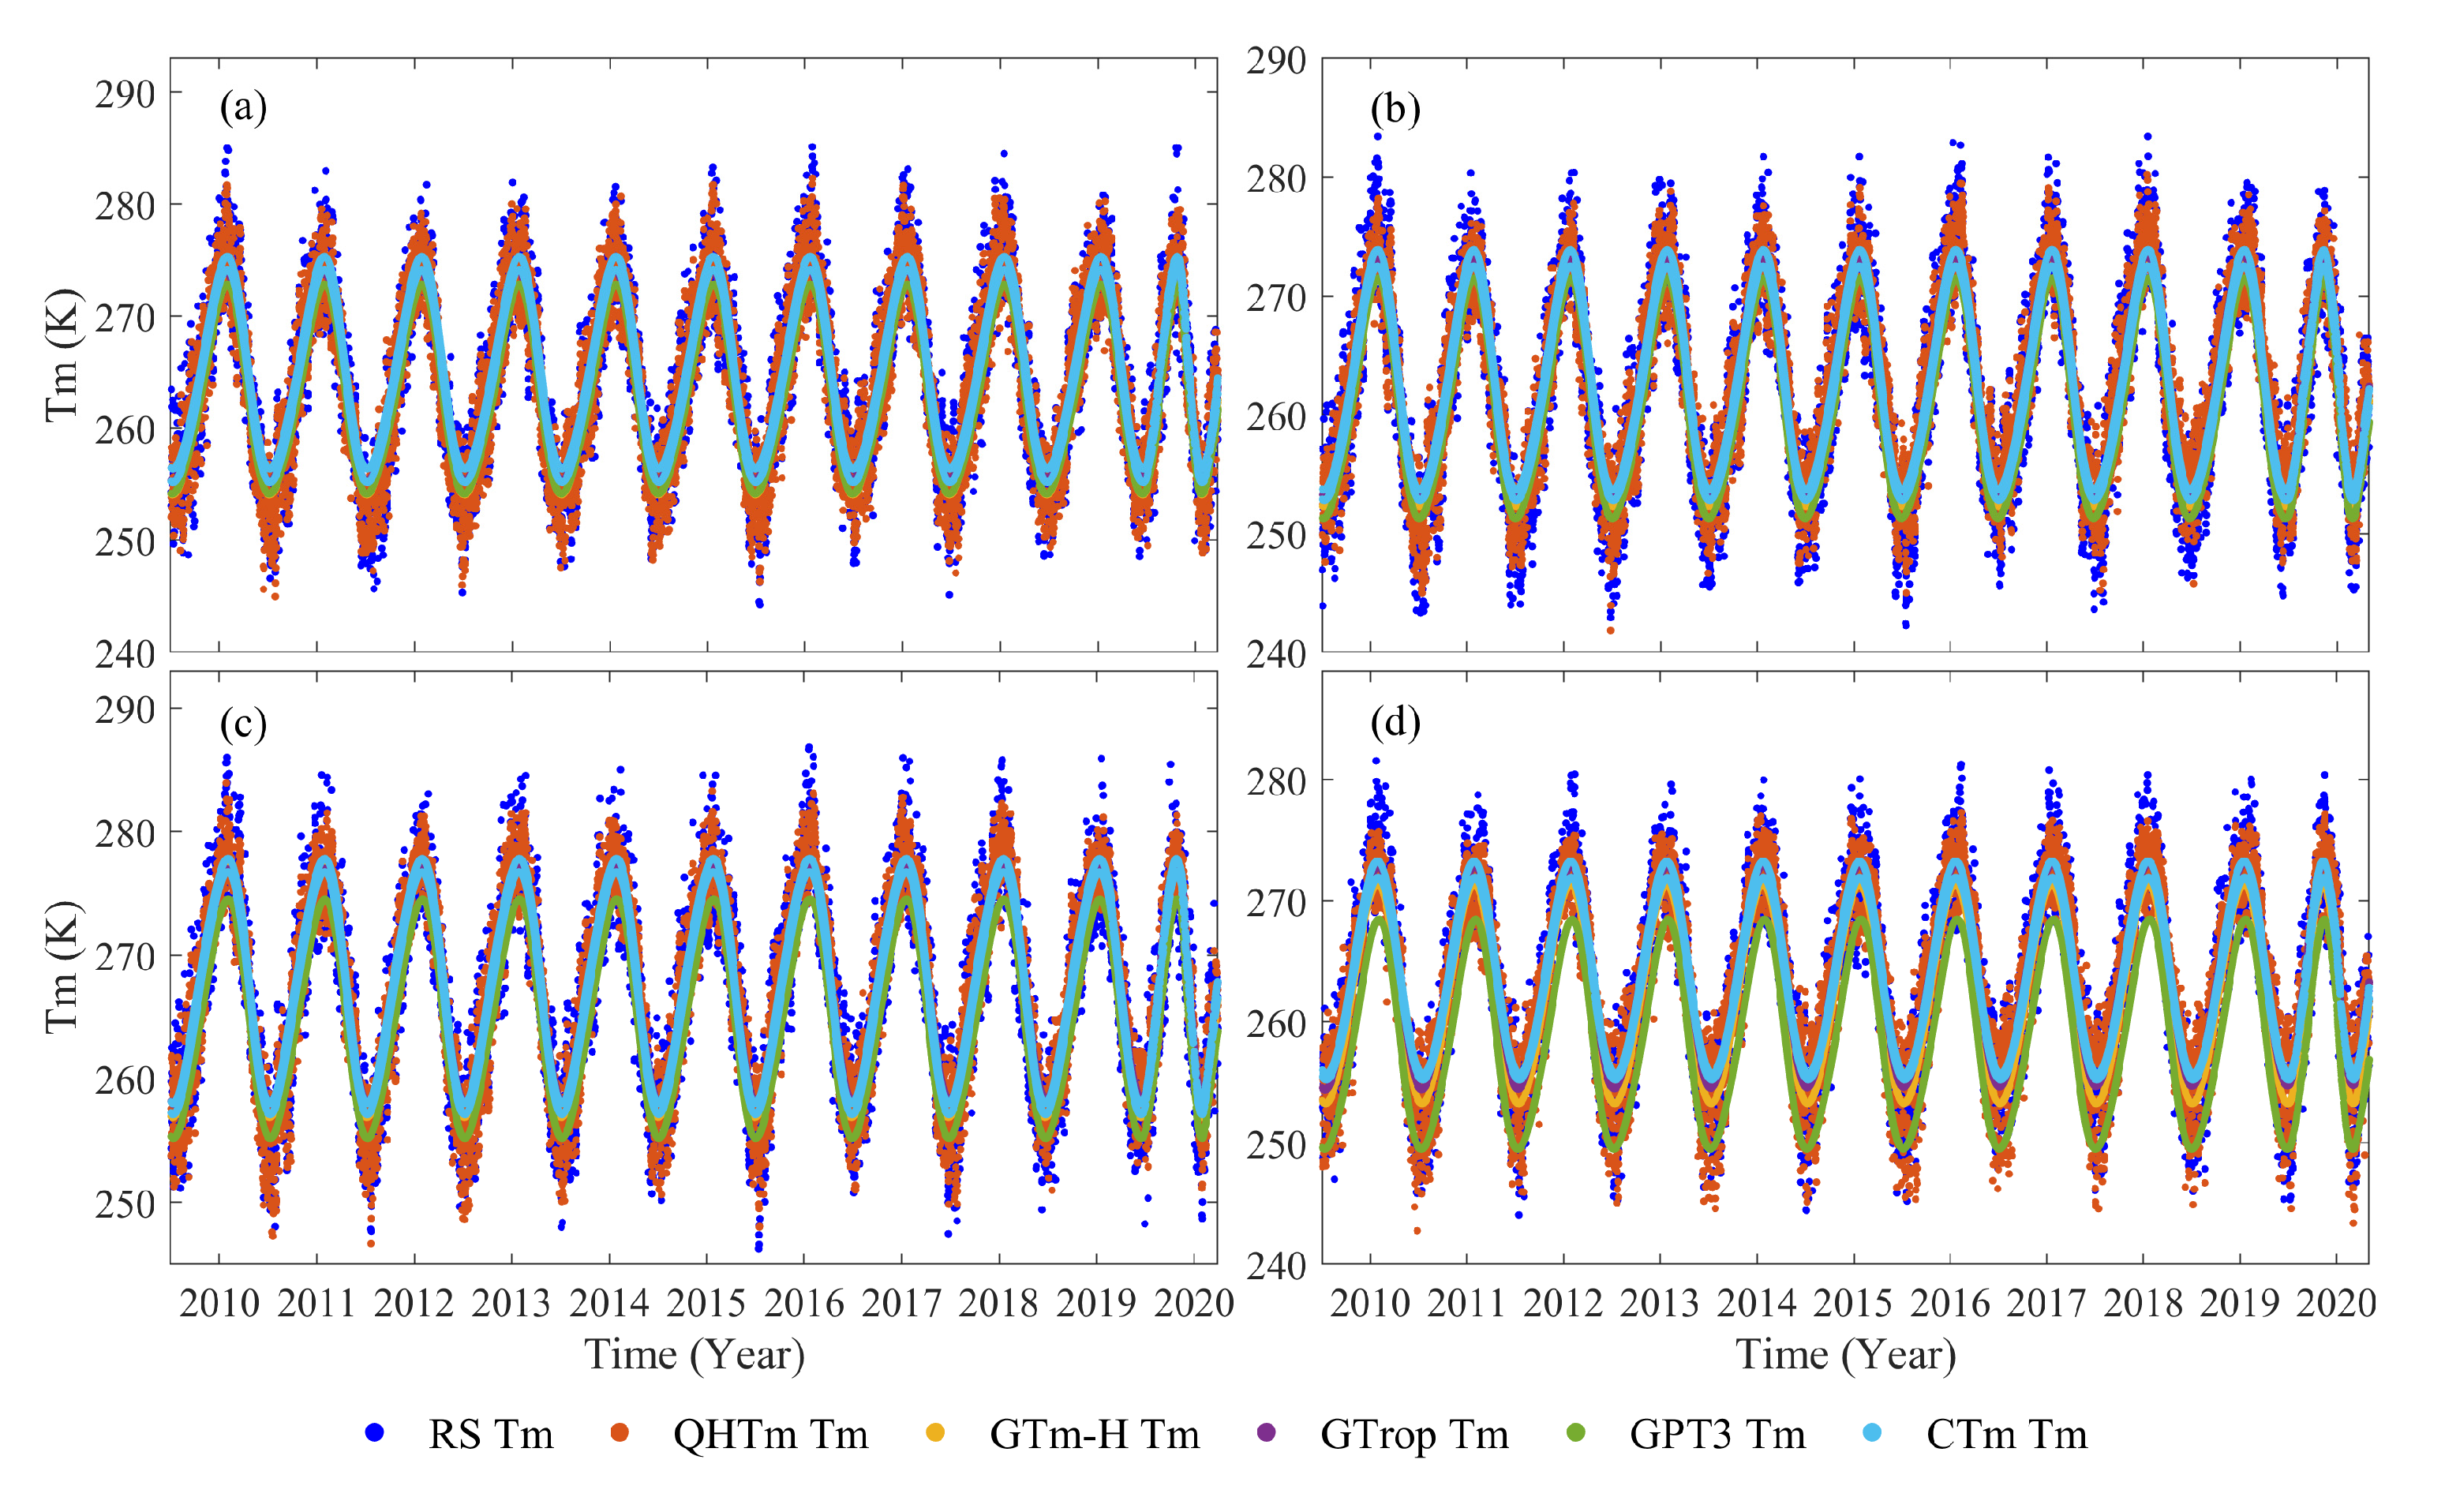
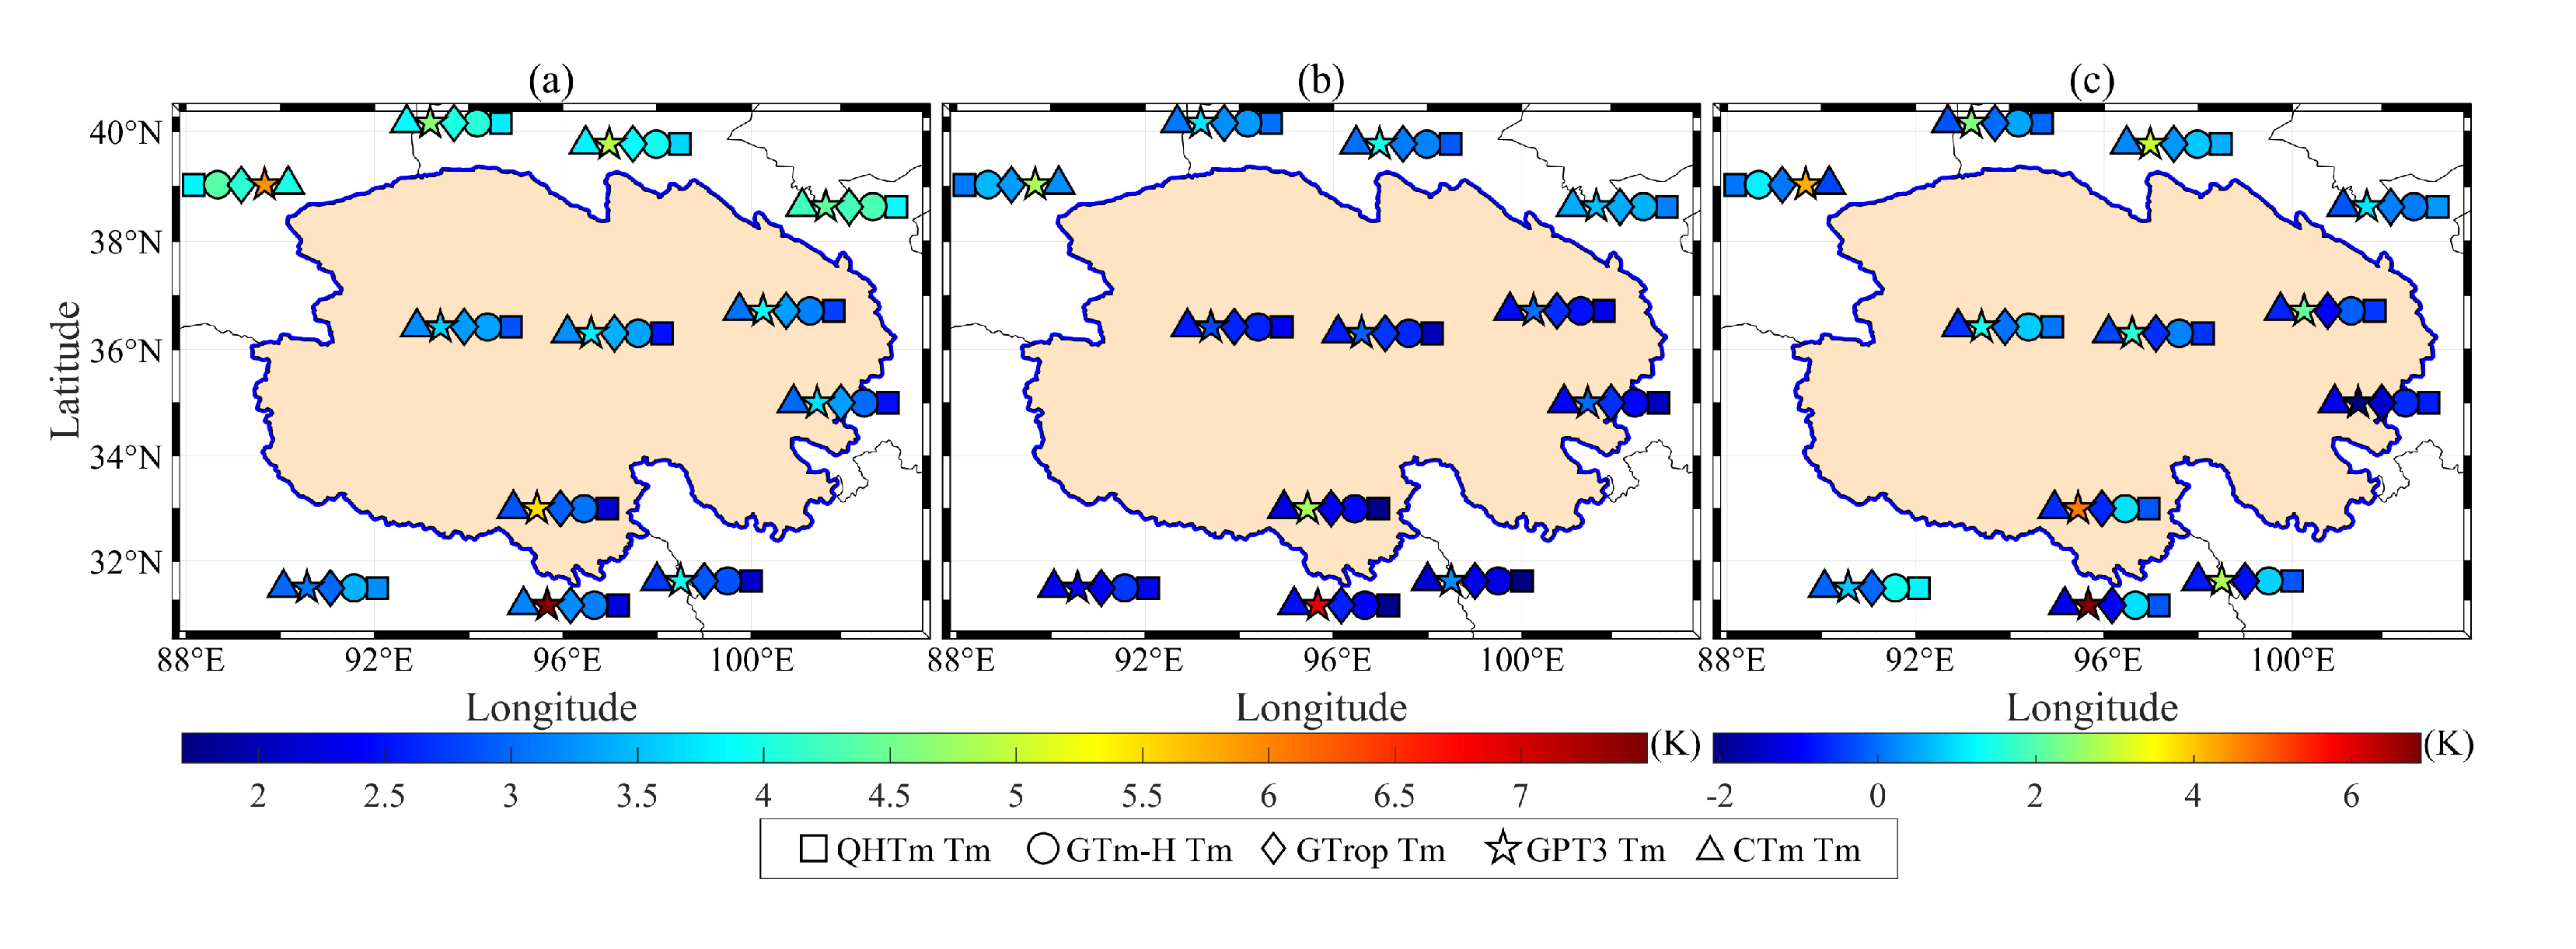
3.2. Establishing of High-Precision Regional Tm Model

Yao et al. [33] have shown that Tm closely correlates with T and water vapor pressure, and they used this correlation to reflect seasonal and geographic changes in the calculation of Tm, annual and semi-annual cycles. Wang et al. [34] noted that T and RH profiles can be used to calculate Tm, suggesting that Tm is also closely related to humidity. Therefore, the influences of numerous factors, such as P, T, RH and seasonal changes, were considered comprehensively in the present study to construct the regional QH-Tm model specific to Qinghai Province. The model expression is as follows:
T m = T m 0 + a * T + b * P + c * R H + A 1 * cos d o y 365.25 2 π φ 1 + A 2 * cos d o y 365.25 4 π φ 2
where T m 0 is the initial value of Tm, a, b and c are coefficients of T, P and RH, respectively; A1, and A2 are the respective amplitudes of annual and semi-annual cycles, respectively; φ 1 and φ 2 are the phases of the annual and semi-annual cycles, respectively; and doy is the day of the year. The coefficients above can be estimated using the least squares method.
To verify the precision of the QH-Tm model proposed herein, the Tm calculated by RS data is served as the standard for comparison with current mainstream Tm calculation models, namely GTm-H, GTrop, GPT3 and CTm models. Figure 3 shows a comparison of a long-term series of changes in the 6 Tm models at four RS stations over the period of January 2010 to December 2020. The Tm calculated by the QH-Tm model was closer to that of the RS-derived Tm, whereas the Tm values calculated by the other models were relatively lower. Figure 4 and Table 2 show comparative statistical results for each station and the overall results over the period of January 2010 to December 2020, respectively. Figure 4 shows that the Tm models have similar RMS, where the GPT3 model had the largest RMS. These findings suggested that the precision of the Tm models was relatively high while that of the GPT3 model was relatively lower. The statistics in Table 2 show that the RMS of the QH-Tm, GTm-H, GTrop, GPT3, and CTm models were, respectively, 2.96/3.50/3.47/4.57/3.35 K, suggesting that the QH-Tm model had the highest precision. This model also had the smallest MAE and the least bias, which further showed that the QH-Tm model has the highest precision and could be applied to calculate PWV in Qinghai.

3.3. Subsection

One of the key factors for calculating PWV is ZTD, the precision of which contributes to ~75% of the impact on PWV [35]. The ZTD data is estimated using PPP technique and compared with the collocated RS stations to verify the precision of the GNSS-derived ZTD data. The colocation principle dictates that the distance between a CORS and an RS station is less than 10 km and that elevation is less than 100 m. Figure 5 shows a ZTD density map of the selected colocation station at GERM over the period of January 2018 to February 2021. It can be found that the GNSS- and RS-derived ZTD were consistent, with a close correlation of 0.95, which passed the significance test (p < 0.05). The statistics showed that the RMS, MAE and bias between GNSS- and RS-derived ZTD were 13.2, 10.3 and −1.8 mm, respectively. These results showed that the GNSS-derived ZTD calculated using the PPP technique has good precision and meets the requirements of PWV retrieval.

3.4. Evaluation of GNSS-Derived PWV

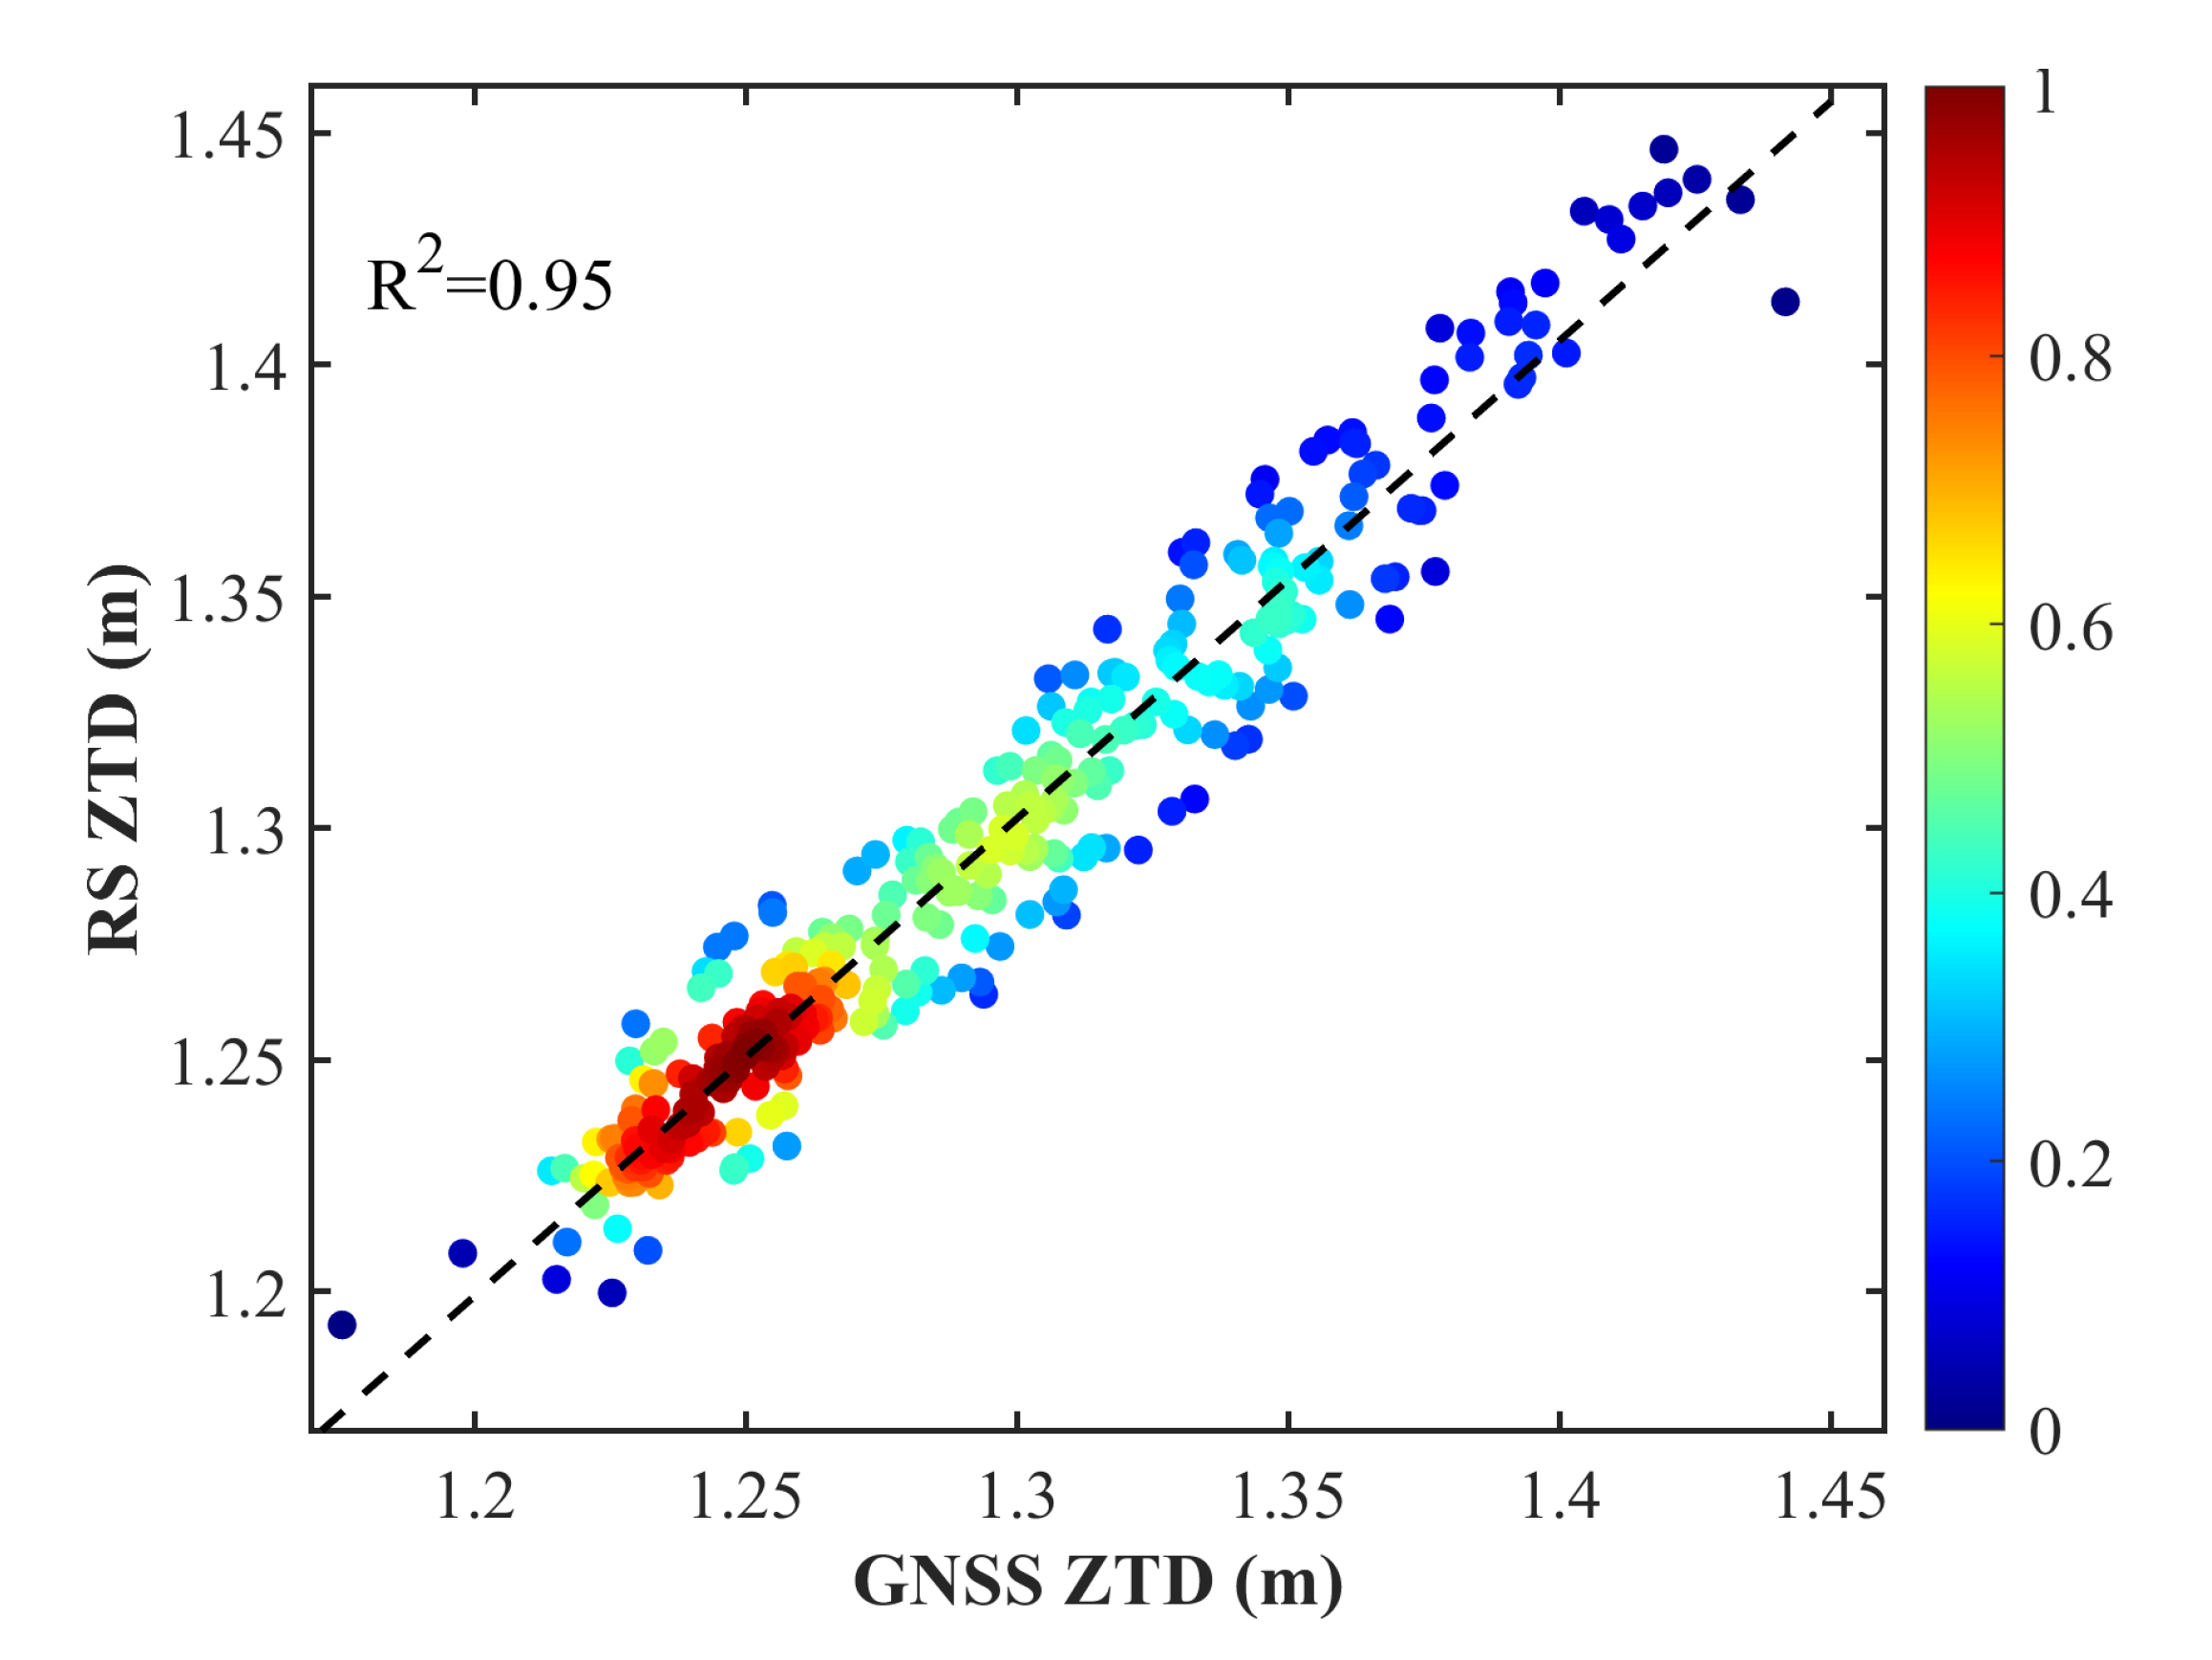
3.4.1. Theoretical Precision of GNSS-Derived PWV

The formula for calculating PWV in Equation (4) shows that the precision of PWV is mainly affected by parameters, such as ZTD, ZHD and Tm, whereas the precision of ZHD is primarily influenced by P. To further determine the impact of these factors on PWV, the theoretical precision of PWV was calculated according to the law of error propagation as follows [35]:
σ P W V = σ Z T D Q 2 + 2.2767 σ P f ( λ , H ) Q 2 + P σ c f ( λ , H ) Q 2 + P W V σ Q Q 2
where σ P W V is the error of PWV, σ Z T D is the error of ZTD, σ P is the error of pressure, and σ Q is the error of the conversion coefficient Q between ZWD and PWV, and σ c = 0.0024 refers to the value used in a study by [12]. f ( λ , H ) = ( 1 0.00266 cos ( 2 φ ) 0.00028 H ) . φ is the latitude, and H is the station height. This formula was applied to calculate the theoretical precision of PWV in Qinghai with the RMS of approximately 1.99 mm.

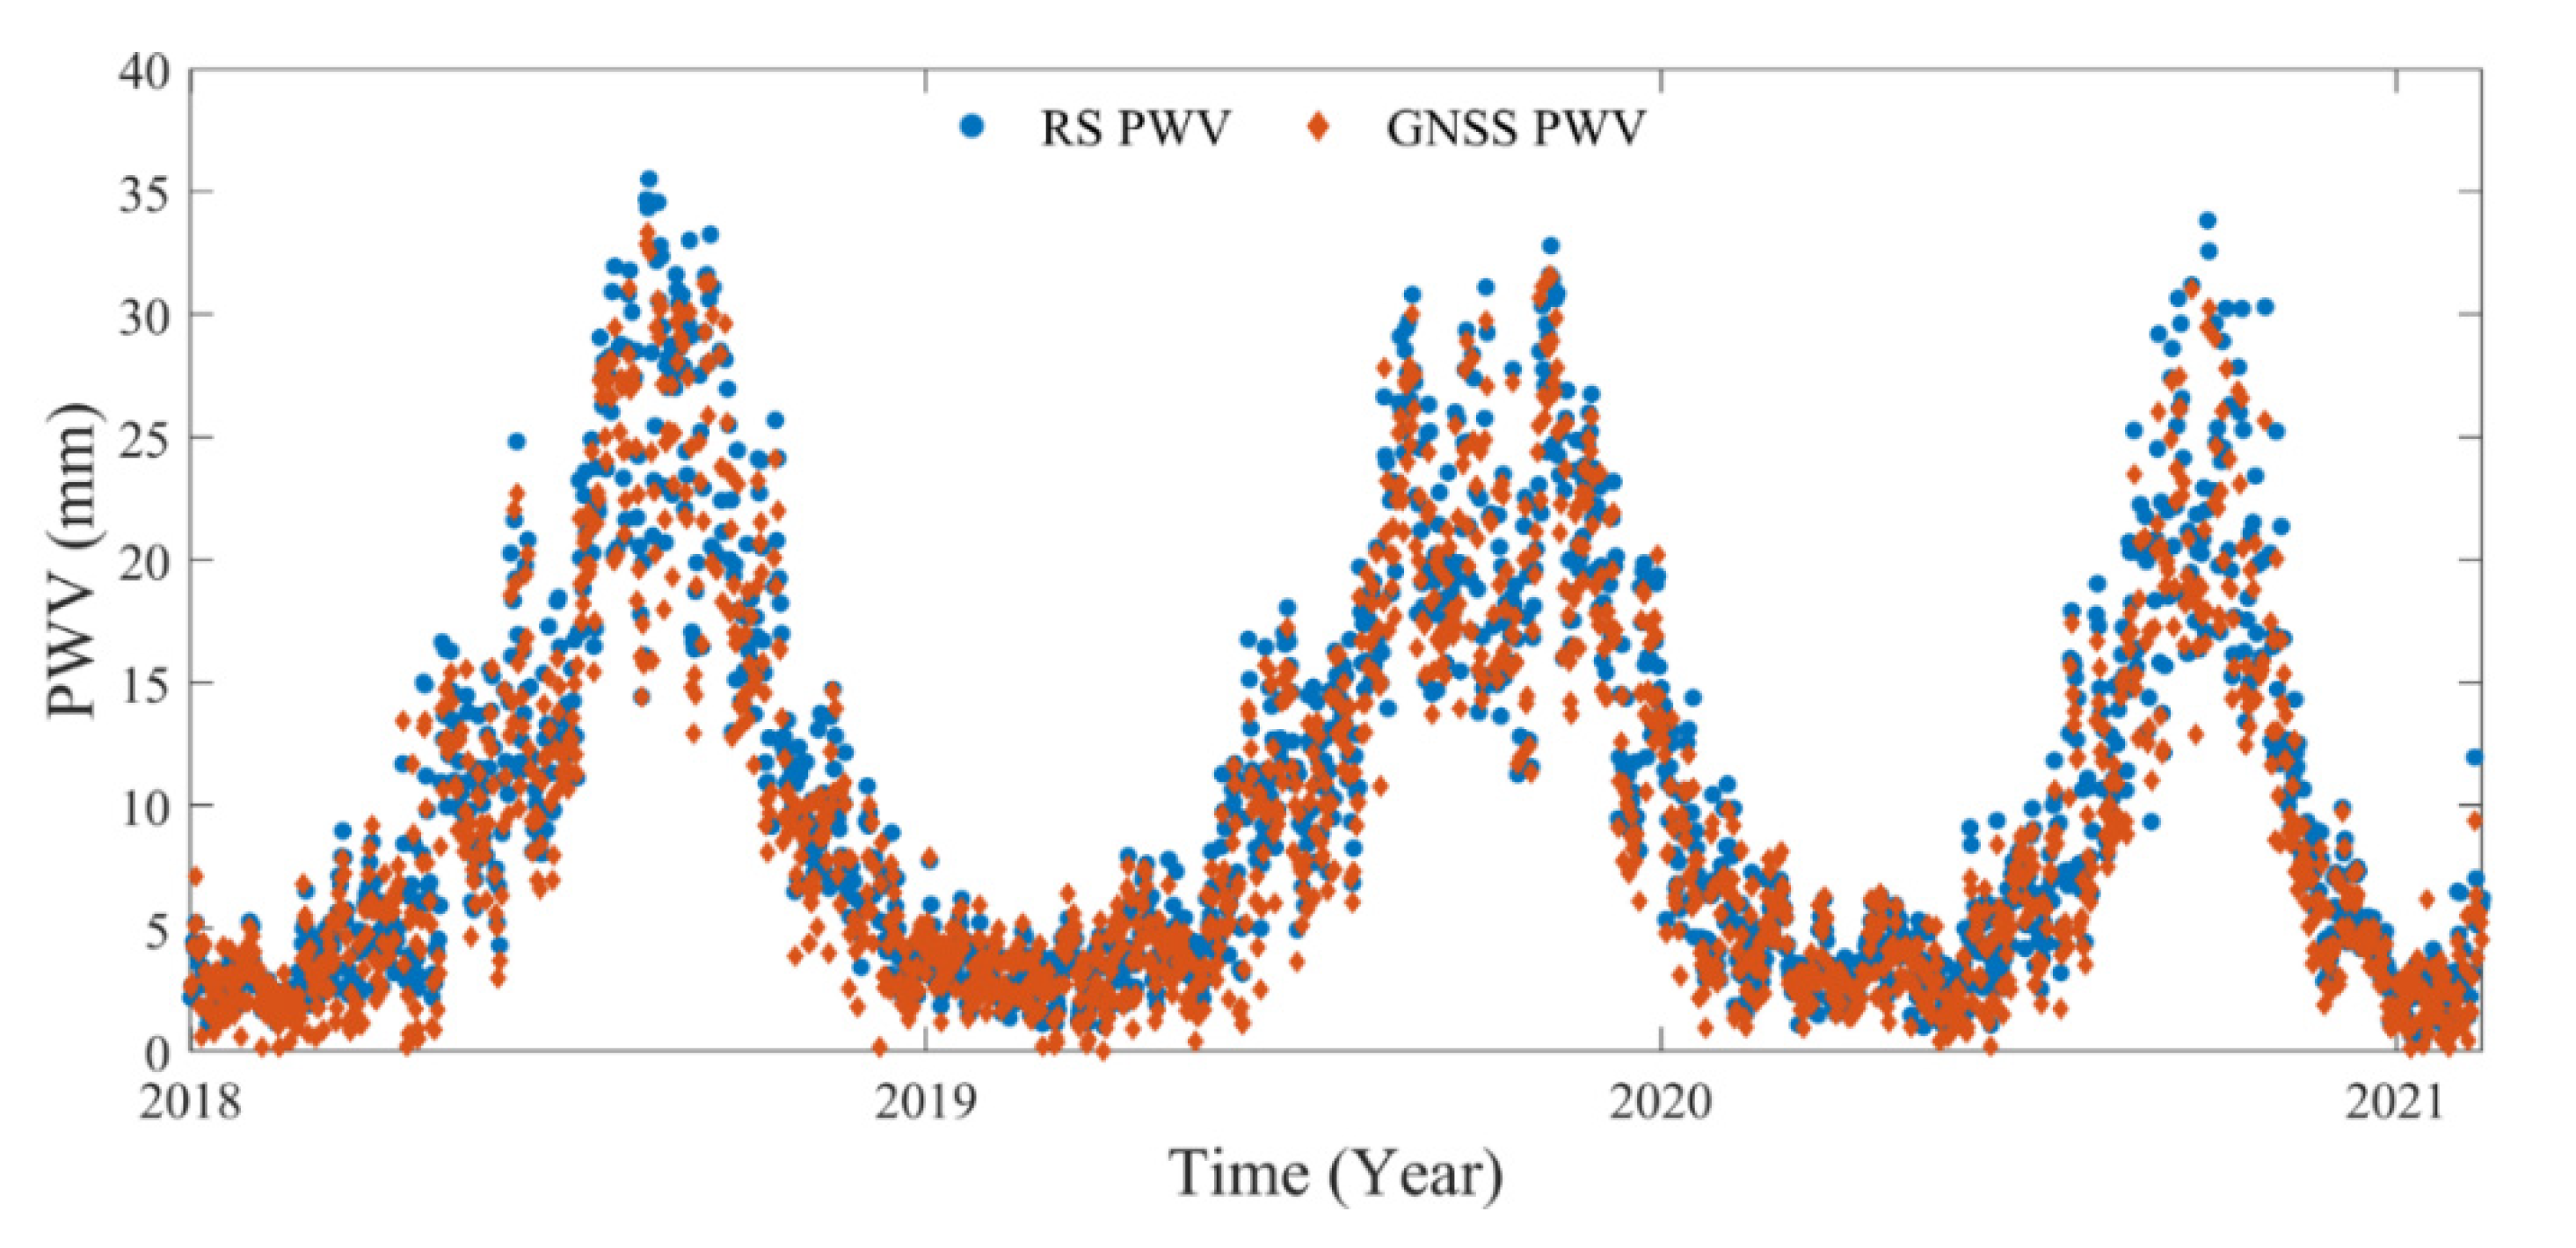
3.4.2. Practical Precision of GNSS-Derived PWV

1. Comparison at specific stations.
The PWV from RS data is calculated and compared with GNSS-derived PWV in this section. Figure 6 shows the long-term series of changes in RS- and GNSS-derived PWV trends at one colocated station over the period of January 2018 to February 2021. It can be observed that the PWV trends in changes were essentially the same between them, as obvious annual periodical changes could be observed. Figure 7 also shows a comparison of ERA5-provided PWV and GNSS-derived PWV at 74 GNSS stations in Qinghai that further verified the precision of GNSS-derived PWV. The overall precision of the GNSS-derived PWV in Qinghai was relatively high, except for some relatively large values at a few stations. Table 3 shows the statistical results of the precision comparison between RS-/ERA5- and GNSS-derived PWV. The RMS, MAE, and bias for the differences between GNSS and RS/ERA5 were 2.69/2.09/−0.22 and 2.16/1.68/0.20 mm, respectively, all of which were less than 3 mm. Therefore, the precision of the PWV in Qinghai retrieved from GNSS data is relatively high. The actual precision of PWV was lower than the theoretical precision, which is primarily because the ERA5 dataset is a reanalyzed product, which has certain disparities from the actual data, and all data contain some inherent errors. As the ERA5-provided P and T were used to calculate PWV, the results of the comparison were better for ERA5-derived PWV than that from RS-derived PWV.
2. Comparison of PWV spatial distributions
To analyze whether the calculated PWV derived from GNSS was spatially consistent with the ERA5-provided PWV, hourly PWV of the 74 CORS in Qinghai in 2019 were spatially interpolated using the Delaunay triangulation method, and a planar PWV with a spatial resolution of 0.25° × 0.25° was obtained. Thereafter, the ERA5-provided PWV was compared with GNSS-derived PWV during spring, summer, autumn and winter, respectively. Figure 8 shows the spatial distribution of GNSS- and ERA5-derived PWV and their differences during the four seasons of 2019. Because CORS are rather scant in western Qinghai, the GNSS-derived PWV data in the western part contained numerous blank areas. It can be observed that the spatial variations of GNSS- and ERA5-derived PWV followed the same pattern, with relatively low and high PWV levels in the western and the eastern regions, respectively. In addition, the differences are relatively smaller for the areas with low elevation while it is large for areas with high elevation. After the altitude correction of ERA-derived PWV is performed, we also calculated the PWV statistical result of GNSS-derived PWV at specific stations (Table 4). It shows that ERA5- and GNSS-derived PWV were relatively high, with a large difference between the two in summer and autumn and a relatively small difference in spring and winter. These findings were in line with changing trends in precipitation in Qinghai, again revealing the potential of using GNSS-derived PWV for meteorological application.

4. Application Analysis of GNSS-Derived PWV for Rainfall and Drought

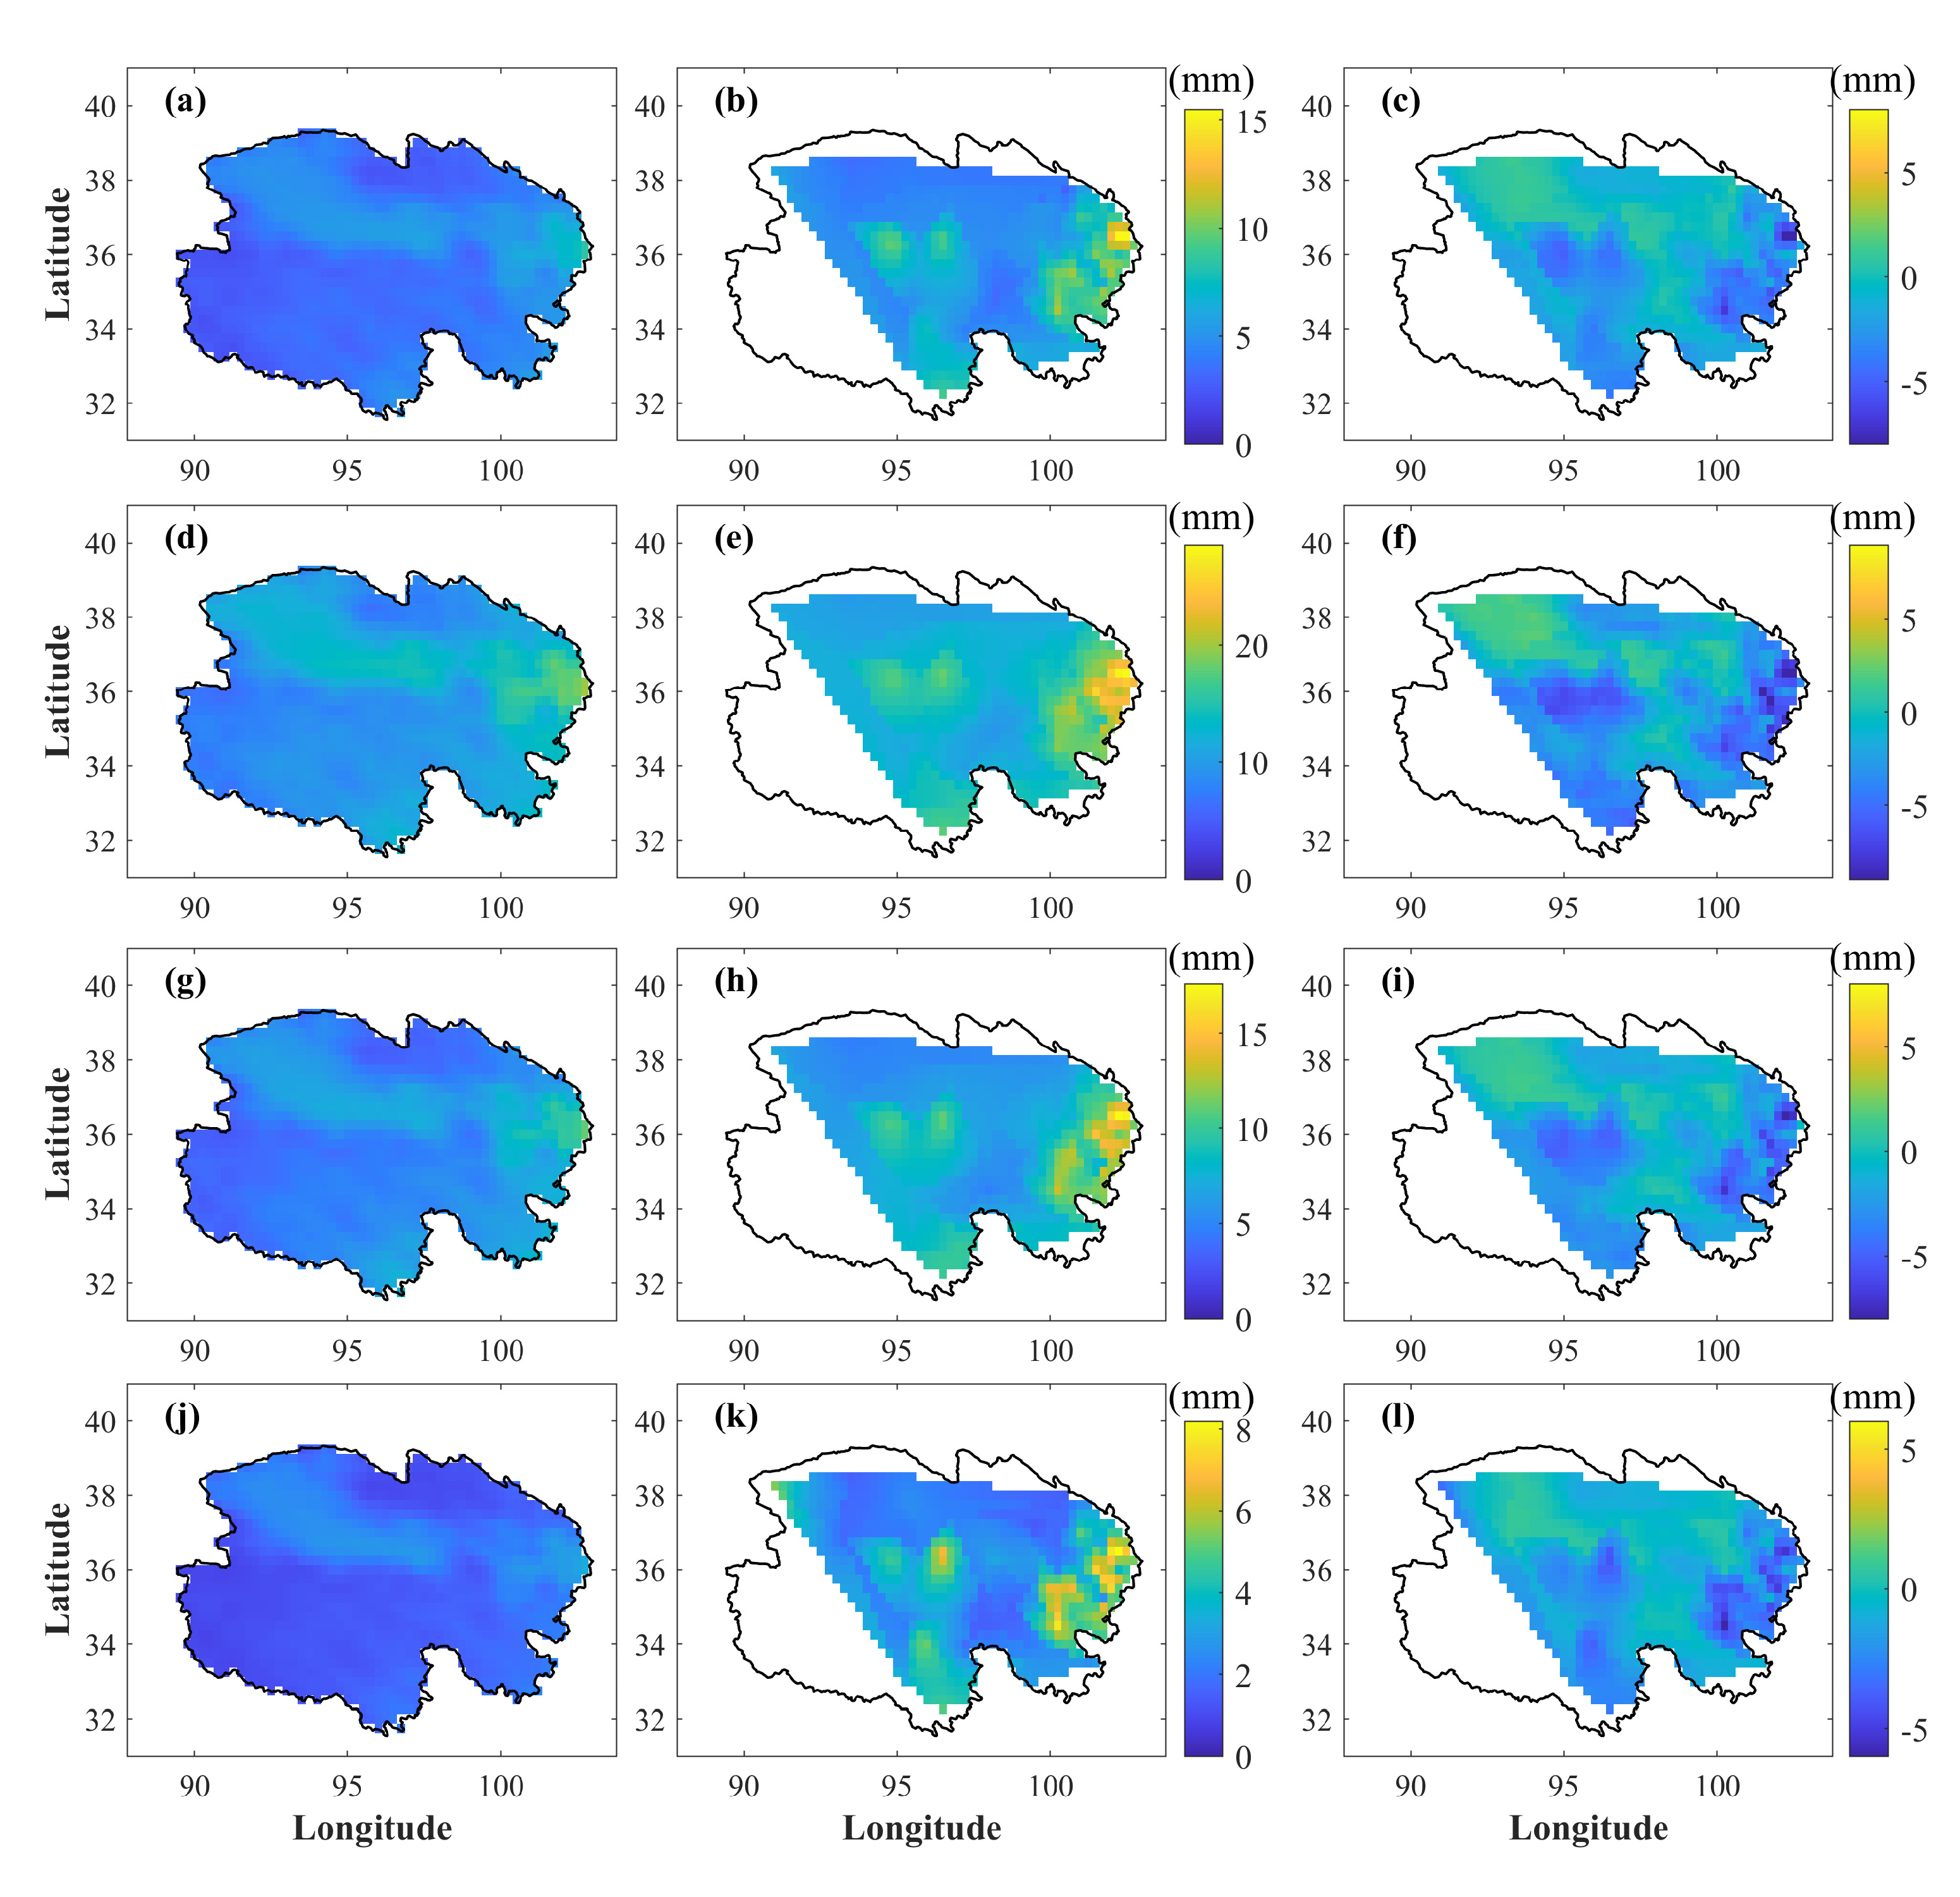
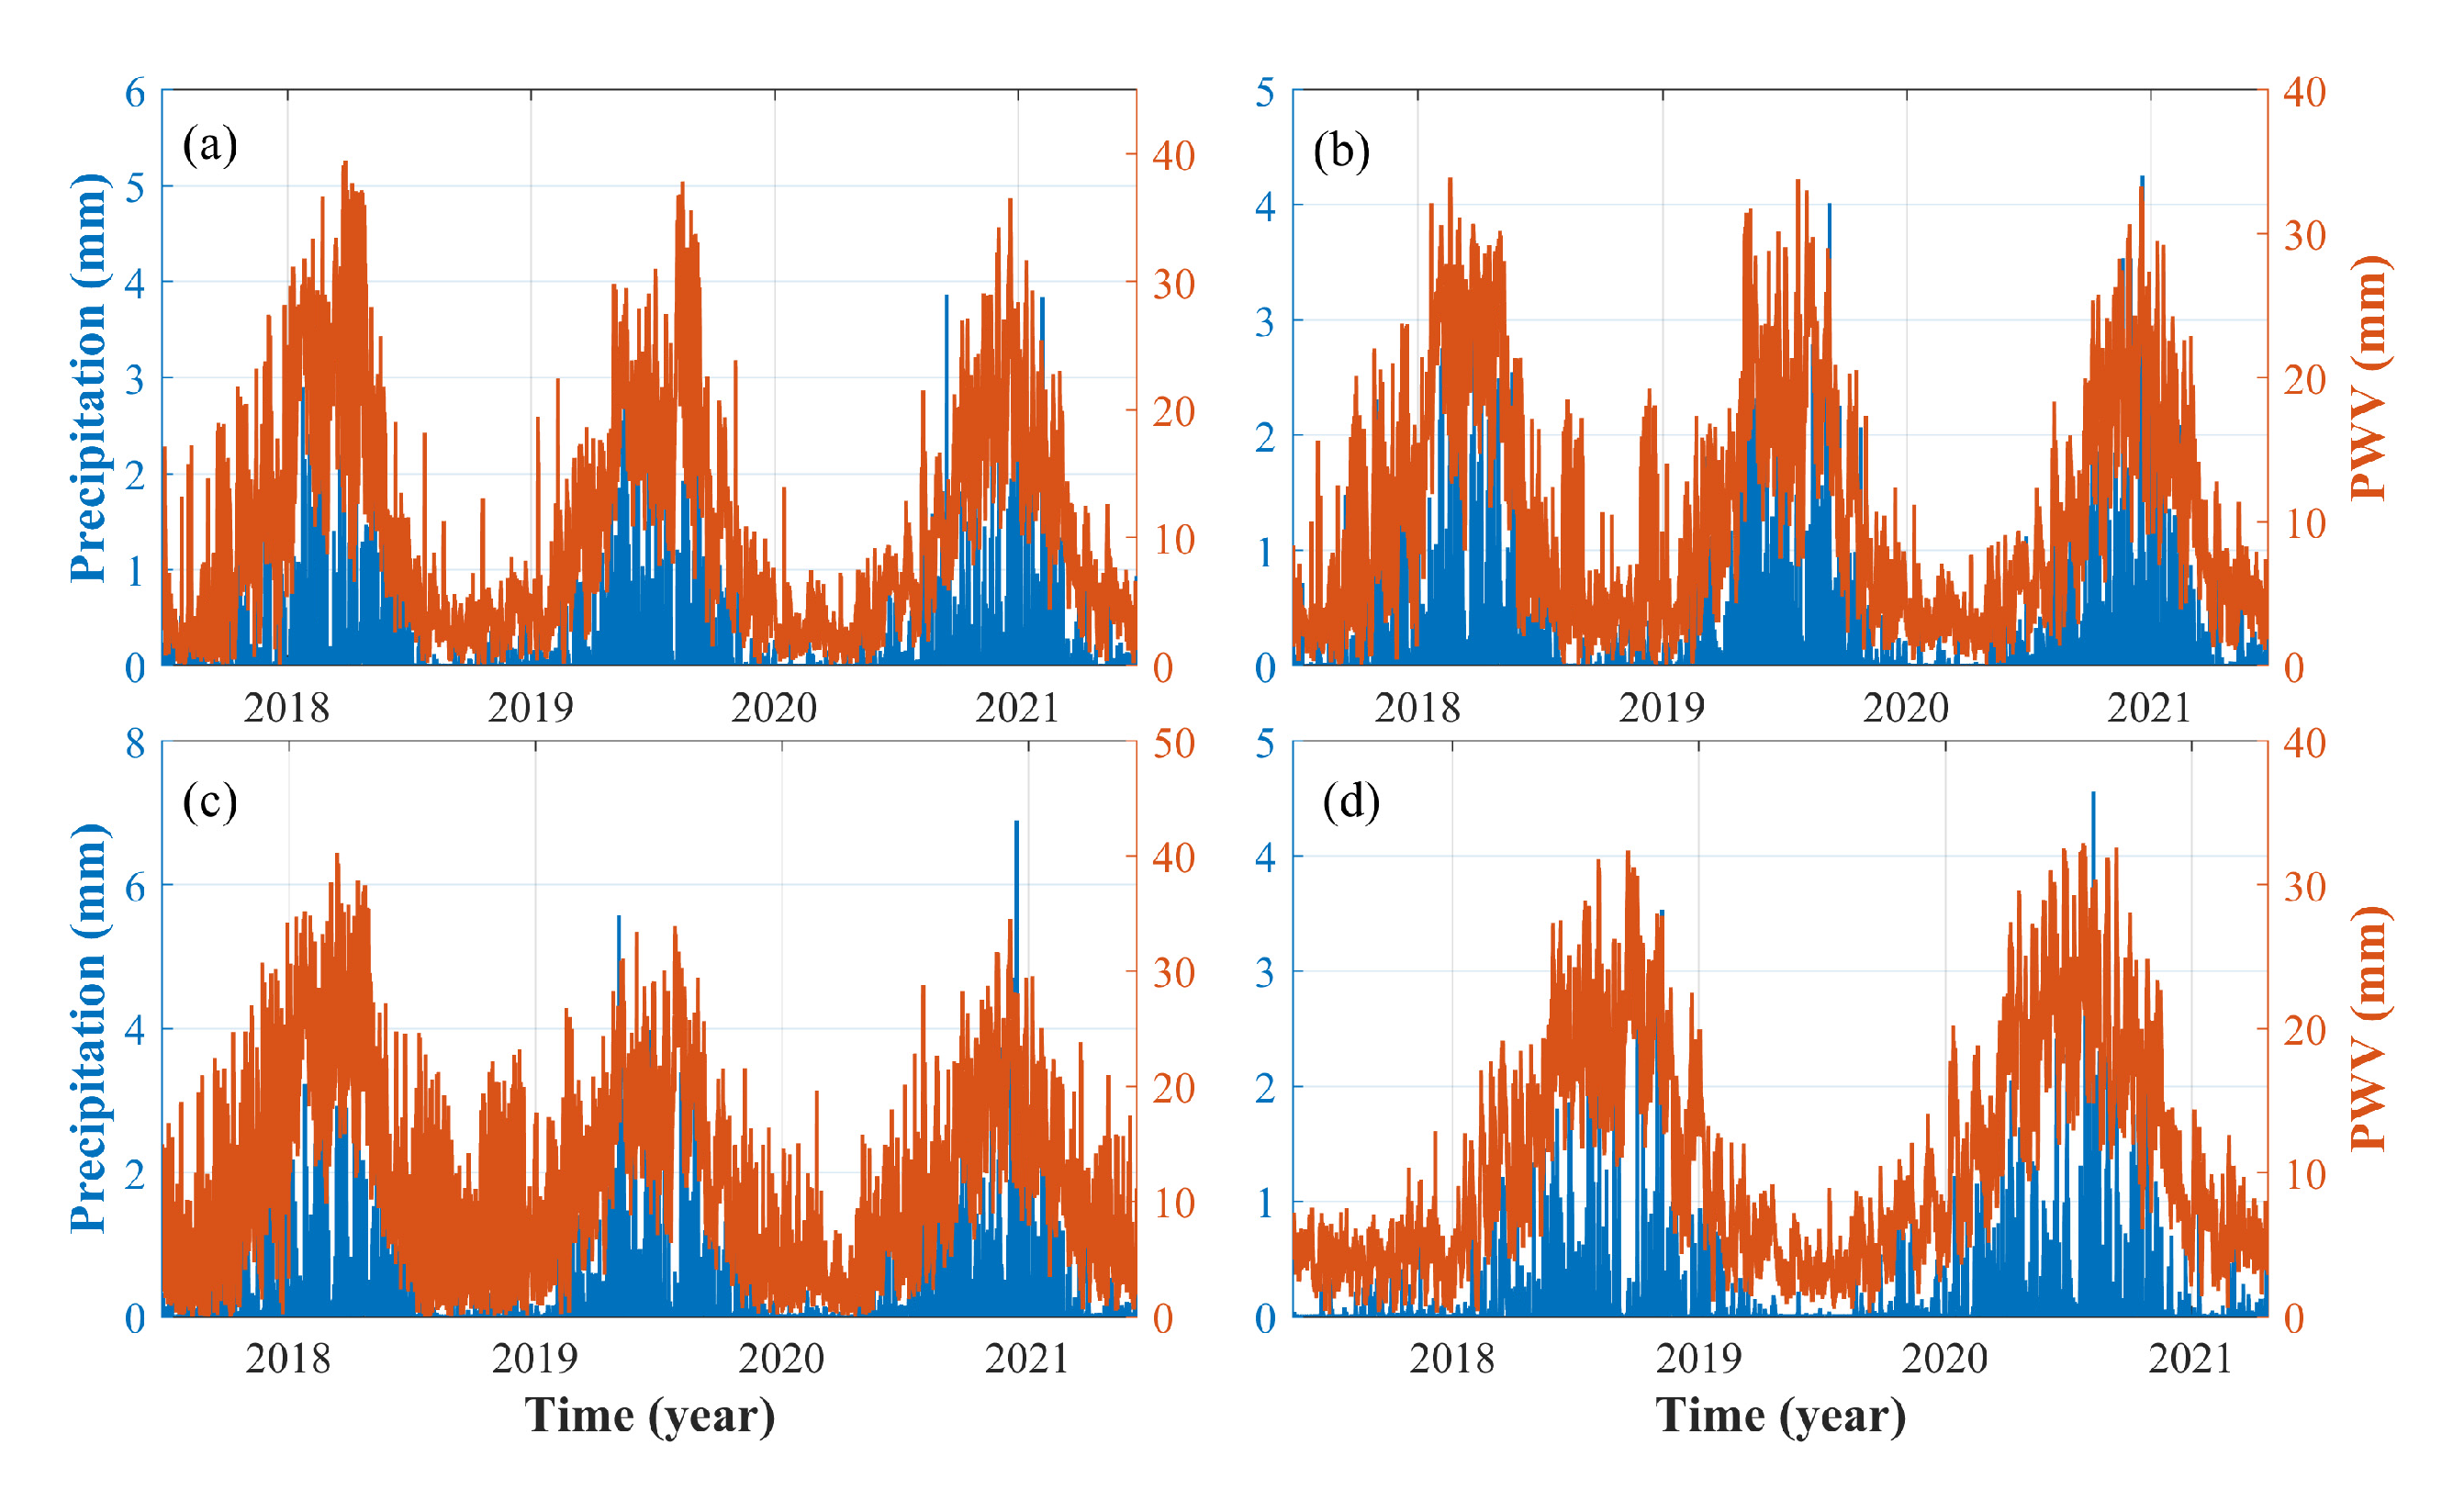
4.1. GNSS-Derived PWV and Rainfall Analysis

The relationship between PWV and extreme rainfall is explored in this section based on GNSS-derived PWV and rainfall data in the eastern part of Qinghai. Figure 9 shows changes in seasonal cycles of PWV and rainfall over the period of January 2018 to February 2021 at four CORS stations (BADT, BAHY, BAHZ and XNIN) in Xining. The amount of rainfall was significantly increased and decreased when the PWV value increased and decreased, respectively. That shows that the consistency between rainfall trends and changes in PWV was remarkable. We further investigated the spatial variations of ERA5-provided rainfall and the GNSS-derived PWV in eastern Qinghai over the period of June to September 2019 (Figure 10). The results show relatively consistent spatial distribution characteristics of PWV and rainfall, being relatively high and low in the eastern and western regions, respectively. Rainfall occurred in areas with high PWV levels, further verifying that the evident relationship existed between PWV and extreme rainfall events.

4.2. GNSS-Derived PWV and Drought Analysis

In addition to analyzing the relationship between PWV and extreme rainfall events, the relationship with drought monitoring is also explored. SPEI is a famous drought monitoring index, which has been widely used on the global scale. Therefore, the SPEI and GNSS-derived PWV data recorded between January 2018 and December 2020 at the NMUH and QHGE stations is first calculated in Qinghai, where the GNSS and the weather station were colocated. The SPEI is calculated using the corresponding data derived from meteorological stations [36]. Figure 11 presents the PWV and SPEI on a monthly scale over the period of January 2010 to December 2020 at the NMUH and QHGE stations. It can be observed that the SPEI and PWV trends were opposite; that is, as the PWV value increased, the SPEI value decreased, and vice versa. The correlations between the SPEI and PWV calculated for the NMUH and QHGE stations were −0.702 and −0.877, respectively, both of which passed the significance test (p < 0.05). These findings indicated that SPEI and PWV were negatively correlated, suggesting that the occurrence of drought can be reflected by the changes in PWV.

5. Conclusions

In this paper, GNSS data from CORS station in Qinghai and the ERA5-provided P and T data are used to calculate PWV. The precision of ERA5-provided P and T, as well as GNSS-derived ZTD, were first evaluated using RS data as the benchmark. After that, the regional QH-Tm model for Qinghai considering the influences of P, T, RH and seasonal changes is established and verified. Then, the theoretical and actual precision of GNSS-derived PWV is calculated in Qinghai area. Finally, the relationships between GNSS-derived PWV and rainfall/drought are demonstrated in Qinghai. The results showed that the ERA5-provided P and T have relatively high precision. Compared with the RS-provided P and T, the average RMS, MAE and bias were 1.06/0.85/0.01 hPa and 2.98/2.42/0.03 K, respectively. The proposed QH-Tm model was more precise than the GTm-H, GTrop, GPT3 and CTm models, with average RMS, MAE and bias of 2.96, 2.37 and −0.02 K, respectively. The calculated theoretical precision of GNSS-derived PWV was 1.99 mm, while the actual calculated precision of GNSS-derived PWV was 2.69 and 2.16 mm compared with the RS- and ERA5-derived PWV, respectively. Finally, the findings of the relationship between GNSS-derived PWV and rainfall/drought showed that PWV was highly consistent during both events. Such results further verified the potential of using GNSS-derived PWV for rainfall and drought studies in Qinghai, which will be significant for studying water vapor distribution and climate change in this region.

Author Contributions

Conceptualization, S.Z., F.L. and H.L.; methodology, S.Z. and Q.Z.; software, F.L. and Q.C.; validation, S.Z., W.M., J.L. and Y.H.; writing—original draft preparation, S.Z. and F.L.; writing—review and editing, H.L., Q.Z. and Q.C.; visualization, S.Z., F.L., W.M. and J.L.; All authors have read and agreed to the published version of the manuscript.

Funding

This research was supported by the National key research and development plan (2019YFA0606902), and the Chinese Academy of Sciences Strategic Pilot Class A Special Project (XDA2009000002).

Institutional Review Board Statement

Not applicable.

Informed Consent Statement

Not applicable.

Data Availability Statement

Not applicable.

Acknowledgments

The authors would like to thank Qinghai CORS for providing high quality GNSS observations. The ECMWF and IGRA are also thanked for providing the corresponding data.

Conflicts of Interest

The authors declare that they have no known competing financial interests or personal relationships that could have appeared to influence the work reported in this paper.

References

  1. Zhao, Q.; Liu, Y.; Ma, X.; Yao, W.; Yao, Y.; Li, X. An improved rainfall forecasting model based on GNSS observations. IEEE Trans. Geosci. Remote Sens. 2020, 58, 4891–4900. [Google Scholar] [CrossRef]
  2. Zhao, Q.; Liu, Y.; Yao, W.; Yao, Y. Hourly rainfall forecast model using supervised learning algorithm. IEEE Trans. Geosci. Remote Sens. 2021, 60, 1–9. [Google Scholar] [CrossRef]
  3. Wong, M.S.; Jin, X.; Liu, Z.; Nichol, J.; Chan, P.W. Multi-sensors study of precipitable water vapour over mainland China. Int. J. Climatol. 2015, 35, 3146–3159. [Google Scholar] [CrossRef]
  4. Trenberth, K.E.; Fasullo, J.; Smith, L. Trends and variability in column-integrated atmospheric water vapor. Clim. Dyn. 2005, 24, 741–758. [Google Scholar] [CrossRef]
  5. Zhao, Q.; Su, J.; Xu, C.; Yao, Y.; Zhang, X.; Wu, J. High-precision ZTD model of altitude-related correction. IEEE J. Sel. Top. Applided Earth Obs. Remote Sens. 2023, 16, 609–621. [Google Scholar] [CrossRef]
  6. Han, Y.; Westwater, E.R. Remote Sensing of Tropospheric Water Vapor and Cloud Liquid Water by Integrated Ground-Based Sensors. J. Atmos. Ocean. Technol. 1995, 12, 1050–1059. [Google Scholar] [CrossRef]
  7. Madhulatha, A.; Rajeevan, M.; Venkat Ratnam, M.; Bhate, J.; Naidu, C.V. Nowcasting severe convective activity over southeast India using ground-based microwave radiometer observations. J. Geophys. Res. Atmos. 2013, 118, 1–13. [Google Scholar] [CrossRef] [Green Version]
  8. Adeyemi, B.; Joerg, S. Analysis of water vapor over Nigeria using radiosonde and satellite data. J. Appl. Meteorol. Climatol. 2012, 51, 1855–1866. [Google Scholar] [CrossRef]
  9. Bevis, M.; Businger, S.; Chiswell, S.; Herring, T.A.; Anthes, R.A.; Rocken, C.; Ware, R.H. GPS meteorology: Mapping zenith wet delays onto precipitable water. J. Appl. Meteorol. 1994, 33, 379–386. [Google Scholar] [CrossRef]
  10. Basili, P.; Bonafoni, S.; Mattioli, V.; Ciotti, P.; Pierdicca, N. Mapping the atmospheric water vapor by integrating microwave radiometer and GPS measurements. IEEE Trans. Geosci. Remote Sens. 2004, 42, 1657–1665. [Google Scholar] [CrossRef]
  11. Bevis, M.; Businger, S.; Herring, T.A.; Rocken, C.; Anthes, R.A.; Ware, R.H. GPS meteorology: Remote sensing of atmospheric water vapor using the global positioning system. J. Geophys. Res. Atmos. 1992, 97, 15787–15801. [Google Scholar] [CrossRef]
  12. Zhang, W.; Lou, Y.; Haase, J.S.; Zhang, R.; Zheng, G.; Huang, J.; Shi, C.; Liu, J. The use of ground-based GPS precipitable water measurements over China to assess radiosonde and ERA-Interim moisture trends and errors from 1999 to 2015. J. Clim. 2017, 30, 7643–7667. [Google Scholar] [CrossRef]
  13. Zhao, Q.; Yao, Y.; Yao, W.Q.; Li, Z. Near-global GPS-derived PWV and its analysis in the El Niño event of 2014–2016. J. Atmos. Sol. Terr. Phys. 2018, 179, 69–80. [Google Scholar] [CrossRef]
  14. Wu, M.; Jin, S.; Li, Z.; Cao, Y.; Ping, F.; Tang, X. High-Precision GNSS PWV and Its Variation Characteristics in China Based on Individual Station Meteorological Data. Remote Sens. 2021, 13, 1296. [Google Scholar] [CrossRef]
  15. Benevide, P.; Catalao, J.; Miranda, P.M.A. On the inclusion of GPS precipitable water vapour in the nowcasting of rainfall. Nat. Hazards Earth Syst. Sci. 2015, 15, 2605–2616. [Google Scholar] [CrossRef] [Green Version]
  16. Huelsing, H.K.; Wang, J.H.; Mears, C.; Braun, J.J. Precipitable water characteristics during the 2013 Colorado flood using ground-based GPS measurements. Atmos. Meas. Tech. 2017, 10, 4055–4066. [Google Scholar] [CrossRef] [Green Version]
  17. Jiang, W.P.; Yuan, P.; Chen, H.; Cai, J.Q.; Li, Z.; Chao, N.F.; Sneeuw, N. Annual variations of monsoon and drought detected by GPS: A case study in Yunnan, China. Sci. Rep. 2017, 7, 5874. [Google Scholar] [CrossRef] [PubMed] [Green Version]
  18. Zhao, Q.; Ma, X.; Yao, W.; Liu, Y.; Yao, Y. A drought monitoring method based on precipitable water vapor and precipitation. J. Clim. 2020, 33, 10727–10741. [Google Scholar] [CrossRef]
  19. Zhao, Q.; Ma, X.; Yao, W.; Yao, Y. A new typhoon-monitoring method using precipitation water vapor. Remote Sens. 2019, 11, 2845. [Google Scholar] [CrossRef] [Green Version]
  20. Landskron, D.; Böhm, J. VMF3/GPT3: Refined discrete and empirical troposphere mapping functions. J. Geod. 2018, 92, 349–360. [Google Scholar] [CrossRef] [PubMed]
  21. Yao, Y.; Sun, Z.; Xu, C.; Xu, X. Global Weighted Mean Temperature Model Considering Nonlinear Vertical Reduction. Geomat. Inf. Sci. Wuhan Univ. 2019, 44, 106–111. [Google Scholar]
  22. Sun, Z.; Zhang, B.; Yao, Y. A global model for estimating tropospheric delay and weighted mean temperature developed with atmospheric reanalysis data from 1979 to 2017. Remote Sens. 2019, 11, 1893. [Google Scholar] [CrossRef] [Green Version]
  23. Huang, L.; Peng, H.; Liu, L.; Li, C.; Kang, C.; Xie, S. An empirical atmospheric weighted mean temperature model considering the lapse rate function for China. Acta Geod. Et Cartogr. Sin. 2020, 49, 432–442. [Google Scholar]
  24. Hoffmann, L.; Günther, G.; Li, D.; Stein, O.; Wu, X.; Griessbach, S.; Heng, Y.; Konopka, P.; Müller, R.; Vogel, B.; et al. From ERA-Interim to ERA5: The considerable impact of ECMWF’s next-generation reanalysis on Lagrangian transport simulations. Atmos. Chem. Phys. 2019, 19, 3097–3124. [Google Scholar] [CrossRef] [Green Version]
  25. Hersbach, H.; Bell, B.; Berrisford, P.; Hirahara, S.; Horányi, A.; Muñoz-Sabater, J.; Simmons, A. The ERA5 global reanalysis. Q. J. R. Meteorol. Soc. 2020, 146, 1999–2049. [Google Scholar] [CrossRef]
  26. Shoji, Y.; Sato, K.; Yabuki, M.; Tsuda, T. Comparison of shipborne GNSS-derived precipitable water vapor with radiosonde in the western North Pacific and in the seas adjacent to Japan. Earth Planets Space 2017, 69, 13. [Google Scholar] [CrossRef]
  27. Barrett, B.S.; Campos, D.A.; Veloso, J.V.; Rondanelli, R. Extreme temperature and precipitation events in March 2015 in central and northern Chile. J. Geophys. Res. Atmos. 2016, 121, 4563–4580. [Google Scholar] [CrossRef] [Green Version]
  28. Yang, P.; Zhao, Q.; Li, Z.; Yao, W.; Yao, Y. High temporal resolution global PWV dataset of 2005–2016 by using a neural network approach to determine the mean temperature of the atmosphere. Adv. Space Res. 2021, 67, 3087–3097. [Google Scholar] [CrossRef]
  29. Jiang, C.; Xu, T.; Wang, S.; Nie, W.; Sun, Z. Evaluation of Zenith Tropospheric Delay Derived from ERA5 Data over China Using GNSS Observations. Remote Sens. 2020, 12, 663. [Google Scholar] [CrossRef] [Green Version]
  30. Saastamoinen, J. Atmospheric correction for the troposphere and stratosphere in radio ranging satellites. Use Artif. Satell. Geod. 1972, 15, 247–251. [Google Scholar]
  31. Aliyu, Y.A.; Botai, J.O. Appraising the effects of atmospheric aerosols and ground particulates concentrations on GPS-derived PWV estimates. Atmos. Environ. 2018, 193, 24–32. [Google Scholar] [CrossRef] [Green Version]
  32. Zhao, Q.; Yang, P.; Yao, W.; Yao, Y. Hourly PWV dataset derived from GNSS observations in China. Sensors 2020, 20, 231. [Google Scholar] [CrossRef] [Green Version]
  33. Yao, Y.; Zhang, B.; Xu, C.; Yan, F. Improved one/multi-parameter models that consider seasonal and geographic variations for estimating weighted mean temperature in ground-based GPS meteorology. J. Geod. 2014, 88, 273–282. [Google Scholar] [CrossRef]
  34. Wang, J.; Zhang, L.; Dai, A. Global estimates of water-vapor-weighted mean temperature of the atmosphere for GPS applications. J. Geophys. Res. Atmos. 2005, 110. [Google Scholar] [CrossRef] [Green Version]
  35. Ning, T.; Wang, J.; Elgered, G.; Dick, G.; Wickert, J.; Bradke, M.; Sommer, M.; Querel, R.; Smale, D. The uncertainty of the atmospheric integrated water vapour estimated from GNSS observations. Atmos. Meas. Tech. 2016, 9, 79–92. [Google Scholar] [CrossRef] [Green Version]
  36. Vicente-Serrano, S.M.; Beguería, S.; López-Moreno, J.I.; Angulo, M.; El Kenawy, A. A global 0.5° gridded dataset (1901–2006) of a multiscalar drought index considering the joint effects of precipitation and temperature. J. Hydrometeorol. 2010, 11, 1033–1043. Available online: http://digital.csic.es/handle/10261/23906 (accessed on 6 September 2021). [CrossRef] [Green Version]
Figure 1. Geographical distributions of GNSS and RS stations in Qinghai Province.
Atmosphere 14 00517 g001
Figure 2. RMS, MAE and Bias of P and T between RS and ERA5 in Qinghai province over the period of 2018−2021, where (a,d) represents the RMS, (b,e) refer to the MAE, and (c,f) are the Bias of P and T, respectively.
Atmosphere 14 00517 g002
Figure 3. Comparison of a long-term series of changes in the six Tm models at four RS stations over the period of January 2010 to December 2020, where (ad) are CHM818, CHM836, CHM866 and CHM029, respectively.
Atmosphere 14 00517 g003
Figure 4. Distributions of RMS, MAE and bias of five Tm models in Qinghai Province over the period of January 2010 to December 2020, where (ac) refer to the RMS, MAE and Bias, respectively.
Atmosphere 14 00517 g004
Figure 5. ZTD density map of the selected colocation station of GERM between GNSS and RS over the period of January 2018 to February 2021.
Atmosphere 14 00517 g005
Figure 6. Long-term series of changes in RS- and GNSS-derived PWV trends at one colocated station over the period of January 2018 to February 2021.
Atmosphere 14 00517 g006
Figure 7. Comparison of ERA5-provided PWV and GNSS-derived PWV at 74 CORS in Qinghai over the period of January 2018 to February 2021, where (ac) refer to the RMS, MAE and Bias, respectively.
Atmosphere 14 00517 g007
Figure 8. Spatial distribution of GNSS- and ERA5-derived PWV and their differences during the four seasons of 2019, where the (a,d,g,j) are the ERA5-provided PWV at four seasons, respectively, (b,e,h,k) are the GNSS-derived PWV at four seasons, respectively, (c,f,i,l) are the PWV difference between ERA5 and GNSS at four seasons, respectively.
Atmosphere 14 00517 g008
Figure 9. Changes in trends of PWV and rainfall between January 2018 and February 2021 at four CORS stations in Xining, where (ad) refer to BADT, BAHY, BAHZ and XNIN stations, respectively.
Atmosphere 14 00517 g009
Figure 10. Spatial variations of ERA5-provided rainfall and the GNSS-derived PWV in eastern Qinghai between June and September 2019, where (a,c,e,g) refer the precipitation of June, July, August and September of 2019, respectively, (b,d,f,h) refer the PWV of June, July, August and September of 2019, respectively.
Atmosphere 14 00517 g010
Figure 11. PWV and SPEI time series on a monthly scale between January 2010 and December 2020 at the NMUH and QHGE stations, where (a,b) are the NMUH and QHGE stations, respectively.
Atmosphere 14 00517 g011
Table 1. Statistical result of average RMS, MAE and bias for ERA5-provided P and T at the eight RS stations over the period of 2018–2021.
IndexP (hPa)T (K)
RMS1.062.98
MAE0.852.42
Bias0.010.03
Table 2. Statistical result of RMS, MAE and bias of five Tm models in Qinghai Province over the period of January 2010 to December 2020.
Index (K)QHTmGTm-H GTrop GPT3 CTm
RMS2.963.503.474.573.35
MAE2.372.782.783.772.67
Bias−0.020.58−0.422.41−0.50
Table 3. Statistical result of RMS, MAE and bias of PWV between GNSS and RS/ERA5 over the period of January 2018 to February 2021.
Index (mm)RMSMAEBias
GNSS vs. RS2.692.09−0.22
GNSS vs. ERA52.161.680.20
Table 4. Statistical result of averaged PWV and their differences in four season in 2019.
SeasonsERA5GNSSDifference
Spring4.006.07−1.81
Summer10.6413.83−2.60
Autumn5.497.76−1.88
Winter1.683.28−1.48
Disclaimer/Publisher’s Note: The statements, opinions and data contained in all publications are solely those of the individual author(s) and contributor(s) and not of MDPI and/or the editor(s). MDPI and/or the editor(s) disclaim responsibility for any injury to people or property resulting from any ideas, methods, instructions or products referred to in the content.

