Article

Estimation and Analysis of Seasonal Rainfall Distribution and Potential of Türkiye and Its 25 Main Watersheds

by
Hasan Hüseyin Aksu
Department of Architecture and Urban Planning, GIS Division, Bucak Emin Gülmez Technical Sciences and Vocational School of Higher Education, Burdur Mehmet Akif Ersoy University, 15300 Burdur, Türkiye
Atmosphere 2023, 14(5), 800; https://doi.org/10.3390/atmos14050800
Submission received: 13 March 2023 / Revised: 17 April 2023 / Accepted: 24 April 2023 / Published: 27 April 2023

Abstract

:
In this study, the seasonal rainfall distribution in Türkiye and its 25 main watersheds were estimated, and potentials were calculated and analyzed. Empirical Bayesian kriging (EBK) and ordinary kriging (OK) methods were applied in interpolations. The calculations were made through EBK, which provided the highest estimation accuracy in all seasons. In winter, which is the season with the highest rainfall, Türkiye’s rainfall depth is 208.8 mm, and its volume is 162.87 billion m3. In summer, the season with the lowest rainfall, Türkiye’s rainfall depth is 61.7 mm, and its volume is 48.13 billion m3. The watersheds with the highest rainfall depth are Antalya (480.1 mm) in winter, Ceyhan (222.8 mm) in spring, and East Black Sea in summer (197.5 mm) and autumn (299.7 mm). Conversely, the watersheds with the lowest precipitation depth are Aras (74.9 mm) in winter, Little Meander (16.5 mm) in summer, and Konya in spring (131.3 mm) and autumn (86.2 mm). In summer, rainfall shortage is observed in all watersheds in the Central and Southern parts of Türkiye. As we go from the north to the south, the watersheds’ seasonal rainfall depths and shares become more irregular and variable.

1. Introduction

Along with being an essential source of life for all living beings on Earth, water is also an irreplaceable element for civilization, economic development, and even national security. While the total amount of fresh water in the world remains constant, the use of freshwater has constantly increased. Freshwater use throughout the world has increased more than six times since 1900 [1]. As of the 1980s, this rate has been increasing by approximately 1% per year [2]. Studies on water usage in the future suggest that by the year 2050, water demand will increase between 20% and 55% [3,4,5]. Population growth, economic development, and changing consumption habits may be considered among the main factors that increase water usage. This increasing demand for freshwater will increase both the pressure on existing water resources and the challenges in the water supply of countries. As a result, the competition for freshwater resources will increase.
Another factor increasing the pressure on freshwater resources is climate change. The changes in precipitation and temperature patterns will directly impact the terrestrial water budget [6]. Because of its geographical position, Türkiye is one of the countries that will be largely affected by climate change [7]. Therefore, it is predicted that the precipitation levels will gradually reduce at various rates in the watersheds located in central and southern Türkiye [8,9].
Watershed-based water management is one of the methods necessary to protect and sustain water resources against the increasing water demand and the drought that may occur because of climate change. In line with the Water Framework Directive of the European Union, Türkiye continues to work for watershed-based water management with a holistic approach.
Rainfall is the source of fresh water, which is the main source of life. It is the primary factor to be considered when creating sustainable water resource use and policies. Therefore, it is essential to identify the most real-like pattern and potential of rainfall. Temporally and spatially, precipitation is the most unstable and irregular meteorological element. Thus, building a denser observation network is necessary. Rainfall observation can be conducted at specific points and reflects the value of the points. In hydrological studies, the spatial rainfall value obtained from the point value is used [10,11,12].
The conditions required to identify a spatial–temporal pattern and the potential of rainfall are an optimum observation network representing the research area and the optimum interpolation technique.
Prediction errors generally decrease as the station density and precipitation recording period increase and increase as precipitation depth increases. Frequent measurement networks reduce errors but increase observation costs. Thus, it is necessary to find the optimum measurement network. The World Meteorological Organization (WMO) determines the standards on this matter [13]. Accordingly, in regions such as Türkiye, there should be at least one station for every 2500 km2, and the observation period of these stations should be at least 30 years. Türkiye, which has an area of approximately 780,000 km2, requires at least 312 usable rain gauges according to WMO standards.
Türkiye’s topography varies greatly over short distances. This has a significant impact on precipitation patterns and potential. By this topographic structure, precipitations show great temporal and spatial differences in amount and pattern over short distances. On the other hand, Türkiye is affected by polar weather conditions in winter and tropical weather conditions in summer. Therefore, it is crucial to use an observation network that meets the minimum standards of the WMO. The Turkish State Meteorological Service (MGM), the institution that performs meteorological observations and forecasts in Türkiye and provides data to the users, has approximately 250 stations of utilizable quality according to WMO’s standards. These stations were built in city and town centers. In the last 20 years, automated weather observing systems (AWOS) were set at over 2000 points. Since the recording times of these stations have not reached sufficient levels, they are not included in such studies. In addition, The Turkish State Hydraulic Works (DSI), the institution responsible for managing and operating all water resources in Türkiye, also performs hydrometeorological observations in watersheds to use the data in its studies. Therefore, DSI’s data were also used in this study to reach the minimum standards of WMO.
Spatial interpolation is a method for estimating values at locations where no measurements are available based on the values at known locations. It is used to fill in the gaps in spatial data and create continuous surfaces from discrete data points. There are tens of interpolation methods, which may generally be categorized as deterministic and geostatistical methods [11,14,15]. Factors such as the density of the observation network, the aim of the research, and the topographical features of the study area, affect the selection of suitable interpolation techniques [16,17]. In regions with sufficient observational data, predictions provide similar results [18,19,20,21].
There are numerous studies in the literature that were performed using precipitation data of various regions or countries in which geostatistical and deterministic techniques were implemented. The researchers compared interpolation techniques to determine the most suitable estimation method for their research fields and period.
Frazier et al. [20] compared the OK, kriging with external drift (KED), and ordinary cokriging (OCoK) methods using seasonal and annual precipitation data in the Hawaiian Islands. They found that the OK method provided the lowest error statistics. Amini et al. [22] compared regularized spline (RS), natural neighbor (NN), tension spline (TS), universal kriging (UK), OK, and IDW methods using monthly precipitation data in Iran and found that the OK method provided the best performance. Rata et al. [23] compared the OK, KED, and regression-kriging (RK) methods using annual precipitation data in Algeria, and they found that the KED method provided the best performance. Antal et al. [24] compared local polynomial interpolation (LPI), radial basis function (RBF), global polynomial interpolation (GPI), empirical Bayesian kriging regression (EBKR), universal cokriging (UCoK), IDW, and OCoK methods using annual precipitation data in Portugal, and they found that the EBKR method provided the most outstanding performance. Yang and Xing [25] compared kernel interpolation with barrier (KIB), diffusion interpolation with barrier (DIB), IDW, RBF, OK, and EBK methods using precipitation data from different time series in Chongqing (China), and they found that the KIB method provided the highest accuracy. Caloiero et al. [26] compared the IDW, OK, KED, and OCoK methods using monthly precipitation data in New Zealand and found OCoK to be the optimal method. Fung et al. [27] compared the IDW, OK, multi-scale geographical weighted regression (MGWR), and geographical weighted regression (GWR) methods using precipitation data from different periods in Peninsular Malaysia and found MGWR to be the best-performing model.
There are studies in Türkiye in which interpolation methods were compared using precipitation data. Aksu [28] calculated the annual precipitation potential of 25 basins in Türkiye using the OK and IDW methods. Although it was a close call, he reported that the OK method provided a lower error margin. Katipoğlu [29] compared the SK, OK, UK, OCoK, EBK, thin plate spline TPS, spline with tensor (ST), completely regularized spline (CRS), multiquadratic functions (MF), inverse multiquadratic functions (IMF), GPI, LPI, and IDW methods using the seasonal precipitation data of 21 MGM rain gauges for the period between 1966 and 2017. It was found that the OCoK method in winter, the LPI method in summer, and the OK method in autumn provided the best estimation results.
Seasonal precipitation data ensure more accurate intra-year precipitation patterns than annual mean precipitation data. Seasonal precipitation is a factor that makes important contributions to the monitoring of climate change and drought, water resources and watersheds management, and hydrological and agricultural activities. Accurate seasonal rainfall knowledge can facilitate the work of decision-makers in this field.
The objectives of this research are to predict and analyze the watershed-based seasonal precipitation distribution of Türkiye and determine precipitation potential.
After a thorough literature review, it was found that there were no studies in which the watershed-based seasonal potential of precipitation in Türkiye was calculated, and patterns were determined. In this study, two geostatistical (OK and EBK) methods were applied to estimate seasonal precipitations and compared via cross-validation. Unlike the previous studies, this study combined the observational data of two institutions performing precipitation measurements in Türkiye to meet the observation network standards of the WMO. Station density directly affects the estimating method’s performance [18,19,20,21,28].
Türkiye is a water-stressed country, and the annual water amount per person is below 1500 m3 [30]. However, since the early 2000s, water consumption has increased by 40% in Türkiye [28]. The watershed-based water management model is one of the methods to protect and sustain water resources to overcome drought and increase water demand. This study is also important for basin management because Türkiye has been working on a basin-based water management model.
Türkiye is located within the Middle East and Mediterranean regions, one of the countries where the precipitation pattern will be strongly affected by climate change [2,7,8,9]. Therefore, this study is important in tracking the changes in precipitation because climate change has seasonal impacts on different areas and basins.

2. Materials and Methods

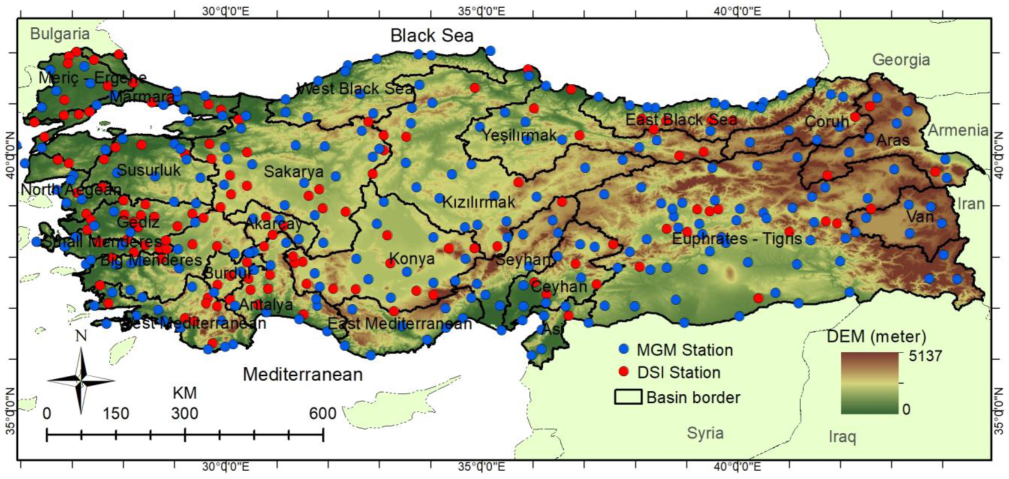
2.1. Study Area and Data
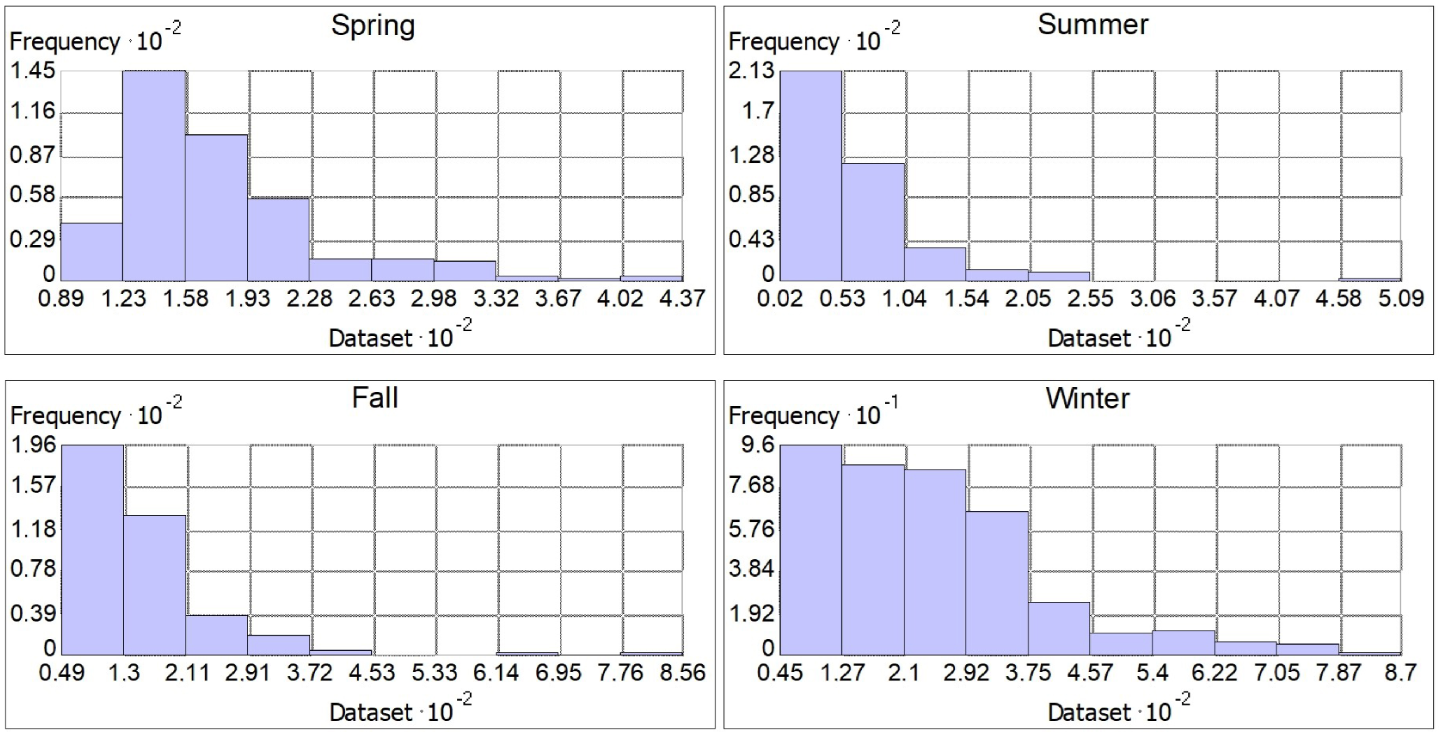
Türkiye, which has a semi-arid climate, is a major peninsula extending east–west along the southern Black Sea, located in the East Mediterranean basin. The average altitude of Türkiye, which can go up to 5137 m, is in the range of 1100–1200 m. The mountains in Türkiye generally lie in the west–east direction. This prevents the country’s interior from having a marine climate and rainfall from the Black Sea north and the Mediterranean south (Figure 1). These factors, such as the particular position of Türkiye, elevation steps, elongation of the mountains, distance from the sea, etc., lead to very distinct climatic conditions and precipitation patterns within short distances between the basins and even within the basins. In general, the seafronts of the mountain ranges are the rainiest areas of Türkiye.
Türkiye, which has approximately 780,000 km2 of surface area, is divided into 25 hydrologic basins; the largest is 175,881.5 km2 (Tigris-Euphrates), and the smallest is 6273.8 km2 (Burdur). The surface areas of 8 basins are below 20,000 km2, and the surface areas of 12 basins are between 20,000 and 30,000 km2. While 8 basins are shoreless, 17 basins are open to the sea. Meriç-Ergene, Asi, Çoruh, Aras, and Tigris-Euphrates are transboundary basins. Annual areal precipitation depths of the basins range between 389.3 mm (Konya) and 1013.7 mm (East Black Sea). The annual precipitation depth is over 800 mm in 4 basins, below 500 mm in 7 basins, and between 500 and 800 mm in 14 basins [28].
MGM is the institution responsible for meteorological observations and weather forecasts in Türkiye. MGM stations with long-term observation data are located in major cities. The DSI also observes precipitations to use the data in their research. In this study, the rainfall values of 391 stations for the period between 1965 and 2018 were used. In total, 254 stations belong to MGM and 137 belong to the DSI. The DSI stations in rural areas complement MGM stations and increase the observation network frequency.

2.2. Methodology

In simple terms, the interpolation methods are techniques used for estimating and reproducing values at unobserved points using the data of points where observations of a variable were made [31]. The geostatistical OK and EBK methods, in which secondary data were not used, were utilized in this study for the spatial interpolation of seasonal precipitations. Since 2015, MGM has been using the OK method to map the precipitation distribution in each period. Geostatistical analyst tools in ArcGIS 10.8 were utilized for the application of interpolation techniques and to generate spatial distribution maps of seasonal rainfall.

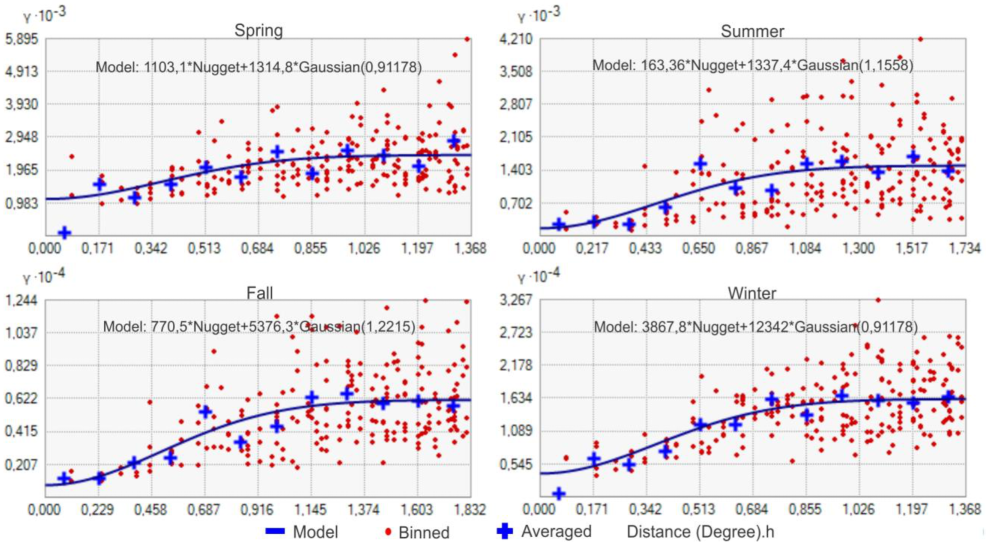
2.2.1. Ordinary Kriging (OK)

Semivariogram analyses form the basis of geostatistics [32,33]. These analyses model the spatial dependence of variables. First, an experimental semivariogram model is calculated and created using measured precipitation data. Second, a theoretical variogram analysis is performed. The most suitable theoretic variogram model based on an algebraic function is adapted to the experimental variogram model obtained in the first step. In this study, the Gaussian theoretical variogram was found to be the most suitable model for all 4 seasons. The experimental and Gaussian theoretic variogram equations are provided below [10,12]:
γ h = 1 2 N   h i = 1 N h Z R i Z R i + h 2 ,
γ h = C 0 + C 1 1 exp 3 h 2 a 2 h 0 .
In these equations, γ h shows the semi-variance function; h shows the Euclidean distance between observation pairs; Z R i shows the seasonal precipitation measured at location i; Z R i + h : shows the seasonal precipitation measured from i location at h distance; N h shows the total number of station pairs at h distance; a shows the range; C 0 shows the nugget effect; C 1 shows the partial sill. After determining the theoretic variogram model of the variable through the algebraic equation, the values of points with no measurement data are reproduced with the help of the OK method equation in the third stage. The OK equation is provided below [10,12].
O K R 0 = i = 1 N W i O K Z R i .  
Here, O K R 0 refers to the estimated seasonal precipitation value at point X 0 , W i O K refers to the weight coefficient corresponding to each Z ( R i ) , and N refers to the number of points used in the OK estimation.

2.2.2. Empirical Bayesian Kriging (EBK)

EBK, a combination of the kriging interpolation technique and Bayes’ theory, is a simple and reliable method for automatic data interpolation of the variables [15,25,34]. As a result, EBK users do not have to manually interfere with the variables to obtain more accurate results [35].
In other kriging methods, a semivariogram is obtained with the help of measured precipitation points. That single semivariogram was assumed to be accurate for the entire area of study and used to make predictions at unmeasured points. Unlike other kriging methods, the EBK reproduces and uses many semivariogram models [36,37]. It also takes into account the errors that occur when reproducing semivariogram models. Thus, the number of interpolation errors in the EBK is lower than in other kriging techniques. These processes involve the following steps [38]:
  • A semivariogram model is predicted by utilizing known rainfall data.
  • Using this predicted semivariogram model, a new rainfall value at each input location is simulated.
  • A new semivariogram model is estimated utilizing the simulated data. Then, utilizing the Bayes’ rule, the weights of this new semivariogram are calculated. Bayes’ rule measures the likelihood of an estimated semivariogram to simulate measured data.

2.2.3. Cross-Validation
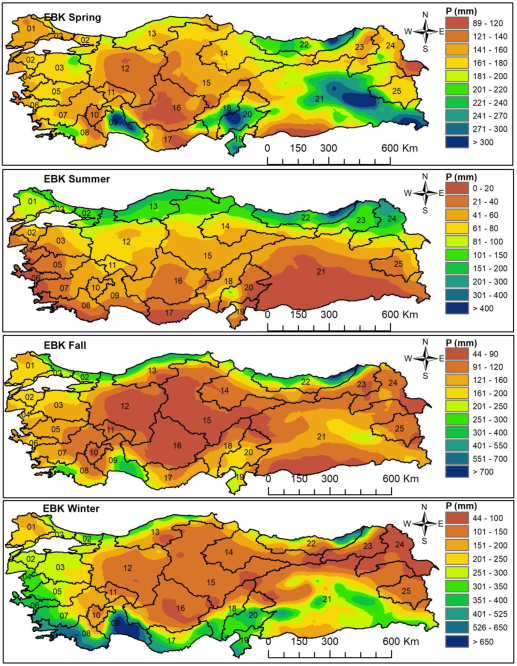
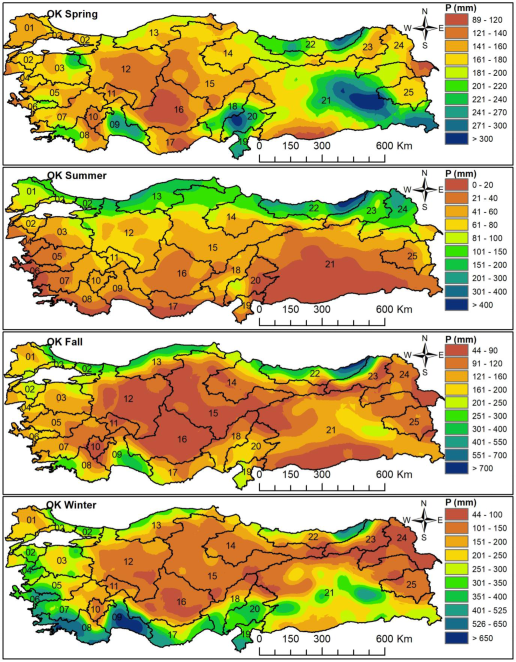
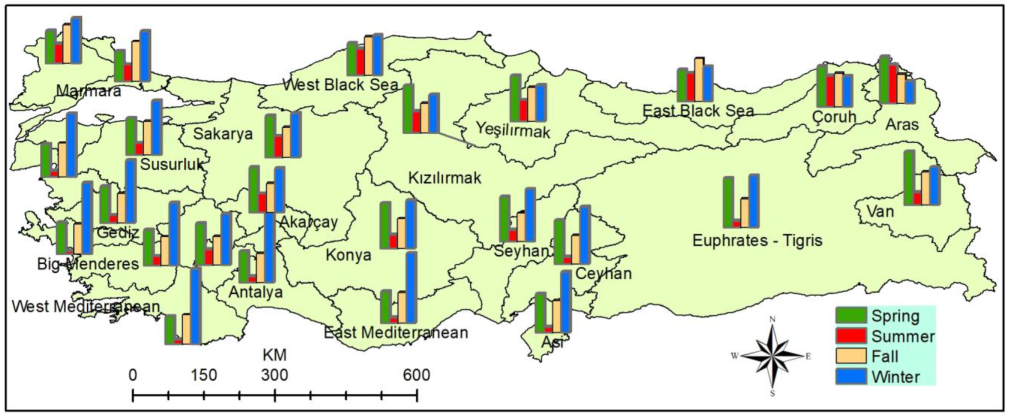
The cross-validation technique was used to compare and evaluate the interpolation methods used in this study. In this technique, the relation between real values and predicted values is analyzed. One of the precipitation stations is temporarily taken out of the data set, and the precipitation data of this excluded station is predicted using the values of the remaining (other) stations. This process is performed, respectively, for all precipitation stations used in the research. The error margins between the observed and predicted precipitation depths are determined. There are different error measurement techniques utilized in the evaluation of produced values [17,39]. Mean absolute error (MAE), root mean square error (RMSE), and determination coefficient (R2), which are the error, relationship, and conformity assessment methods, were used in this study, and the formulae are provided below:
M A E = 1 n i = 1 n S m i S e i ,
R M S E = 1 n i = 1 n S m i S e i 2 ,
R 2 = i = 1 n S m i S ¯ m S e i S ¯ e [ i = 1 n S m i S ¯ m 2 ] 1 / 2 [ i = 1 n S e i S ¯ e 2 ] 1 / 2 .
S m measured seasonal rainfall, S e estimated seasonal rainfall, S ¯ m is the average of measured seasonal rainfall, and S ¯ e is the average of seasonal estimated rainfall. The outliers do not largely affect MAE, providing an average error prediction. RMSE is sensitive to outliers and shows the error’s size. Smaller RMSE and MAE values indicate the credibility of interpolated precipitations. R2 shows the strength of the linear relationship between measured and predicted precipitation values.

3. Results

The statistical analysis results of seasonal precipitation data from 391 stations in Türkiye are provided in Table 1. The maximum precipitation among all stations was found to be 869.7 mm in winter, and the minimum was 2.2 mm in summer. In summer, there was a 231 times difference between the stations receiving the lowest precipitation (2.2 mm) and the highest precipitation (508.8 mm). The amplitude was at its highest level in winter (825.1) and lowest in spring (348.4). When the statistical data were evaluated together, it was found that the precipitation values of the stations in Türkiye showed great differences within and between seasons.
Figure 2 shows the histograms of seasonal precipitation values of the stations. Spring precipitations were clustered between 120 and 220 mm (304 stations). There were four stations with precipitation levels below 100 mm and 19 stations with over 300 mm. There were 252 stations below 175.7 mm, which was the average spring precipitation value. In spring, DSI-operated rain gauges had the highest rainfall depth in 11 watersheds and the lowest in 14 watersheds.
The amount of precipitation in summer was very low. The precipitation depth of 264 stations was below Türkiye’s average (64.5 mm). The average precipitation was below 10 mm at 28 stations, below 50 mm at 201 stations, and over 400 mm at only 4 stations. In summer, DSI-operated rain gauges had the highest rainfall depth in eight watersheds and the lowest in nine watersheds.
In total, 202 stations received precipitation between 100 and 200 mm and 5 stations received precipitation over 500 mm in autumn. On the other hand, the precipitation depth of 247 stations was below Türkiye’s average (155.4 mm). In autumn, DSI-operated rain gauges had the highest rainfall depth in 11 watersheds and the lowest in 14 watersheds.
The maximum precipitation fell in winter, and the precipitation depth was between 100 and 200 mm in 132 stations, 200 and 300 mm in 104 stations, and over 400 mm in 45 stations. On the other hand, the precipitation depth of 225 stations was below Türkiye’s average (246.7 mm). In winter, DSI-operated rain gauges had the highest rainfall depth in 11 watersheds and the lowest in 16 watersheds. In all seasons, only a few stations had higher precipitation values, and the majority of the stations had lower precipitation values (Figure 2).
Different parameters were tested to determine the ideal model of the interpolation methods. These parameters were tried until the minimum prediction error values were obtained, and they can be listed as follows: subset file, overlap factor, number of simulations, neighborhood type, sector type, semivariogram type, and transformation type. In the EBK method, an empirical model was used as a transform type for autumn, and a log empirical model was used for the remaining seasons; a whittle-detrended model was used for summer, and a K-Bessel detrended model was used for the remaining seasons as a semivariogram model. The subset size was selected as 25, the overlap factor as 5, and the simulation number as 100 for all seasons. In the OK method, the Gaussian theoretical variogram was fitted as the optimum model into the experimental variogram models determined for all seasons. The parameters of the OK models are provided in Figure 3.
The performance and error results that were found through cross-validation for comparing the interpolation methods are provided in Table 2. R2 values in the EBK method were 0.62 in spring, 0.92 in summer, 0.87 in autumn, and 0.82 in winter. The lowest MAE values were calculated as 10.97 in summer, and the highest values were calculated as 48.05 in winter; the lowest RMS values were calculated as 20.29 in summer, and the highest values were calculated as 69.27 in winter.
R2 values in the OK method were calculated as 0.52 in spring, 0.88 in summer, 0.78 in autumn, and 0.75 in winter. MAE was between 12.48 (in summer) and 53.85 (in winter); RMSE was between 23.44 (in summer) and 77.13 (in winter).
The areal distribution patterns of the seasonal precipitations found via the EBK (Figure 4) and the OK (Figure 5) methods showed similarities and provided a compatible structure with the country’s topography.
With over 300 mm of precipitation, the east and southeast of the Tigris-Euphrates basin, the high hillsides of Antalya and Ceyhan basins facing the Mediterranean Sea, and the east of the East Black Sea basin are the rainiest regions of Türkiye in spring. On the other hand, with under 120 mm of precipitation, central parts of the Konya basin, central parts of the East Mediterranean basin, southeast parts of Aras, and southwest parts of the Tigris-Euphrates (Syrian border) are the least rainy regions.
With over 400 mm of precipitation, the east of the East Black Sea basin is the rainiest region in summer; with under 10 mm of precipitation, the south of Tigris-Euphrates and the coastline of the basins opening to the Aegean and the Mediterranean Seas are the least rainy regions in summer.
With over 300 mm of precipitation, the coastline of the Black Sea and the southern parts of the Antalya basin are the rainiest regions in autumn. The precipitation in the east of the East Black Sea basin is approximately 800 mm. With under 60 mm of precipitation, the inner parts of the Konya basin and the areas in the southern parts of the Tigris-Euphrates basin closer to the Syrian border are the least rainy regions.
With over 700 mm of precipitation, Antalya and West Mediterranean basins are the rainiest regions in winter. On the other hand, with under 50 mm of precipitation, the southeast of the Aras basin is the least rainy region.
At this stage of the study, the seasonal precipitation potentials of Türkiye and the basins in Türkiye were calculated based on the EBK interpolation results, which showed the highest performance. First, the basins were extracted one by one according to their boundaries from the seasonal rainfall distribution maps generated for the entirety of Türkiye, and seasonal average areal rainfall depths were computed with the help of the software used. Then, the surface areas of the basins were multiplied by the rainfall depth, and the rainfall volumes were found (Table 3). The results of the OK method are also provided in Table 4 for comparison.
The average areal precipitation is 173.6 mm (OK, 175.2 mm) in spring in Türkiye, and the average precipitation of 9 basins is above Türkiye’s average. The Ceyhan (222.8 mm), Asi (220.2 mm), East Black Sea (219.5 mm), Antalya (215.5 mm), and Tigris-Euphrates basins (203.9 mm) have the highest areal average rainfall depths. On the other hand, the Konya (131.3 mm), Burdur (138.3 mm), Sakarya (142.2 mm), Akarçay (145.7 mm), East Mediterranean (148.1 mm), and Meriç-Ergene (149.0 mm) basins have the lowest average precipitation depths, respectively (Table 3). The precipitation depths of Susurluk (174.0 mm), Yeşilırmak (174.0 mm), West Black Sea (172.1 mm), and Çoruh (170.7 mm) basins are closest to the average precipitation depths of Türkiye.
In summer, the areal precipitation depth of Türkiye is 61.7 mm (OK, 62.6 mm). The precipitation depths in 16 basins are below the average precipitation depth of Türkiye. While the basins in Northern Türkiye receive the highest amount of rainfall, the basins in Central and Southern Türkiye receive the lowest amount of rainfall. East Black Sea (197.5 mm), West Black Sea (142.1 mm), Çoruh (131.6 mm), and Aras (131.4 mm) basins have the highest; Little Meander (16.5 mm), East Mediterranean (24.5 mm), West Mediterranean (26.1 mm), Tigris-Euphrates (27.0 mm), and the Northern Aegean (29.7 mm) basins have the lowest average precipitation depths, respectively. The precipitation depths decrease from north to south, in general. The precipitation depths of the Akarçay (61.1 mm) and Susurluk (56.3 mm) basins are closest to the average precipitation depth of Türkiye.
The average areal precipitation is 133.6 mm (OK, 136.8 mm) in autumn in Türkiye, and the average precipitation of 13 basins is above Türkiye’s average. East Black Sea (299.7 mm), Marmara (216.3 mm), and West Black Sea (207.4 mm) basins in the north receive the highest amount of rainfall in this season. These basins are followed by Antalya (200.5 mm) in southern Türkiye, Asi (183.7 mm), and the West Black Sea (172.2 mm) basins. On the other hand, the Konya (86.2 mm), Akarçay (94.0 mm), Burdur (94.9 mm), Kızılırmak (95.4 mm), and Aras (98.5 mm) basins receive the lowest amount of rainfall in autumn. The Gediz (131.0 mm) and Yeşilırmak (130.2 mm) basins are the closest to the average precipitation depth of Türkiye in this season.
In general, Türkiye receives the highest amount of precipitation in winter, and the average areal precipitation depth in this season was calculated as 208.8 mm (OK, 213.0 mm). The average precipitation depths in 15 basins are over the average precipitation depth of Türkiye. In this season, the basins opening to the Aegean and the Mediterranean Seas are the rainiest basins. These basins are Antalya (480.1 mm), West Mediterranean (440.0 mm), Little Meander (362.9 mm), Asi (347.8 mm), East Mediterranean (327.4 mm), and Northern Aegean (302.8 mm), respectively. Aras (74.9 mm), Kızılırmak (123.4 mm), Çoruh (129.4 mm), Van (129.6 mm), Yeşilırmak (138.0 mm), Konya (138.8 mm), and Akarçay (143.0 mm) are the basins that receive lower precipitation in this season. The precipitation depths of the Meriç-Ergene (206.2 mm), Tigris-Euphrates (213.9 mm), and West Black Sea (214.2 mm) basins are closest to the precipitation depth of Türkiye in this season.
The average seasonal precipitation volume of the entirety of Türkiye was calculated as 162.87 billion m3 (OK, 166.15 billion m3) in winter, 135.42 billion m3 (OK, 136.66 billion m3) in spring, 104.21 billion m3 (OK, 106.71 billion m3) in autumn, and 48.13 billion m3 (OK, 48.83 billion m3) in summer, respectively. The Tigris-Euphrates basin, which has the largest surface area, has the highest precipitation volumes in winter (37.62 billion m3), spring (35.86 billion m3), and autumn (20.79 billion m3). In summer, the precipitation volume of Kızılırmak (5.73 billion m3) is higher than that of Tigris-Euphrates (4.75 billion m3).
The basins with the lowest precipitation volume are Burdur (0.87 billion m3), Little Meander (1.13 billion m3), and Akarçay (1.16 billion m3) in spring; Little Meander (0.12 billion m3), Asi (0.25 billion m3), and Northern Aegean (0.30 billion m3) in summer; Burdur (0.60 billion m3), Akarçay (0.75 billion m3), and Little Meander (1.08 billion m3) in autumn; Burdur (1.07 billion m3), Akarçay (1.14 billion m3), and Aras (2.10 billion m3) in winter, respectively (Table 3).
To shed light on the precipitation regime of the basins, the EBK-based seasonal precipitation percentages were calculated (Table 5), and the results are presented in graphs over the Türkiye watersheds map (Figure 6). The percentage results by the OK method were also added in the last line of Table 5 for comparison. Türkiye received 36.1% (OK, 36.2%) of overall precipitation in winter, 30.1% (OK, 29.8%) in spring, 23.1% (OK, 23.3%) in autumn, and 10.7% (OK, 10.7%) in summer. In total, 18 out of 25 basins received the maximum precipitation in winter, 6 basins in spring, and 1 basin (East Black Sea) in autumn.

4. Conclusions and Discussion

Precipitation is the key input for the sustainable use and management of water resources. Türkiye is a water-stressed country, and its water resources are controlled by local precipitations. Therefore, it is essential to identify the rainfall pattern and the potential in Türkiye.
In this study, the seasonal precipitation distribution of Türkiye and its 25 main watersheds were estimated, and their depths, volumes, and percentages were calculated. The station networks of the two institutions (MGM and DSI) were combined, and the WMO’s minimum standards were achieved.
The most common EBK and OK methods were applied. According to R2 and cross-validation results, the EBK provided better results and efficiency than the OK method in all seasons. The methods showed their best prediction performances in the summer. This finding is in accordance with ref. [29]. The lower precipitation depths and steady pattern in summer increased the prediction performances of the methods compared to other seasons. The highest error rates were found in winter, which received the maximum depths of precipitation. The lowest R2 values were found in spring. The precipitations were mostly irregular in springtime, and this was interpreted as the reason for lower R2 values. Considering the heterogeneous and highly unstable texture of the seasonal precipitations in Türkiye, it may be concluded that the OK method is also sufficient. Combining the data from two institutions ensured station frequency and homogeneity. This process increased the performance of interpolation methods. This finding agrees with refs. [18,19,20,21].
In winter, which received 36.1% (OK, 36.2%) of total precipitation, Türkiye’s areal precipitation depth was calculated as 208.8 mm (OK, 213.0 mm), and its volume as 162.87 billion m3 (OK, 166.15 billion m3). Along with the Antalya (480.1 mm) and West Mediterranean (440 mm) basins, of which average areal precipitation depths are over 400 mm, the basins in southern and west Türkiye on the coastline of the Mediterranean and the Aegean Seas were the rainiest in winter. On the other hand, with their areal averages below 130 mm, Aras (74.9 mm), Kızılırmak (123.4 mm), Çoruh (129.4 mm), and Van (129.6 mm) were the basins with the lowest precipitation depths in winter.
The precipitation percentage of the spring season was calculated as 30.1% (OK, 29.8%), precipitation depth as 173.6 mm (OK, 175.2 mm), and precipitation volume as 135.42 billion m3 (OK, 136.66 billion m3) in the entirety of Türkiye. In this season, the precipitation depth of five basins was over 200 mm, and below 150 mm in six basins. The precipitation depths of the remaining 14 basins were between 150 and 200 mm.
The precipitation percentage of autumn, which had 133.6 mm (OK, 136.8 mm) precipitation depth and 104.21 billion m3 (OK, 106.71 billion m3) precipitation volume, was found to be 23.1% (OK, 23.3%). With over 200 mm of precipitation depth, the rainiest basins were the East Black Sea (299.7 mm), Marmara (216.3 mm), West Black Sea (207.4 mm), and Antalya (200.5 mm) basins; with under 100 mm of precipitation depth, the least rainy basins were the Konya (86.2 mm), Akarçay (94.0 mm), Burdur (94.9 mm), Kızılırmak (95.4 mm), and Aras (98.5 mm) basins.
In summer, which was the season with the lowest precipitation, 10.7% (OK, 10.7%), the average areal precipitation depth of Türkiye was 61.7 mm (OK, 62.6 mm), and the volume was 48.13 billion m3 (OK, 48.83 billion m3). More than 70% of annual water consumption in Türkiye is used for agricultural purposes, particularly in summer. The average areal precipitation depth of 5 basins in this season, including the Tigris-Euphrates basin, is below 30 mm, and it is below 50 mm in 13 basins. Therefore, all basins except those in northern Anatolia become rainfall shortages in summer.
Eighteen basins received the highest precipitation in winter, six basins in spring, and one basin in autumn. The precipitation percentages of 9 out of 10 basins opening to the Aegean and the Mediterranean Seas were over 45% in winter. More than half of the total amount of precipitation fell in winter in the West Mediterranean (54.9%), Little Meander (52.2%), Antalya (51.2%), and East Mediterranean (50.9%) basins.
In 14 basins, the contribution of summer rains to the overall precipitation percentage was below 10% and below 5% in 7 basins. The basins with the lowest precipitation percentages were Little Meander (2.4%), West Mediterranean (3.3%), East Mediterranean (3.8%), Asi (4.1%), Antalya (4.4%), Northern Aegean (4.6%), and Tigris-Euphrates (4.8%).
Tigris-Euphrates, which has a significant impact on its area and location, had 38% precipitation percentage in winter, 36.2% in spring, and 21% in autumn. The seasonal precipitation percentages of the East Black Sea, West Black Sea, and Çoruh basins in northern Türkiye were more balanced and stable than the others.
While 23 basins received the lowest precipitation in summer, Aras and Çoruh received the lowest precipitation in winter. As we go from the north to the south, the seasonal precipitation depths and shares of the watersheds became more irregular and unstable (Table 5, Figure 6).
Two major factors cause the seasonal and spatial rainfall distribution of the basins in Türkiye. The first is the topographic structure and location of Türkiye. The topography of Türkiye varies greatly over short distances. By this topographic structure, precipitations show great temporal and spatial differences in amount and pattern over short distances. The Northern Anatolian Mountains parallel the Black Sea coast, and the Taurus Mountains parallel the Mediterranean coast preventing the interior of the country from having a marine climate and rainfall. The Black Sea coasts in all seasons, the Mediterranean and Aegean coasts in the winter, and the hillsides facing the Mediterranean Sea in the spring are the areas of the watersheds with the most precipitation. Second, Türkiye is situated in a transition zone that is under the influence of various atmospheric disturbances and weather types originating from polar and tropical regions [40]. Tropical weather conditions in summer and polar weather conditions in winter affect Türkiye. Both polar and tropical weather conditions affect the country from middle–late autumn to the middle of spring.
The use of DSI stations has changed the seasonal precipitation pattern of Türkiye. To use an observation network in WMO standards in such studies in Türkiye, DSI stations should be used in addition to MGM stations. The derived precipitation patterns differ from the works conducted for Türkiye [29,41,42]. This difference is evident in the Marmara, West Mediterranean, Antalya, Ceyhan, and Tigris-Euphrates basins. On the other hand, the seasonal precipitation amount findings of the study are in accordance with ref. [43].
MGM has been using the OK method to map the precipitation distribution since 2015. The EBK method provided better efficiency and results than the OK method. The EBK method should also be considered in such studies.
More than 2000 AWOS precipitation data will become available, and the precipitation pattern and potential of the basins in Türkiye, including the micro-climatic areas, will be revealed more accurately.
Accurate calculation of seasonal precipitation potential in Türkiye is also significant for the hydro-politics of neighboring countries and the countries in the Middle East.

Funding

This research received no external funding.

Institutional Review Board Statement

Not applicable.

Informed Consent Statement

Not applicable.

Data Availability Statement

The data sets generated and analyzed during the current study are available from the corresponding author upon reasonable request.

Acknowledgments

The author would like to thank the Turkish State Meteorological Service and Turkish State Hydraulic Works for the data used in this study. The author thanks reviewers for their constructive and valuable comments.

Conflicts of Interest

The authors declare no conflict of interest.

References

  1. The United Nations World Water Development Report 2021: Valuing Water. UNESCO, Paris. Available online: https://www.unwater.org/publications/un-world-water-development-report-2021.pdf (accessed on 16 January 2023).
  2. The United Nations World Water Development Report 2020: Water and Climate Change. UNESCO, Paris. Available online: https://www.unwater.org/publications/un-world-water-development-report-2020.pdf (accessed on 16 January 2023).
  3. Organization for Economic Co-Operation and Development. OECD Environmental Outlook to 2050: The Consequences of Inaction. Key Facts and Figures. Paris, OECD Publishing. 2012. Available online: www.oecd.org/env/indicators-modelling-outlooks/49910023.pdf. (accessed on 16 January 2023).
  4. International Energy Agency (IEA). Water Energy Nexus, Excerpt from the World Energy Outlook 2016. Organisation for Economic Co-Operation and Development, Paris. Available online: www.iea.org/reports/water-energy-nexus. (accessed on 16 January 2023).
  5. Available online: https://pure.iiasa.ac.at/id/eprint/13008/1/WP-16-006.pdf (accessed on 16 January 2023).
  6. Schewe, J.; Heinke, J.; Gerten, D.; Haddeland, I.; Arnell, N.W.; Clark, D.B.; Dankers, R.; Eisner, S.; Fekete, B.M.; Colón-González, F.J.; et al. Multimodel assessment of water scarcity under climate change. Proc. Natl. Acad. Sci. USA 2014, 111, 3245–3250. [Google Scholar] [CrossRef]
  7. Türkeş, M. Impacts of climate change on food security and agricultural production: A scientific review. Aegean Geogr. J. 2020, 29, 125–149. [Google Scholar]
  8. Gürkan, H.; Arabacı, H.; Demircan, M.; Eskioğlu, O.; Şensoy, S.; Yazıcı, B. Temperature and precipitation projections based on GFDL-ESM2M using RCP4.5 and RCP8.5 scenarios for Turkey. Turk. J. Geogr. Sci. 2016, 14, 77–88. [Google Scholar] [CrossRef]
  9. Demircan, M.; Gürkan, H.; Eskioğlu, O.; Arabacı, H.; Coşkun, M. Climate change projections for Turkey: Three models and two scenarios. Turk. J. Water Sci. Manag. 2017, 1, 22–43. [Google Scholar] [CrossRef]
  10. Goovaerts, P. Kriging and semivariogram deconvolution in the presence of irregular geographical units. Math Geosci. 2008, 40, 101–128. [Google Scholar] [CrossRef]
  11. Li, J.; Heap, A.D. Spatial interpolation methods applied in the environmental sciences: A review. Environ. Model. Softw. 2014, 53, 173–189. [Google Scholar] [CrossRef]
  12. Webster, R.; Oliver, M.A. Geostatistics for Environmental Scientists, 2nd ed.; John Wiley: Hoboken, NJ, USA, 2007; pp. 153–194. ISBN 978-0-470-51727-7. [Google Scholar] [CrossRef]
  13. World Meteorological Organization (WMO). Guide to Hydrological Practices; WMO-No:168:; WMO: Geneva, Switzerland, 2008. [Google Scholar]
  14. Goovaerts, P. Geostatistical approaches for incorporating elevation into the spatial interpolation of rainfall. J Hydrol. 2000, 228, 113–129. [Google Scholar] [CrossRef]
  15. Pellicone, G.; Caloiero, T.; Modica, G.; Guagliardi, I. Application of several spatial interpolation techniques to monthly rainfall data in the Calabria region (southern Italy). Int. J. Climatol. 2018, 38, 3651–3666. [Google Scholar] [CrossRef]
  16. Lloyd, C. Nonstationary models for exploring and mapping monthly precipitation in the United Kingdom. Int. J. Climatol. A J. R. Meteorol. Soc. 2010, 30, 390–405. [Google Scholar] [CrossRef]
  17. Li, J.; Heap, A.D. A review of comparative studies of spatial interpolation methods in environmental sciences: Performance and impact factors. Ecol. Inform. 2011, 6, 228–241. [Google Scholar] [CrossRef]
  18. Dirks, K.N.; Hay, J.E.; Stow, C.D.; Harris, D. High-resolution studies of rainfall on Norfolk Island, part II: Interpolation of rainfall data. J. Hydrol. 1998, 208, 187–193. [Google Scholar] [CrossRef]
  19. Borges, P.A.; Franke, J.; da Anunciação, Y.M.T.; Weiss, H.; Bernhofer, C. Comparison of spatial interpolation methods for the estimation of precipitation distribution in Distrito Federal, Brazil. Theor. Appl. Climatol. 2016, 123, 335–348. [Google Scholar] [CrossRef]
  20. Frazier, A.G.; Giambelluca, T.W.; Diaz, H.F.; Needham, H.L. Comparison of geostatistical approaches to spatially interpolate month–year rainfall for the Hawaiian Islands. Int. J. Climatol. 2016, 36, 1459–1470. [Google Scholar] [CrossRef]
  21. Hurtado, S.I.; Zaninelli, P.G.; Agosta, E.A.; Ricetti, L. Infilling methods for monthly precipitation records with poor station network density in Subtropical Argentina. Atmos. Res. 2021, 254, 105482. [Google Scholar] [CrossRef]
  22. Amini, M.A.; Torkan, G.; Eslamian, S.; Zareian, M.J.; Adamowski, J.F. Analysis of deterministic and geostatistical interpolation techniques for mapping meteorological variables at large watershed scales. Acta Geophys. 2019, 67, 191–203. [Google Scholar] [CrossRef]
  23. Rata, M.; Douaoui, A.; Larid, M.; Douaik, A. Comparison of geostatistical interpolation methods to map annual rainfall in the Chéliff watershed, Algeria. Theor. Appl. Climatol. 2020, 141, 1009–1024. [Google Scholar] [CrossRef]
  24. Antal, A.; Guerreiro, P.M.P.; Cheval, S. Comparison of spatial interpolation methods for estimating the precipitation distribution in Portugal. Theor. Appl. Climatol. 2021, 145, 1193–1206. [Google Scholar] [CrossRef]
  25. Yang, R.; Xing, B.A. Comparison of the performance of different interpolation methods in replicating rainfall magnitudes under different climatic conditions in Chongqing Province (China). Atmosphere 2021, 12, 1318. [Google Scholar] [CrossRef]
  26. Caloiero, T.; Pellicone, G.; Modica, G.; Guagliardi, I. Comparative analysis of different spatial interpolation methods applied to monthly rainfall as support for landscape management. Appl. Sci. 2021, 11, 9566. [Google Scholar] [CrossRef]
  27. Fung, K.F.; Chew, K.S.; Huang, Y.F.; Ahmed, A.N.; Teo, F.Y.; Ng, J.L.; Elshafie, A. Evaluation of spatial interpolation methods and spatiotemporal modeling of rainfall distribution in Peninsular Malaysia. Ain Shams Eng. J. 2022, 13, 3972–3983. [Google Scholar] [CrossRef]
  28. Aksu, H.H. Basin-based precipitation potential of Turkey. Arab. J. Geosci. 2021, 14, 2470. [Google Scholar] [CrossRef]
  29. Katipoğlu, O.M. Spatial analysis of seasonal precipitation using various interpolation methods in the Euphrates basin, Turkey. Acta Geophys. 2022, 70, 859–878. [Google Scholar] [CrossRef]
  30. Ministry of Agriculture and Forestry (MAF). General Directorate of Water Management. Available online: https://www.tarimorman.gov.tr/SYGM/Menu/96/Iklim-Degisikligi-Ve-Uyum-Kitabi. (accessed on 16 January 2023).
  31. Li, L.; Revesz, P. Interpolation methods for spatio-temporal geographic data. Comput. Environ. Urban Syst. 2004, 28, 201–227. [Google Scholar] [CrossRef]
  32. Goovaerts, P. Geostatistics for Natural Resources Evaluation; Oxford University Press: New York, NY, USA, 1997; pp. 132–139. [Google Scholar]
  33. Gupta, A.; Kamble, T.; Machiwal, D. Comparison of ordinary and Bayesian kriging techniques in depicting rainfall variability in arid and semi-arid regions of north-west India. Environ. Earth Sci. 2017, 76, 1–16. [Google Scholar] [CrossRef]
  34. Li, Z.; Tao, H.; Zhao, D.; Li, H. Three-dimensional empirical Bayesian kriging for soil PAHs interpolation considering the vertical soil lithology. Catena 2022, 212, 106098. [Google Scholar] [CrossRef]
  35. Gribov, A.; Krivoruchko, K. Empirical Bayesian kriging implementation and usage. Sci. Total Environ. 2020, 722, 137290. [Google Scholar] [CrossRef]
  36. Krivoruchko, K.; Gribov, A. Evaluation of empirical Bayesian kriging. Spat. Stat. 2019, 32, 100368. [Google Scholar] [CrossRef]
  37. Zou, W.; Yin, S.; Wang, W. Spatial interpolation of the extreme hourly precipitation at different return levels in the Haihe River basin. J. Hydrol. 2021, 598, 126273. [Google Scholar] [CrossRef]
  38. Krivoruchko, K. Empirical Bayesian Kriging; ESRI: Redlands, CA, USA, 2012; pp. 6–10. [Google Scholar]
  39. Berndt, C.; Haberlandt, U. Spatial interpolation of climate variables in Northern Germany—Influence of temporal resolution and network density. J. Hydrol. Reg. Stud. 2018, 15, 184–202. [Google Scholar] [CrossRef]
  40. Turkeş, M. Climate and Drought in Turkey. In Water Resources of Turkey; Harmancioglu, N., Altinbilek, D., Eds.; Springer: Cham, Switzerland, 2020; Volume 2, pp. 85–125. [Google Scholar]
  41. Turkeş, M. Climatology and Meteorology; Kriter Publishing: İstanbul, Türkiye, 2010; p. 384. [Google Scholar]
  42. Çıtakoğlu, H.; Çetin, M.; Cobaner, M.; Haktanır, T. Modeling of seasonal precipitation with geostatistical techniques and its estimation at ungauged locations. Tek. Dergi 2017, 28, 7725–7745. [Google Scholar]
  43. Selek, B.; Aksu, H. Water Resources Potential of Turkey. In Water Resources of Turkey; Harmancioglu, N., Altinbilek, D., Eds.; Springer: Cham, Switzerland, 2020; Volume 2, pp. 241–256. [Google Scholar]
Figure 1. Main watersheds and rainfall station network of Türkiye.
Atmosphere 14 00800 g001
Figure 2. Seasonal precipitation histograms.
Atmosphere 14 00800 g002
Figure 3. Experimental and theoretical semivariogram models and parameters of the OK method.
Atmosphere 14 00800 g003
Figure 4. Seasonal rainfall pattern map of the watersheds estimated by the EBK method.
Atmosphere 14 00800 g004
Figure 5. Seasonal rainfall pattern map of the watersheds estimated by the OK method.
Atmosphere 14 00800 g005
Figure 6. The EBK-based seasonal rainfall percentages of the watersheds.
Atmosphere 14 00800 g006
Table 1. Descriptive statistics for seasonal average precipitation data in Türkiye (mm).
SeasonMin.Max.Amp.MeanStd. Dev.First QuartileMedianThird Quartile
Spring88.6437.0348.4175.755.5139.8160.6199.0
Summer2.2508.8506.664.565.028.849.274.7
Fall49.3856.2806.9155.499.695.8129.7183.0
Winter44.6869.7825.1246.7145.7128.6218.4322.5
Table 2. Seasonal performance and error values of the interpolation methods.
OKEBK
SeasonMAERMSER2MAERMSER2
Spring27.2138.560.5224.4234.340.62
Summer12.4823.440.8810.9720.290.92
Fall28.3546.610.7823.4736.330.87
Winter53.8577.130.7548.0569.270.82
Table 3. Seasonal rainfall potential of the watersheds calculated based on the EBK method.
Basin NumberBasin
Name
Basin Area
(km2)
SpringSummerFallWinter
Mean (mm)Volume
(Billion m3)
Mean
(mm)
Volume
(Billion m3)
Mean
(mm)
Volume
(Billion m3)
Mean
(mm)
Volume
(Billion m3)
1Meriç-Ergene14,510.7149.02.1689.21.29175.52.55206.22.99
2Marmara23,113.7163.63.7891.32.11216.35.00271.66.28
3Susurluk24,304.2174.04.2356.31.37158.83.86254.86.19
4North Aegean9963.6157.01.5629.70.30162.01.61302.83.02
5Gediz16,981.4161.32.7434.70.59131.02.22275.64.68
6Little Meander 7027.1161.11.1316.50.12154.21.08362.92.55
7Big Meander26,017.1155.74.0540.51.05125.73.27273.27.11
8West Mediterranean21,131.2163.33.4526.10.55172.23.64440.09.30
9Antalya20,251.9215.54.3641.10.83200.54.06480.19.72
10Burdur6273.8138.30.8751.40.3294.90.60170.01.07
11Akarçay7954.5145.71.1661.10.4994.00.75143.01.14
12Sakarya63,242.9142.28.9972.74.60102.86.50150.09.49
13West Black Sea28,968.4172.14.99142.14.12207.46.01214.26.21
14Yeşilırmak39,620.2174.06.8981.53.23130.25.16138.05.47
15Kızılırmak82,082.5152.612.5369.85.7395.47.83123.410.13
16Konya 49,805.3131.36.5439.51.9786.24.29138.86.91
17East Mediterranean21,751.2148.13.2224.50.53142.63.10327.47.12
18Seyhan22,120.8185.74.1148.21.07118.72.63218.34.83
19Asi7904.2220.21.7432.10.25183.71.45347.82.75
20Ceyhan21,482.6222.84.7936.60.79145.33.12289.46.22
21Euphrates-Tigris175,881.5203.935.8627.04.75118.220.79213.937.62
22East Black Sea 22,876.1219.55.02197.54.52299.76.86243.65.57
23Çoruh20,259.8170.73.46131.62.67141.72.87129.42.62
24Aras28,041.2158.34.44131.43.6898.52.7674.92.10
25Van 17,977183.33.3043.30.78113.42.04129.62.33
Turkey (total)780,043173.6135.4261.748.13133.6104.21208.8162.87
Table 4. Seasonal rainfall potential of the watersheds calculated based on the OK method.
SpringSummerFallWinter
BasinMean (mm)Volume
(Billion m3)
Mean
(mm)
Volume
(Billion m3)
Mean
(mm)
Volume
(Billion m3)
Mean
(mm)
Volume
(Billion m3)
Meriç-Ergene149.52.1789.41.30178.22.59207.63.01
Marmara165.83.8394.12.17227.55.26280.06.47
Susurluk176.64.2958.01.41157.93.84259.56.31
North Aegean158.51.5829.70.30161.11.61301.03.00
Gediz163.32.7734.80.59133.82.27281.64.78
Little Meander 167.11.1716.90.12156.71.10378.82.66
Big Meander159.44.1541.21.07130.63.40287.17.47
West Mediterranean167.53.5427.60.58181.63.84458.19.68
Antalya206.94.1940.70.82206.34.18481.79.76
Burdur141.70.8950.20.3191.10.57169.21.06
Akarçay145.11.1563.70.5196.30.77142.31.13
Sakarya143.59.0873.24.63103.36.53149.39.44
West Black Sea171.74.97146.54.24221.26.41224.86.51
Yeşilırmak177.37.0283.83.32132.95.27142.35.64
Kızılırmak153.112.5769.45.7099.18.13129.310.61
Konya 131.66.5538.11.9083.44.15138.36.89
East Mediterranean150.33.2727.40.60147.83.21332.77.24
Seyhan191.64.2448.71.08121.42.69226.35.01
Asi224.81.7833.80.27183.81.45355.32.81
Ceyhan221.94.7736.80.79145.33.12286.96.16
Euphrates-Tigris205.636.1626.94.73116.920.56213.637.57
East Black Sea 221.65.07213.14.87323.77.40255.35.84
Çoruh177.53.60135.42.74162.13.28148.63.01
Aras161.34.52126.33.5499.12.7881.32.28
Van 184.93.3244.70.80113.82.05128.72.31
Turkey (total)175.2136.6662.648.83136.8106.71213.0166.15
Table 5. Seasonal rainfall percentages of the watersheds calculated based on the EBK method.
BasinSpring
(%)
Summer (%)Fall
(%)
Winter
(%)
Meriç-Ergene24.014.428.333.3
Marmara22.012.329.136.6
Susurluk27.08.724.739.6
North Aegean24.14.624.946.5
Gediz26.85.821.745.7
Little Meander23.22.422.252.2
Big Meander 26.26.821.145.9
West Mediterranean20.43.321.554.9
Antalya23.04.421.451.2
Burdur30.411.320.937.4
Akarçay32.813.821.232.2
Sakarya30.415.522.032.1
West Black Sea23.419.328.229.1
Yeşilırmak33.215.624.926.4
Kızılırmak34.615.821.628.0
Konya 33.210.021.835.1
East Mediterranean23.03.822.250.9
Seyhan32.58.420.838.2
Asi28.14.123.444.4
Ceyhan32.15.320.941.7
Euphrates-Tigris36.24.821.038.0
East Black Sea 22.920.631.225.4
Çoruh29.823.024.722.6
Aras34.228.421.316.2
Van 39.09.224.127.6
Turkey (total)30.110.723.136.1
OK-Türkiye (total)29.810.723.336.2
Disclaimer/Publisher’s Note: The statements, opinions and data contained in all publications are solely those of the individual author(s) and contributor(s) and not of MDPI and/or the editor(s). MDPI and/or the editor(s) disclaim responsibility for any injury to people or property resulting from any ideas, methods, instructions or products referred to in the content.

