1. Introduction
Owing to the increasingly stringent regulation of exhaust emissions and the increasing electrification of new vehicle generations, non-exhaust emissions continue to move into the focus of regulatory authorities as the main driver of overall vehicle particle emissions. Here, brake system emissions are of particular focus, as they can account for up to 21% of traffic-related PM10 emissions [
1]. The Organisation for Economic Co-operation and Development (OECD) reported that brake wear PM10 emissions may contribute approximately 5–8% of total PM10 at traffic sites [
2]. Recent studies indicate that the relative contribution of non-exhaust sources to traffic-related PM concentrations at local hot spots may exceed 50% [
3,
4], highlighting the importance of non-exhaust emissions for urban environments.
Therefore, the Informal Working Group on Particulate Measurement Programme (PMP-IWG), on behalf of the Working Party on Pollution and Energy (GRPE) of the United Nations Economic Commission for Europe World Forum for Harmonisation of Vehicle Regulations (UNECE WP.29), has developed a method for sampling and measuring brake particulate matter (PM) and particle number (PN) emissions from light-duty vehicles (LDV) up to 3.5 t on component test benches. This method is summarised in a UN Global Technical Regulation (UN GTR) and contains the basic boundary conditions and test parameters [
5].
Based on this GTR, an initial regulation of brake emissions may be incorporated into the new Euro 7 standard to further reduce the emission level of light-duty vehicles up to 3.5 t (this includes passenger cars of all types, but also light commercial vehicles (LCV) designed for the carriage of goods less than 3.5 t). More specifically, the European Commission recently introduced provisions to limit PM and PN emissions from road transport braking systems [
6]. These include a PM10 limit of 7 mg/km per vehicle for LDV. PN emission limits will be introduced later in the procedure, whereas it is not yet clear if there will be a separate limit for PM2.5. It is noteworthy that the Euro 7 pollutant emissions regulation is the first regional regulation introducing such limits worldwide [
6].
In the recent past, the UN GTR has been extended to include regenerative braking systems. For this purpose, a correlation coefficient depending on the degree of electrification was implemented in the method [
5]. With regard to the boundary conditions, the UN GTR was initially designed for front-axle brakes. During the interlaboratory study (ILS), rear-axle brakes were also investigated under identical testing conditions as front-axle brakes [
7]. Despite these can be subject to different conditions in real use, such as the inflow of cooling air and the disc temperature levels, in the GTR it was decided to test rear-axle brake systems applying the cooling settings of the corresponding front-axle brake. With regard to the investigation of conventional brake systems (e.g., grey cast iron discs) and alternative friction materials (e.g., carbide-coated discs), identical boundary and test conditions apply.
Currently, several technical solutions exist to reduce brake emissions. These primarily include alternative friction materials, such as coated brake discs [
8,
9,
10], or modified friction lining mixtures [
11], and the possibility of recuperation in hybrid or fully battery-electric vehicles [
12,
13,
14]. Furthermore, there is potential for reduction through the use of drum brakes instead of disc brake systems, particularly for rear-axle brake applications [
15]. While these studies—including the recently completed interlaboratory study of the IWG PMP [
16]—focused on the general implementation of the methodology, so far the actual reduction potentials of the mentioned measures have not been investigated on a comparable or even identical basis.
The aim of the present study is to assess the reduction potential of the technical measures mentioned with regard to brake particle emissions. Based on this study, it is shown that alternative friction materials in brake pad compounds, more wear-resistant brake discs, and, primarily, the recuperation potential of electrified vehicles can significantly reduce the emissions of light-duty vehicles.
2. Experimental
2.1. Measurement Setup
The measurements were carried out on an inertia dynamometer (Link 3900 NVH; Link Engineering Company GmbH, Limburg, Germany), which has conventional mechanical flywheel masses and can also superimpose an electrical inertia simulation. The brakes were mounted using vehicle-specific knuckles, which also results in the real vehicle installation position of the brake calliper. The evacuation of the fine dust aerosol takes place in the direction of rotation.
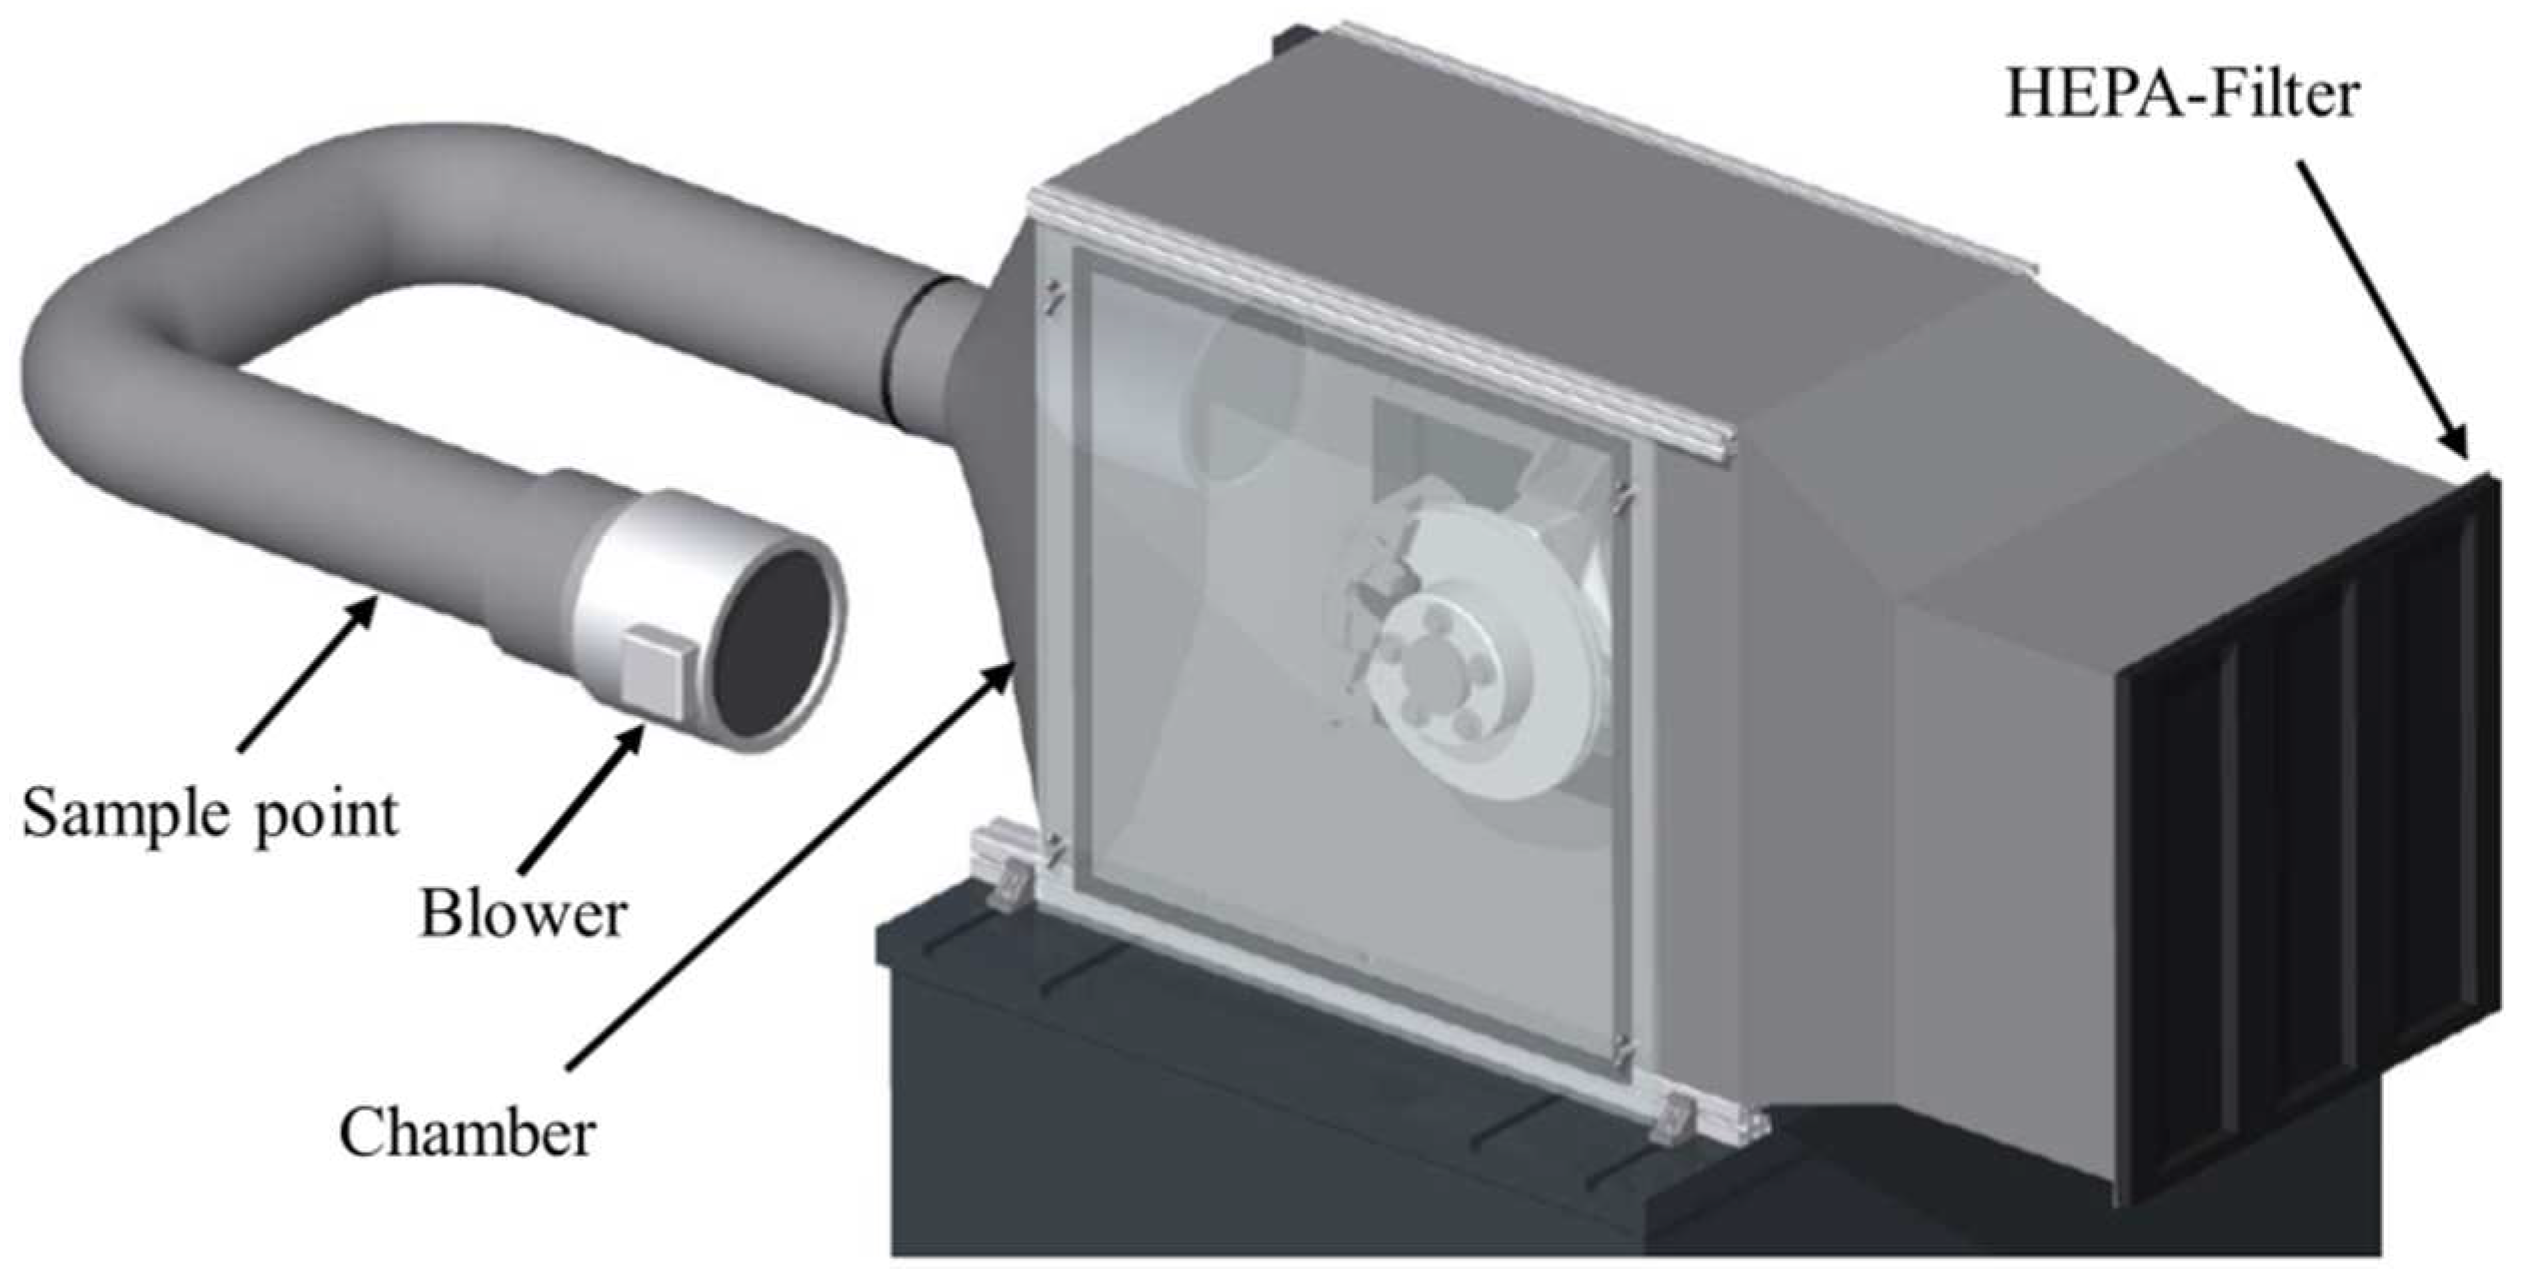
The main component of the setup for fine dust measurement is the TU Ilmenau constant volume sampling system (CVS) with a directly upstream HEPA H13 filter (see
Figure 1) [
8,
12]. The optimal flow rate range of this system was simulated and experimentally validated for sampling losses using test aerosol to be 750–850 m
3/h.
Sampling from the dilution tunnel was performed by using isokinetic probes according to EN 13284-1 and ISO 9096 (Paul Gothe GmbH, Bochum, Germany). To achieve isokinetic ratios of 1 ± 0.1 (the GTR allows for isokinetic ratios in the range 0.9–1.15), appropriate nozzle diameters were selected with regard to the sampling flow used for the individual tests.
A differential pressure transmitter (Kimo Electronic Pvt. Ltd., Mumbai, India) was used to measure the air flow downstream from the sampling point, as specified in the GTR. For sampling, three probes were placed in the same plane 1 cm from the duct centre. The first probe was used for particle number (PN) measurement, the second one for particulate matter mass (PM), and the third one for determining the particle size distribution.
PM samples are fractioned and collected on plane glass fibre filters in three particle size classes by the use of a calibrated PM10/PM2.5 in-stack measurement three-stage-cascade impactor (Paul Gothe GmbH, Bochum, Germany). At first, particles >10 µm in (aerodynamic) diameter are separated during the first stage. Particles smaller 10 µm (PM10) reach the next stage where particles between 2.5 and 10 µm are collected on the second filter. PM2.5 particles are able to progress to stage three where they are collected on a third filter. It must be noted that the final adopted UN GTR does not allow for the use of impactors for collecting PM samples; however, the method is not expected to introduce a significant error in the PM measurement due to the relatively low particulate matter mass collected on the filters. For evaluation of emission characteristics in terms of size-specific differences, the PM10/PM2.5 ratio is additionally investigated and discussed. Sampling is performed with a volume flow of 3.2 m3/h, which is constantly controlled depending on the ambient gas conditions. According to VDI 2066, the lower detection limit of the filter loading is 0.3 mg for PM2.5 and 0.4 mg for PM10.
A microbalance (Radwag Waagen GmbH, Hilden, Germany) was used for the gravimetric determination of the filter mass. The weight of the filters is determined before and after each test in accordance with the UN GTR. The accuracy is 1 µg with a repeatability of 1.6 µg. The mass of particulate matter collected on the filters was between 0.6 and 2.8 mg for PM10 and 0.3 to 1.3 mg for PM2.5, which is within the permissible limits (manufacturer specification: max. 3 mg on PM10 filter; max. 20 mg on PM2.5 filter) [
17]. The filters were conditioned for 24 h in a temperature- and humidity-controlled climate room (20 ± 2 °C; 50 ± 7% RH) before each measurement. To minimise measurement inaccuracies, each filter was weighed 5 times and the mean value was used for the calculation of the PM emission factors.
In order to relate the determined emission factors with regard to wear, the total mass loss of the friction partners was determined (in mg) and divided by the total testing driven distance (in km). This was performed using two laboratory balances (Kern and Sohn GmbH, Balingen-Frommern, Germany; resolution: 0.05 g (for brake discs and drums) and 0.01 g (for brake pads and shoes)) by weighing the friction partners before and after the tests following the specifications described in the UN GTR.
For PN measurement, a TSI 3772 (TSI Inc, Aachen, Germany.) 10 nm Condensation Particle Counter (CPC) with dual-dilution system was used in accordance with the European exhaust emission standard [
18]. The dilution device consists of a primary and a secondary diluter (PND1 and PND2) in combination with a catalytic stripper that is used to remove volatile particles. A preclassifier (cyclone) with a cutoff size of 2.5 µm that prevents coarse-mode particles from entering the system is mounted upstream from the catalytic stripper. Inside the diluter, the aerosol is first diluted 15 times by hot air at 191 °C. The diluted air reaches a catalytic stripper operating at 350 °C for thermal treatment. A second 10:1 dilution stage follows where the sample is cooled by using filtered air at room temperature before entering the particle counting unit (CPC). The measurement results of the (solid) particle number are indicated as PN.
An Electrical Low Pressure Impactor (ELPI+; Dekati Ltd., Kangasala, Finland) was used in dedicated tests to investigate the size distribution of the emitted particles. This instrument is based on an electric-charge-measuring principle that uses a unipolar corona charger for conditioning of the incoming sample as a first step. The electrically charged particles later deposit depending on their size on impactors (connected to sensitive electrometers). Fourteen impactor stages (with greased aluminium foils for particle collection), covering the particle diameter size range 6 nm to 10 µm enable the instrument to distinguish emitted fine dust particles based on their aerodynamic diameter. Since this instrument operates without thermal preconditioning, the measurement results depict total PN (TPN). Thus, all particle occurrences are fractionated into the corresponding size classes.
2.2. Brake Systems and Friction Material
The aim of the investigations carried out within this work is to provide examples of the brake dust emissions of current C-Class and J-Class EU vehicles and to identify possible reduction measures already available today. Four different scenarios were examined, as described in
Table 1,
Table 2,
Table 3 and
Table 4. In accordance with the GTR specification, the mass in running order (MRO—unladen mass + operating materials) increased by the mass corresponding to 1.5 persons (75 kg each) was used for all vehicles to calculate the inertia to be simulated on the test bench (minus 13% to account for driving resistance) [
5].
In the first scenario, the front and rear-axle brake systems of a representative mid-size C-segment vehicle were selected. This vehicle is equipped with floating calliper brakes on all four wheels. Ventilated grey-cast iron (GCI) discs are mounted on the front and solid discs on the rear axle. For the front brake, the standard friction pairing (ECE), a non-asbestos organic (NAO) brake pad set, and an aftermarket product were tested (see
Table 1). The purpose of the tests on this vehicle is, on the one hand, to determine a total vehicle emission factor and, on the other hand, to illustrate the emission levels of different types of brake pads.
Table 2 contains the vehicle and test parameters for a comparison of three sets of drum brake shoes using the example of a mid-size C-segment rear axle. The simplex drum brake is used to compare the emission characteristics of different shoe mixtures.
In the third scenario, the comparison of a friction system with a tungsten carbide-coated brake disc as representative of alternative friction materials with a conventional GCI friction pairing is carried out. For this reason, the SUV listed in
Table 3 was chosen. The front-axle brake system of this vehicle has a 19″ fixed calliper brake system with ventilated brake disc. The standard GCI friction pairing with ECE linings serves as a benchmark, which is compared to a tungsten carbide-coated brake disc (henceforth: hard metal coated—HMC) with hybrid linings specially adapted to the requirements of the coating.
The final investigations are based on the mid-size C-segment vehicle previously described in
Table 1. In this case, the comparison shown in
Table 4 is made with regard to the vehicle electrification level. For this purpose, the emissions of the vehicle’s standard friction pairing under conventional operation were compared to those caused by the brake when different recuperation capacities are taken into account. The assumptions for the simulation of electric braking (Plug-In Hybrid Vehicle—PHEV and Battery Electric Vehicle—BEV) are described in
Section 2.3.2 that follows.
2.3. Test Protocol
2.3.1. Sections of the Brake Emissions Test
The emission measurements were carried out in the period between Q3 2021 and Q2 2022. Accordingly, the investigations are based on the state of the PMP Brake Emission Protocol 07/2021 [
19,
20]. In addition to the methodological framework for sampling and measurement of brake dust, it also defines the cycle to be completed on the test bench. The WLTP Brake Cycle, developed to simulate realistic driving scenarios, comprises 10 individual trips, which in total correspond to 303 brake events with a mileage of 192 km. The details of the cycle are described in [
21]. A previous ILS using brake dynamometers assessed the test-to-test (repeatability) and lab-to-lab (reproducibility) of the cycle [
22].
Trip 10 of the mentioned cycle initially serves to set a suitable cooling volume flow for the measurement. The temperature corridors for the brake disc specified within the method on the basis of the wheel load/disc mass (WL/DM) ratio must be adhered to. On the basis of six defined reference brake events, mean values for the initial brake temperature (IBT) and final brake temperature (FBT) of these events are formed and used together with the mean section temperature for comparison with the permissible temperature corridors. This is to ensure that the friction system is simulated and evaluated in terms of emissions in a realistic and reproducible temperature range. For air conditioning, 20 ± 2 °C and a relative humidity of 50 ± 5 % were specified (a last-minute change in the GTR defines 23 ± 2 °C for the incoming cooling air to match regulatory provisions of other regulations).
After the cooling air speed adjustment, the brake emissions test continues with the application of the bedding section. This consists of five runs of the WLTP Brake Cycle which serve for preconditioning the brakes and for creating homogeneous friction contact areas. Once the contact areas are created, removing the brake system from the brake dyno is not allowed. Therefore, the five WLTP Brake Cycles of the bedding section are always followed by the emissions measurement section without disassembling the brake system. To monitor the emission trend and the stabilisation of the emissions behaviour, the PN emission factor is determined during bedding for each one of the five repetitions of the WLTP Brake Cycle.
Finally, three additional WLTP Brake Cycle iterations form the actual emission measurement, which enables the calculation of both PN and PM emission factors. The final PM and PN emission factors for a given brake are formed by the mean value of the three main emission measurements. The final adopted version of the GTR foresees only one repetition of the WLTP Brake Cycle for emission measurement.
2.3.2. Simulation of the Recuperation Capability
The ability of electrified vehicles to generate braking torque through the electric motor (recuperation) reduces load on and use of friction brakes—and thus the energy dissipated—on the mechanical brakes. The potential for reducing PM and PN emissions depends primarily on the performance of the electric machine in combination with the battery management system [
23,
24].
In order to provide a realistic analysis of current systems and concepts on the European market, the recuperation capability of a typical C-segment PHEV and BEV was simulated. Owing to the fact that there is not yet a defined method for investigating braking systems of electric vehicles, some parameters and assumptions had to be defined in advance. First of all, in the context of these investigations, the permanently available maximum recuperation power of the vehicle was assumed. This means that neither the battery’s state of charge (SoC) nor various environmental influences relevant for the electrical performance are taken into account.
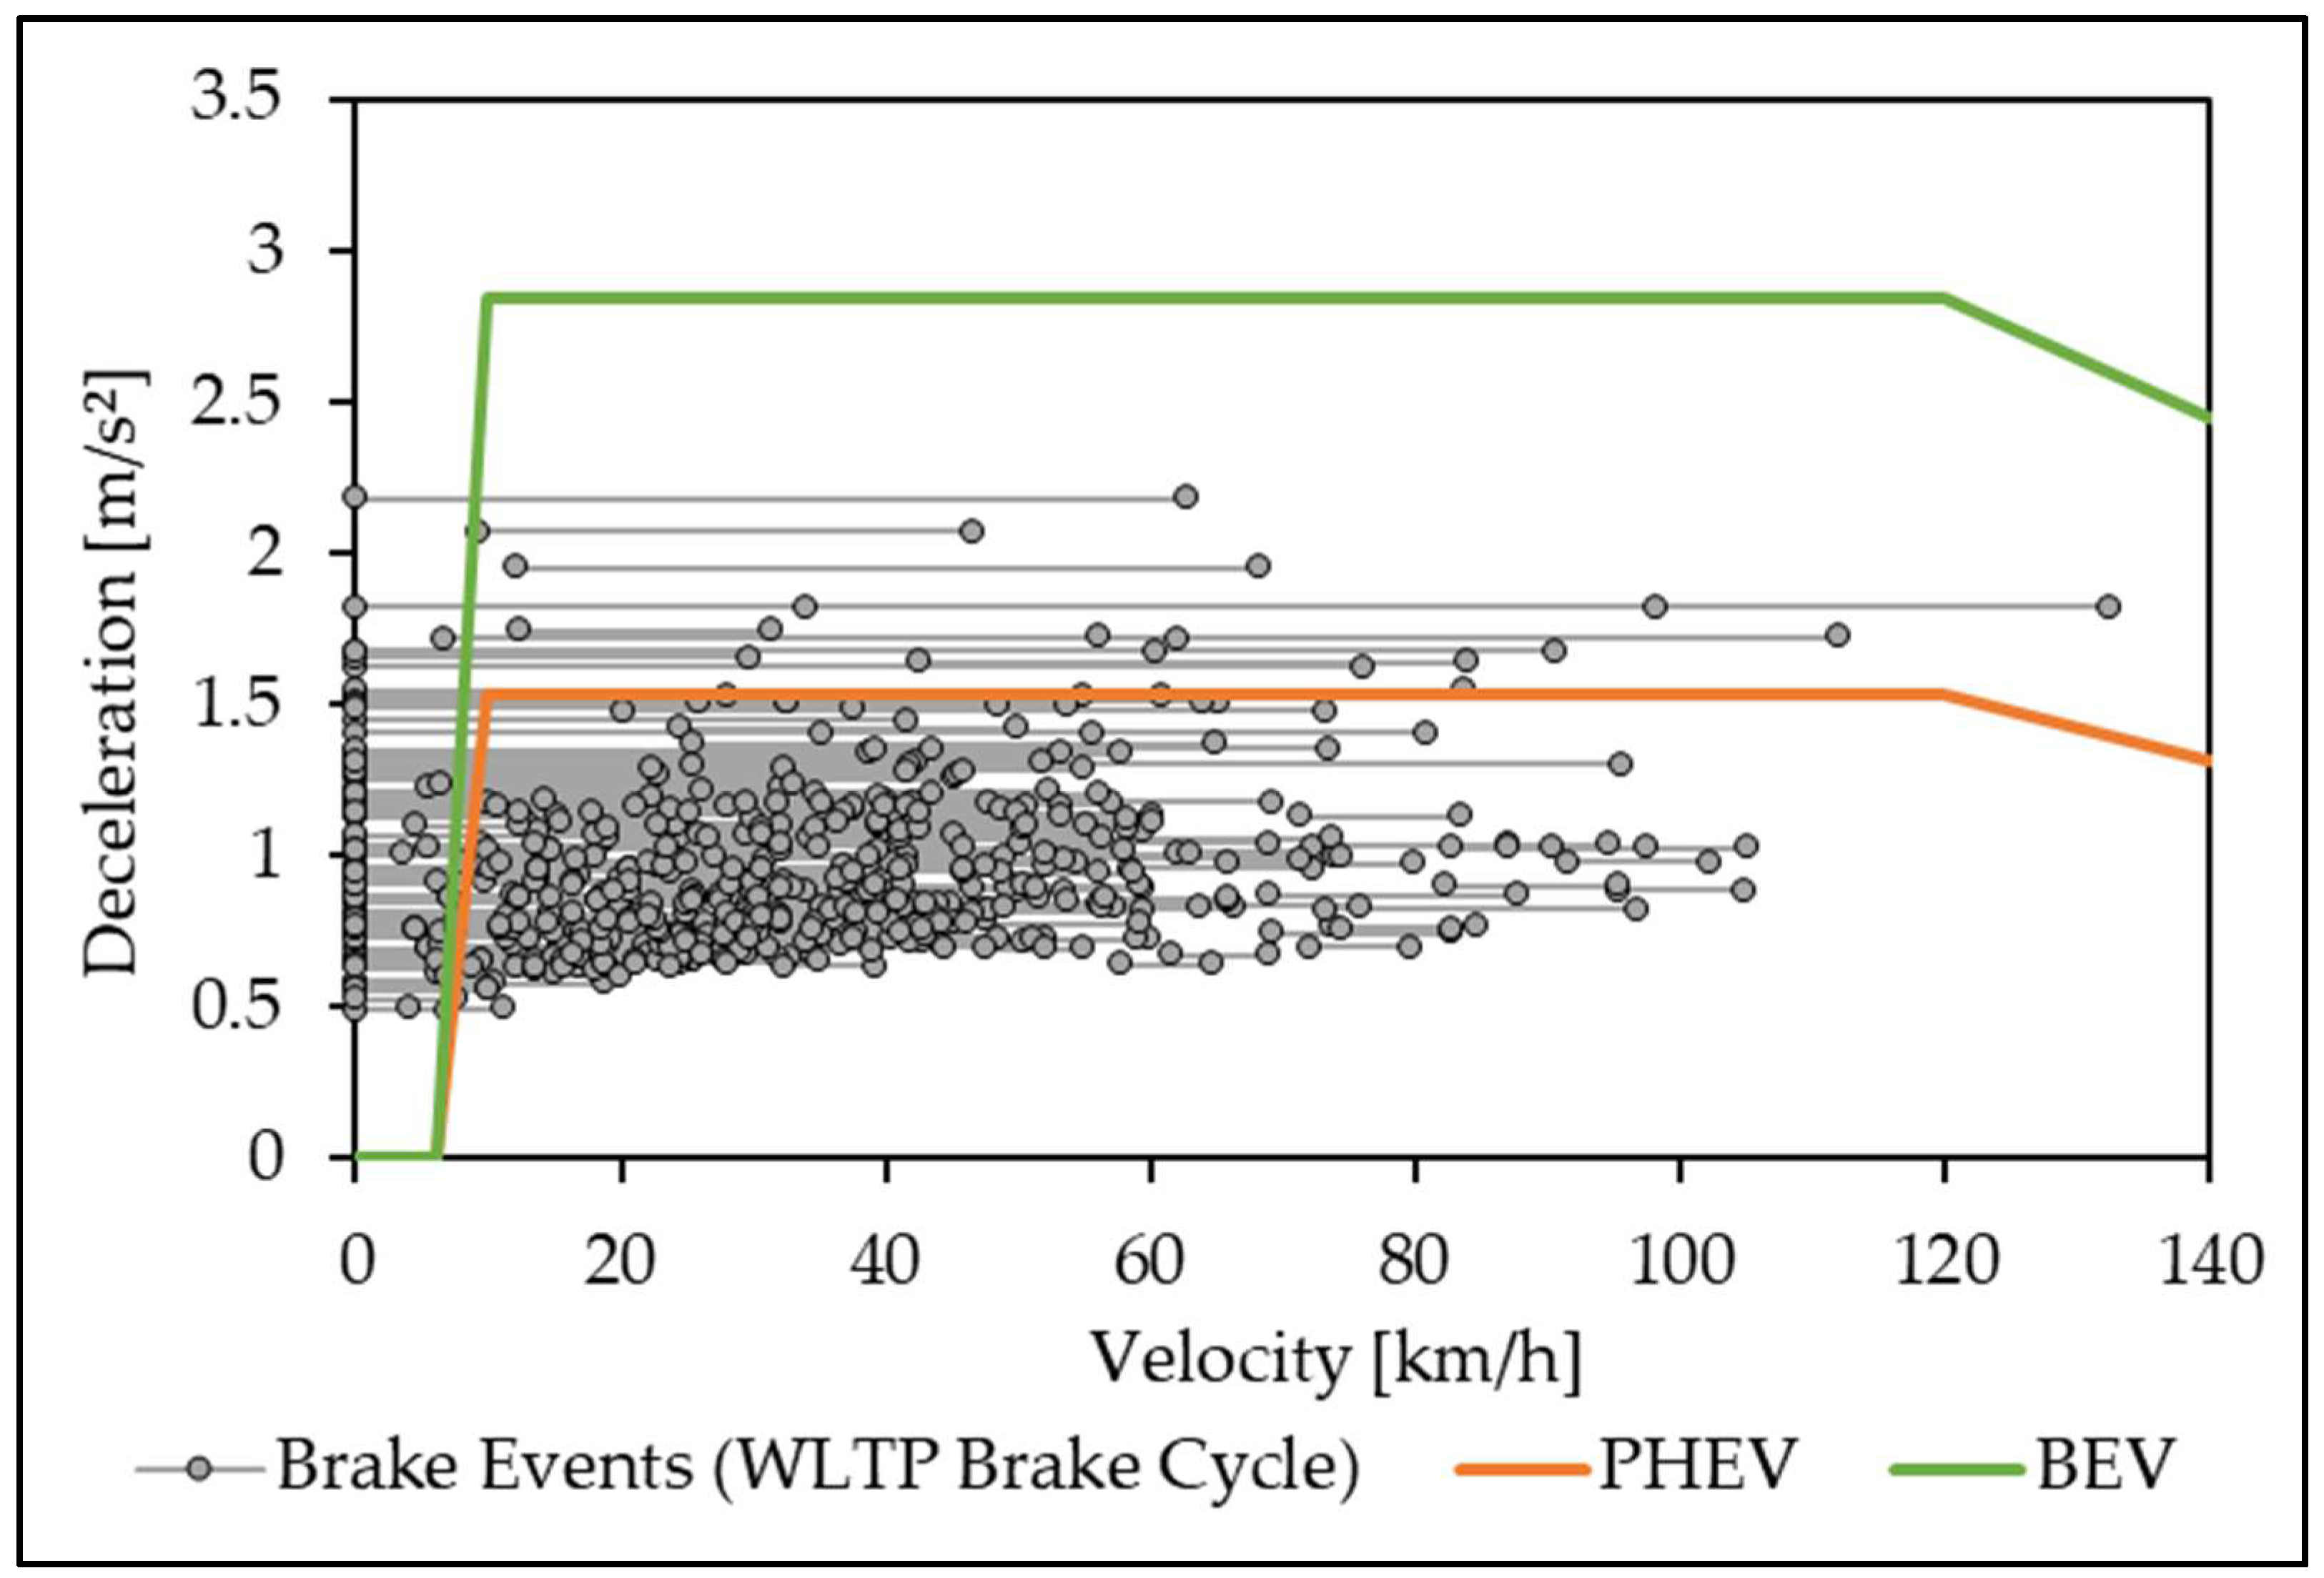
Since the actual generator characteristics and the blending behaviour of the vehicles are not known, a generator power of 85 kW was assumed for the simulation of the PHEV recuperation. The maximum deceleration that can be realised by the generator is thus about 0.156 g (or 1.53 m/s
2). The blending range for deceleration at low speeds takes place between 10 and 6 km/h. This results in the PHEV recuperation map shown in
Figure 2. Therefore, among the overall 303 deceleration events of the WLTP Brake Cycle, 14 brake events occur purely via the friction brake (a > 0.156 g), 128 events are blended (v
end < 10 km/h), and 161 decelerations occur solely by the electric motor (cf.,
Table 4).
The simulation of the BEV, also shown in
Figure 2, uses the same brake blending range between 10 and 6 km/h. Owing to the higher generator power of 115 kW, the BEV’s electric motor is capable of decelerations up to 0.29 g (or 2.84 m/s
2). Therefore 166 brake events are performed exclusively by the electric motor, while for 137 decelerations brake blending takes action (cf.,
Table 4).
3. Results
3.1. Total Emissions of the Vehicle
In terms of driving physics, the dynamic axle load distribution causes an increase in wheel loads on the front axle during braking. For this reason, the front brake systems of light-duty vehicles often have to generate more than two-thirds of the total braking power required for deceleration. As a result, larger brake discs are used and the friction contact area increases. In addition, the higher inertia of the front axle resulting from the wheel loads leads to a higher braking power requirement, which also influences the particle emission.
In order to show the respective shares of the front and rear axle in the total brake emission of a vehicle, the front and rear-axle disc brake systems belonging to the same vehicle (C-segment vehicle) were examined in the context of this campaign. The comparison is based on the commercially available original equipment manufacturer (OEM) parts consisting of GCI brake discs with ECE brake pads.
Table 5 presents the measured PM (PM10 and PM2.5) and PN results for the described configuration on front (FA) and rear-axle (RA) brake.
As expected from the given wheel loads, significantly lower PM and PN emission factors for the rear-axle brake are shown in
Table 5 compared to the corresponding front-axle friction pairing. The PM emission of the rear axle in this case accounts for about 23% of the total vehicle emission level of the vehicle (22% for PM10 and 24% for PM2.5). For PN emissions, the rear axle provides approximately 11% of the total vehicle PN emission levels.
The emission factors of the entire vehicle are calculated as the sum of twice the front-axle brake and rear-axle brake emission factors.
Table 6 shows that the PM10 emission factor is calculated to be approximately 13.6 mg/km/vehicle. In view of the proposed Euro 7 limit value of 7 mg/km/vehicle for PM10, as proposed by the European Commission, it becomes evident that current mid-size vehicles have to at least halve their brake dust emissions until Euro 7 might become mandatory (if the limit values and test procedures are to be agreed). The same vehicle emits approximately 7.4 mg/km/vehicle PM2.5, whereas PN emissions reach the level of 10
10 #/km/vehicle.
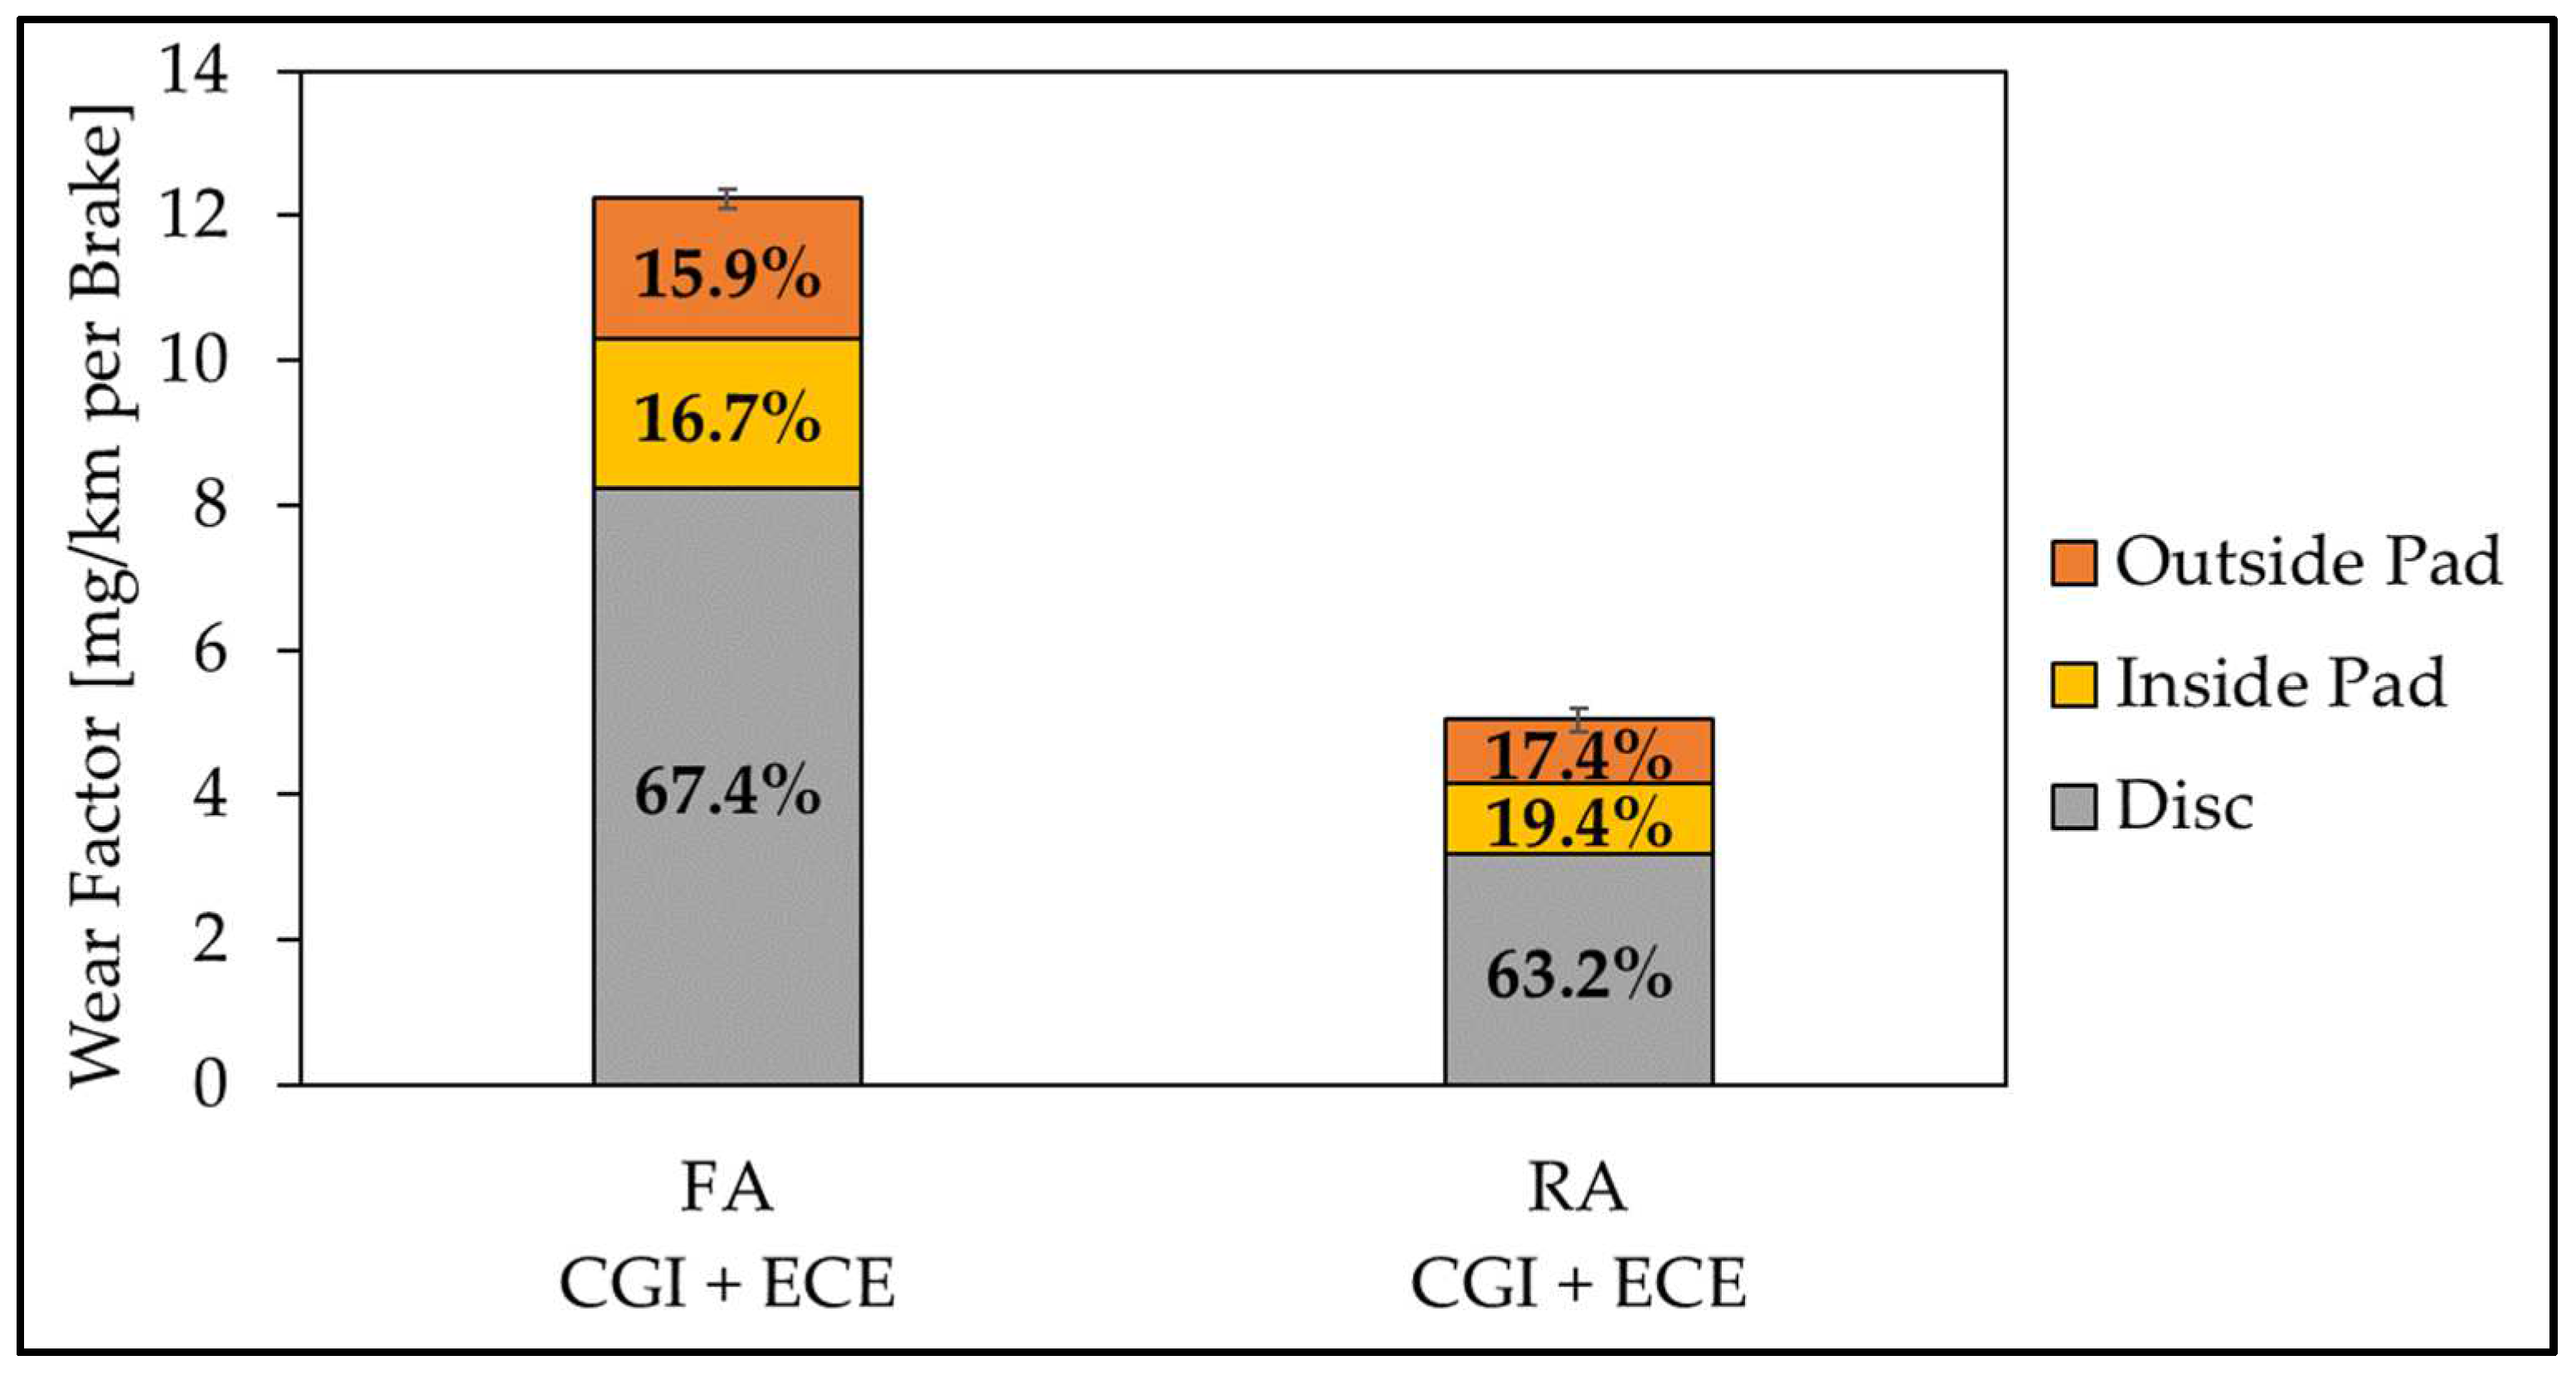
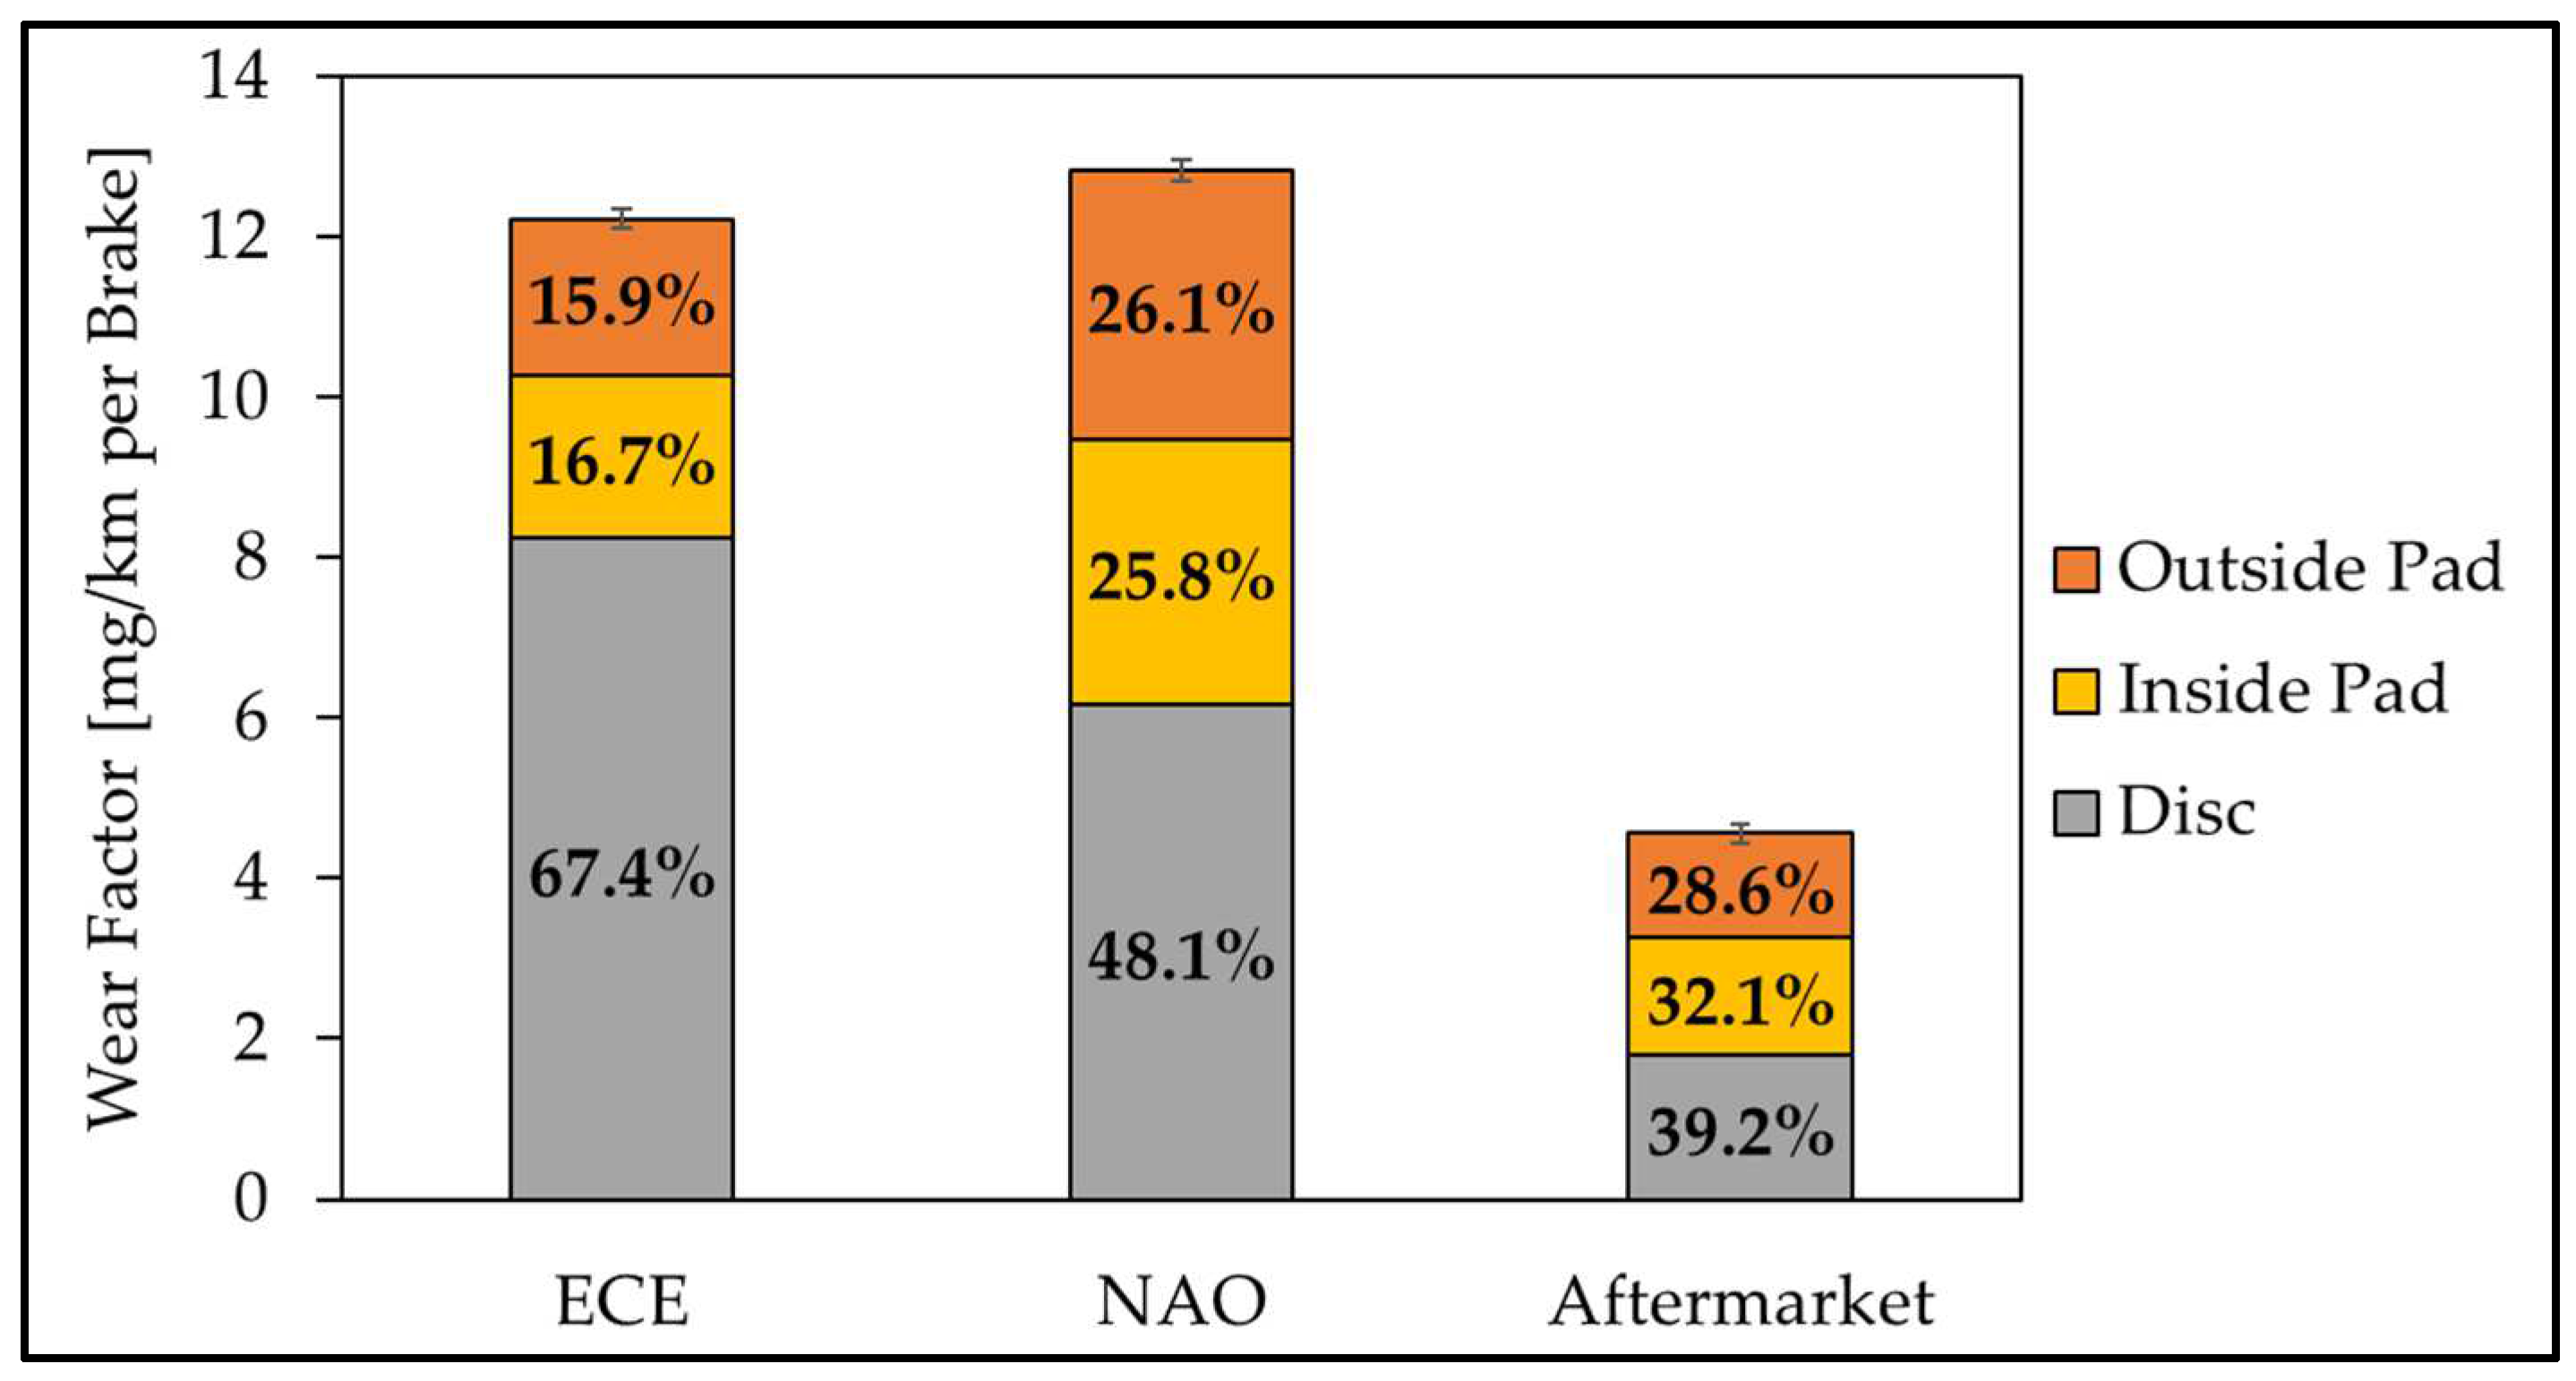
Regarding the entire vehicle brake wear, it is calculated that the total mass loss of the brake system is approximately 34 mg/km/vehicle, whereas each FA and RA brake accounts for 12.2 and 5.0 mg/km/vehicle, respectively. This shows that the majority of the brake mass loss does not fall in the PM10 fraction [
7]. A comparison of the wear factors shows that the rear axle accounts for approximately 29% of the total wear, which is similar to the calculated particulate matter mass ratio (23%). In addition to the comparison of the absolute wear,
Figure 3 shows the typical characteristics of friction pairings with ECE brake pads in terms of wear shares. The abrasive pads cause high disc wear, which often accounts for about two-thirds of the total wear.
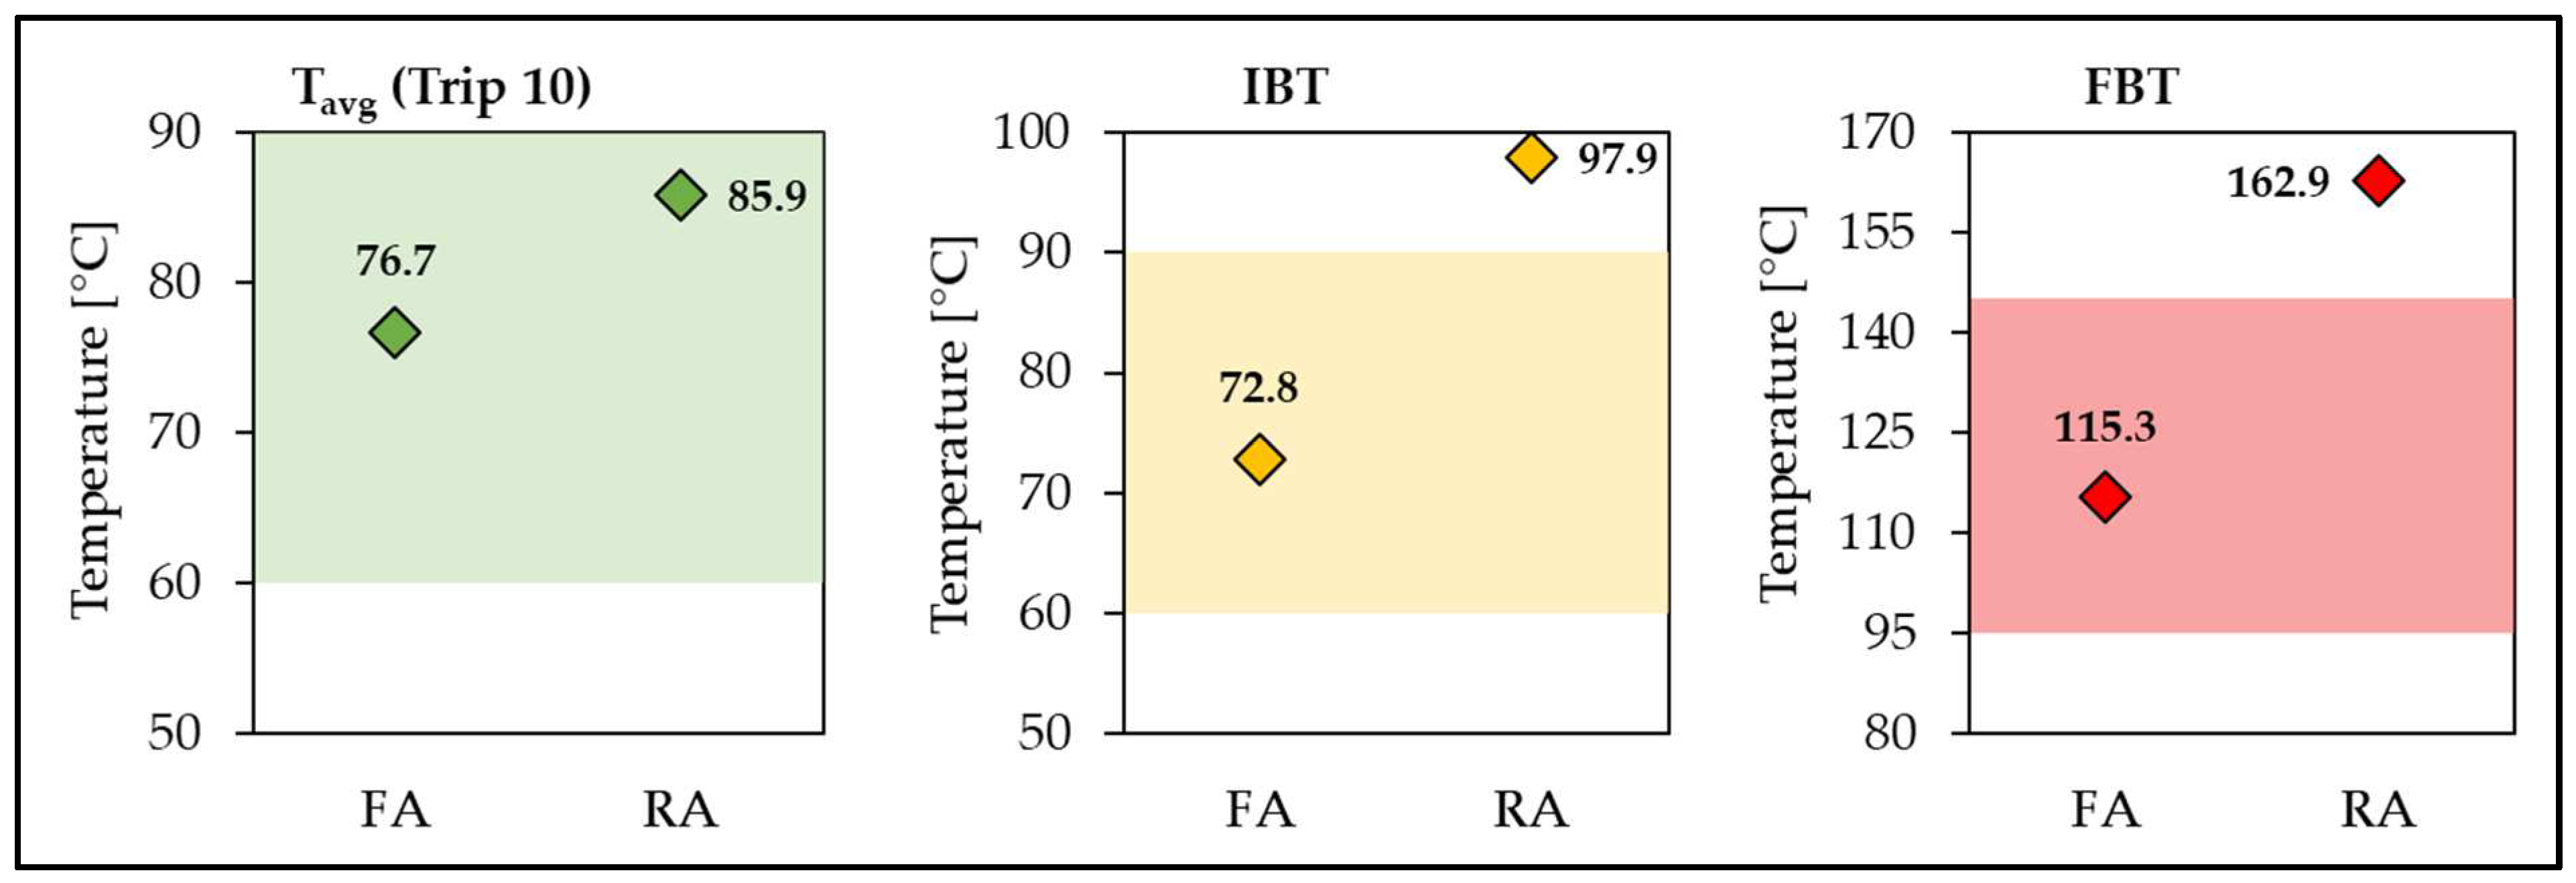
With the aim of direct comparability between front and rear-axle brakes, the identical volume flow was used for cooling flow adjustment and emission measurement. The current GTR also covers the case of corresponding rear-axle brakes without the need to fulfil the temperature corridors (compliance is mandatory only for the front axle). Compliance with the temperature corridors is at first verified using the front-axle brake or rather the volume flow is adjusted accordingly. Later, the corresponding rear-axle brake is measured under the same conditions. Both brakes (front and rear) compared in this study are in category 3 of the defined temperature corridors with regard to their wheel load/disc mass ratio (WL/DM) [
20].
Figure 4 illustrates the category 3 temperature corridors valid at the time of testing for average cycle temperature (Trip 10), initial brake temperature (IBT), and final brake temperature (FBT) of the reference brake events. The front-axle brake with the set volume flow 810 m
3/h fulfils the requirements perfectly. On the other hand, the rear-axle brake has a temperature level above the IBT and FBT corridors. The brake therefore runs hotter than the originally permitted range; however, as mentioned above compliance is not mandatory in the GTR for the rear axle. The current version of the GTR contains significantly wider corridors. IBT up to 110 °C and FBT up to 165 °C are now permitted in category 3. The rear-axle brake would therefore now meet the requirements even if not needed.
The background to this consideration is the influence of temperature peaks on the emission behaviour of tribological friction systems, and particularly on the PN emissions of brake systems. Peak temperatures greater than 220 °C were measured in the rear-axle brake system (data not shown). Although no increased concentration of nanoscale volatile particles could be detected in the course of these investigations, it is known that, depending on the brake pad composition, significantly lower temperatures can already contribute to the emission of ultrafine dust. This type of fine dust is primarily relevant for the emission factor of the particle number, since the presence of ultrafine particles usually results in an exponential increase in the particle number concentration. This is described in more detail in [
16].
In order to be able to determine the presence of volatile fractions, the current state of the GTR provides the measurement of total PN (TPN) in addition to the solid PN (SPN) measurement. TPN records all particles in the range from 10 nm to 2.5 µm. For SPN, the particle counter is preceded by thermal preconditioning, which removes volatile components from the aerosol. SPN has advantages with regard to the reproducibility of the results and thus provides reliable information on the emission behaviour [
16]. For this reason, the PN emission factors reported in this paper are based on SPN measurements using an upstream catalytic stripper (350 °C) including double dilution of the aerosol.
Finally, it should be mentioned that a single thermocouple is only capable of resolving local thermal effects. These are dependent on the so-called wear pattern, in other words, on the load and run-in condition. This type of measurement is suitable for a general statement on the temperature behaviour of the friction system, but does not provide any insights on the formation of microscopic hotspots on the brake pads [
12,
25]. Ultimately, the composition and surface properties of brake pads are an important factor influencing the temperature behaviour and thus the emission of fine dust particles [
12,
26].
3.2. Influence of the Brake Pad/Shoe Material
3.2.1. Brake Pad Composition
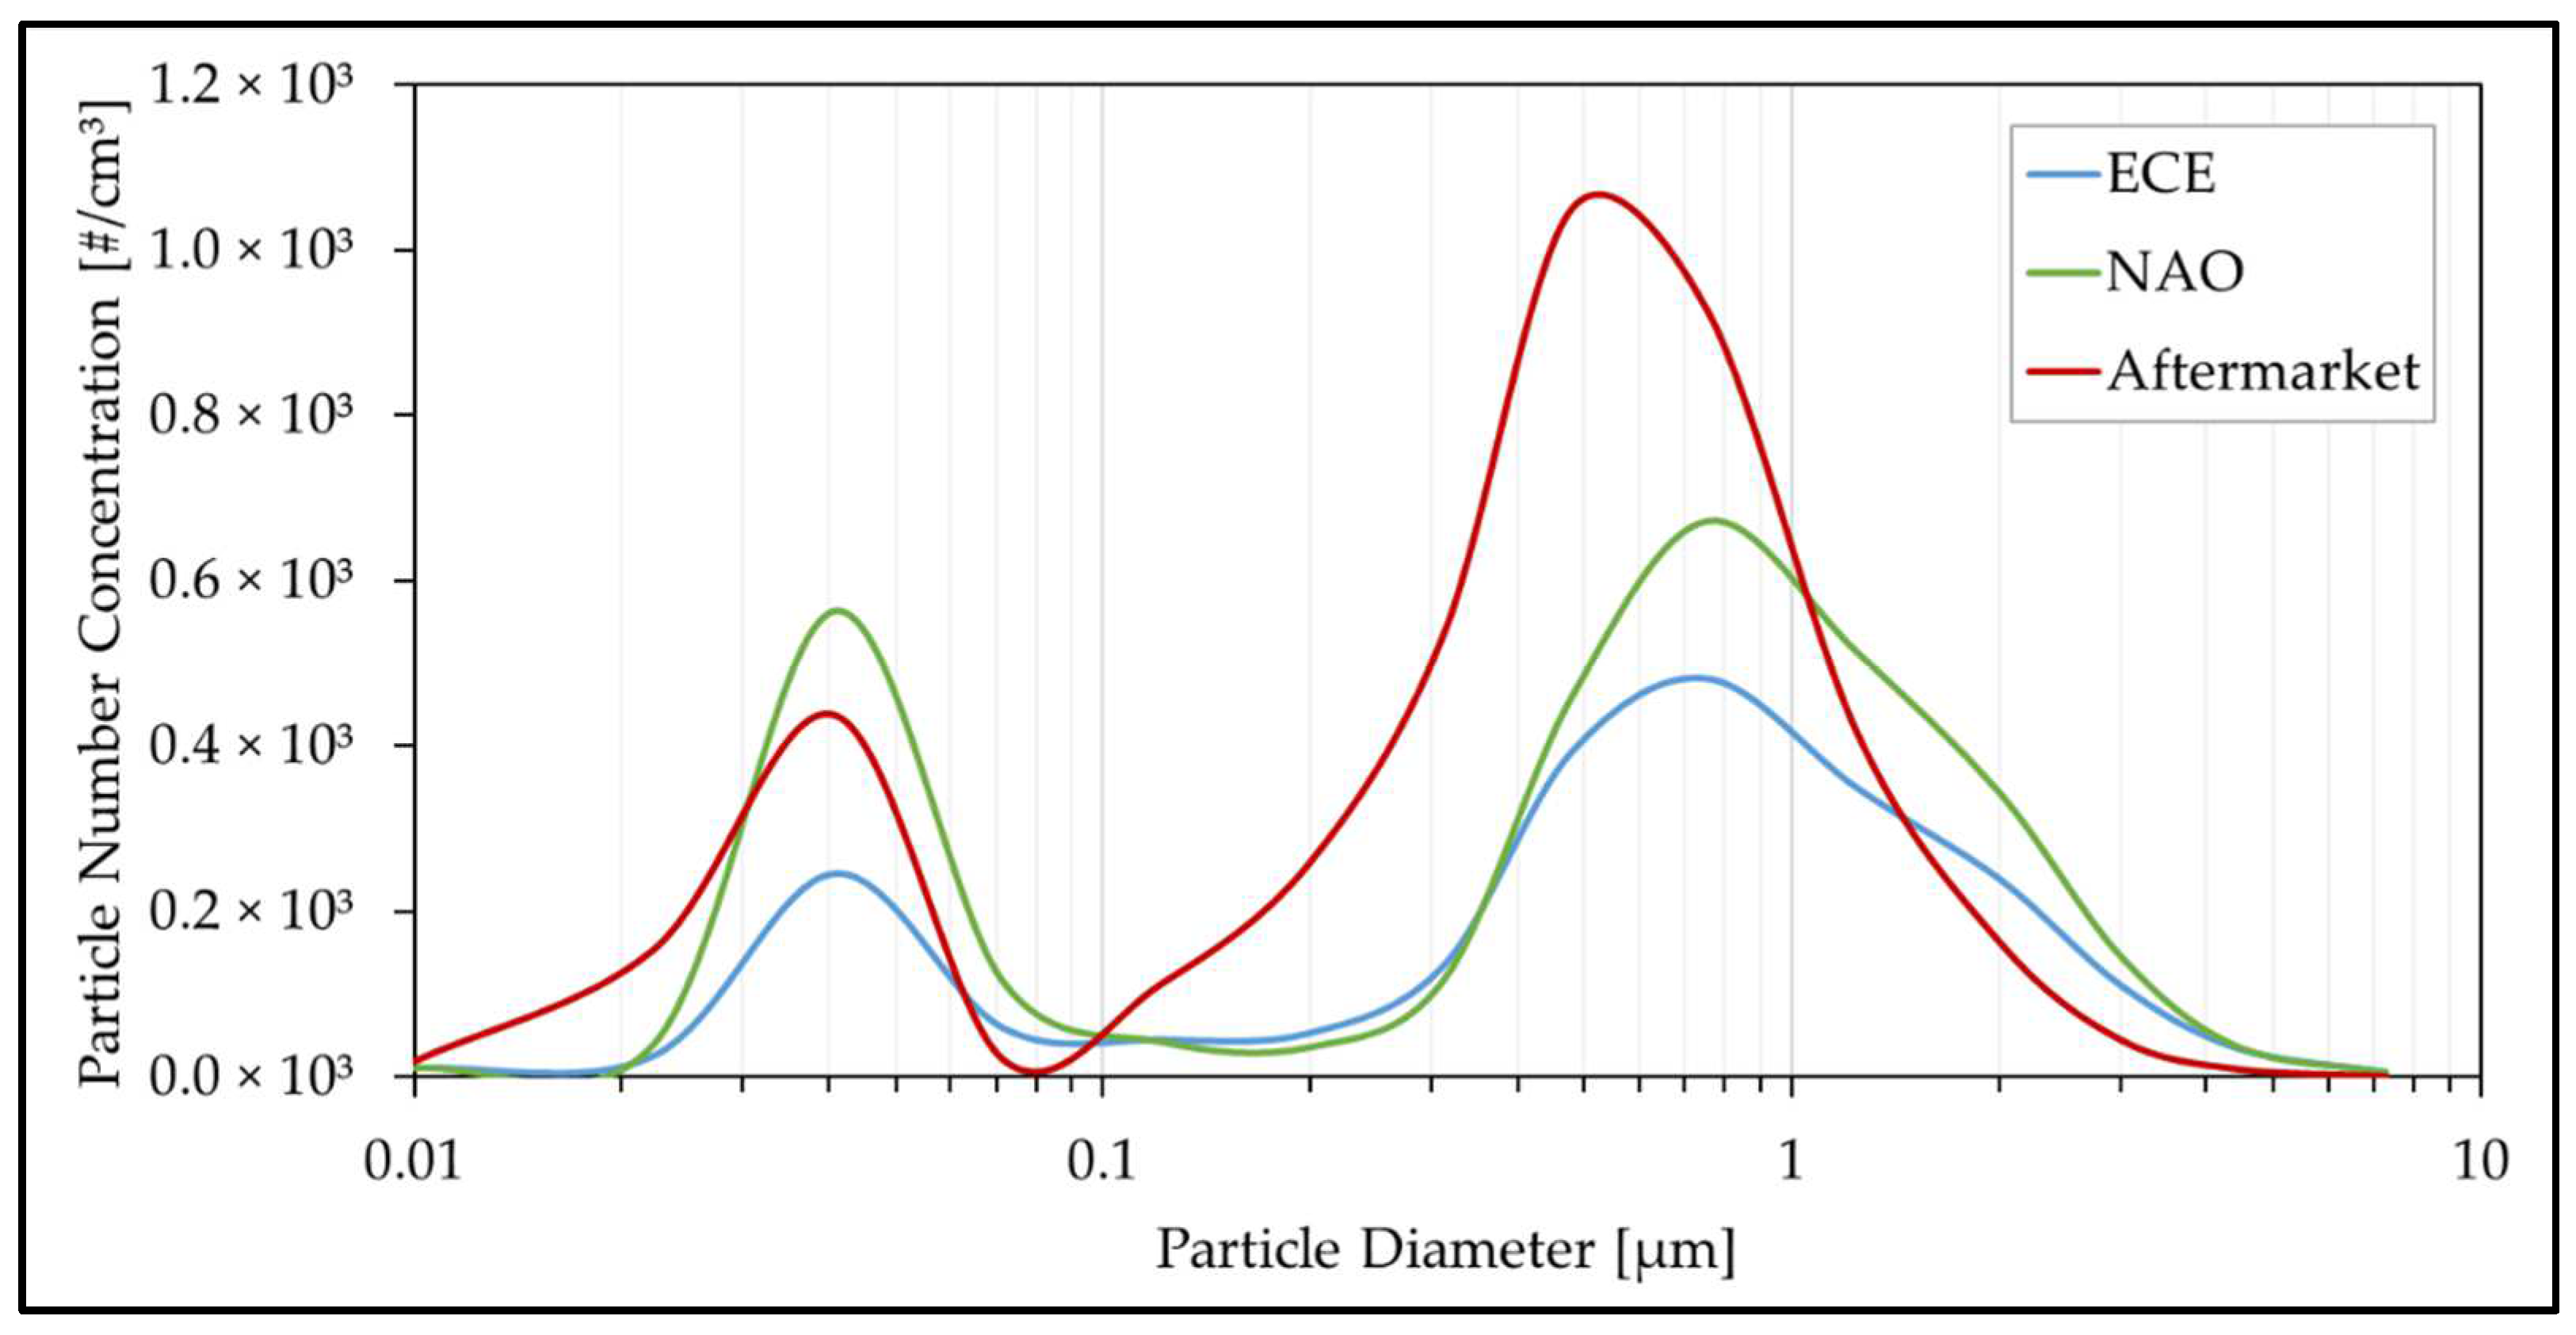
On the basis of the C-segment front axle, a comparison of different brake pad compositions was made. A representative of the low-steel brake pads (ECE) that dominate the European market was compared to a non-asbestos organic (NAO) brake pad set (American or Asian market) and an aftermarket brake pad set. All three pad mixtures were tested on identical conventional grey cast iron brake discs.
Table 7 shows the emission factors for PM and PN calculated as the mean value of the three main emission tests per friction pairing. As expected, the ECE friction pairing generates the most particulate matter mass [
16]. Similar results were reported in the ILS during the development of the GTR [
7]. Since this is the standard friction pairing for the European market, it serves as a benchmark in the following analysis and discussion. At this point, high demands in Europe on the braking performance and temperature stability of the friction systems, especially on German motorways, require somewhat aggressive brake pads, which at the same time lead to correspondingly high wear [
27]. In particular, it is the wear of the brake disc that comes to the foreground due to the abrasive effect of the ECE brake pads (cf.,
Figure 5).
By using NAO brake pads, the emission reduction potential for both PM and PN is measurable compared to the ECE benchmark. These pads, which were initially developed for comfort optimisation (reduction in noise and rim contamination), cause less disc wear, but are themselves less wear-resistant. For this reason, the total wear of this brake system, as can be seen in
Figure 5, slightly exceeds the total wear of the ECE benchmark brake system. Despite the similar level of wear, the NAO friction pairing is significantly less relevant to fine dust as it emits approximately 26% lower PM10 and 21% lower PM2.5. A much higher reduction compared to the benchmark (58.1%) is observed for PN emissions.
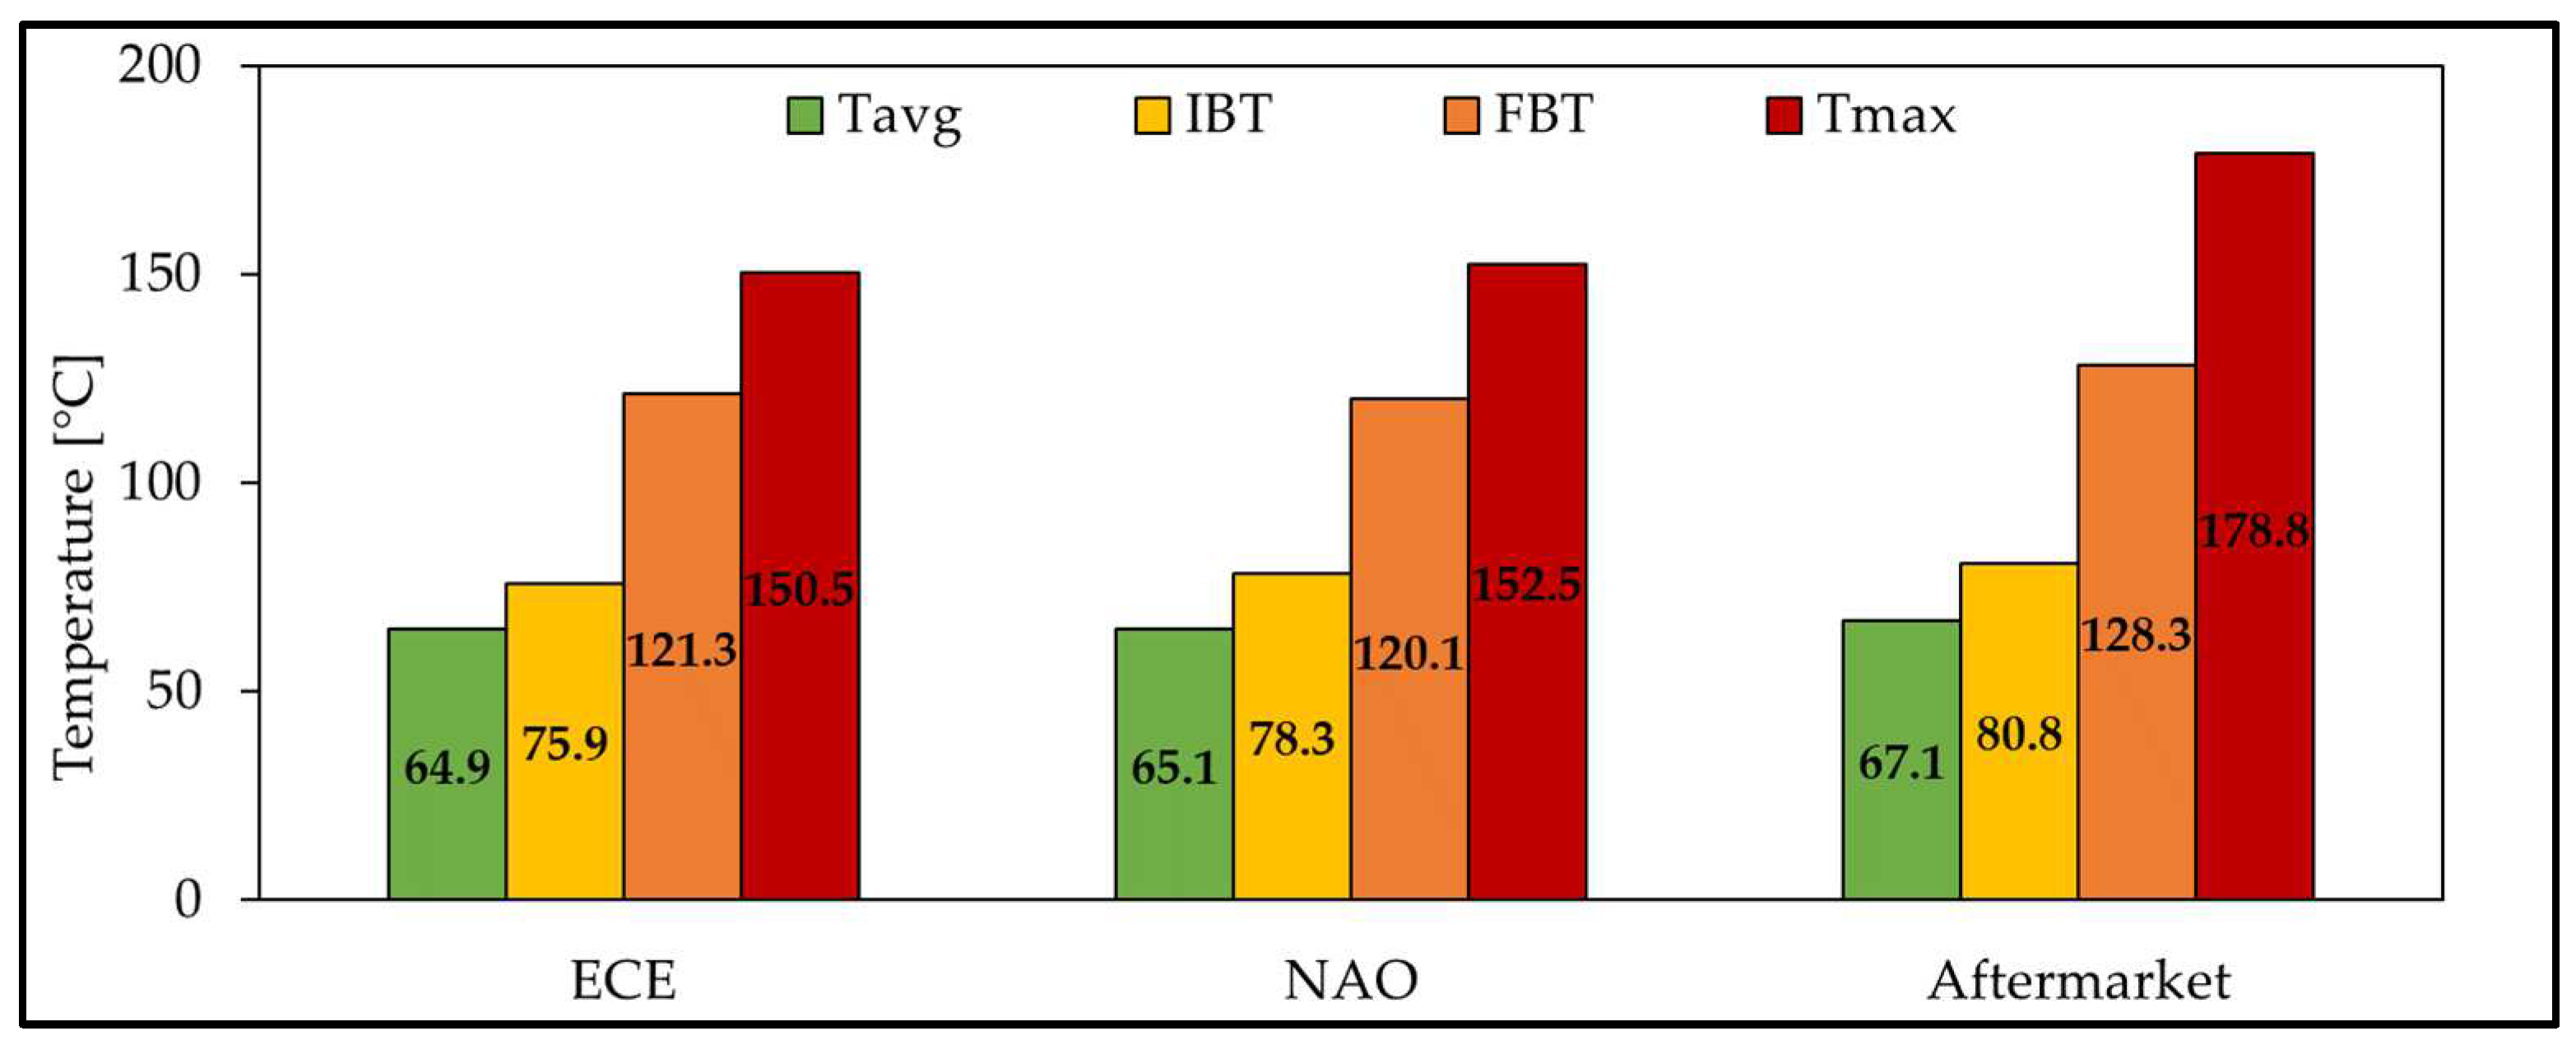
Significant PM reductions can be observed using the aftermarket brake pads. More specifically, it is observed that, compared to the benchmark ECE pads, the aftermarket brake pads emit 68% and 57% less PM10 and PM2.5, respectively. These reductions are very high and seem very promising for the brake systems to meet the requirements of the recently published Euro 7 pollutant emissions proposal. On the other hand, the emission factor of the particle number even slightly exceeds the corresponding value of the ECE reference. Such behaviour can often be attributed to temperature effects, especially local peak temperatures. High temperatures favour the formation of small particles, which have a major influence on the total number of particles [
28,
29,
30,
31]. In contrast, they are hardly measurable in the mass of fine dust.
Figure 6 illustrates an increased peak temperature of the aftermarket friction pairing, which supports such an argumentation in principle.
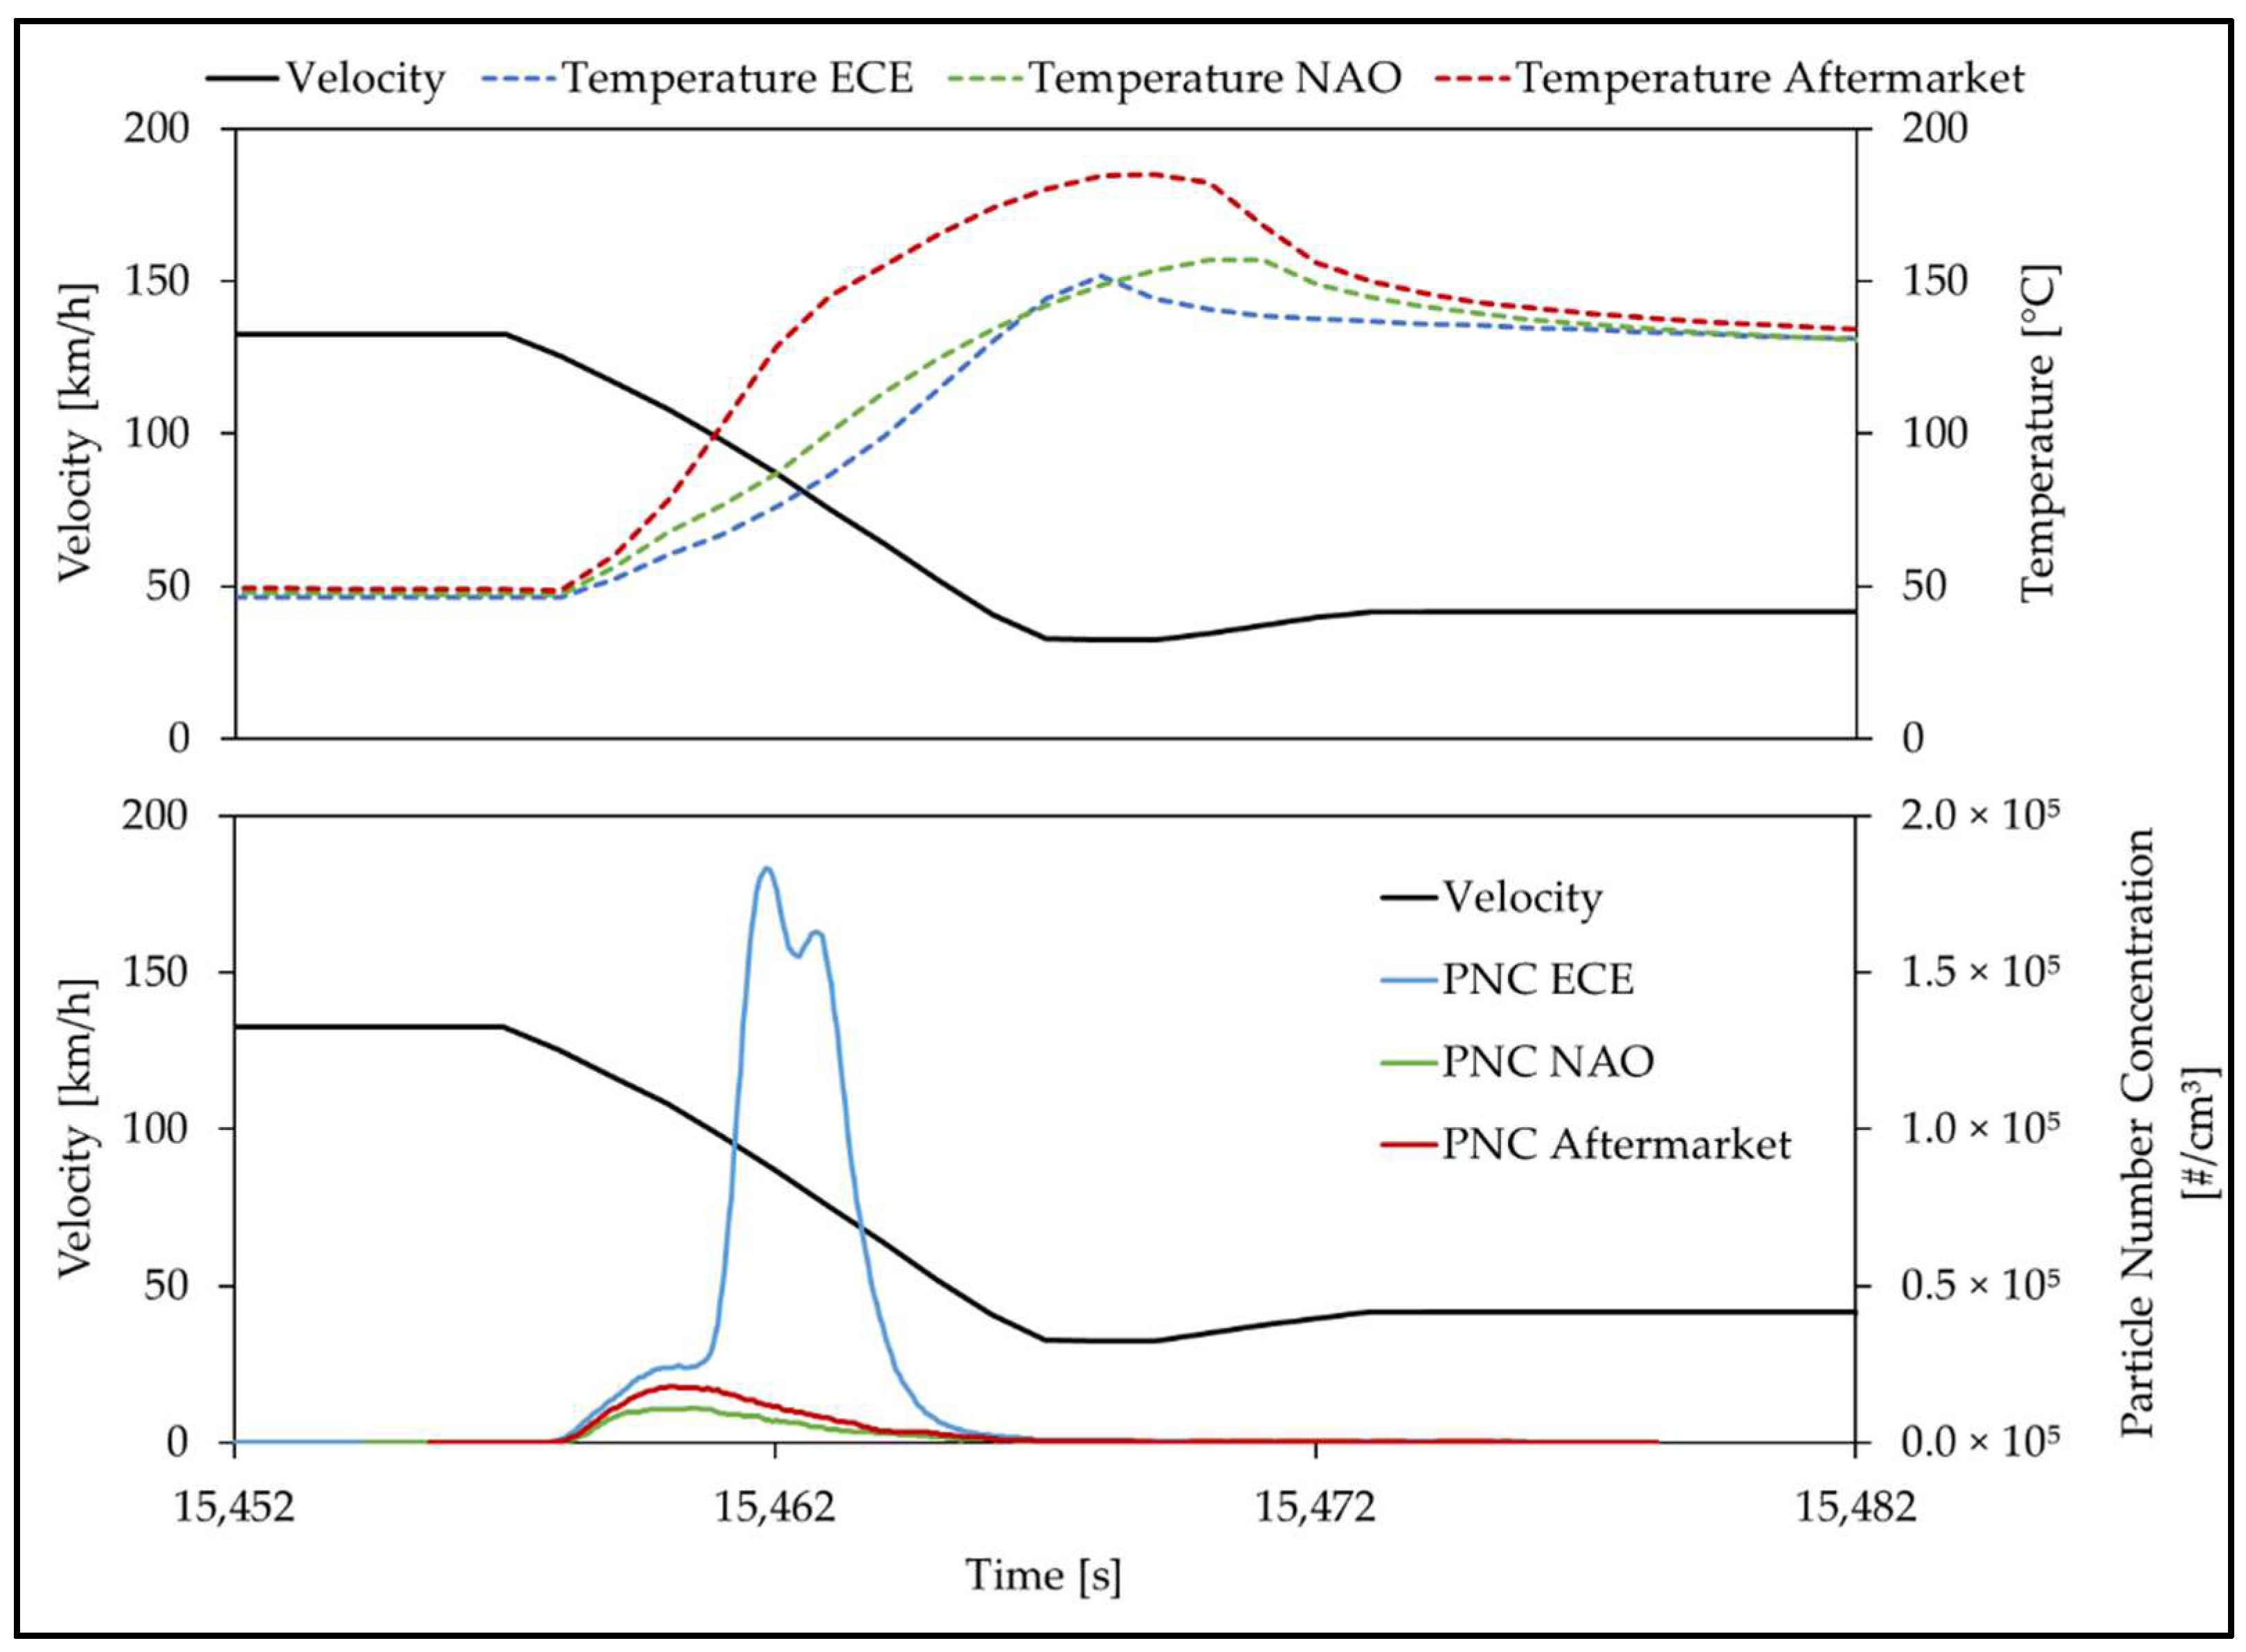
However, a closer look at the emission behaviour during the cycle reveals that the peak temperatures during individual brake events do not result in increased particulate emissions compared with the ECE reference (
Figure 7).
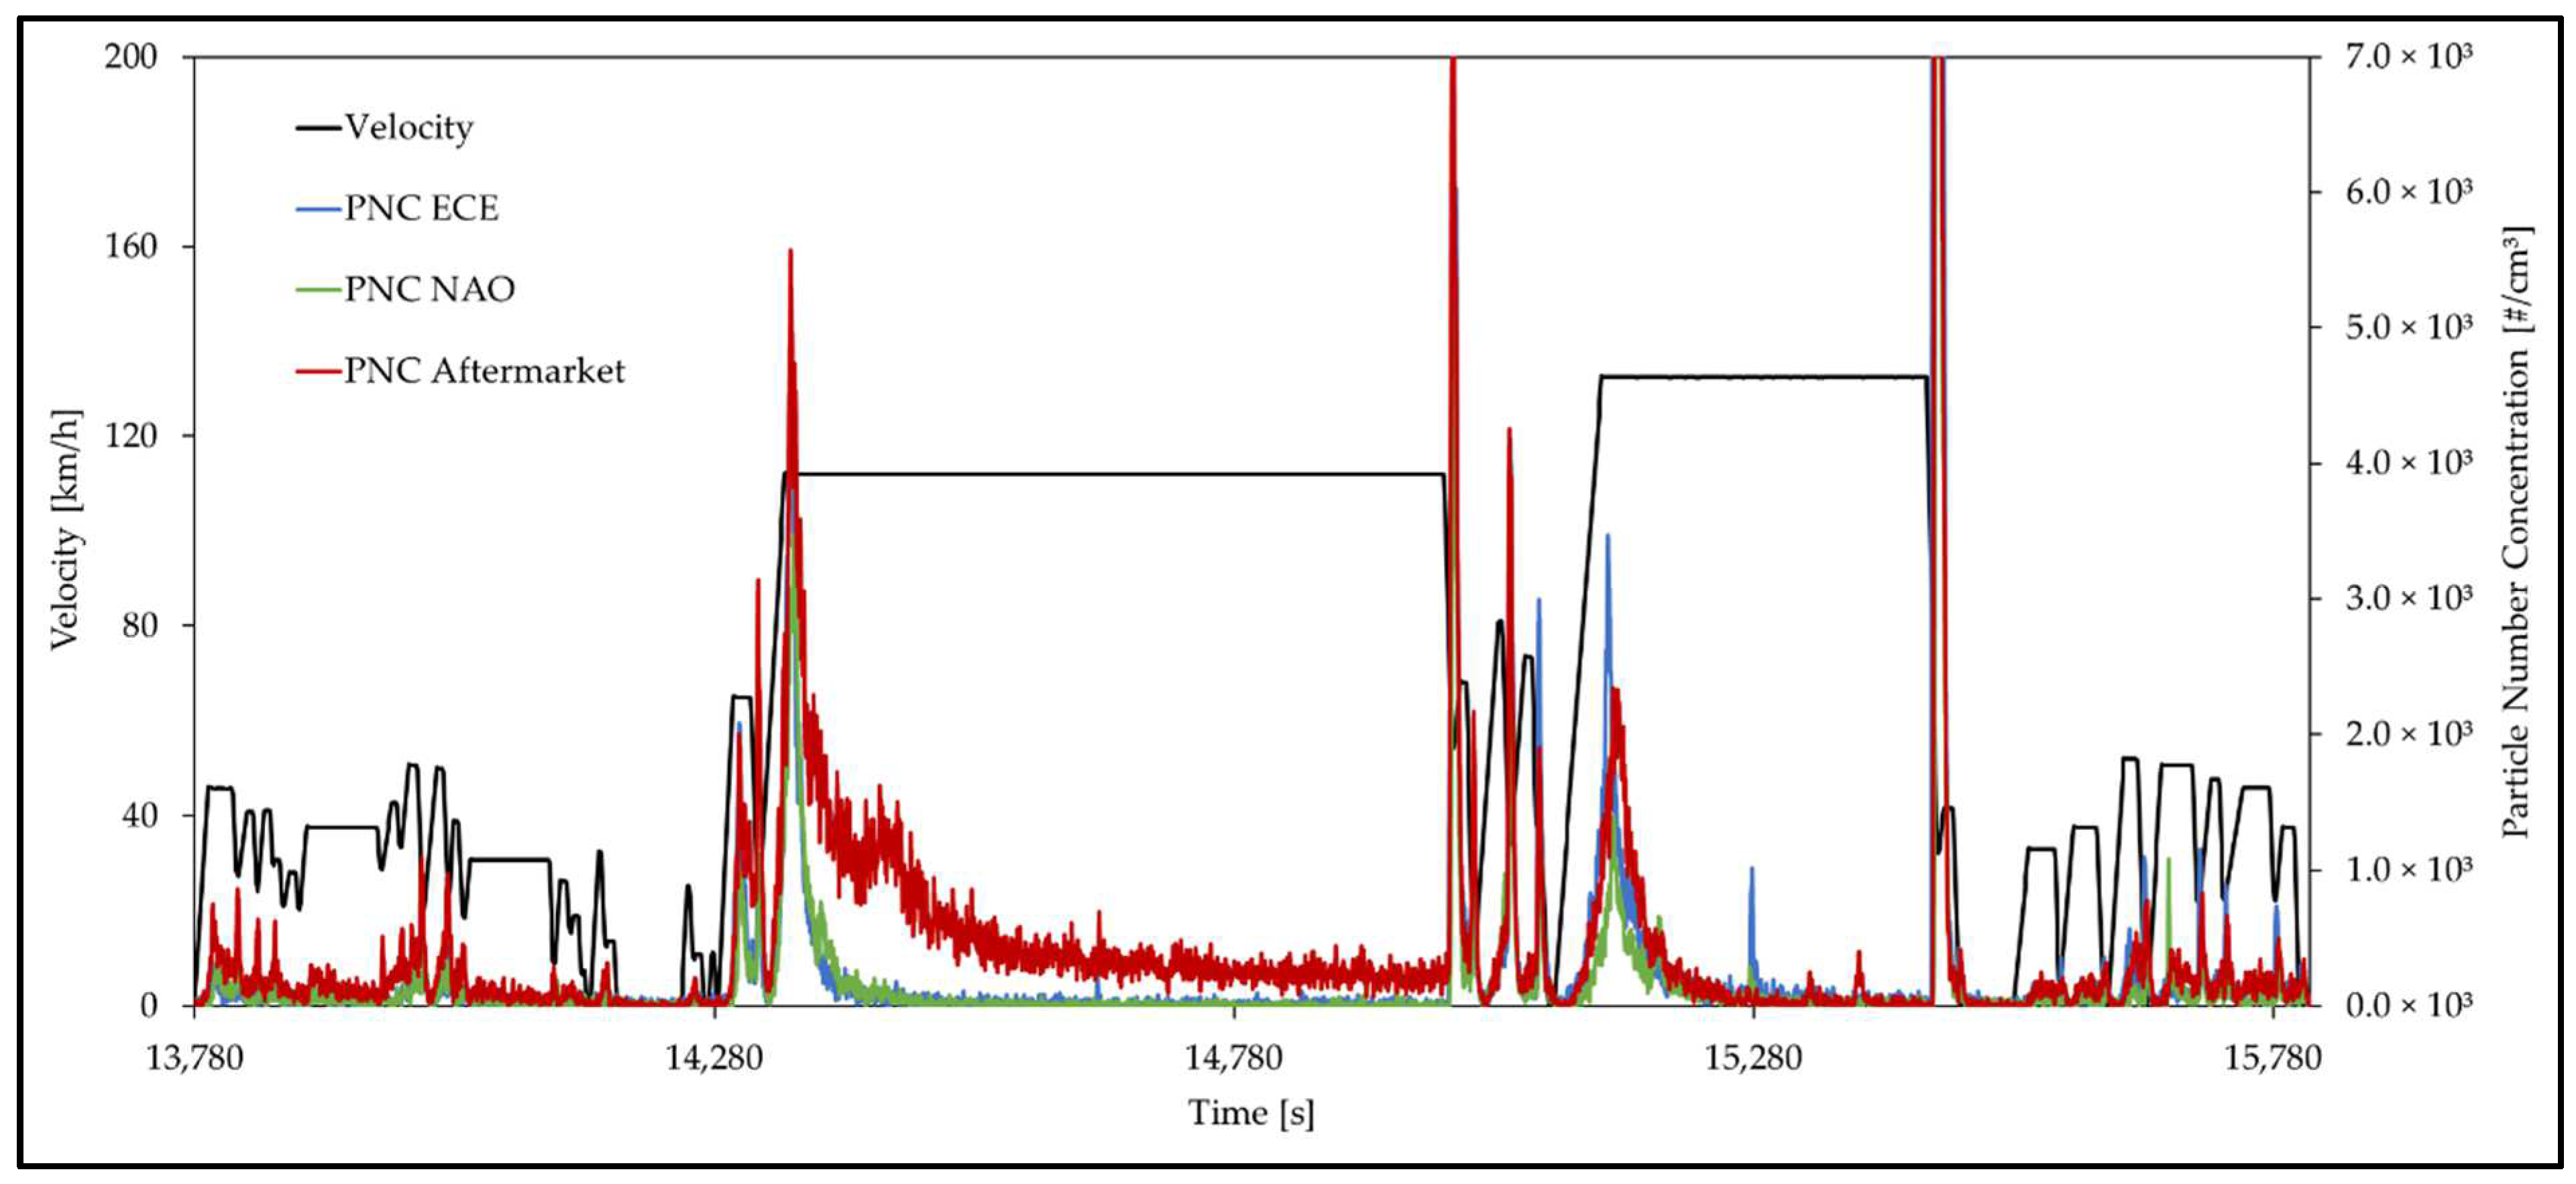
Instead, the aftermarket friction pairing emits permanently increased concentrations of particulate matter over the cycle (see
Figure 8). In particular, acceleration phases and longer periods of constant speed are causal for secondary particle emissions. In this context, it is reasonable to assume that this friction system reacts very sensitively to the slight residual contact between brake pads and disc, which is also present when the brake is not applied. These microcontact areas induce high local peak temperatures at the microscopic level, which cannot be resolved by thermocouples, but are revealed in the increased emission of ultrafine particles [
12,
28,
29]. A direct correlation of the increased particle emissions to residual braking torques could not be clearly proven within these investigations with the dynamometer setup used. An extension of the measurement method to include measurement of the residual contact, as also indicated by the current version of the GTR, is part of ongoing research.
However, it is well known that tribological wear processes differ for different classes of brake pads [
32]. From the comparison of wear in
Figure 5, it can be seen that the use of aftermarket brake pads results in even lower disc wear than with NAO pads on the same disc. As a result, the worn-off material of the brake pads is thus increasingly responsible for the formation of the tribofilm. This is also reflected in the emission of fine dust particles.
Figure 9 shows the averaged particle size distribution of the secondary emissions at the start of the Trip 10 112 km/h cruising. This shows, firstly, the higher absolute emissions of the aftermarket friction pairing in direct comparison, and secondly, a shift in the coarse mode to small particle diameters. Accordingly, the relatively high secondary emissions of the aftermarket friction pairing is quite plausible and shows nicely how important it can be to reset the brake pads when the brakes are not applied.
3.2.2. Brake Shoe Compositions
The drum brake is the alternative to the disc brake, which has been established as a friction system in motor vehicles for decades. The drum brake has lost importance in recent years. It was mainly used in the small car segment on rear axles. The reason for this is, for example, poor cooling and less fading stability compared to a disc brake. In the course of the increasing electrification of motor vehicles and the need for reducing brake wear particle emissions, drum brakes are once again coming to the forefront of brake development. With the aid of regenerative braking by the electric motor and the associated takeover of deceleration, the average power demand on the friction brake is decreasing. Furthermore, this ensures significantly fewer conventional brake applications and results in lower brake pressures. This in turn can have a negative effect on the susceptibility of the friction brake to corrosion. With its closed design, the drum brake can offer an advantage in this respect. The study by Hamatschek et al. [
15] shows that the closed design can also provide additional advantages in terms of emission behaviour compared to a conventional disc brake. This has also been proven in the recent ILS study [
7].
In this study, three different brake shoe compositions and their emission behaviour were analysed. The comparison is based on the C-segment rear axle. In the case of brake shoes, there is no classic differentiation of lining families as with disc brakes. However, pair 1 and 2 resemble low-steel linings in their dark and rugged appearance. Friction pair 3 is reminiscent of an NAO brake pad due to its light, homogeneous, and organic appearance. All three brake shoe mixtures were tested on conventional cast iron brake drums of the same kind.
The emission level of the individual brake shoes is shown in
Table 8. As in the previous pad comparison, the individual variants show clear differences in emission levels. Friction pairing 1 emits the highest level of 1.1 mg/km/Brake. Significantly lower emissions can be achieved with the other two brake shoe variants. The similar looking friction pair 2 emits about 36% less and pair 3 even achieves a reduction of about 73% PM10. Compared to the disc brakes investigated in this study, the drum brakes ratio of PM10 to PM2.5 is significantly lower. It can be deduced that the labyrinth seal between the brake drum and backing plate has a beneficial effect on the emission of PM10 particles. A similar effect was described in [
7]. The particle number behaves equivalently to the particle mass for the investigated brake shoes.
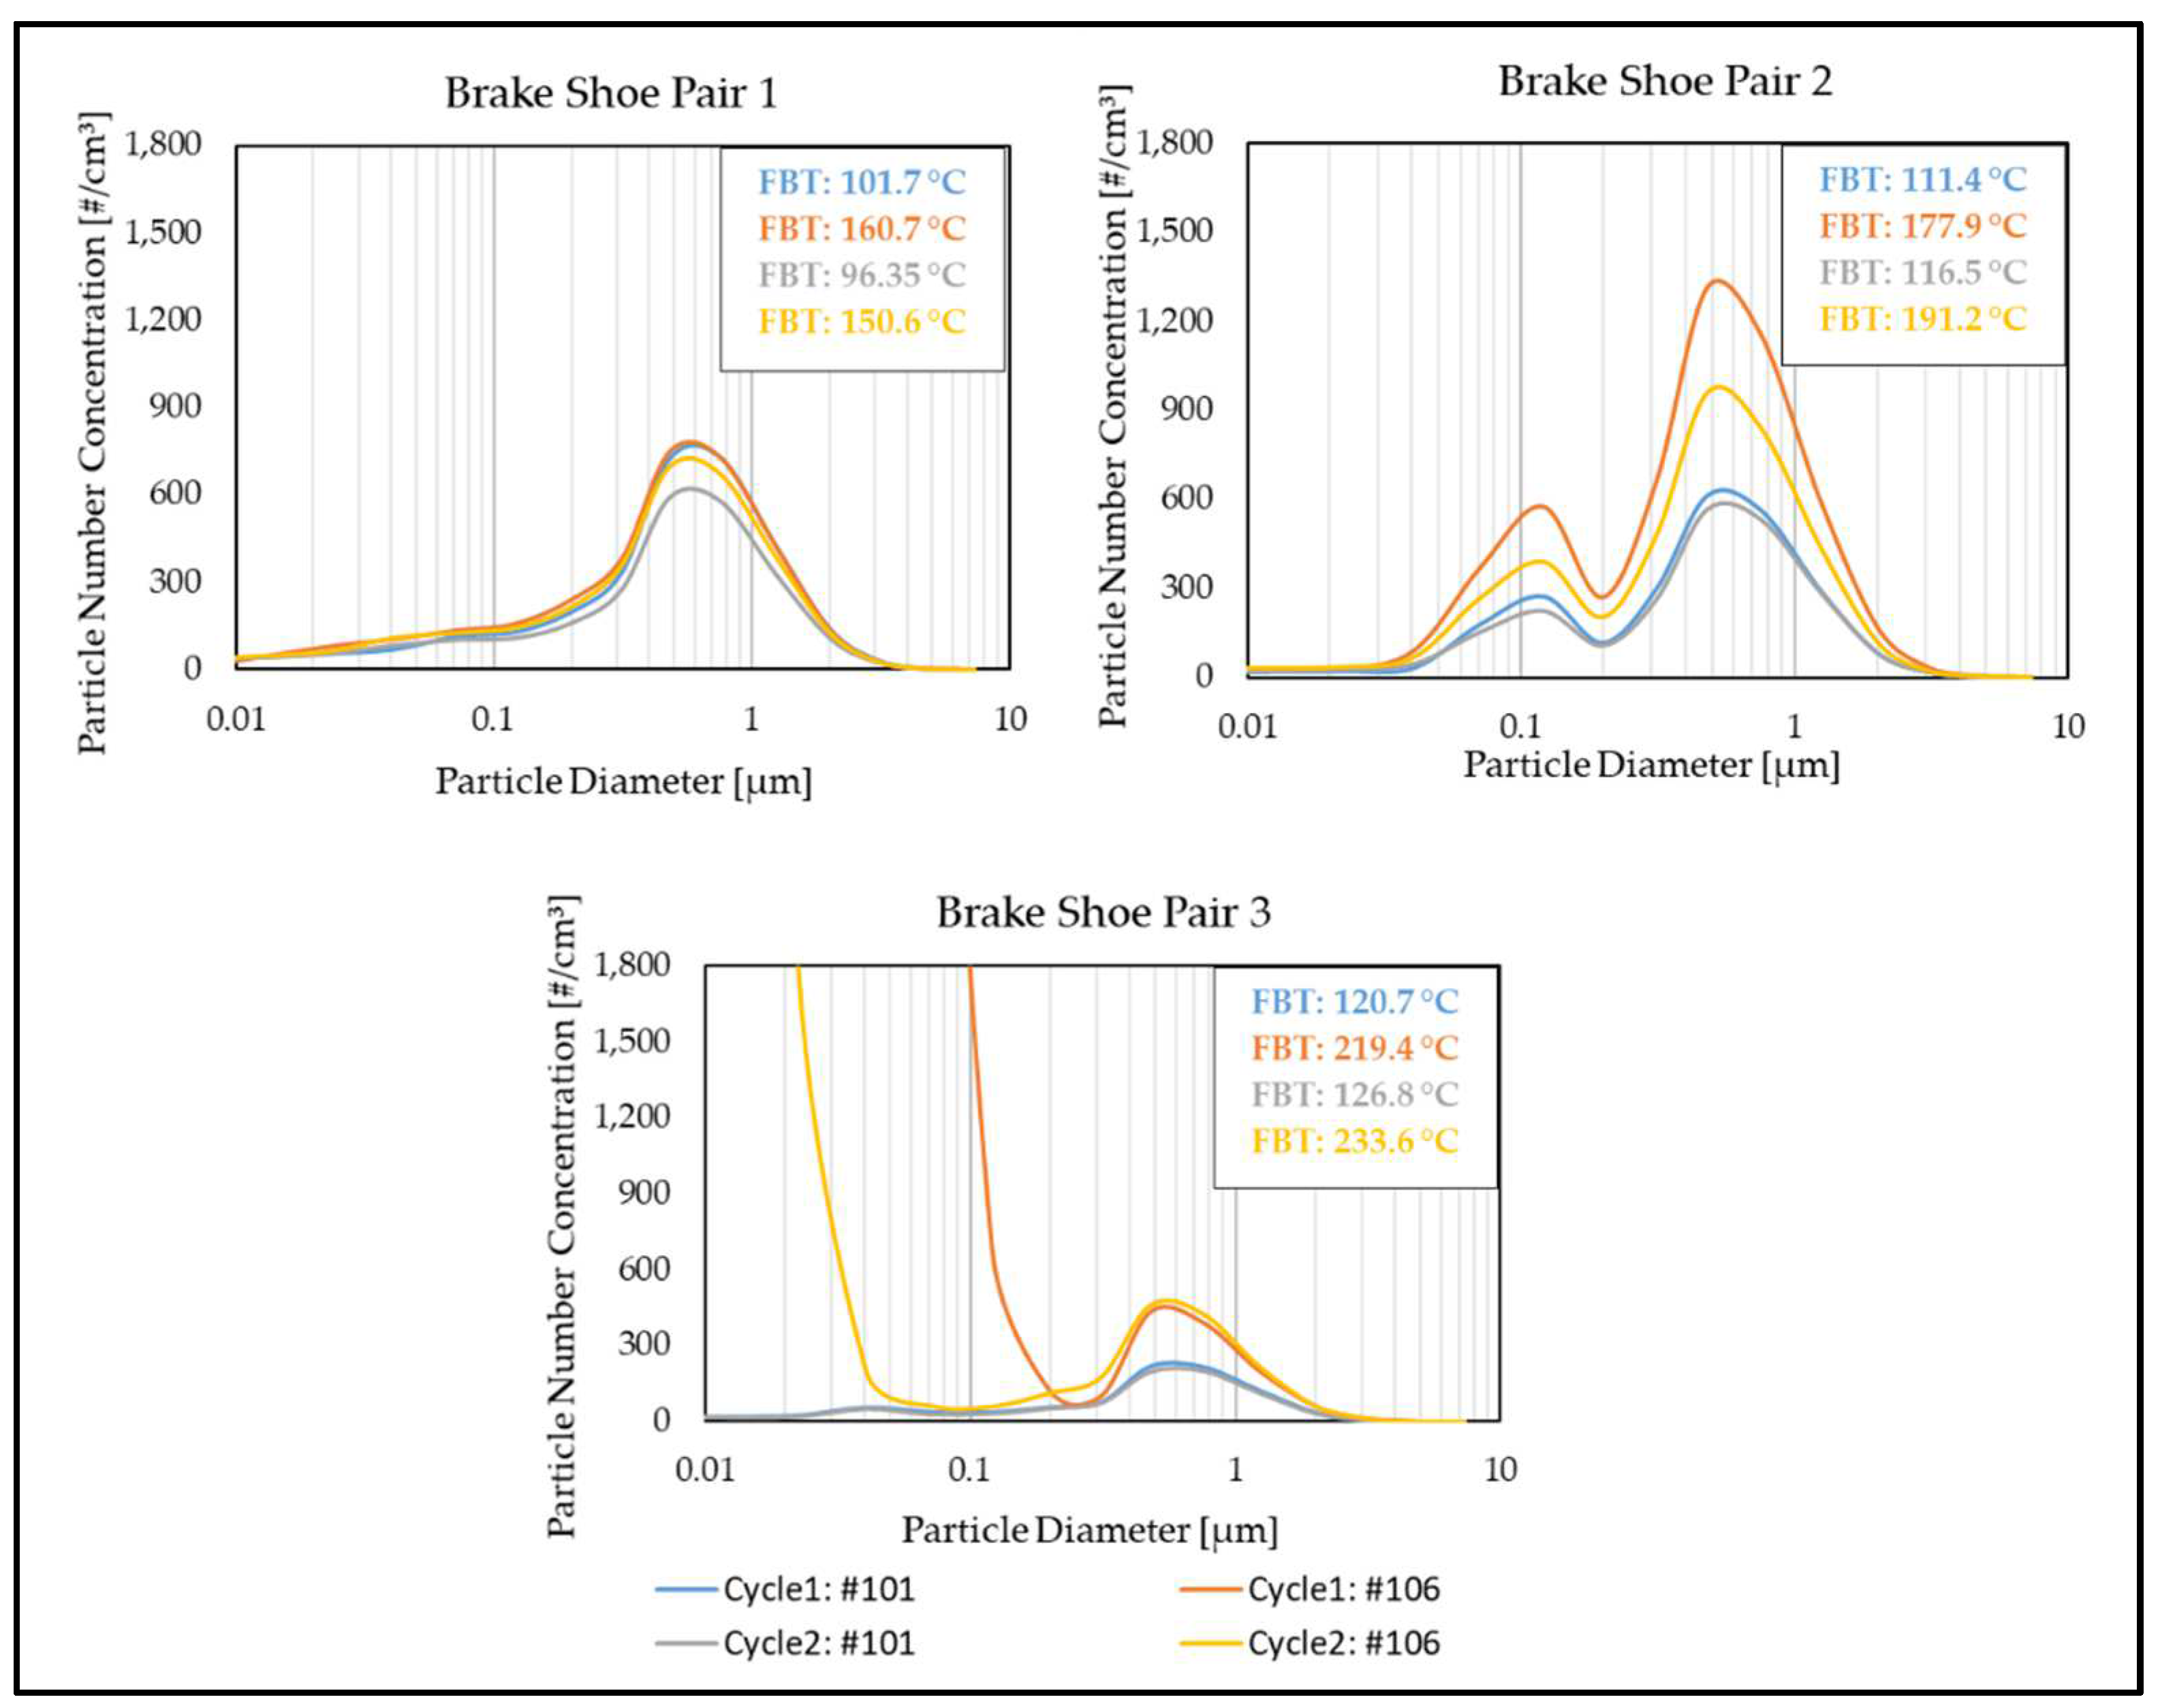
An ELPI was used to study the particle number distribution.
Figure 10 shows the mean particle number concentration curve for the two brake events with the highest initial velocity (#101 and #106) from Trip 10. These are very well suited to identify ultrafine particles in the WLTP Brake Cycle [
33]. The figure shows that pair 1 and pair 2 emit a reproducible size distribution. This is not the case for pair 3. For the two brake events from 132.5 km/h (#106), the emission of small particles is exponentially increased. Comparing the final braking temperatures of the different friction pairs with each other, it is noticeable that there is a clear increase from pair 1 to pair 3. Friction pairing 3 has up to 70 °C higher final braking temperatures (FBT). Thus, the friction pairing probably tends to nanoscale particles due to higher braking temperatures. With this insight, the result from
Table 8 should be viewed critically. Owing to the thermal preconditioning of the particle counter, volatile particles are eliminated and are not visible in the PN2.5 value.
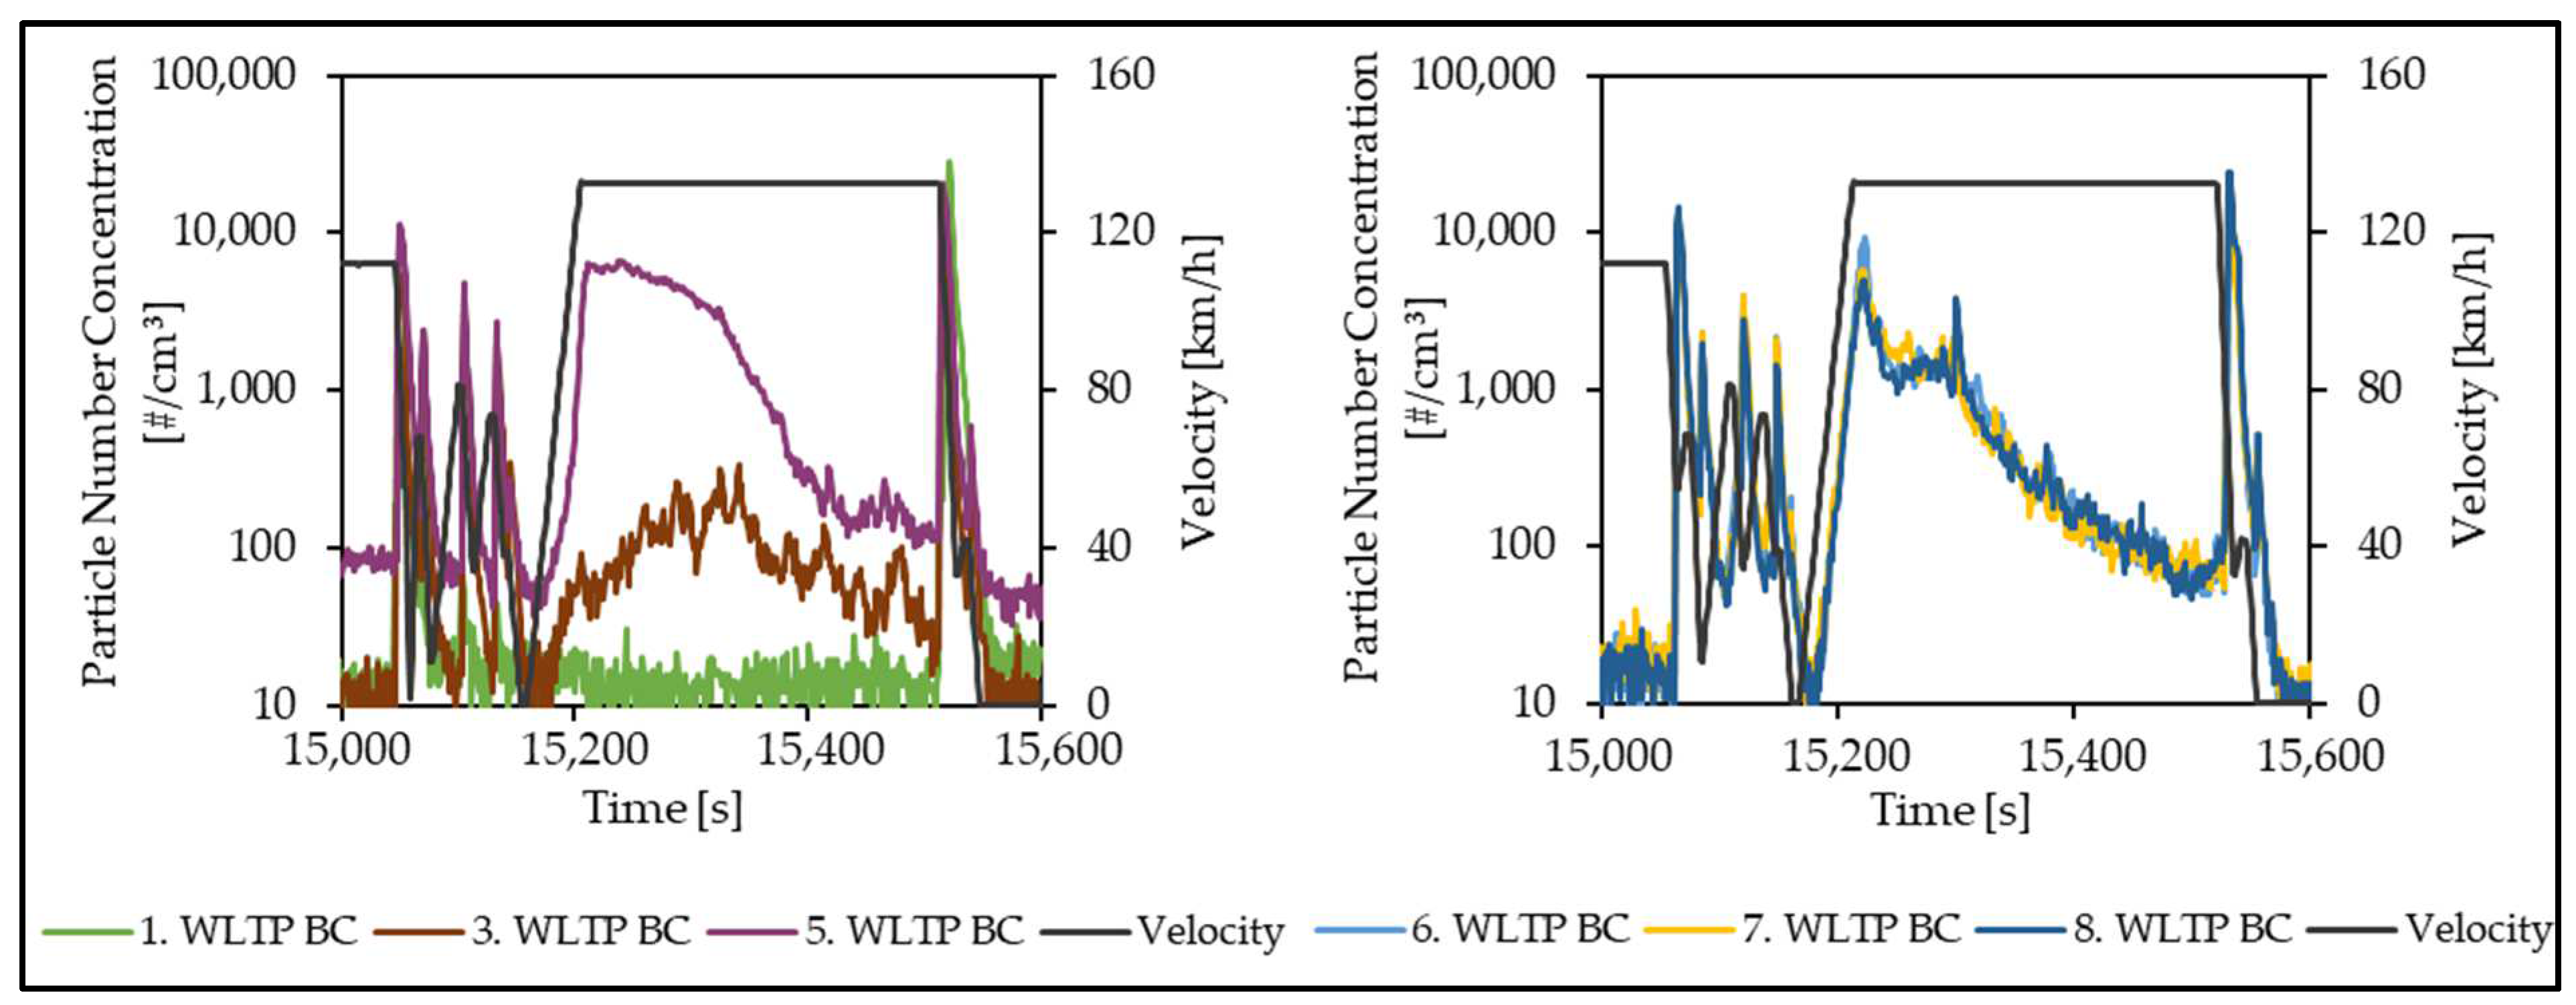
During the emission measurements of the brake drums, it was also noticed that the secondary particle emissions increase with each continuing WLTP Brake Cycle iteration until they stagnate at a constant level. The progression over the bedding and main emissions test is shown in
Figure 11.
Because of their radial adjustment, drum brakes have strong retraction elements in the form of springs. In the first WTLP Brake Cycle, no increase in the particle number concentration can be detected over the constant speed of 132.5 km/h. This might be a sign of very low residual braking torque. With the consecutive WLTP Brake Cycles, an increase in the particle number concentration can be detected up to the fifth cycle. Owing to the bedding of the friction pairing, local contacts are formed, which result in progressive wear. These wear products initially accumulate primarily in the closed drum brake system. Because of the continuous wear process, the capacity to store wear products within the drum becomes saturated and a constant exchange in emissions occurs during the phases of constant velocity. In the process, wear products are ejected by centrifugal forces between the labyrinth passage.
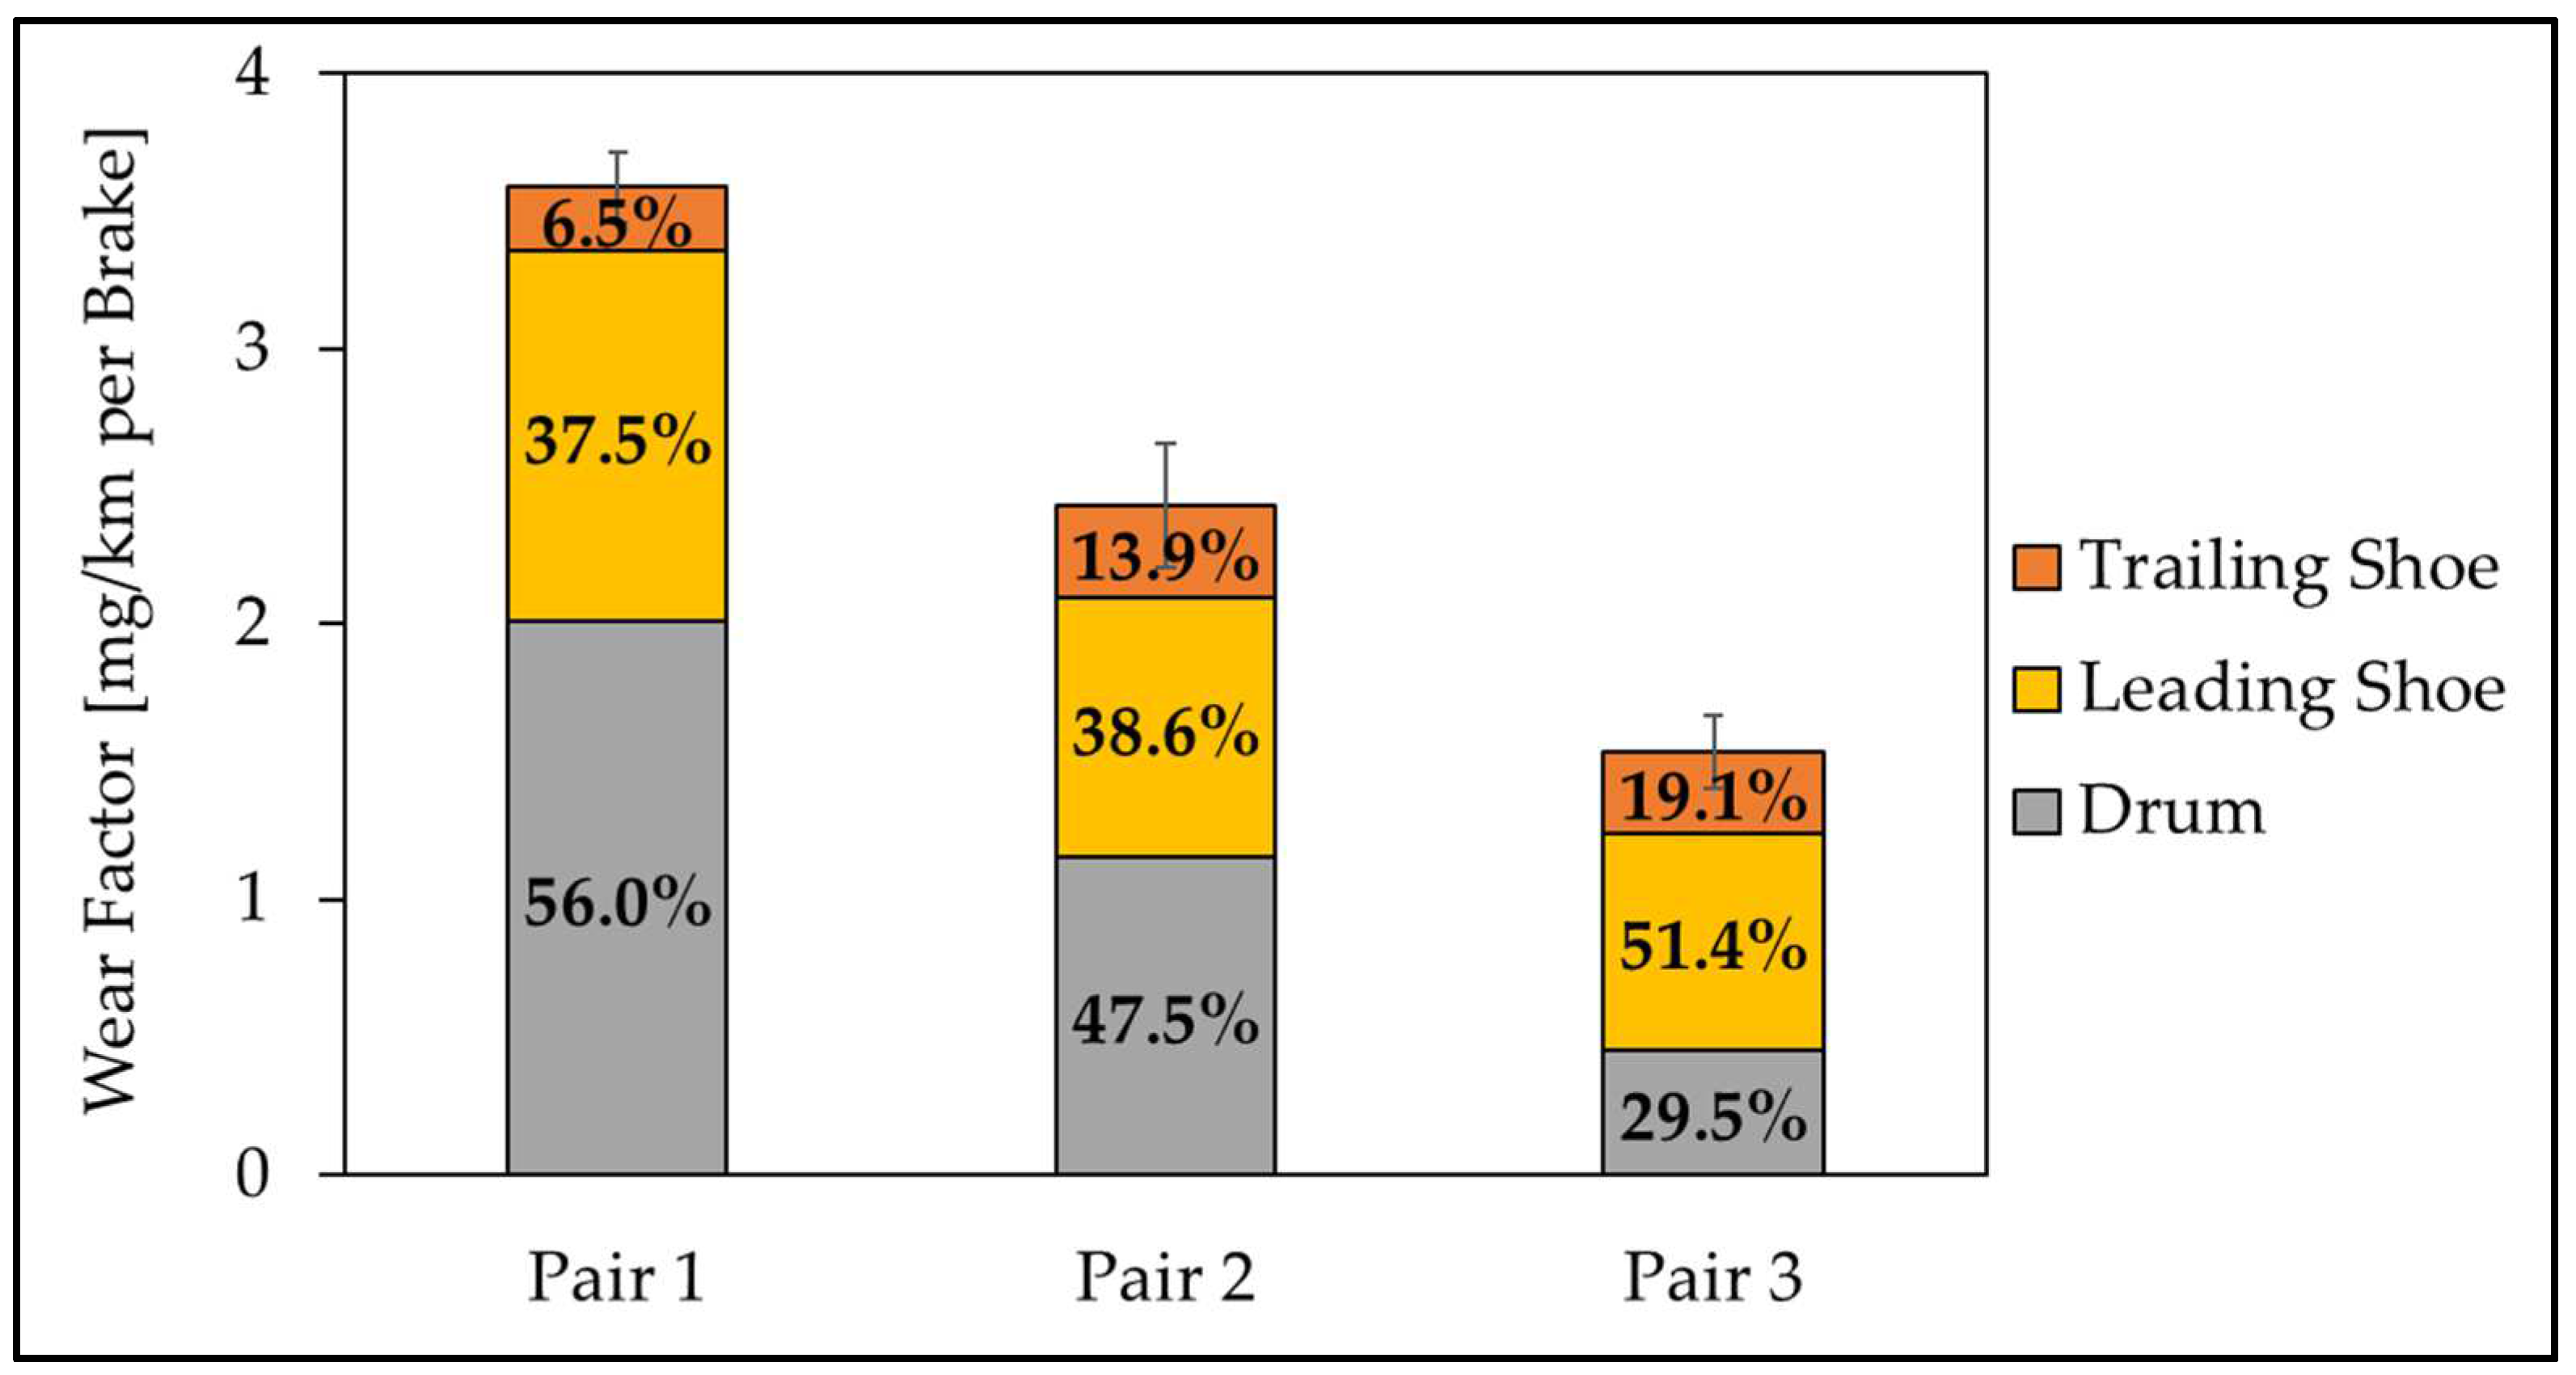
Figure 12 shows the wear of the different friction pairs. The values correlate with the emissions table (
Table 8). For pairing 1 with the highest emission level, also the largest weight loss could be measured. Friction pairing 2 shows reductions in wear of about 33% compared to the friction pairing 1. Similarly, the friction pairing 3 shows reductions in wear of about 57% compared to the friction pairing 1. In addition, the relative wear shares of the brake components show that pairing 1 has the highest abrasiveness towards the brake drum.
It is also evident that the distribution in wear among the individual brake components is relatively uneven. Compared to the brake linings of a disc brake, the drum brake’s shoes wear differs between both shoes. This finding is based on the simplex design of the drum brake, with the primary shoe contributing a significantly larger share of the braking force than the secondary shoe.
3.3. Influence of Alternative Brake Disc Materials
The reason for choosing the J-segment vehicle as a representative of the luxury SUV segment for this measurement campaign is primarily the carbide-coated brake disc, which has been commercially available for some time. This tungsten carbide-coated disc has a significantly higher surface hardness compared with conventional grey cast iron brake discs [
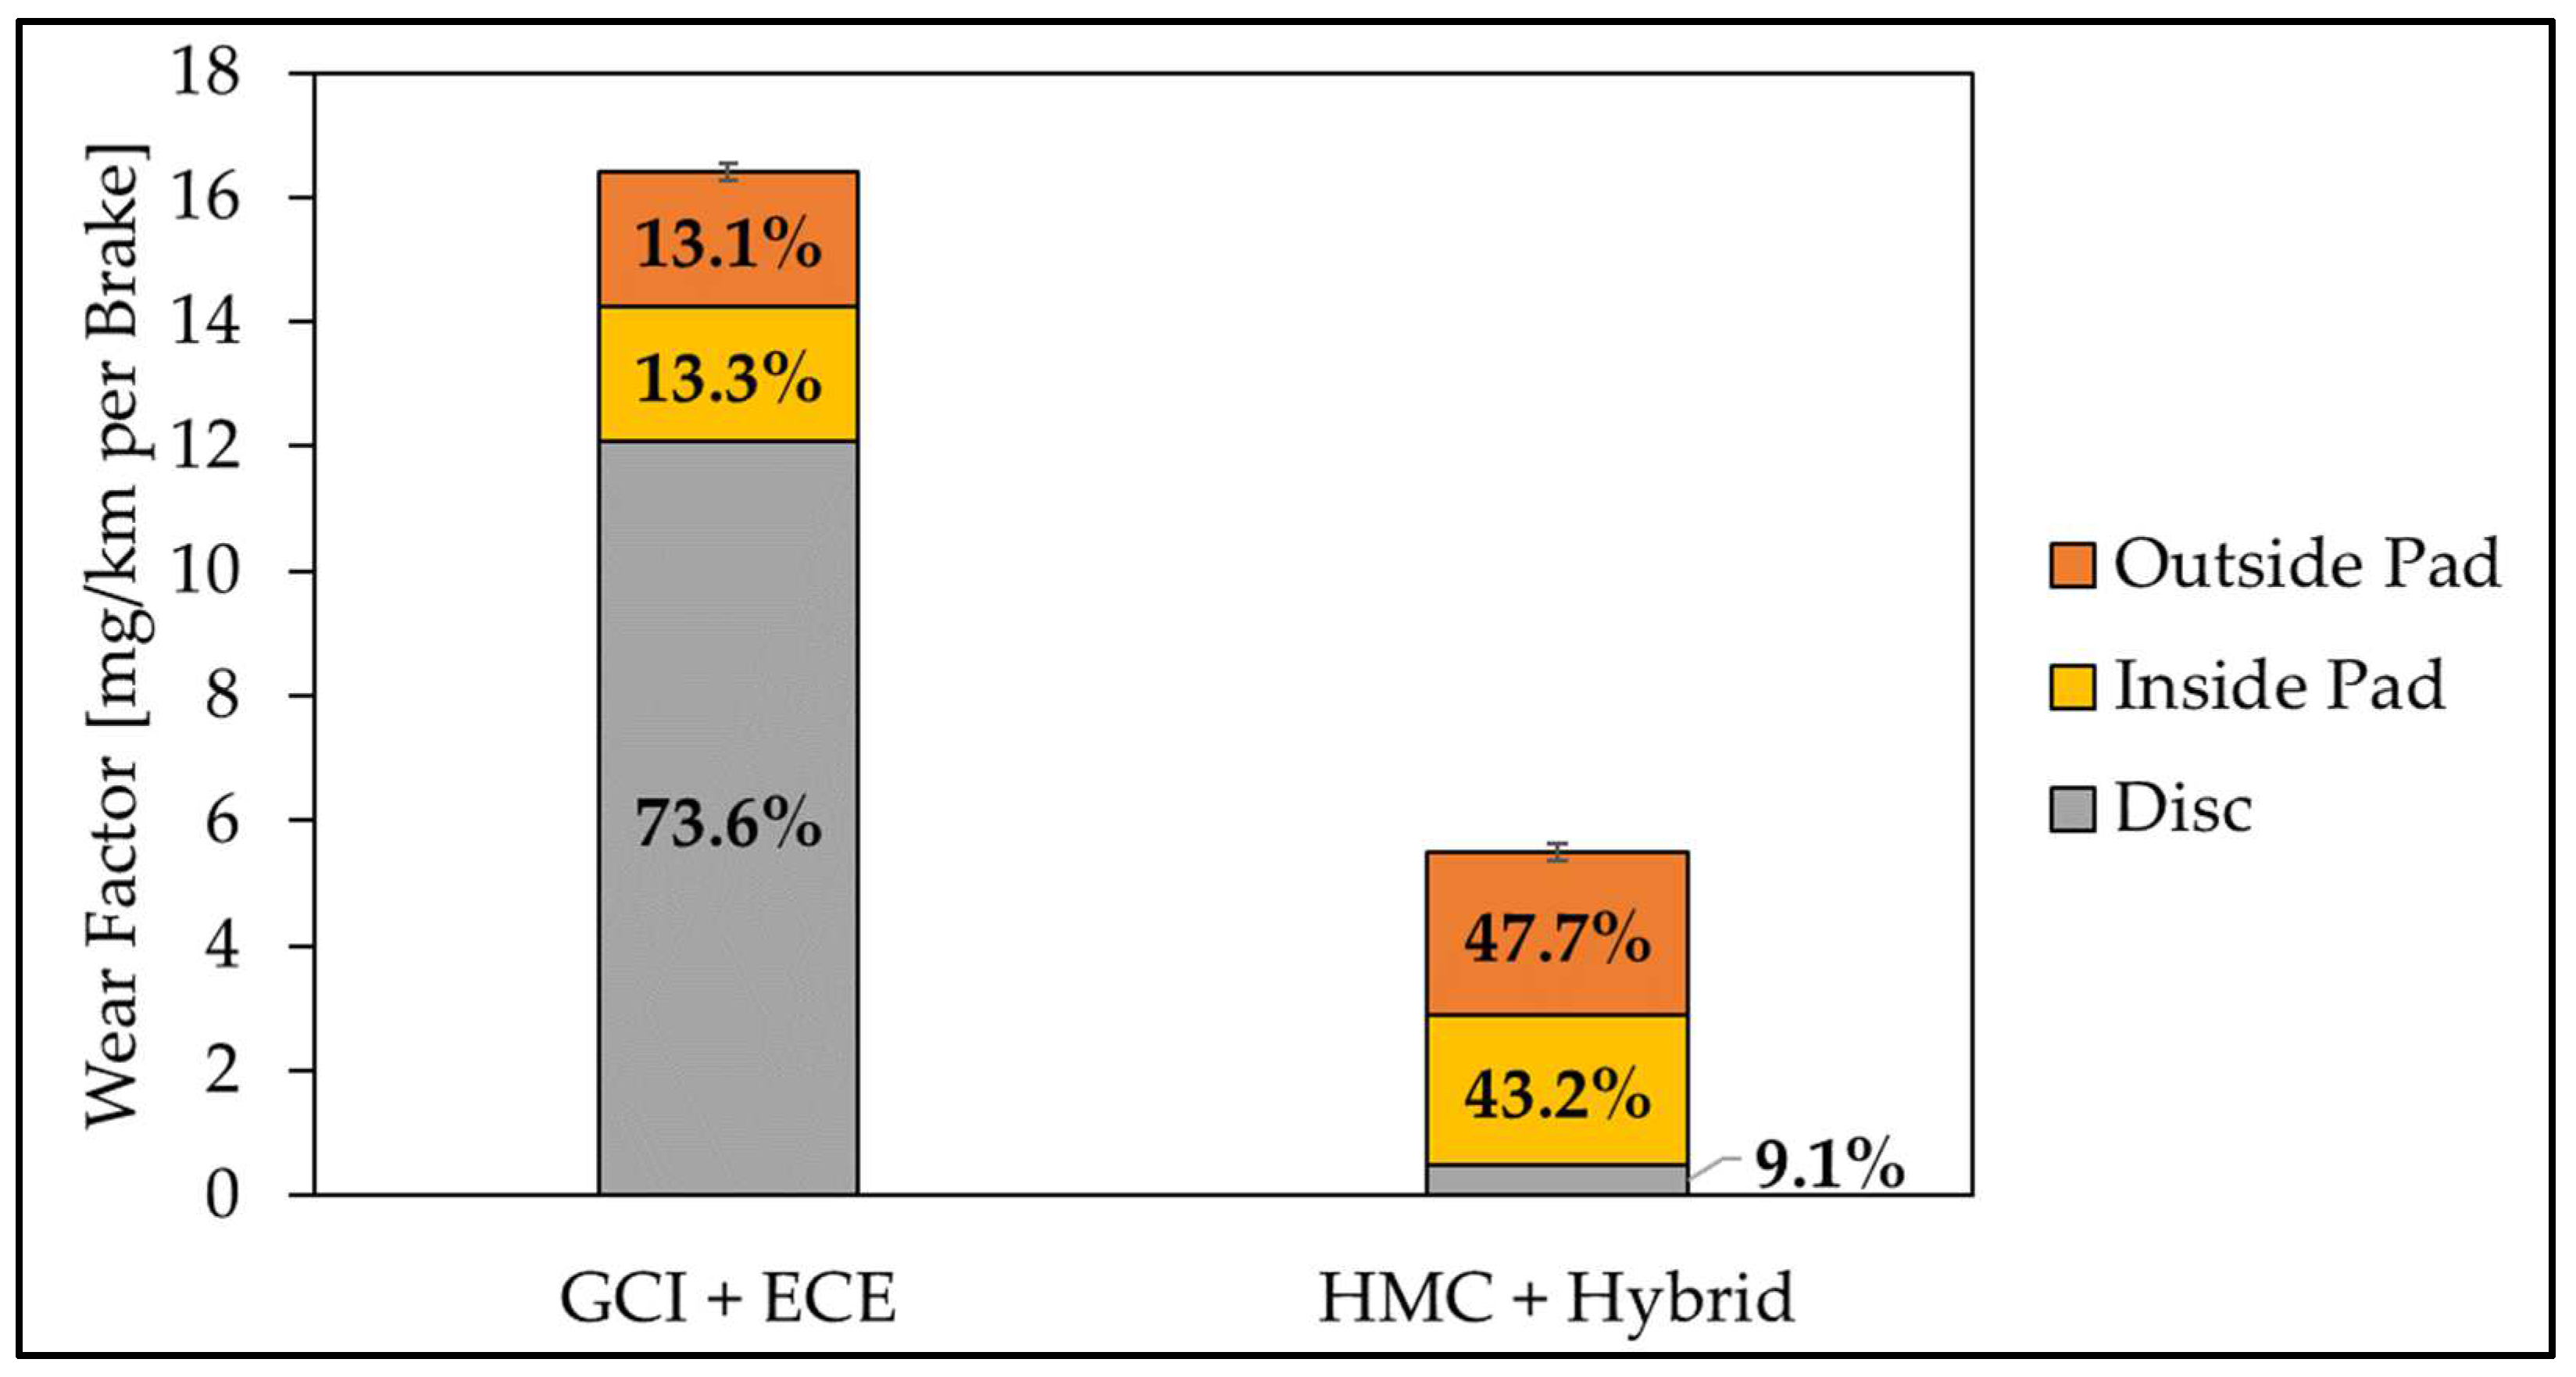
34]. This coated disc results in advanced wear resistance of the brake disc, which was demonstrated in these tests (see
Figure 13).
While the wear factor of the GCI friction pairing is 12.1 mg/km per brake, only 0.5 mg/km per brake was measured for the HMC disc. This corresponds to a reduction in the wear factor of approximately 95%. In this specific case, the surface hardening by application of tungsten carbide mixed crystals leads to a wear resistance that is higher by a factor of 24.
It is important to note at this point that the use of surface-coated brake discs changes the tribological processes inside the friction interface [
10]. For this reason, it is necessary to develop brake pads specially adapted to the coating [
35]. The use of conventional ECE linings is usually not expedient. Therefore, the HMC disc comes with specially designed brake pads, which have been used here accordingly.
In direct comparison with the GCI benchmark, the absolute wear of the HMC pairing’s adapted linings is about 15% higher. Because of the high wear resistance of the coated disc, the relative wear within the friction pairing is to the detriment of the brake pads. As a result of the wear reduction by the use of carbide-coated brake discs, the associated emission level drops significantly.
Table 9 illustrates a PN saving of over 60% in relation to the GCI reference. For PM, the savings are even more than 70% for both PM2.5 and PM10.
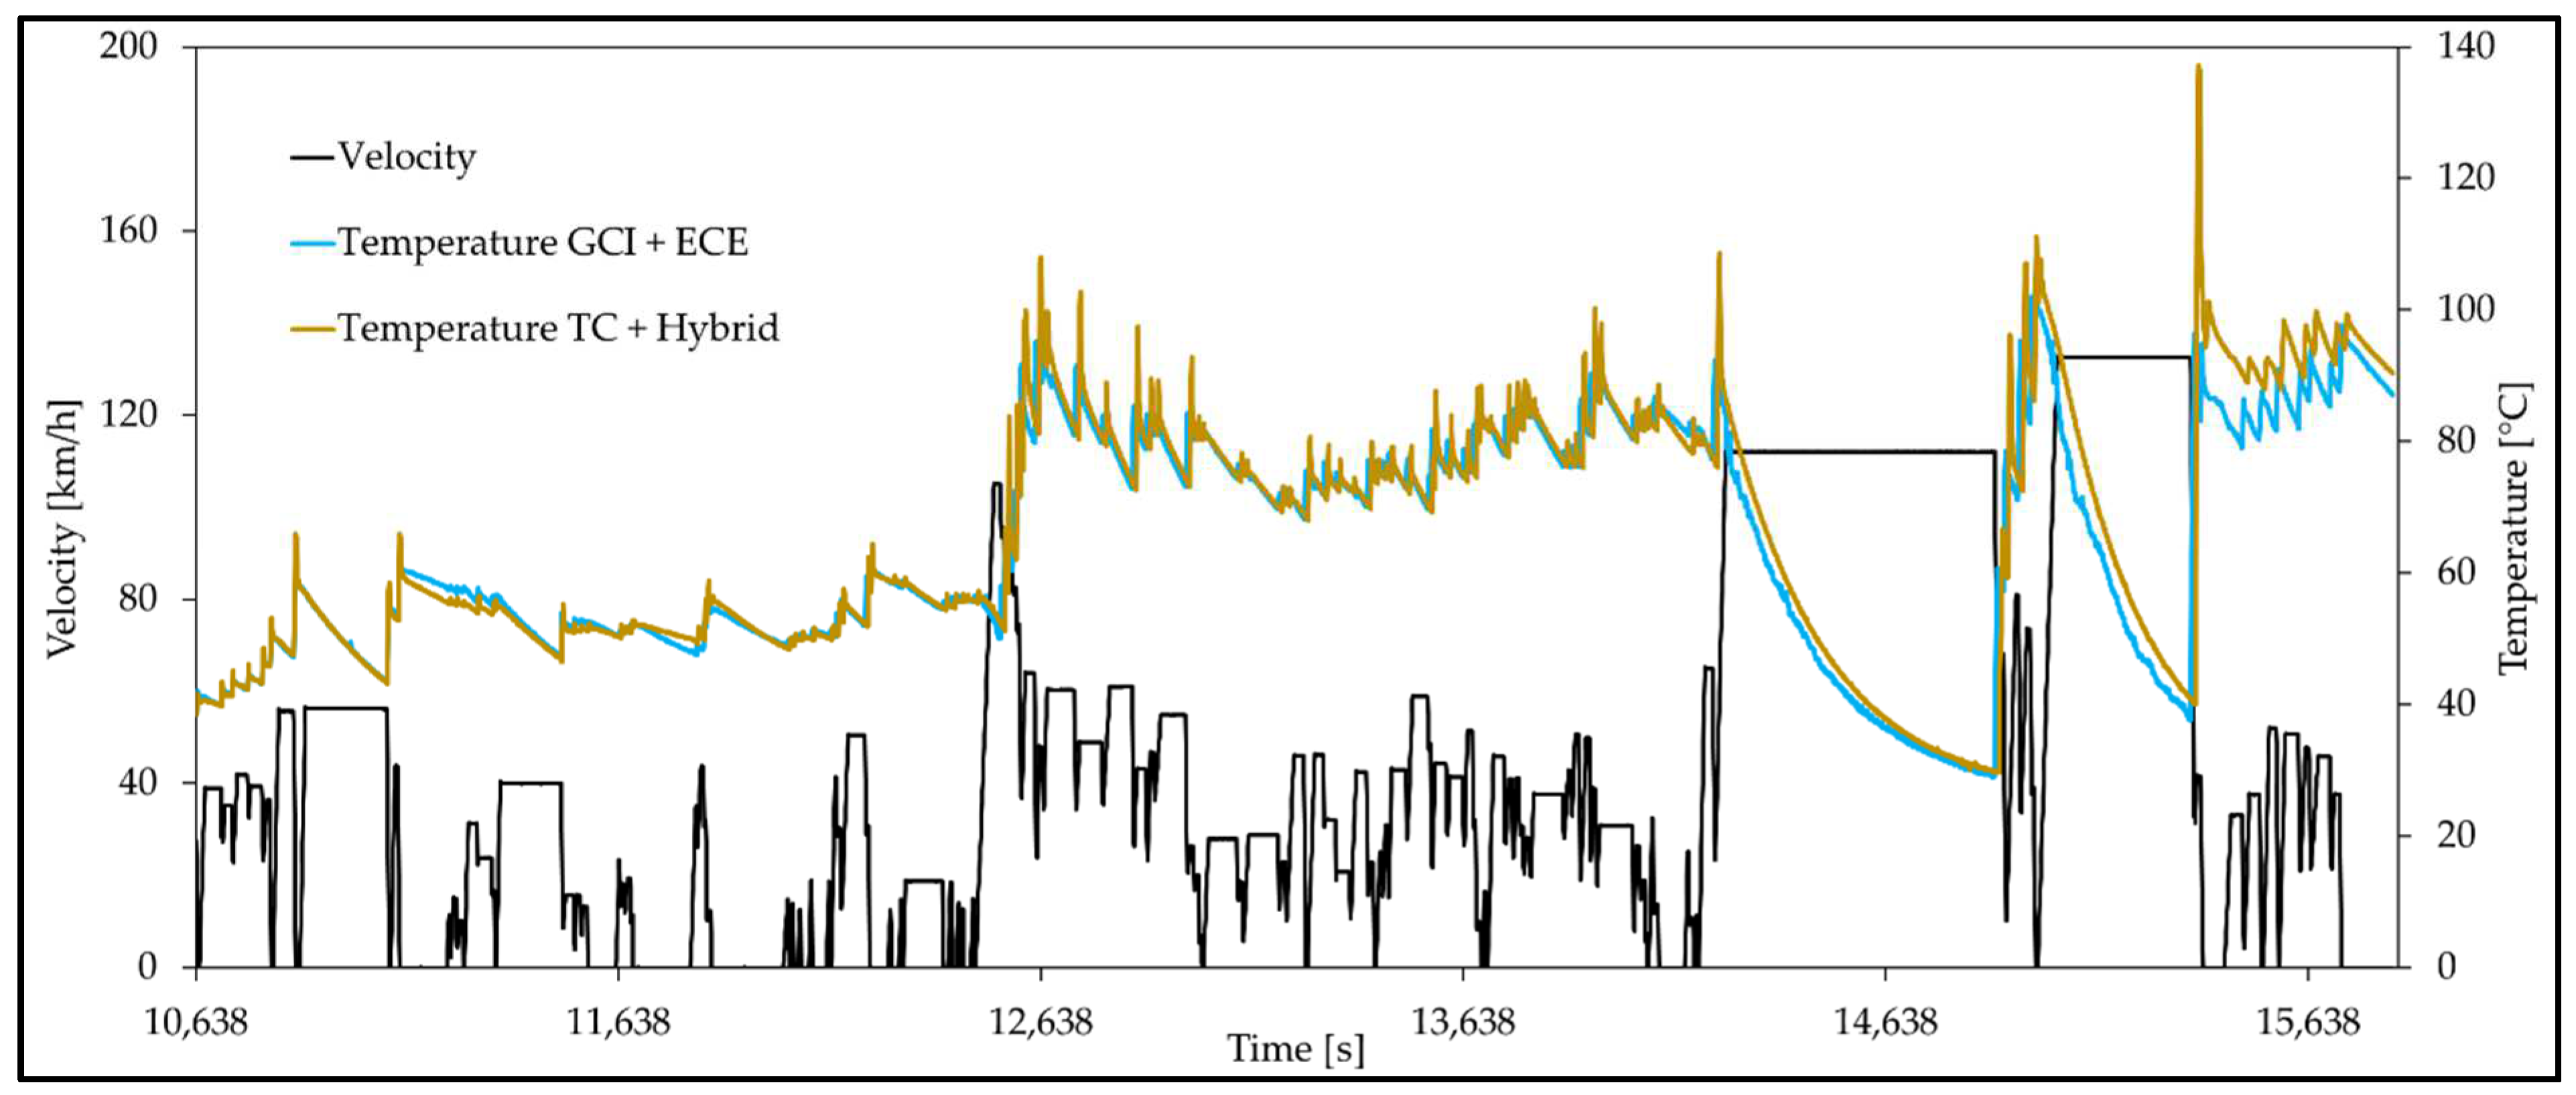
An initial look at the temperature behaviour of the two different friction systems reveals that they do not differ significantly in qualitative terms over the WLTP Brake Cycle Trip 10 (cf.,
Figure 14). On closer inspection, the HMC friction pairing shows visibly higher temperature peaks due to the energy input during the brake events.
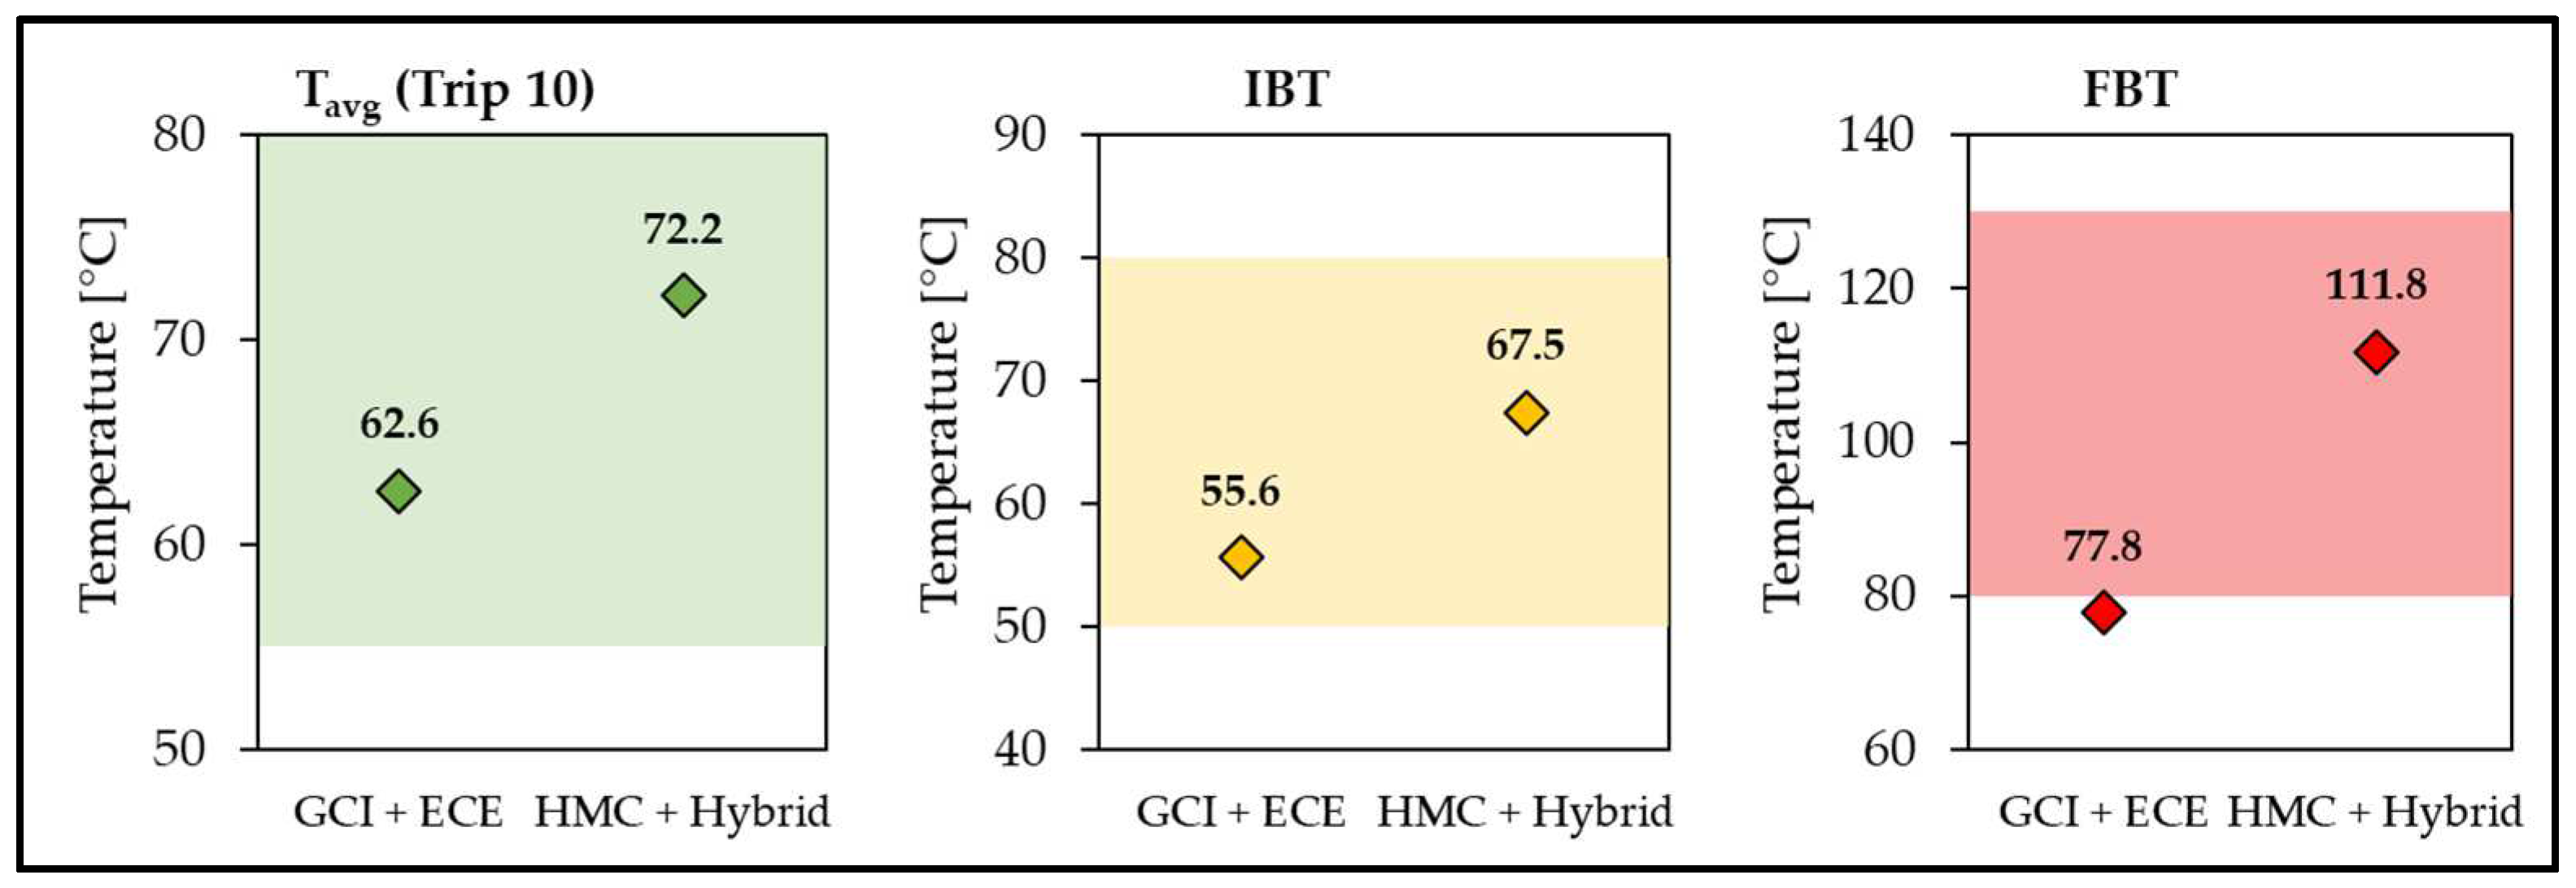
This is also reflected in the GTR temperature corridors (see
Figure 15). Owing to the peak temperatures, the friction pairing with the coated brake disc yields higher mean values than the GCI counterpart for all three evaluation variables (average section temperature, IBT, FBT). With regard to the FBT in particular, the difficulty of determining suitable cooling volume flows for the comparison of friction systems with different disc coatings becomes apparent. To ensure the best possible comparability of the emission results, both friction pairings were measured with the same volume flow, 810 m
3/h. A slight undercutting of the FBT corridor by the GCI pairing was considered acceptable. At the same time, this leads to the remark of a potentially slight underestimation of the emission level of the mentioned GCI pairing, whereby reduction potentials by carbide-coated brake discs would be additionally enhanced.
Furthermore, temperature peaks, such as those present with this HMC friction system, always harbour the risk of additional particle emissions from the nanoscale ultrafine dust spectrum [
28,
29,
30]. Accordingly, the importance of thermal compatibility must not be underestimated in the development of braking systems with coated brake discs. In addition, there is the phenomenon of the formation of local hotspots on the disc surface, which occur especially after heavy tribological load.
The favourable thermal properties of GCI brake discs have proven themselves over decades and have shaped the current standard of disc brakes [
36]. Owing to the surface coating with stainless steel and carbide reinforcement phase, there are different heat transfer and propagation coefficients within the brake disc and the heat storage capacity also differs from the GCI standard depending on the material [
35,
37].
3.4. Regenerative Braking
The emission behaviour of the full-friction-operated ECE friction pairing (ICV) is compared to two recuperatively operated ECE friction pairings (PHEV and BEV) of the same type. For this purpose, the disc brake of the front axle of the C-segment vehicle used for the brake pad comparison was used. To establish a similar starting point for the emission tests, bedding of the PHEV and BEV friction pairings was performed using conventional load (this approach is similar to the current version of the GTR). This ensures that all friction pairs have a comparable run-in condition (approx. 960 km WLTP Brake Cycle—conventional) for the actual emission measurement. At the same time, however, it follows that a comparison of the wear masses is not meaningful, since a clear traceability to the recuperative load is not guaranteed.
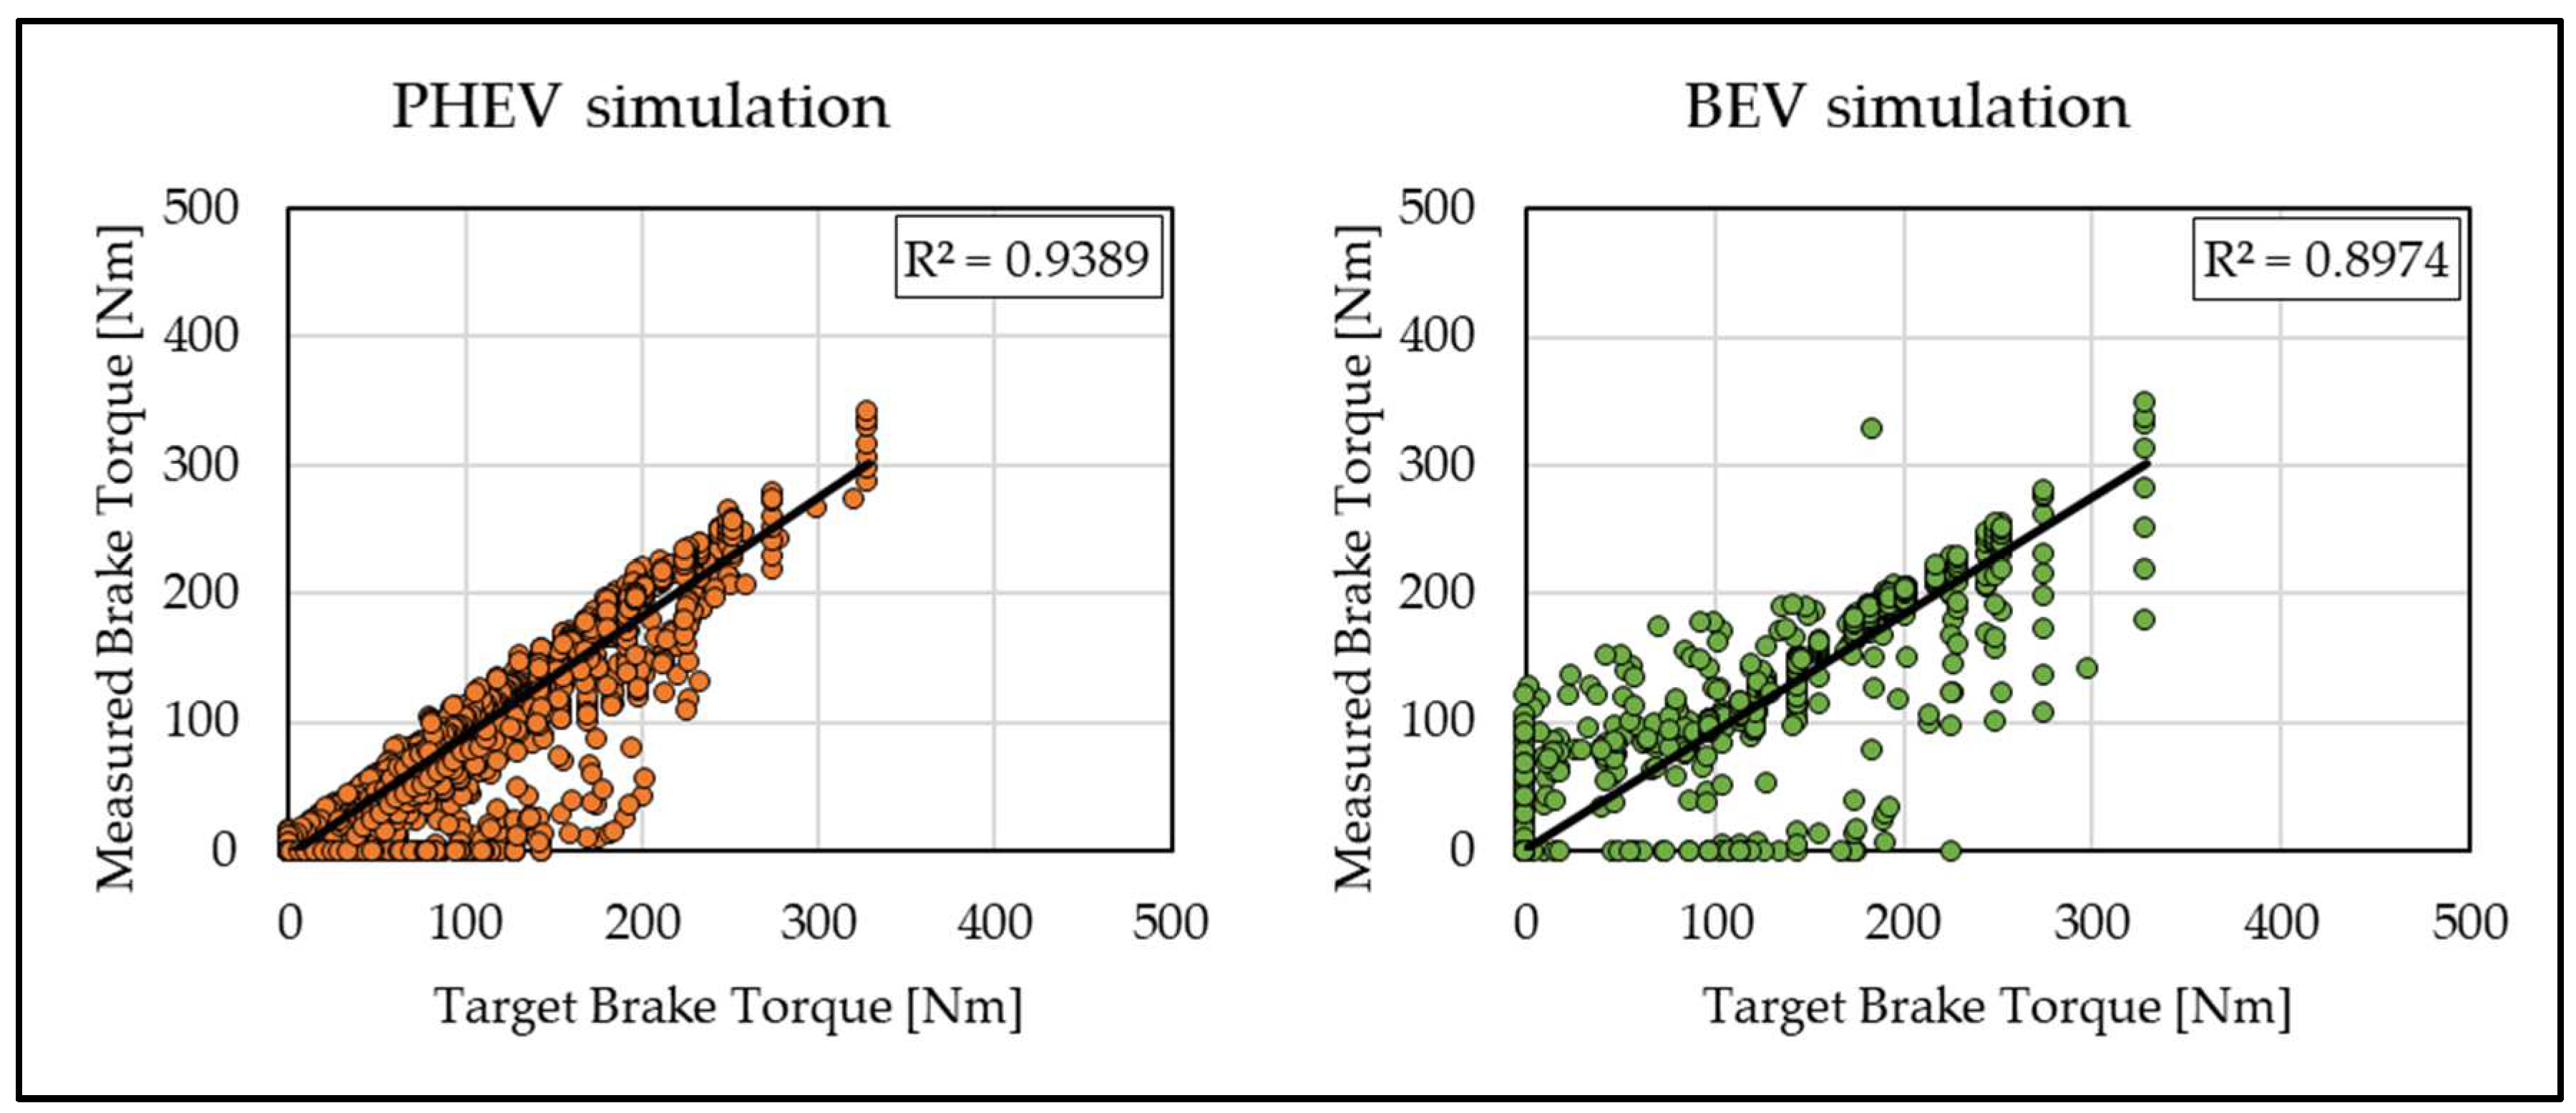
The results are preceded by a linearity check of the brake-blending torque as a quality criterion for the recuperation simulated on the brake dynamometer. In
Figure 16, the measured torque is plotted against the target value. After extensive programming, a determination coefficient of 93.9% was achieved for the PHEV. For the friction brake of the BEV, which is used even less frequently, a determination coefficient of 89.7% has been achieved. The torque conversions, which in some cases deviate slightly from the idealised target, can be traced back to the dynamic test bench control. When the brake pressure is built up and released there are minor time delays compared to the specification due to the hardware.
Furthermore, the temperature corridors defined for the conventional WLTP Brake Cycle (T
avg, IBT, FBT) are not applicable as comparative variables for recuperative braking. Depending on the level of electrification, the brake events used for evaluation are primarily taken over by the electric motor, which means that there is no temperature input into the friction brake. In addition, in the case of the BEV, there is only a minimal increase in the temperature of the brake disc during the cycle. The upper part of
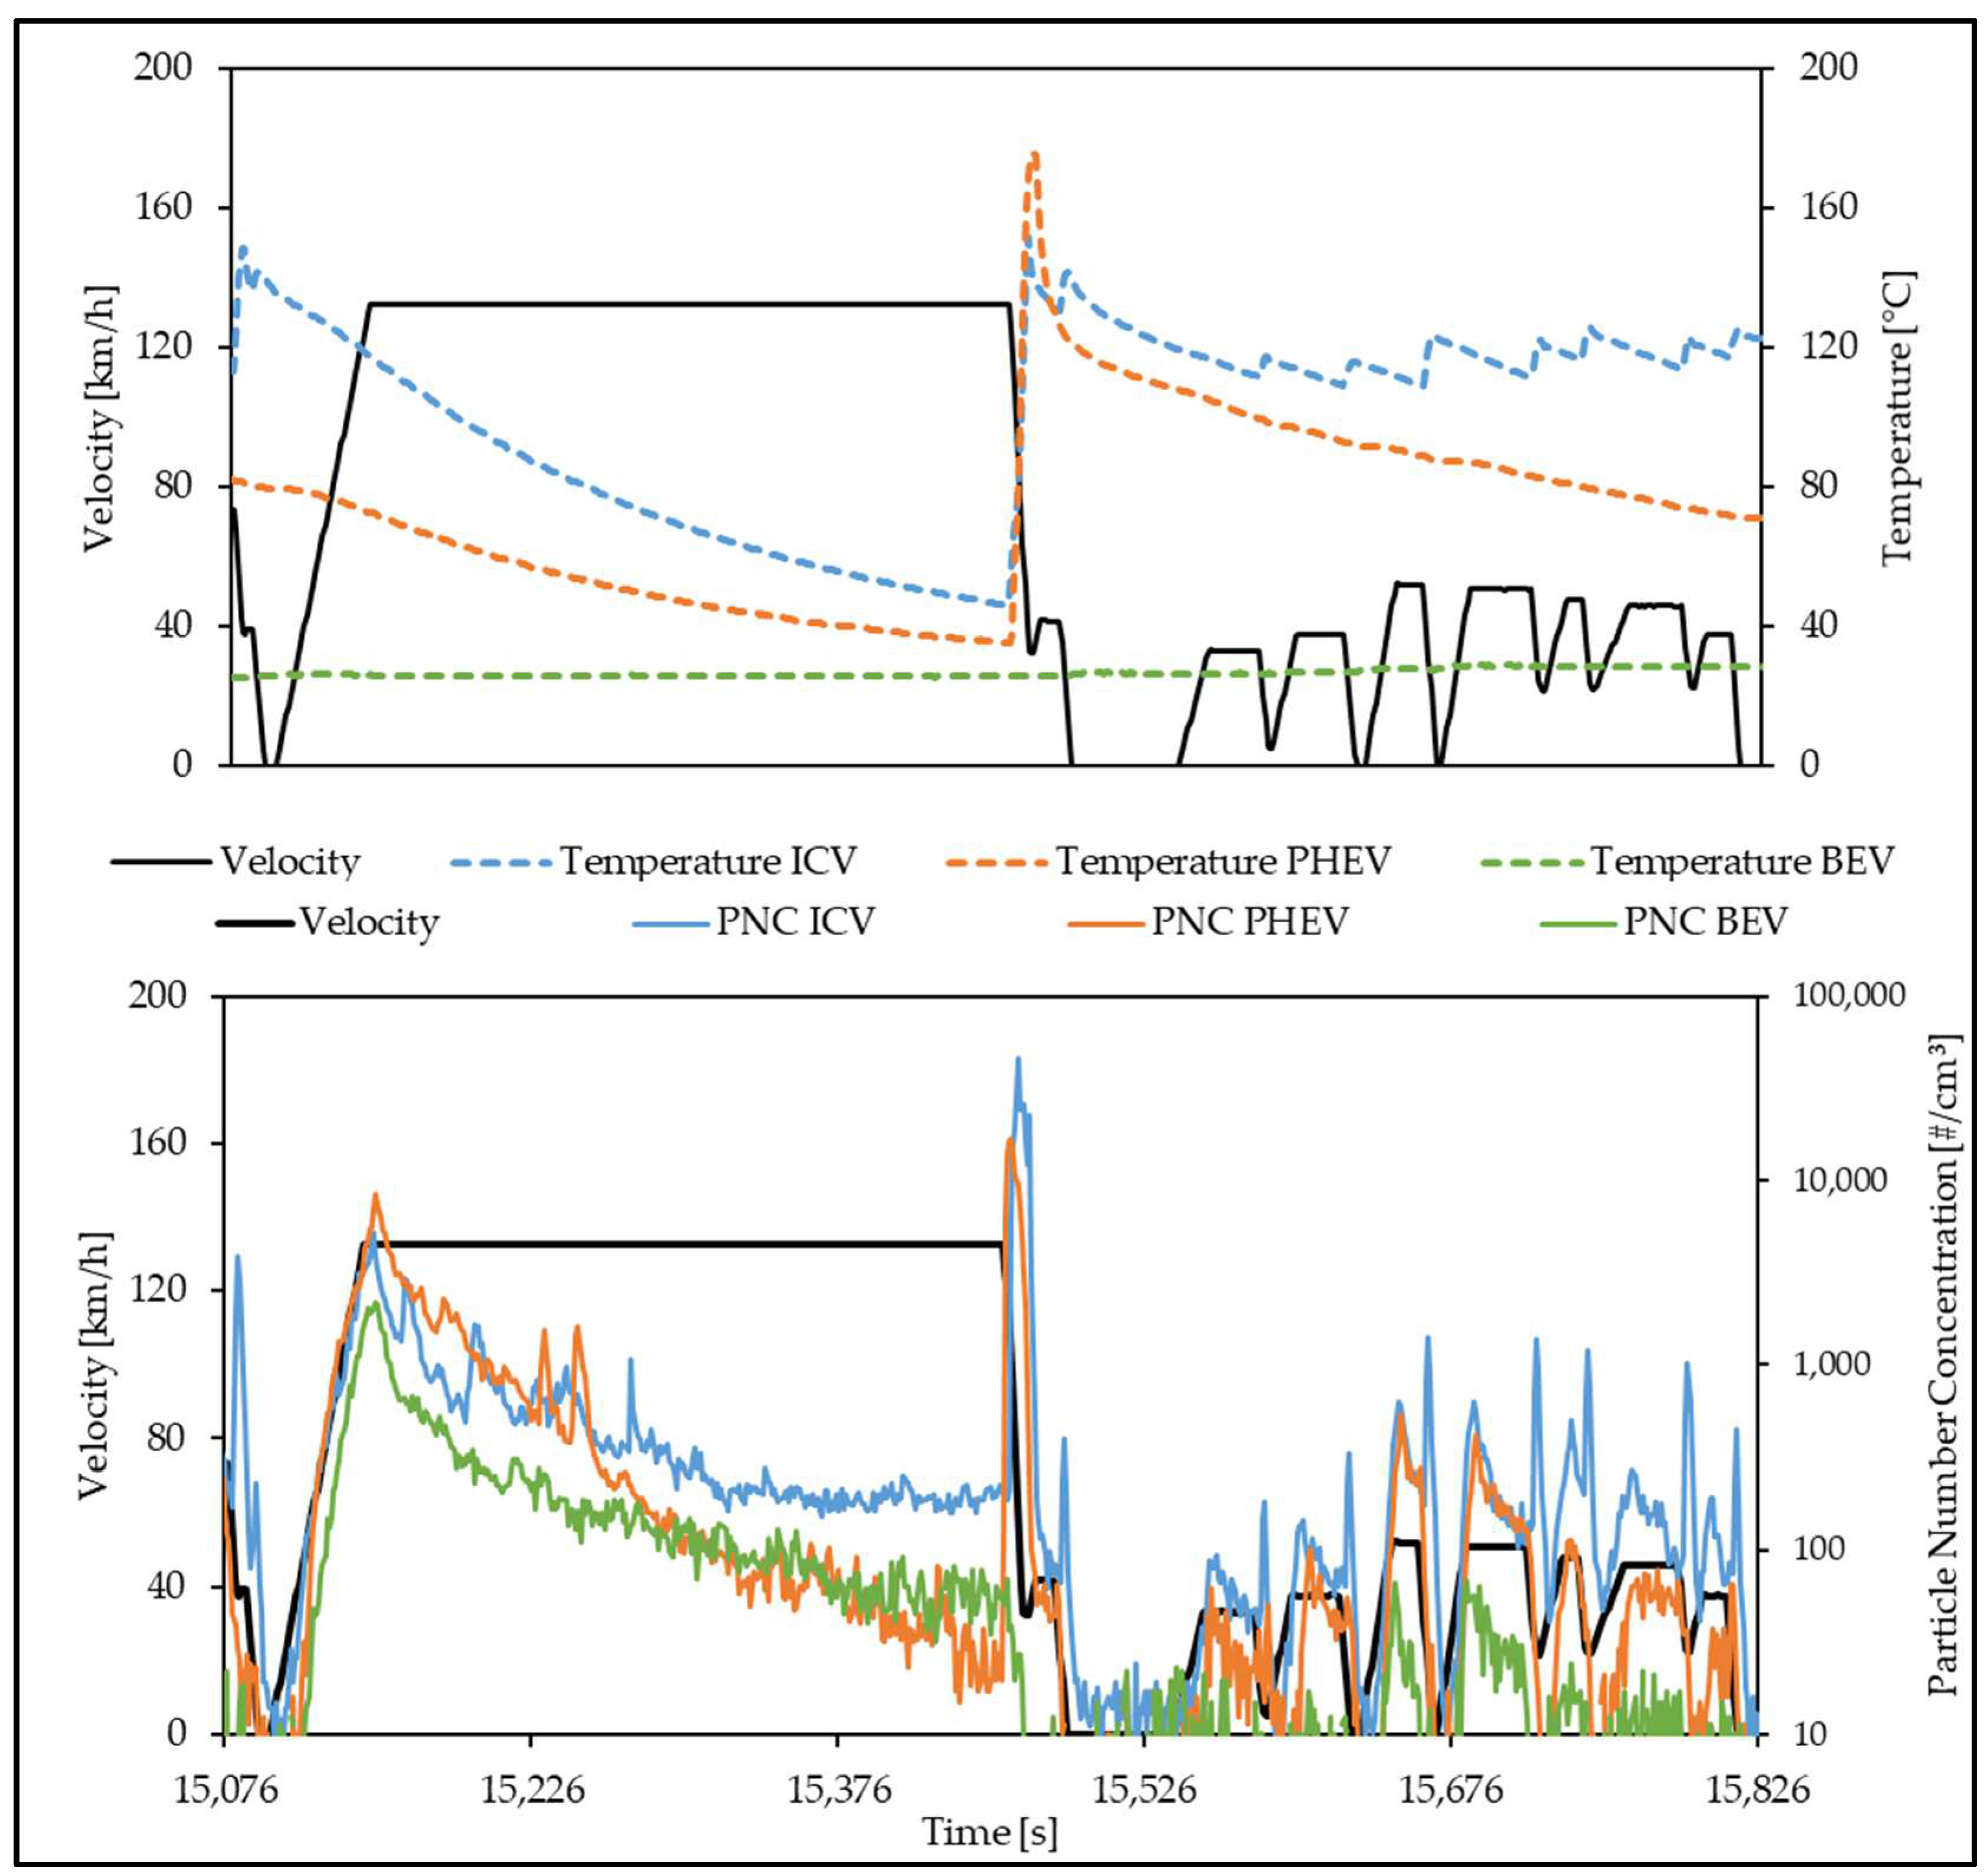
Figure 17 shows the temperature evolution of the brake disc of all three variants at the end of Trip 10 of the WLTP Brake Cycle. While the conventionally operated brake (ICV) shows the typical alternation of brake-induced temperature rise and cooling, the PHEV already shows a significantly lower base temperature level due to the less frequent use of the friction brake.
A significant temperature increase for the PHEV only occurs with high deceleration demand, where the friction brake is activated exclusively. Despite the lower IBT, higher FBT than for conventional operation can be measured sometimes due to uneven contact behaviour in connection with the local measurement position of the thermocouple. For the BEV, which only uses the friction brake for brake blending when stopping during the WLTP Brake Cycle, hardly any heating of the brake disc can be detected.
Figure 17 depicts the same section of the cycle in terms of particle number concentration highlighting another characteristic of the BEV mode. In contrast to the conventional mode (ICV), which realises all deceleration via the friction brake, the friction brake of the BEV is only used at speeds of less than 10 km/h. On the other hand, the PHEV replica uses the friction brake at high deceleration requirements and for a slightly wider brake-blending range. The rotational energy present at this moment is not sufficient for immediate emission of particles. Rather, they are emitted during the subsequent accelerations or generally only at higher speeds. Accordingly, the peaks of the particle number concentration from the full-electric vehicle are not observed during the brake events, but during acceleration phases. This characteristic emission behaviour must be taken into account if secondary approaches to emission reduction are to be pursued (e.g., particulate filters).
The final comparison of the emission factors between conventional (ICV) and recuperative modes can be found in
Table 10. This shows that the recuperation of a currently commercially available PHEV can achieve a reduction in particulate matter (PM10) of approximately 62% under WLTP Brake Cycle conditions. The saving of approx. 40% in the number of particles is actually lower, but nevertheless demonstrates a significant approach to brake dust reduction. In this study, the savings in PM10 emissions through the recuperation of the BEV are up to 79%. The reduction in the number of particles is on the same level, at approximately 82%. Although the size distribution of the emitted particles according to the PM10/PM2.5 ratio factor shifts towards smaller particles with increasing recuperation performance, this does not appear to have any significant influence on the particle count. In particular, the BEV friction pairing, which remains at ambient temperature, provides no basis for the formation of high concentrations of volatile ultrafine dust.
According to the current version of the GTR, the PM10 emission factors of electrified vehicles are calculated from the emission factor of conventional operation (ICV) using so-called friction braking share coefficients [
5]. For plug-in hybrids (PHEVs), a coefficient of 0.3 and for full-electric vehicles 0.15 is specified. A comparison of the PHEV and BEV emission factors calculated from the ICV emission factor with the PM10 emission factors actually measured in this study can be found in
Table 11.
In this case, both electrification variants have slightly higher measured emission factors than the calculation approach produces. Nevertheless, the chosen coefficients appear to be a good first approximation for typical electrified mid-size vehicles. Yet, the result demonstrates the need for vehicle-specific friction braking share coefficients. Given the multitude of different topologies and performance capabilities of electrified powertrains, a single coefficient per vehicle group can never enable fair technology competition. Accordingly, an appropriate method for determining vehicle-specific coefficients is already under development and will be applied within the GTR at a later stage.
4. Discussion
The measurements in this study were carried out under consideration of the PMP Brake Emission Protocol status 07/2021. The currently valid version of the GTR has since been revised in a series of aspects. Findings from the ILS—organised by the PMP Task Force 3 (TF3)—led to tighter guidelines for the design of the sampling system, the enclosure, the sampling tunnel and sampling plane, the PM and PN measurement system, and the cooling air flow measurement. It shall be noted that the setup used in this project was already compliant to most of the final specifications of the GTR despite their non-mandatory nature at the time of the measurements. The most important deviations relate to the calliper position and the use of cascade impactors. More specifically, a uniform calliper position at 12 o’clock is now specified for all emission measurements. Concerning the measurement of the particulate matter mass, PM samplers with preceding cyclone separation are intended today. Altogether, the cascade impactor used in this measurement campaign for PM measurement, the sampling system, and the vehicle-specific calliper position, thus represent a certain deviation from the currently valid version of the GTR. However, the influence of the described differences on the emission result can be regarded as minor, which is why a basic analysis is permissible and meaningful, particularly in a direct comparison within this study. In any case, this work does not claim to show fully GTR-compliant emission factors.
The reported emission factors were calculated as the average of three consecutive emission tests following the bedding (current GTR requires only a single emission test). This provides for statistical support of the emission factors.
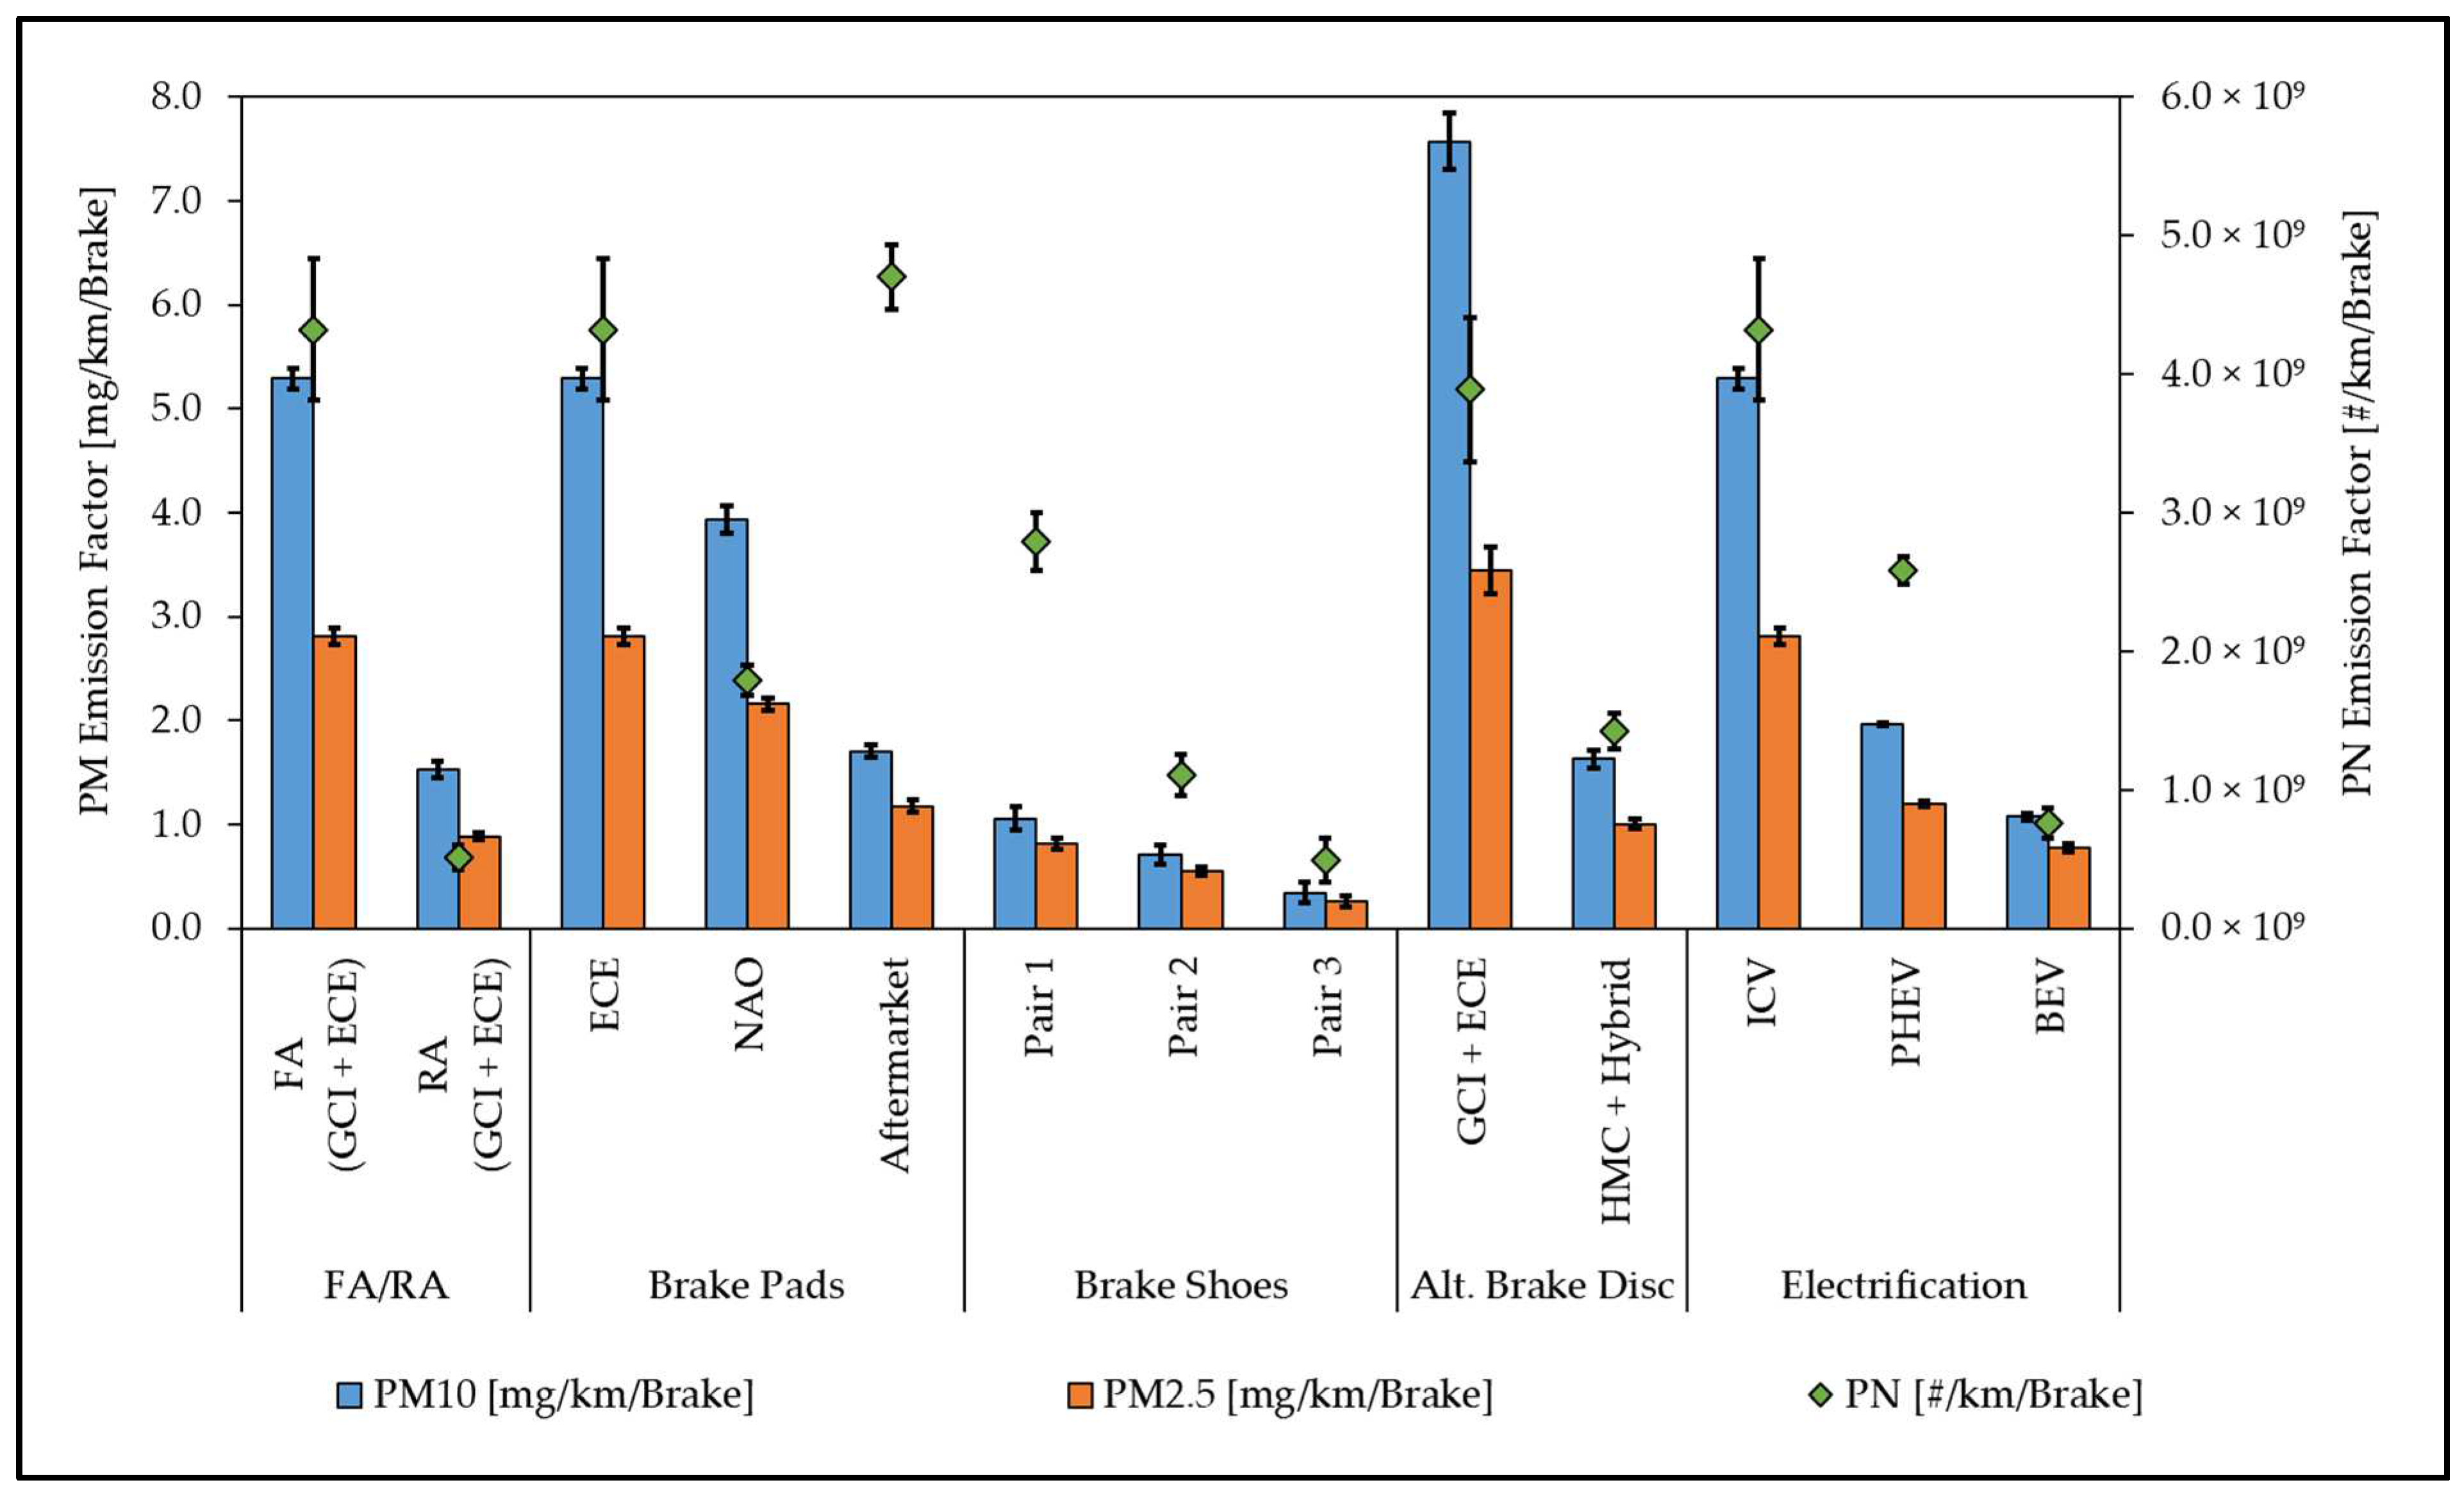
Figure 18 outlines the determined and reported emission factors of the brakes tested in this study. Additionally, the variability of the emission tests is shown as error indicators.
Figure 18 illustrates the standard deviation ranging from 0.02 to 0.27 mg/km/Brake for PM and from 0.9 × 10⁸ to 5.2 × 10⁸ #/km/Brake for PN emissions. This indicates solid reproducibility of the measurements.
The brake dust reduction potentials shown below always refer to the respective standard components of the original equipment manufacturer. They represent the reference in each measurement series of this study. As a general rule, reduction potentials are of course always dependent on the choice of the reference friction pairing.
4.1. Total Emissions of the Vehicle
Initial point for the discussion of the results of this measurement campaign is the exemplary emission factor of the whole vehicle determined for a C-segment vehicle. It is 13.6 mg/km/vehicle PM10 and thus almost twice as high as the upcoming limit value of 7 mg/km/vehicle. In view of the ambitious timeline, according to which the Euro 7 regulations are to come into force mid-2025, short-term measures to reduce emissions are necessary. In this respect, the investigations carried out show some approaches that are already available. Particularly when applied in combination, the measures described in the results and discussed in the following paragraphs offer a considerable potential for reducing emissions, and thus also for complying with the proposed limit value.
At the same time, it was determined that rear-axle disc brakes in the mid-range segment of conventionally powered vehicles are responsible for about one-fourth of the total PM10 brake emissions. However, this share may increase in the future as vehicle masses rise and rear-axle loads increase for electric vehicles, which are often rear-wheel powered. Accordingly, the emission reduction in the rear-axle brake must not be neglected. Furthermore, the design of the electric drive topology, for example, through recuperation using powerful electric motors on the rear axle, offers the possibility of reducing brake dust through the return of the drum brake.
4.2. Influence of the Brake Pad/Shoe Composition
First, disc brakes established in the market are examined, where a significant reduction in particulate matter by means of mass and number can be achieved by developing optimised friction partners. In a first step, the composition of the brake pads can be considered. Often brake pads from the NAO category are highly traded in terms of reduction in brake dust. The determined PM10 savings of more than 26% confirm this expectation in the specific case of the mid-range front-axle brake using the WLTP Brake Cycle. However, when using NAO brake pads, the increase in pad wear at high mechanical and thermal loads must also be taken into account. In some cases, this has also been reflected in the emission of particulate matter [
12,
27]; however, in the current study we did not notice such a trend. In particular, it has been reported that (volatile) ultrafine dust is generated by ‘outgassing’ of the organic lining matrix [
11]. These nanoparticles are primarily relevant for the emission factor of the particle number (PN), which is expected to be regulated in the future in the framework of the Euro 7 regulation. Again, no such a trend was observed in this study; however, it needs to be noted that the formation of such particles largely depends also on the chemical composition of the friction materials (meaning that other NAO pads may show such emissions). In addition, a NAO mixture may be disadvantageous in terms of corrosion [
38]. The lower abrasiveness of this lining family makes it more difficult to remove corrosion products and the regeneration of the friction partner surfaces becomes challenging.
In the aftermarket sector, a wide range of different brake pads is available. The choice is wide, ranging from thermally stable compositions specially designed for motorsports to comfort optimisation with low wear. A brake pad set that promises low wear was investigated in this measurement campaign and generated a considerable PM10 reduction of over 67% on the basis of its wear resistance. Despite the significant reduction in particulate matter mass, a slightly higher particle number count (PN) was measured than in the ECE reference. Here, again, the question arises as to whether the PM10 savings at the expense of the particle count represent a compromise that will be effective in the long term. To appropriately answer this question, one would need to look into two different aspects: One is the PN emissions limits to be defined at the Euro 7 level in the next years. The second relates to the chemical composition—and thus the health relevance—of these particles, which are not directly comparable to exhaust ultrafine particles.
In order to better classify the particulate matter of different friction pairings, it is necessary to take a close look at the emission behaviour during the cycle. This allows for determining in which operating states and under which conditions particles are emitted. For example, the aftermarket brake pads tested in this study are very sensitive to the residual contact of the friction partners when the brakes are not applied. Local microcontacts result in the formation of fine particles, which are then reflected in the PN emission factor [
12,
28,
29,
30]. It is therefore important for this friction system to actively counteract residual contact. One solution for this is the spring arrangements already available for both floating-calliper and fixed-calliper brake systems. When the brake is released, the elastic force causes the brake pads to reset, thus ensuring sufficient clearance between the brake disc and the brake pads. Last but not least, the reduction in the so-called residual braking torque leads to increases in efficiency and thus in the total range when thinking about fully electric vehicles. Another benefit is the reduction in CO
2 emissions with the internal combustion engine propelled vehicles. In all cases, it also leads to a reduction in brake dust emissions irrespective of the composition of the friction partners [
39,
40].
Comparable reduction potentials with regard to brake dust were determined by comparing three different sets of drum brake shoes. Up to 72% PM10 reduction was achieved for the rear-axle application of a mid-size vehicle.
The design-related self-amplification of drum brakes makes them attractive for performance reasons and also leads to the amplification of possible disadvantages of these systems. A contact behaviour across the brake shoes that is as uniform as possible is the basis for favourable emission properties. If, on the other hand, local peak temperatures occur as a result of non-uniform load distribution, the formation of nanoscale and sometimes volatile particles are expected, for which the measurement of the TPN prescribed in the GTR makes perfect sense. These escape the closed design of the drum brake much more easily than coarse wear products, which agglomerate inside the drum and are ultimately also captured there. The potentially very good PM10 performance of drum brakes is often based on this enclosed design. Targeted sealing of the system can both protect the tribological contact surfaces from environmental influences (moisture, corrosion) and contain the emission of coarse particulate matter.
Nevertheless, efforts with regard to emission reduction should not focus solely on the best possible sealing of the overall system. After all, the wear products that initially remain inside the drum will sooner or later enter the environment. Be it through water or moisture infiltration, which leads to washing out of the drum, or through maintenance of the braking system, which exposes the mechanic to the partly hazardous substances and requires the collected material to be disposed off. Accordingly, the formation of fine dusts should already be reduced, for example, through higher wear resistance. Unavoidable remaining wear could also be removed by targeted extraction. The enclosed design of the drum brake offers good preconditions for effective evacuation in this context.
In addition, the different friction force generation between the leading and trailing brake shoe in simplex drum brakes makes it difficult to achieve a comparable running-in condition between the two brake shoes. In view of the predefined bedding within the GTR (5× WLTP Brake Cycle), the question thus arises as to whether a tribologically stable condition can actually be achieved for drum brakes that ultimately produce reproducible emissions. Any fluctuations in the emission factors may sometimes be attributable to such an incomplete running-in process, especially in the case of vehicles with low rear-axle braking power requirements.
In addition, the closed drum brake system fills with the corresponding wear products as the friction partners wear. In turn, these are emitted to some extent as secondary particle emissions at higher rotational speeds. Since saturation of the filling level must first occur before the amount of secondary emission is stable and the emission factor is reproducible, this aspect should also be taken into account in the future evaluation of the running-in condition of a drum brake system. Of course, at the same time one should keep in mind that a much longer preconditioning (e.g., 10 repetitions of the WLTP-Brake cycles) is not desirable since it will significantly increase testing time.
4.3. Influence of Alternative Brake Disc Materials
The effectiveness of high wear resistance for emission reduction is demonstrated by carbide-coated brake discs. The tungsten carbide-coated brake disc investigated in this measurement campaign, in combination with brake pads adapted to the coating, generates over 78% PM10 savings under WLTP Brake Cycle conditions when compared to the benchmark system. In addition to the PM reduction, the significantly lower overall wear in this friction system enables a reduction in the particle count, which is depicted in the reduced PN emissions. It is noteworthy that this reduction is observed despite the higher temperature peaks observed with the carbide-coated brake disc when directly compared to the CGI disc.
With regard to the tribological system as a whole, however, the mere coating of brake discs does not automatically guarantee high particulate reduction potential. Rather, the process parameters must be mastered in the fabrication of the coating surface and brake linings specially adapted to the requirements of the coating must be used [
10,
41]. In general, the compatibility of the friction partners is decisive for performance and emission characteristics as well as for comfort aspects and the durability of the braking system [
35]. At the same time, this raises the question of the long-term emissions of such a system. Depending on the durability of the coating, a change in the emission properties is to be expected in the long term after the potential removal of the coating, which is usually only about 200 µm thick. In particular, strong mechanical and thermal stresses have a detrimental effect on the lifetime of a hard metal coating [
42]. Furthermore, these alternative friction systems still need to be investigated more intensively with regard to their interaction with everyday adversities. The formation of a tribofilm is negatively influenced by wetness, among other things. This automatically raises the question of the influence of corrosion on the brake pads and the tribofilm. This gains more importance not least because of the increasingly infrequent use of friction brakes in the context of e-mobility. An intact hard metal coating protects the disc itself very effectively against the commonly known corrosion-related damage phenomena [
37].
Another important question in relation to alternative friction materials in the form of carbide-coated brake discs is aimed at the running-in condition of the friction system after the prescribed 5× WLTP Brake Cycle (≙ 960 km). Hesse et al. were already able to show in past work that constant and reproducible emission behaviour with alternative friction materials occurs significantly later than with conventional GCI friction pairings [
8]. Although the emission factors of friction systems with carbide-coated brake discs are significantly lower almost from the start, they also have a relatively fluctuating running-in tendency with a low gradient in terms of emission reduction. This makes it difficult to define the point at which a completed running-in condition is reached. As a result, it cannot be ruled out that in the medium to long term, as the running-in process of the friction pairing progresses, lower emission factors could be achieved than after a bedding of 5× WLTP Brake Cycle and thus higher reduction potentials could be achieved. Again, one should keep in mind the necessary compromise in the number of WLTP Brake Cycle repetitions to not significantly increase testing time.
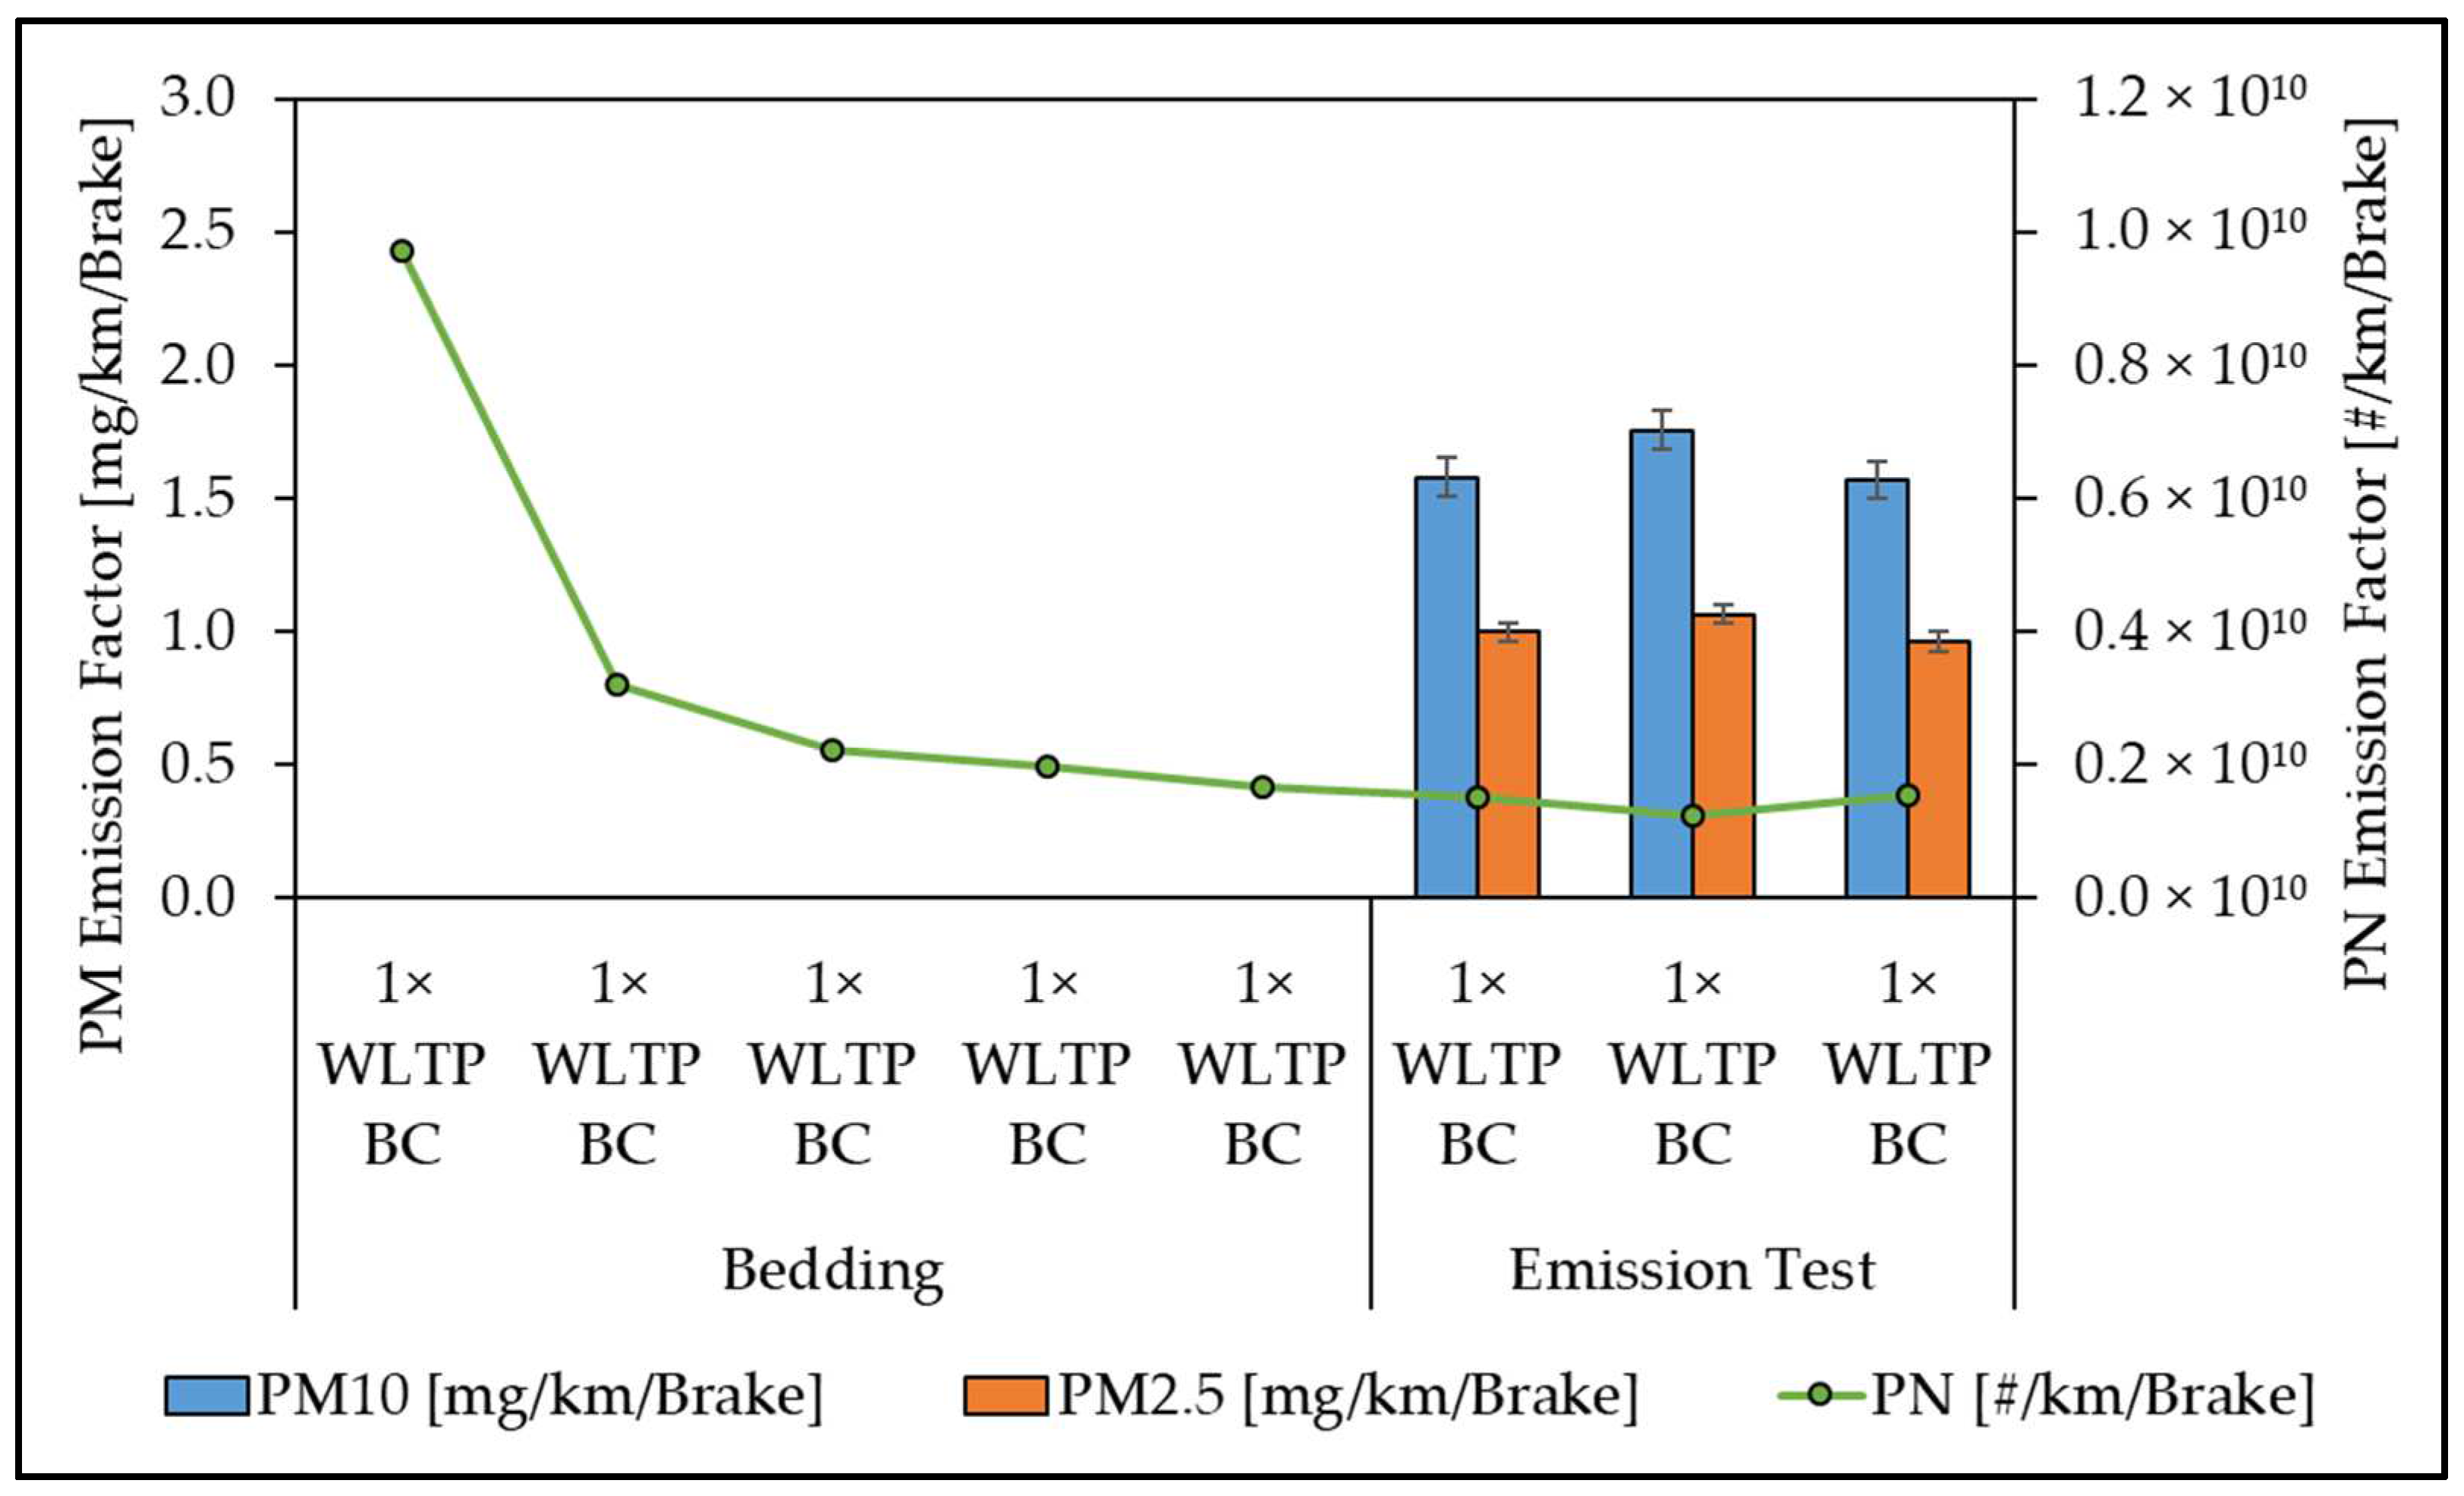
For the HMC friction pairing tested in this work,
Figure 19 initially shows a significant decrease in the PN emission factor at the beginning of the bedding process. This is primarily due to the process of forming a uniform friction contact between the brake pads and the brake disc [
8,
43]. As early as the third iteration of the WLTP Brake Cycle, a low PN emission level is reached, from which a decrease in particle emission from then on only occurs with a low gradient. In this case, the previously described fluctuations in the emission behaviour of alternative friction partners can just be seen in the emission test. Both the PN and the PM emission factors are already at a low level compared with conventional friction systems. A clear tendency towards a further decrease in emissions cannot be deduced at this point for the reasons mentioned. Ultimately, this also raises the question of a suitable compromise between time and cost expenditure and the benefit of further refinement of the emission results.
Despite its wear resistance, the weight analysis showed that the brake disc was subject to a loss of mass. Studies have shown that coating debris enters the environment as wear products [
10,
44]. The coating wear products may possess a number of hazards to human health [
45]. Therefore, it is necessary to continue research on alternative coating processes and material combinations.
4.4. Regenerative Braking
The electrification of vehicles is considered to be one of the driving factors in the reduction in traffic-related particulate matter. Thus, the formation of brake particles originates from the tribological contact of the friction brake, which will be progressively replaced by regenerative braking in the future. To increase efficiency and range, the friction brake in electrified vehicles is normally only used outside the power limits of the generator. This applies on the one hand to assistance above the maximum electric braking torque and on the other hand, for efficiency reasons, to mechanical braking at low vehicle speeds and for stopping. Exceptions are critical driving situations or emergency braking, in which the friction brakes take over the main role or regenerative braking is sometimes switched off completely. The control strategies depend on the drive topology and the possibility of wheel-selective deceleration to ensure driving safety functions [
46,
47].
Particularly with regard to real operating conditions, it must be noted that less frequent and less intensive use of the friction brakes may lead to changes in tribological behaviour. This in turn could result in a change in the emission characteristics due to different thermal operating conditions and corrosion, for example. If in everyday situations the friction brake is mainly used at low speeds where the efficiency of electric braking is low, brake dust is hardly ever emitted during the actual braking manoeuvre. Instead, the emission takes place during acceleration or generally at high speeds without braking action. If, for example, additional filter systems are to be used to collect the fine dust particles, this must be taken into account when designing the collection mechanism or extraction system.
For the PHEV and BEV simulated in this measurement campaign, PM10 reductions of about 62% (PHEV) and 79% (BEV) were determined compared to conventional operation. In addition, the emission factors of the particle number (PN) could be reduced by about 82% for the fully electric vehicle. The simulation of the PHEV results in a PN saving of about 40%. It should be noted in this context that in the simulation of the PHEV, decelerations greater than 1.53 m/s2 were implemented without the support from the generator brake, in other words, purely via the friction brake. This potentially amounts to a slight overestimation of PHEV emissions, as many vehicles attempt to recuperate as much of the braking energy as possible, even at higher deceleration demands. Furthermore, the brake blending control of the dynamometer has remaining optimisation potential in certain cases, which affects both electrification levels investigated. As a result, the friction energy actually converted is about 10–15% below the target value of the respective simulation specifications. This in turn is accompanied by a potential underestimation of the actual emission factors.
The particular influence of the abovementioned methodological and simulative limitations on the emission factor, or whether these may be equalised in the case of the PHEV, cannot be conclusively clarified and should be specified by further studies.
In general, the friction braking share coefficients in the GTR provide a good first approximation with respect to the PM10 reduction potentials. Nevertheless, further steps might prove to be necessary regarding the optimisation of the method to determine the emissions of electric vehicles. A proposal for a possible way forward is presented in
Table 12. Of course, on one hand these are all steps that will help the method to become more accurate and representative for all types of vehicles, but on the other hand, they require long and resource-consuming development and validation phases to reach the level of being ready to be introduced in a regulatory procedure. Therefore, they shall be treated as initial ideas and not final proposals. For the short term, the categorical friction braking share coefficients need to be improved to vehicle-specific coefficients (
Table 12(I)). This is a step already taken by the PMP group in the framework of the Task Force 4 (TF4). The method is expected to be updated in January 2024 and include a specific measurement method providing friction braking share coefficients for each vehicle.
In addition, simulation of electric braking on the dynamometer might be necessary at a next step. This would ensure that the real operation behaviour and the associated emissions are able to be investigated on the dynamometer. In a first step, this simulation can be carried out with characteristic curves that are generally valid for certain electrification levels (
Table 12(II)). This approach was used for emission measurement of the PHEV and BEV within the scope of this study. The most important advantage of this approach is that it can also be applied by third parties. The use of generic deceleration–velocity curves for each vehicle type does not require access to sensitive vehicle manufacturers’ data. However, it has to be noted that this approach would also require developments and improvements in the field of brake dynamometer manufacturing since the vast majority of the layouts used at the ILS were not capable of applying such functionality.
In a further step, vehicle-specific characteristic curves could be determined and simulated on the basis of the individual performance capability of electric recuperation (
Table 12(III)). This can ultimately be supplemented by the real operating behaviour of the electrical system. This means that additional functions and safety features specified in various control units are also taken into account in the recuperation simulation (
Table 12(IV)). For example, the so-called cleaning functions for conditioning or corrosion prevention, which cause the friction brake to be used instead of regenerative braking at regular intervals or under certain environmental conditions (rain), could be recorded and evaluated in terms of emissions. Furthermore, the simulation of regenerative braking is inevitably necessary in order to capture the changed emission characteristics of the braking system in the form of secondary emissions. The presented results of the brake lining, brake shoe, and electrification comparison have shown that the secondary particle emissions have a significant influence on the emission factors. Future regulations should include a definition of the boundary conditions and the battery state of charge (SoC) at the beginning of the cycle. Based on this, a simulation of the traction battery’s state of charge can be performed as a balance of taken energy for driving and recuperated braking energy over the cycle. Since the performance of electric braking is highly dependent on external conditions and the state of charge, this is the only way to determine realistic emission factors and provide additional incentives for increasing the efficiency of the systems. Of course, all these need to be considered pragmatically and in a non-exclusive manner. Issues such as the use of proprietary information, existing testing capabilities, access to third-party testing facilities, and applicability of the proposed methods need to be addressed. As a result, a compromise on what is required to achieve an accurate PM and PN measurement at a vehicle level and what is included in the regulation might be required. In any case, given the ambition of the EU to ban thermal engine vehicles after 2035, it seems that the proposed steps III and IV could serve as a starting point for a discussion of defining a more refined methodology for measuring PM and PN emissions from BEVs.
Finally, like with other vehicle-related regulations, the entire system characteristic can ultimately only be determined in real-life driving tests (
Table 12(V)). However, owing to limited capacities and challenging reproducibility, real-driving emission (RDE) measurements are not initially part of this proposed process.
5. Conclusions
Fine dust measurements of various brake friction pairings were carried out on a dynamometer with comprehensive emission measurement technology. The measurements were used to identify a selection of technical solutions currently available on the market for reducing brake dust. Different brake lining and brake shoe qualities, a surface-coated brake disc, and different levels of electrification were investigated as the most promising options. First, the total PM10 emission factor of a C-segment vehicle was determined to be 13.6 mg/km/vehicle and was used as benchmark to show an exemplary status of current emission factors.
In the case of the brake lining qualities, a PM10 reduction potential of up to 67.9% were demonstrated. For the investigations of the different brake shoes, PM10 reduction potentials of up to 72.7% were found. In addition, the measurement results have shown that the drum brake forms the smallest ratio of PM10 to PM2.5 of the examined friction pairings, which indicates the different emission characteristics of this brake type.
From the investigation of alternative friction pairings, it could be derived that coated brake discs allow reduction potentials regarding PM10 of up to 78.9%.
Furthermore, the analysis of the PM reduction potentials by different levels of electrification showed that with increasing level of electrification the highest PM reduction potentials in this study can be achieved. Those are up to 79.2% for PM10.
In summary, high reduction potentials can be achieved with solutions already available on the market. In the selection and availability of the various solutions, it is important to meet both current and future requirements on brake systems, especially those of a safety-relevant nature. Combined implementation of different measures can be used for this purpose.
The method for measuring brake particle emissions from LDVs developed by the PMP informal working group was a robust basis to conduct the measurements in this study. However, it is necessary to further improve this methodology in the future and to increase its applicability and representativity for real brake emissions. In particular, the temperature corridors for HMC friction pairings and drum brakes are generally not validated. A reproducible measurement of emissions for these brakes would require the protocol to be amended. Furthermore, there might be a need to make a major contribution to the consideration and implementation of electrified vehicles and their operating behaviour by taking into account the available technologies and capabilities. The friction braking share coefficients are a first step of consideration; however, the method might require improvements since it does not represent the real regenerative braking characteristics.
By considering a selection of particulate matter reduction measures, the present study was able to show that various measures can significantly reduce the contribution of friction brakes to particulate matter emissions from motor vehicles. It can be assumed that, due to the increasing electrification of vehicles, the path to reducing brake particulate matter is already in full swing.


 ,
, 


