Article

Interlaboratory Study on Brake Particle Emissions—Part I: Particulate Matter Mass Emissions

by
Theodoros Grigoratos
1,*,
Marcel Mathissen
2,
RaviTeja Vedula
3,
Athanasios Mamakos
4,
Carlos Agudelo
5,
Sebastian Gramstat
6 and
Barouch Giechaskiel
1,*
1
European Commission, Joint Research Centre (JRC), 21027 Ispra, Italy
2
Ford-Werke GmbH, Süsterfeldstr. 200, 52072 Aachen, Germany
3
Brakes India Private Limited, Padi, Chennai 600 050, India
4
Corning GmbH, 65189 Wiesbaden, Germany
5
Link Engineering Co., 43855 Plymouth Oaks Blvd., Plymouth, MI 48170, USA
6
Audi AG, 85045 Ingolstadt, Germany
*
Authors to whom correspondence should be addressed.
Atmosphere 2023, 14(3), 498; https://doi.org/10.3390/atmos14030498
Submission received: 1 February 2023 / Revised: 27 February 2023 / Accepted: 2 March 2023 / Published: 4 March 2023
(This article belongs to the Special Issue Brake Wear Particulate Matter and Mitigation Strategies)

Abstract

:
The Particle Measurement Programme Informal Working Group (PMP-IWG) coordinated a global interlaboratory study (ILS) on brake wear particle emissions with the participation of 16 testing facilities. Two articles present the main outcomes of the ILS: (I) Particulate matter mass (PM), and (II) Particle Number (PN) emissions. The test matrix covered a wide variety of brake systems and configurations. The tested disc brakes were found to emit PM2.5 and PM10 that varied between 0.8–4.0 mg/km and 2.2–9.5 mg/km per brake, respectively, depending on the type of brake and the applied testing load. The drum brake emitted much lower PM due to its enclosed nature. Almost 37–45% of the emitted PM falls in the fine particle size with this fraction being higher for the drum brake. On the other hand, almost 50–65% of the total brake mass loss falls in particle sizes larger than 10 μm or gets lost before being measured. The most important loss mechanisms for PM in the proposed layout are being discussed. Finally, the PM measurement variability and lab-to-lab reproducibility are investigated.

1. Introduction

Non-exhaust emissions refer to particle emissions released from friction brake wear [1], the interaction between the tyre and road interface [2], and the resuspension of road dust [3]. The European Environmental Agency (EEA) reported that these sources contributed 2.6–3.2% to the total PM emissions in the EU27 (2020) [4]. In line with these figures, the Organisation for Economic Co-operation and Development (OECD) reported that brake and tyre wear PM10 emissions contribute approximately 4% to the total PM concentrations at background sites, and 5–8% at traffic sites [5]. Recent studies indicate that the relative contribution of non-exhaust sources to traffic-related PM concentrations at local hot spots may exceed 50% [6,7], highlighting the importance of non-exhaust emissions for urban environments.
Regarding brake wear PM emission factors (EF), a wide range of values have been published in the literature depending on the measurement or calculation method. In 2014, the European Commission’s Joint Research Centre (EC’s JRC) summarised PM10 emission factors in the range of 1.0–8.0 mg/km per vehicle from the literature [8]. Similar emission levels have been reported in other measurement campaigns [9,10,11,12,13,14], whereas higher PM EF values have also been reported [14,15,16,17,18], depending—among others—on the type of tested brake, the applied load, the test cycle, and the overall layout. The EEA applies a PM10 EF for brake wear emissions from passenger cars of 7.35 mg/km per vehicle [19], whereas the Euro 7 pollutants regulation preparation used a fleet-based PM10 emission factor of 12 mg/km per vehicle for LDV up to 3.5 t to perform the accompanying impact assessment study [20]. Despite the differences in the reported EF, there is a consensus that non-exhaust emissions have increased in recent decades due to the increase in traffic volume and are now the main contributor to traffic-related particle emissions. Non-exhaust emissions from tyres and road abrasion have also contributed significantly to this increase [5,6,7].
In this framework, regulatory bodies have taken action to mitigate non-exhaust traffic-related particle emissions in the environment. More specifically, in 2021, the Working Party on Energy and Pollution (GRPE) mandated the Particle Measurement Programme Informal Working Group (PMP-IWG) to develop a global technical regulation (GTR) for sampling and measuring brake wear particle emissions from Light-Duty vehicles (LDV) up to 3.5 t [21]. Similarly, a joint Task Force on Tyre Abrasion (TFTA) was created in 2022 under the Working Party on Noise and Tyres (GRBP) and the GRPE with the aim of developing a procedure for measuring the abrasion of tyres and rating the abrasion performance of a wide range of tyres available on the market [22]. These two activities are carried out under the auspices of the United Nations Economic Commission for Europe World Forum for Harmonization of Vehicle Regulations (UNECE WP.29). At the same time, the European Commission, in its recent proposal for the EURO 7 pollutant emissions regulation, introduced provisions to limit PM and PN emissions from brakes and tyre abrasion to ensure the lowest possible level of vehicle emissions, thus becoming the first region to introduce such limits worldwide [23].
Regarding the GTR on brake emissions, the PMP-IWG worked on the development of the first version of the proposed methodology that included a set of minimum technical specifications for measuring brake particle emissions on a brake dynamometer [24]. These included provisions regarding the testing cycle [25], cooling adjustment methodology, bedding procedure, brake enclosure design, measurement of PM and PN emissions, and the reporting of the results [24]. These recommendations were submitted to the PMP-IWG in July 2021 by Task Force 2 (TF2), which was created to investigate the appropriate methodologies and instrumentation for the sampling and measurement of brake wear particles. In September 2021, the PMP-IWG organised an Inter-Laboratory Study (ILS) to assess the proposed methodology and provide recommendations to the PMP-IWG for its further improvement and refinement. The objectives of the ILS included (a) verifying the feasibility and applicability of the proposed specifications, (b) providing recommendations on further improving the defined specifications, (c) examining the repeatability and reproducibility of PM and PN emission measurements, and (d) proposing alternatives to some of the proposed specifications.
The PMP-IWG created a Task Force (TF3) to organise and carry out the ILS. The testing activities of the ILS were launched in September 2021 and finalised in January 2022. The measurements took place at 16 testing facilities in Europe, Japan, S. Korea, and the United States. A total of 75 tests were completed including the evaluation of PM and PN emissions for seven brake designs, the effectiveness of an alternative bedding procedure compared to the default bedding, and the repeatability of PM and PN emissions by testing multiple replicate samples of the same brake system. The most important results of the ILS were presented to the IWG on PMP in March 2022 in six different presentations [26]. The TF3 concluded its activities in April 2023. The PMP-IWG continued with the development of the GTR and submitted its draft version to the GRPE in June 2022. The GRPE adopted the GTR on brake emissions on January 2023 [27]. The GTR on brake emissions is the first regulation addressing a non-exhaust traffic-related particle emissions source worldwide. At the same time, the GTR on brake emissions will be used in the EURO 7 pollutant emissions regulation aiming to reduce brake PM and PN emissions from road transport and improve air quality in Europe.
The current article presents the most important results related to the PM10 and PM2.5 measurements obtained during the ILS. PM emission levels from different brakes, repeatability and reproducibility of the measurements, transport and extraction particle losses in the setups, and influence of energy dissipation to PM emissions are discussed. Additionally, the current article touches upon some important lessons learned from the ILS and discusses how these were incorporated into the final GTR. The most important results related to the PN measurements are discussed in Part II [28].

2. Materials and Methods

2.1. Tested Brakes

Four disc and one drum brake systems were tested. Table 1 lists the vehicle parameters and attributes for the five brakes tested using assemblies from different vehicle OEMs (in alphabetical order: Audi, BMW, Ford, Stellantis, and VW). Brakes have been anonymized and their numbering does not correspond to the original equipment manufacturer (OEM) order of sequence provided here. The letters ‘F’ and ‘L’ in the brake IDs indicate the variation of the friction type and vehicle mass (load), respectively. Br1Fa is the reference ECE (European performance brake pads) brake used also in the previous ILS, which examined the feasibility of testing facilities to correctly execute the WLTP–Brake cycle on the brake dynamometer [29]. Br1Fb is the non-asbestos organic (NAO) counterpart to the reference brake. Br1Fa and Br1Fb are considered typical for a sedan vehicle type. Wheel Load/Disc Mass (WL/DM) ratio is an essential parameter in determining the appropriate cooling airflow for the tested brake [24]. Br2 was selected to have similar test inertia, but a different WL/DM ratio compared to the reference brake. The main difference between the two brakes lies in their mass: Br2 weighs approximately twice as much compared to the reference brake. On the other hand, Br3 was selected to have a higher test inertia and a lower WL/DM ratio compared to the reference brake and represents the sports utility vehicle (SUV) segment. Br4 is a typical drum brake mounted on the rear axle of city cars and compact passenger cars. Br5La represents a typical N1 vehicle category (cargo van segment) brake tested under low load conditions. In this case, no additional payload was considered and only the mass that equals 1.5 passengers was applied. Br5Lb was a heavily loaded condition of the vehicle (90% payload) corresponding to Brake 5La. Br1 and Br2 were mandatory for all participating facilities. In contrast, the remaining brakes (Br3-Br5) were optional depending on the testing facilities’ availability.

2.2. Testing Protocol

The applied cycle during the ILS was the Worldwide Harmonised Light-Duty Vehicles Test Procedure (WLTP) brake cycle (hereafter mentioned as the WLTP-Brake cycle). The WLTP-Brake cycle is derived from the WLTP database, which consists of in-use driving data from five different regions (EU, USA, India, Korea, and Japan). It consists of 10 Trips with total distance of 192 km and 303 braking events. The details of the cycle have been discussed by Mathissen et al. [25]. A previous interlaboratory study using brake dynamometers assessed the test-to-test (repeatability) and lab-to-lab (reproducibility) of the cycle [29]. A maximum of 10% of speed violations were allowed during the execution of the emissions measurement section (see below Phase 3).
Table 2 lists the primary specifications mandated for the participating facilities. These requirements covered the system and the measurement specifications to improve repeatability and reduce lab-to-lab variability during the emission measurements.
To standardise the emission test procedure and harmonise the measurements, the participating facilities followed a predefined test sequence:
-
Phase 1—cooling section: A section to adjust the cooling airflow rate to match predefined thermal regimes measured or predicted from proving ground test data [24]. The ratio of WL/DM provided a reference metric to define the target values for: (i) the overall average temperature; (ii) the average initial temperature of six preselected events; and (iii) the average final temperature of six preselected events during the WLTP-Brake cycle’s Trip 10 [24]. These temperatures were employed to determine the cooling airflow rate for each brake under testing at each facility. Multiple iterations of the WLTP-Brake cycle’s Trip 10 were carried out by the testing facilities to define the correct cooling settings meeting all target values.
-
Phase 2—bedding section: A section to precondition the brakes and stabilize their emissions behaviour. The bedding section included five repeats of the WLTP-Brake cycle without any warm-up stops. The first WLTP-Brake cycle started at ambient temperature without cooling sections between consecutive trips. After the first cycle, the brake disc (or drum) was allowed to cool down to 40 °C before starting each WLTP-Brake cycle (2 through 5). In addition to this default bedding method, some testing facilities tested using a second method with a shorter duration. This alternative method included 10 repeats of the WLTP-Brake cycle’s Trip 10 with a cooling section to reach an initial brake temperature of 40 °C before each repetition. The influence of the alternative bedding method on brake emissions is not examined in this paper and only results with the standard bedding procedure are discussed.
-
Phase 3—emissions measurement section: A section to measure brake PM and PN emissions. The emissions measurement section included three repeats of the WLTP-Brake cycle that followed the bedding section. Trip 1 started at ambient temperature. At the end of Trip 1 and every subsequent trip (2–9) a cool-down to 40 °C before starting the next Trip (2–10) was followed. The emissions test section ran without dissembling the brake or opening the brake enclosure. If the dynamometer faulted during a WLTP-Brake cycle Trip, the facility repeated the entire WLTP-Brake cycle.
The dynamometer control system maintained the cooling airflow rate at the target value determined by the tested brake’s cooling air adjustment section (Phase 1). The cooling airflow required continuous preconditioning to a temperature of 20 ± 2 °C, and relative humidity of 50 ± 5% during the entire brake emissions test (Phases 1–3). In addition, the cooling airflow passed through air filters of at least class H13 before entering the brake enclosure. Figure 1 illustrates a generic layout based on which the testing facilities carried out brake emissions testing during the ILS. The layout is not identical for all testing facilities as there were certain flexibilities (e.g., the existence or not of a 90° bend before the sampling plane, placement of the flow measurement device, enclosure shape and dimensions, etc.).
In addition to the PM and PN emissions measurements (Phase 3), the testing facilities were requested to measure and report the total mass loss of the tested brake over the entire emission test procedure (Phases 1–3). This was determined by weighing the brake (disc or drum, and pads or shoes) before the start (i.e., before the cooling air adjustment section) and after the end of the emission tests (i.e., after the end of the emissions measurement section). The mass loss rate for each brake was calculated by dividing the total measured mass loss by the total distance covered throughout the entire testing procedure.

2.3. PM Measurement Specifications and Instrumentation

The ILS presented in this paper used 16 brake emissions dynamometers from facilities across Central Europe, Asia, and the U.S. In the current study, a set of guidelines established the test setup, cycle execution, and measurement system [24]. PM10 and PM2.5 mass emissions were measured gravimetrically. Table 3 presents the main elements of the PM-related instrumentation selected by the testing facilities. The following minimum specifications were defined for sampling, measuring, and calculating PM emissions:
-
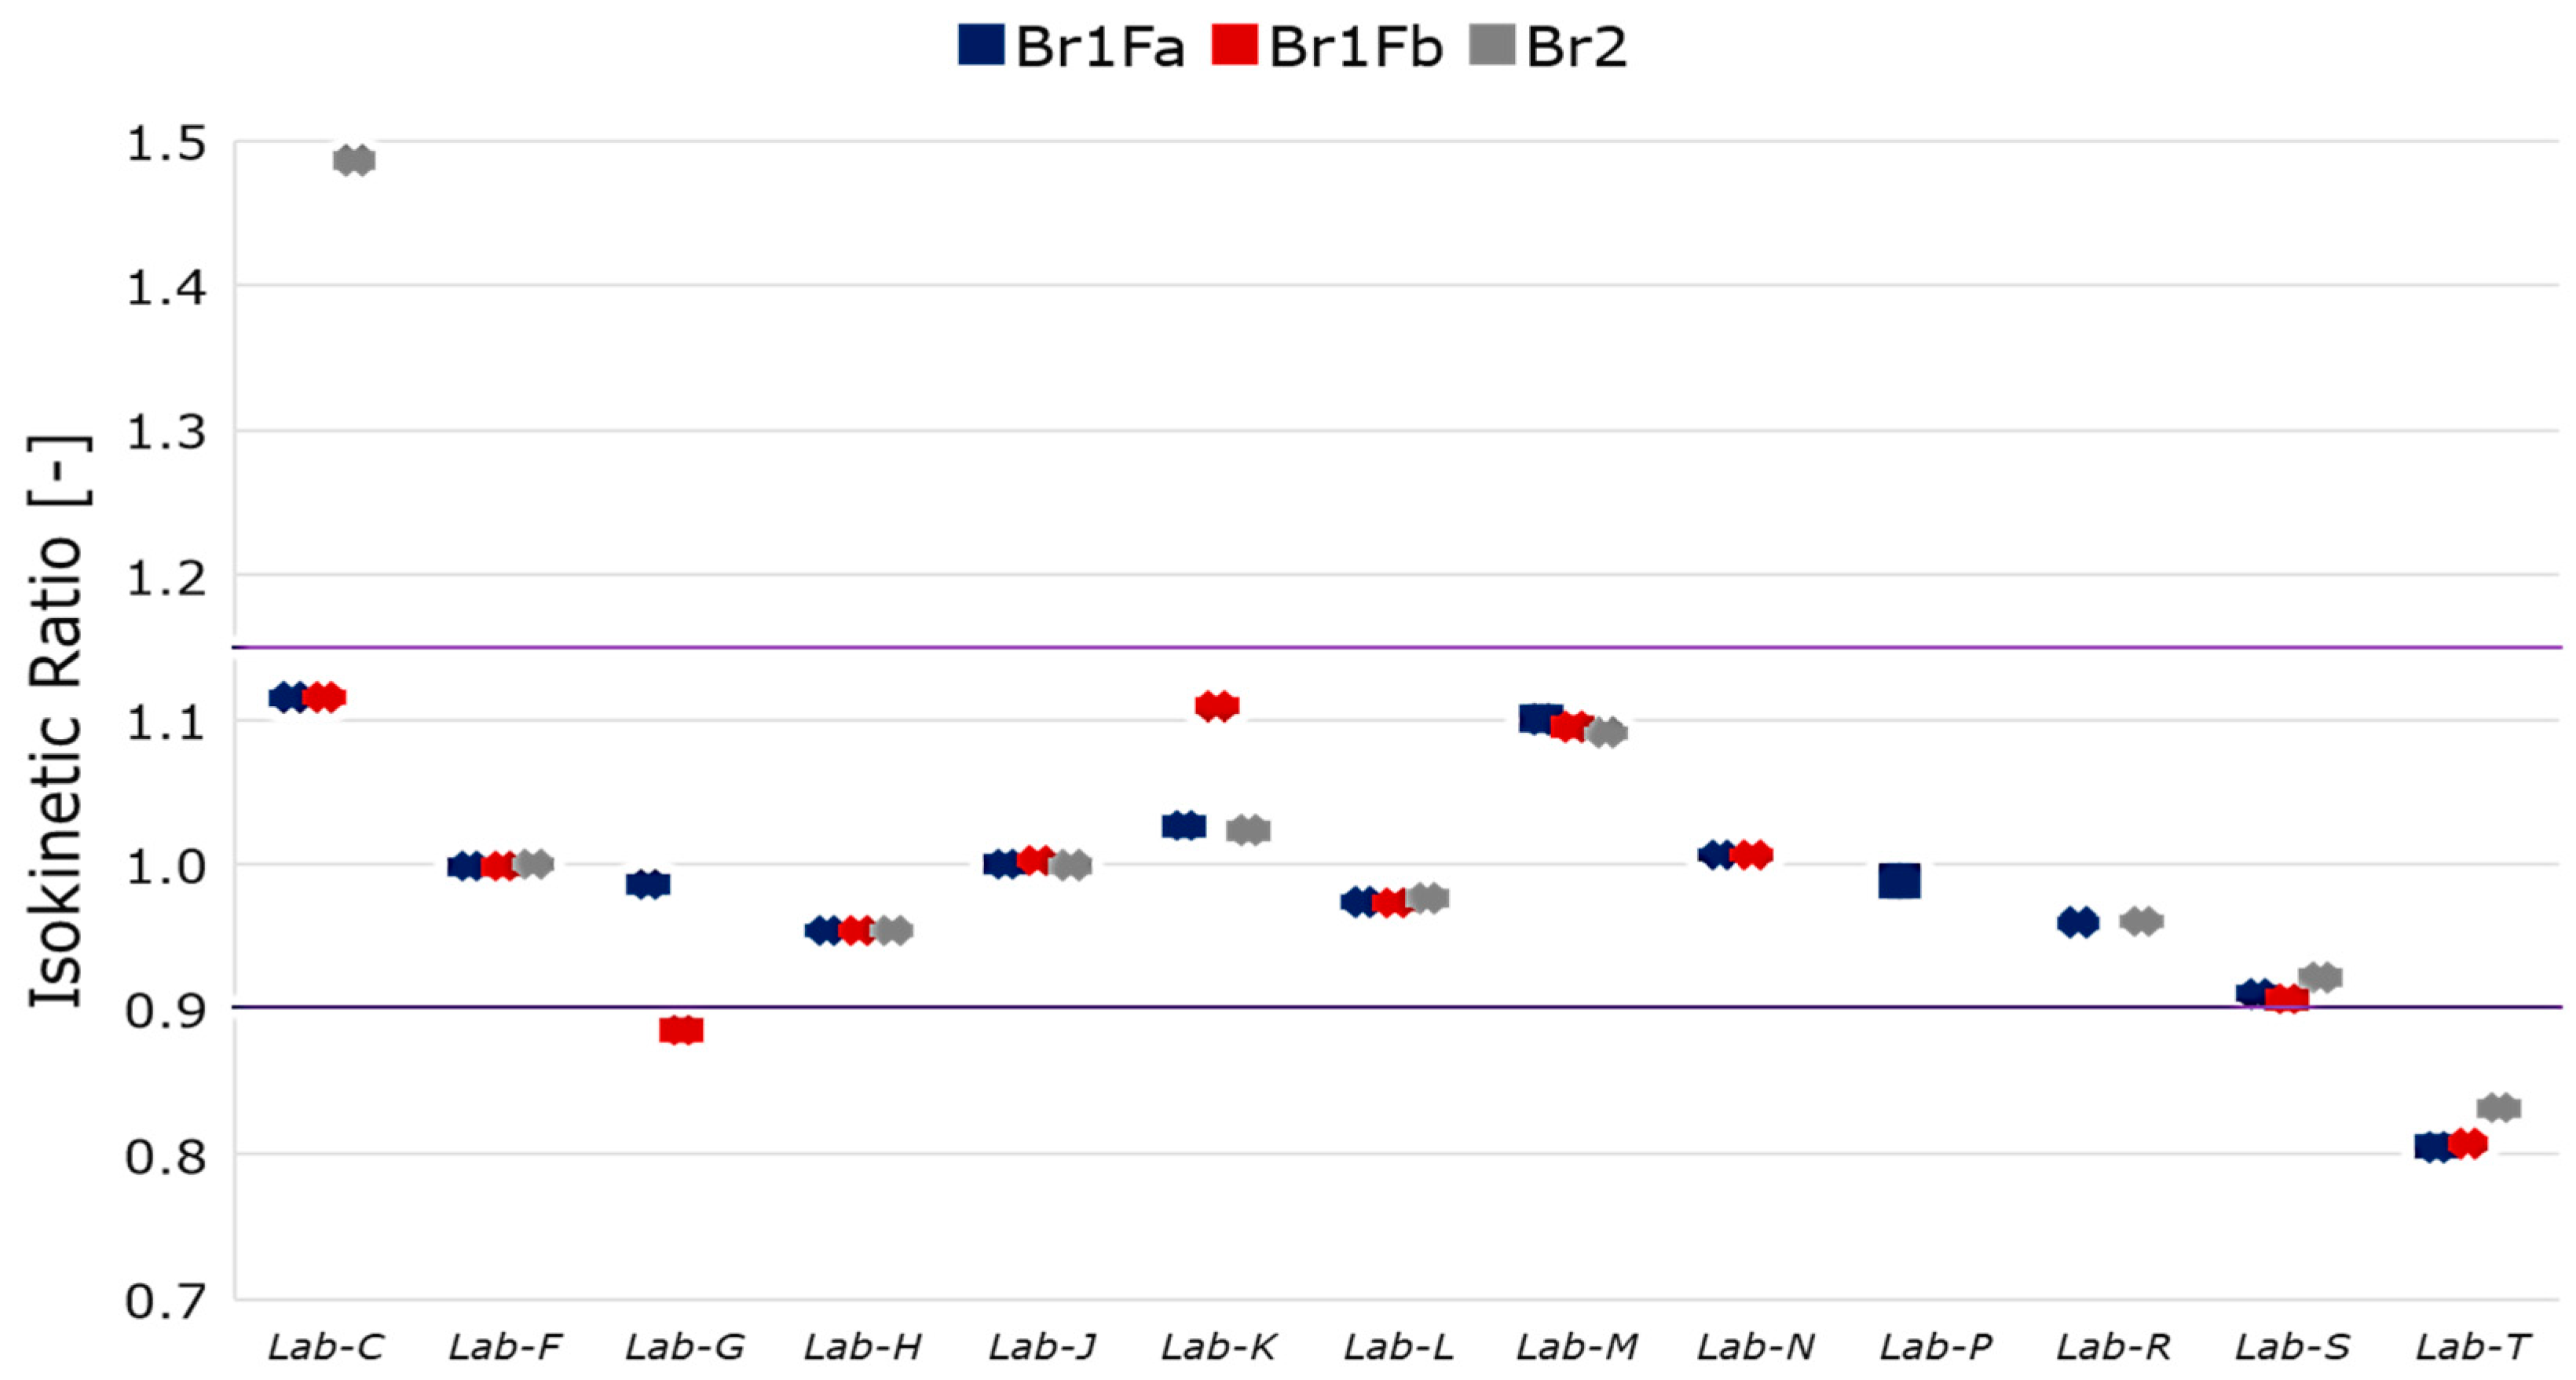
Transport and Extraction: The sampling plane was placed at least 5 duct diameters downstream and at least 2 duct diameters upstream of the last flow disturbance. The use of appropriate nozzles to ensure isokinetic sampling for both PM10 and PM2.5 was mandatory. The isokinetic ratio defined as the ratio of air velocity in the nozzle to the air velocity in the duct was set between 0.9 and 1.15. The aspiration angle was restricted to ±15°. In addition to the mandatory elements, it was recommended to limit bends to a minimum, and design them with a radius greater than 1.5 times the duct/tube diameter. The use of flow splitters for PM measurements was discouraged; however, when applied, it was recommended to limit the change in the flow angle within 20° for each outlet.
-
PM Sampling Devices: Single- or multi-stage PM10 and PM2.5 cyclonic separators followed by gravimetrical filter holders were the primary choice for the collection of the PM10 and PM2.5 samples. Alternatively, single- or multi-stage inertial impactors were allowed for the collection of the PM samples to study their feasibility. Certain specifications for the penetration as a function of aerodynamic diameter and the separation efficiency of the PM sampling devices were set [24]. The sampling flow was required to remain within 5% of the set point throughout the test so as to not compromise the associated collection efficiency curve.
-
Sampling media: Filters with efficiency better than 99.5% on a test aerosol with an aerodynamic diameter of 0.3 µm at the maximum sampling flow rate, or better than 99.9% on a test aerosol of 0.6 µm aerodynamic particle diameter were used. Teflon-coated glass fibre (TCGF) filters or polytetrafluoroethylene (PTFE) 47 mm membrane filters with polymer support or appropriate impaction substrates were required for the ILS. For cyclonic separators, both types of filters were allowed. Neutralizing the electrostatic charge was mandatory when the PM samples were collected using PTFE 47 mm membrane filters with polymer support. For the inertial impactors, it was recommended to use aluminium foils or polycarbonate film as an impaction substrate. Alternatively, PTFE 47 mm membrane filters with polymer support were allowed.
-
Weighing Procedure: Only the filter—or the impaction substrate—was specified to be weighed. For inertial impactors, the impaction substrates were coated beforehand with a thin layer of adhesive material, heated in an oven (at 100 °C for aluminium foils) to evaporate any volatile components, and weighed with the pre-conditioned grease coating. The filters—or the impaction substrates—were conditioned pre- and post-sampling for a minimum of 24 h at 22 ± 3 °C and 50 ± 10% RH. The weighing balance was placed in a weighing room maintained at controlled conditions of 22 ± 1 °C and 50 ± 5% RH. The balance resolution was set to a minimum of 1 μg. Certified calibration weights were required to verify the stability and the proper function of the microbalance. The validation of the PM data was performed using reference filters.

2.4. Test Matrix

Br1 and Br2 were mandatory for all participating facilities, whereas Br3, Br4, and Br5 were optional. Table 4 summarizes the planning of the testing activity. The “X” in the table denotes planned tests that were not able to be completed on time or at all due to logistical or technical constraints. Overall, 75 tests were planned. A total of 71 tests were completed successfully (95%).
A total of 16 testing facilities completed tests with Br1Fa (reference brake) allowing for a thorough analysis of the results for this brake. Each test included three PM measurements sampled during the last three WLTP-Brake cycles. Thus, a total of 48 data points of PM10 and PM2.5 measurements are reported for Br1Fa. A high number of tests were also completed with Br1Fb (14) and Br2 (13), allowing for the draw of useful conclusions for these brakes, too. Optional brakes were tested by fewer facilities with Br3 having seven completed tests corresponding to 21 reported PM10 and PM2.5 measurements. The drum brake was tested by five laboratories. Finally, Br5La and Br5Lb were tested by four testing facilities, allowing for some preliminary trends to be extracted.

2.5. Testing Facilities Compliance

Table 5 summarizes the main deviations of the testing facilities from the defined specifications in different areas. The table focuses on the deviations that are considered more relevant to PM emissions. The list of non-compliances is provided mainly for information purposes. For most of the listed non-compliances it is not statistically possible to extract any robust information regarding their influence on the PM measurements; however, the influence of some of these deviations on the PM results is attempted to be addressed in the “Discussion” section. Additionally, providing this information may prove a useful lesson learned for possible similar future exercises.
Labs B and Q identified serious issues with their sampling and measurement setups after the end of the ILS. Lab B faced issues with isokinetic sampling related to the measurement of the correct airflow and the use of the appropriate nozzles. On the other hand, Lab Q experienced issues with the correct execution of the WLTP-Brake cycle and with the brake enclosure design. Both testing facilities requested not to be considered for the subsequent analysis of the results. For this reason, their measurement results will not be discussed in this paper.

2.6. Statistical Data Treatment

PM10 and PM2.5 emissions data in the “Results” section are given in box plots. Six statistical variables are included in the plots for each brake: the minimum, first quartile, median (denoted with the horizontal line), average (denoted with the “×”), third quartile, and maximum. The circles in the boxplots denote all PM measurements carried out by all testing facilities for the given brake. Outliers are denoted, too, when applicable. Outliers are defined based on the Z-value–data with Z-values beyond three are treated as outliers. The Z-value is defined as Z = (x − μ)/σ (μ is the mean of the data and σ is the standard deviation of the data). Outliers are always accounted for in the discussion of the results unless indicated differently. Similar box plots are used for studying PM2.5 to PM10 and PM10 to mass loss ratios.
The PM10 and PM2.5 measurement repeatability for each testing facility and tested brake are examined in the “Discussion” section. The coefficients of variation (CoV) of the three PM measurements of each test are used to assess each testing facility’s PM repeatability. The CoV is calculated as the ratio of the standard deviation of the PM measurements to their average value. Similarly, PM10 and PM2.5 measurement reproducibility among all testing facilities for all tested brakes are examined in the “Discussion” section. The coefficients of variation (CoV) of all PM10 and PM2.5 measurements for each brake are used to assess the PM10 and PM2.5 reproducibility, respectively. The CoV is calculated as the ratio of the standard deviation of the PM measurements to their average value.

3. Results

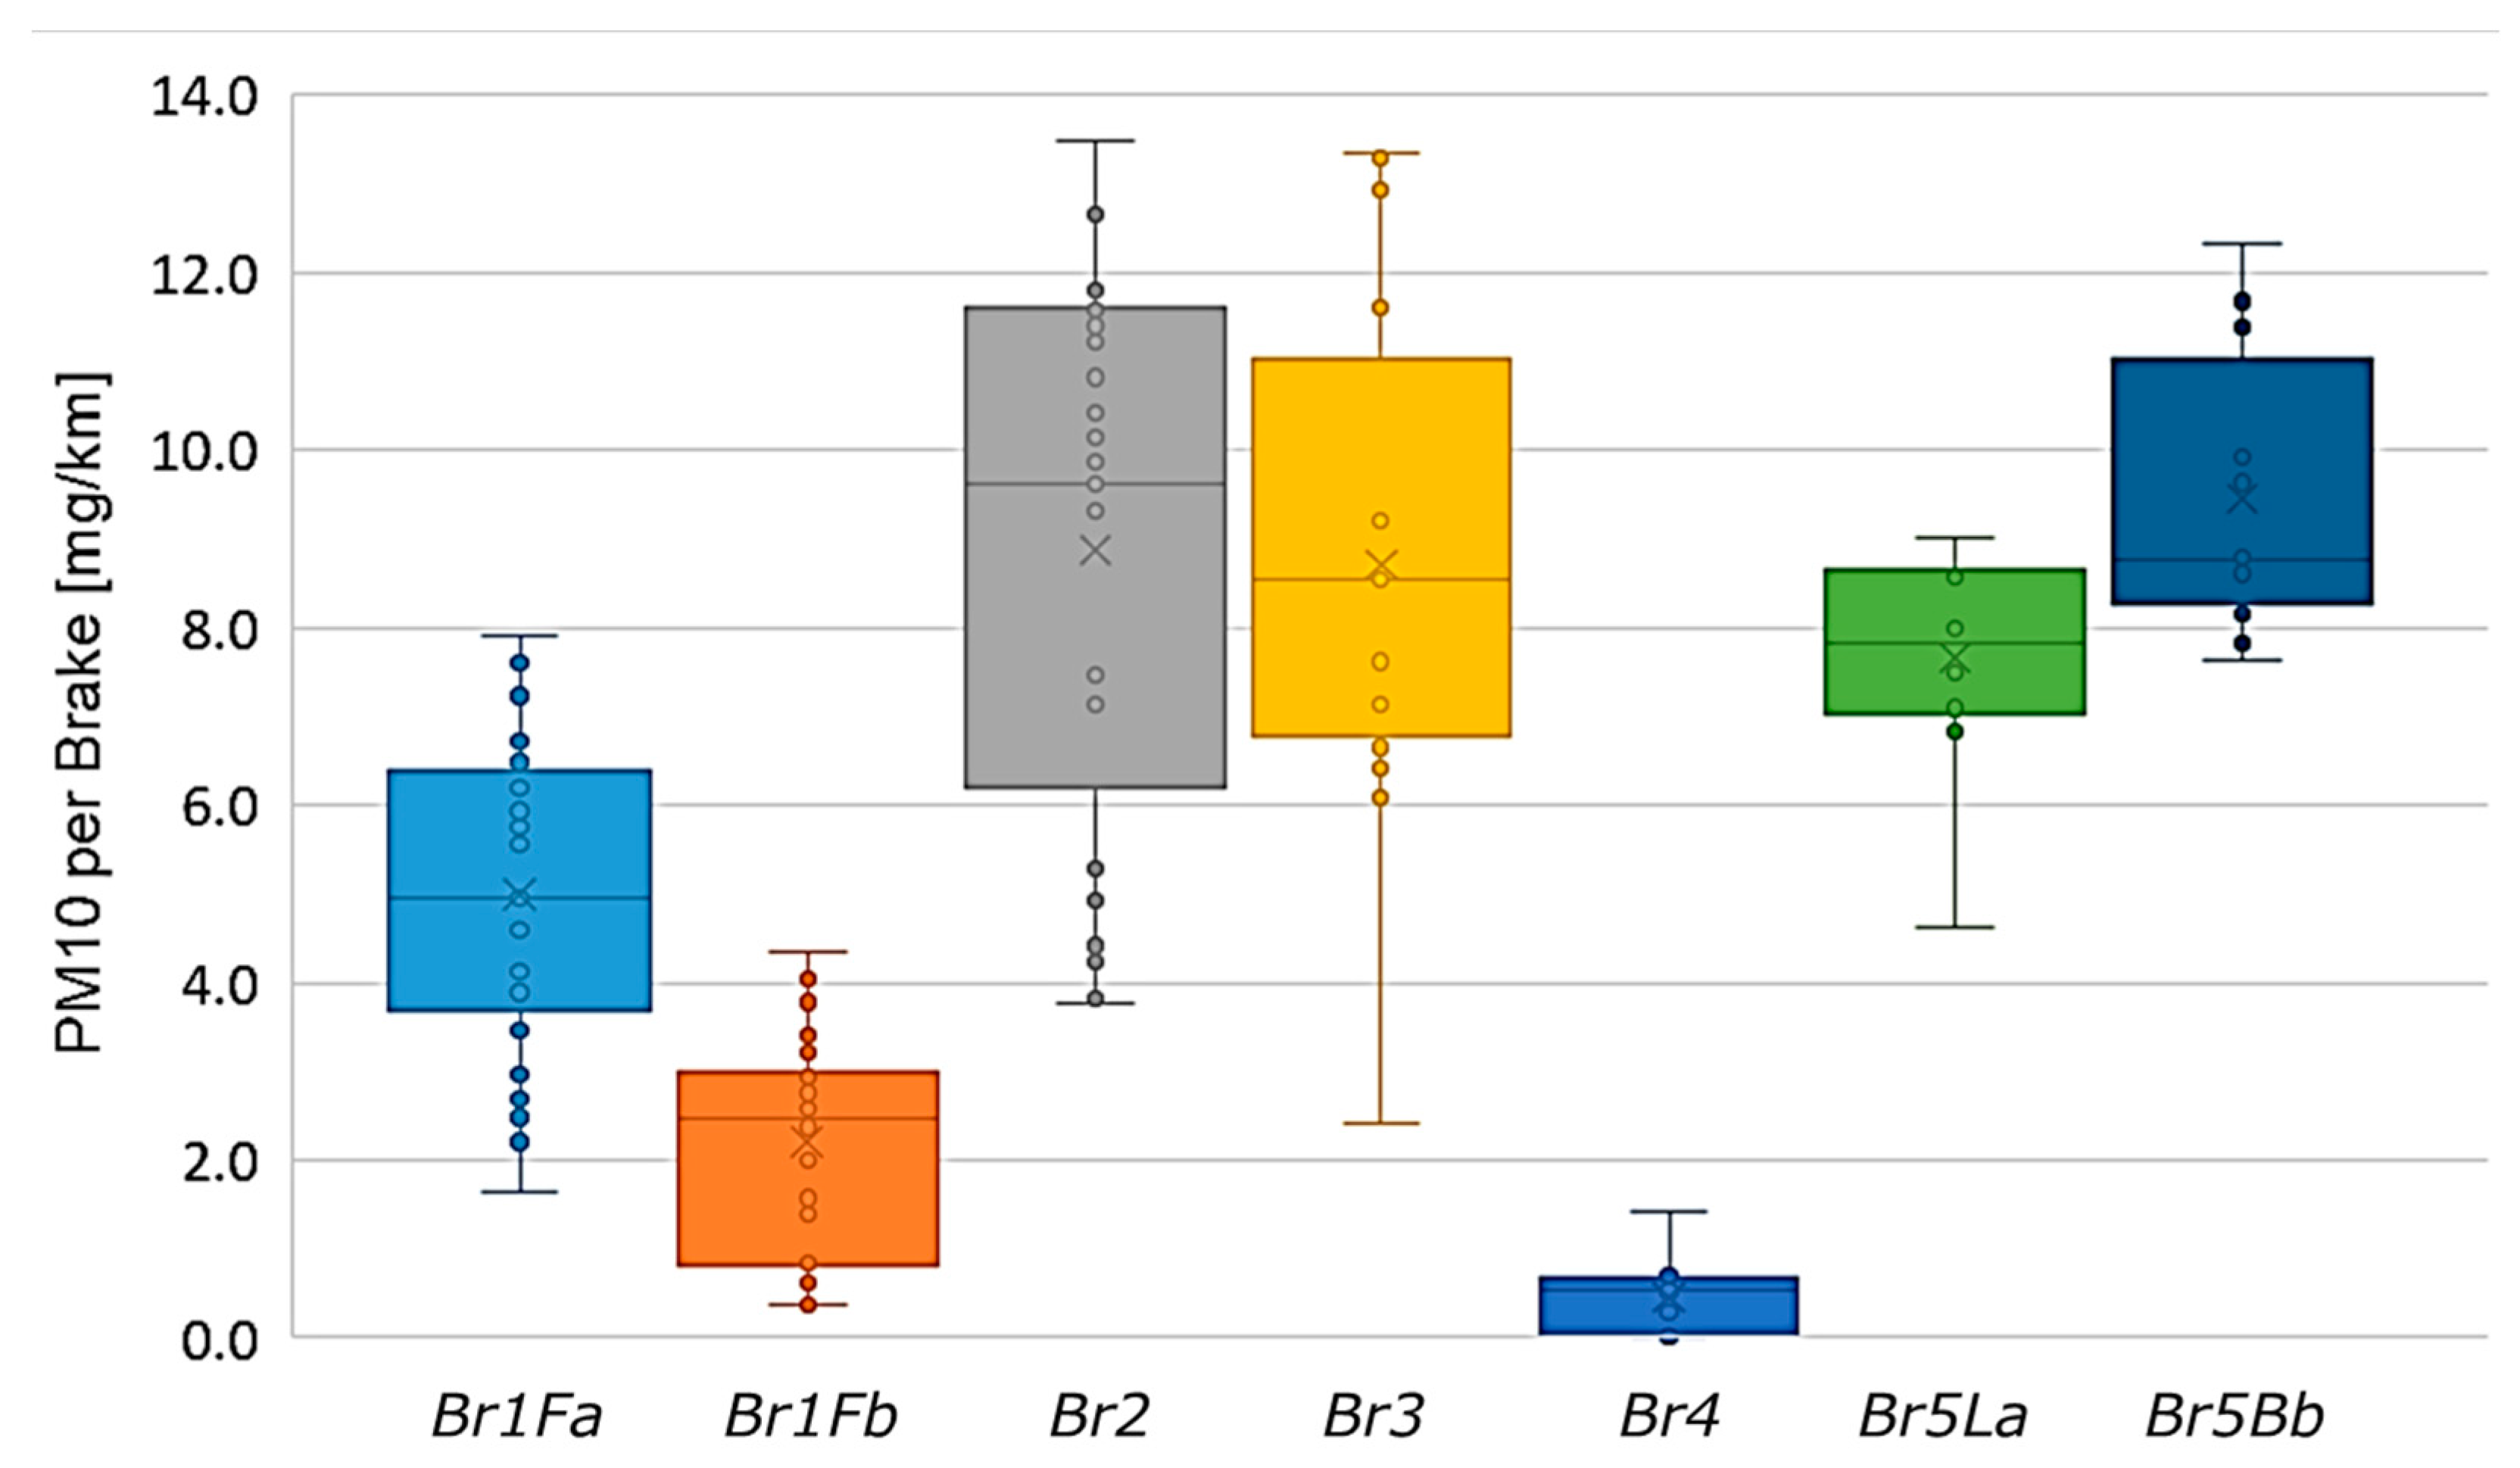
3.1. PM10 Emission Measurements

Figure 2 provides an overview of the PM10 measurement results for all brakes and testing facilities. It includes data points from 37, 34, 29, 16, 15, 10, and 12 emission tests for Br1Fa, Br1Fb, Br2, Br3, Br4, Br5La, and Br5Lb, respectively.
PM10 emissions of the reference brake (Br1Fa) varied between 1.7 mg/km and 7.9 mg/km per brake with the average being 5.0 mg/km per brake. This value is slightly higher compared to that reported in the literature for the same brake system by Farwick zum Hagen et al. [15]. On the other hand, the reference brake’s NAO counterpart (Br1Fb) emitted less than half PM10 averaging 2.2 mg/km per brake. This is much higher compared to the values reported by Hagino et al. [12] for NAO-based brake systems (approximately 1.4 mg/km per vehicle). Br2 and Br3 emitted higher PM10 compared to the reference brake averaging 8.9 mg/km and 8.7 mg/km per brake, respectively, in line with previously reported values for similar brakes [17]. This corresponds to approximately 25–27 mg/km at a vehicle level assuming a scaling factor of 3. This factor is commonly used in the industry to extrapolate corner-based to vehicle-based brake PM emissions. It is based on the front to rear axle brake force distribution, which is typically close to a 2:1 range. Therefore, vehicle-based brake PM emissions are assumed to be three times higher than the front axle single corner-based brake PM emissions. As expected, the drum brake (Br4) emitted very low PM10 emissions averaging 0.5 mg/km per brake. This is due to the enclosed nature of the brake, but also due to the low testing load at the rear brake corner of the corresponding vehicle. Finally, Br5La emitted as high as the “bigger vehicle” category brakes (Br2 and Br3) averaging 7.7 mg/km per brake. The 36% increase in the testing load (Br5Bb vs. Br5Ba) resulted in a 23% increase in the PM10 emissions with Br5Lb, which averaged 9.5 mg/km per brake.

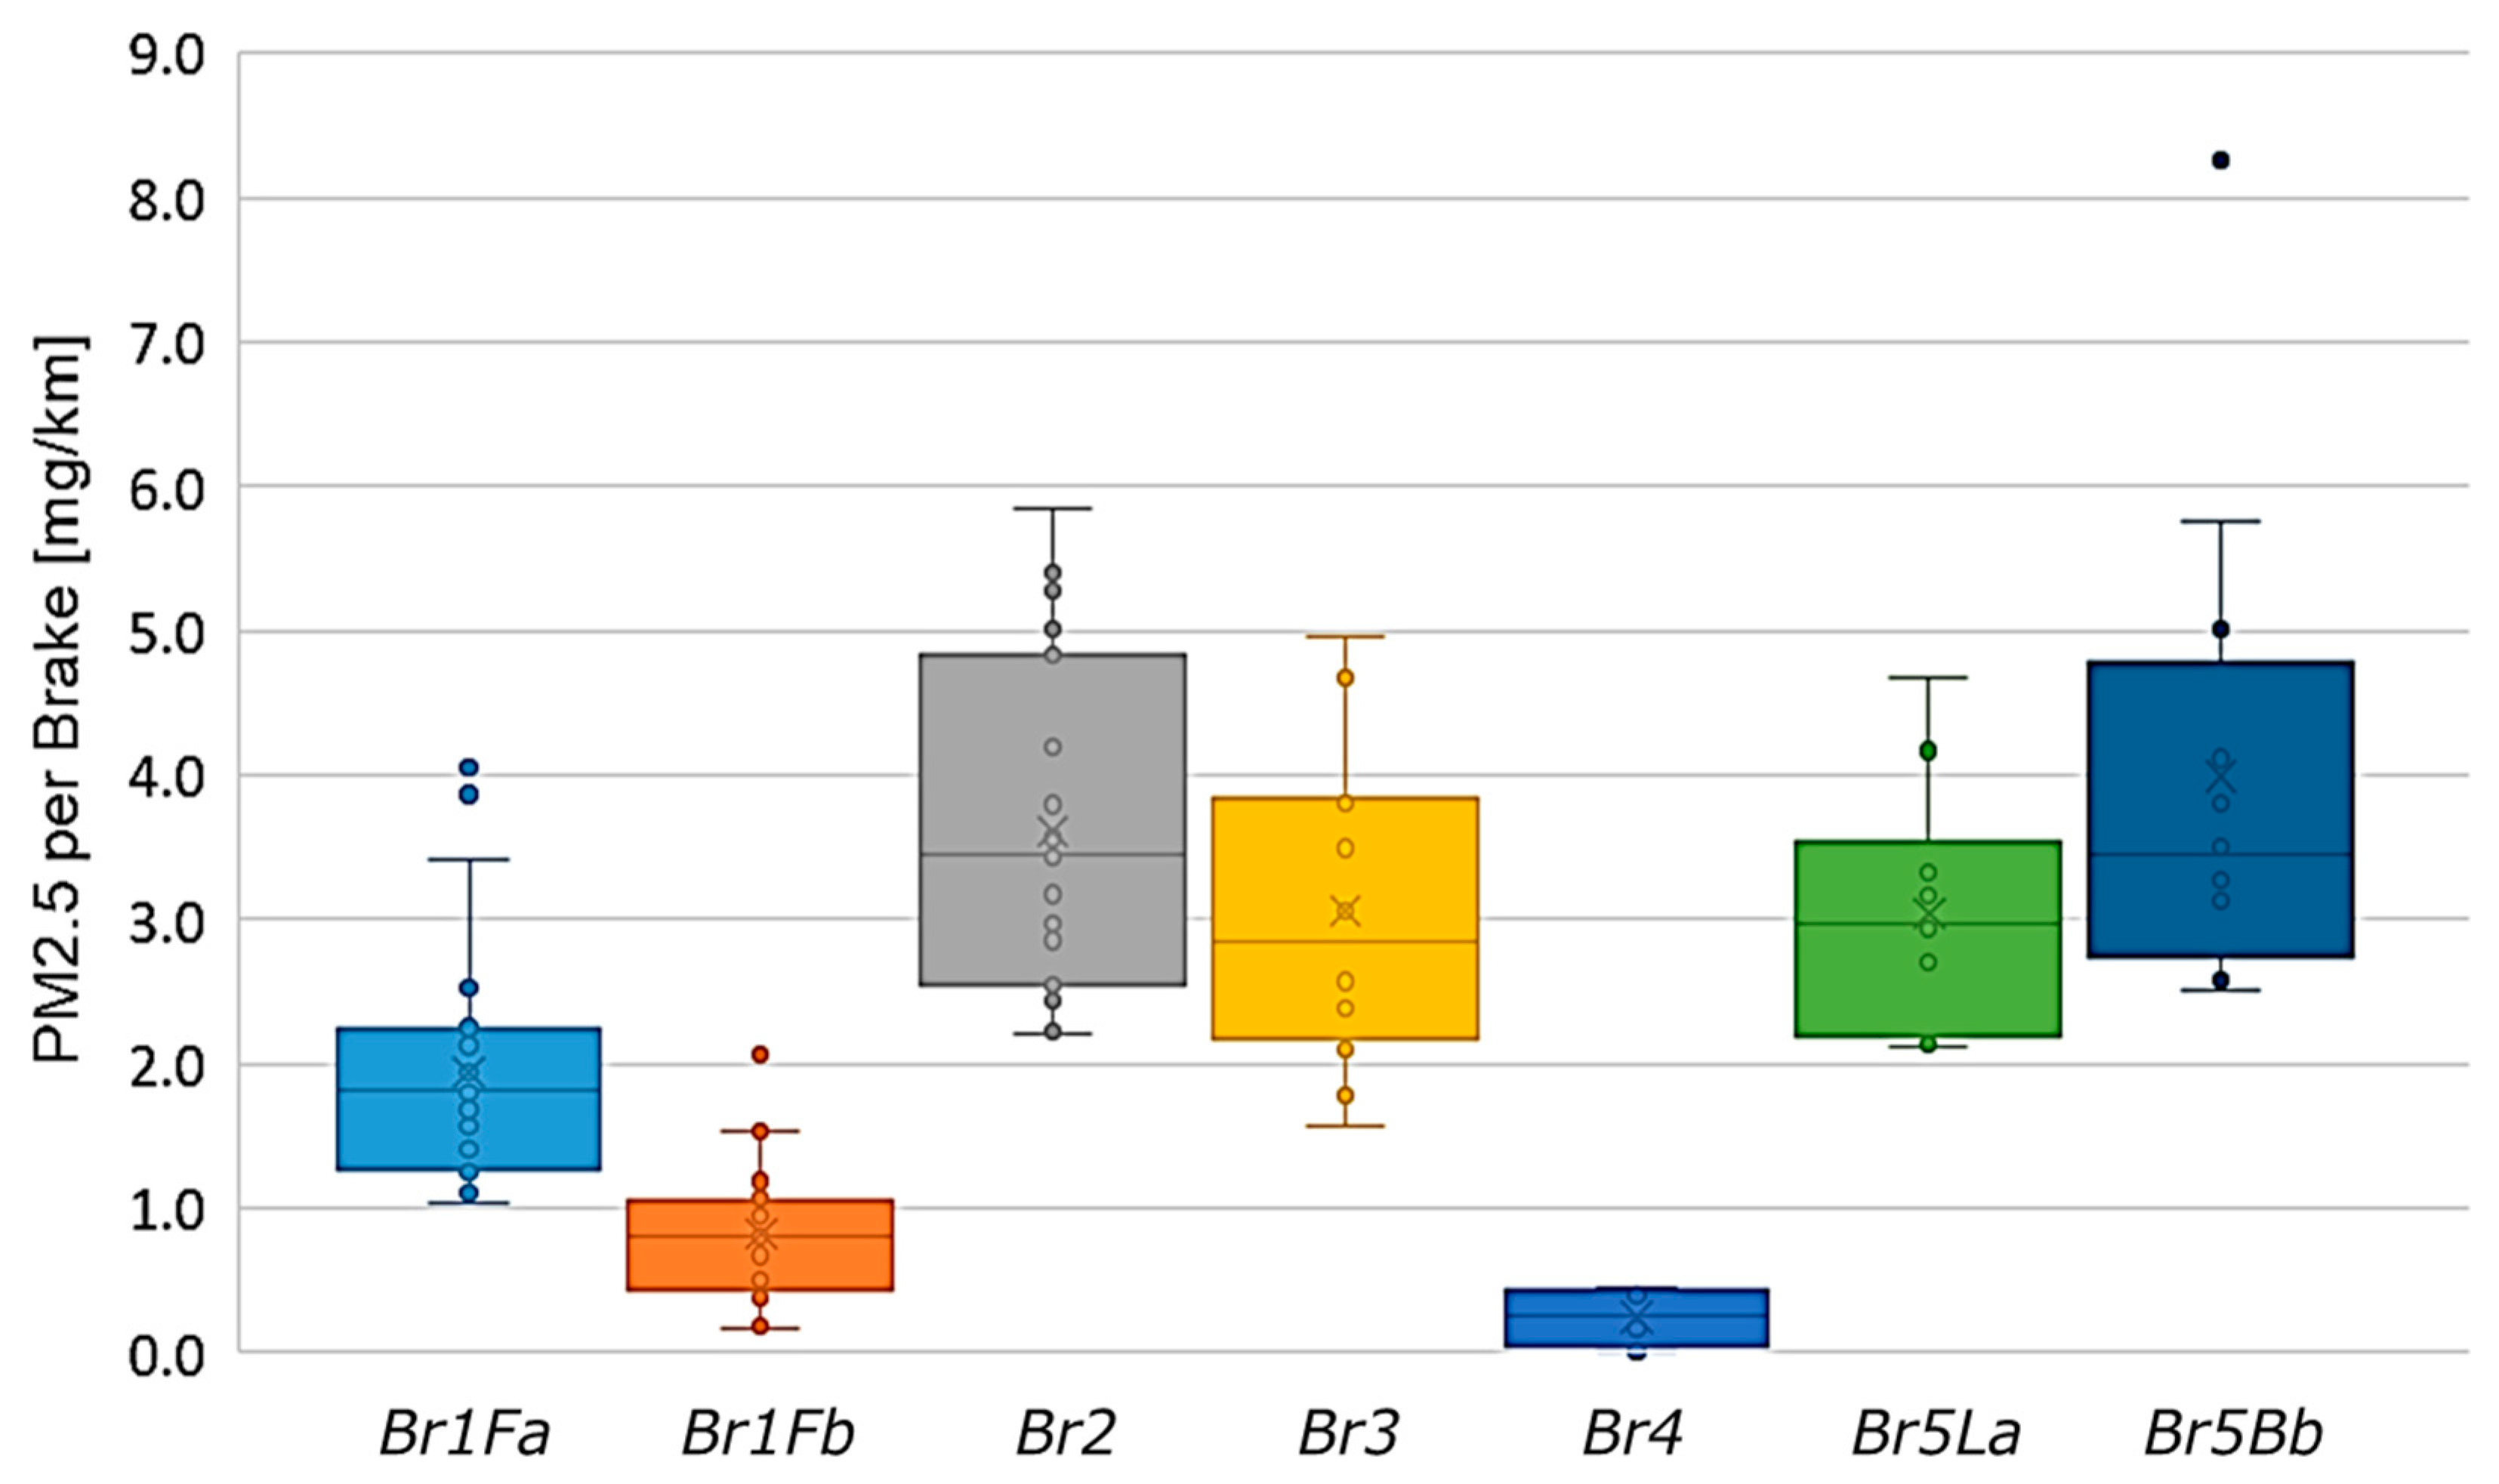
3.2. PM2.5 Emission Measurements

Figure 3 provides an overview of the PM2.5 measurement results for all brakes and testing facilities. It includes data points from 34, 31, 26, 16, 12, 10, and 12 emission tests for Br1Fa, Br1Fb, Br2, Br3, Br4, Br5La, and Br5Lb, respectively.
PM2.5 emissions of the reference Br1Fa varied between 1.0 mg/km and 4.0 mg/km per brake with the two highest values being identified as outliers. The average PM2.5 emissions of the reference brake were 1.9 mg/km per brake (including the outliers). Br1Fb emitted at least twice as low as PM2.5, averaging 0.8 mg/km per brake, which is similar to values reported in the literature [12]. Br2 had the highest average PM2.5 emissions followed by Br3. Their average PM2.5 was 3.6 mg/km and 3.1 mg/km per brake, respectively. Br4 (drum brake) emitted the lowest PM2.5 averaging close to 0.3 mg/km per brake. Finally, Br5La emitted as high as the “bigger vehicle” category brakes averaging 3.0 mg/km per brake. Similar to PM10, the 36% increase in the testing load resulted in a 33% increase in the PM2.5 emissions with Br5Lb, which averaged 4.0 mg/km per brake.

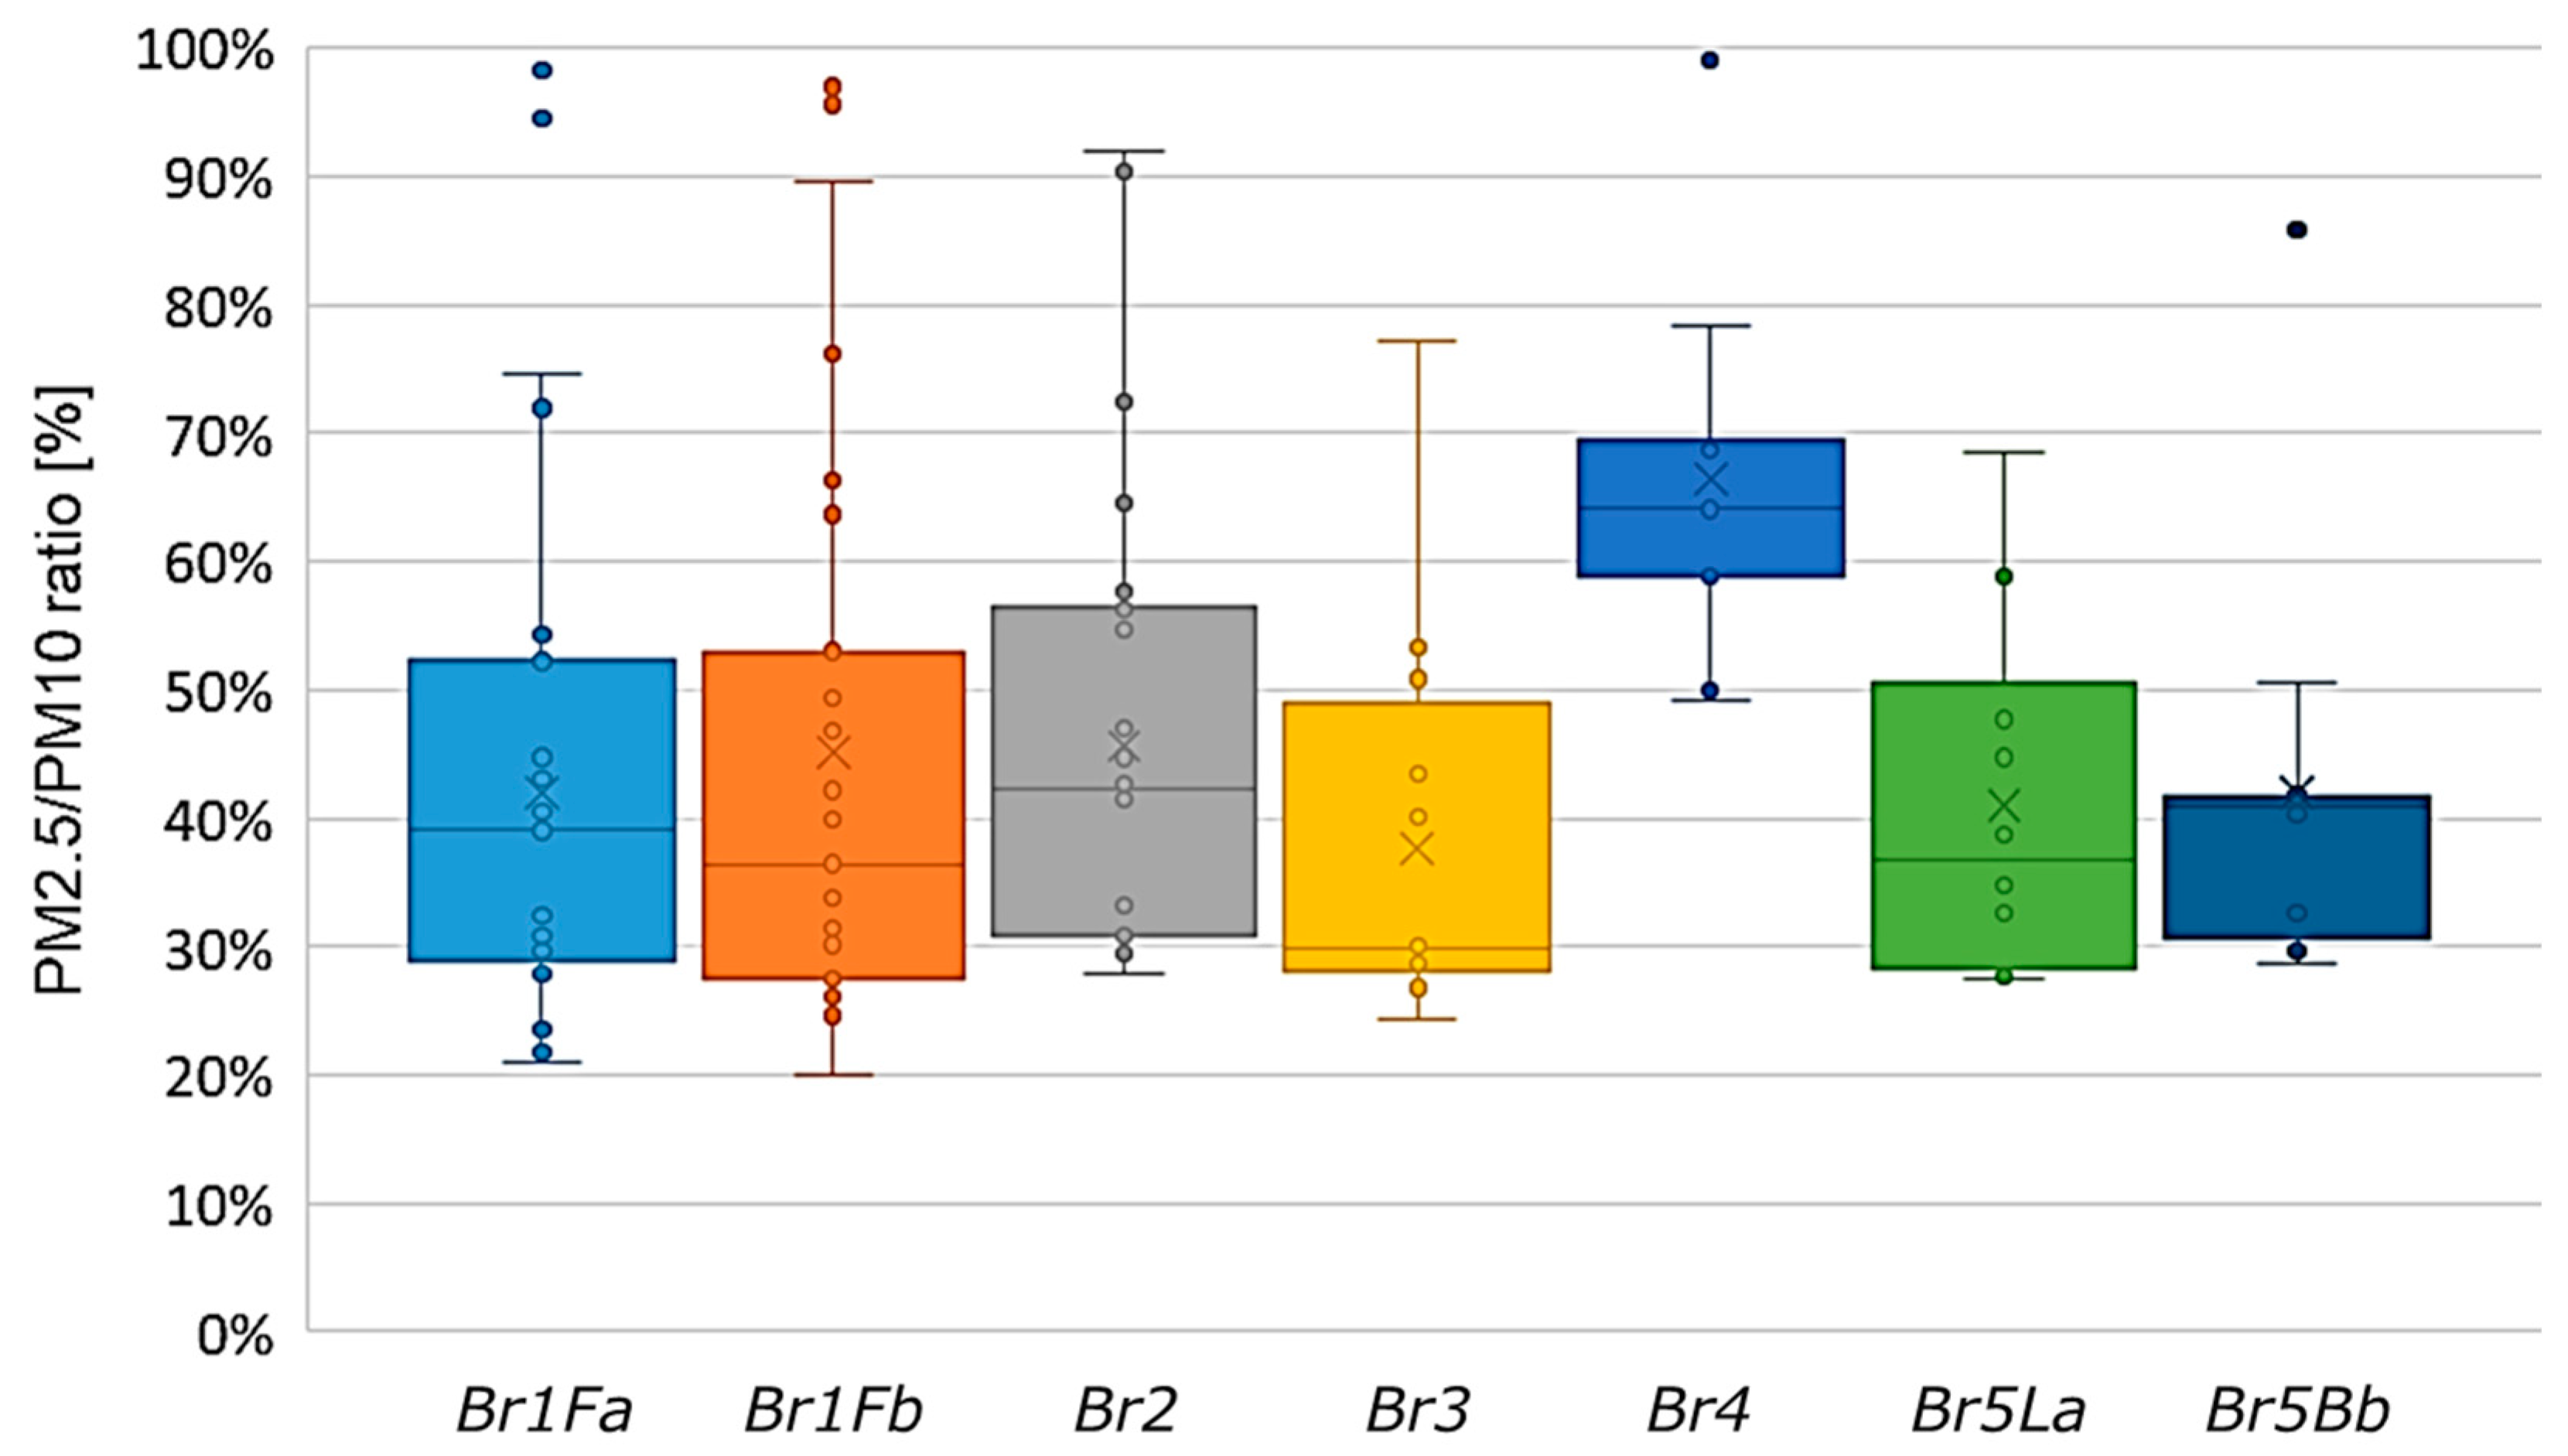
3.3. PM2.5 to PM10 Ratio

Figure 4 provides an overview of the PM2.5 to PM10 emissions ratio for all tested brakes. It includes data points from 34, 31, 26, 16, 11, 10, and 12 emission tests for Br1Fa, Br1Fb, Br2, Br3, Br4, Br5La, and Br5Lb, respectively. The study of the PM2.5 to PM10 emissions ratio allows for a better understanding of the PM emissions distribution of different brakes to the fine and coarse size fractions and provides indication for possible errors in the measurements.
The average PM2.5 to PM10 ratio varied between 37–45% for all disc brake systems indicating that a significant part of PM10 falls in the fine-size particle fraction. Similar findings have been reported by Hesse et al. [14] for a wide variety of brake systems. The reference brake and its NAO counterpart exhibited an average PM2.5/PM10 ratio of 42–45% with slightly higher values being observed with the NAO-based system. Very similar values were observed for Br2 and Br5 under both tested loads (41–45%) indicating a similar emissions behaviour for all disc brakes tested in the ILS. Br3 resulted in the lowest averaged PM2.5 to PM10 ratio; however, this was with minor difference compared to other disc brakes (38%). It is noteworthy that the drum brake exhibited a significantly higher PM2.5 to PM10 ratio (61%). This indicates that smaller particles were more capable to escape out of the drum and travel to the sampling point compared to larger particles. However, overall PM emissions of the drum brake were much lower than those of disc brakes; therefore, in absolute terms, it was the best-performing brake in terms of PM2.5 emissions.

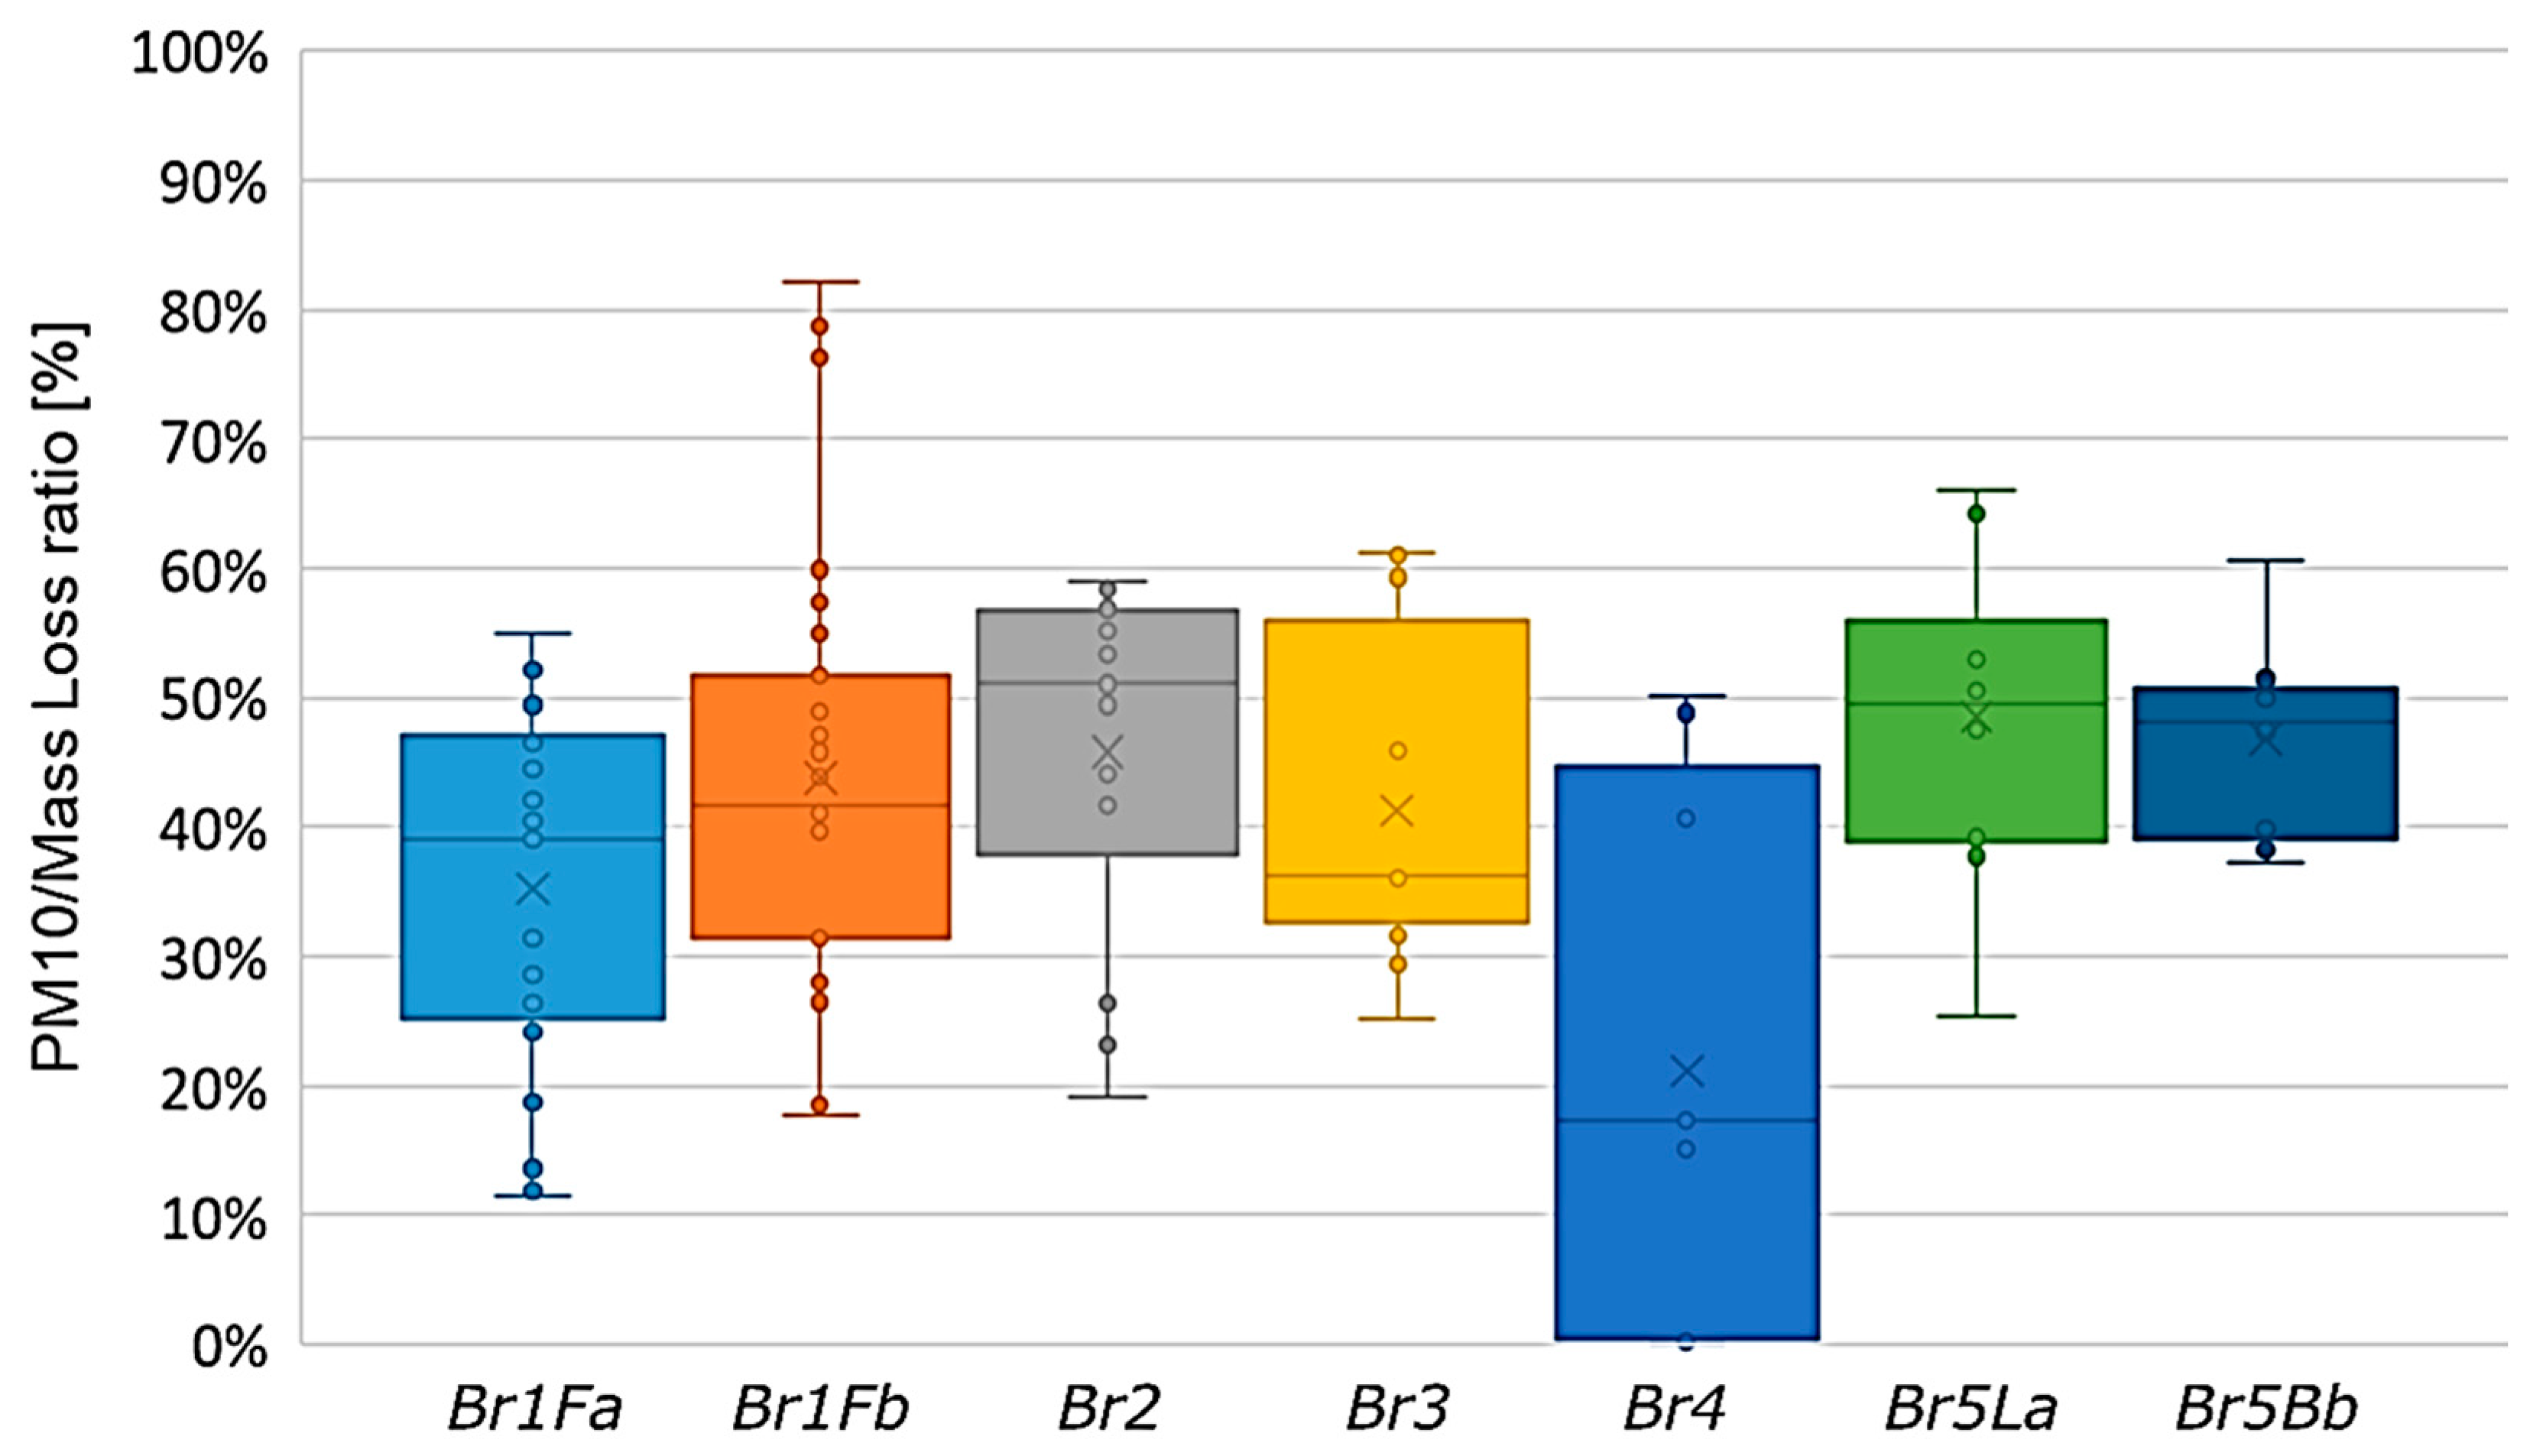
3.4. PM10 to Mass Loss Ratio

Figure 5 provides an overview of the PM10 to total mass loss ratio for all tested brakes. Mass loss was measured by some testing facilities over the entire testing procedure. The mass loss rate for each brake was calculated by dividing the total measured mass loss by the total distance covered throughout the entire testing procedure, including cooling air adjustment, bedding, and emissions measurement. Bedding is expected to be associated with higher mass loss rates compared to the actual emission tests. However, the overall mass loss rate can be considered as a good approximation and may provide useful information for identifying possible issues with the PM measurements. Figure 5 includes data points from 29, 27, 22, 12, 9, 10, and 9 emission tests for Br1Fa, Br1Fb, Br2, Br3, Br4, Br5La, and Br5Lb, respectively.
The average PM10 to mass loss ratio varies between 35–49% for the disc brake systems indicating that a significant part of brake wear falls outside the PM10 size fraction (particle sizes bigger than 10 μm) or gets lost before being measured. These ratios are well in-line with those reported in several studies in the literature (approximately 40%) as summarized by [1]; however, it has to be noted that brake systems and testing conditions are not directly comparable. Furthermore, cooling and bedding sections have been included in the mass loss measurement—this may have resulted in a slight differentiation of the actual mass loss behaviour of the brake. The reference brake exhibited an average PM10 to mass loss ratio of 35%. This was the lowest PM10 to mass loss ratio among the disc brake systems. Somewhat higher ratios were observed for all other disc brake systems (41–48%). The drum brake data indicated a significantly lower PM10 to mass loss ratio averaging at 21%. This was expected as bigger particles are captured in the brake. However, it needs to be noted that the number of valid measurements with the drum brake is low; therefore, no safe conclusion can be drawn. Additionally, Lab F reported ratios lower than 0.5%, raising questions about the validity of their measurements. When Lab F is excluded from the calculation the average ratio was calculated to be 31.6%; however, the uncertainty in this figure remains high due to limited number of data points. It is noteworthy that the PM10 to mass loss ratio found in this study for the drum brake is still higher compared to what has been reported in the literature for other drum brake systems (approximately 5%) [11,12].

4. Discussion

4.1. PM Measurement Repeatability

Table 6 provides information regarding the PM10 and PM2.5 measurement repeatability for each testing facility and tested brake. The PM10 and PM2.5 measurement repeatability provide a first indication regarding each testing facility’s ability to carry out PM measurements successfully. The CoV of the three PM measurements of each test are used to assess each testing facility’s repeatability. Asterisks in Table 6 denote the cases where testing facilities accumulated mass from the three emission measurement cycles on one filter; therefore, it was not possible to assess the repeatability in such cases. N/A corresponds to brakes not tested by the testing facility or a parameter not measured by the testing facility for a given brake.
Regarding PM10, it is observed that most testing facilities were able to repeat the tests with success. The CoV for the reference brake was always below 10%, except for Lab H, which exhibited a high variability with all tested brakes. More specifically, 8 out of 12 testing facilities exhibited high repeatability with CoV lower than 5%. Br1Fb exhibited higher variation compared to Br1Fa; however, the emissions were also much lower. A total of 5 out of 11 testing facilities exhibited high repeatability (CoV < 5%) for Br1Fb, whereas Labs M and H did not perform repeatable measurements. Similarly, Br2 PM10 measurements were highly repeatable in eight testing facilities, whereas only Labs H and R failed to repeat PM10 emission measurements successfully. Br3, Br5La, and Br5Lb PM10 measurements were repeatable with some exceptions where the CoV reached 20%. Finally, PM10 measurements of the drum brake Br4 were performed successfully only by Labs M and N; however, the emission levels were very low (0.5 mg/km per brake). Results indicate that Labs D and F failed to perform repeatable PM10 measurements with the drum brake most probably because the measurement reached the noise level of their gravimetric procedures.
Most testing facilities were able to repeat PM2.5 measurements with the reference brake successfully (Table 6). The coefficient of variation for the reference brake was below 10% except for Labs H and M. Lab H followed the trend observed with PM10 and exhibited PM2.5 measurements with high variability for all tested brakes. On the other hand, Lab M seems to have carried out two outlying measurements with Br1Fa. Higher variability was observed with the reference brake’s NAO counterpart. In this case, Lab T demonstrated the highest coefficient of variation, whereas Labs H, J, and L exhibited relatively low repeatability (coefficients of variation > 10%) for this low emitting brake. PM2.5 measurements with Br2 were highly repeatable in six testing facilities, whereas Labs H, M, and R failed to repeat the measurements successfully. Issues with low PM2.5 measurement repeatability were also observed for brakes Br3, Br5La, and Br5Lb. More specifically, Lab M exhibited high coefficients of variation for all three brakes, whereas other testing facilities demonstrated low repeatability for one or two of these brakes. Finally, PM2.5 measurements of the drum brake Br4 were highly repeatable only in Lab N. On the other hand, data indicate that Lab F failed to perform repeatable measurements with the drum brake.
The overall good repeatability of the PM measurements for most testing facilities indicates an adequate pre-conditioning of all tested brakes with the applied method. A similar conclusion was drawn after investigating the PN emissions measured during the ILS [28]. Therefore, the PMP decided to mandate five repetitions of the WLTP-Brake cycle for bedding all brake systems in the GTR. Additionally, the stability at the PM emission levels of the tested brakes after the sixth cycle indicate that one emissions measurement test is adequate for regulatory purposes. Therefore, the GTR does not include a provision for repeating the emissions measurement three times as in the ILS.

4.2. PM2.5 to PM10 and PM10 to Mass Loss Ratio

As mentioned previously, the study of the PM2.5 to PM10 and the PM10 to mass loss ratio allows for an analysis of the PM emissions distribution of different brakes to the fine and coarse size fractions. Additionally, the study of the two ratios provides indications for possible errors in the measurements by the different testing facilities and can be used along with the measurement repeatability to assess each testing facility’s ability to carry out PM measurements successfully. Table 7 presents the average PM2.5 to PM10 emission ratios reported by the testing facilities with each tested brake (where applicable). Table 7 also provides the average PM10 to mass loss ratios reported by the testing facilities with each tested brake (where applicable).
Some testing facilities exhibited systematically increased PM2.5 to PM10 emission ratios compared to the averages. For example, Lab C measured PM2.5 to PM10 of 54%, 65%, and 77% for Br1Fa, Br2, and Br3, respectively. For Br3, this is 40% higher than the average over all testing facilities. Lab R measured PM2.5 to PM10 at 75% and 57% for Br1Fa and Br3, respectively. For the reference brake, this is approximately 30% higher than the average over all testing facilities. Lab H systematically overestimated the PM2.5 to PM10 ratio compared to the average of all labs with values ranging between 88–92%. In all cases, increased PM2.5 to PM10 ratios can be attributed to underestimation of PM10 emissions by the aforementioned testing facilities probably due to high losses of particles in the coarse size fraction. This is discussed in more detail in the next paragraph. In some cases, there are indications of possible underestimation of the PM2.5 to PM10 emission ratio. For example, Lab L measured PM2.5 to PM10 of 23%, 28%, 31%, and 29% for Br1Fa, Br1Fb, Br2, and Br3, respectively, while Lab S reported PM2.5 to PM10 of 23%, 26%, 30%, and 26% for Br1Fa, Br1Fb, Br2, and Br3, respectively. However, these values are much closer to the overall averages compared to the deviations observed in the upper part of the PM2.5 to PM10 distribution. This is also reflected in Figure 4 where all outliers are attributed to the upper part of the figure towards higher PM2.5 to PM10 ratios.
Some testing facilities experienced low PM10 to mass loss ratios compared to the averages of all labs. Lab K measured PM10 to mass loss of 19%, 29%, and 24% for Br1Fa, Br1Fb, and Br2, respectively. This is 15–20% lower than the average reported by the testing facilities. Lab P measured PM10 to mass loss of 13% for Br1Fa. This is approximately 20% lower than the average over all testing facilities. Lab H systematically underestimated the PM10 to mass loss ratio compared to the average of all labs with values ranging between 21–23%. In general, low PM10 to mass loss ratios can be attributed to underestimation of PM10 emissions by the aforementioned testing facilities probably due to high losses of particles in the coarse size fraction. This is discussed in more detail later in the paper. On the other hand, Lab F measured PM10 to mass loss of 53%, 79%, 58%, and 61% for Br1Fa, Br1Fb, Br2, and Br3, respectively. These values are higher than the averages by up to 35% (Br1Fb) and indicate an overestimation of the PM10 fraction; however, statistically, they are not classified as outliers.

4.3. PM Transport and Extraction Losses

In general, it is expected that the testing facilities experience particle losses at four stages: in the enclosure mainly due to recirculation zones and long residence times; in the tunnel while particles are transferred from the enclosure’s exit to the sampling probe’s inlet; while entering the sampling probe due to possible anisokinetic and/or anisoaxial sampling (noting that it could also lead to overestimating and not only underestimating emissions); and in the PM sampling system while particles travel though sampling tubes towards the filter holder. Particle losses in the enclosure have not been examined in this paper; however, certain specifications on airflow, brake test setup, and enclosure geometry have been defined in the GTR to harmonize measurements among all testing facilities [27]. Isokinetic sampling is examined and discussed below. Additionally, tunnel and PM sampling losses for 10 μm particles are evaluated. Two main loss mechanisms are considered for the tunnel and the PM sampling system: gravitational and inertial losses. Other types of losses (e.g., thermophoretic) are considered non-relevant or negligible for PM measurements.
The isokinetic ratio is defined as the ratio of air velocity in the nozzle to the air velocity in the duct. Figure 6 presents the calculated PM10 isokinetic ratio for Br1Fa, Br1Fb, and Br2 with the aim of providing an indication regarding the testing facilities’ capacity to perform isokinetic sampling. The isokinetic ratio is calculated using the average tunnel flow and the average PM sampling flow reported by the labs over the WLTP-Brake cycle for the given brake. It has to be noted that this calculation introduces an error compared to the more correct isokinetic definition of mean nozzle velocity to approximately maximum tunnel velocity (at the position of the probe/nozzle). However, this error is expected to be small due to the turbulent flow in the tunnel and the small difference between max and mean velocities.
It is shown in Figure 6 that most testing facilities respected the set values for isokinetic sampling (0.9–1.15). Only Lab T systematically sampled at a lower isokinetic ratio of 0.80–0.83 resulting in a possible slight PM10 overestimation, in agreement with the lower-than-average PM2.5/PM10 ratio (Table 7). Lab C tested Br2 at a high ratio of 1.48–1.49 for all three repetitions resulting in a possible PM10 underestimation, as indicated by the higher-than-average PM2.5/PM10 ratio (Table 7). It has to be noted that no specifications were defined for the measurement of the tunnel air flow rate. As a result, the testing facilities applied different flow measurement method (flow vs. speed), flow measurement position (upstream or downstream of the sampling plane), and flow measurement accuracy (not always within ±5%). Thus, the calculation of the isokinetic ratio comes with a relative uncertainty. Additionally, all labs were requested to place the sampling probe at least five tunnel inner diameters downstream of the enclosure to ensure a fully developed velocity profile. Lab K did not follow this specification (Table 4). The proposed GTR defines clear specifications for all these parameters minimizing the risk of an inaccurate isokinetic ratio calculation. Similar values for the isokinetic ratio were observed for PM2.5 sampling; therefore, there is no added value in presenting and analysing PM2.5 isokinetic ratio data as similar conclusions are drawn. In any case, the impact of anisokinetic sampling is lower for smaller particles. Overall, it seems that the labs managed to fulfil the isokinetic requirements; therefore, the investigation for possible particle losses shall focus on other parts of the layout. The effect of anisoaxial sampling has not been investigated since all testing facilities declared sampling at an aspiration angle lower than 15°, a requirement that can easily be fulfilled even without using a level. This specification has also been introduced in the GTR [27].
Table 8 provides a summary of the theoretical losses for 10 μm particles assuming a 1 m horizontal duct with a 90 degrees bend. It covers inertial losses per m of horizontal duct and inertial deposition per 90 degrees bend. The calculation has been performed for all testing facilities using the tunnel and sampling tube inner diameters and the applied tunnel and sampling air flows with the application of the expressions described in [30]. Calculations have been carried out for the operating conditions employed for the reference brake as it was the only brake tested by all facilities. As seen in Table 8, gravitational losses in the tunnel are expected to be very low at the typical ILS operating conditions (<1%). This applies also to ducts longer than the 1 m assumed for the calculations when a maximum of one 90° bend is applied. On the other hand, inertial losses can become more relevant when small diameter tunnels are combined with relatively high tunnel flow rates (e.g., Lab F and Lab H). In any case, inertial losses in the tunnel are generally low (<20%) and do not raise significant concern considering that the typical mass size distribution peaks at 5–7 μm [8]. A minimum tunnel diameter of 175 mm and a maximum of one 90° bend have been mandated in the GTR proposal to keep possible particle losses in the tunnel at minimum levels.
Table 8 shows that tubing losses in the PM sampling system are of higher concern. Gravitational losses of up to 20% are rather typical for most tube diameter—sampling flow combinations tested during the ILS. Again, 20% losses for 10 μm particles is considered an acceptable level as the overall losses of the PM10 fraction are expected to be much lower given the typical mass size distributions. On the other hand, inertial losses can become very critical in tubes even with only one 90° bend. Indeed, inertial losses are very high for some of the systems: Labs C, H, and P experienced losses between 61–97% for 10 μm particles that compromised the PM10 fraction measurement, as noted for the high PM2.5/PM10 ratio of these labs (Table 7). High inertial losses in the tubing are a result of combining small inner diameters with very high flows. An optimization taking into account gravitational losses is required. Indeed, certain limitations regarding the PM sampling tubing have been introduced in the GTR. These are combined with specifications in the design of the nozzles and the probes aiming in minimizing particle losses mainly at the bigger particle size range [27].

4.4. PM Measurement Reproducibility

4.4.1. Overall PM Measurement Reproducibility

Table 9 provides information regarding the PM10 and PM2.5 measurement reproducibility for all tested brakes. Data from all testing facilities have been considered (unfiltered data). The CoV of all PM measurements for each brake were used to assess the reproducibility of the measurements among the testing facilities (typically the term between laboratories variance is used). Data from Labs B and Q have not been included following their request, as explained in the Materials and Methods section.
The PM10 measurement reproducibility ranged between 17% and 54%, while the PM2.5 measurement reproducibility was at similar levels and ranged between 28% and 52%. In most cases, the CoV was approximately 30–35% indicating the need for further restricting and harmonising the testing protocol. Of course, one needs to take into account that most testing facilities failed to follow the agreed technical specifications (Table 5); thus, resulting in a deteriorated variability. Br1Fb exhibited the highest PM10 and PM2.5 measurement reproducibility among all brakes. It is noteworthy that Br1Fb’s emissions behaviour is different compared to the other tested brakes; therefore, it is discussed separately later in the article. The drum brake demonstrated a relatively low variability despite its very low PM emission levels. This demonstrates the potential of the proposed method to measure accurately very low PM emission levels. Finally, Br5La and Br5Lb exhibited a very satisfactory PM10 reproducibility at the level of 17%. One explanation for the difference with other brakes relates to the fact that three out of the four laboratories that tested these brakes (Labs F, M, N) were among those with the fewest “non-compliances” with the defined protocol (Table 5). This is confirmed when the PM10 reproducibility for all brakes is checked for this subset of laboratories—i.e., the PM10 reproducibility for the reference Br1Fa is 23% (instead of 35% with all data included).

4.4.2. PM Measurement Reproducibility after Data Filtering

Table 10 shows the PM10 and PM2.5 measurement reproducibility for all tested brakes after carrying out a high-level filtering. The filtering is based on the most important non-compliances and the analysis of PM losses described in the previous paragraph. Information from each testing facility’s repeatability of the PM measurements and from the PM2.5 to PM10 and PM10 to mass loss ratios has also been used to identify testing facilities that encountered issues during the measurement campaign.
Emissions data from Labs C, D, H, K, P, and R were excluded from this part of the analysis (high-level filtering) for different reasons. More specifically, data from Lab D were filtered out since there were substantial errors with the correct execution of the WLTP-Brake cycle (speed violations and shorter cycle duration) and issues with missing data in the submitted Time-Based files (1Hz data file reporting all measured parameters). The lack of data did not allow for a correct calculation of the tunnel airflow, and thus the final PM10 emission factor. On the other hand, Labs C and R accumulated PM data of three emission measurements on one filter; thus, not allowing for a direct comparison of PM emissions with the other testing facilities. Labs C, H, and P exhibited a high level of inertial losses in the PM sampling line (61–97%—Table 8) resulting in low PM emission levels compared to the average values. For example, Labs C, H, and P reported PM10 of 2.2 mg/km, 3.1 mg/km, and 2.8 mg/km per brake for the reference brake, whereas the unfiltered average of all testing facilities for this brake was 5.0 mg/km per brake. Finally, Lab K carried out the PM sampling right at the exit of the enclosure. The flow at the exit of the enclosure is highly chaotic due to high turbulent flow passing through a varying cross-sectional area (outlet transition) before entering the sampling tunnel. PM sampling from this turbulent non-developed flow can induce larger variability in the measurements. Indeed, the average PM10 and PM2.5 for the reference brake was reported to be 2.8 mg/km and 1.2 mg/km per brake, respectively, which is almost 40% lower than the unfiltered average of all testing facilities. These figures are also confirmed for the other brakes tested by Lab K. In the cases of Labs C, H, and R, the combination of low PM10 emission levels along with high PM2.5 to PM10 ratio (Table 7) points to high losses in the PM10 fraction, particularly, of coarser particles. On the other hand, for Labs H, K, and P the combination of low PM10 emission levels along with low PM10 to mass loss ratio (Table 7) indicates again high losses of larger particles. For these reasons, the PM10 and PM2.5 measurement reproducibility was also examined without considering the data from these testing facilities (hereafter mentioned as filtered measurement reproducibility).
The filtered PM10 measurement reproducibility ranged between 17% and 62%. For most brakes, the CoV was lower than 30% and close to 20% pointing to a significant improvement when compared to the unfiltered data. This is due to the fact that this analysis considers only the testing facilities that managed to follow most of the agreed technical specifications (Table 5). Only Br1Fb exhibited a very high PM10 measurement reproducibility; however, this is due to the friction material—and not the method’s uncertainty—and is discussed in more detail in the next paragraph. The PM2.5 measurement reproducibility was slightly higher compared to PM10 and ranged between 28% and 47%. In most cases, the CoV was close to 30%, highlighting again the need for further restricting the testing protocol. The PM2.5 measurement reproducibility was negatively influenced by two outliers for Br1Fa (3.9 mg/km and 4.1 mg/km per brake vs. the average of 2.0 mg/km per brake) and one outlier for Br5Lb (8.3 mg/km per brake vs. the average of 4.0 mg/km per brake). These were measurements carried out with inertial impactors collecting a significant amount of PM on the PM10 impaction stage and maybe overestimating PM2.5 due to bouncing phenomena that result in larger particles settling on the PM2.5 impaction stage. The CoV improves significantly when excluding these outlying measurements (Br1Fa from 37% to 25% and Br5Lb from 42% to 28%).

4.5. ECE vs. NAO PM Emissions

4.5.1. NAO Brake PM Emissions

Before discussing the difference between ECE and NAO PM emissions, it is necessary to take a more detailed look into the Br1Fb data. As discussed previously, Br1Fb shows a higher measurement variability compared to the other tested brakes. Table 11 summarises the PM10, PM2.5, and mass loss emission results of Br1Fb from all testing facilities.
Table 11 shows that in total nine testing facilities measured the mass loss of Br1Fb. Three of them (Labs J, M, and N) reported low mass loss values at the range of 1.8 ± 0.2 mg/km per brake (low mass loss group). On the other hand, six testing facilities (Labs D, F, G, K, L, and T) reported almost four times higher mass loss values at the range of 6.5 ± 0.9 mg/km per brake (high mass loss group). The average PM10 and PM2.5 of the low mass loss group is approximately five and three times lower than the average PM10 and PM2.5 of the high mass loss group, respectively. The significant difference in the mass loss and PM emission levels shows that Br1Fb “behaves” as if there were two different brakes. The variability in the tribological properties caused by differences in the production batch has been discussed elsewhere [31]; however, it is questionable whether this applies here since the parts were supposed to be of the same production batch. This results in very low PM10 and PM2.5 reproducibility when all data are treated together.
Figure 7 summarises the PM and mass loss emissions of Br1Fb when using all data together (grey), but also when data is separated into two different groups (blue for the low wear Br1Fb and red for the high wear Br1Fb). The PM10 measurement reproducibility is 23% and 32% for the high- and low-wear Br1Fb, respectively—this is much lower than the 54% discussed in the previous paragraph when all data are considered together. Similarly, the PM2.5 measurement reproducibility is 16% and 37% for the high- and low-wear Br1Fb, respectively. Again, this is much lower than the 52% shown in the previous paragraph. The case of Br1Fb was one of the most important reasons for the PMP to decide to mandate the mass loss measurement in the GTR. It is demonstrated that it provides useful information regarding the tested brake and may prove useful when evaluating the results of a measurement campaign.

4.5.2. ECE vs. NAO PM Emissions

When comparing PM emissions, it is concluded that the ECE brake emits higher PM10 and PM2.5 than its NAO counterpart. This is in line with what is reported in the literature [10,32,33]. When all data are considered (i.e., unfiltered data), the ECE PM10 and PM2.5 are 2.2 and 2.3 times higher compared to the corresponding NAO PM emissions. This difference is less important compared to what has been reported in the literature. More specifically, Hagino et al. [32,34] tested ECE and NAO front brakes over four different cycles—including the WLTP-Brake cycle—and reported approximately 10 and 5 times higher PM10 and PM2.5 emissions, respectively, with the ECE brakes. Robere et al. [33] tested a compact SUV and a mid-size Coupe front brakes over the WLTP-Brake cycle. Production NAO and ECE pads were tested—ECE brakes emitted approximately 4.5 times higher PM10 compared to their NAO counterparts. Agudelo et al. [10] tested the front brakes of three vehicles typical of the US fleet over the CBDC (California Brake Dynamometer Cycle). PM10 of ECE brakes was approximately 1.3 to 5 times higher compared to that of NAO brakes. Similarly, PM2.5 of ECE brakes was approximately 1 to 4 times higher compared to that of NAO brakes.
When the PM emissions data of Br1Fb are treated separately (low mass loss group vs. high mass loss group), the trends change substantially. More specifically, BrF1a emits 5.6 and 2.0 times higher PM2.5 compared to its NAO counterpart when the low and high mass loss groups are considered separately (2.2 times when all data are treated together—unfiltered data as given in Table 9 are considered for Br1FA). Similarly, BrF1a emits 8.6 and 1.6 times higher PM10 compared to Br1Fb when the low and high mass loss groups of the later are treated separately (2.3 times when all data are treated together—unfiltered data as given in Table 9 are considered for Br1FA). These ratios are well within the ranges given in the literature as presented in the previous paragraph. It is obvious that the brake friction material’s variability is an important factor to be considered when trying to define a brake system’s PM emission behaviour.

4.6. PM Emissions and Energy Dissipation

Br5a was tested by four testing facilities under different load conditions. Br5La considered a mass of 1.5 passengers additional to the vehicle’s curb weight, whereas Br5Lb represents a heavily loaded condition of the vehicle (90% payload). This test setup allowed for a high-level investigation of the influence of the dissipated energy to the PM emissions. The testing inertia of Br5Lb was 36% higher compared to Br5La (Table 2). Correspondingly, the kinetic energy dissipated to the brakes was 36% higher for Br5Lb compared to Br5La (15,791 kJ vs. 11,642 kJ). Figure 8 plots PM2.5 and PM10 emissions as a function of the dissipated kinetic energy. A linear regression for both PM2.5 and PM10 is also attempted (blue and red lines) assuming that a zero kinetic energy will result in zero PM emissions.
Figure 8 shows that the increase in the dissipated kinetic energy results in an approximately linear increase in PM2.5 and PM10 emissions. More specifically, increasing the energy by 36% results in an increase in PM2.5 and PM10 emissions by 31% and 23%, respectively (average values of all four laboratories tests). A similar trend has been reported in the literature [18]. Despite it is very difficult to demonstrate linearity with only two data points—and assuming that zero dissipated energy results in zero emissions—the R-squared value is very high for both PM10 and PM2.5. This points to a good linearity between friction energy and PM emissions.

5. Conclusions

An interlaboratory study on LDV brake emissions involved 16 testing facilities with five brake systems measuring average PM10 emissions of 0.5 mg/km to 9.5 mg/km per brake and average PM2.5 emissions of 0.3 mg/km to 4.0 mg/km per brake. The drum brake emitted the lowest PM2.5 and PM10 values due to its enclosed nature. On the other hand, the highest PM2.5 and PM10 were measured with the van brake tested under heavy load conditions. The tested disc brakes exhibited PM10 that correspond to approximately 6.5–27 mg/km at the vehicle level depending—among others—on the brake type and the vehicle configuration.
The majority of the emitted PM10 falls within the coarse size fraction. More specifically, the average PM2.5 to PM10 ratio of the disc brakes varied between 37–45%. The drum brake exhibited a significantly higher PM2.5 to PM10 ratio; thus, indicating that smaller particles escape the drum enclosure in larger quantities compared to coarse size particles. On the other hand, the average PM10 to mass loss of the disc brakes varied between 35–49% demonstrating that a significant part of brake wear falls outside the PM10 size fraction. This seems to be more pronounced with the drum brake, which showed a PM10 to mass loss ratio of 21%.
The PM measurement repeatability for most testing facilities was very good with all tested disc brakes. A generally higher variability was observed with PM10 and PM2.5 measurements of the drum brake due to its very low emission levels. The overall good repeatability of the PM measurements supports the adoption of five repetitions of the WLTP-Brake cycle for bedding brake systems in the GTR. It is also demonstrated that one emissions measurement test is adequate for reporting PM emissions since there is no significant change in the PM emissions with the subsequent measurements.
The PM10 and PM2.5 measurement reproducibility ranged between 17–54% and 28–52%, respectively, reflecting the non-compliance of most testing facilities with the agreed technical specifications. A high-level filtering of the data resulted in a better reproducibility (approximately 20% for most tested brakes); however, the introduction of stricter specifications and harmonisation of the testing protocol is necessary for defining the actual method’s measurement reproducibility. Br1Fb’s high PM measurement reproducibility was attributed to possible differences in the production batch.
It was demonstrated that gravitational and inertial losses in the tunnel were low at the typical ILS operating conditions. On the other hand, tubing losses in the PM sampling system may be significant, specifically when small inner diameters are combined with very high flows. For this reason, the GTR includes limitations regarding the PM sampling tubing combined with specifications in the design of the nozzles and the probes to optimise inertial and diffusional losses. Other types of losses (e.g., thermophoretic) are considered non-relevant or negligible for PM measurements.
The reference ECE brake emitted approximately 1.6–8.6 times higher PM10 and 2.0–5.6 times higher PM2.5 than its NAO counterpart. The high variability in the reported ratios was due to the NAO friction material’s variability and it was demonstrated by the high variability in the total mass loss of the tested brake systems. Finally, testing the van brake under two different payloads demonstrated a good linearity between friction energy and PM emissions. This has been used in the GTR to calculate emissions from electrified vehicles applying correction coefficients to reflect the friction brake usage. More data will be required to prove this correlation for all types of brakes.

Author Contributions

Conceptualization, T.G., M.M., A.M., S.G., R.V. and C.A.; Formal analysis, T.G., M.M. and A.M.; writing—original draft preparation, T.G.; writing—review and editing, B.G., M.M., C.A., S.G. and R.V.; project administration, T.G. and B.G. All authors have read and agreed to the published version of the manuscript.

Funding

This research received no external funding.

Institutional Review Board Statement

Not applicable.

Informed Consent Statement

Not applicable.

Data Availability Statement

Data not available due to confidentiality reasons.

Acknowledgments

The authors thank AUDI AG, Bayerische Motoren Werke AG, Ford-Werke GmbH, Stellantis N.V., Continental AG, DRiV Inc., Brembo S.p.A, and Volkswagen AG for providing the testing brakes. The authors thank M. Arndt (AVL List GmbH), K. Kolbeck and J. Von-Wild (Bayerische Motoren Werke AG), M. Federici (Brembo S.p.A.), M. Morbach and C. Kölsch (DRiV Inc.), J. Grochowicz (Ford-Werke GmbH), G. Kanae Filler and D. Lugovyy (HORIBA Europe GmbH), A. Perez and J. Olive (Applus+ IDIADA), A. Sin and S. Balestra (ITT Inc.), H. Hagino (Japan Automobile Research Institute), A. Hortet (Link Engineering Co.), H. Chong (National Institute of Environmental Research, South Korea), P. Nyhof (TMD Friction Services GmbH), H. Niemann and H. Kaminski (TU DARMSTADT), D. Hesse and C. Hamatschek (TU ILMENAU), and P. Jouy (UTAC France) for their technical support during the ILS.

Conflicts of Interest

The authors declare no conflict of interest.

References

  1. Grigoratos, T.; Martini, G. Brake wear particle emissions: A review. Environ. Sci. Pollut. Res. 2014, 22, 2491–2504. [Google Scholar] [CrossRef] [PubMed] [Green Version]
  2. Hesse, D.; Feißel, T.; Kunze, M.; Bachmann, E.; Bachmann, T.; Gramstat, S. Comparison of Methods for Sampling Particulate Emissions from Tires under Different Test Environments. Atmosphere 2022, 13, 1262. [Google Scholar] [CrossRef]
  3. Rienda, I.C.; Alves, C.A. Road dust resuspension: A review. Atmos. Res. 2021, 261, 105740. [Google Scholar] [CrossRef]
  4. National Emissions Reported to the Convention on Long-range Transboundary Air Pollution (LRTAP Convention). Available online: https://www.eea.europa.eu/ds_resolveuid/f54753b5901e4a8591060bb4ba23c497 (accessed on 1 March 2022).
  5. OECD. Non-Exhaust Particulate Emissions from Road Transport: An Ignored Environmental Policy Challenge; OECD Publishing: Paris, France, 2020. [Google Scholar] [CrossRef]
  6. Grange, S.K.; Fischer, A.; Zellweger, C.; Alastuey, A.; Querol, X.; Jaffrezo, J.-L.; Weber, S.; Uzu, G.; Hueglin, C. Switzerland’s PM10 and PM2.5 environmental increments show the importance of non-exhaust emissions. Atmos. Environ. X 2021, 12, 100145. [Google Scholar] [CrossRef]
  7. Piscitello, A.; Bianco, C.; Casasso, A.; Sethi, R. Non-exhaust traffic emissions: Sources, characterization, and mitigation measures. Sci. Total Environ. 2021, 766, 144440. [Google Scholar] [CrossRef] [PubMed]
  8. Grigoratos, T.; Martini, G. Non-Exhaust Traffic-Related Emissions-Brake and Tyre Wear PM: Literature Review; Publications Office: Mercier, Luxembourg, 2014; Available online: https://data.europa.eu/doi/10.2790/21481 (accessed on 1 March 2022).
  9. Chasapidis, L.; Grigoratos, T.; Zygogianni, A.; Tsakis, A.; Konstandopoulos, A.G. Study of Brake Wear Particle Emissions of a Minivan on a Chassis Dynamometer. Emiss. Control. Sci. Technol. 2018, 4, 271–278. [Google Scholar] [CrossRef] [Green Version]
  10. Agudelo, C.; Vedula, R.T.; Collier, S.; Stanard, A. Brake Particulate Matter Emissions Measurements for Six Light-Duty Vehicles Using Inertia Dynamometer Testing. SAE Int. J. Adv. Curr. Prac. Mobil. 2020, 2, 994–1019. [Google Scholar] [CrossRef]
  11. Hagino, H.; Oyama, M.; Sasaki, S. Laboratory testing of airborne brake wear particle emissions using a dynamometer system under urban city driving cycles. Atmospheric Environ. 2016, 131, 269–278. [Google Scholar] [CrossRef] [Green Version]
  12. Hagino, H.; Oyama, M.; Sasaki, S. Airborne brake wear particle emission due to braking and accelerating. Wear 2015, 334–335, 44–48. [Google Scholar] [CrossRef]
  13. Liu, Y.; Wu, S.; Chen, H.; Federici, M.; Perricone, G.; Li, Y.; Lv, G.; Munir, S.; Luo, Z.; Mao, B. Brake wear induced PM10 emissions during the world harmonised light-duty vehicle test procedure-brake cycle. J. Clean. Prod. 2022, 361, 0959–6526. [Google Scholar] [CrossRef]
  14. Hesse, D.; Hamatschek, C.; Augsburg, K.; Weigelt, T.; Prahst, A.; Gramstat, S. Testing of Alternative Disc Brakes and Friction Materials Regarding Brake Wear Particle Emissions and Temperature Behavior. Atmosphere 2021, 12, 436. [Google Scholar] [CrossRef]
  15. Farwick zum Hagen, F.H.F.; Mathissen, M.; Grabiec, T.; Hennicke, T.; Rettig, M.; Grochowicz, J.; Vogt, R.; Benter, T. Study of Brake Wear Particle Emissions: Impact of Braking and Cruising Conditions. Environ. Sci. Technol. 2019, 53, 5143–5150. [Google Scholar] [CrossRef] [PubMed]
  16. Mamakos, A.; Arndt, M.; Hesse, D.; Augsburg, K. Physical Characterization of Brake-Wear Particles in a PM10 Dilution Tunnel. Atmosphere 2019, 10, 639. [Google Scholar] [CrossRef] [Green Version]
  17. Mamakos, A.; Kolbeck, K.; Arndt, M.; Schröder, T.; Bernhard, M. Particle Emissions and Disc Temperature Profiles from a Commercial Brake System Tested on a Dynamometer under Real-World Cycles. Atmosphere 2021, 12, 377. [Google Scholar] [CrossRef]
  18. Kolbeck, K.; Schröder, T.; Schlichting, M.; Bacher, H. Evaluation of Different Influencing Parameters on the Result of Brake Particle Emission Measurements. EB2022-FBR-011. EuroBrake 2022–17-19.05.2022. Fundamental Properties & Influencing Factors of Brake Particulate Emissions. Available online: https://doi.org/10.46720/eb2022-fbr-011 (accessed on 1 March 2022).
  19. EMEP/EEA air pollutant emission inventory guidebook 2019. Available online: https://www.eea.europa.eu/publications/emep-eea-guidebook-2019 (accessed on 1 March 2022).
  20. Mellios, G.; Ntziachristos, L. Non-exhaust emissions: Evaporation & Brake wear control. Available online: https://circabc.europa.eu/sd/a/1c0efc15-8507-4797-9647-97c12d82fa28/AGVES-2021-04-08-EVAP_Non-Exh.pdf (accessed on 1 March 2022).
  21. ECE/TRANS/WP.29/2021/150. Request for Authorization to Develop a New UN GTR on Brake Particulate Emissions. In Proceedings of the United Nations Economic Commission for Europe-Inland Transport Committee-World Forum for Harmonization of Vehicle Regulations. 185th Session, Geneva, Switzerland, 23–25 November 2021; Available online: https://unece.org/transport/documents/2023/01/informal-documents/clean-pmp-proposal-amend-ecetranswp29grpe20234 (accessed on 1 March 2022).
  22. GRBP-75-39-Rev.1. (EC and France) Terms of Reference of the Task force on Tyres’ abrasion (TF TA). Available online: https://unece.org/transport/documents/2022/02/informal-documents/ec-and-france-terms-reference-task-force-tyres (accessed on 1 March 2022).
  23. COM(2022) 586-Proposal for a Regulation on Type-Approval of Motor Vehicles and Engines and of Systems, Components and Separate Technical Units Intended for such Vehicles, with Respect to their Emissions and Battery Durability (Euro 7). Directorate-General for Internal Market, Industry, Entrepreneurship and SMEs. Available online: https://single-market-economy.ec.europa.eu/sectors/automotive-industry/environmental-protection/emissions-automotive-sector_en (accessed on 1 March 2022).
  24. PMP Web Conference 15.07.2021. PMP Brake Protocol-Testing Specifications-Minimum specifications for measuring and characterizing brake emissions. Transport-Vehicle Regulations-UNECE Wiki. Available online: https://wiki.unece.org/display/trans/PMP+Web+Conference+15.07.2021 (accessed on 1 March 2022).
  25. Mathissen, M.; Grochowicz, J.; Schmidt, C.; Vogt, R.; Zum Hagen, F.H.F.; Grabiec, T.; Steven, H.; Grigoratos, T. A novel real-world braking cycle for studying brake wear particle emissions. Wear 2018, 414–415, 219–226. [Google Scholar] [CrossRef]
  26. PMP Web Conference 29.03.2022. PMP Item 2bi-ILS Introduction.pdf, PMP Item 2bii-Checklist-High Level Analysis.pdf, PMP Item 2biii-Time Based Files-High Level Analysis.pdf, PMP Item 2biv-Event-Based Files Overview ILS-BMW.pdf, PMP Item 2bv-PM overview ILS.pdf, PMP Item 2bvi-ILS-Preliminary Analysis.pdf. Transport-Vehicle Regulations-UNECE Wiki. Available online: https://wiki.unece.org/display/trans/PMP+Web+Conference+29.03.2022 (accessed on 1 March 2022).
  27. GRPE-2023-4e. Clean-(PMP) Proposal to amend ECE/TRANS/WP.29/GRPE/2023/4. Proposal for a New UN GTR on Laboratory Measurement of Brake Emissions for Light-Duty Vehicles. Available online: https://unece.org/transport/documents/2023/01/informal-documents/clean-pmp-proposal-amend-ecetranswp29grpe20234 (accessed on 1 March 2022).
  28. Mathissen, M.; Grigoratos, T.; Gramstat, S.; Mamakos, A.; Vedula, R.T.; Agudelo, C.; Grochowicz, J.; Giechaskiel, B. Interla-boratory Study on Brake Particle Emissions-Part II: Particle number emissions. Atmosphere 2023, 14, 424. [Google Scholar] [CrossRef]
  29. Grigoratos, T.; Agudelo, C.; Grochowicz, J.; Gramstat, S.; Robere, M.; Perricone, G.; Sin, A.; Paulus, A.; Zessinger, M.; Hortet, A.; et al. Statistical Assessment and Temperature Study from the Interlaboratory Application of the WLTP–Brake Cycle. Atmosphere 2020, 11, 1309. [Google Scholar] [CrossRef]
  30. Kulkarni, P.; Baron, P.A.; Willeke, K. Aerosol Measurement: Principles, Techniques, and Applications, 3rd ed.; Wiley: Hoboken, NJ, USA, 2011; ISBN 9780470387412. [Google Scholar]
  31. Gramstat, S.; Mertens, T.; Waninger, R.; Lugovyy, D. Impacts on Brake Particle Emission Testing. Atmosphere 2020, 11, 1132. [Google Scholar] [CrossRef]
  32. PMP 50th Session 03-04.04.2019. Hiroyuki Hagino. Sensitivity and Reproducibility of Brake Wear Particle Emission Measurements using JARI System. Transport-Vehicle Regulations-UNECE Wik. Available online: https://wiki.unece.org/display/trans/PMP+50th+Session (accessed on 1 March 2022).
  33. PMP 50th Session 03-04.04.2019. Matt Robere. Exploratory Brake Emissions benchmarking-A design of experiments. Transport -Vehicle Regulations-UNECE Wiki. Available online: https://wiki.unece.org/display/trans/PMP+50th+Session (accessed on 1 March 2022).
  34. Hagino, H. Investigation of Brake Wear Particle Emissions from Different Disc Brake Friction Components and Urban Driving Cycles Using a JASO C 470 Methodology. EB2020-FBR-019. EuroBrake 17–21 May 2021. Brake Emissions Macroscopic Part 1. Available online: https://www.fisita.com/library/eurobrake/2021/2694eb2020-fbr-019 (accessed on 1 March 2022).
Figure 1. Overview of the layout based on which the testing facilities carried out brake emissions testing during the ILS. The illustration of certain elements (e.g., flow measurement device, calliper orientation, positioning of HEPA filter, and use of flow-splitting for PN measurement) is indicative.
Atmosphere 14 00498 g001
Figure 2. Overview of the PM10 measurement results for all brakes. The minimum, first quartile, median (denoted with the horizontal line), average (denoted with the “×”), third quartile, and maximum statistical variables are included in the chart. No outliers were detected.
Atmosphere 14 00498 g002
Figure 3. Overview of the PM2.5 measurement results for all brakes. The minimum, first quartile, median (denoted with the horizontal line), average (denoted with the “×”), third quartile, and maximum statistical variables are included in the chart. Outliers are denoted, too.
Atmosphere 14 00498 g003
Figure 4. Overview of the PM2.5 to PM10 emissions ratio for all brakes. The minimum, first quartile, median (denoted with the horizontal line), average (denoted with the “×”), third quartile, and maximum statistical variables are included in the chart. Outliers are denoted, too.
Atmosphere 14 00498 g004
Figure 5. Overview of the PM10 to mass loss ratio for all brakes. The minimum, first quartile, median (denoted with the horizontal line), average (denoted with the “×”), third quartile, and maximum statistical variables are included in the chart. No outliers were detected.
Atmosphere 14 00498 g005
Figure 6. Isokinetic ratio for PM10 sampling with Br1Fa, Br1Fb, and Br2. Data for all three repetitions of the PM10 measurement are plotted. Lab D’s isokinetic ratio was not able to be calculated due to errors in the submitted files.
Atmosphere 14 00498 g006
Figure 7. PM and mass loss emissions of Br1Fb. The error bars represent the standard deviation of all measurements.
Atmosphere 14 00498 g007
Figure 8. PM2.5 and PM10 emissions as a function of the dissipated kinetic energy. The solid blue and red lines identify the ideal regression lines for PM10 and PM2.5, respectively.
Atmosphere 14 00498 g008
Table 1. Main characteristics of tested brakes. WL/DM = Wheel load/Disc mass. ECE refers to European performance brake pads. NAO refers to non-asbestos organic brake pads.
Brake IDAxleVehicle
Test Mass
[kg]
Vehicle
Type
[-]
Test
Inertia
[kg·m2]
Rolling
Radius
[mm]
Friction
Material
WL/DM
Ratio
[-]
Br1FaFront1600M1 (Sedan)49.3315ECE88.1
Br1FbFront1600M1 (Sedan)49.3315NAO88.1
Br2Front1668M1 (Sedan)50.8321ECE44.6
Br3Front2623M1 (SUV)112.1383ECE50.7
Br4Rear1253M1 (Compact)16.1314-44.7
Br5LaFront2500N1 (Van)86.7345ECE90.1
Br5LbFront3390N1 (Van)117.6345ECE122.1
Table 2. Minimum system specifications applied at the ILS.
SpecificationRequirement
Cooling air conditioning20 ± 2 °C and 50 ± 5% RH
Cooling air filterH13 or higher
Cooling airflow measurement pointUpstream or downstream of the sampling plane
Cooling airflow measurement minimum requirement5% of set point throughout the emissions measurement section (see below Phase 3)
Brake rotation with respect to the cooling airflow
-
Clockwise (CW) for flow left-to-right
-
Counter-clockwise (CCW) for flow right-to-left
Disc/Drum brake temperature measurementEmbedded thermocouples
Calliper position
-
Between 1 and 2 o’clock if brake rotation CW
-
Between 10 and 11 o’clock if brake rotation CCW
Sampling plane location
-
≥5d 1 downstream of the last flow disturbance
-
≥2d 1 upstream of the last flow disturbance
1 d represents the inner diameter of the sampling tunnel.
Table 3. Main characteristics of PM-related instrumentation used at the ILS.
PM Sampling DeviceDuct
Diameter
[mm]
PM10 Nozzle Inner
Diameters
[mm]
PM2.5 Nozzle Inner
Diameters
[mm]
Flow Split
Angle
(If applied)
[⁰]
Filter TypeMicrobalance Resolution
[μg]
Lab BMulti-stage
Impactor
1606.2–7.2 *6.2–7.2 *N/AAL + TCGF10.0
Lab CCyclone35523.519.0N/ATCGF0.1
Lab DCyclone2537.3N/AN/ABorosilicate
GF
10.0
Lab FCyclone PM10 +
Impactor PM2.5
108.37.57.590PTFE + TCGF0.1
Lab GCyclone1505.5–9.5 *5.5–9.5 *20TCGF0.1
Lab HMulti-stage
Impactor
1256.06.0N/APTFE10.0
Lab JMulti-stage
Impactor
1507.1–8.2 *7.1–8.2 *N/AAL + GF0.1
Lab KImpactor30015.7–17.9 *15.7–17.9 *20TCGF1.0
Lab LCyclone1754.04.0N/ATCGF1.0
Lab MMulti-stage
Impactor
1504.2–6.7 *4.2–6.7 *N/APTFE–Coated AL1.0
Lab NCyclone1507.8–9.5 *7.8–9.5 *20PTFE1.0
Lab PMulti-stage
Impactor
1508.78.7N/APTFE + Coated AL1.0
Lab QMulti-stage
Impactor
14814.114.1N/ATCGF + Coated AL0.1
Lab RImpactor1509.59.520PTFE1.0
Lab SCyclone2195.05.0N/APTFE0.1
Lab TCyclone1604.04.0N/ATCGF10.0
* A range is provided because different nozzle sizes were used depending on the testing brake and the applied cooling airflow. AL = aluminium; GF = Glass-fibre; PTFE = Polytetrafluoroethylene polymer; TCGF = Teflon-coated glass fibre.
Table 4. Final execution status of the ILS test matrix.
Lab/BrakeBr1FaBr1FbBr2Br3Br4Br5LaBr5Lb
Lab B
Lab C
Lab D
Lab F
Lab GX
Lab H
Lab J
Lab K
Lab L
Lab M
Lab NX
Lab PXX
Lab Q
Lab RX
Lab S
Lab T
Table 5. Most important deviations from the ILS specifications.
LabNon-Compliance
Lab BIssues with the correct execution of the cycle (speed violations); Non-compliance with the dynamometer environmental conditions; Microbalance resolution not according to the specifications; Problems with isokinetic requirements; Filters conditioning outside the specifications; Non-appropriate impactor substrate coating; Pre-classifier cut-point outside the specifications; Airflow deviations beyond defined value
Lab CNon-compliance with the dynamometer environmental conditions (only RH); Calliper orientation outside the specifications; Issues with the correct execution of the cycle (lower friction work); Airflow measurement location; Use of one filter for three repetitions of PM10 and PM2.5
Lab DIssues with the correct execution of the cycle (speed violations and duration); Issues with the submission of the Time-Based file; Non-compliance with the dynamometer environmental conditions; Microbalance resolution not according to the specifications; Calliper orientation outside the specifications; Filters conditioning not according to the specifications; Absence of PM2.5 measurement
Lab FNon-compliance with the dynamometer environmental conditions (only RH); Disc rotation direction not according to the specifications; Calliper orientation outside the specifications; Weighing room outside the defined specifications; PM flow split angle outside the defined value
Lab GIssues with the correct execution of the cycle (initial trips temperature); Airflow measurement location; Airflow deviations beyond the defined value
Lab HWeighing room outside the defined specifications; No use of charge neutralizer; Microbalance resolution not according to the specifications; Filters conditioning not according to the specifications
Lab JWeighing room outside the defined specifications; Non-appropriate impactor substrate coating; Filters conditioning not according to the specifications
Lab KCalliper orientation outside the specifications; Sampling plane location outside the specifications (0D); No use of recommended impactor substrates
Lab LCalliper orientation outside the specifications; Sampling plane location outside the specifications (5.5D); Weighing room outside the defined specifications; Airflow measurement location; Airflow deviations beyond defined value
Lab MCalliper orientation outside the specifications; Filters conditioning not according to the specifications; Weighing room outside the defined specifications
Lab NN/A
Lab PIssues with the correct execution of the cycle (initial trips temperature); Calliper orientation outside the specifications; Airflow measurement location; Issues with the correct execution of the cycle (lower friction work)
Lab QIssues with the correct execution of the cycle (first 0.7 s missed for every braking event); Non-appropriate sampler/filter combination; Flow rate deviation beyond defined value; Issues with the enclosure design
Lab RIssues with the correct execution of the cycle (initial trips temperature); No use of charge neutralizer; Pre-classifier cut-point outside the specifications; Use of one filter for three repetitions of PM10
Lab SWeighing room outside the defined specifications
Lab TIssues with the correct execution of the cycle (initial trips temperature); Microbalance resolution not according to the specifications; Bedding not according to the specifications
Table 6. PM10 and PM2.5 measurement repeatability. Green cells indicate very good repeatability (CoV ≤ 5%), while red cells indicate not good repeatability (CoV > 10%). Asterisks denote testing facilities that accumulated the mass from the three PM emission measurements on one filter. N/A denotes brakes not tested by the testing facility or a parameter not measured by the testing facility for a given brake.
Br1FaBr1FbBr2Br3Br4Br5LaBr5Lb
PM10 repeatability [%]Lab C****N/AN/AN/A
Lab D9.015.22.7N/A104.5N/AN/A
Lab F2.83.61.41.788.33.21.1
Lab G2.31.1N/AN/AN/A0.310.6
Lab H41.716.722.6N/AN/AN/AN/A
Lab J3.210.93.6N/AN/AN/AN/A
Lab K2.48.82.2N/AN/AN/AN/A
Lab L1.75.91.90.3N/AN/AN/A
Lab M3.824.82.413.511.12.117.4
Lab N2.22.6N/A11.49.022.13.3
Lab P9.4N/AN/AN/AN/AN/AN/A
Lab R*N/A21.6N/AN/AN/AN/A
Lab S3.51.02.89.3N/AN/AN/A
Lab T6.44.33.4N/A17.2N/AN/A
PM2.5 repeatability [%]Lab C****N/AN/AN/A
Lab DN/AN/AN/AN/AN/AN/AN/A
Lab F2.46.85.51.2119.12.42.1
Lab G5.53.9N/AN/AN/A7.446.1
Lab H51.117.823.8N/AN/AN/AN/A
Lab J6.313.15.5N/AN/AN/AN/A
Lab K2.96.15.0N/AN/AN/AN/A
Lab L7.617.92.23.9N/AN/AN/A
Lab M29.12.014.617.815.624.524.0
Lab N1.12.6N/A18.64.829.33.8
Lab P7.5N/AN/AN/AN/AN/AN/A
Lab R*N/A16.0N/AN/AN/AN/A
Lab S4.45.30.514.8N/AN/AN/A
Lab T6.725.14.4N/A25.0N/AN/A
Table 7. Average PM2.5 to PM10, and PM10 to mass loss ratios. Asterisks denote testing facilities that did not measure PM2.5 or mass loss; therefore, the ratio is not available.
Br1FaBr1FbBr2Br3Br4Br5LaBr5Lb
PM2.5 to PM10 ratio [%]Lab C54.349.464.577.1N/AN/AN/A
Lab D***N/A*N/AN/A
Lab F30.126.530.429.359.127.929.4
Lab G29.935.3N/AN/AN/A36.853.3
Lab H88.394.191.2N/AN/AN/AN/A
Lab J40.065.642.5N/AN/AN/AN/A
Lab K45.038.756.5N/AN/AN/AN/A
Lab L23.127.930.828.9N/AN/AN/A
Lab M44.558.830.544.862.440.243.8
Lab N41.748.7N/A45.665.957.341.4
Lab P53.9N/AN/AN/AN/AN/AN/A
Lab R74.6N/A56.9N/AN/AN/AN/A
Lab S22.926.230.426.2N/AN/AN/A
Lab T31.028.245.0N/A56.3N/AN/A
Average41.945.145.637.660.941.042.0
PM10 to Mass loss ratio [%]Lab C****N/AN/AN/A
Lab D28.539.042.9N/A*N/AN/A
Lab F53.379.057.560.50.348.948.0
Lab G45.441.1N/AN/AN/A53.054.0
Lab H21.4*22.8N/AN/AN/AN/A
Lab J40.343.654.7N/AN/AN/AN/A
Lab K19.228.623.7N/AN/AN/AN/A
Lab L*48.550.536.1N/AN/AN/A
Lab M51.638.251.339.746.562.5*
Lab N26.918.3N/A28.716.834.138.5
Lab P12.8N/AN/AN/AN/AN/AN/A
Lab R*N/A*N/AN/AN/AN/A
Lab S****N/AN/AN/A
Lab T45.457.457.1N/A*N/AN/A
Average35.243.845.841.321.248.546.8
Table 8. Calculation of 10 μm particle losses in the tunnel, and the PM sampling tube as a factor of the tunnel and tube inner diameters (D), and the tunnel and sampling flow (Q)—VSettling = 0.00304 m/s, pair = 1.2 kg/m3, μ = 1.83 × 10⁻⁵ Pa·s, Lref = 1 m, 1 bend of 90°, tRelaxation = 0.00031 s.
LabD
[mm]
Q
[lpm]
Re
[-]
ZStokes (10 μm)0.5Gravitational Losses
[%]
Inertial Losses
[%]
Tunnel LossesLab C35580052,4040.0040.0440.50.9
Lab D25380073,5310.0030.0740.32.4
Lab F108.3491.8105,5900.0020.2060.217.1
Lab G150473.773,4360.0030.1240.36.6
Lab H125818.3152,2360.0010.2140.218.4
Lab J150593.191,9470.0020.1390.38.2
Lab K3001636126,8120.0020.0810.22.9
Lab L175950126,2360.0020.1390.28.3
Lab M15027342,3220.0050.0940.63.9
Lab N15046371,7780.0030.1230.46.4
Lab P15054083,7150.0020.1320.37.5
Lab R15025038,7570.0050.0900.73.5
Lab S21982887,9200.0020.0930.33.8
Lab T160750.4109,0620.0020.1420.28.5
PM sampling LossesLab C126575580.0260.4973.068
Lab D9.651014460.1380.2701626
Lab F16.516.714120.1420.1561718
Lab G12.716.518130.1100.2301318
Lab H6.253066970.0300.8994.097
Lab J21.33019650.1020.1431213
Lab K122529070.0690.3088.026
Lab L10811160.1790.2292125
Lab M101013950.1430.25617 *24
Lab N12.71516480.1210.2191419
Lab P103041860.0480.4446.061
Lab R15.416.414860.1350.1721617
Lab S10811160.1790.2292125
Lab T10811160.1790.2292125
* Theoretical gravitational losses are overestimated. Lab’s M layout was vertical without any bends; therefore, sampling with gravity.
Table 9. PM10 and PM2.5 measurement reproducibility without applying any data filtering (all data considered). The row “count” denotes the number of emission tests used to calculate the CoV.
Br1FaBr1FbBr2Br3Br4Br5LaBr5Lb
PM10Average
[mg/km]
5.02.28.98.70.57.79.4
St. Dev.
[mg/km]
1.81.23.12.90.21.31.6
Count
[#]
3734291691012
CoV
[%]
35543534311717
PM2.5Average
[mg/km]
1.90.83.63.10.33.04.0
St. Dev.
[mg/km]
0.80.41.11.10.10.91.7
Count
[#]
3431261691012
CoV
[%]
42523234332842
Table 10. PM10 and PM2.5 measurement reproducibility after data filtering. The row “count” denotes the number of emission tests used to calculate the CoV.
Br1FaBr1FbBr2Br3Br4Br5LaBr5Lb
PM10Average
[mg/km]
6.02.310.79.10.57.79.4
St. Dev.
[mg/km]
1.21.42.02.50.21.31.6
Count
[#]
2424171591012
CoV
[%]
19621827311717
PM2.5Average
[mg/km]
2.00.73.83.10.33.04.0
St. Dev.
[mg/km]
0.70.31.21.00.10.91.7
Count
[#]
2424171591012
CoV
[%]
37473233332842
Table 11. PM10, PM2.5, and mass loss emission results of Br1Fb from all testing facilities. Orange cells denote testing facilities that measured high mass loss. Green cells denote testing facilities that measured low mass loss. ± indicates the standard deviation of the three measurements–mass loss measurements were one-off. Asterisks denote testing facilities not carried out emissions or mass loss measurement for this brake. N/A indicates measurements not repeated three times as defined in the protocol.
LabPM2.5
[mg/km per Brake]
PM10
[mg/km per Brake]
Mass Loss
[mg/km per Brake]
Br1FbLab C0.7 ± N/A1.4 ± N/A*
Lab D*2.5 ± 0.46.3
Lab F1.1 ± 0.14.2 ± 0.25.3
Lab G1.0 ± 0.02.9 ± 0.07.0
Lab H1.7 ± 0.31.8 ± 0.3*
Lab J0.5 ± 0.10.7 ± 0.11.6
Lab K0.8 ± 0.12.2 ± 0.27.6
Lab L1.0 ± 0.23.5 ± 0.27.3
Lab M0.4 ± 0.00.7 ± 0.21.8
Lab N0.2 ± 0.00.4 ± 0.02.0
Lab P***
Lab R***
Lab S0.7 ± 0.02.7 ± 0.0*
Lab T0.9 ± 0.23.1 ± 0.15.4
Disclaimer/Publisher’s Note: The statements, opinions and data contained in all publications are solely those of the individual author(s) and contributor(s) and not of MDPI and/or the editor(s). MDPI and/or the editor(s) disclaim responsibility for any injury to people or property resulting from any ideas, methods, instructions or products referred to in the content.

