
Study on Spatial Changes in PM2.5 before and after the COVID-19 Pandemic in Southwest China

1
Faculty of Geography, Yunnan Normal University, Kunming 650500, China
2
Key Laboratory of Resources and Environmental Remote Sensing, Universities in Yunnan, Kunming 650500, China
3
Center for Geospatial Information Engineering and Technology of Yunnan Province, Kunming 650500, China
*
Author to whom correspondence should be addressed.
Atmosphere 2023, 14(4), 671; https://doi.org/10.3390/atmos14040671
Submission received: 10 February 2023
/
Revised: 23 March 2023
/
Accepted: 30 March 2023
/
Published: 31 March 2023
(This article belongs to the Special Issue Air Pollution in China (2nd Edition))
Abstract
:Coronavirus disease 2019 (COVID-19) swept the world at the beginning of 2020, and strict activity control measures were adopted in China’s concentrated and local outbreak areas, which led to social shutdown. This study was conducted in southwest China from 2019 to 2021, and was divided into the year before COVID-19 (2019), the year of COVID-19 outbreak (2020), and the year of normalization of COVID-19 prevention and control (2021). A geographically and temporally weighted regression (GTWR) model was used to invert the spatial distribution of PM2.5 by combining PM2.5 on-site monitoring data and related driving factors. At the same time, a multiple linear regression (MLR) model was constructed for comparison with the GTWR model. The results showed that: (1) The inversion accuracy of the GTWR model was higher than that of the MLR model. In comparison with the commonly used PM2.5 datasets “CHAP” and “ACAG”, PM2.5 inverted by the GTWR model had higher data accuracy in southwest China. (2) The average PM2.5 concentrations in the entire southwest region were 32.1, 26.5, and 28.6 μg/m3 over the three years, indicating that the society stopped production and work and the atmospheric PM2.5 concentration reduced when the pandemic control was highest in 2020. (3) The winter and spring of 2020 were the relatively strict periods for pandemic control when the PM2.5 concentration showed the most significant drop. In the same period of 2021, the degree of control was weakened, and the PM2.5 concentration showed an upward trend.
1. Introduction
The coronavirus disease 2019 (COVID-19) broke out at the beginning of 2020 and caused widespread concern. On 11 March 2020, the World Health Organization (WHO) declared COVID-19 as a pandemic and projected that 40% to 60% of the world’s population will be infected with the virus [1]. COVID-19 posed enormous social, economic, environmental, and health challenges to the world [2,3,4,5]. Many regions adopted measures that restricted human activities to curb the spread of the pandemic [6,7,8,9,10], such as the first “lockdown” measures in Wuhan, China [11,12,13,14,15]. These restrictions in human activities have led to a significant reduction in pollutant emissions, and the area controlled by human activities can be used as a natural experiment area to evaluate the impact on atmospheric pollution in the context of emission reduction [16,17,18,19].
Studies have shown that atmospheric particulate matter can be used as a vector to transmit the virus, and its concentration is a powerful predictor of the incidence of COVID-19 [20,21,22]. For every 10 μg/m3 increase in PM2.5 and PM10 concentrations, the lethality of COVID-19 increases by 0.24% and 0.26%, respectively [23,24]. Therefore, the knowledge of the spatial concentration variation characteristics of atmospheric particulate matter during the special period of COVID-19 has important implications for understanding the impact on atmospheric particulate pollution and human health in the context of emission reduction.
After the outbreak of COVID-19, the level of air pollution in many countries and regions was reduced to a certain extent [25,26,27,28,29,30]. Studies in Europe [31,32,33], America [34,35,36], Asia [37,38,39], and other countries and regions showed that air pollution levels significantly decreased during COVID-19 control. For instance, Richard et al. [40] combined urban air quality monitoring networks, satellite monitoring, traffic activities, and road transport emission models to compare the concentrations of PM2.5, NOX, and CO in the Santiago Metropolitan Area of Chile from March to May 2020 and compared the results with those of the same period from 2017 to 2019. These authors showed that the concentrations of PM2.5, NOX, and CO decreased by 11%, 54%, and 13%, respectively. Jesse et al. [41] compared county-level pollutant concentrations in the United States with the same historical period, and found that PM2.5 and NO2 concentrations significantly decreased during COVID-19 control in more densely populated urban counties as compared with rural counties.
Some scholars divide China’s epidemic control period into multiple stages and analyzed the changes in air pollution at different stages [42,43,44,45,46]. For example, In 2020, Zhao et al. [47] divided the control period in the Beijing–Tianjin–Hebei region into four stages, namely, the uncontrolled period (1 to 23 January), the initial control stage (24 January to 19 February), the intermediate control stage (20 February to 30 April), and the late control stage (1 to 31 May). These authors analyzed the changes in air pollution at each stage and found that the air quality index (AQI) of five pollutants (PM2.5, PM10, SO2, NO2, and CO) showed a general downward trend from the initial control stage to the late control stage. In the Guanzhong Plain of China, Zhang et al. [48] divided the eight months after the onset of COVID-19 into six control stages, and constructed a multi-scale geographic spatiotemporal weighted regression model based on variables such as aerosol optical depth (AOD), meteorological factors, and normalized difference vegetation index (NDVI) to simulate changes in PM2.5 concentrations at each stage. The results showed that the concentration of PM2.5 continued to decrease since the beginning of the control and the rate of decline was lower in the subsequent stages.
The reduction in the intensity of human activities after COVID-19 control has made regional air pollution different from normal times, which provides an opportunity to study the impact of human activities on air pollution. As China enters the post-epidemic era, changes in human activities will pose long-term effects on the atmosphere. To prevent the infection of the virus, people will take initiatives to change their living and working habits, such as through telecommuting and online meetings. These changes in behavior will have a long-term positive impact on the atmosphere due to the reduction in pollution.
In China, the research on changes in atmospheric PM2.5 concentration during COVID-19 is mainly concentrated in economically developed cities or regions, and the time scale mainly focuses on the concentrated outbreak time, mostly monthly or weekly short-term periods. Very few studies have investigated the impact of long-term scale control [49,50,51]. Further, the climate change in southwest China is complex, and the influence of different meteorological factors on PM2.5 in different seasons has rarely been considered in existing studies. In this direction, this study used remote sensing to monitor changes in PM2.5 in southwest China before and after the pandemic for three consecutive years (2019–2021) on an annual and quarterly scale, and analyzed changes in air quality in the period before and after the pandemic. The findings of this study can provide a decision-making basis for promoting atmospheric environment governance and formulating pollution prevention and control plans. This study provides useful data support for exploring the coordination and sustainable development between economy and environment in southwest China.
2. Materials and Methods
2.1. Study Area
Southwest China is located between 21°8′ and 33°4′ north latitude and 97°2′ and 110°1′ east longitude, and includes Chongqing (municipality directly under the central government), Sichuan Province, Guizhou Province, and Yunnan Province. It comprises an area of about 1.14 million km2 and accounts for 12% of China’s land area and a permanent population of about 200 million, which comprises 14% of the country’s total population. The study area mainly comprised Hengduan Mountain Range, Sichuan Basin, and the Yunnan–Guizhou Plateau. The Hengduan Mountain Range is dominated by mountains, the Sichuan Basin by plains, hills, and mountains, and the Yunnan–Guizhou Plateau by plateaus, mountain basins, and mountains. The Chengdu–Chongqing urban agglomeration in the east of Sichuan Province and the western part of Chongqing Municipality, the central Yunnan region in Yunnan Province, and the Qianzhong region in Guizhou Province are relatively developed areas in terms of economy, transportation, and industry. The rapid economic development has increased atmospheric problems in southwest China, and there are significant spatial differences in regional air pollution owing to the complex topography, difference in urbanization process, and imbalance in economic development.
The Chengdu–Chongqing area is the fourth largest area with serious haze pollution in China after the Beijing–Tianjin–Hebei urban agglomeration, the eastern Yangtze River Delta urban agglomeration, and the southern Pearl River Delta urban agglomeration. Dali City, Lijiang City, Shangri-La City and Ganzi Prefecture in the northwest region have higher air quality.
2.2. Data
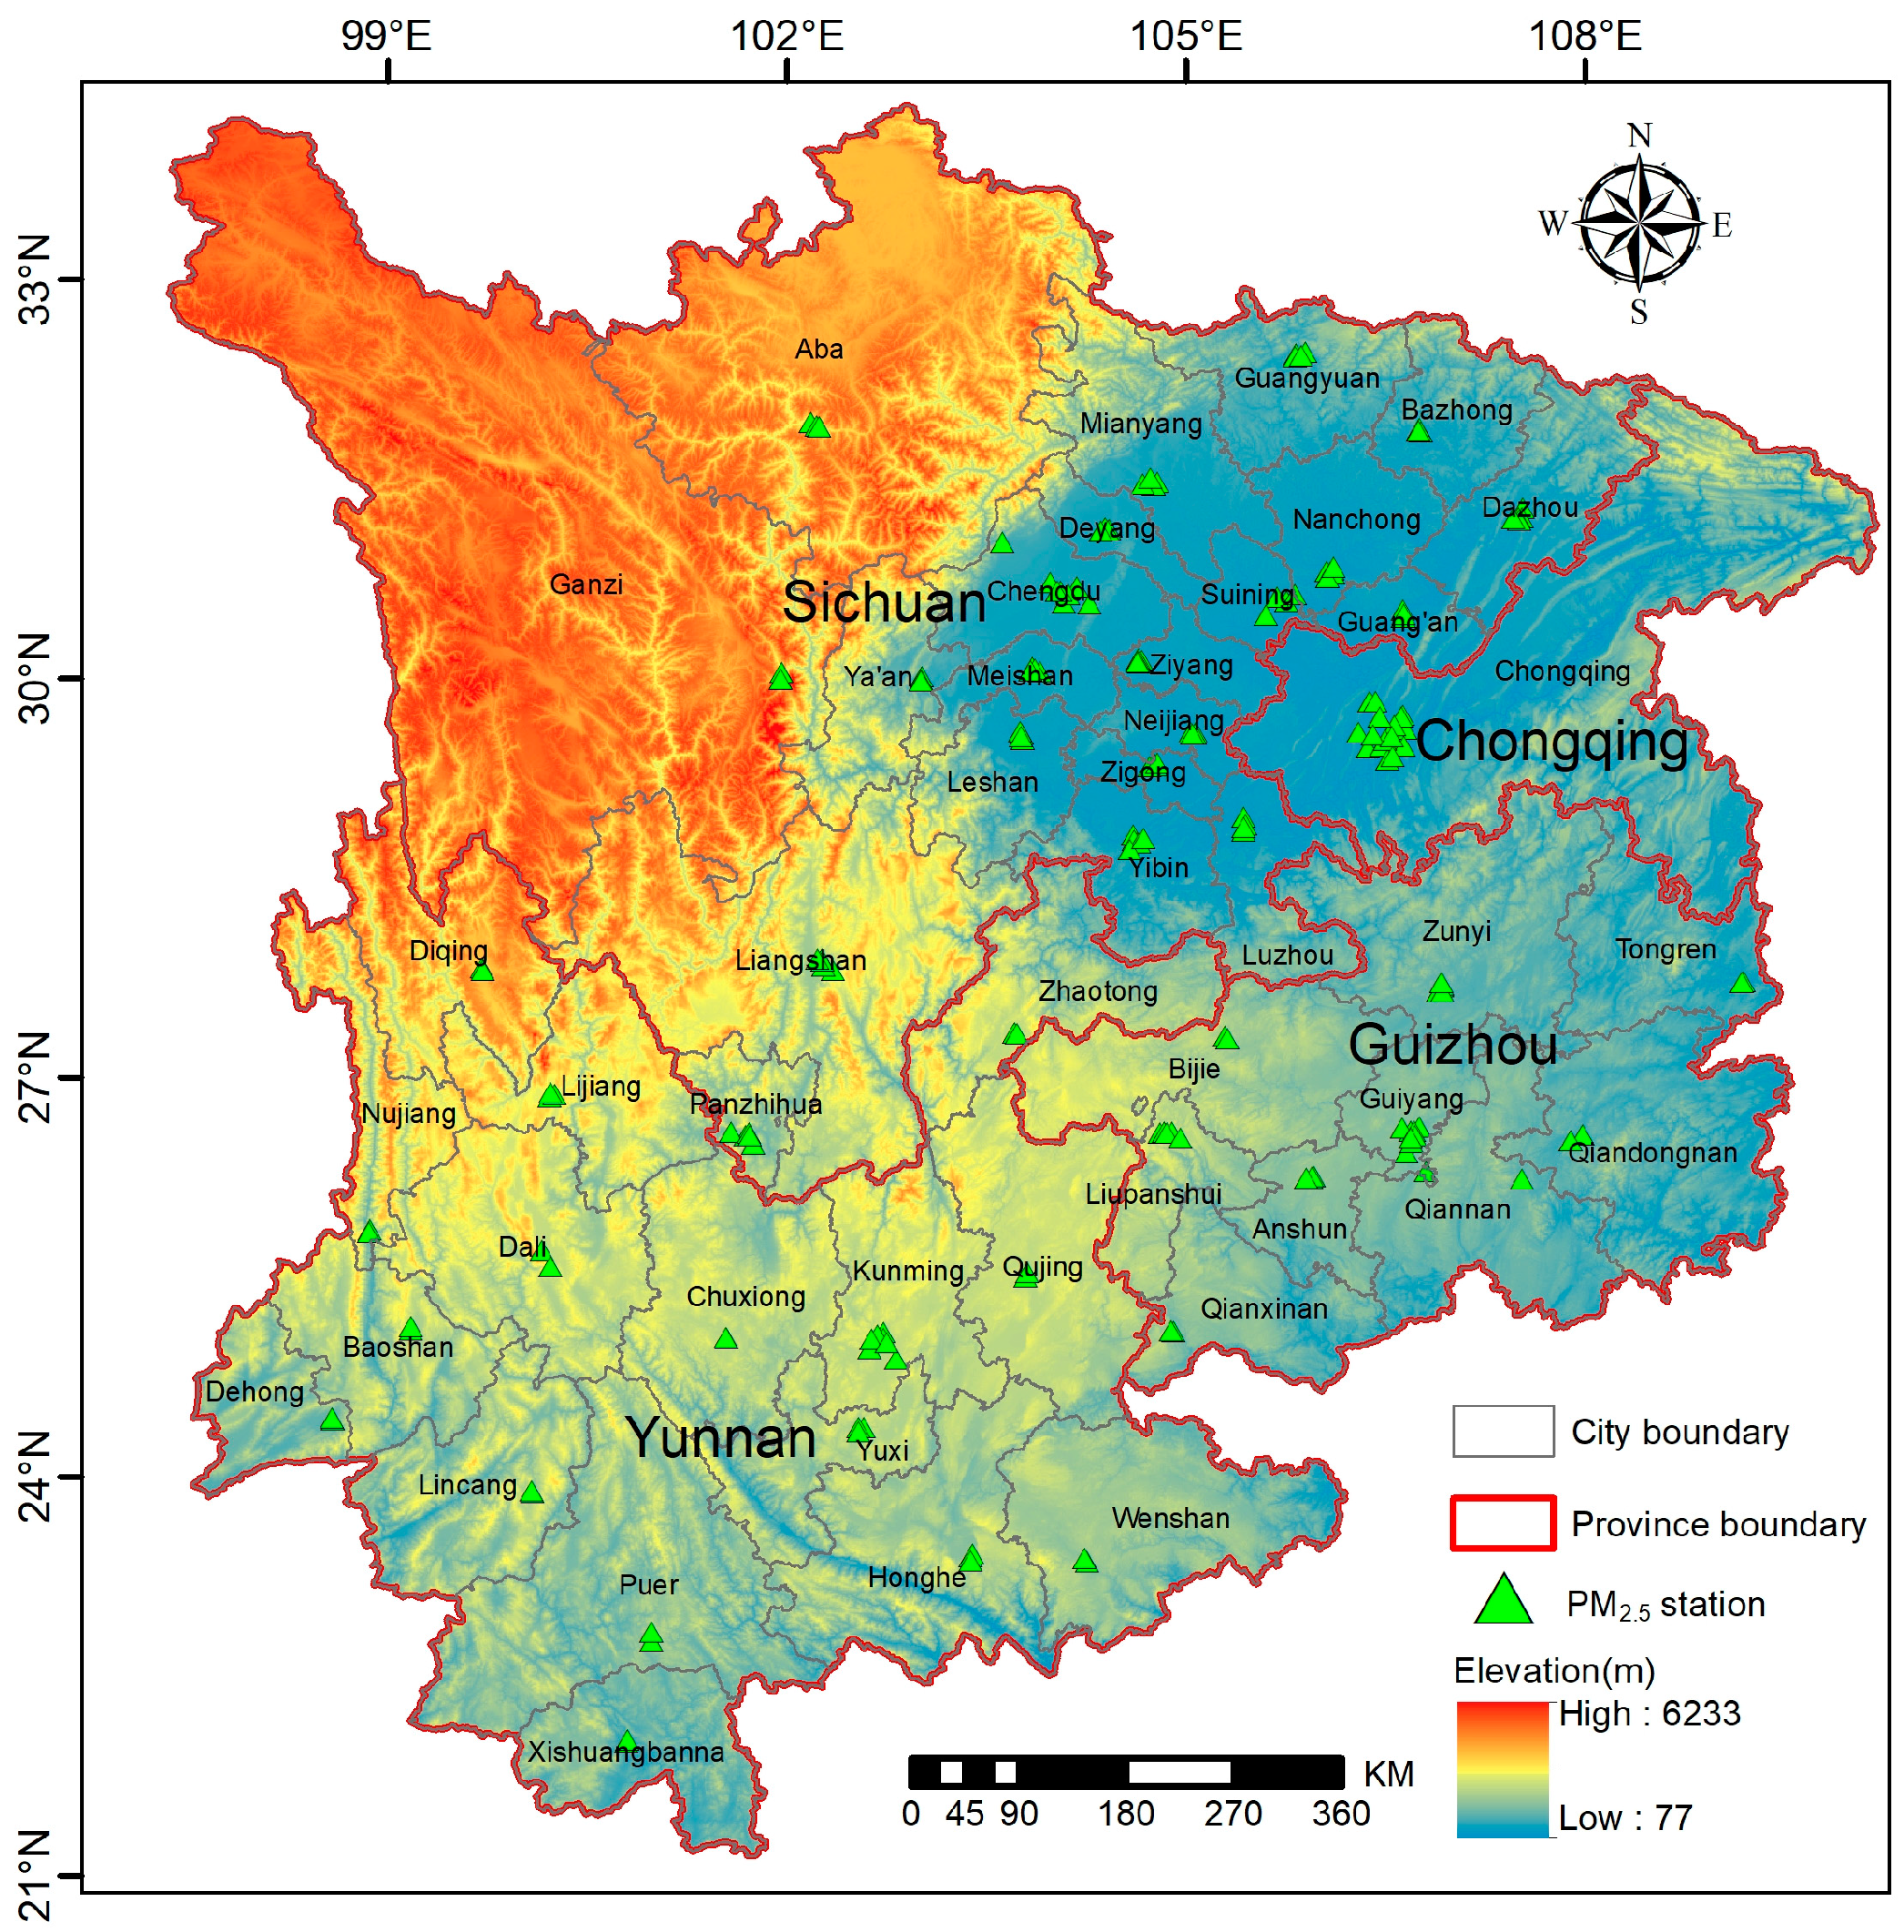
The monitoring data of PM2.5 ground stations were from the real-time release platform of urban air quality in China (NUAQRRP). There were a total of 227 monitoring stations in the study area, as shown in Figure 1, including 109 in Sichuan Province, 36 in Chongqing City, 36 in Guizhou Province, and 46 in Yunnan Province.
The temporal resolution of ground PM2.5 observation data is 1 h. The “Ambient Air Quality Standard” (GB3095-2012) and “Determination of atmospheric articles PM10 and PM2.5 in ambient air by gravimetric method” (HJ618-2011) pointed out that China’s ground PM2.5 concentration is obtained by continuous online monitoring using the tapered element oscillating microbalance method (TEOM) or β-ray method. It was necessary to use the Pauta criterion to eliminate errors in processing potentially erroneous information from ground-station observations resulting from instrument failures [52]. Using a 99.7% confidence probability, the standard deviation σ the dataset was calculated, and data showing more than 3σ deviation from the mean were discarded. The standard deviation σ of the remaining data was recalculated and the process was repeated until there were no data in the dataset with a deviation of more than 3σ from the mean [53].
The AOD data were derived from the NASA Center for Climate Simulation, version number MCD19A2, and the strip numbers covering the study area were h26v05, h26v06, h7v05, and h27v06, which is a 1 km spatial resolution product inverted by multi-angle implementation of atmospheric correction (MAIAC) [54,55]. Its spatial resolution and effective coverage were effectively improved as compared with traditional algorithms [56,57]. Zhang et al. [58] conducted a comparative analysis on 1 km MAIAC AOD and AERONET AOD in China. These authors showed that the correlation coefficient between Aqua and Terra and AERONET was 0.92 and 0.93, respectively, which proves that MAIAC AOD has high accuracy and can be used as an excellent AOD data source for air quality research in China. In this study, Terra and Aqua, were used to select the 550 nm band for preprocessing, such as reprojection, mosaicking, and cropping. As the gray value of the original data is between 0–5000 and the scale factor is 1000, it is necessary to multiply by 0.001 on the basis of the given value to obtain the true value. On this basis, the least squares method was used to construct a linear regression model for the two data to compensate for the missing AOD values. Finally, the average value of Terra and Aqua was fused to obtain the average AOD.
The meteorological data were derived from the fifth generation of global reanalysis data product ERA5 launched by the European Centre for Medium-range Weather Forecasts (ECMWF), with a time resolution of 1 h and a spatial resolution of 0.25°, including near-ground temperature (TEM), total precipitation (TP), surface pressure (SP), relative humidity (RH), near-ground wind speed (WS), and boundary layer height (BLH). When used, the hourly data were processed as a daily average. Other parameters were as follows: NDVI version number, MOD13A2; strip number, same as AOD; spatial resolution, 1 km; temporal resolution, month; total scenes, 144; periods, 36. Meteorological and NDVI data were preprocessed in the ENVI + IDL environment, such as projection transformation, mosaicking, and clipping.
2.3. Model Structure and Validation
2.3.1. GTWR Model
PM2.5 has obvious spatial and temporal distribution characteristics [59,60], and the geographically and temporally weighted regression (GTWR) model is a multiple linear local regression model that considers both temporal and spatial variation, that is, the model regression coefficient is an arbitrary function of geographic location and observation time [61,62,63]. The model can generate local regression coefficients that fluctuate with spatial and temporal position changes based on the corresponding information of the sample data. The essence is to obtain the regression coefficient of continuous regional change by using distance weighting. Therefore, GTWR is suitable for PM2.5 inversion research and its basic expression is as follows:
where are the space-time coordinates of the -th sample point, and are expressed as the longitude, latitude, and time of the -th sample point, respectively; are the observations of the dependent variable and the independent variable at the observation location ; is expressed as the regression constant of the -th sample point; is the -th regression parameter for the -th sample point; is the value of the -th independent variable at point ; is the residual. The local linear estimation method can be used to obtain the estimated value of each regression coefficient at observation point .
2.3.2. Model Variable Selection
In southwest China, the seasons are distinct and the factors affecting PM2.5 change in different seasons are varied. Hence, it is important to construct GTWR estimation models for different seasons (spring: March–May, summer: June–August, autumn: September–November, winter: December–February). When constructing the GTWR model, multiple linear regression (MLR) was performed to analyze the independent variables. At the same time, the multi-collinearity effect among independent variables was eliminated at variance inflation factor (VIF) < 7 [64,65]. The variable combination with the largest coefficient of determination (R2) was selected as the independent variable factor to build the GTWR model.
The PM2.5 ground monitoring stations were divided into two independent parts, and 20% of the representative and spatially distributed stations were selected as model verification points. The remaining 80% of the stations were used as sample points for model construction. During the model construction, the remote sensing image metadata closest to the ground monitoring site was matched to the measured data of the site to construct the model parameter to solve the equation.
The results of independent variable factor selection in each time scale combined with the MLR model are shown in Table 1. The cells with missing data indicate that the variable does not meet the modeling conditions within the corresponding time range. AOD, RH, and SP were positively correlated with PM2.5, and BLH, TEM, TP, WS, NDVI, and DEM had a negative correlation with PM2.5. On this basis, an inversion model of PM2.5 spatial change in southwest China was constructed on an annual and quarterly basis.
3. Results and Discussion
3.1. Statistical Analysis of Model Data
When constructing the model, the stations with less than three groups of daily data were excluded. Finally, 173,161 groups of effective daily observation data were obtained for 3 years, and the descriptive statistical analysis results are shown in Table 2. The PM2.5 concentration range in southwest China was between 4.8 and 95.1 μg/m3, and the annual average value was between 27.9 and 28.9 μg/m3, which is lower than the annual average level 2 limit of 35 μg/m3 stipulated in China’s “Ambient Air Quality Standards” (GB 3095-2012). This result indicates the overall good quality of air. The AOD range was between 0.02 and 0.95, with an average of 0.35–0.38 and standard deviation (SD) of 0.17–0.21. Thus, the regional difference in air pollution was large.
3.2. Analysis of Model Fitting Results
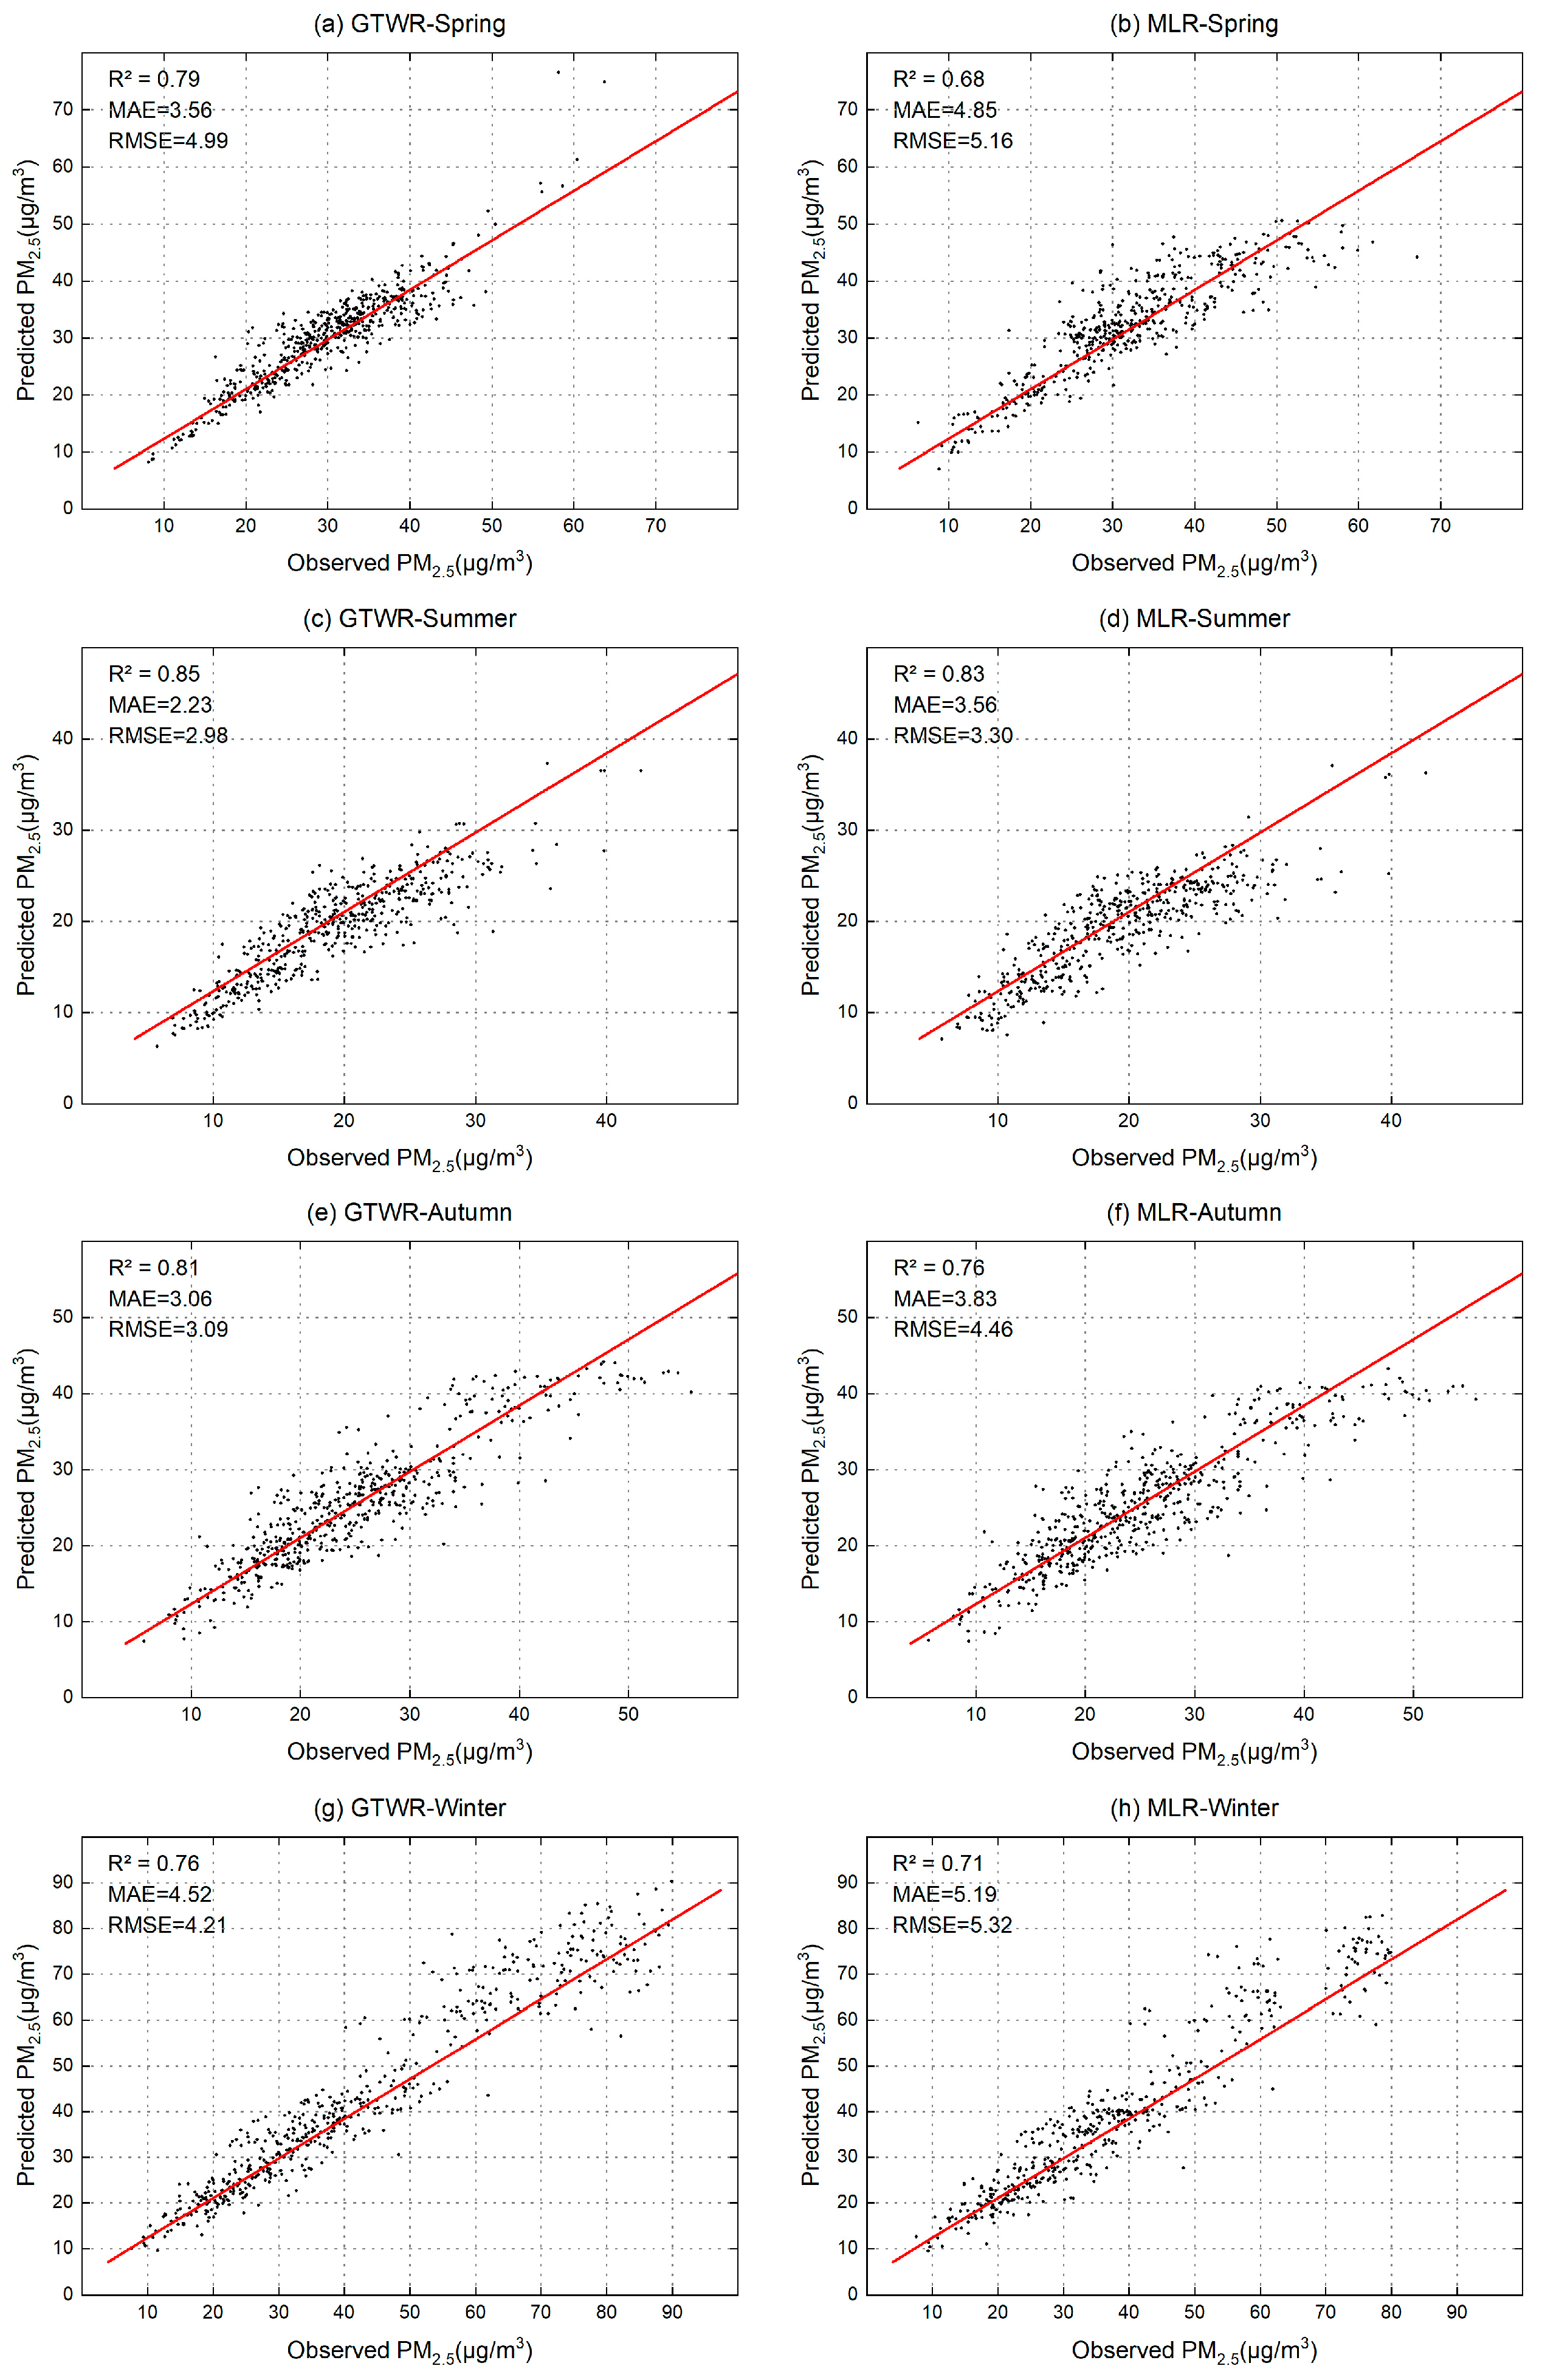
R2, MAE, and RMSE values were used to evaluate the estimation accuracy of the model [66,67]. R2 indicates the degree of consistency between the estimated value of the model and the actual observation, and varies between 0 and 1. The larger the R2 value, the closer the prediction result of the model is to the true value. MAE and RMSE indicate the degree of deviation in the model estimate from the observation; the smaller the value, the higher is the accuracy of the model. The GTWR and MLR models were constructed simultaneously by combining the selection results of various seasonal variables shown in Table 1 and using the same factors as independent variables. The fitting results are shown in Figure 2 and Figure 3.
The results show that in the annual simulation (Figure 2), the simulated R2 value of the two models exceeded 0.8, and the MAE and RMSE values of GTWR were smaller than those of the MLR model. Thus, the prediction results of the two models showed a high degree of agreement with the measured PM2.5 concentration at the ground station and the fitting error of the GTWR model was low.
From the quarterly fitting results (Figure 3), it seems that the accuracy was the highest in summer and the lowest in winter. Overall, the inversion accuracy of the GTWR model was higher than that of the MLR model; hence, the GTWR model can be used to invert the annual and quarterly PM2.5 changes in the study area.
3.3. Comparison of Model Estimation Accuracy with Existing Datasets
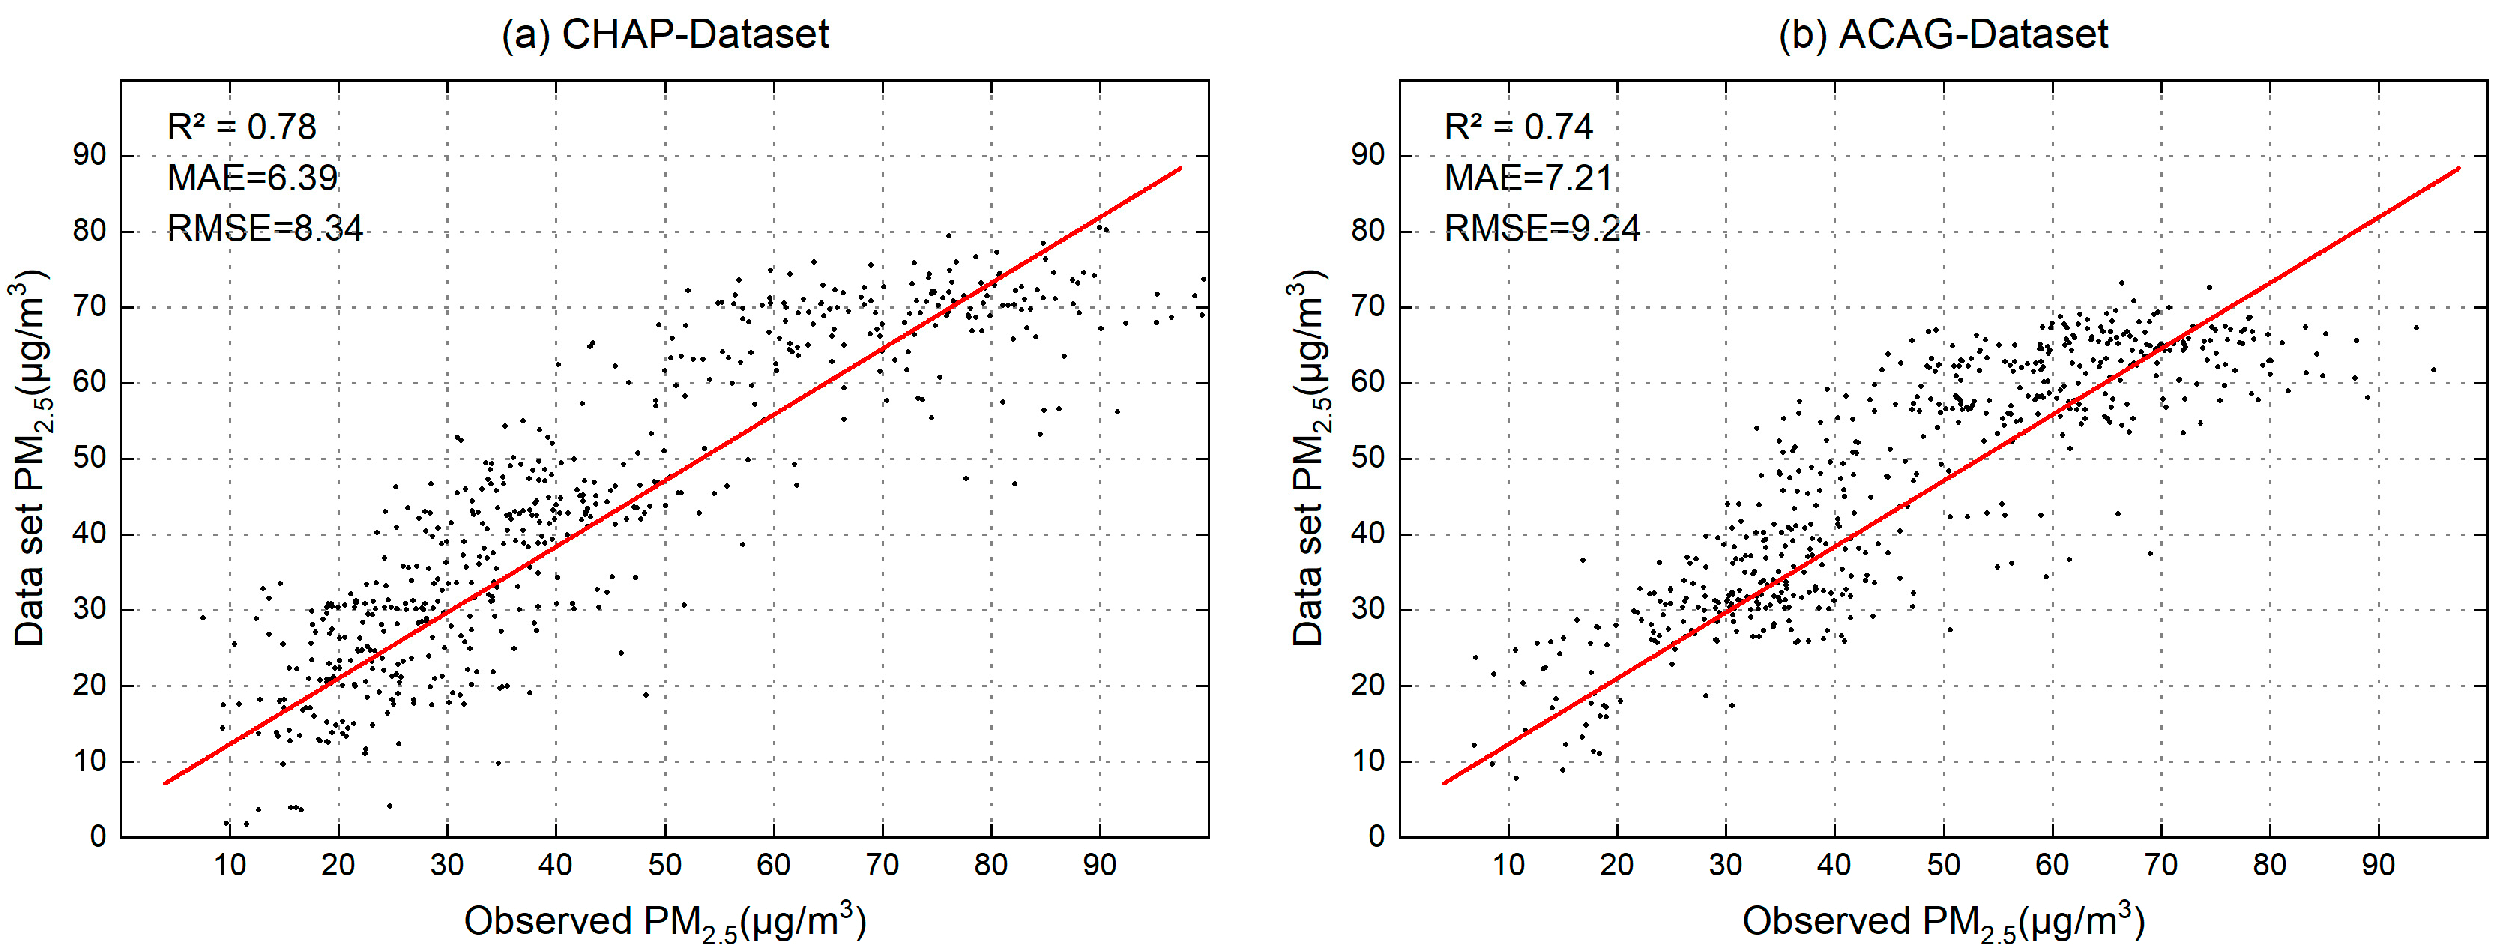
To evaluate the accuracy of the PM2.5 data retrieved using the GTWR model and the commonly used public PM2.5 dataset, the Global Ground PM2.5 dataset (ACAG data) [68] and China High PM2.5 dataset (CHAP data) [69] were selected and compared with the site monitoring data. The selected time range was from 2019 to 2021, and the spatial resolution was 0.01°.
The ACAG dataset is the Atmospheric Composition Analysis Group’s radiation measured by MODIS, MISR, and SeaWIFS to invert AOD data and is combined with GEOS-Chem chemical transport models to estimate the concentration of surface PM2.5; the selected version is V5.GL.03. The CHAP dataset is generated by Wei et al. using MAIAC AOD products and combining multi-source satellite remote sensing data and machine learning, mainly developed for the Chinese region. The selected version is V4, which exhibits high overall accuracy.
The results of the comparison are shown in Figure 4. The R2, MAE, and RMSE of the CHAP dataset were 0.78, 6.39, and 8.34, respectively, and those of the ACAG dataset were 0.74, 7.21, and 9.24, respectively. The accuracy of the ACAG dataset in the southwest region was slightly lower than that of the CHAP dataset, but they can show that the remote sensing data had a good correlation with the ground data. Together with Figure 2, the R2, MAE, and RMSE inverted by the GTWR model were 0.86, 4.84, and 4.14, respectively. R2 was greatly improved in this case as compared with that from the CHAP and ACAG datasets. MAE and RMSE were reduced, indicating that the model accuracy was significantly higher than that of CHAP and ACAG datasets. Thus, the model was suitable for PM2.5 inversion research in southwest China.
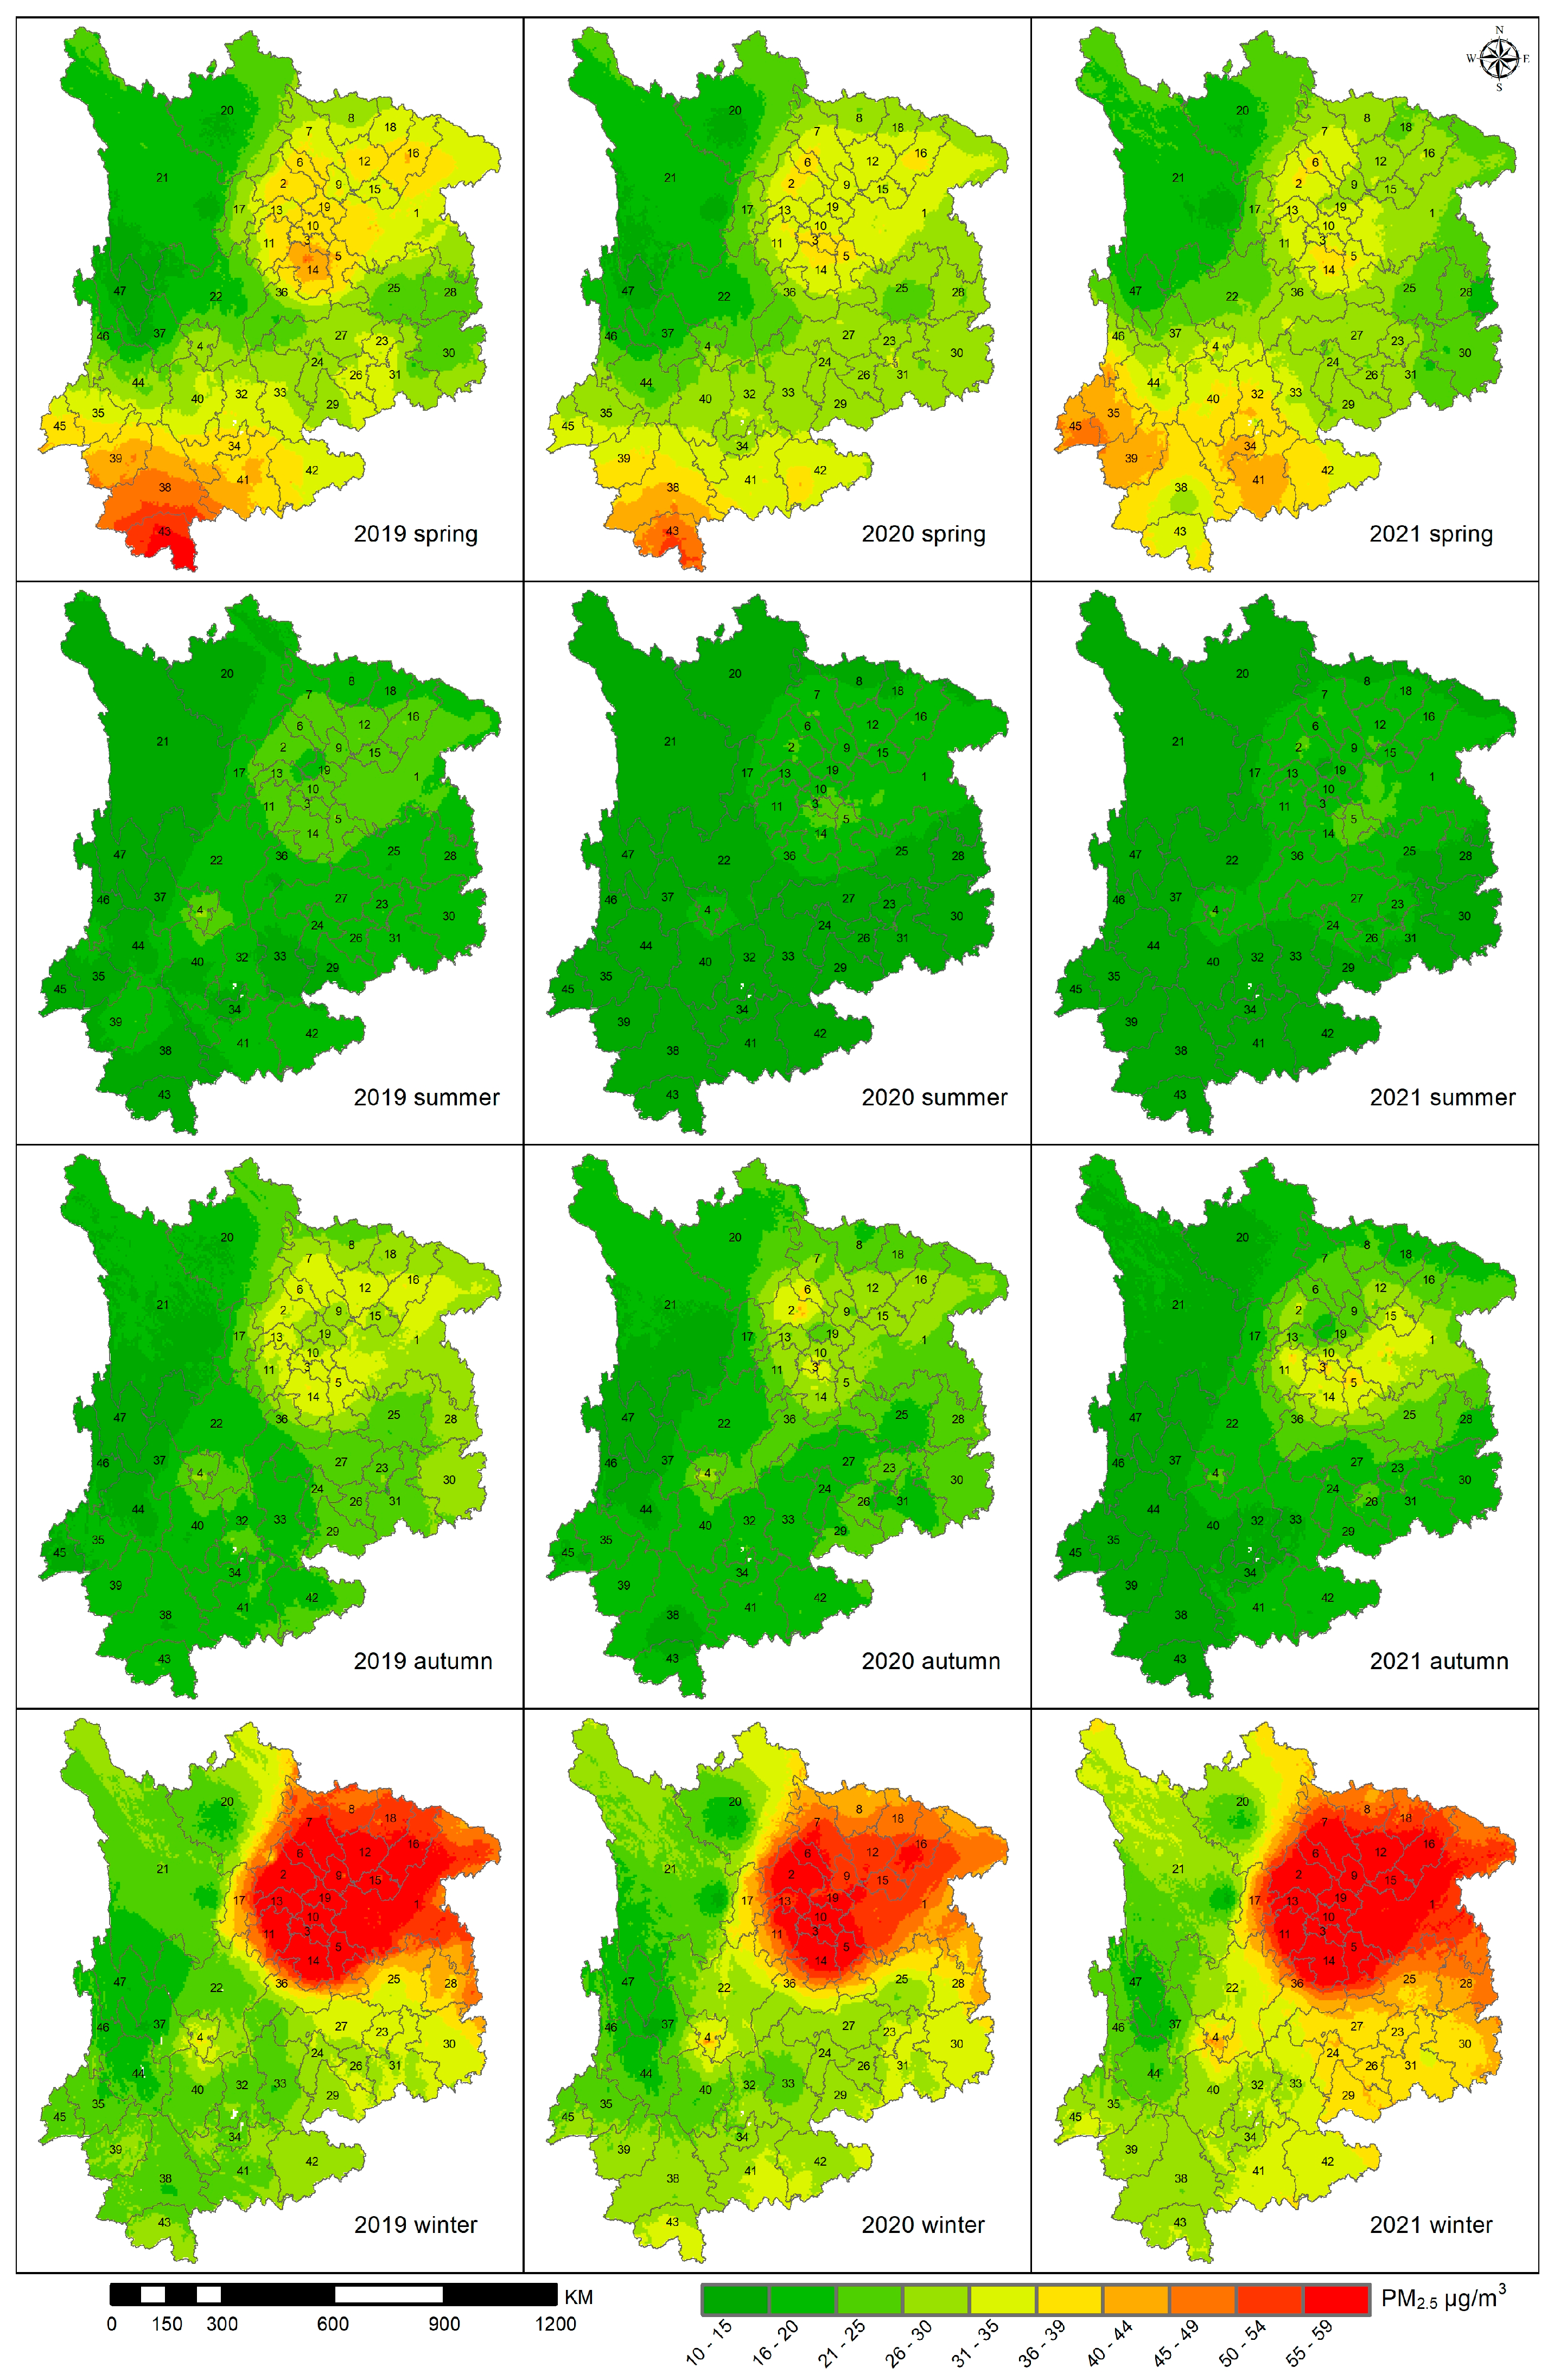
3.4. Analysis of Annual Spatial Distribution of PM2.5
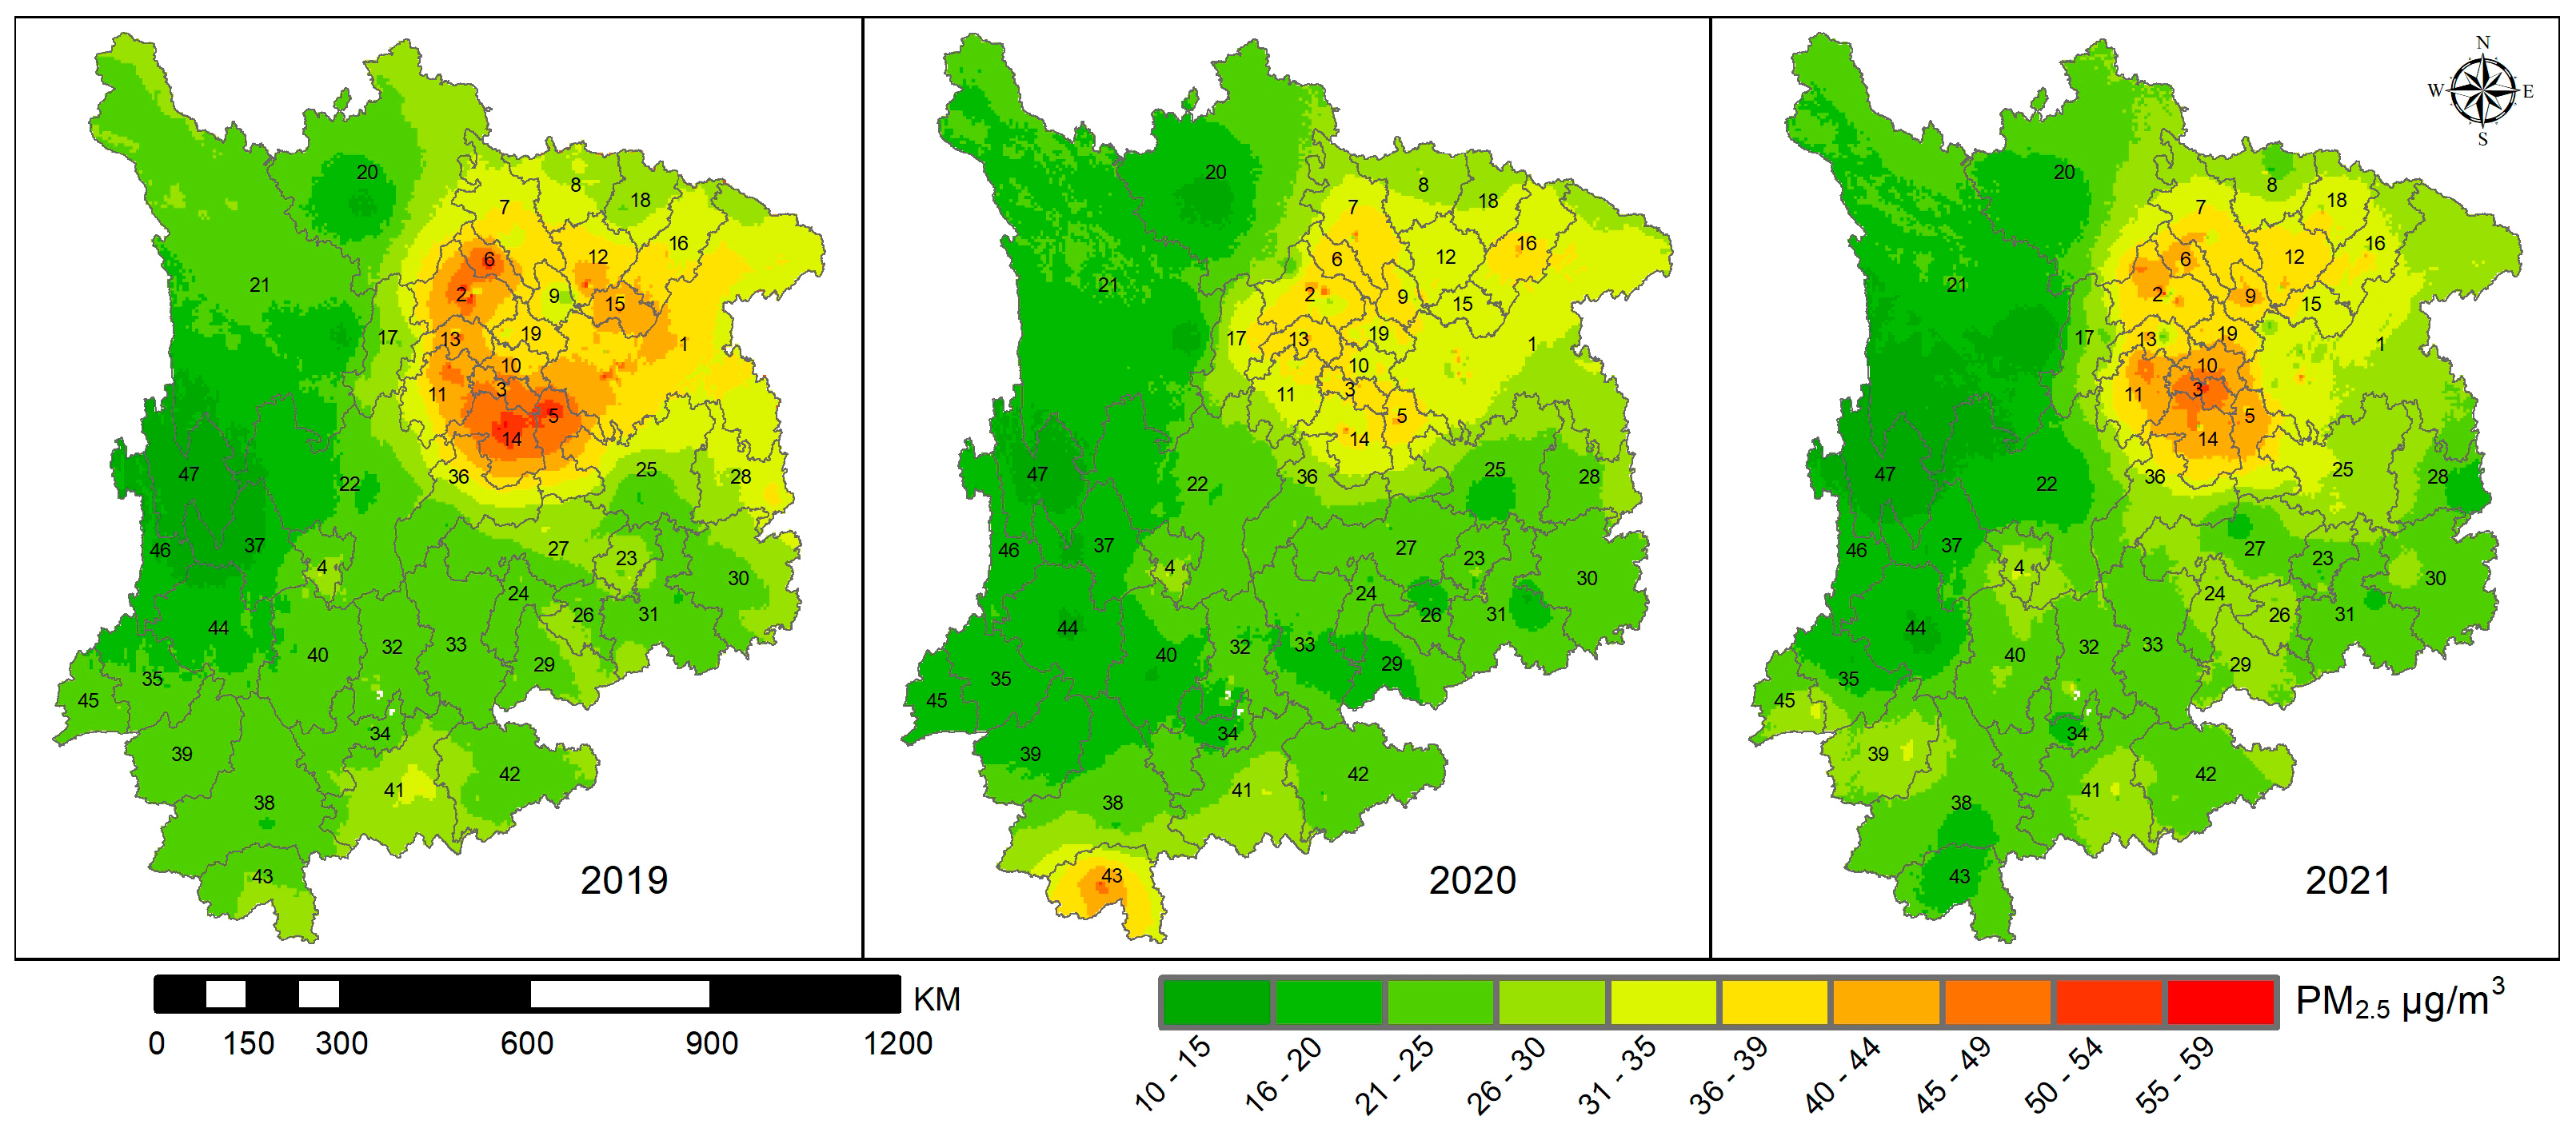
The spatial change in PM2.5 in southwest China from 2019 to 2021 based on the GTWR model is shown in Figure 5. From the perspective of spatial distribution, the high-value areas were mainly located in the Sichuan–Chongqing urban agglomeration in the east, the northern region of Guizhou Province, and some cities in the southern part of Yunnan Province. The low-value areas were located in Aba Prefecture, Ganzi Prefecture, and Liangshan Prefecture in the western Sichuan Plateau and Diqing Prefecture, Nujiang Prefecture, and Lijiang City in the northwest of Yunnan Province. Thus, these results show that the characteristics of the west were lower than those of the east.
As shown in Table 3, the average PM2.5 concentration in 2020 was significantly lower than that in 2019; the concentration increased in 2021, with the average values being 32.1, 26.5, and 28.6 μg/m3 for 2019, 2020, and 2021, respectively; all these values were lower than the annual average limit level 2 standard. From the perspective of provinces and cities, the values for four provinces and cities in 2020 all decreased by more than 15% as compared with those in 2019. Chongqing had the largest decline of 20.7%, and Sichuan, Guizhou, and Yunnan showed a decrease of 16.4%, 15.7%, and 15.4%, respectively. In comparison with 2020, 2021 showed an increase of about 5–10%, where the value in Chongqing increased by 9.6% (the largest increase) and that in Guizhou Province, Sichuan Province, and Yunnan Province increased by 8.0%, 7.6%, and 5.5%, respectively. Considering the overall change trend, PM2.5 concentration significantly decreased from the beginning of the COVID-19 pandemic in 2020, but began to rise after the relaxation of pandemic control measures in 2021.
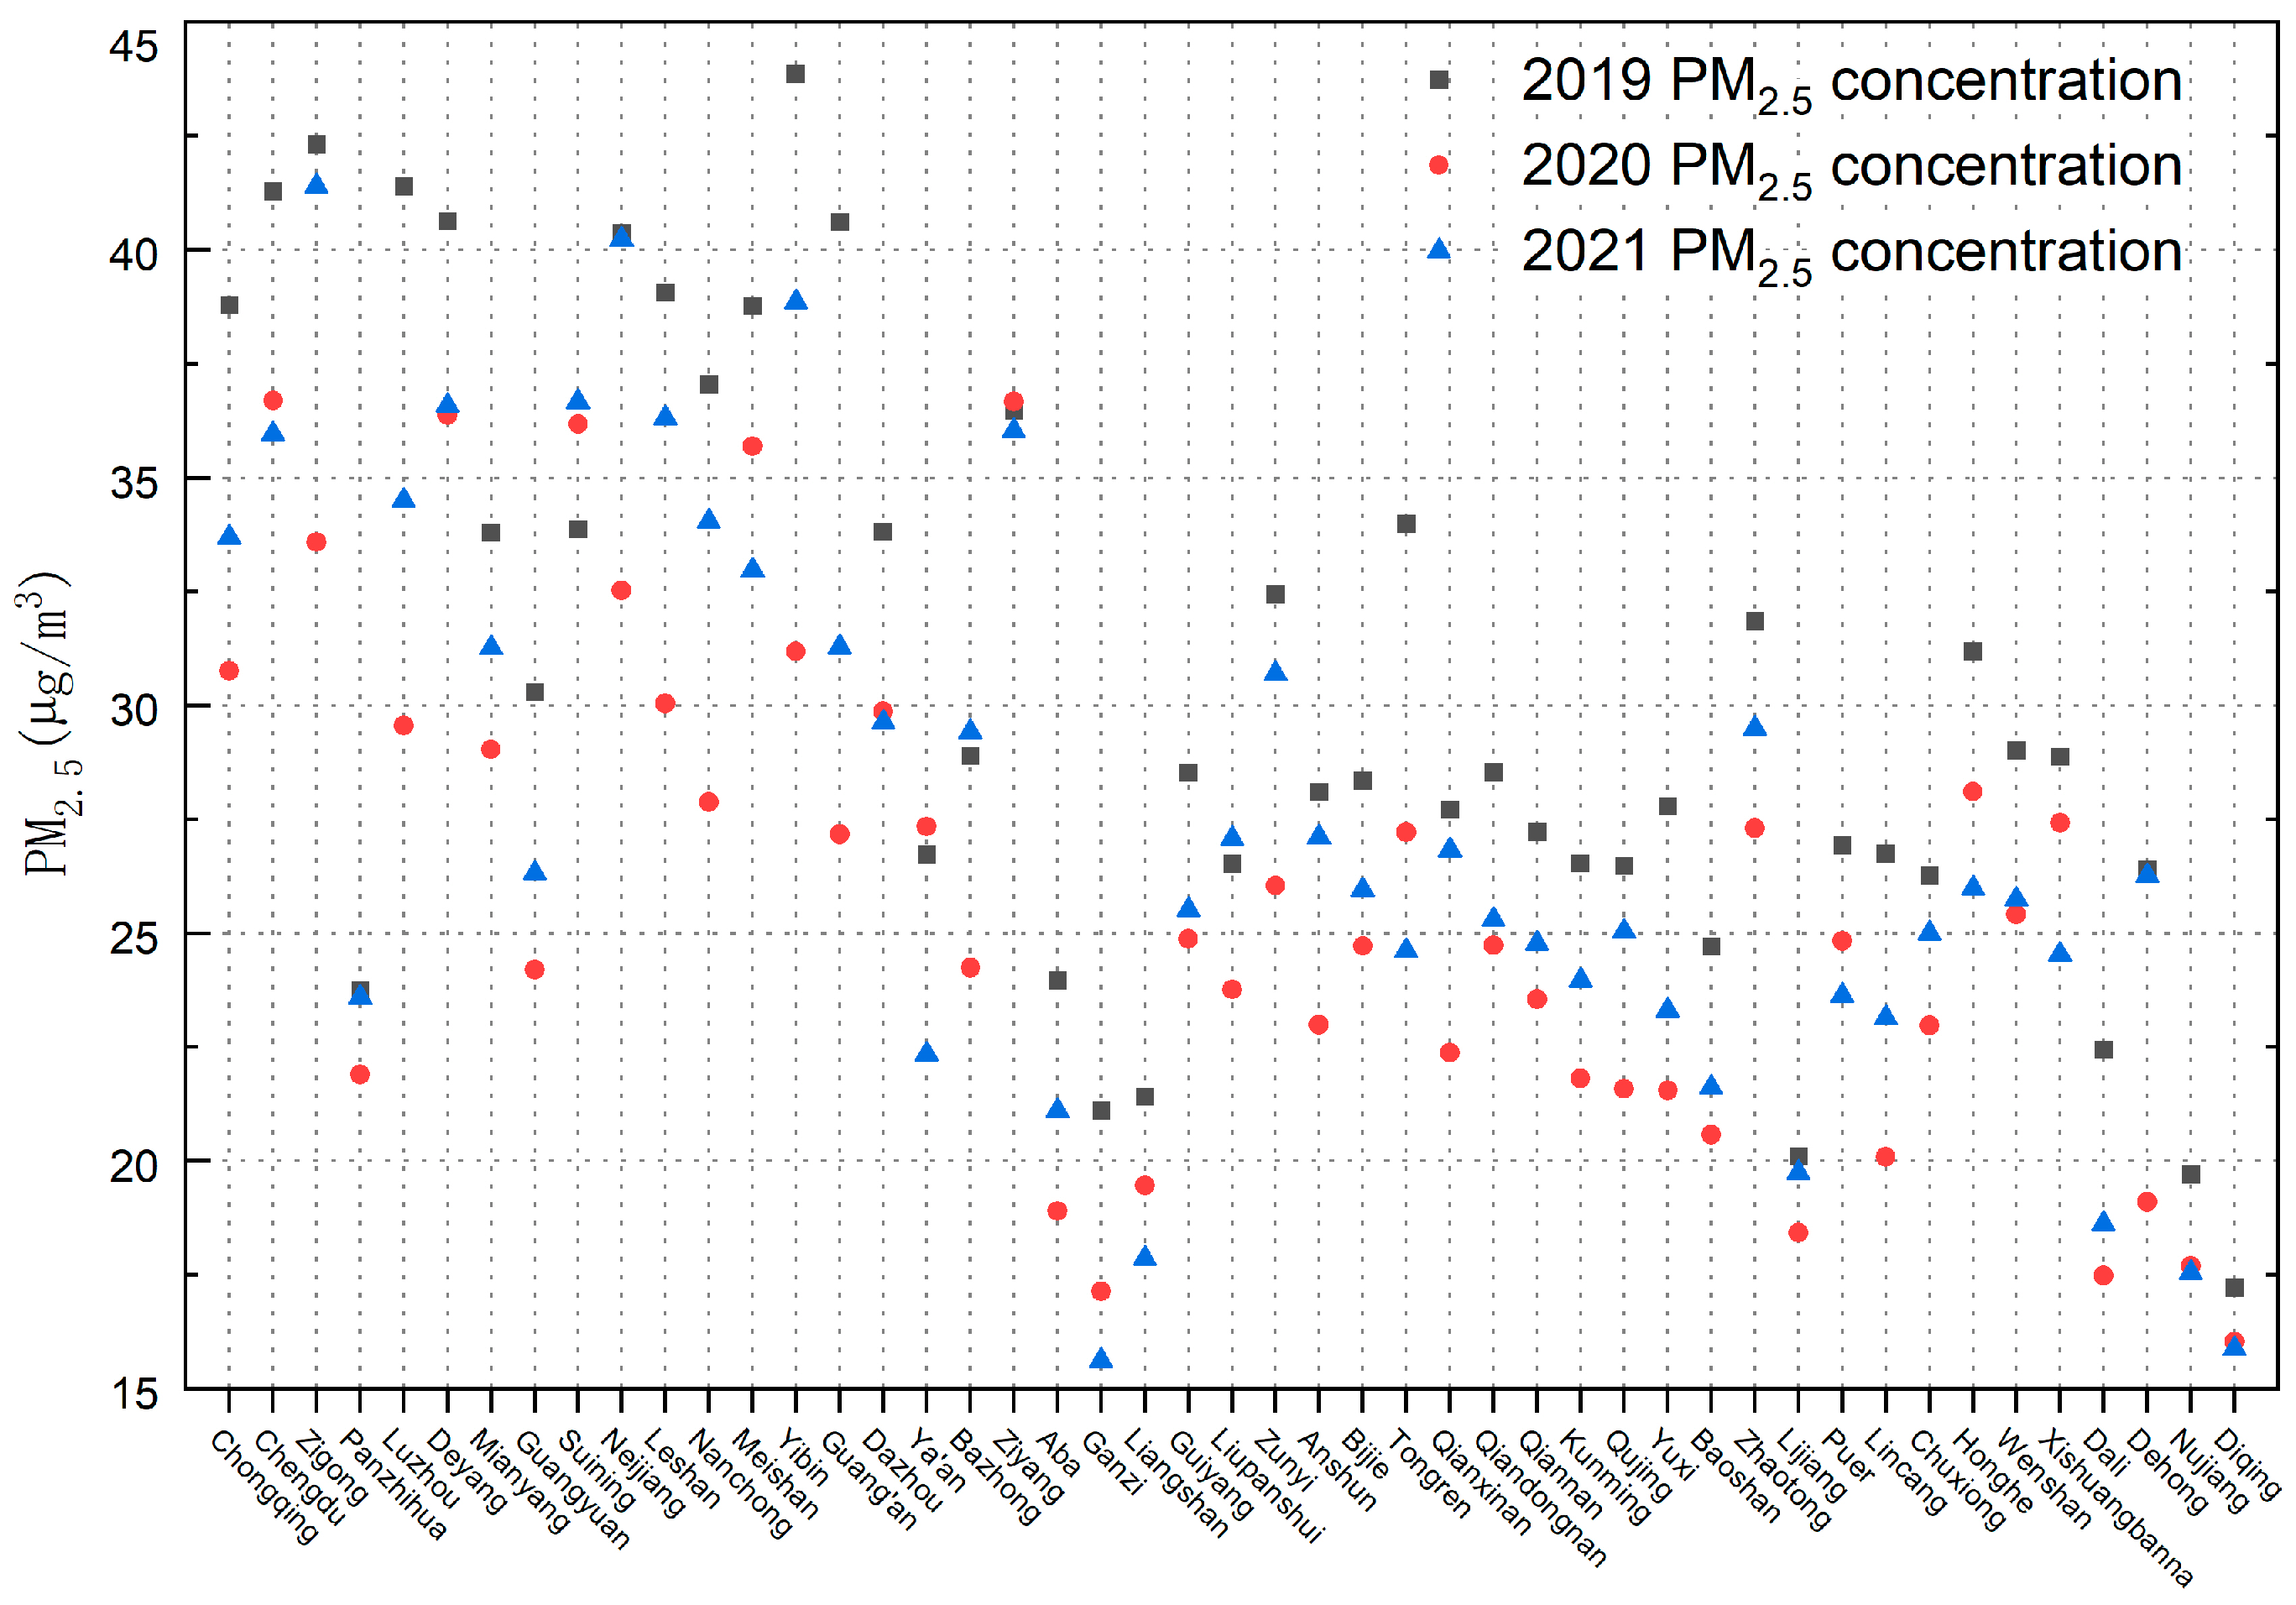
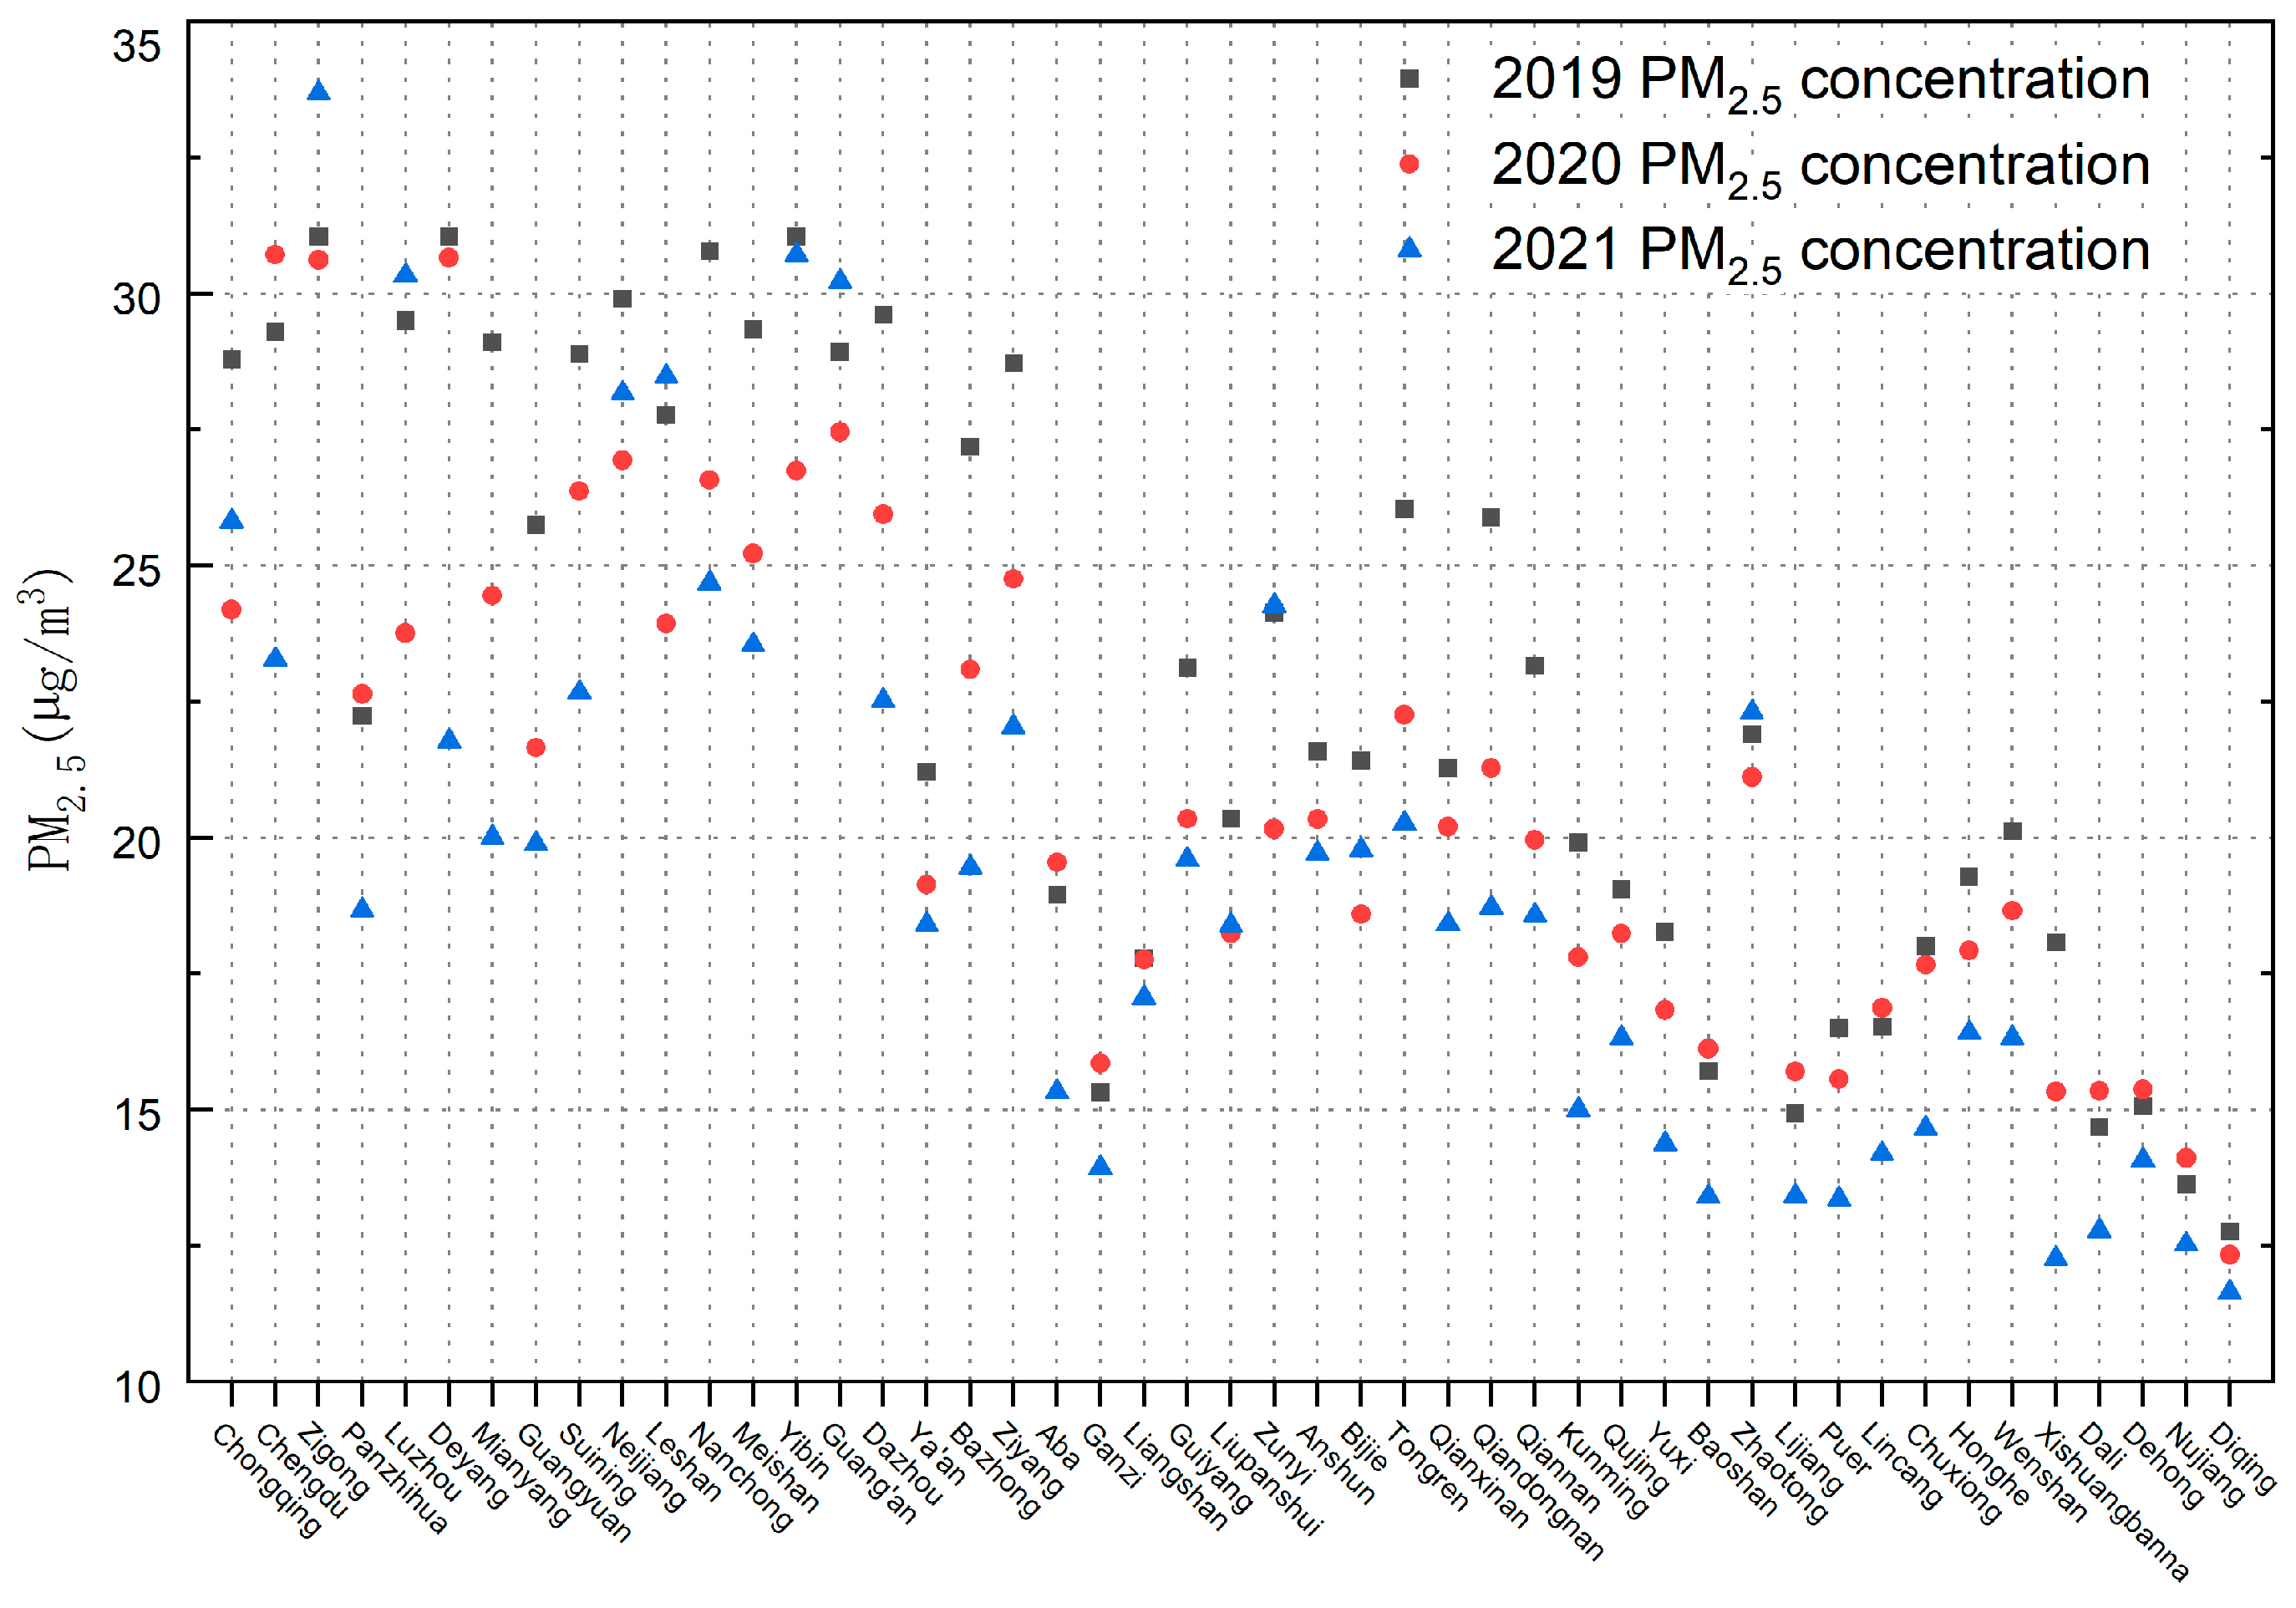
The annual PM2.5 concentration changes in each city are shown in Figure 6. Considering the secondary concentration limit of 35 μg/m3 as the standard, the cities exceeding this value in 2019 were concentrated in the Sichuan Basin, including Zigong City, Yibin City, Luzhou City, Chengdu City, Deyang City, Guang’an City, Neijiang City, Leshan City, Meishan City, Nanchong City, and Ziyang City, with an average value of 40.1 μg/m3 that exceeded the secondary concentration limit standard by 14.4%.
In 2020, the cities that exceeded this limit were Chengdu, Ziyang, Zigong, Deyang, Suining, and Meishan, with an average value of 36.3 μg/m3, which exceeded the secondary concentration limit standard by 3.8%. Thus, from 2019 to 2020, the number of cities reduced from 11 to 5, and PM2.5 concentration significantly decreased. In 2021, as the impact of COVID-19 gradually decreased, PM2.5 concentrations in various cities gradually increased and the cities that exceeded the secondary concentration limit standards included Zigong, Neijiang, Yibin, Suining, Deyang, Leshan, Ziyang, Chengdu. The average value was 37.8 μg/m3, which exceeded 7.9% of the average annual level 2 limit of 35 μg/m3.These cities are located in the Sichuan–Chongqing urban agglomeration in the Sichuan Basin, which is a region with high population concentration and socio-economic activity in southwest China, where transportation and production emissions are large and urban high-density buildings are conducive to the accumulation of PM2.5 and inhibition of the spread of pollutants. Under the condition of a large reduction in emissions during the control period, densely populated, highly urbanized areas had a significant effect on the improvement of air pollution.
Most cities in Guizhou Province and Yunnan Province did not exceed the secondary concentration limit for most regions for three years. Nujiang Prefecture, Diqing Prefecture, and Lijiang City located in the Hengduan Mountains in the northwest of Yunnan Province, and Aba Prefecture, Ganzi Prefecture, and Liangshan Prefecture located in the west of Sichuan Province, had an average value of about 10 to 15 µg/m3 in three years; this is the area with the lowest PM2.5 concentration. The West Sichuan Plateau is part of the southeast edge of the Qinghai–Tibet Plateau and the Hengduan Mountain Range, which belongs to the plateau climate with high local wind speed that is conducive to the diffusion of atmospheric pollutants and has low population density and a low degree of influence by human activities.
3.5. Analysis of Quarterly Spatial Distribution of PM2.5
The changes in PM2.5 in the four seasons of spring, summer, autumn, and winter in the entire southwest region are shown in Table 4 and Figure 7. A seasonal distribution pattern of low summer and autumn and high winter and spring was observed. There was an overall downward trend in the change in the transition from spring to summer, with a minimum in summer, a slow rise from summer to autumn, and a rapid rise from autumn to winter. Considering the entire southwest region, the PM2.5 concentration in the four seasons of spring, summer, autumn, and winter decreased by 18.6%, 13.4%, 13.5%, and 21.7%, respectively, in 2020 as compared with that in 2019. The concentration in spring, summer, autumn, and winter increased by 15.7%, 10.7%, 7.5%, and 14.6%, respectively, in 2021 as compared with the same period in 2020. The winter and spring of 2020 saw the largest decrease owing to the outbreak of COVID-19 at the end of January 2020 and the most stringent control measures imposed; the reduction rate slowed in the summer and autumn of 2020 as the intensity of control gradually weakened and society resumed work and production. Each quarter of 2021 showed an upward trend compared to the same period in 2020, indicating that PM2.5 concentration also increased as the impact of the pandemic gradually decreased.
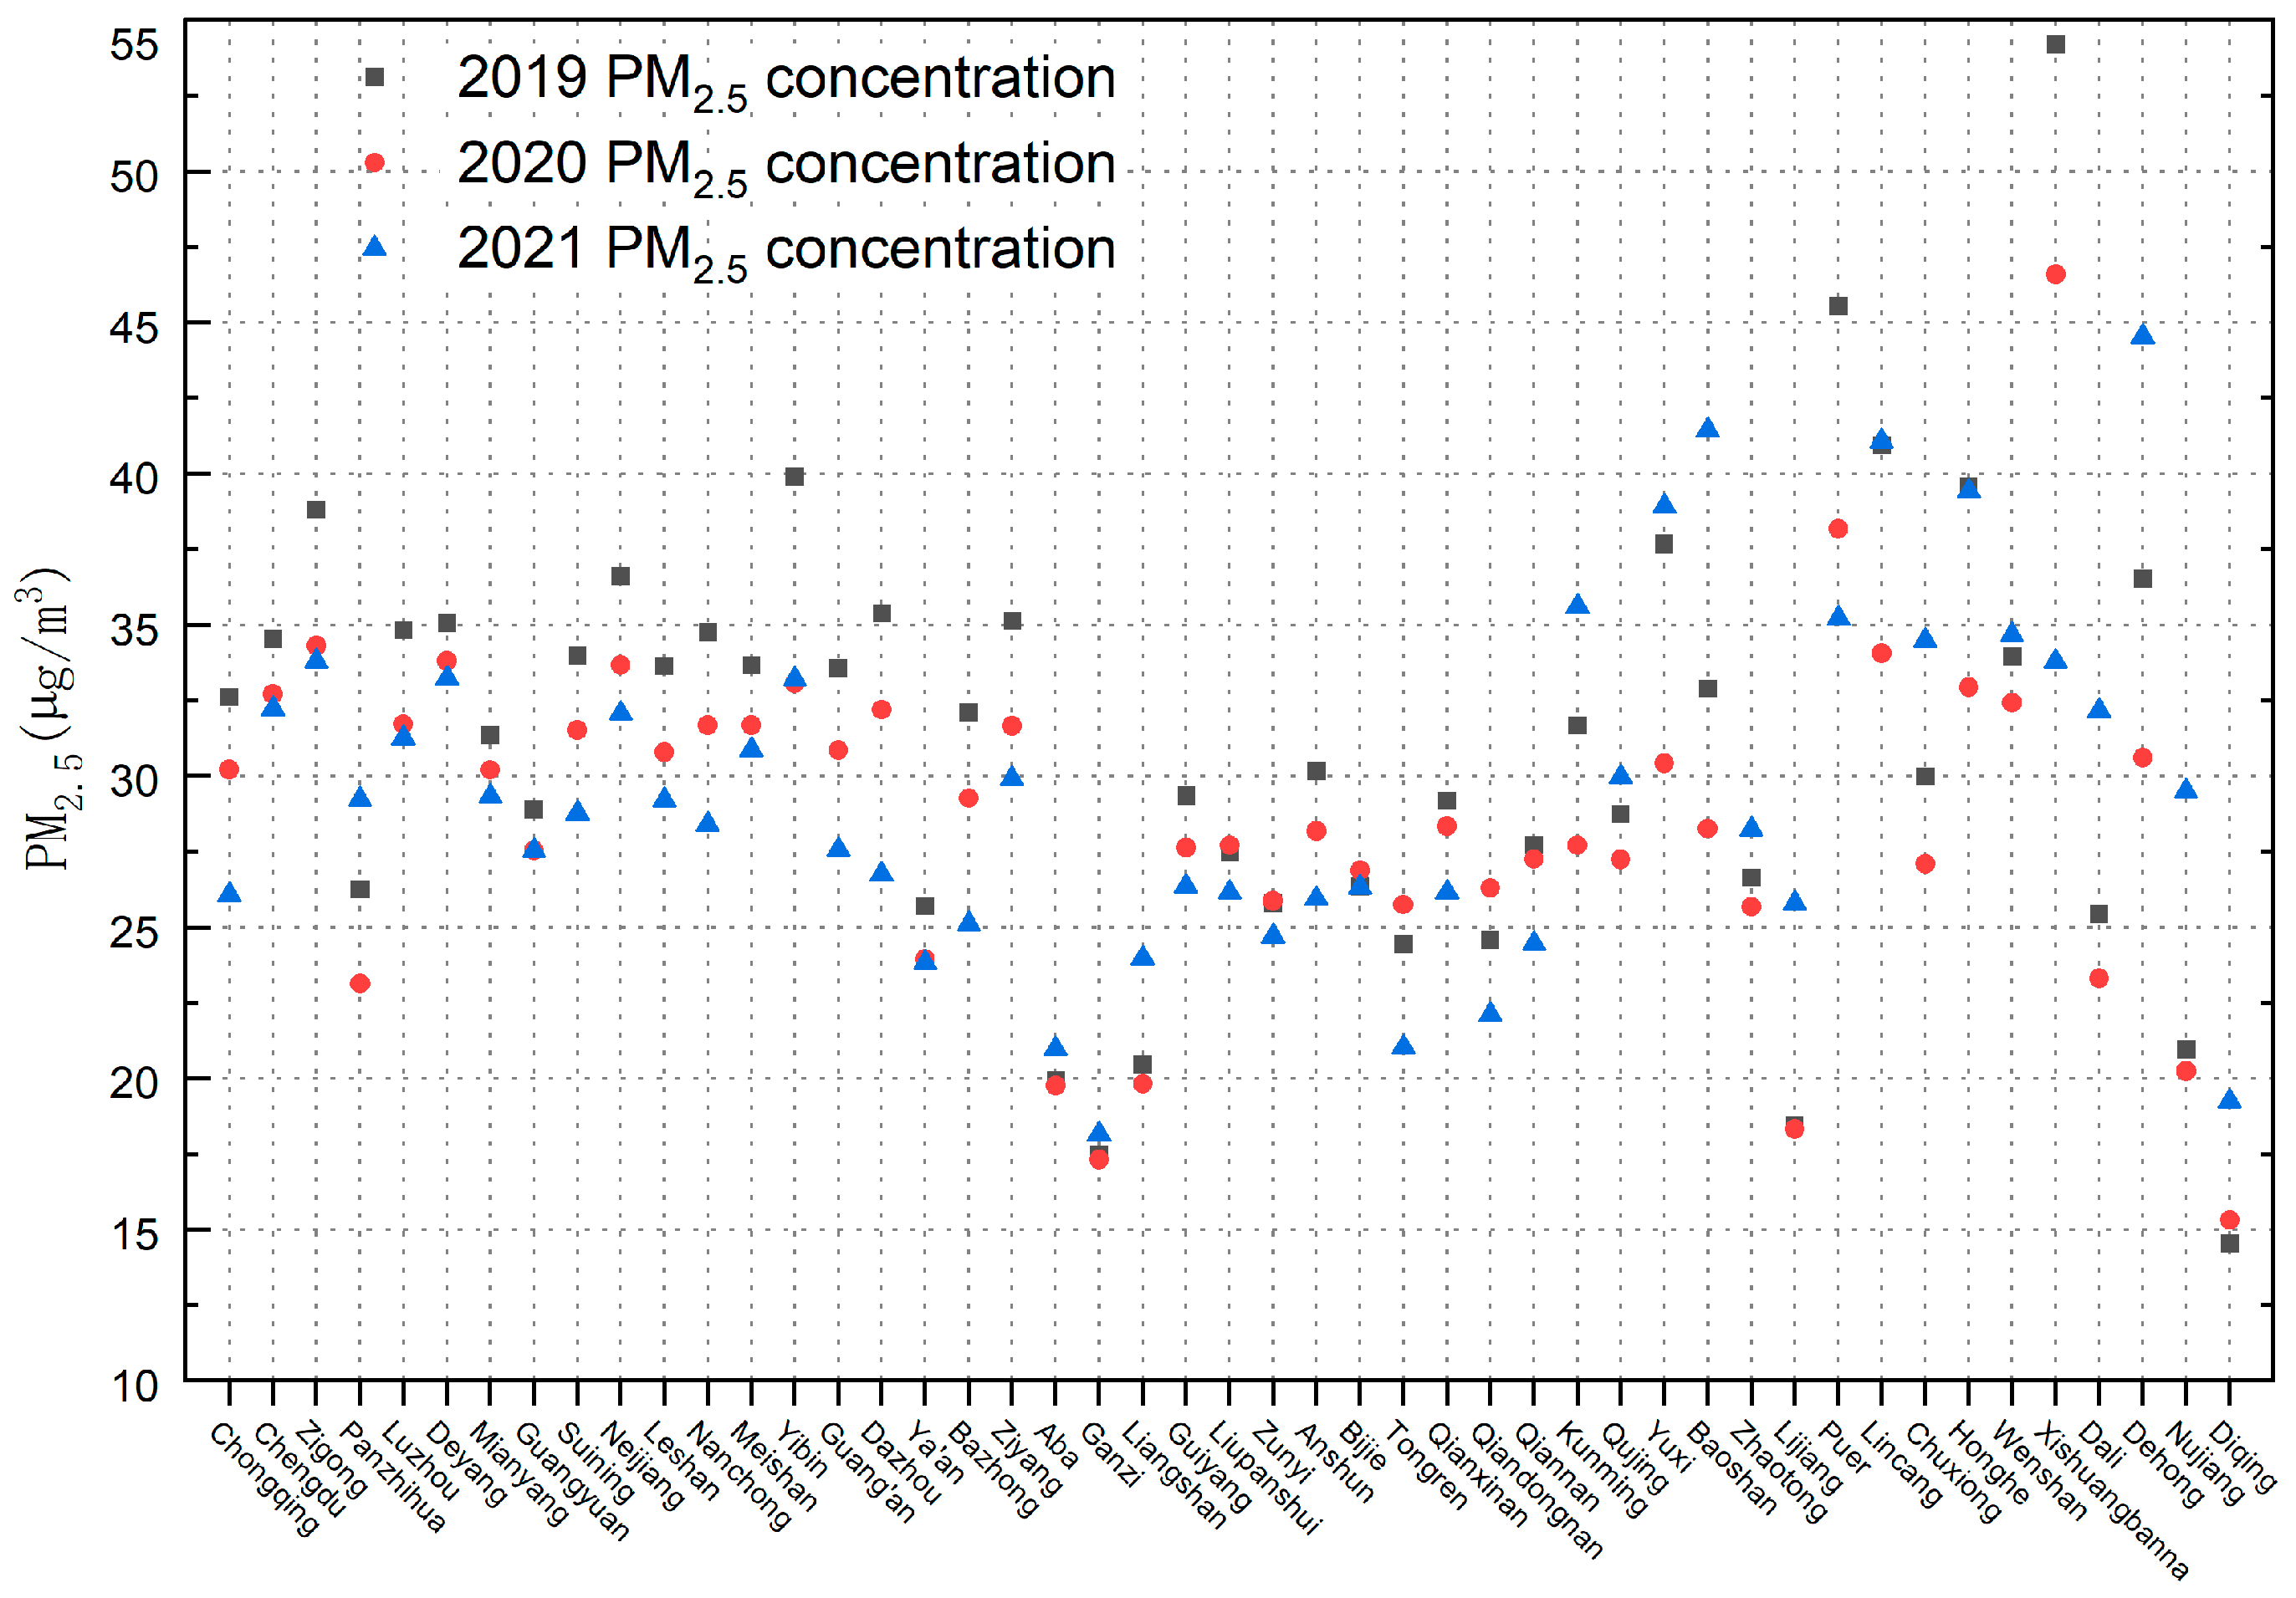
The changes in PM2.5 concentrations in spring are shown in Figure 8. The PM2.5 concentration in Chongqing Municipality, Sichuan Province, Guizhou Province, and Yunnan Province decreased by 32.2%, 27.1%, 5.6%, and 5.4%, respectively, in 2020 as compared with 2019. From the perspective of spatial distribution, the high-value areas in the Sichuan–Chongqing area in spring were those mainly located in the eastern region centered on the Sichuan Basin, which showed a gradually decreasing distribution pattern from west to east. In the spring of 2019, the cities in the Sichuan–Chongqing area that exceeded the annual average secondary concentration limit were Yibin City, Zigong City, Neijiang City, Dazhou City, Ziyang City, and Deyang City. In the spring of 2020, all cities were below the secondary concentration limit.
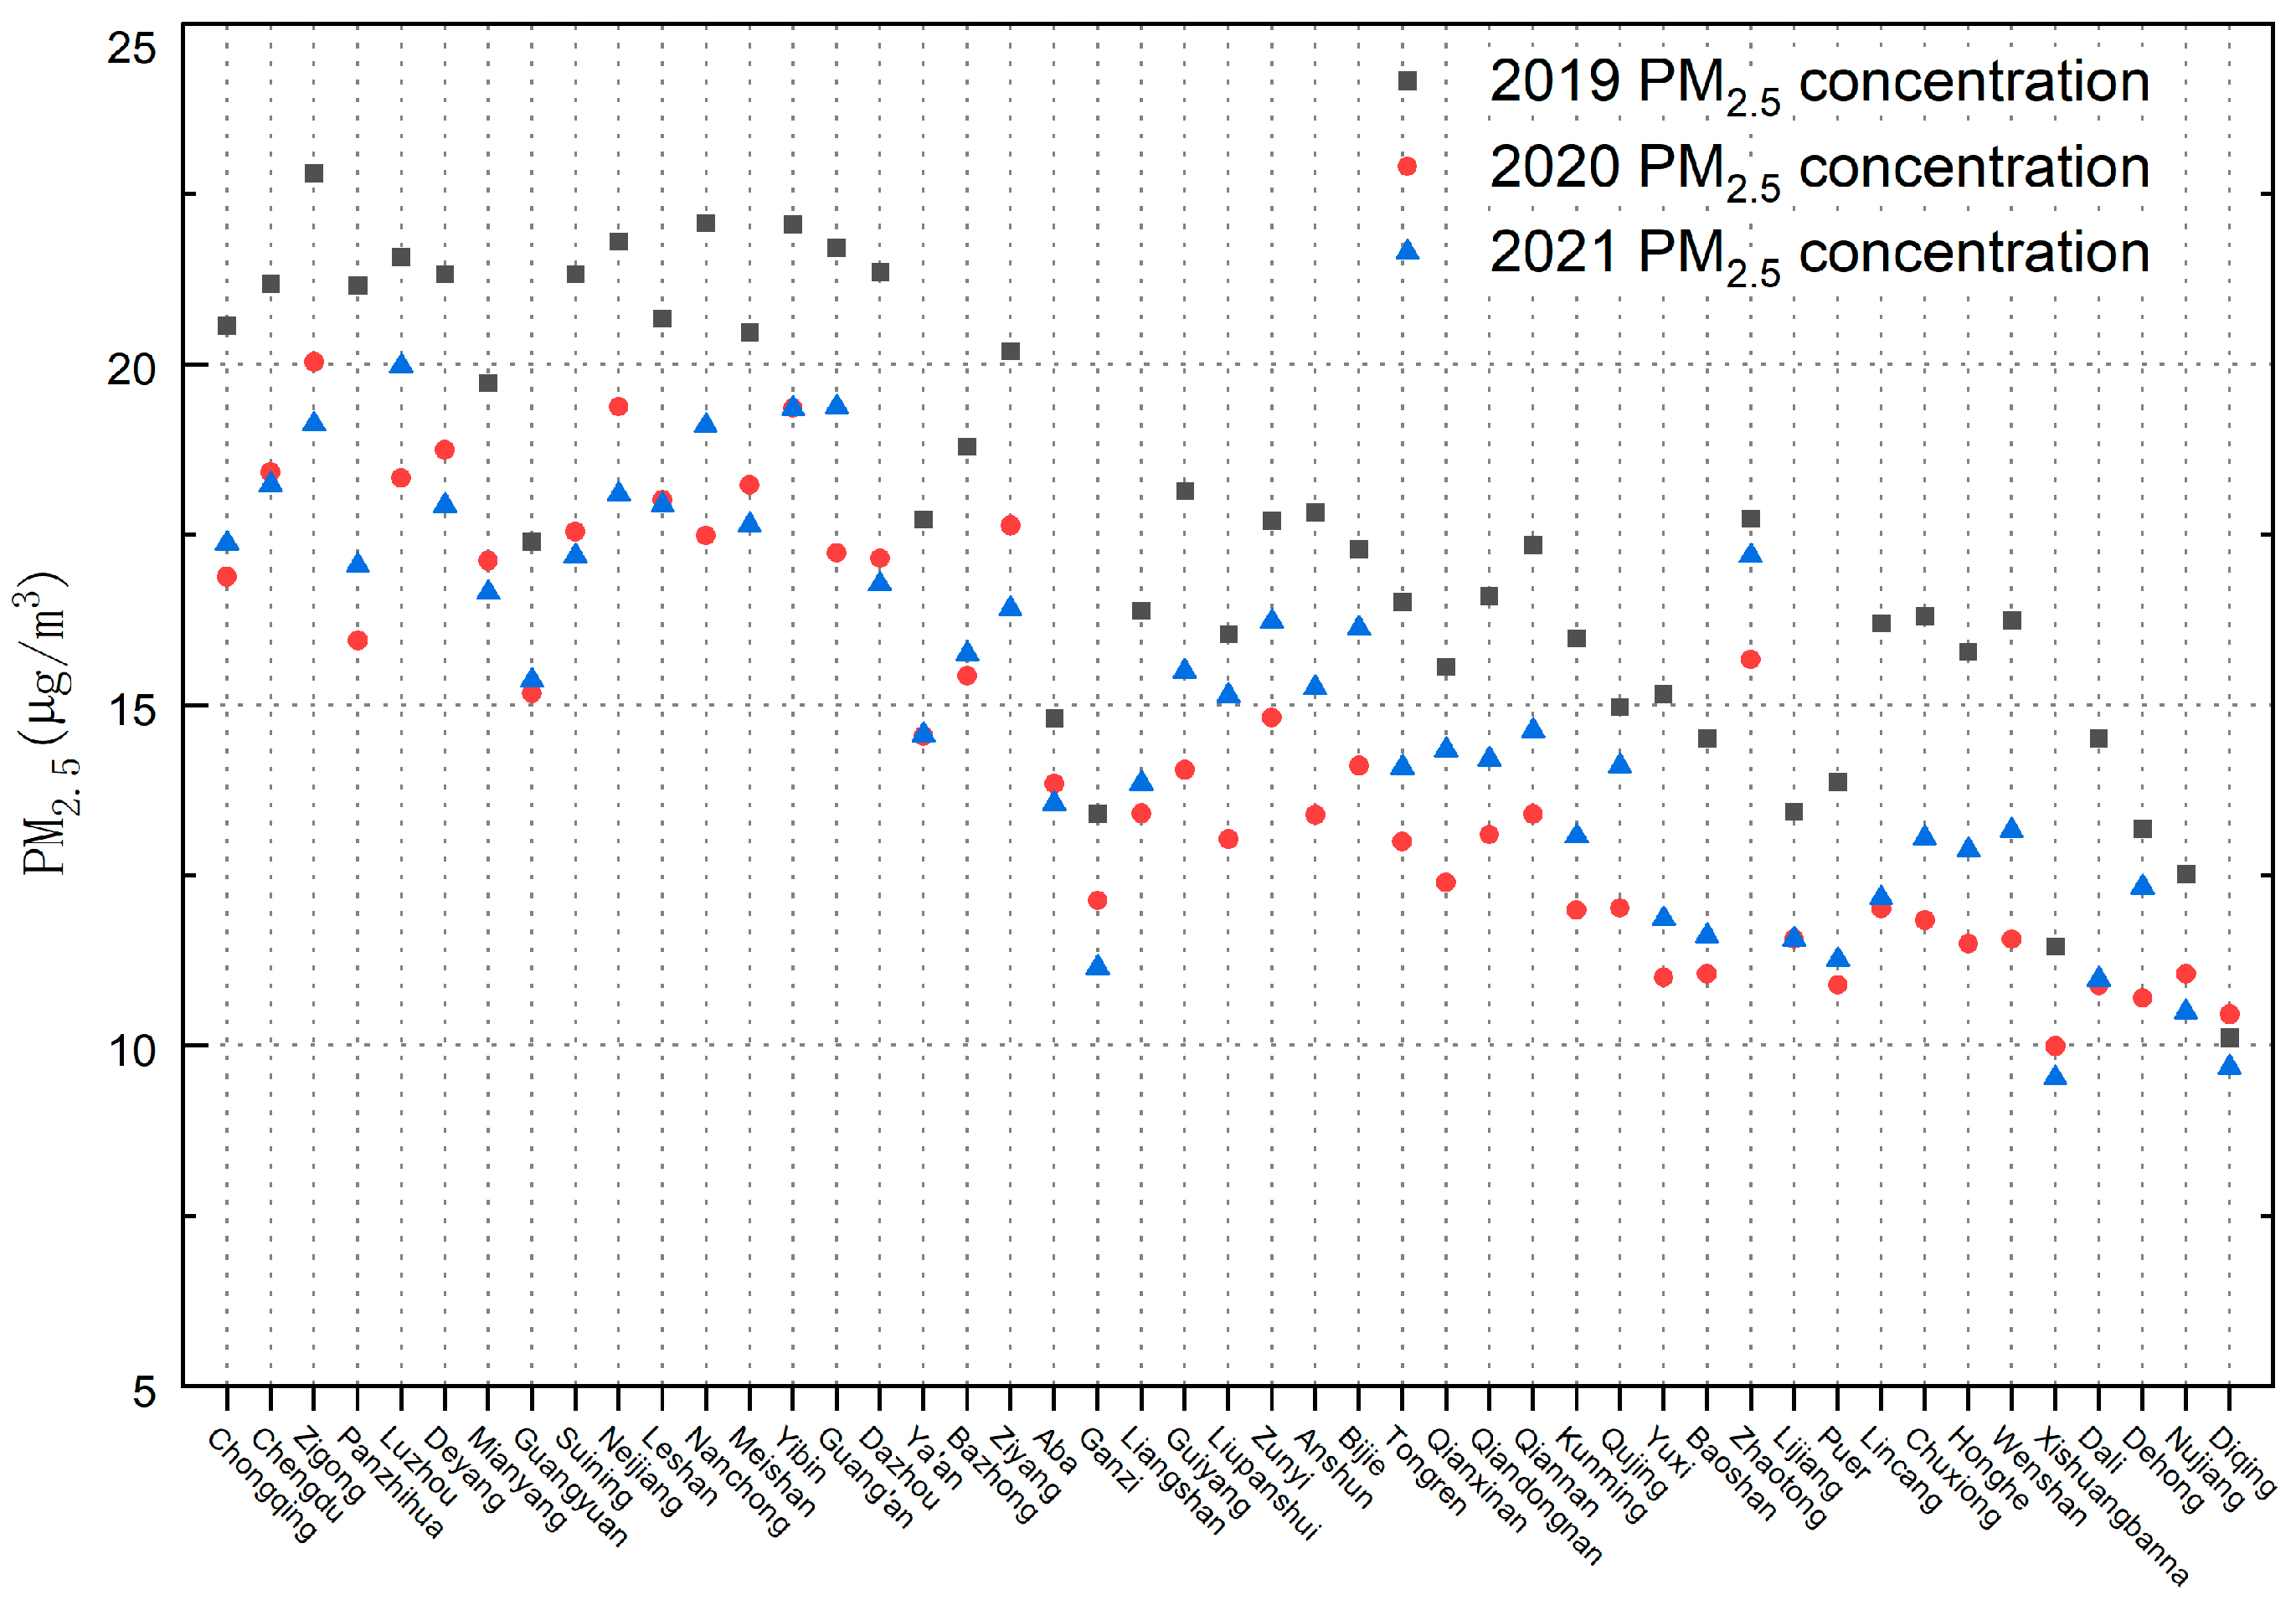
The changes in summer PM2.5 concentrations are shown in Figure 9. The concentrations in Chongqing, Sichuan, Guizhou, and Yunnan decreased by 11.8%, 14.8%, 16.6%, and 10.1%, respectively, in the summer of 2020 as compared with that in the same period in 2019 (with an average decrease of 13.4%) and increased by 8.9%, 11.2%, 18.3%, and 4.6%, respectively, in 2021 as compared with that in 2020. From the perspective of spatial distribution, the southwest region in summer 2019 showed a distribution of low west and high east, roughly bounded by the western Sichuan Plateau and western Yunnan, with a concentration range of 10–15 μg/m3, the Sichuan Basin between 21 and 30 μg/m3, and the rest of the area between 16 and 20 μg/m3. In the summer of 2020, the PM2.5 concentration range in the Sichuan Basin was between 16 and 20 μg/m3, and that in most of the rest of the area was between 10 and 15 μg/m3. In 2021, the range of 16–20 μg/m3 gradually expanded in the Sichuan Basin.
The changes in PM2.5 concentrations in autumn are shown in Figure 10. Chongqing Municipality, Sichuan Province, Guizhou Province, and Yunnan Province showed a decrease of 14.3%, 14.9%, 14.5%, and 8.5%, respectively, in 2020 as compared with 2019. In 2021, the values increased by 7.9%, 8.6%, 10.8%, and 1.4% in these cities as compared to 2020. Considering the spatial distribution, the areas with a PM2.5 concentration range between 10 and 15 μg/m3 in 2019 were mainly concentrated in Ganzi Prefecture in southwest Sichuan and Diqing Prefecture and Nujiang Prefecture in northwestern Yunnan Province. Most of the rest of Yunnan Province showed values ranging between 15 and 25 μg/m3, while Sichuan Basin and western Guizhou Province showed values between 26 and 35 and 21 and 30 μg/m3, respectively. In 2020, the PM2.5 ranges of Aba Prefecture, Ganzi Prefecture, and Liangshan Prefecture in Sichuan Province, Diqing Prefecture, Nujiang Prefecture, Dali Prefecture, Lijiang City, Baoshan City, Dehong Prefecture, Lincang City, Pu’er City, and Chuxiong Prefecture in Yunnan Province were all between 10 and 15 μg/m3 and the range in Guizhou Province was between 16 and 25 μg/m3. In 2021, the PM2.5 concentration range was 10–15 μg/m3 and significantly decreased as compared with that in 2020. The PM2.5 concentration rose to 21–25 μg/m3 in most areas of Yunnan Province, 16–25 μg/m3 in Guizhou Province, and 26–35 μg/m3 in the Sichuan Basin.
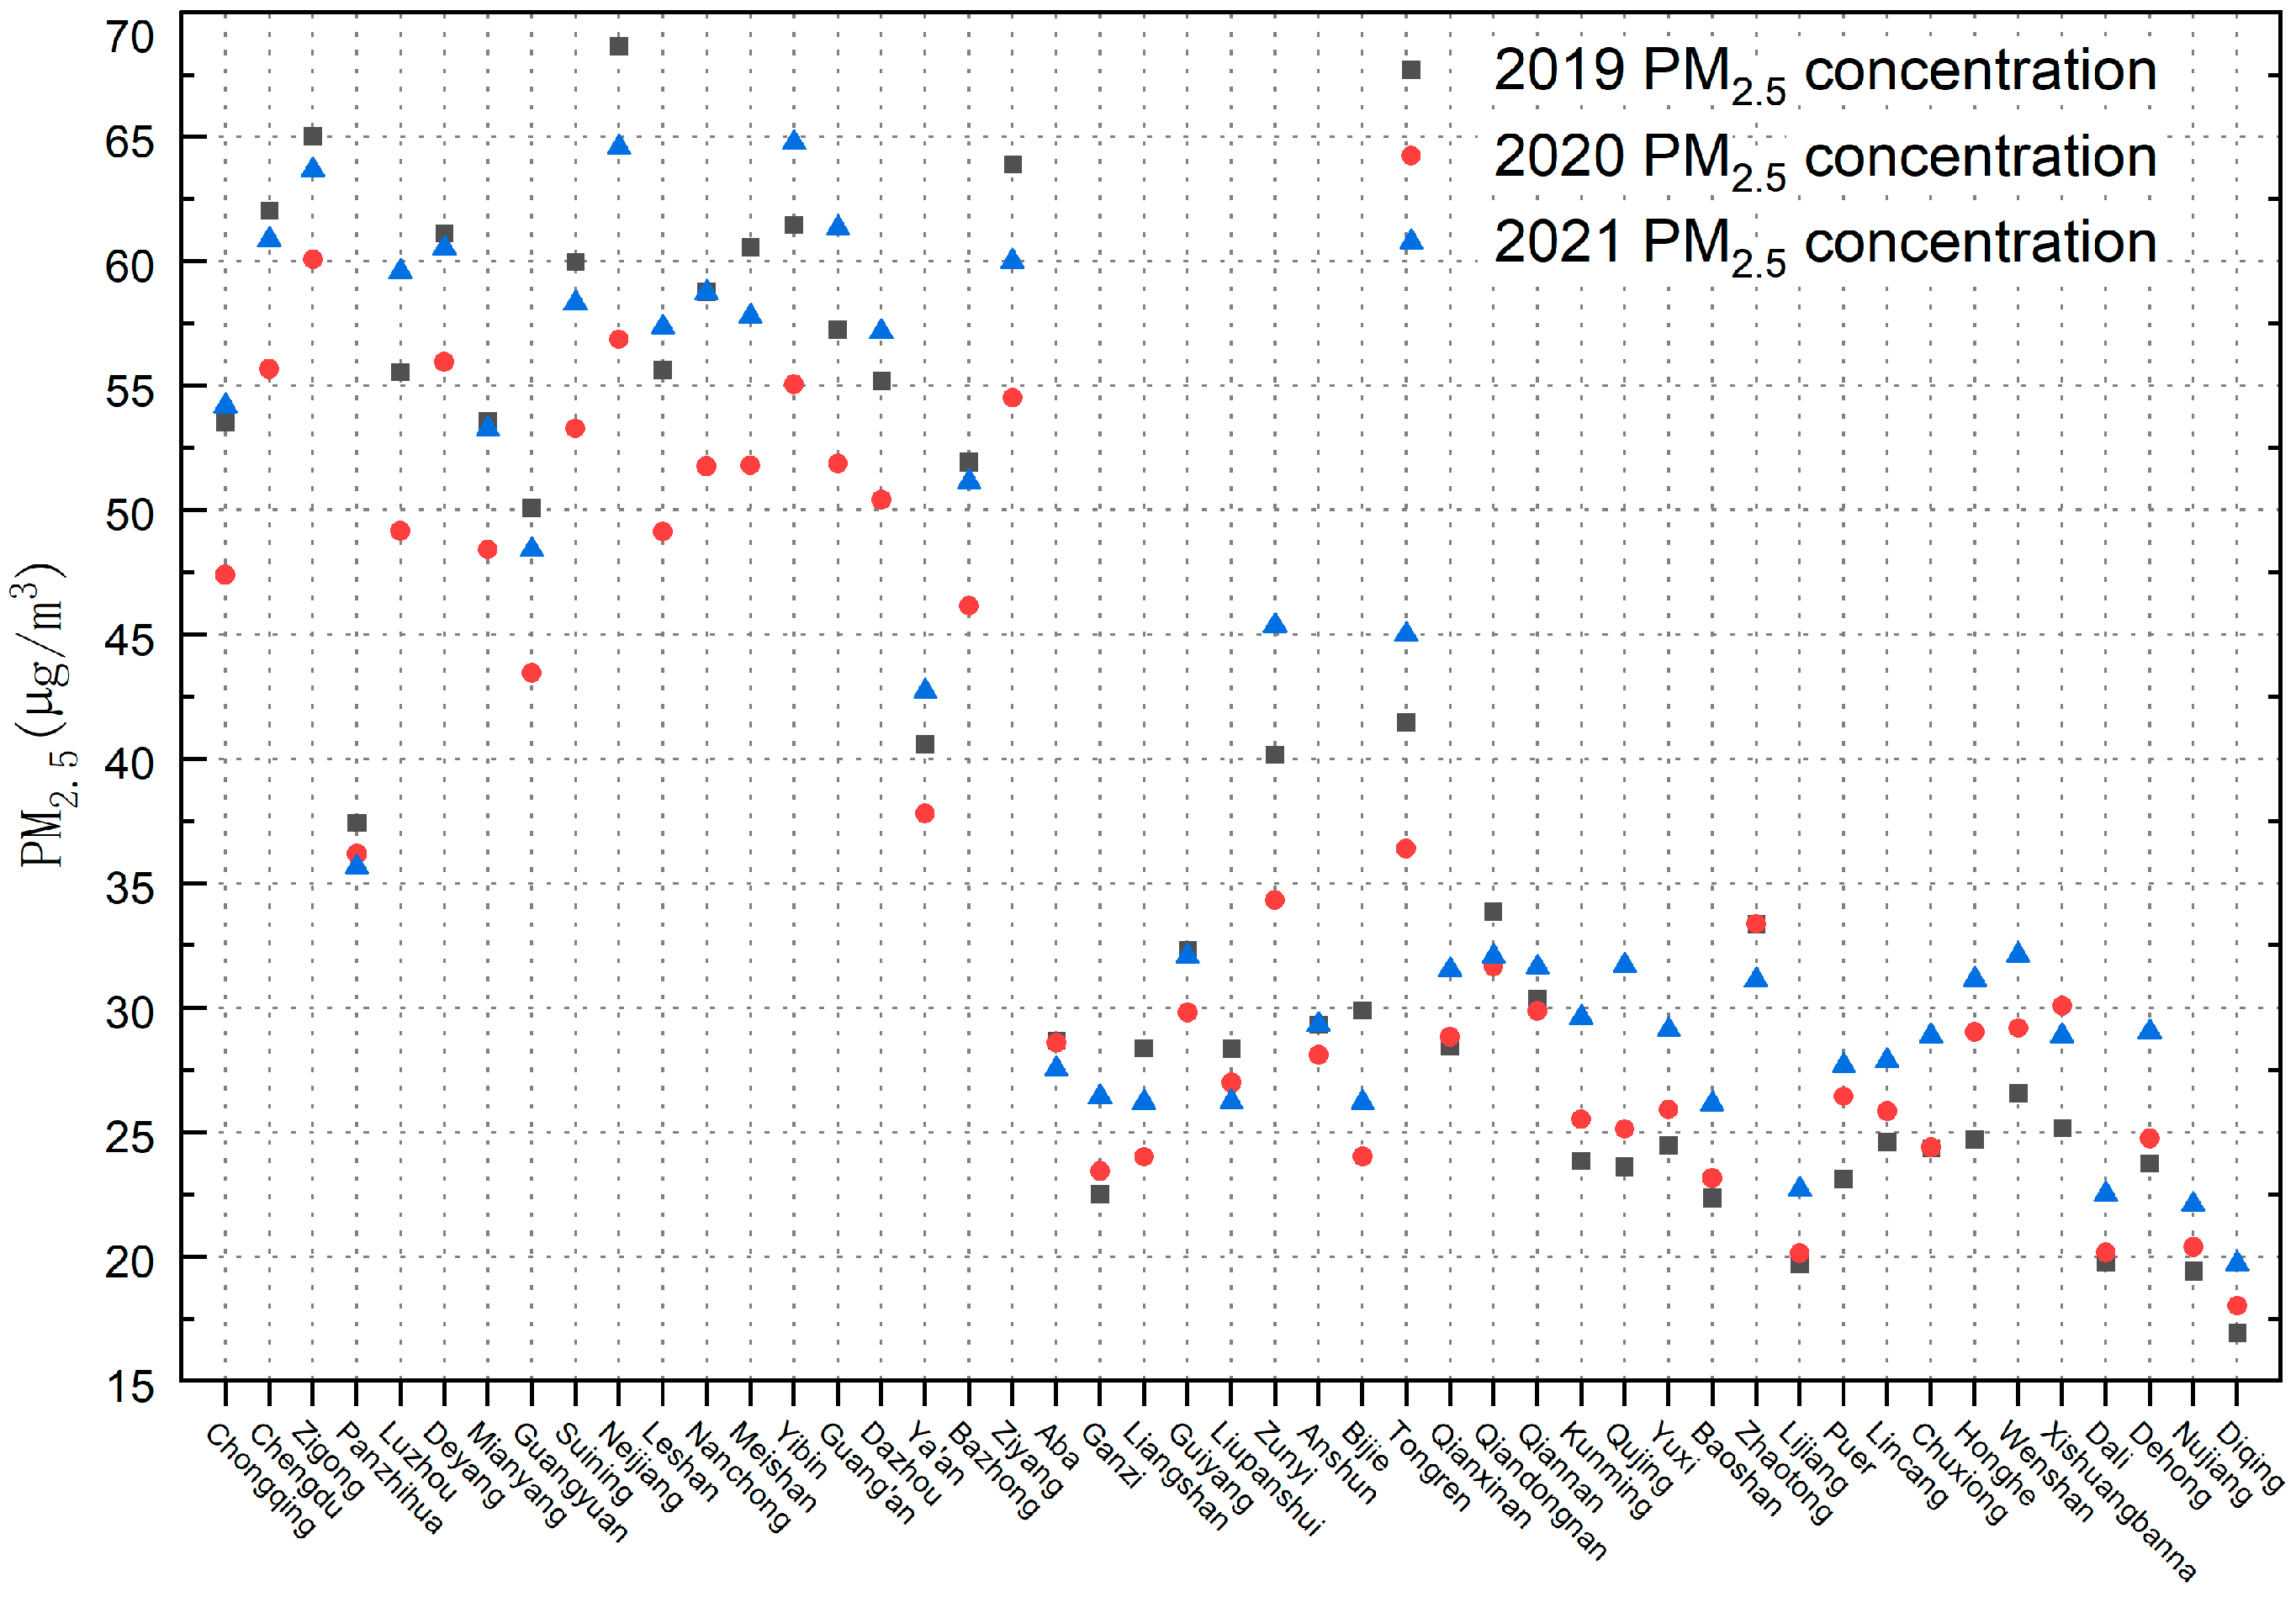
The changes in PM2.5 concentrations in winter are shown in Figure 11. In comparison with 2019, Chongqing Municipality, Sichuan Province, Guizhou Province, and Yunnan Province showed a decrease in PM2.5 concentration of 34.9%, 29.4%, 5.9%, and 3.5%, respectively, and the spatial distribution in winter was opposite to that in spring. The high-value areas were mainly located in the Sichuan Basin. In 2019, except for Aba Prefecture, Ganzi Prefecture, Liangshan Prefecture, and Panzhihua City in southern Sichuan, the rest of Sichuan–Chongqing exceeded 50 μg/m3. Tongren City and Zunyi City in Guizhou Province exceeded 40 μg/m3.
The PM2.5 concentrations in Chongqing, Sichuan, and Guizhou were higher in winter than in spring. Given the use of a large number of fossil fuels, the closed terrain, the high density of ground rivers, and the meteorological tendency to form stable weather, the unfavorable atmosphere caused by this special geographical environment makes it difficult for pollution to diffuse. This has been the cause of serious pollution in the region. The seasonal variation in the PM2.5 concentration in southern cities of Yunnan Province showed that the change was higher in spring than in winter, and the main reason for the continuous increase from winter to spring was exogenous transport pollution. The spring planting activities in South and Southeast Asian countries lead to the entry of the pollutants produced by biomass combustion in the southern region of Yunnan Province through wind action, which results in a significant increase in PM2.5 concentration in southern cities such as Lincang City, Pu’er City, Xishuangbanna Prefecture, Honghe Prefecture, and Wenshan Prefecture.
According to the “Fighting COVID-19 China in Action,” Wuhan, China, announced the closure of the city on 23 January 2020. Thus, China entered the most stringent stage of epidemic control. Chongqing and Sichuan Province are the most economically developed regions in southwest China where PM2.5 emissions reduced by 34.9% and 29.4%, respectively, making them the most obvious provinces and cities in southwest China. Therefore, the control measures taken to interrupt the spread of COVID-19 have achieved obvious emission reduction effects. Since 29 April 2020, the “China Action to Fight the Novel Coronavirus Pneumonia Epidemic” indicates that China’s epidemic prevention and control has entered a stage of normalized control in spring. At this stage, the epidemic situation in the southwest region was generally sporadic, and the positive trend of the epidemic continued to change. There has been a gradual increase in resumption of work and production. PM2.5 decreased by 18.6% in southwest China in spring 2020 as compared with 2019, which is a slight decrease in the rate of reduction compared with winter. After 2021, PM2.5 concentrations in all seasons in southwest China showed an upward trend as compared with the same period in 2020, indicating that the impact of COVID-19 is gradually decreasing.
4. Conclusions
Considering the southwest region of China as the research area, we used the PM2.5 site monitoring data from 2019 to 2021 and AOD, meteorological factors, NDVI, and DEM as independent variable factors to establish a spatial quantitative inversion model of PM2.5 on quarterly and annual time scales under the background of COVID-19, a social public event. The spatial variation in PM2.5 concentration in southwest China was studied over three years to better understand the characteristics of regional air pollution and effectively formulate prevention and control measures. The main conclusions of this study are as follows:
(1) From the perspective of the selection of model variables, there was a clear difference observed in the climate between seasons in southwest China. The influence of meteorological variables on PM2.5 during each season thus needs to be considered, and the main meteorological variables for each season were selected by combining the MLR model. Due to the large variations in altitude within the study area, for example, in the closed geographical environment and relatively low altitude of the Sichuan Basin region, meteorological inversion is prone to occur. When this occurs, both the atmospheric air convection and precipitation decrease, which can result in significant atmospheric pollution and is not conducive to the diffusion of atmospheric particles. Therefore, altitude was selected as a variable. Vegetation has a regulatory effect on atmospheric particulate matter, and different types of vegetation and tree species have different effects on PM2.5. The vegetation cover in different seasons in southwest China shows obvious temporal and spatial differences, so NDVI was selected as a variable.
(2) From the perspective of the regional distribution of PM2.5, different cities showed different degrees of response to PM2.5 changes during control of the pandemic. The pandemic had a significant impact in the economically developed urban agglomeration of Chengdu and Chongqing, with significant changes in PM2.5. However, areas such as Aba Prefecture and Ganzi Prefecture on the western Sichuan Plateau, and Diqing Prefecture and Nujiang Prefecture in northwest Yunnan Province, have sparse populations and are not as economically developed, resulting in relatively low PM2.5 concentrations and the response to change was not significant.
(3) From the perspective of temporal variations in PM2.5, the average concentrations over the three years were 32.1 μg/m3, 26.5 μg/m3, and 28.6 μg/m3, respectively. These variations in the PM2.5 concentrations over the three years showed a U-shaped change. In 2021, as the impact of the pandemic gradually diminished, the overall PM2.5 concentration rebounded. From a quarterly perspective, the change in the PM2.5 concentration during the four seasons of spring, summer, autumn, and winter represents a temporal distribution pattern of low PM2.5 concentrations in summer and autumn, and high PM2.5 concentrations during winter and spring. Compared to the same period in 2019, the concentration of PM2.5 in the four seasons of spring, summer, autumn, and winter in 2020 decreased by 20.3%, 13.3%, 11.9%, and 21.4%, respectively. Compared to the same period in 2020, the concentration of PM2.5 in the four seasons of spring, summer, autumn, and winter in 2021 increased by 19.8%, 9.1%, 5.8%, and 16.7%, respectively. Spring and winter in 2020 were the times of greatest control of COVID-19, with the largest changes.
In this study, AOD, meteorological factors, vegetation factors, and topographic factors were selected for model construction by analyzing the spatial distribution changes in PM2.5 before and after pandemic control from natural influencing factors. However, there are still shortcomings that require further improvement. The main shortcomings include the following:
(1) There are many factors that influence the PM2.5. In the present study, the model was mainly based on changes in the response of PM2.5 emission under natural conditions and was thus not considered in terms of the mechanism of PM2.5 generation. Thus, follow-up studies should consider the spatial distribution and changes in the PM2.5 concentrations of the emission sources which should be combined with atmospheric emission inventories.
(2) There are spatiotemporal differences in the relationship between PM2.5 and AOD, and the intrinsic governing principles and underlying mechanisms of PM2.5 and AOD should be considered in subsequent research. Factors that have a spatiotemporal influence on PM2.5 and AOD should also be considered more comprehensively.
(3) The terrain of southwest China is complex, with large variations in altitude and the social and economic development of the various provinces and cities. It is thus necessary to consider regional differences to construct a PM2.5 spatial inversion model in subsequent research.
Author Contributions
Conceptualization, X.L. and J.Z.; Formal analysis, X.L., Z.F. and J.Z.; Funding acquisition, J.W.; Investigation, Z.F.; Methodology, X.L.; Software, X.L. and Z.F.; Supervision, J.Z.; Validation, X.L.; Writing—original draft, X.L.; Writing—review and editing, J.W. All authors have read and agreed to the published version of the manuscript.
Funding
This research was funded by (1) the Multi-government International Science and Technology Innovation Cooperation Key Project of National Key Research and Development Program of China for the “Environmental monitoring and assessment of land use/land cover change impact on ecological security using geospatial technologies” (2018YFE0184300); (2) Graduate Research and Innovation Fund of Yunnan Normal University, “Research on Socio-economic Changes Before and After COVID-19 Control in Southwest China Based on PM2.5 Spatial Inversion Results (YJSJJ22-B102).
Institutional Review Board Statement
Not applicable.
Informed Consent Statement
Not applicable.
Data Availability Statement
Data are available on request.
Conflicts of Interest
The authors declare no conflict of interest.
References
- Rodríguez-Urrego, D.; Rodríguez-Urrego, L. Air quality during the COVID-19: PM2.5 analysis in the 50 most polluted capital cities in the world. Environ. Pollut. 2020, 266, 115042. [Google Scholar] [CrossRef] [PubMed]
- Bhat, S.A.; Bashir, O.; Bilal, M.; Ishaq, A.; Dar, M.U.D.; Kumar, R.; Bhat, R.A.; Sher, F. Impact of COVID-related lockdowns on environmental and climate change scenarios. Environ. Res. 2021, 195, 110839. [Google Scholar] [CrossRef] [PubMed]
- Díaz, J.; Antonio-López-Bueno, J.; Culqui, D.; Asensio, C.; Sánchez-Martínez, G.; Linares, C. Does exposure to noise pollution influence the incidence and severity of COVID-19? Environ. Res. 2021, 195, 110766. [Google Scholar] [CrossRef]
- Caraka, R.; Lee, Y.; Kurniawan, R.; Herliansyah, R.; Kaban, P.; Nasution, B.; Gio, P.; Chen, R.; Toharudin, T.; Pardamean, B. Impact of COVID-19 large scale restriction on environment and economy in Indonesia. Glob. J. Environ. Sci. Manag. 2020, 6, 65–84. [Google Scholar] [CrossRef]
- Fernandes, N. Economic Effects of Coronavirus Outbreak (COVID-19) on the World Economy. IESE Bus. Sch. Work. Pap. Ser. 2020. Available online: https://papers.ssrn.com/sol3/papers.cfm?abstract_id=3557504 (accessed on 23 March 2023). [CrossRef]
- Yuan, Q.; Qi, B.; Hu, D.; Wang, J.; Zhang, J.; Yang, H.; Zhang, S.; Liu, L.; Xu, L.; Li, W. Spatiotemporal variations and reduction of air pollutants during the COVID-19 pandemic in a megacity of Yangtze River Delta in China. Sci. Total Environ. 2020, 751, 141820. [Google Scholar] [CrossRef]
- He, G.; Pan, Y.; Tanaka, T. The short-term impacts of COVID-19 lockdown on urban air pollution in China. Nat. Sustain. 2020, 3, 1005–1011. [Google Scholar] [CrossRef]
- Ropkins, K.; Tate, J.E. Early observations on the impact of the COVID-19 lockdown on air quality trends across the UK. Sci. Total Environ. 2020, 754, 142374. [Google Scholar] [CrossRef]
- Jin, Q.; Luo, Y.; Meng, X.; Feng, M.; Huang, C. Short- and long-term impacts of the COVID-19 epidemic on urban PM2.5 variations: Evidence from a megacity, Chengdu. Atmos. Environ. 2023, 294, 119479. [Google Scholar] [CrossRef]
- Nguyen, T.P.M.; Bui, T.H.; Nguyen, M.K.; Vu, V.T.; Pham, H.L. Impact of COVID-19 partial lockdown on PM2.5, SO2, NO2, O3, and trace elements in PM2.5 in Hanoi, Vietnam. Environ. Sci. Pollut. Res. 2021, 29, 41875–41885. [Google Scholar] [CrossRef]
- Tan, Z.-Y.; Li, X.-H.; Gao, M.-L.; Jiang, L.-G. The Environmental Story During the COVID-19 Lockdown: How Human Activities Affect PM2.5 Concentration in China? IEEE Geosci. Remote Sens. Lett. 2020, 19, 1001005. [Google Scholar] [CrossRef] [PubMed]
- Cai, J.; Jia, Y.-H.; Wang, K. Prediction of development trend of COVID-19 in Wuhan based on SEIR model. Shandong Med. J. 2020, 60, 1–4. [Google Scholar]
- Jiang, Y.; Xu, J. The association between COVID-19 deaths and short-term ambient air pollution/meteorological condition exposure: A retrospective study from Wuhan, China. Air Qual. Atmos. Health 2020, 14, 1–5. [Google Scholar] [CrossRef] [PubMed]
- Zheng, S.; Fu, Y.; Sun, Y.; Zhang, C.; Wang, Y.; Lichtfouse, E. High resolution mapping of nighttime light and air pollutants during the COVID-19 lockdown in Wuhan. Environ. Chem. Lett. 2021, 19, 3477–3485. [Google Scholar] [CrossRef] [PubMed]
- Hu, Y.; Kong, L.; Yao, T.; Chen, X.; Du, W. Does lock-down of Wuhan effectively restrict early geographic spread of novel coronavirus epidemic during chunyun in China? A spatial model study. BMC Public Health 2021, 21, 825. [Google Scholar] [CrossRef]
- Zhang, L.; Li, D.; Ren, J. Analysis of COVID-19 by Discrete Multi-stage Dynamics System with Time Delay. Geomat. Inf. Sci. Wuhan Univ. 2020, 45, 658–666. [Google Scholar] [CrossRef]
- Zhang, X.; Wang, Q.-L.; Qing, W.-N. New implications of air pollution control in China: Based on natural experiments during the COVID-19 lockdown in Wuhan. China Popul. Resour. Environ. 2021, 31, 14–23. [Google Scholar]
- Tian, H.; Liu, Y.; Li, Y.; Wu, C.-H.; Chen, B.; Kraemer, M.U.G.; Li, B.; Cai, J.; Xu, B.; Yang, Q.; et al. An investigation of transmission control measures during the first 50 days of the COVID-19 epidemic in China. Science 2020, 368, 638–642. [Google Scholar] [CrossRef] [Green Version]
- Zhang, J.; Li, H.; Lei, M.; Zhang, L. The impact of the COVID-19 outbreak on the air quality in China: Evidence from a quasi-natural experiment. J. Clean. Prod. 2021, 296, 126475. [Google Scholar] [CrossRef]
- Alonso, C.; Raynor, P.C.; Davies, P.R.; Torremorell, M. Concentration, Size Distribution, and Infectivity of Airborne Particles Carrying Swine Viruses. PLoS ONE 2015, 10, e01356752015. [Google Scholar] [CrossRef] [Green Version]
- Yang, W.; Elankumaran, S.; Marr, L.C. Concentrations and size distributions of airborne influenza A viruses measured indoors at a health centre, a day-care centre and on aeroplanes. J. R. Soc. Interface 2011, 8, 1176–1184. [Google Scholar] [CrossRef] [PubMed] [Green Version]
- Wang, J.; Du, G. COVID-19 may transmit through aerosol. Ir. J. Med. Sci. 2020, 189, 1143–1144. [Google Scholar] [CrossRef] [PubMed] [Green Version]
- Yao, Y.; Pan, J.; Wang, W.; Liu, Z.; Kan, H.; Qiu, Y.; Meng, X.; Wang, W. Association of particulate matter pollution and case fatality rate of COVID-19 in 49 Chinese cities. Sci. Total Environ. 2020, 741, 140396. [Google Scholar] [CrossRef] [PubMed]
- Yao, Y.; Pan, J.; Liu, Z.; Meng, X.; Wang, W.; Kan, H.; Wang, W. Temporal association between particulate matter pollution and case fatality rate of COVID-19 in Wuhan. Environ. Res. 2020, 189, 109941. [Google Scholar] [CrossRef]
- Marinello, S.; Butturi, M.A.; Gamberini, R. How changes in human activities during the lockdown impacted air quality parameters: A review. Environ. Prog. Sustain. Energy 2021, 40, e136722021. [Google Scholar] [CrossRef]
- Wyche, K.; Nichols, M.; Parfitt, H.; Beckett, P.; Gregg, D.; Smallbone, K.; Monks, P. Changes in ambient air quality and atmospheric composition and reactivity in the South East of the UK as a result of the COVID-19 lockdown. Sci. Total Environ. 2020, 755, 142526. [Google Scholar] [CrossRef]
- Kumari, P.; Toshniwal, D. Impact of lockdown on air quality over major cities across the globe during COVID-19 pandemic. Urban Clim. 2020, 34, 100719. [Google Scholar] [CrossRef]
- Fan, C.; Li, Y.; Guang, J.; Li, Z.; Elnashar, A.; Allam, M.; De Leeuw, G. The Impact of the Control Measures during the COVID-19 Outbreak on Air Pollution in China. Remote Sens. 2020, 12, 1613. [Google Scholar] [CrossRef]
- Sharma, S.; Zhang, M.; Anshika; Gao, J.; Zhang, H.; Kota, S.H. Effect of restricted emissions during COVID-19 on air quality in India. Sci. Total Environ. 2020, 728, 138878. [Google Scholar] [CrossRef]
- Saxena, A.; Raj, S. Impact of lockdown during COVID-19 pandemic on the air quality of North Indian cities. Urban Clim. 2021, 35, 100754. [Google Scholar] [CrossRef]
- Sicard, P.; De Marco, A.; Agathokleous, E.; Feng, Z.; Xu, X.; Paoletti, E.; Rodriguez, J.J.D.; Calatayud, V. Amplified ozone pollution in cities during the COVID-19 lockdown. Sci. Total Environ. 2020, 735, 139542. [Google Scholar] [CrossRef] [PubMed]
- Zoran, M.-A.; Savastru, R.-S.; Savastru, D.-M.; Tautan, M.-N. Assessing the relationship between surface levels of PM2.5 and PM10 particulate matter impact on COVID-19 in Milan Italy. Sci. Total Environ. 2020, 738, 139825. [Google Scholar] [CrossRef]
- Viatte, C.; Petit, J.-E.; Yamanouchi, S.; Van Damme, M.; Doucerain, C.; Germain-Piaulenne, E.; Gros, V.; Favez, O.; Clarisse, L.; Coheur, P.-F.; et al. Ammonia and PM2.5 Air Pollution in Paris during the 2020 COVID Lockdown. Atmosphere 2021, 12, 160. [Google Scholar] [CrossRef]
- Ghosal, R.; Saha, E. Impact of the COVID-19 induced lockdown measures on PM2.5 concentration in USA. Atmos. Environ. 2021, 254, 118388. [Google Scholar] [CrossRef]
- Bashir, M.-F.; Ma, B.-J.; Bilal; Komal, B.; Bashir, M.-A.; Farooq, T.-H.; Iqbal, N.; Bashir, M. Correlation between environ-mental pollution indicators and COVID-19 pandemic: A brief study in Californian context. Environ Res. 2020, 187, 109652. [Google Scholar] [CrossRef]
- Wang, Q.; Li, S.-Y. Nonlinear impact of COVID-19 on pollutions—Evidence from Wuhan, New York, Milan, Madrid, Bandra, London, Tokyo and Mexico City. Sustain. Cities Soc. 2021, 65, 102629. [Google Scholar] [CrossRef] [PubMed]
- Ali, S.M.; Malik, F.; Anjum, M.S.; Siddiqui, G.F.; Anwar, M.N.; Lam, S.S.; Nizami, A.-S.; Khokhar, M.F. Exploring the linkage between PM2.5 levels and COVID-19 spread and its implications for socio-economic circles. Environ. Res. 2020, 193, 110421. [Google Scholar] [CrossRef] [PubMed]
- Hasnain, A.; Hashmi, M.; Bhatti, U.; Nadeem, B.; Wei, G.; Zha, Y.; Sheng, Y. Assessment of Air Pollution before, during and after the COVID-19 Pandemic Lockdown in Nanjing, China. Atmosphere 2021, 12, 743. [Google Scholar] [CrossRef]
- Zhang, H.; Zhang, L.; Yang, L.; Zhou, Q.; Zhang, X.; Xing, W.; Hayakawa, K.; Toriba, A.; Tang, N. Impact of COVID-19 Outbreak on the Long-Range Transport of Common Air Pollutants in KUWAMS. Chem. Pharm. Bull. 2021, 69, 237–245. [Google Scholar] [CrossRef]
- RICHARD, T.-A.; Francisco, C.; Jhojan, P.-R.; Carlos, A.-M.; Rodrigo, S.; Laura, G.; Mauricio, O.; Nicolás, P.; Manuel, A.-L.-G. Air pollution and COVID-19 lockdown in a large South American city: Santiago Metropolitan Area Chile. Urban Clim. 2021, 36, 100803. [Google Scholar]
- Berman, J.D.; Ebisu, K. Changes in U.S. air pollution during the COVID-19 pandemic. Sci. Total Environ. 2020, 739, 139864. [Google Scholar] [CrossRef] [PubMed]
- Li, H.-T.; Cai, X.-B.; Dong, J.-D.; Chen, F.; Chen, X.-L. The impact of COVID-19 control measures on atmospheric pollutant concentrations indifferent epidemic areas of China. J. Cent. China Norm. Univ. 2020, 54, 1051–1058. [Google Scholar]
- Wu, L.-B.; Ren, F.-Z.; Xu, S.-D. Impact of First-level Response to COVID-19 on the Reduction of Urban Air Pollutants in China. J. Environ. Econ. 2020, 5, 1–20. [Google Scholar]
- Wang, A.-P.; Zhu, B.; Qin, W.; Qin, Y.-H.; Yang, X.; Li, X.-H. Air quality in Nanjing during COVID-19 lockdown period. China Environ. Sci. 2021, 41, 3088–3095. [Google Scholar]
- Chen, H.; Huo, J.; Fu, Q.; Duan, Y.; Xiao, H.; Chen, J. Impact of quarantine measures on chemical compositions of PM2.5 during the COVID-19 epidemic in Shanghai, China. Sci. Total Environ. 2020, 743, 140758. [Google Scholar] [CrossRef]
- Zheng, H.; Kong, S.; Chen, N.; Yan, Y.; Qi, S. Significant changes in the chemical compositions and sources of PM2.5 in Wuhan since the city lockdown as COVID-19. Sci. Total Environ. 2020, 739, 140000. [Google Scholar] [CrossRef] [PubMed]
- Zhao, X.; Shen, N.-C.; Li, L.-J.; Wu, G.-F.; Tao, J.; Zhao, W.-J. Analysis of Changes and Factors Influencing Air Pollutants in the Beijing-Tianjin-Hebei Region During the COVID-19 Pandemic. Environ. Sci. 2021, 42, 1205–1214. [Google Scholar]
- Zhang, K.; de Leeuw, G.; Yang, Z.; Chen, X.; Jiao, J. The Impacts of the COVID-19 Lockdown on Air Quality in the Guan Zhong Basin China. Remote Sens. 2020, 12, 3042. [Google Scholar] [CrossRef]
- Zhang, Y.; Ma, Z.; Gao, Y.; Zhang, M. Impacts of the meteorological condition versus emissions reduction on the PM2.5 concentration over Beijing–Tianjin–Hebei during the COVID-19 lockdown. Atmos. Ocean. Sci. Lett. 2020, 14, 100014. [Google Scholar] [CrossRef]
- Wen, L.; Yang, C.; Liao, X.; Zhang, Y.; Chai, X.; Gao, W.; Guo, S.; Bi, Y.; Tsang, S.-Y.; Chen, Z.-F.; et al. Investigation of PM2.5 pollution during COVID-19 pandemic in Guangzhou, China. J. Environ. Sci. 2022, 115, 443–452. [Google Scholar] [CrossRef]
- Gao, M.; Yang, H.; Xiao, Q.; Goh, M. COVID-19 lockdowns and air quality: Evidence from grey spatiotemporal forecasts. Socio-Econ. Plan. Sci. 2022, 83, 101228. [Google Scholar] [CrossRef] [PubMed]
- Ye, C.; Wu, C.; Zhang, J. Comparision about how to get rid of abnormal data in metrology & measurement. Metrol. Meas. Tech. 2007, 34, 26–27. [Google Scholar]
- Sun, D.; Yang, S.; Wang, T.; Shu, L.; Qu, Y. Characteristics of O3 and PM2.5 and its impact factors in Yangtze River Delta. J. Meteorol. Sci. 2019, 39, 164–177. [Google Scholar]
- Lyapustin, A.; Wang, Y.; Korkin, S.; Huang, D. MODIS Collection 6 MAIAC algorithm. Atmos. Meas. Tech. 2018, 11, 5741–5765. [Google Scholar] [CrossRef] [Green Version]
- Lyapustin, A.; Wang, Y.; Laszlo, I.; Kahn, R.; Korkin, S.; Remer, L.; Levy, R.; Reid., J.-S. Multiangle implementation of atmospheric correction (MAIAC): 2 Aerosol algorithm. J. Geophys. Res. 2011, 127, 385–393. [Google Scholar] [CrossRef]
- Han, X.; Cui, X.; Ding, L.; Li, Z. Establishment of PM2.5 Prediction Model Based on MAIAC AOD Data of High Resolution Remote Sensing Images. Int. J. Pattern Recognit. Artif. Intell. 2019, 33, 19540091–195400915. [Google Scholar] [CrossRef]
- Liang, F.; Xiao, Q.; Wang, Y.; Lyapustin, A.; Li, G.; Gu, D.; Pan, X.; Liu, Y. MAIAC-based long-term spatiotemporal trends of PM2.5 in Beijing, China. Sci. Total Environ. 2018, 616–617, 1589–1598. [Google Scholar] [CrossRef]
- Zhang, Z.; Wu, W.; Fan, M.; Wei, J.; Tan, Y.; Wang, Q. Evaluation of MAIAC aerosol retrievals over China. Atmos. Environ. 2019, 202, 8–16. [Google Scholar] [CrossRef]
- Ma, Z.; Hu, X.; Sayer, A.M.; Levy, R.; Zhang, Q.; Xue, Y.; Tong, S.; Bi, J.; Huang, L.; Liu, Y. Satellite-Based Spatiotemporal Trends in PM 2.5 Concentrations: China, 2004–2013. Environ. Health Perspect. 2016, 124, 184–192. [Google Scholar] [CrossRef] [Green Version]
- Wang, Z.-B.; Fang, C.-L. Spatial-temporal characteristics and determinants of PM2.5 in the Bohai Rim Urban Agglomeration. Chemosphere 2016, 148, 148–162. [Google Scholar] [CrossRef]
- Mirzaei, M.; Amanollahi, J.; Tzanis, C.G. Evaluation of linear, nonlinear, and hybrid models for predicting PM2.5 based on a GTWR model and MODIS AOD data. Air Qual. Atmos. Health 2019, 12, 1215–1224. [Google Scholar] [CrossRef]
- Erkin, N.; Simayi, M.; Ablat, X.; Yahefu, P.; Maimaiti, B. Predicting spatiotemporal variations of PM2.5 concentrations during spring festival for county-level cities in China using VIIRS-DNB data. Atmos. Environ. 2023, 294, 119484. [Google Scholar] [CrossRef]
- He, Q.; Huang, B. Satellite-based high-resolution PM2.5 estimation over the Beijing-Tianjin-Hebei region of China using an improved geographically and temporally weighted regression model. Environ. Pollut. 2018, 236, 1027–1037. [Google Scholar] [CrossRef] [PubMed]
- Pete, S.; Joe, W. The impact of pre-selected variance inflation factor thresholds on the stability and predictive power of logistic regression models in credit scoring. Ima J. Manag. Math. 2015, 31, 17–37. [Google Scholar] [CrossRef] [Green Version]
- Gupta, P.; Levy, R.C.; Mattoo, S.; Remer, L.A.; Munchak, L.A. A surface reflectance scheme for retrieving aerosol optical depth over urban surfaces in MODIS dark target retrieval algorithm. Atmos. Meas. Tech. 2016, 9, 3293–3308. [Google Scholar] [CrossRef] [Green Version]
- Bagheri, H. A machine learning-based framework for high resolution mapping of PM2.5 in Tehran, Iran, using MAIAC AOD data. Adv. Space Res. 2022, 69, 3333–3349. [Google Scholar] [CrossRef]
- He, Q.-Q.; Huang, B.-B. Satellite-based mapping of daily high-resolution ground P PM2.5 in China via space-time regression modeling. Remote Sens. Environ. 2018, 206, 72–83. [Google Scholar] [CrossRef]
- van Donkelaar, A.; Hammer, M.S.; Bindle, L.; Brauer, M.; Brook, J.R.; Garay, M.J.; Hsu, N.C.; Kalashnikova, O.V.; Kahn, R.A.; Lee, C.; et al. Monthly Global Estimates of Fine Particulate Matter and Their Uncertainty. Environ. Sci. Technol. 2021, 55, 15287–15300. [Google Scholar] [CrossRef]
- Wei, J.; Li, Z.; Lyapustin, A.; Sun, L.; Peng, Y.; Xue, W.; Su, T.; Cribb, M. Reconstructing 1-km-resolution high-quality PM2.5 data records from 2000 to 2018 in China: Spatiotemporal variations and policy implications. Remote Sens. Environ. 2020, 252, 112136. [Google Scholar] [CrossRef]
Figure 1.
Geographic location and air pollution monitoring stations in southwest China.

Figure 2.
Annual fitting results of GTWR and MLR models. (a) GTWR fitting results; (b) MLR fitting results.
Figure 2.
Annual fitting results of GTWR and MLR models. (a) GTWR fitting results; (b) MLR fitting results.

Figure 3.
Quarterly fitting results of GTWR and MLR models. ((a,c,e,g) represent the GTWR fitting results for spring, summer, autumn, and winter; (b,d,f,h) represent the MLR fitting results for spring, summer, autumn, and winter).
Figure 3.
Quarterly fitting results of GTWR and MLR models. ((a,c,e,g) represent the GTWR fitting results for spring, summer, autumn, and winter; (b,d,f,h) represent the MLR fitting results for spring, summer, autumn, and winter).

Figure 4.
Comparison of the results with the dataset. (a) shows the fitting result between the CHAP dataset and the observation station, (b) shows the fitting result between the ACAG dataset and the observation station.
Figure 4.
Comparison of the results with the dataset. (a) shows the fitting result between the CHAP dataset and the observation station, (b) shows the fitting result between the ACAG dataset and the observation station.

Figure 5.
Annual change in PM2.5 spatial distribution in southwest China.

Figure 6.
Annual change in PM2.5 concentration in cities in southwest China.

Figure 7.
Quarterly changes in PM2.5 spatial distribution in southwest China.

Figure 8.
Changes in PM2.5 concentration in cities of southwest China in spring.

Figure 9.
Changes in PM2.5 concentration in cities of southwest China in summer.

Figure 10.
Changes in PM2.5 concentrations in cities of southwest China in autumn.

Figure 11.
Changes in PM2.5 concentrations in cities of southwest China in winter.


Table 1.
Variable selection results.
| Year | Spring | Summer | Autumn | Winter | |||||||||||
|---|---|---|---|---|---|---|---|---|---|---|---|---|---|---|---|
| variable | coefficient | VIF | sig | coefficient | VIF | sig | coefficient | VIF | sig | coefficient | VIF | sig | coefficient | VIF | sig |
| AOD | 0.34 | 1.23 | 0.001 | 0.35 | 2.28 | 0.001 | 037 | 1.18 | 0.001 | 0.37 | 1.11 | 0.001 | 0.30 | 1.29 | 0.001 |
| BLH | −0.09 | 3.91 | 0.028 | −0.02 | 3.92 | 0.036 | - | - | - | −0.12 | 10.42 | 0.040 | −0.18 | 22.31 | 0.025 |
| RH | 0.02 | 3.61 | 0.066 | - | - | - | 0.05 | 2.05 | 0.074 | - | - | - | 0.03 | 16.11 | 0.039 |
| SP | 0.19 | 2.17 | 0.025 | 0.19 | 5.25 | 0.021 | 0.16 | 3.16 | 0.056 | 0.17 | 4.42 | 0.041 | 0.11 | 3.35 | 0.019 |
| TEM | −0.16 | 4.18 | 0.019 | −0.27 | 4.65 | 0.044 | −0.23 | 3.34 | 0.046 | −0.16 | 48.13 | 0.091 | −0.08 | 2.54 | 0.056 |
| TP | −0.03 | 1.40 | 0.121 | - | - | - | −0.01 | 1.95 | 0.092 | −0.11 | 2.08 | 0.088 | - | - | - |
| WS | −0.05 | 1.86 | 0.003 | −0.07 | 3.09 | 0.002 | −0.08 | 1.20 | 0.006 | −0.05 | 1.41 | 0.008 | −0.09 | 3.31 | 0.001 |
| NDVI | −0.05 | 1.42 | 0.001 | - | - | - | −0.06 | 1.15 | 0.001 | −0.02 | 1.34 | 0.001 | - | - | - |
| DEM | −0.09 | 1.30 | 0.001 | −0.11 | 1.19 | 0.001 | −0.07 | 1.06 | 0.001 | −0.09 | 1.10 | 0.001 | −0.06 | 1.06 | 0.001 |
Table 2.
Results of descriptive statistical analysis of variables.
| Variable | MIN | MAX | AVG | SD |
|---|---|---|---|---|
| PM2.5 (µg/m3) | 4.8~6.2 | 74.2~95.1 | 27.9~28.9 | 10.9~17.4 |
| AOD (unitless) | 0.02~0.07 | 0.84~0.95 | 0.35~0.38 | 0.17~0.21 |
| TEM (K) | 267.6~276.5 | 303.5~315.3 | 292.4~297.6 | 44.1~69.8 |
| TP (mm) | 0~0.8 | 62.1~88.2 | 4.3~5.8 | 2.7~2.8 |
| SP (hpa) | 821.1~868.3 | 1044.3~1069.4 | 962.2~1002.9 | 32.5~38.1 |
| RH (%) | 3~9 | 83~100 | 41~61 | 17~21 |
| WS (m/s) | 0~0.6 | 4.6~5.8 | 1.4~2.4 | 0.9~1.2 |
| BLH (m) | 282.1~375.9 | 2115.7~2803.1 | 999.5~1041.7 | 335.2~375.1 |
| NDVI (unitless) | −0.02~0.09 | 0.91~0.92 | 0.59~0.62 | 0.15~0.17 |
| ELEVATION (m) | 77.5 | 6233.8 | 1995.3 | 1324.3 |
Table 3.
Annual variation in PM2.5 concentration in provinces and cities in southwest China (Unit: μg/m3).
Table 3.
Annual variation in PM2.5 concentration in provinces and cities in southwest China (Unit: μg/m3).
| Province | 2019 | 2020 | 2021 |
|---|---|---|---|
| Chongqing | 38.8 | 30.8 | 33.7 |
| Sichuan | 34.6 | 28.9 | 31.1 |
| Guizhou | 29.1 | 24.5 | 26.4 |
| Yunnan | 25.9 | 21.9 | 23.1 |
| Southwest | 32.1 | 26.5 | 28.6 |
Table 4.
Quarterly variation of PM2.5 concentration in provinces and cities in southwest China (Unit: μg/m3).
Table 4.
Quarterly variation of PM2.5 concentration in provinces and cities in southwest China (Unit: μg/m3).
| Season | Year | Chongqing | Sichuan | Guizhou | Yunnan | Southwest |
|---|---|---|---|---|---|---|
| Spring | 2019 | 36.3 | 34.1 | 27.5 | 32.1 | 32.5 |
| 2020 | 24.6 | 24.8 | 25.9 | 30.3 | 26.4 | |
| 2021 | 31.3 | 32.6 | 26.6 | 31.8 | 30.6 | |
| Summer | 2019 | 22.0 | 20.9 | 17.1 | 15.3 | 18.9 |
| 2020 | 19.4 | 17.9 | 14.3 | 13.8 | 16.3 | |
| 2021 | 21.2 | 19.8 | 16.9 | 14.4 | 18.1 | |
| Autumn | 2019 | 30.5 | 28.4 | 23.0 | 18.4 | 25.1 |
| 2020 | 26.2 | 24.2 | 19.7 | 16.8 | 21.7 | |
| 2021 | 28.2 | 26.3 | 21.8 | 17.1 | 23.3 | |
| Winter | 2019 | 48.1 | 45.5 | 34.0 | 24.5 | 38.0 |
| 2020 | 31.3 | 32.1 | 32.0 | 23.7 | 29.8 | |
| 2021 | 39.5 | 38.5 | 34.6 | 24.2 | 34.2 |
Disclaimer/Publisher’s Note: The statements, opinions and data contained in all publications are solely those of the individual author(s) and contributor(s) and not of MDPI and/or the editor(s). MDPI and/or the editor(s) disclaim responsibility for any injury to people or property resulting from any ideas, methods, instructions or products referred to in the content. |
© 2023 by the authors. Licensee MDPI, Basel, Switzerland. This article is an open access article distributed under the terms and conditions of the Creative Commons Attribution (CC BY) license (https://creativecommons.org/licenses/by/4.0/).
Share and Cite
MDPI and ACS Style
Li, X.; Zhou, J.; Wang, J.; Feng, Z. Study on Spatial Changes in PM2.5 before and after the COVID-19 Pandemic in Southwest China. Atmosphere 2023, 14, 671. https://doi.org/10.3390/atmos14040671
AMA Style
Li X, Zhou J, Wang J, Feng Z. Study on Spatial Changes in PM2.5 before and after the COVID-19 Pandemic in Southwest China. Atmosphere. 2023; 14(4):671. https://doi.org/10.3390/atmos14040671
Chicago/Turabian StyleLi, Xing, Jingchun Zhou, Jinliang Wang, and Zhanyong Feng. 2023. "Study on Spatial Changes in PM2.5 before and after the COVID-19 Pandemic in Southwest China" Atmosphere 14, no. 4: 671. https://doi.org/10.3390/atmos14040671
Note that from the first issue of 2016, this journal uses article numbers instead of page numbers. See further details here.