Article

Regional Differences in PM2.5 Environmental Efficiency and Its Driving Mechanism in Zhejiang Province, China

1
Key Laboratory of Urban Environment and Health, Institute of Urban Environment, Chinese Academy of Sciences, Xiamen 361021, China
2
University of Chinese Academy of Sciences, No. 19(A) Yuquan Road, Beijing 100049, China
3
Xiamen Key Lab of Urban Metabolism, Xiamen 361021, China
4
Industrial Economic Research Center around Hangzhou Bay, Ningbo Polytechnic, Ningbo 315800, China
*
Authors to whom correspondence should be addressed.
Atmosphere 2023, 14(4), 672; https://doi.org/10.3390/atmos14040672
Submission received: 22 February 2023 / Revised: 28 March 2023 / Accepted: 30 March 2023 / Published: 1 April 2023
(This article belongs to the Special Issue Air Pollution and Climate Issues in the Coastal Atmosphere of China)

Abstract

:
Improving the digital economy and environmental governance efficiency are important methods for current high-quality economic development. Based on the panel data of 11 cities in Zhejiang, on the eastern coast of China, fine particulate matter smaller than a 2.5 μm (PM2.5) environmental efficiency (PMEE) was measured by the undesirable output Slack-Based Measure-Data Envelopment Analysis (SBM-DEA) model. The fixed effect regression model, the divergences in the difference model and other empirical methods were obtained to test the driving mechanism of social-economic factors on the PMEE. The results showed that: (1) the concentration of PM2.5 was continually decreasing, and environmental quality experienced a continuous improvement in Zhejiang province in the observation period, although cities such as Hangzhou, Jiaxing and Shaoxing have relatively severe PM2.5 pollution. (2) The total average value of PMEE in Zhejiang was 0.6430 over the observation period, while there was still a lot of room for improvement when compared to the production frontier. Additionally, PMEE in each city showed a fluctuating growth trend. Cities with a higher PMEE were mainly Zhoushan, Hangzhou and Ningbo. (3) The level of the digital economy had a positive role in promoting the PMEE, which was statistically significant. The level of pollution control and technological innovation also had a significantly positive effect. However, the ratio of the industrial output value to the gross domestic product (GDP) presented a negative effect on the PMEE. In the future, it is suggested that the development of the urban digital economy should be accelerated in an all-around way to improve the efficiency of government pollution control and to improve the technical efficiency of PM2.5 via innovative technological progress.

1. Introduction

Improving the efficiency of environmental governance is a crucial measure in order to fight a tough battle against environmental pollution and guarantee high-quality economic development [1,2,3]. At present, China is facing a severe challenge in air pollution control [4,5]. According to the data announced by the Ministry of Ecology and Environment, in 2020, about 33 percent of 337 cities in China did not meet the Class II national standard for the concentration of fine particulate matter smaller than 2.5 μm (PM2.5), which is defined as a fine inhalable particle with a diameter less than 2.5 μm. The ozone concentration fluctuated and increased, and regional severe air pollution weather took place frequently. Thus, it is of great practical significance to continually strengthen the control of air pollution and to improve the efficiency of a reduction in PM2.5 emissions [6,7].
Meanwhile, the research on the socio-economic driving factors of air pollution provides an essential reference for environmental pollution control [8]. Many scholars have discussed the causes of air pollution, smog, and pollution reduction paths from different perspectives, such as economic growth, foreign investment, industrial structure, environmental regulation, fiscal decentralization, population agglomeration, urbanization development, and technological innovation [9,10,11]. At present, China’s economy has proceeded into the era of Industry 4.0, and the digital economy has become a crucial propulsion power for high-quality economic development, playing a vital role in transforming the economic development mode and promoting the construction of ecological civilization [12,13]. However, existing research on the relationship between the digital economy and environmental pollution is still in its infancy [14,15,16,17,18], especially since there is a lack of research on disclosing the relationship between the digital economy and atmospheric environmental efficiency [19]. Taking into account natural conditions, the economy, technology and the demographic scale of cities in different regions, it is necessary to examine scientifically and systematically the efficiency of air pollution in various cities, the potential efficiency of the effect of reducing emissions, and the factors affecting atmospheric environmental efficiency. The results can put forward countermeasures and suggestions for regional air pollution control and air quality improvement [20,21].
To account for these, this study selected a key area of air pollution prevention and a typical area of digital economic development, Zhejiang province, as a case study. The mass concentration values of PM2.5 and the relevant socioeconomic data of 11 cities in Zhejiang province from 2006 to 2019 were obtained, and the PM2.5 environmental efficiency (PMEE) was calculated with the undesirable output Slack-Based Measure-Data Envelopment Analysis (SBM-DEA) model. In this study, we defined PMEE as the environmental cost of PM2.5 pollution paid by regional producers over a period of time using various factors to conduct economic activities. Subsequently, taking the digital economy as the core explanatory variable, the panel fixed effect model, difference-in-differences (DID), and other multi-dimensional systems were used to investigate the driving mechanism of PMEE’s change. Finally, it proposed countermeasures and recommendations for improving the PMEE and controlling PM2.5 pollution effectively.
The main contributions of this study were: (1) For coastal areas, the PMEE measurement model was established at the city level, which was helpful in strengthening the control and management of pollutants; (2) Taking the digital economy as the core explanatory variable, the mechanism of the influence of PMEE was revealed, which was conducive to the regulation of the digital economy with regard to environmental pollutants.

2. Literature Review

Environmental efficiency represents the environmental performance level of production units through the ratio of economic output and environmental impact. Atmospheric environmental efficiency provides a further focus on environmental efficiency in the field of atmospheric environment, which can reflect the comprehensive performance level of the regional atmospheric environment [21,22,23]. In recent years, as global air pollution prevention and control work has received wide attention from academia and society, many academics have conducted studies on the efficiency of the atmospheric environment, as shown in Table 1.
(1)
In terms of research methods, DEA is a non-parametric method that does not need to set subjective weights and process dimension data. Therefore, it has been widely used to measure atmospheric environmental efficiency [34,35]. From the traditional radial framework to the non-radial model framework considering relaxation variables, various academics have proposed the SBM-DEA model [28,31], super SBM model [2], dynamic SBM-DEA [36], Hybrid-Dynamic DEA [34] and other improved models. The limitation of the traditional DEA method is that it is difficult to analyze efficiency accurately because it does not take into account the relaxation of output factors, and it is difficult to grasp the factors that need to be considered first to improve efficiency. The subsequently improved SBM-DEA model could avoid the deviation caused by radial and angular measurements, which is favored by scholars. In the empirical estimation, the combination of static efficiency and the dynamic efficiency analysis is often adopted, and the Malmquist index and Luenberger productivity index method are frequently selected to decompose detailed driving factors, including the technical efficiency, technological progress, and scale efficiency index of dynamic efficiency [2,22,25].
(2)
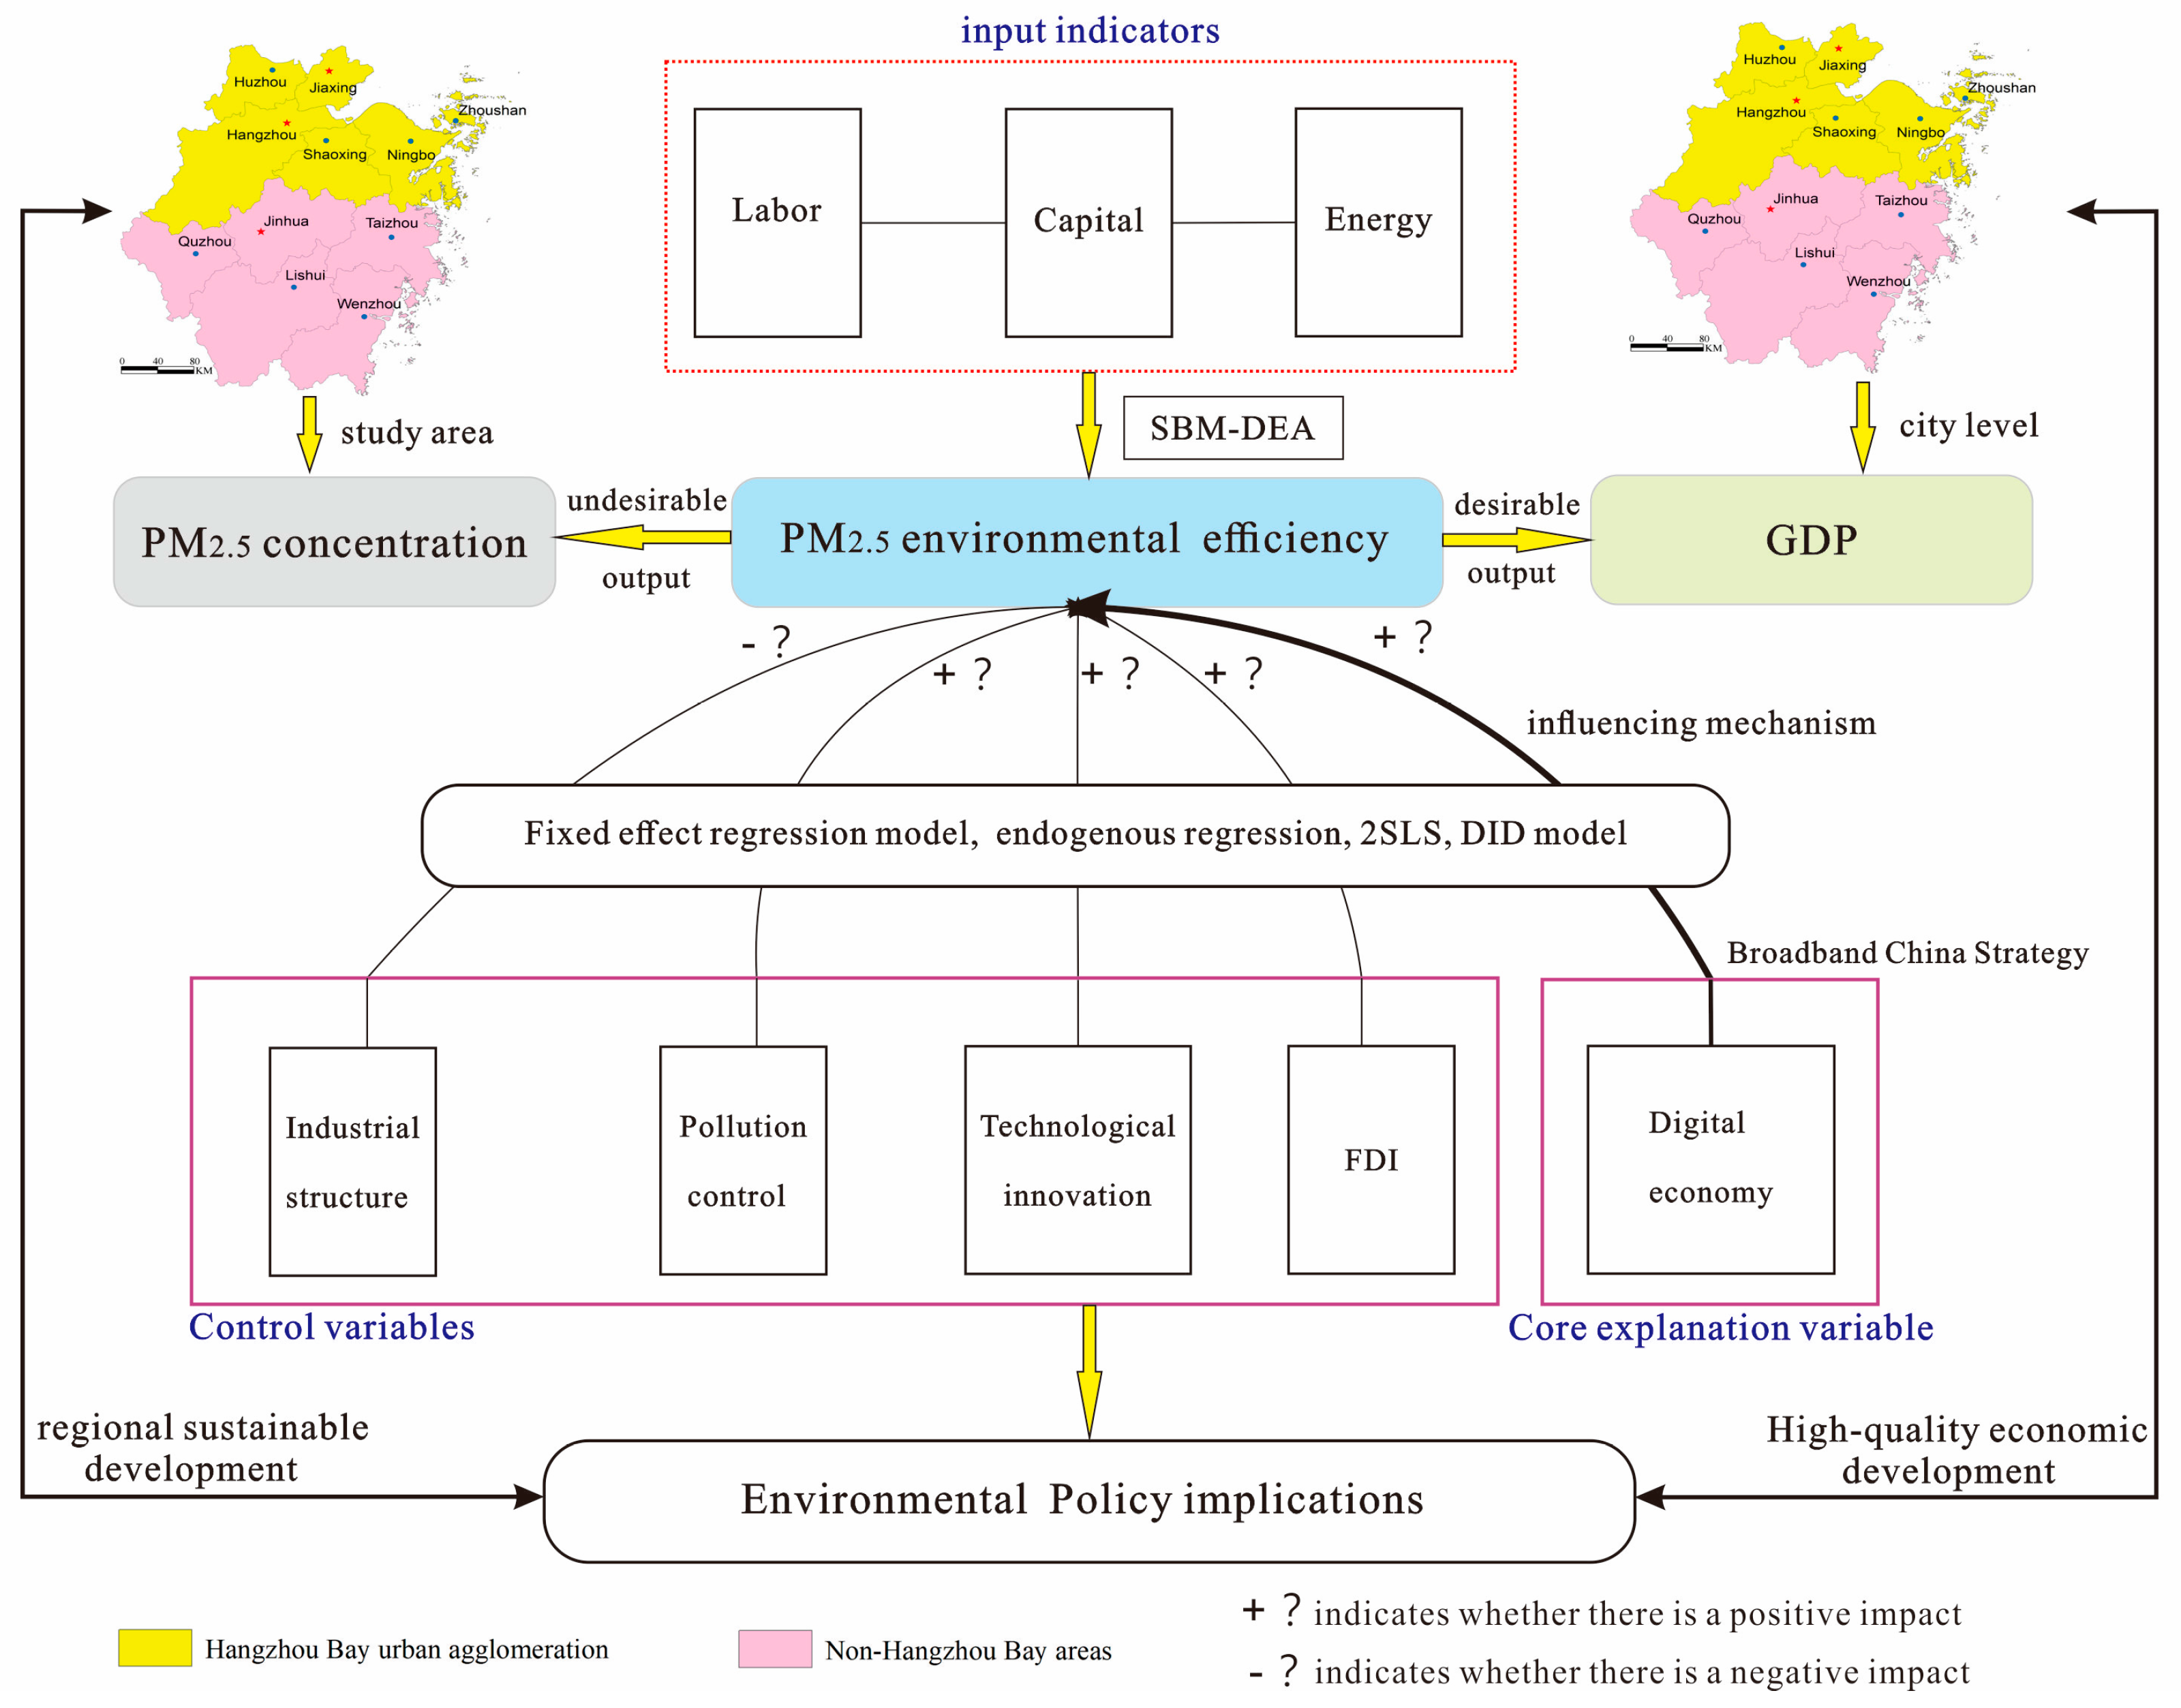
For evaluation indicators, to make the DEA a reasonable method to estimate atmospheric environmental efficiency, different scholars have constructed different input-output index systems for calculation. The first way is to take the air pollutant emissions (SO2, NOx, smoke and dust, etc.) as the input indexes and GDP as the economic output index to calculate the atmospheric environment efficiency or air pollution emissions efficiency. Further, some scholars regard the air quality rate and comprehensive index of IAQI to be the direct output factor that measures environmental benefits [22,35]. However, this index system has limitations in considering the impact of conventional production factor inputs (capital and labor) on atmospheric environmental efficiency and cannot reflect the socioeconomic background differences in the study area. The second way is to take labor, capital, energy, and other production factors as input indicators, while air pollutant emissions are an undesirable output with weak disposability and introduce a directional distance function together with the desirable output (GDP) for calculation. This method can evaluate atmospheric environmental efficiency. In specific empirical research, CO2, SO2, NOx, smoke and dust are often regarded as the research objects of pollutants [26,27], and particulate matters smaller than 10 μm (PM10) (inhalable particles with diameters that are generally less than 10 μm), while PM2.5 are gradually being included in the undesirable output indicators [18,34].
(3)
From the research on the influence mechanism of atmospheric environmental efficiency, the ordinary panel regression model and Tobit model have often been adopted [34]. To control the influence of endogenous problems on the estimation results to the largest extent, the system Gaussian mixture model (GMM) estimation, two-stage least squares approach (2SLS), panel threshold model, spatial Dubin model, mediation effect model, DID model and instrumental variable analysis can be further employed to test the robustness of the model [1,6,27]. The explained variables in the regression model are mainly static atmospheric environmental efficiency. The level of economic development and GDP are often selected as core explanatory variables. Other explanatory variables mainly include a factor endowment structure, industrial structure, scientific and technological innovation level, foreign direct investment, government environmental management ability, environmental regulation, population density, industrial enterprise scale, investment scale, etc. [34]. At present, the development of a digital economy has brought profound changes to government governance, enterprise production, and the lives of residents, which not only directly affects pollutant emissions but also plays a strong part in the environmental supervision and technical efficiency of governments and enterprises [27]. However, few studies have been conducted to analyze the effect of the digital economy’s development on environmental efficiency from a theoretical and empirical perspective.
To sum up, although existing studies have made explorations around the air pollution efficiency and its influencing factors, there are still the following deficiencies: (1) for research objects, most of the existing literature dedicated to the unexpected output of atmospheric environmental efficiency is focused on conventional pollutants, such as SO2, NOx, smoke and dust, while less attention has been paid to the variation characteristics of PMEE; (2) for the mechanism research, in the analysis of driving factors for evaluating the reduction effect of haze emissions, the main concern is the economic development level, industrial structure, etc., while systematic research on impact mechanisms, including indicators such as the digital economy and technological innovation has been lacking, and the endogenous problems of the variables themselves not fully considered; (3) for the research scale, due to the availability of data, most of the research samples in the existing literature focus on the provincial level [26], while less detailed research focuses on the driving mechanism of PMEE at the city level. Above all, this study focuses on PMEE, taking the coastal Zhejiang province as an example, discussing the measurement level and socio-economic impact mechanism of PMEE at the city level, and establishing an analytical framework with the digital economy as the core explanatory variable. Finally, relevant policy recommendations are put forward.
The technical framework and research process of this study is displayed in Figure 1.

3. Materials and Methods
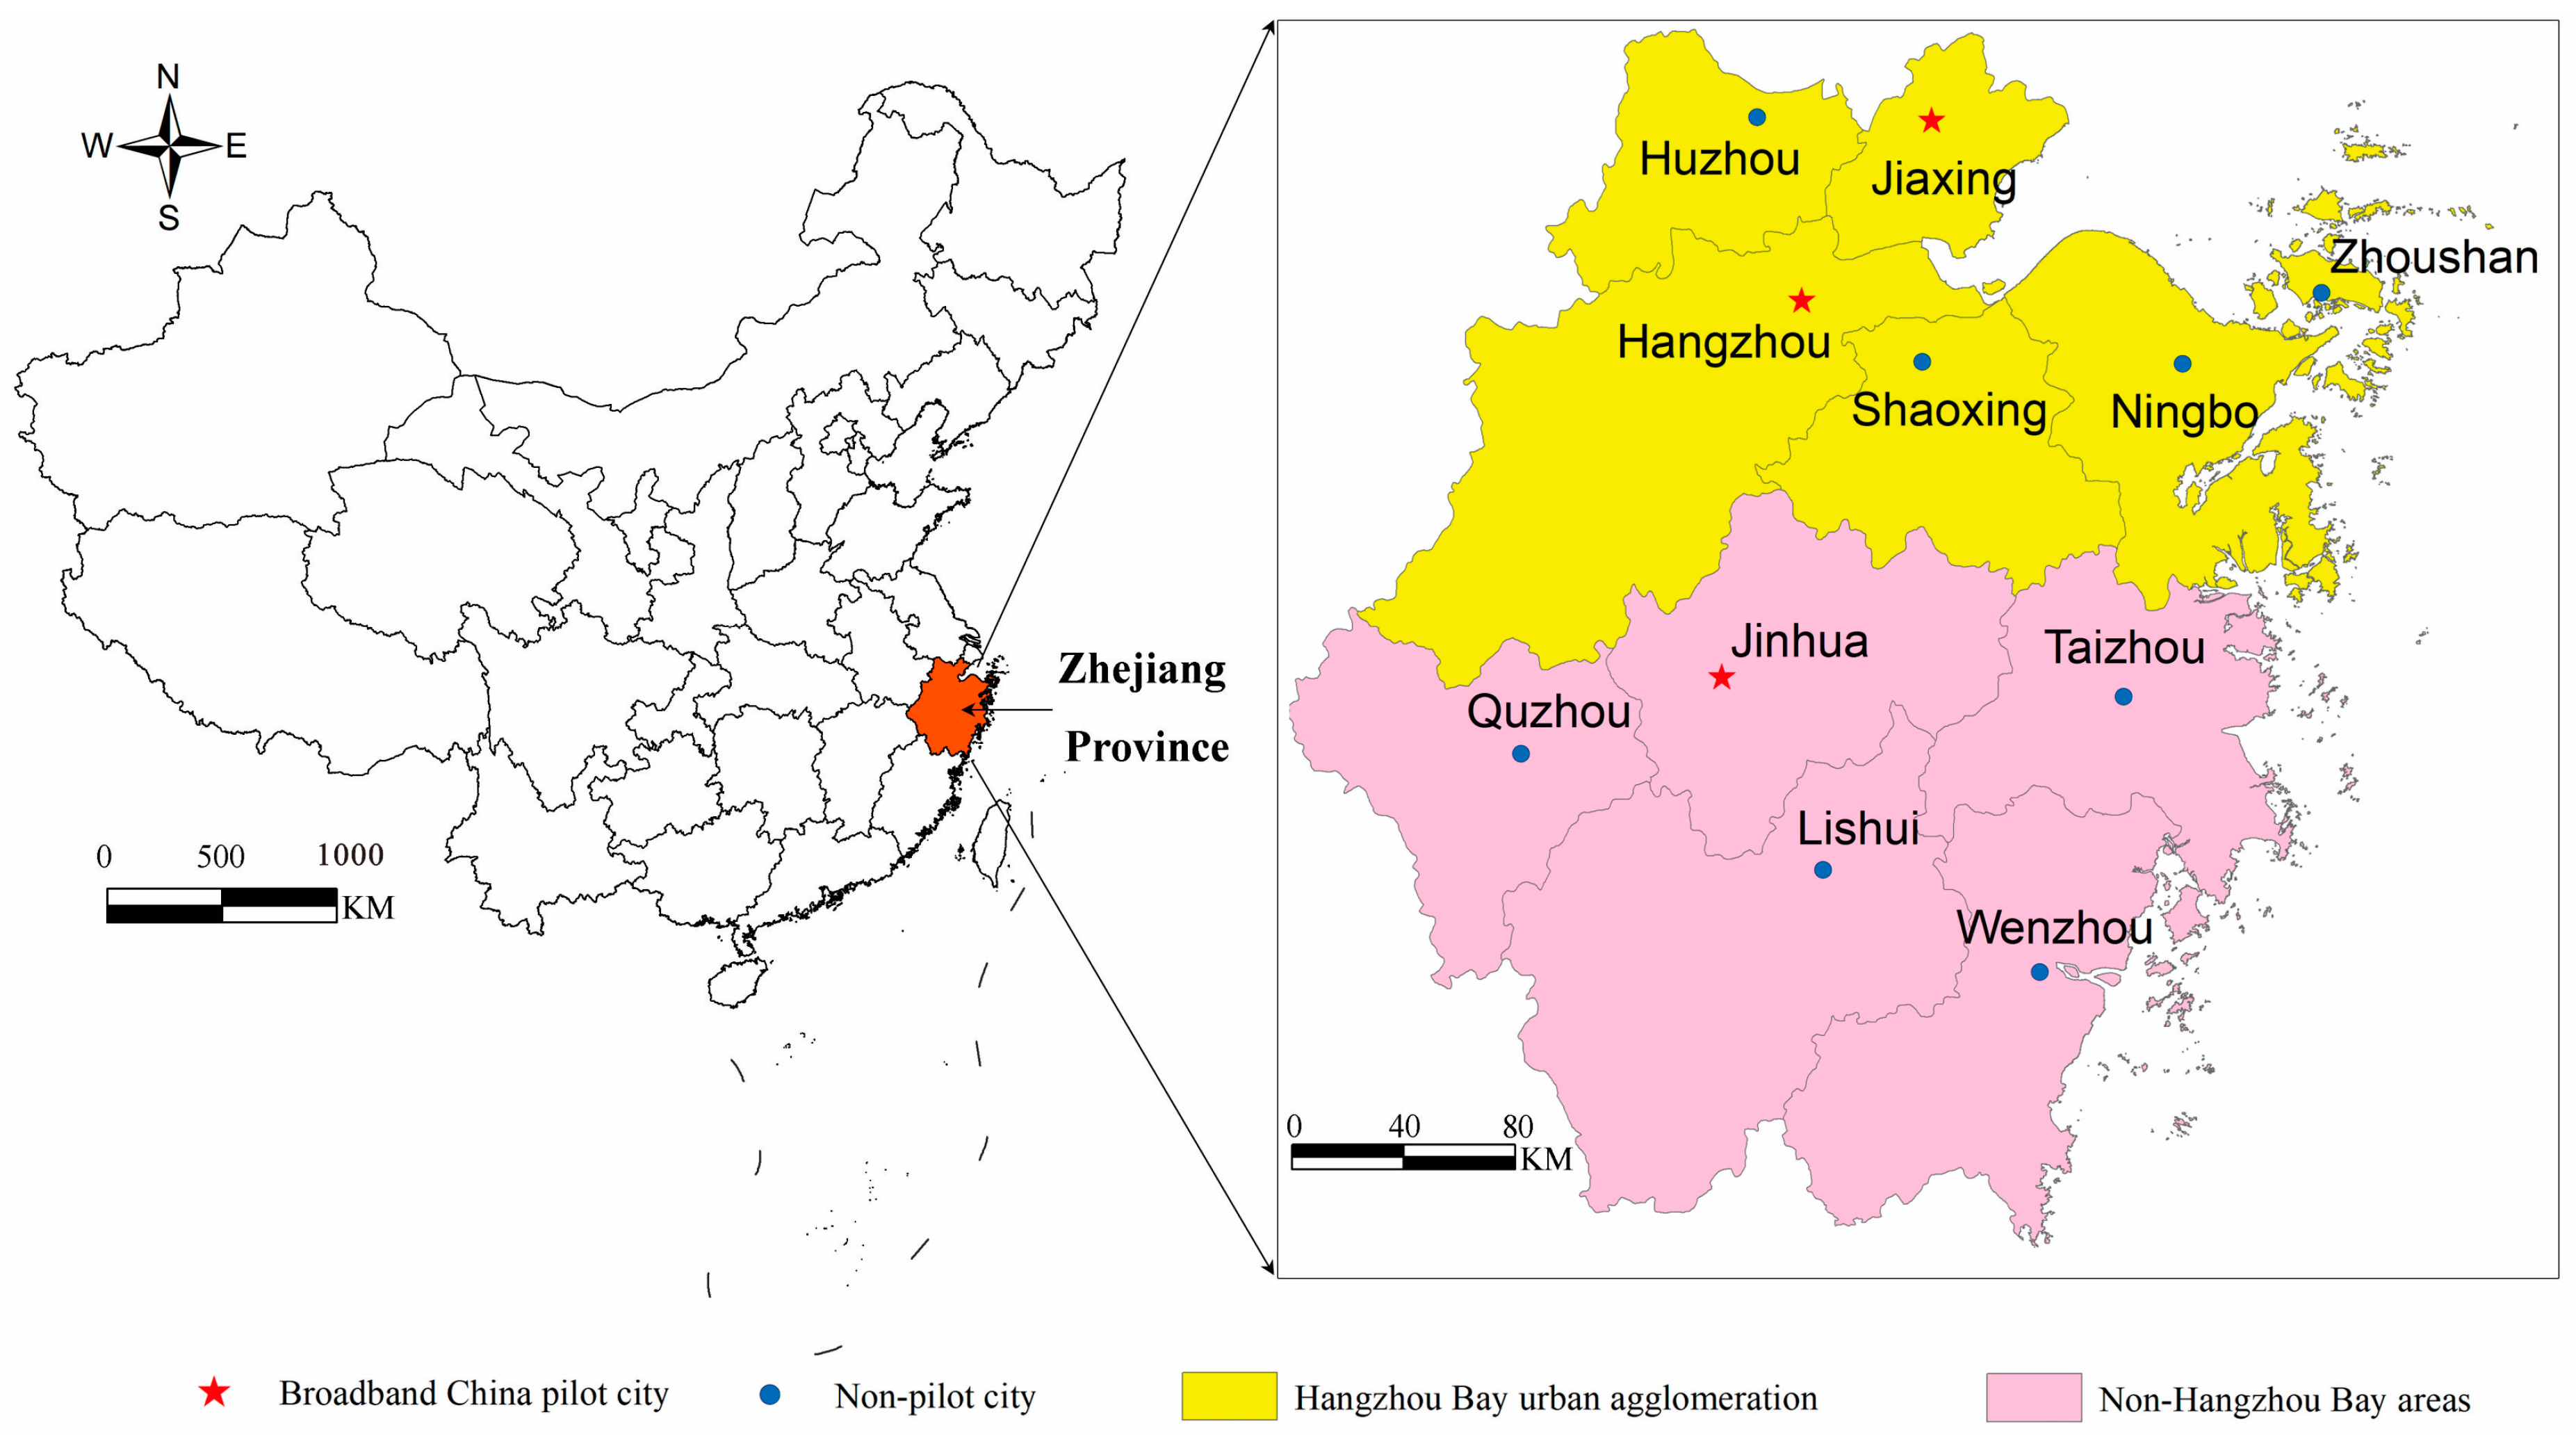
3.1. Study Area

Zhejiang (Figure 2) is an economically developed province along China’s eastern coast and is also one of the key areas of the Blue-Sky Protection Campaign [37,38,39].
In 2020, the average concentration of urban PM2.5 in Zhejiang was 25 μg/m3, down by 43.2% compared to 2015, while the ratio of days with excellent air quality was 93.3%, an increase of 9.5% compared to 2015. Affected by the COVID-19 pandemic in 2020, along with favorable weather conditions, ambient air quality in Zhejiang has greatly improved, but the difficulty of further improvement is also increasing. In addition, a high proportion of traditional industries with high energy consumption and air pollutant emissions, such as the heavy chemical industry around Hangzhou Bay, which accounts for a relatively high proportion, and the rapid increase in production capacity has greatly offset the achievements of air pollutant emissions reduction in other industries in this region, which poses challenges to the continuous improvement of air quality [22]. In recent years, to continually optimize the industrial structure system and the environmental governance efficiency, the Zhejiang government has vigorously implemented the “No. 1 Project” of the digital economy [12]. This project has accelerated the digital, intelligent and green transformation of the traditional manufacturing industry, comprehensively promoted the industrial internet into clusters, parks and enterprises, and relies on the latest big data and artificial intelligence technologies to enhance the level of the environmental regulatory system and reduce atmospheric pollutant emissions [40,41].
It should be noted that the Hangzhou Bay urban agglomeration is an important part of the southern wing of the Yangtze River Delta world-class urban agglomeration, which is an important strategic embodiment of the comprehensive development of the region, and the linkages between the cities in terms of economic activities and environmental regulation have become closer. Hangzhou Bay urban agglomeration has led to the development of a digital economy in the whole province. Therefore, in the following analysis, we divided the 11 cities in Zhejiang into the Hangzhou Bay urban agglomeration (including Hangzhou, Jiaxing, Huzhou, Shaoxing, Ningbo and Zhoushan) and non-Hangzhou Bay areas for comparison.

3.2. Variables and Data

Referring to the existing literature [35,37], taking labor, capital and energy as input indicators, regional GDP as a desirable output indicator, and PM2.5 with the annual average concentration as an undesirable output indicator, this study built the PMEE evaluation system in Zhejiang province, while the objective was to reduce the input of single production factors and achieve economic development and the improvement status of PM2.5 pollution. The labor input index was expressed by the number of urban employees in each city at the end of the year [42]. The capital investment index was expressed by the investment amount of fixed assets in the whole society [32,43]. The energy input index adopted energy consumption, which was expressed by the energy consumption of industries above the designable size (104 tons of standard coal). The desirable output index was expressed by GDP, and the GDP of each city was converted to a constant price in 2006 to eliminate the influence of price factors [44,45]. The above indicators were obtained from the Statistical Yearbook of Zhejiang Province [46] and the Zhejiang Natural Resources and Statistical Yearbook on Environment [47] from 2007 to 2020. Linear interpolation can be used to fill in some missing data. The undesirable output was the average PM2.5 annual concentration (μg/m3) in each city, from the grid data of the annual mean of the global concentration of PM2.5 based on satellite surveillance disseminated by the Socioeconomic Data and Application Center of Columbia University, with a grid resolution of 0.1° × 0.1° [48]. Specifically, the grid data of the annual average PM2.5 concentration was overlaid on the administrative boundary of the 11 cities in Zhejiang and then converted to the annual average city-wide PM2.5 concentration data.
The descriptive statistical results of the aforementioned variables are summarized in Table 2.

3.3. SBM-DEA Model with Undesirable Output

The DEA and its expanded models are widely used for efficiency measures or performance evaluations [49]. The traditional Banker, Charnes and Cooper model (BCC) and Charnes, Cooper and Rhodes model (CCR) are DEA models that evaluate performance radially and angularly [22,50]. The radial means that the same proportional input or output change is required when performing efficiency evaluation. When there is an excessive input or insufficient output, the radial DEA will overestimate the efficiency of the decision-making unit (DMU). Angular requires the selection of a model between input-based performance evaluation (assuming the output remains unchanged) or output-based performance evaluation (assuming the input remains unchanged). Therefore, changes in inputs or outputs are often ignored, and the efficiency value of DMU is overestimated [51,52]. To solve the above-mentioned problems of the traditional DEA model, Tone (2001, 2002) proposed a non-radial, non-angular DEA model based on slack variables [53,54], such as the SBM-DEA model with undesirable output. Compared with the traditional DEA model, the SBM-DEA model with undesirable output is a more rigorous efficiency evaluation method, which is not affected by index units. It not only avoids the deviation caused by radial and angular measurements but also takes into account the influence of undesirable output factors on the production process, which may better reflect the nature of efficiency evaluation. In addition, in the SBM-DEA model, each DMU minimizes the input and maximizes the output simultaneously to calculate efficiency, which brings a large clear efficiency ranking benefit [30,33,45,48].
Based on the undesirable output SBM-DEA model [36,54], we assumed that n denoted the number of DMUs, and the input variables could be computed with X = ( x i j ) R m × n . The desirable output variable was calculated by Y = ( y k j ) R s 1 × n while the undesirable variable was Z = ( z l j ) R s 2 × n . We assumed X > 0, Y > 0, and Z > 0 and that the production possibility set would be P = {(x,y,z)|xXΛ, yYΛ, zZΛ, Λ > 0} of which Λ = ( λ 1 , λ 2 , , λ n ) R n indicates the weight coefficient vector. x ≥ XΛ in the P set denotes that the actual input was larger than the frontier input; y ≤ YΛ in the P set denotes that the actual output was less than the frontier output. The undesirable output SBM model can be listed as follows.
min ρ = 1 1 m i = 1 m s i x x i 0 1 + 1 s 1 + s 2 ( k = 1 s 1 s k y y k 0 + l = 1 s 2 s l y y l 0 ) s . t . { x i 0 = j = 1 n λ j x j + s i x , i ; y k 0 = j = 1 n λ j y j s k y , k ; z l 0 = j = 1 n λ j z j + s l z , l ; s i x 0 ; s k y 0 ; s l z 0 ; λ j 0 ; i , j , k , l ;
where s x R m and s z R s 2 represent the redundancy of DMU ( x 0 , y 0 ) ’s input and undesirable output; s y R s 1 refers to the shortage of a desirable output; ρ denotes the PMEE in one particular city; m refers to the number of input variables; S1 and S2 are the numbers of a desirable and undesirable output; λ denotes the weight matrix, and input frontier and output frontier can be obtained via a λ multiplied input and output indicator matrix [55].
Model (1) was under the assumption of constant returns to scale. Under the assumption of variable returns to scale, the constraint condition j = 1 n λ j = 1 should be added. If ρ = 1 , s x = 0 , s y = S z = 0 , it indicates that input redundancy and output shortage are 0 and the DMU is the most efficient. If ρ < 1 , it indicates an excessive input, that the desirable output was insufficient, or that the undesirable output was excessive. Additionally, this indicates that the DMU was not of the highest efficiency and could be improved [22].

3.4. Econometric Regression Model

Based on empirical analysis and existing research [27,31,34,56], and taking into account data availability, PMEE in Zhejiang province was used as the dependent variable, while the level of the digital economy, industrial structure, pollution control, technological innovation and foreign direct investment were used as independent variables to investigate the impact mechanism. The five explanatory variables can be described as follows:
(1)
Level of the digital economy. It is a core explanatory variable. Promoting the development of the digital economy reinforces the intensive transformation of industrial production methods through technological innovation, thereby improving the current state of PM2.5 pollution and the PM2.5 environmental control efficiency. Referring to the estimate of the level of development of the digital economy at the city level [18,27,57], this study comprehensively considered four dimensions of the digital economy, including digital infrastructure, digital industry, digital technology, and digital applications. Four indicators, including the proportion of internet users, the proportion of mobile phone users, the employees’ proportion in the information transmission and technology service industry, and the total per capita telecommunications business, were used to build a digital economy indicator system. After standardization, the entropy method was used to estimate the indicator’s weight, and the digital economy’s comprehensive development index was calculated, which was denoted as De.
(2)
Level of industrial structure. The proportion of the industrial output value in GDP was used to measure this indicator. Industrial pollution is one of the important sources of PM2.5 emissions. This indicator affects PMEE from the perspective of source management [27,58].
(3)
Level of pollution control. The yearly operating cost of industrial waste gas treatment facilities was selected to measure this indicator. It affected the PMEE from the perspective of waste treatment investment and technical capability [27].
(4)
Level of scientific technological innovation. This was measured by the ratio of Research and Development funds to GDP in each city. It reflected the impact of technological investment and technological progress on PMEE [27,31].
(5)
Level of FDI. The ratio of actually used FDI to GDP in each city was used to measure the level of FDI in each city. This indicator was mainly used to test the “Pollution Shelter” hypothesis and analyze its impact on the PMEE [31,37].
Therefore, the causality between PMEE and the digital economy was calculated as follows:
P M E E i , t = α 1 + α 2 D e i , t + β 1 l n X i , t + μ i + γ t + ε i , t
where PMEEi,t denotes the PMEE in city i in time t; Dei,t denotes the digital economy level (distributed in 0–1) in city i in time t; Xi,t denotes the vector of all the control variables, and, in order to eliminate the difference in units of variables, logarithmic processing was conducted here; μ i denotes the fixed individual effect with the aim of controlling the individual differences between cities; γ denotes the fixed time effect with the aim of eliminating the time trend; ε i , t denotes random disturbance; α 1 denotes the constant; α 2 denotes the coefficient of the digital economy. If the coefficient α 2 is still significantly positive after the control of the above-mentioned control variables, the digital economy could contribute to the improvement of PMEE.
Compared with the existing literature [20,31], the empirical model in this study had the following distributions. (1) The indicator of the economic development level (GDP) was not included in the regression model because when the DEA efficiency was decomposed, the GDP indicator was used as one indicator of a desirable output. If the GDP were readopted to explain the PMEE, it might increase the endogenous problem of the model. (2) The digital economy level was added to the econometric model. The regional digital economy level reflected the government’s effective use of resource allocation and the production efficiency of enterprises. This indicator could reflect the impact of the technical efficiency of PM2.5, which ensured the precision of the regression model.

4. Results

4.1. Regional Difference of PM2.5 Concentration in Zhejiang

The spatial distribution of the PM2.5 concentration in 11 prefecture-level cities in Zhejiang from 2006 to 2019 is demonstrated in Figure 3. For comparison, this study chose four different years from different time periods, which were 2006 (the starting year of China’s 11th Five-Year Plan), 2011 (the starting year of China’s 12th Five-Year Plan), 2016 (the starting year of China’s 13th Five-Year Plan), and 2019 (the end year of this study).
The PM2.5 concentration of Zhejiang was characterized by a continuous reduction in concentration and the continuous improvement in environmental quality. In 2006, only Zhoushan reached the national Class II ambient air quality (35 μg/m3), which was 29.2 μg/m3. By 2019, eight cities reached the national Cass II ambient air quality standard. Only Hangzhou, Jiaxing and Shaoxing did not reach the Class II standard, but none of these 11 cities reached the national Class I ambient air quality standard (15 μg/m3). The ranking of the average PM2.5 concentration for 2006–2019 was Shaoxing > Hangzhou > Jinhua > Huzhou > Jiaxing > Quzhou > Wenzhou > Ningbo > Taizhou > Lishui > Zhoushan. The PM2.5 concentration in Zhoushan was the lowest. This was mainly due to the development of tourism and fisheries, which had a lower proportion of pollution-intensive industries and lower emissions of air pollutants [33]. Subsequently, Zhoushan is an island-type city with strong sea-to-land winds; the frequent exchange of land and sea winds at Zhoushan makes its airflow and pollutant dispersal fine and the ability of self-purification strong. Thus, Zhoushan had the lowest PM2.5 pollution. Lishui began to meet the national Class II ambient air quality after 2016. Overall, the concentration of PM2.5 in the urban agglomeration around Hangzhou Bay was more serious than that in non-Hangzhou Bay areas.

4.2. Analysis of PMEE in Zhejiang

Through the aforementioned SBM-DEA model with an undesirable output, the PMEE of 11 cities in Zhejiang was calculated by Equation (1). The specific results are presented in Table 3 and Figure 4.
Over the past 14 years, the average PMEE value for the entire Zhejiang province has been 0.6430, and there was an opportunity for an improvement of about 36% from the production frontiers. There was still great potential for improving and controlling the PMEE. In terms of the overall PMEE in each city, it showed a certain trend of fluctuating growth. In 2019, four cities (Hangzhou, Ningbo, Zhoushan and Lishui) reached the production frontiers, while the remaining seven cities did not reach the PM2.5 emission reduction technology of the common frontier cities, which meant that these cities still had a certain potential to improve the PMEE. It also revealed that there were some regional differences in PMEE among different cities. From the 14-year average PMEE of each city, the PMEE of 11 cities ranked as Zhoushan > Hangzhou > Ningbo > Lishui > Taizhou > Jinhua > Wenzhou > Shaoxing > Huzhou > Quzhou > Jiaxing. Due to variations in different years, the ranking of PMEE in different cities also changed considerably. The cities with high PMEE values were mainly Zhoushan, Hangzhou and Ningbo, while the cities with low PMEE were mainly Huzhou, Quzhou and Jiaxing. Among them, Hangzhou and Ningbo were the two most developed cities in Zhejiang in terms of economy and technology. Since the 13th Five-Year Plan, relying on continuous technological innovation, the two cities’ key polluting industries were technologically transformed and controlled at the end of the treatment period [22,37], effectively reducing air pollutant emissions such as nitrogen oxide and particulate matter and effectively enhancing the PMEE.
Further, Zhejiang province was divided into Hangzhou Bay urban agglomeration and non-Hangzhou Bay areas for comparison (Figure 4). The results show that the PMEE of the Hangzhou Bay urban agglomeration increased from 0.5675 in 2006 to 0.8174 in 2019, with a growth rate of 44.03%. The PMEE in non-Hangzhou Bay areas rose from 0.5735 in 2006 to 0.7323 in 2019, with a growth rate of 27.69%. At the same time, from 2006 to 2011, the PMEE of the non-Hangzhou Bay area was higher than that of the Hangzhou Bay urban agglomeration. At this stage, the air pollutant emissions and PM2.5 concentrations from Hangzhou Bay urban agglomeration were higher, and the emission reduction pressure was higher. After 2012, the PMEE of Hangzhou Bay urban agglomeration was significantly higher than that of non-Hangzhou Bay areas, so the PMEE of the entire province had a stable growth trend. This resulted from the fact that, after the 12th Five-Year Plan to improve the ambient air quality effectively and strive to build a beautiful Zhejiang, the provincial government increased investment in addressing PM2.5 pollution, accelerated the adjustment of industrial structure and energy structure relying on scientific and technological innovations [22,37], and improved PMEE effectively, especially in Hangzhou, Ningbo, Zhoushan and other cities around Hangzhou Bay. After 2012 (when PM2.5 was included in the national key control object of air pollution prevention and control), Zhejiang successively issued and implemented the 13th Five-Year plan for air pollution prevention and control of Zhejiang Province (2016–2020) (2017) and the 14th Five-Year plan for air quality improvement of Zhejiang Province (2021–2025) (2021). Especially after 2016, the provincial government implemented extensive air pollution prevention and persistent control measures, which were deployed to high standards, promoted the success of the Blue-Sky Protection Campaign [41], and innovated the construction of fresh air demonstration areas (a key assessment index is PM2.5 concentration). Thus, the PMEE in the entire province was obviously improved.

4.3. Influencing Factors of PM2.5 Environmental Efficiency

4.3.1. Benchmark Regression Results

The fixed-effect model is able to overcome the errors caused by missing variables. This study employed the fixed effect for benchmark regression estimations (Table 4) and the method of gradually increasing control variables to estimate column (1). To eliminate the individual fixed effect and time trend of the city, the dummy variables reflecting individual city characteristics and the yearly dummy variables reflecting temporal characteristics were added to the model. The results of the regression estimation of the two-way fixed effect model illustrated that the impact coefficient of the development level of the digital economy on urban PMEE was 0.932, with a positive significant level at 1%, showing that the development level of the urban digital economy significantly promoted an improvement in PMEE, which was in line with theoretical expectations. The results of columns (2)–(5) displayed a significant positive correlation between the level of development in the digital economy and PMEE, which still existed after the control variables were added. PM2.5 emissions could be reduced effectively by digital economy development through green innovation and the optimization of resource allocation. Previous studies have also illustrated that improving digital economy development could promote the intensive industrial transformation production mode by enabling technological innovation to combat the current situation of environmental pollution [27]. With the economic society of Zhejiang entering the digital era, the proportion of the digital economy in the total economic volume is expanding year by year, and Zhejiang has become fertile soil for achieving regional high-quality innovation and sustainable development. Firstly, the digital economy improves the efficiency of resource distribution and decreases air pollutant emissions from inefficient production. Another important aspect is that the integrative development of the digital economy and real economy promotes innovation output and efficiency and reduces innovation costs. As a consequence, digital economy development has become an important solution to atmospheric environmental problems [59].
From the regression results of the control variables, (1) the increase in the share of the industrial output value had a significant negative effect on the improvement in PMEE. This was primarily because the fossil energy consumption of industrial enterprises was closely related to PM2.5 emissions. Thus, reducing the proportion of high energy-consuming industrial sectors such as steel and cement and optimizing the industrial structure could benefit the efficiency of PM2.5 environmental governance. (2) The improvement in pollution control level took an obvious positive effect on PMEE improvement. Improving industrial exhaust gas treatment plants and end treatment technologies could effectively reduce relevant waste gas emissions. (3) The improvement of scientific and technological innovation levels had a significant positive effect on PMEE improvement, which was significant at the 5% level. The increase in enterprise research and development (R&D) investment could promote the technological upgrading of production equipment and the output of new products and then eliminate traditional production lines with high pollution emissions. (4) There was no significant impact between the level of foreign investment and PMEE, indicating that the production process and technology of foreign-invested industries in Zhejiang did not significantly improve the fight against PM2.5 pollution, so the hypothesis of “Pollution Shelter” was not tenable here. Considering that Zhejiang is a major foreign trade province, in the future, it should closely combine the influx of foreign capital and local enterprises in technological innovation and the transformation and upgrading of production processes to control the output of pollutants at the source.

4.3.2. Endogenous Regression Results

To control the impact of endogenous problems on the estimation results to the largest extent, most of the existing literature used a dynamic panel data model or system moment estimation to alleviate the endogenous issues, but a more efficient instrumental variable method needs to be employed instead of using only the system matrix estimation method [20,27]. Therefore, the following strategies were employed. Firstly, as the proxy index of PMEE, PM2.5 concentration was used to solve the potential measurement error problem. Generally, the lower the concentration of PM2.5 in a city, the higher the PMEE. Secondly, the lag period of the core explanatory variable was used as its instrumental variable to alleviate the endogenous problem. The corresponding estimated results are demonstrated in Table 5.
Column (6) uses the logarithm of PM2.5 concentration as the explaining variable for estimation. The development of the digital economy had a negative impact on PM2.5 concentration, which was significant at the level of 1%. Thus, the digital economy could inhibit PM2.5 emission reduction and improve air quality, which is in line with the results issued by Li et al. [20]. Column (7) represents the systematic GMM Estimation with the lag period of the core explanatory variable as the instrumental variable [60]. It indicates that the coefficient for estimating the level of development of the digital economy was significantly positive at the 1% level. Column (8) presents 2SLS estimation using the lag phase of the core explanatory variable as the instrumental variable. It illustrates that at the first stage of regression, the coefficient of the instrumental variable was significantly positive, while the Anderson LM test was significant at the 1% level, and the F statistic value of the weak instrumental variable test was 20.56, which is larger than the empirical value of 10. It indicates that it was reasonable to select this instrumental variable [61]. Compared with columns (8) and (7), the estimated coefficient of the development level of the digital economy exceeds the significance test of 1%. It shows that the above estimation results were robust. This means that, with the digital economy’s increasing development, the application of new technologies, such as artificial intelligence, big data, and blockchain, provided technical support for government environmental regulation and enterprise production could be implemented. The continually improved environmental monitoring system provides data and a support platform for environmental governance and enhances the accuracy and effectiveness of PM2.5 governance.

4.3.3. Exogenous Impact Test

To further overcome the possible reverse causality problem, referring to relevant studies [20,62], this study adopted the network infrastructure upgrading of the “Broadband China” pilot as the proxy for exogenous policy impact and used the DID method to evaluate the digital economy’s impact on the PMEE. The Chinese government selected 120 cities (clusters) as the demonstration plots of the “Broadband China” strategy in three batches in 2014, 2015, and 2016. Jinhua, Jiaxing and Hangzhou in Zhejiang were involved, and the digital economy development was inseparable from the support of network infrastructure. The “Broadband China” strategy pilot provided a quasi-natural experience to explore the pollution reduction effect of the digital economy [27].
A multi-period double difference model with the following formula was built:
P M E E i , t = α 1 + α 2 P o l i c y + β 1 l n X i , t + μ i + γ t + ε i , t
where Policy is a dummy variable for the policies of the “Broadband China” policy, indicating whether city i is a pilot city of “Broadband China” in year t. If yes, the value of the dummy variable was 1; otherwise, it was 0. Other variables were consistent with Equation (2).
Meeting the hypothesis of the parallel trend was one of the basic conditions for establishing the multi-stage DID method, which is in line with the method of Ren et al. [63] and Jacobson et al. [64] and was tested by the event analysis method. Specifically, taking the implementation time of “Broadband China” as the base year, DID estimation was performed for the dummy variables of each year before and after the implementation of the policy. Figure 5 shows the estimated results of the dummy variable (Policy) coefficient under the 95% confidence interval.
In the eight years before the pilot started, the coefficient of the dummy variable fluctuated around 0 insignificantly. This means that, before the implementation of “Broadband China” in Zhejiang, there was no significant difference in the changing trend of PMEE between the pilot cities and non-pilot cities, which is consistent with the parallel trend assumption. After the pilot began, especially after Hangzhou became a pilot city in 2016, the coefficient value of the dummy variable was significantly positive, and the positive coefficient value increased, indicating that the PMEE of the “Broadband China” pilot tended to increase. Afterward, the DID method was used to estimate the average treatment effect of the “Broadband China” pilot on the PMEE of Zhejiang. The regression model estimation results are shown in Table 6. As a reference, the impact of the “Broadband China” pilot on the PM2.5 concentration in Zhejiang was added. It was found that the impact coefficient of the “Broadband China” dummy variable on the PMEE of Zhejiang was significantly positive, while the impact coefficient on the PM2.5 concentration was significantly negative. It also meant that the urban digital economy development represented by the implementation of the pilot policy had not only reduced PM2.5 emissions but also improved the level of PMEE, which confirmed the stability of the empirical results.

5. Discussion and Policy Implications

5.1. The Influence Mechanism of Digital Economy on PMEE

Through the above regression analysis and exogenous impact test, the development of the digital economy could improve the level of PMEE and produce certain emission reduction effects on PM2.5 concentration. Compared with the existing research results [20,27], we have seen the positive effect of the development of an urban digital economy represented by the implementation of pilot policies such as “Broadband China” on PMEE. The two pilot cities, Hangzhou and Jiaxing in Zhejiang, belonged to the Hangzhou Bay urban agglomeration, which was relatively better developed in the digital economy.
As regards the specific path of influence, the improvement in the level of pollution control and the level of scientific and technological innovation had a significantly positive effect on the improvement of PMEE. These two factors may be the two major ways in which the development of the digital economy can affect PMEE. Therefore, the digital economy should first promote an improvement in industrial waste gas treatment facilities and end-treatment technologies to effectively reduce particulate matter emissions. In terms of building an enterprise green production mode, enterprises, as the main part for pollution prevention and control, can rely on technical support from virtual reality, databases, the Internet of Things and other technologies, to effectively integrate diverse information resources in production decision-making and alleviate information fragmentation and asymmetry issues in data collection and development. In this way, data on products, processes, and resources can be analyzed, decided upon, planned and reorganized to realize the efficient promotion of the production process and improve the productivity of enterprises [58,63]. Then, polluting enterprises could make full use of digital platforms to obtain information linked to technological innovation, develop cleaner production methods, optimize production processes, and actively realize the digital transformation of enterprises and reduce particulate matter emissions.

5.2. Regional Differences in PM2.5 Environmental Efficiency Promotion

Previous studies have pointed out that different cities have different levels of PM2.5 pollution and PMEE. Therefore, different cities need to adopt differentiated governance strategies based on their own realities.
First of all, it should strengthen the measures of zoning governance, especially for the Hangzhou Bay urban agglomeration. Taking the overall average value of the province-wide PM2.5 concentration with PMEE as the boundary, meaning that those above the average value were recorded as H and those below the average value were recorded as L. The advantages and disadvantages of PM2.5 pollution performance in 11 cities in Zhejiang can be classified into the following four types (see Figure 6): Type I, High pollution High efficiency, i.e., urban PM2.5 pollution was relatively severe, but the value of PMEE was high. Type II, Low pollution High efficiency, i.e., with light urban PM2.5 pollution and high PMEE, which was the state that achieved the best performance in the atmospheric environment. Type III, Low pollution Low efficiency, i.e., urban PM2.5 pollution was relatively low, while the PMEE was also low. Type Ⅳ, High pollution Low efficiency, i.e., urban PM2.5 pollution was relatively serious, and the PMEE was also low, which was the worst state for the performance of the atmospheric environment.
As seen in Figure 6, there were two Type I cities, namely Hangzhou and Jinhua, which were also the pilot cities of the “Broadband China” strategy. The number of Type II cities was the greatest, with five cities including Zhoushan, Lishui, Ningbo, Wenzhou, and Taizhou. There was no Type III city. There were four cities belonging to Type IV, namely Quzhou, Shaoxing, Jinhua, and Huzhou. The primary task for Type I and IV cities was to reduce PM2.5 emissions and PM2.5 concentration in the process of economic development. Type IV cities could also cooperate to improve the efficiency of PM2.5 governance. Cities in Type II needed to maintain the current development trend and reflect the PM2.5 environmental governance efficiency while reducing air pollutant emissions.
In addition, Hangzhou, Ningbo, and other digital economy-developed cities should encourage enterprises to invest in green technology research and development and could play a role in the spillover effect of technology to stimulate the enhancement of PMEE in Huzhou, Shaoxing, Quzhou, and other cities. In addition, cities with low PMEE need to strengthen technology introduction or technological transformation further and moderately increase the pressure on environmental assessments such as energy conservation and emissions reduction.

5.3. Other Necessary Policy Recommendations

For other regions confronted with environmental governance and high-quality economic development, the following suggestions are proposed:
The digital economy plays an indispensable role in integrating various information resources in the production of decision-making, alleviating information fragmentation and asymmetry in data collection and development.
  • It is necessary to accelerate the development of the digital economy and improve the efficiency of government pollution control. The digital economy can effectively integrate all kinds of information resources in production decision-making, alleviate information fragmentation and asymmetry issues in data collection and development, and conduct decisional analysis and reorganize product data, process data, and resource data. Therefore, it can realize the efficient promotion of the production process, improve the productivity of enterprises, and support PMEE improvement by reducing resource waste and pollutant emissions.
  • It is necessary to implement precise pollution control and improve the technical efficiency of PM2.5 treatment. Environmental digital management can be taken as a means to highlight PM2.5-governance in key areas, key periods, key fields, and key industries and promote the in-depth governance of volatile organic compounds in petrochemical, chemical, industrial coating, and other industries [65]. Relying on the continually advanced environmental data monitoring network, the ability to provide an early warning, the perception of pollution sources, and the ability of government environmental supervision can be improved. The level of PM2.5 pollution control can be upgraded by improving the accuracy and effectiveness of government environmental supervision.
  • It is vital to rely on innovation and technological progress to accelerate industrial transformation and upgrading. The methods include increasing investment in research and development funds in air pollution prevention and control technology, encouraging industrial enterprises to develop low-carbon and green technologies, promoting technological change in the field of energy and the environment, as well as reducing fossil energy consumption and pollution emissions at the source. Moreover, traditional industries can be phased out and replaced by green environmental protection industries, and the emission intensity of atmospheric pollutants in traditional manufacturing sectors will be gradually reduced. Future areas of industrial development include clean energy vehicles, cloud computing, big data, 5G, medical installations, and aviation and satellite applications.

6. Conclusions

Based on the concentration of PM2.5 and the relevant socio-economic indicators of 11 cities in Zhejiang province from 2006 to 2019, this study first measured PMEE by adopting the unexpected output SBM-DEA model. Then, the impact of the digital economy on the PMEE and its internal mechanism was empirically tested by using multi-dimensional empirical methods. The conclusions are as follows:
(1)
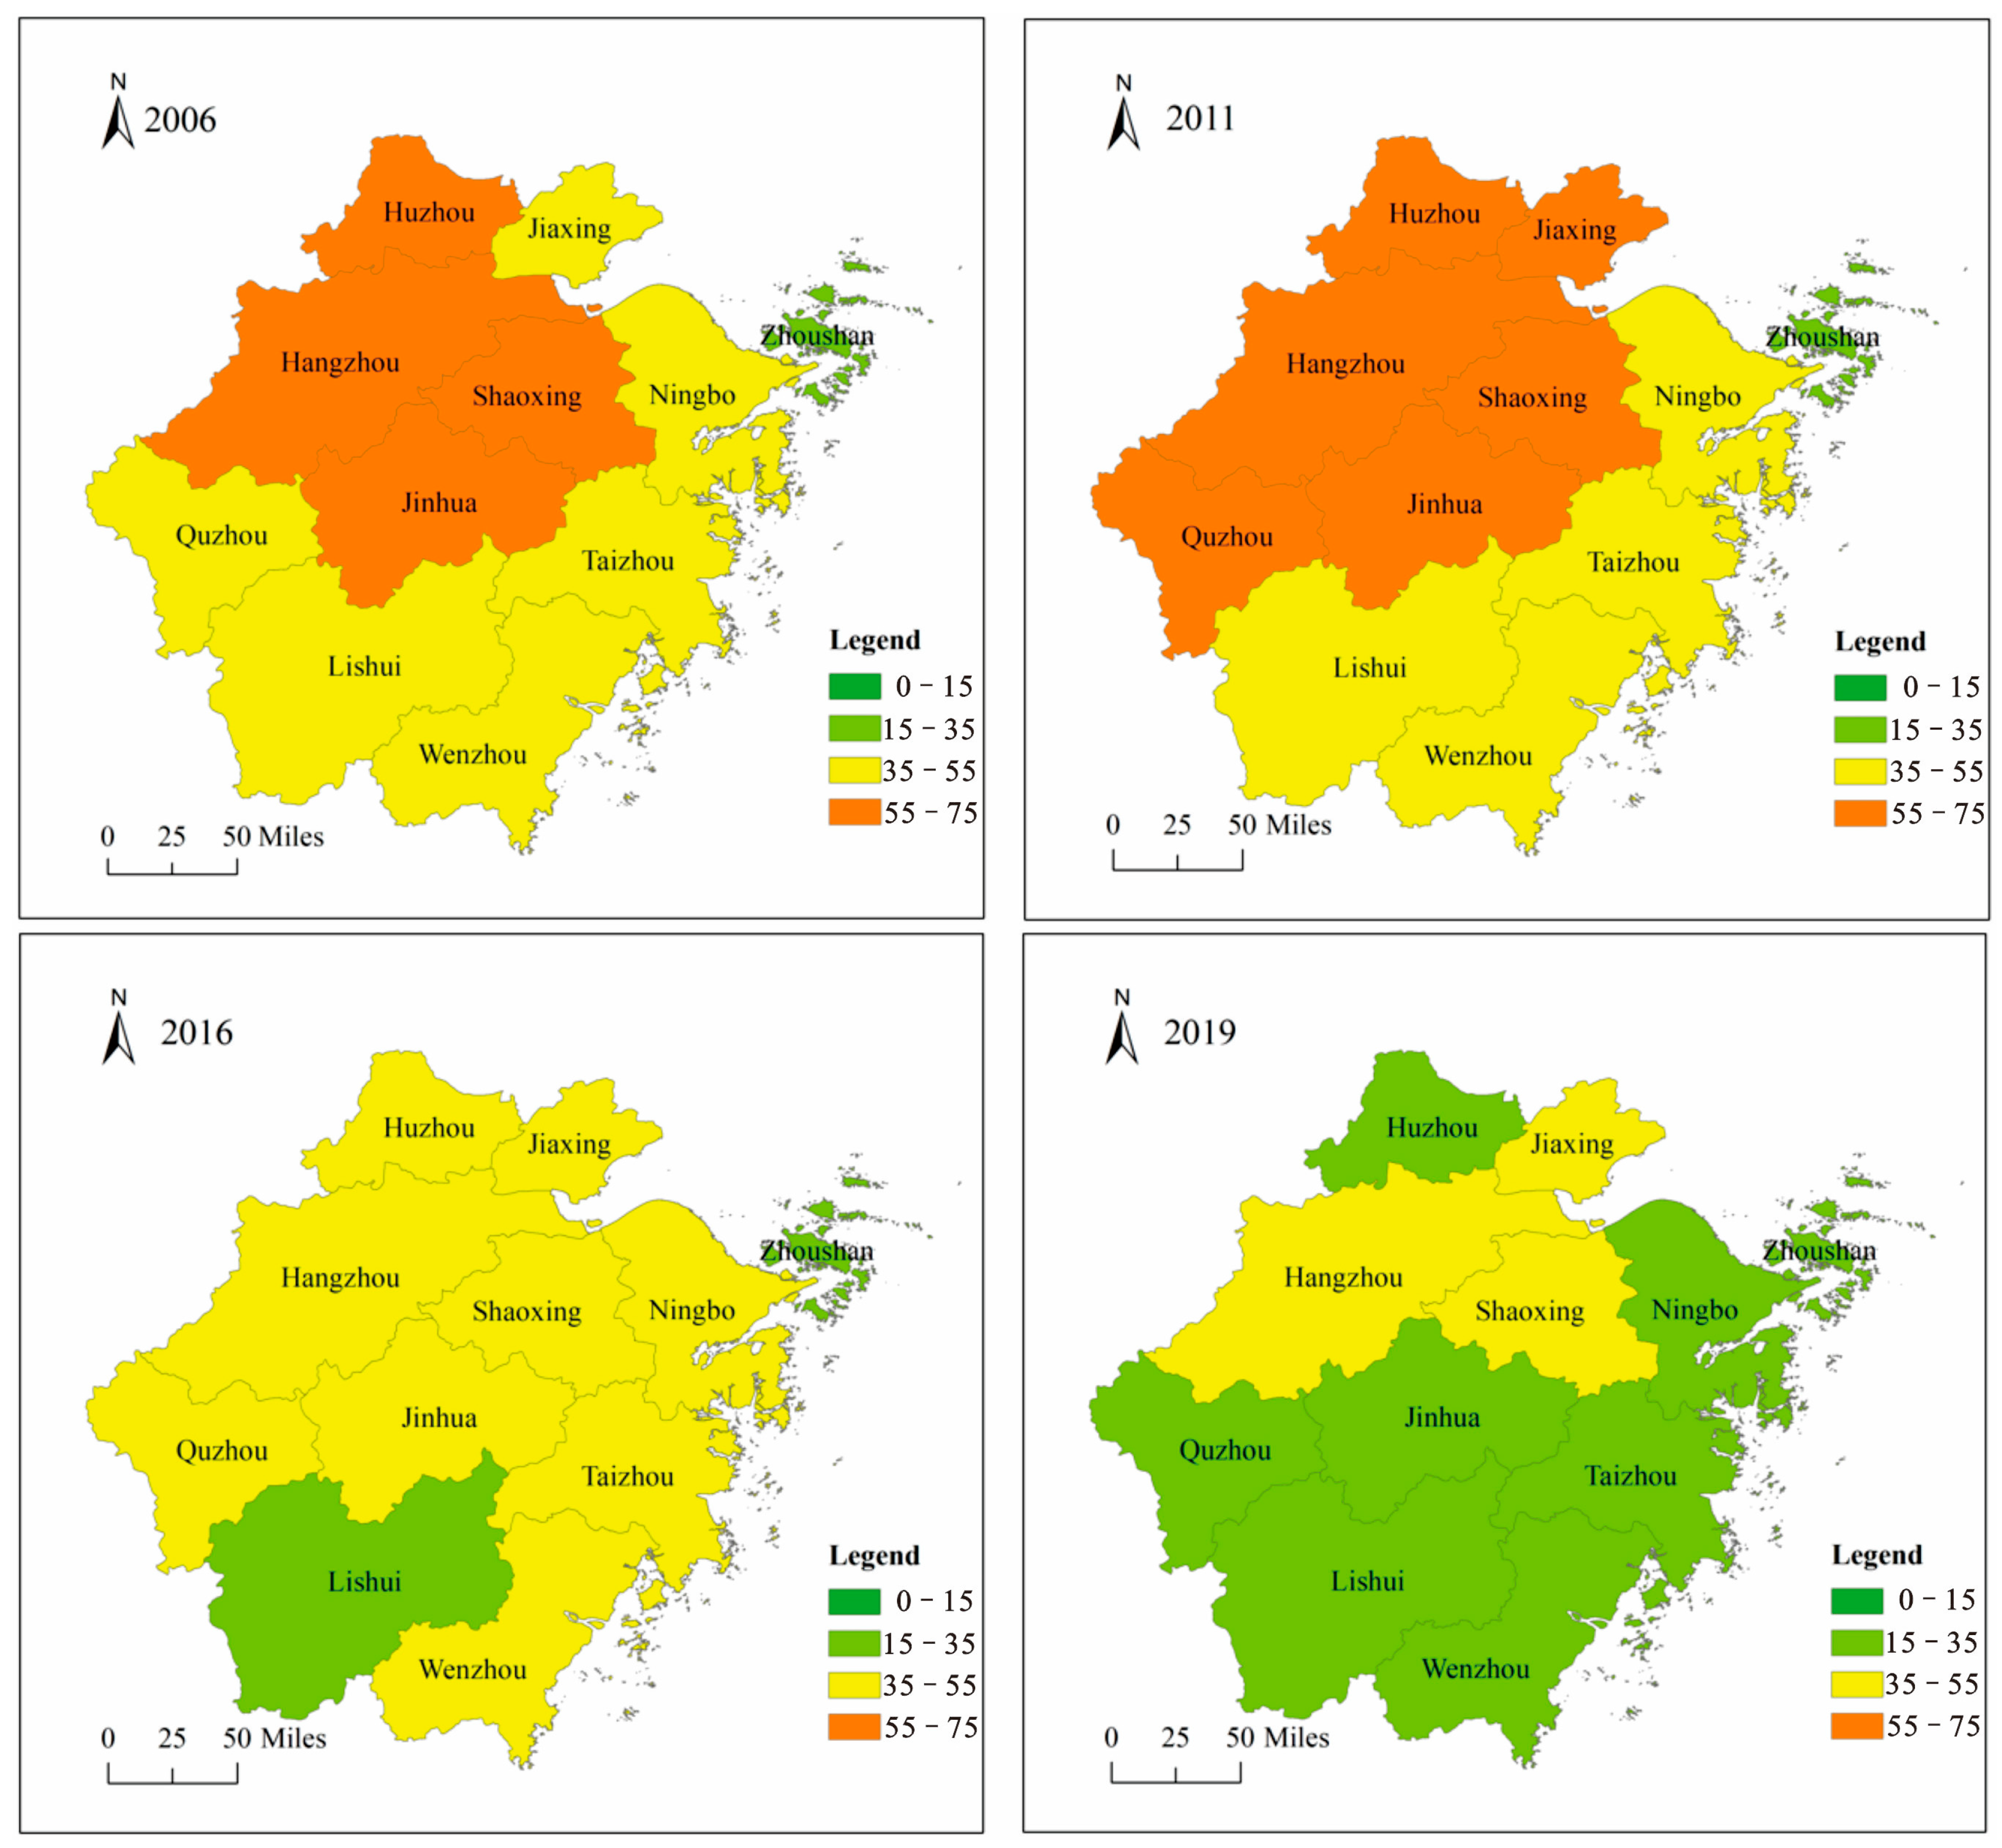
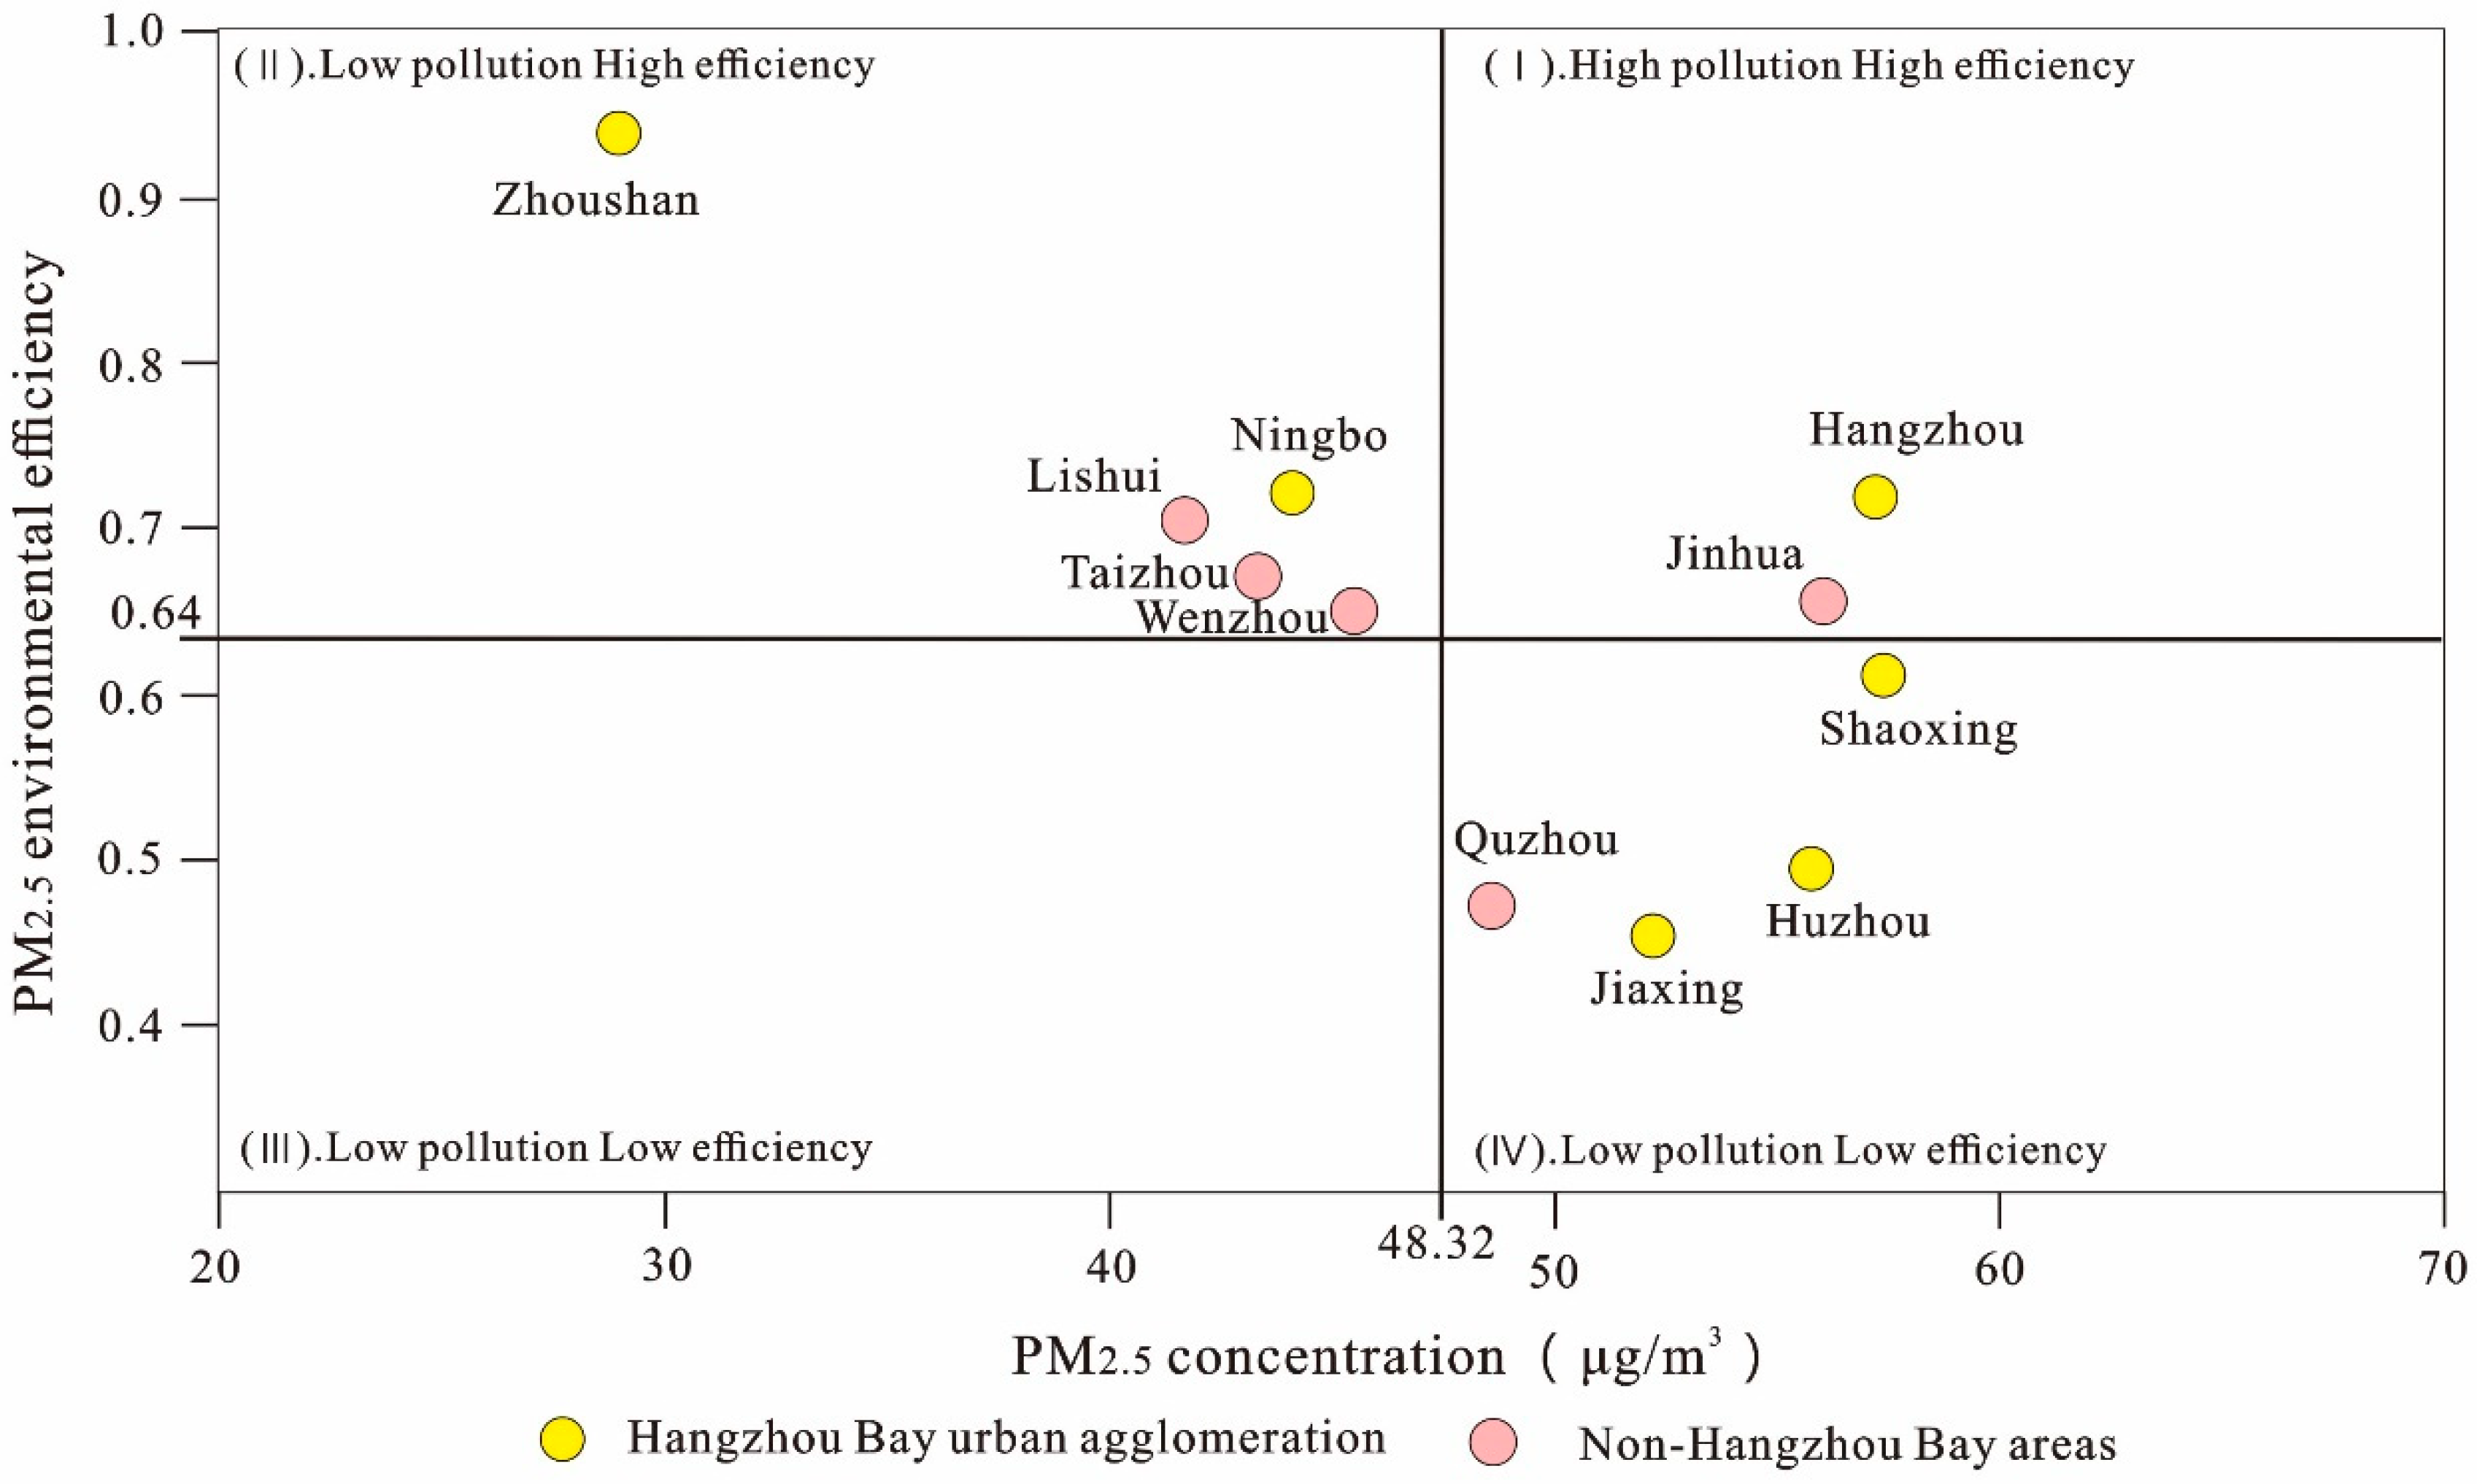
During the study period, the PM2.5 pattern of Zhejiang province indicated the characteristics of a continuous reduction in the concentration and continuous improvement in environmental quality. PM2.5 pollution was relatively serious in Hangzhou, Jiaxing, Shaoxing and other cities around Hangzhou Bay.
(2)
The average value of PMEE in Zhejiang province was 0.6430, and there was about a 36% possibility for improvement in production frontiers, and the PMEE of each city showed a certain fluctuating growth trend. The cities with high PMEE were mainly Zhoushan, Hangzhou, and Ningbo.
(3)
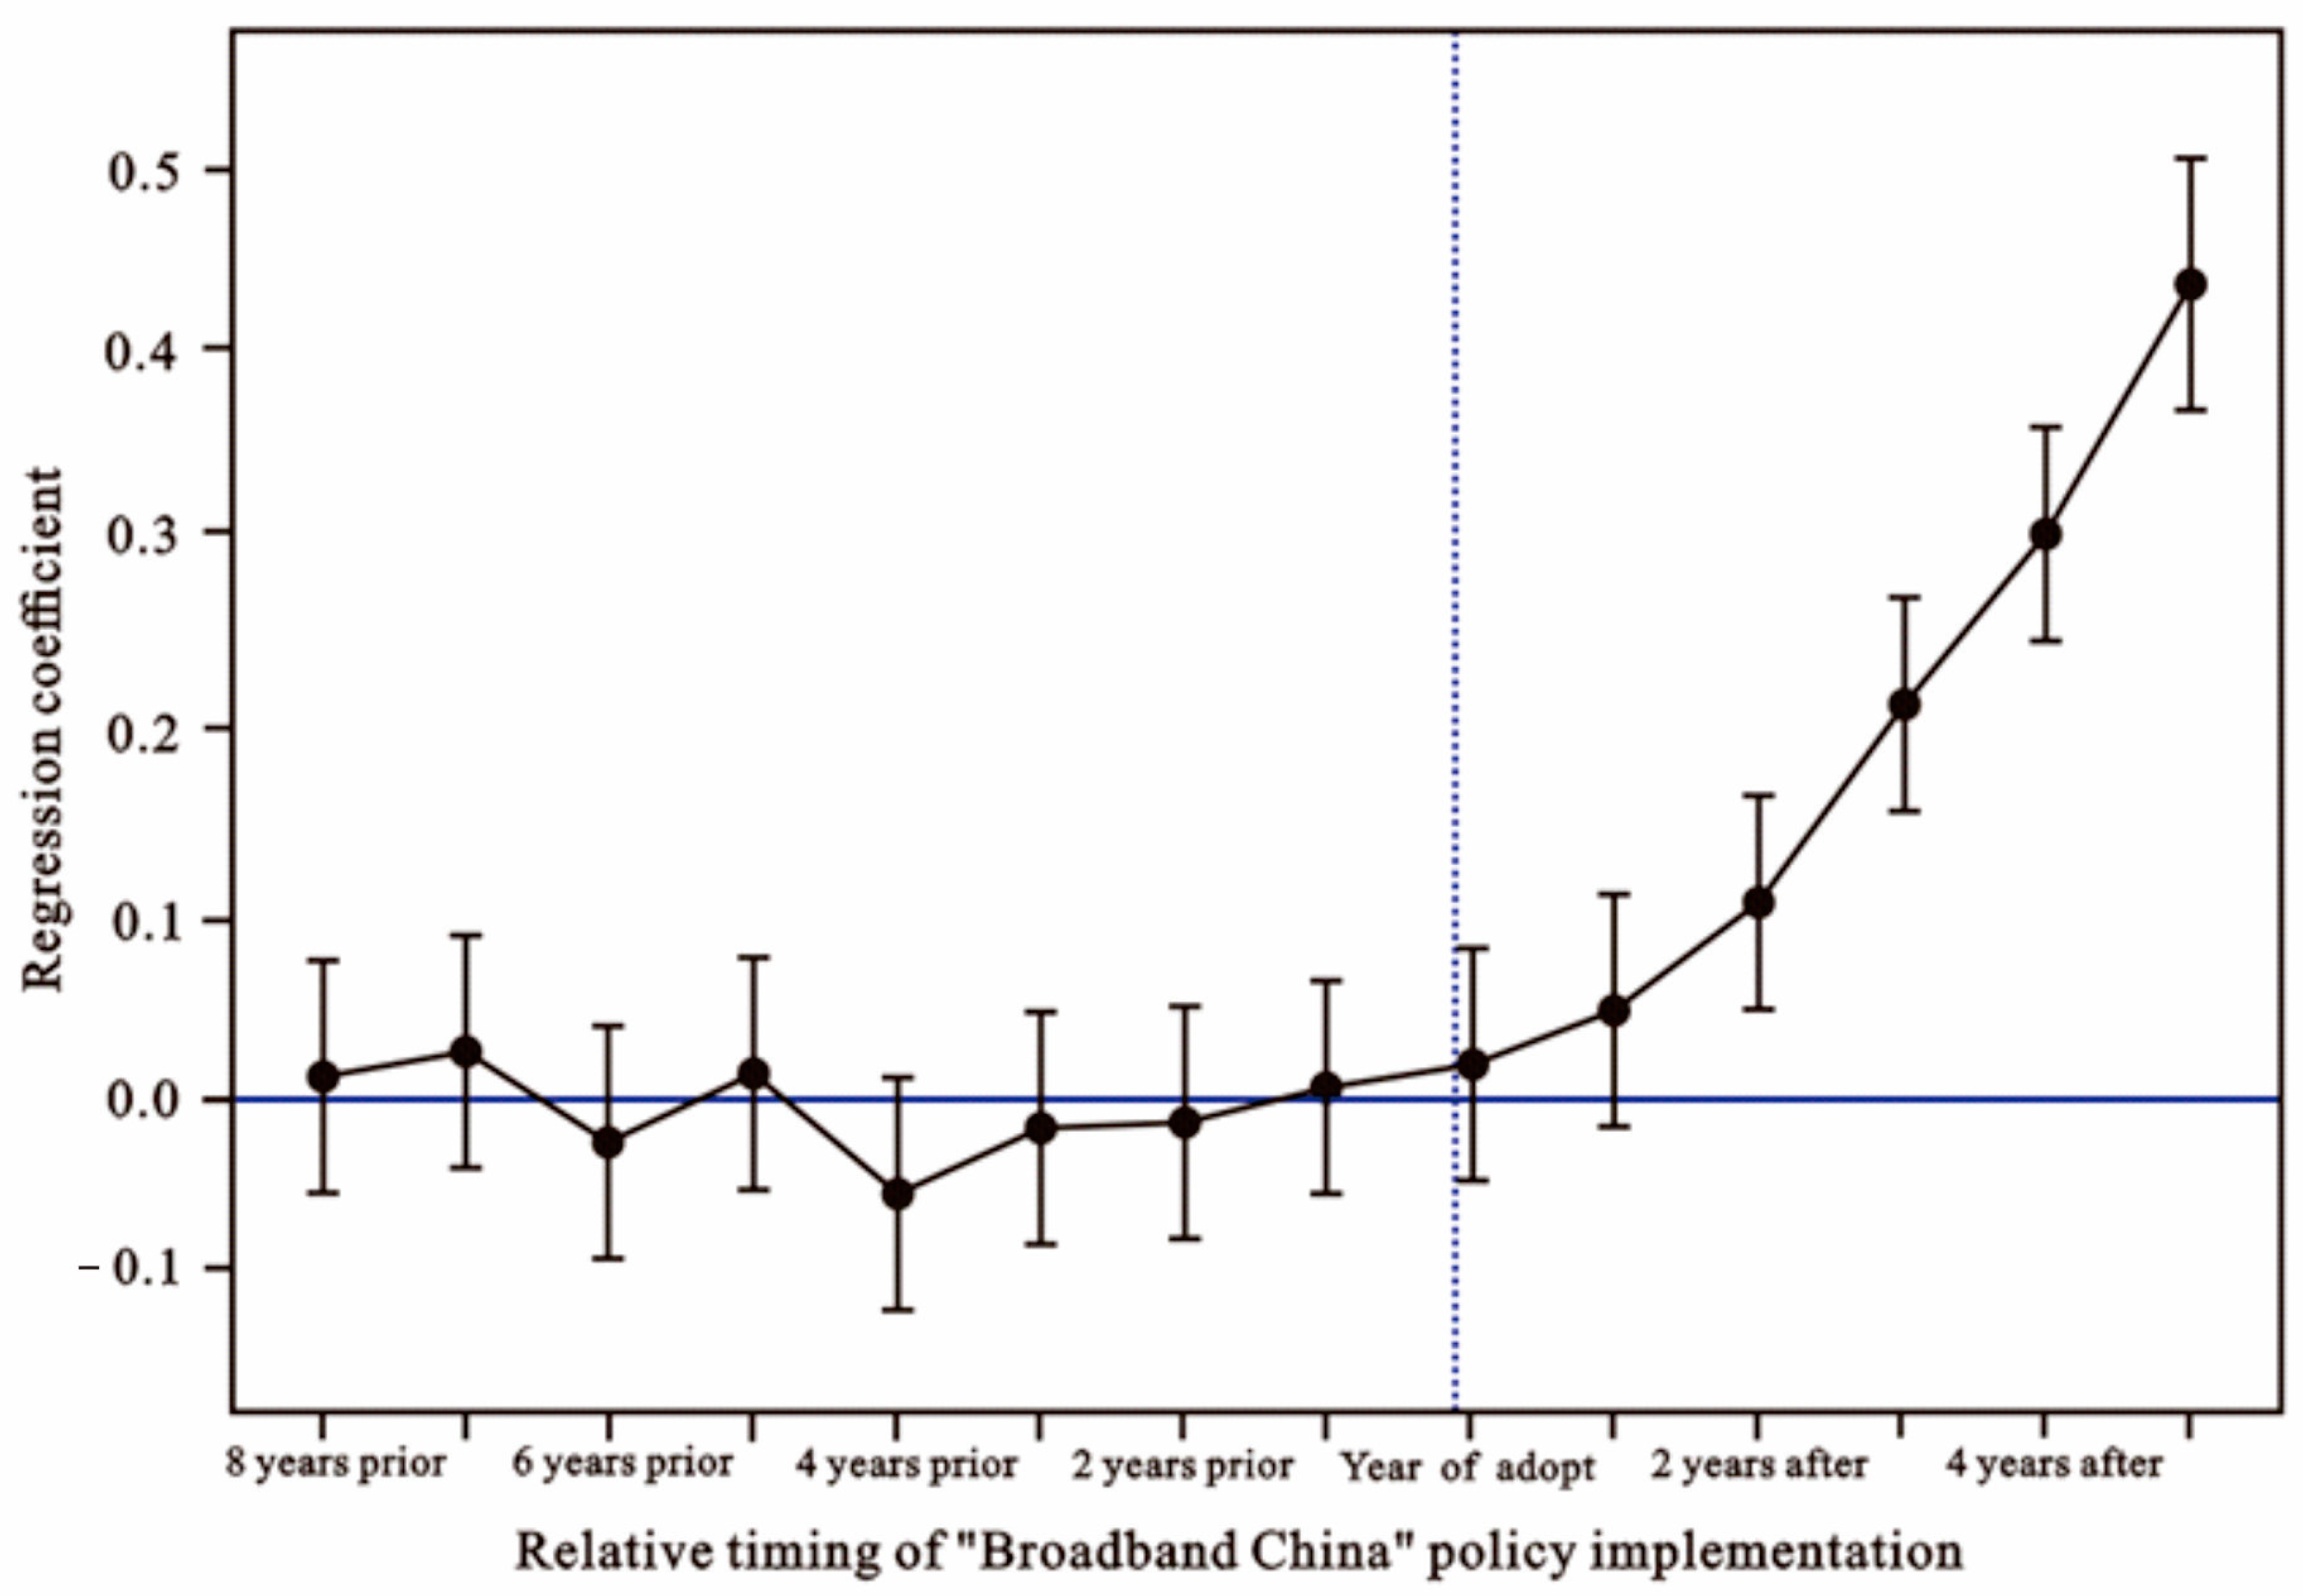
The results of benchmark regression and endogenous regression estimation indicated that the development level of the digital economy had a crucial effect on promoting urban PMEE. At the same time, the level of pollution control and scientific and technological innovation also had a significantly positive impact. By contrast, the proportion of the industrial output value had a certain negative effect on PMEE. The positive impact of the development of the digital economy on urban PMEE was still tenable after the robustness test through the use of methods that replaced explanatory variables. The results of the exogenous impact test indicated that the development of the urban digital economy, represented by the implementation of a pilot policy, not only reduced PM2.5 emissions but also improved the level of PMEE governance. This means that the results of the empirical analysis were reliable.
Limited by the availability of the sample data, the research area of this paper focused on Zhejiang: a typical province on the eastern coast of China. With the continuous development of artificial intelligence, blockchain technology, and digital economy, as well as the improvement of relevant indicators, researchers should continue to expand the scope and samples of the research area and explore the driving mechanism and internal transmission mechanism of the digital economy on PMEE and air pollution further in the future.

Author Contributions

Conceptualization, X.F. and L.D.; Data curation, X.F.; Formal analysis, B.G.; Funding acquisition, S.C. and Y.S.; Investigation, L.W.; Methodology, L.D.; Project administration, S.C.; Resources, Y.S.; Software, L.D.; Supervision, B.G. and S.C.; Validation, B.G. and L.W.; Visualization, X.F.; Writing—original draft, X.F., S.C. and L.D.; Writing—review and editing, X.F., S.C. and L.D. All authors have read and agreed to the published version of the manuscript.

Funding

This work was supported by the Intergovernmental Cooperation in Science, Technology and Innovation, the National Key Research and Development Program (Grant No. 2019YFE0194000), the National Natural Science Foundation of China (Grant No. 42077013 and 71704171), the Zhejiang Province Philosophy and Social Science Planning Key Project (Grant No. 19NDJC011Z), and the Major Humanities and Social Science Projects of Colleges in Zhejiang Province in 2019–2020 (Grant No. 2021GH047).

Institutional Review Board Statement

Not applicable.

Informed Consent Statement

Not applicable.

Data Availability Statement

The model data and its generator can be obtained by contacting the author.

Conflicts of Interest

The authors declare that there are no conflicts of interest regarding the publication of this paper.

Abbreviations

PM2.5fine particulate matter smaller than 2.5 μm
PM10particulate matter smaller than 10 μm
PMEEPM2.5 environmental efficiency
GDPGross domestic product
DEAData Envelopment Analysis
SBMSlack-Based Measure
ZSG-DEAZero sum gains DEA model
DIDDifference-in-differences
IAQIUrban environmental air quality index
R&DResearch and development
DMUDecision-making unit
CCRCharnes, Cooper, and Rhodes
BCCBanker, Charnes and Cooper
FDIForeign direct investment level

References

  1. Li, G.; Fang, C.; He, S. The influence of environmental efficiency on PM2.5 pollution: Evidence from 283 Chinese prefecture-level cities. Sci. Total Environ. 2020, 748, 141549. [Google Scholar] [CrossRef] [PubMed]
  2. Zhang, Y.; Chen, X.; Mao, Y.; Shuai, C.; Jiao, L.; Wu, Y. Analysis of resource allocation and PM2.5 pollution control efficiency: Evidence from 112 Chinese cities. Ecol. Indic. 2021, 127, 107705. [Google Scholar] [CrossRef]
  3. Qian, H.; Xu, S.; Cao, J.; Ren, F.; Wei, W.; Meng, J.; Wu, L. Air pollution reduction and climate co-benefits in China’s industries. Nat. Sustain. 2021, 4, 417–425. [Google Scholar] [CrossRef]
  4. Diao, B.; Ding, L.; Cheng, J.; Fang, X. Impact of transboundary PM2.5 pollution on health risks and economic compensation in China. J. Clean. Prod. 2021, 326, 129312. [Google Scholar] [CrossRef]
  5. Guo, X.; Jia, C.; Xiao, B. Spatial variations of PM2.5 emissions and social welfare induced by clean heating transition: A gridded cost-benefit analysis. Sci. Total Environ. 2022, 826, 154065. [Google Scholar] [CrossRef]
  6. Cheng, S.; Xie, J.; Xiao, D.; Zhang, Y. Measuring the environmental efficiency and technology gap of PM2.5 in China’s ten city groups: An empirical analysis using the EBM meta-frontier model. Int. J. Environ. Res. Public Health 2019, 16, 675. [Google Scholar] [CrossRef] [PubMed] [Green Version]
  7. Guo, Q.; Luo, K. The spatial convergence and drivers of environmental efficiency under haze constraints—Evidence from China. Environ. Impact Assess. 2021, 86, 106513. [Google Scholar] [CrossRef]
  8. Wang, Q.; Hao, D.; Li, F.; Guan, X.; Chen, P. Development of a new framework to identify pathways from socioeconomic development to environmental pollution. J. Clean. Prod. 2020, 253, 119962. [Google Scholar] [CrossRef]
  9. Zhao, X.; Zhou, W.; Han, L. The spatial and seasonal complexity of PM2.5 pollution in cities from a social-ecological perspective. J. Clean. Prod. 2021, 309, 127476. [Google Scholar] [CrossRef]
  10. Mi, Y.; Sun, K.; Li, L.; Lei, Y.; Wu, S.; Tang, W.; Yang, J. Spatiotemporal pattern analysis of PM2.5 and the driving factors in the middle Yellow River urban agglomerations. J. Clean. Prod. 2021, 299, 126904. [Google Scholar] [CrossRef]
  11. Li, G.; Fang, C.; Wang, S.; Sun, S. The effect of economic growth, urbanization, and industrialization on fine particulate matter (PM2.5) concentrations in China. Environ. Sci. Technol. 2016, 50, 11452–11459. [Google Scholar] [CrossRef] [PubMed]
  12. Pan, W.; Xie, T.; Wang, Z.; Ma, L. Digital economy: An innovation driver for total factor productivity. J. Bus. Res. 2022, 139, 303–311. [Google Scholar] [CrossRef]
  13. Ma, Q.; Tariq, M.; Mahmood, H.; Khan, Z. The nexus between digital economy and carbon dioxide emissions in China: The moderating role of investments in research and development. Technol. Soc. 2022, 68, 101910. [Google Scholar] [CrossRef]
  14. Xu, S.; Yang, C.; Huang, Z.; Failler, P. Interaction between digital economy and environmental pollution: New evidence from a spatial perspective. Int. J. Environ. Res. Public Health 2022, 19, 5074. [Google Scholar] [CrossRef]
  15. Che, S.; Wang, J. Digital economy development and haze pollution: Evidence from China. Environ. Sci. Pollut. Res. 2022, 29, 73210–73226. [Google Scholar] [CrossRef]
  16. Wan, Q.; Shi, D. Smarter and Cleaner: The Digital Economy and Environmental Pollution. China World Econ. 2022, 30, 59–85. [Google Scholar] [CrossRef]
  17. Li, J.; Chen, L.; Chen, Y.; He, J. Digital economy, technological innovation, and green economic efficiency—Empirical evidence from 277 cities in China. Manag. Decis. Econ. 2022, 43, 616–629. [Google Scholar] [CrossRef]
  18. Zhou, J.; Lan, H.; Zhao, C.; Zhou, J. Haze pollution levels, spatial spillover influence, and impacts of the digital economy: Empirical evidence from China. Sustainability 2021, 13, 9076. [Google Scholar] [CrossRef]
  19. Han, D.; Ding, Y.; Shi, Z.; He, Y. The impact of digital economy on total factor carbon productivity: The threshold effect of technology accumulation. Environ. Sci. Pollut. Res. 2022, 37, 29. [Google Scholar] [CrossRef]
  20. Li, G.; Zhou, X. Can promoting the development of the digital economy improve China’s environmental pollution? A quasi-natural experiment based on the “Broadband China” strategy. Macroeconomics 2021, 7, 146–160. (In Chinese) [Google Scholar]
  21. Wang, K.; Zhao, X.; Peng, B.; Zeng, Y. Can energy efficiency progress reduce PM2.5 concentration in China’s cities? Evidence from 105 key environmental protection cities in China, 2004–2015. J. Clean. Prod. 2021, 288, 125684. [Google Scholar] [CrossRef]
  22. Lu, Y.Y.; He, Y.; Wang, B.; Ye, S.S.; Hua, Y.; Ding, L. Efficiency evaluation of atmospheric pollutants emission in Zhejiang Province China: A DEA-malmquist based approach. Sustainability 2019, 11, 4544. [Google Scholar] [CrossRef] [Green Version]
  23. Chen, X.; Zhang, X.; Wu, X.; Lu, C.C. The environmental health and energy efficiency in China: A network slacks-based measure. Energ. Environ. 2022, 33, 170–188. [Google Scholar] [CrossRef]
  24. Wu, X.; Guo, J. Inputs optimization to reduce the undesirable outputs by environmental hazards: A DEA model with data of PM2.5 in China. In Economic Impacts and Emergency Management of Disasters in China; Springer: Singapore, 2021; pp. 547–580. [Google Scholar]
  25. Piao, S.R.; Li, J.; Ting, C.J. Assessing regional environmental efficiency in China with distinguishing weak and strong disposability of undesirable outputs. J. Clean. Prod. 2019, 227, 748–759. [Google Scholar] [CrossRef]
  26. Song, M.; Wang, S.; Lei, L.; Zhou, L. Environmental efficiency and policy change in China: A new meta-frontier non-radial angle efficiency evaluation approach. Process Saf. Environ. 2019, 121, 281–289. [Google Scholar] [CrossRef]
  27. Deng, R.; Zhang, A. Research on the impact of urban digital economy development on environmental pollution and its mechanism. South China J. Econ. 2022, 2, 18–37. (In Chinese) [Google Scholar]
  28. Zhang, J.; Zeng, W.; Shi, H. Regional environmental efficiency in China: Analysis based on a regional slack-based measure with environmental undesirable outputs. Ecol. Indic. 2016, 71, 218–228. [Google Scholar] [CrossRef]
  29. Wang, K.; Wei, Y.M.; Huang, Z. Environmental efficiency and abatement efficiency measurements of China’s thermal power industry: A data envelopment analysis based materials balance approach. Eur. J. Oper. Res. 2018, 269, 35–50. [Google Scholar] [CrossRef]
  30. Yang, W.; Li, L. Efficiency evaluation of industrial waste gas control in China: A study based on data envelopment analysis (DEA) model. J. Clean. Prod. 2018, 179, 1–11. [Google Scholar] [CrossRef]
  31. Ma, D.; Li, G.; He, F. Exploring PM2.5 Environmental Efficiency and Its Influencing Factors in China. Int. J. Environ. Res. Public Health 2021, 18, 12218. [Google Scholar] [CrossRef]
  32. Li, Y.; Chiu, Y.H.; Lu, L.C.; Chiu, C.R. Evaluation of energy efficiency and air pollutant emissions in Chinese provinces. Energ. Effic. 2017, 12, 963–977. [Google Scholar] [CrossRef]
  33. Wu, X.; Tan, L.; Guo, J.; Wang, Y.; Liu, H.; Zhu, W. A study of allocative efficiency of PM2.5 emission rights based on a zero sum gains data envelopment model. J. Clean. Prod. 2016, 113, 1024–1031. [Google Scholar] [CrossRef]
  34. Li, D.; Zhang, Z.; Fu, L.; Guo, S.D. Regional differences in PM2.5 emission reduction efficiency and their influencing mechanism in Chinese cities. China Popul. Resour. Environ. 2021, 31, 74–85. (In Chinese) [Google Scholar]
  35. Ding, L.; Lu, Y.Y.S. Evaluation of atmospheric environment efficiency and regional differences in Zhejiang. J. Saf. Environ. 2019, 19, 1075–1085. (In Chinese) [Google Scholar]
  36. Tone, K.; Tsutsui, M. Dynamic DEA: A slacks-based measure approach. Omega 2010, 38, 145–156. [Google Scholar] [CrossRef] [Green Version]
  37. Ding, L.; Fang, X. Spatial-temporal distribution of air-pollution-intensive industries and its social-economic driving mechanism in Zhejiang Province, China: A framework of spatial econometric analysis. Environ. Dev. Sustain. 2022, 24, 1681–1712. [Google Scholar] [CrossRef]
  38. Xia, H.; Ding, L.; Yang, S.; Wu, A. Socioeconomic factors of industrial air pollutants in Zhejiang Province, China: Decoupling and Decomposition analysis. Environ. Sci. Pollut. Res. 2020, 27, 28247–28266. [Google Scholar] [CrossRef]
  39. Zhang, Q.; Ye, S.; Ma, T.; Fang, X.; Shen, Y.; Ding, L. Influencing factors and trend prediction of PM2.5 concentration based on stripat-scenario analysis in Zhejiang province, China. Environ. Dev. Sustain. 2022, 1–25. [Google Scholar] [CrossRef]
  40. Zhang, S.; Wu, S. Evaluation of Digital Rural Development from the Perspective of Rural Revitalization–Take Zhejiang Province as an Example. Strateg. Plan. Energ. Environ. 2021, 40, 121–144. [Google Scholar] [CrossRef]
  41. Ding, L.; Chen, K.; Hua, Y.; Dong, H.; Wu, A. Investigating the relationship between the industrial structure and atmospheric environment by an integrated system: A case study of Zhejiang, China. Sustainability 2020, 12, 1278. [Google Scholar] [CrossRef] [Green Version]
  42. Liu, X.; Wu, J. Energy and environmental efficiency analysis of China’s regional transportation sectors: A slack-based DEA approach. Energy Syst. 2017, 8, 747–759. [Google Scholar] [CrossRef]
  43. Zhang, Y.; Shuai, C.; Bian, J.; Chen, X.; Wu, Y.; Shen, L. Socioeconomic factors of PM2.5 concentrations in 152 Chinese cities: Decomposition analysis using LMDI. J. Clean. Prod. 2019, 218, 96–107. [Google Scholar] [CrossRef]
  44. Wang, J.; Wang, S.; Li, S.; Cai, Q.; Gao, S. Evaluating the energy-environment efficiency and its determinants in Guangdong using a slack-based measure with environmental undesirable outputs and panel data model. Sci. Total Environ. 2019, 663, 878–888. [Google Scholar] [CrossRef] [PubMed]
  45. Halkos, G.E.; Polemis, M.L. The impact of economic growth on environmental efficiency of the electricity sector: A hybrid window DEA methodology for the USA. J. Environ. Manag. 2018, 211, 334–346. [Google Scholar] [CrossRef]
  46. Zhejiang Provincial Bureau of Statistics. Zhejiang Statistical Yearbook; China Statistics Press: Beijing, China, 2020. [Google Scholar]
  47. Zhejiang Provincial Bureau of Statistics. Zhejiang Natural Resources and Environment Statistical Yearbook; China Statistics Press: Beijing, China, 2020. [Google Scholar]
  48. Van Donkelaar, A.; Martin, R.V.; Brauer, M.; Boys, B.L. Use of satellite observations for long-term exposure assessment of global concentrations of fine particulate matter. Environ. Health Perspect. 2015, 123, 135–143. [Google Scholar] [CrossRef] [Green Version]
  49. Hampf, B.; Rødseth, K.L. Environmental efficiency measurement with heterogeneous input quality: A nonparametric analysis of US power plants. Energ. Econ. 2019, 81, 610–625. [Google Scholar] [CrossRef]
  50. Iram, R.; Zhang, J.; Erdogan, S.; Abbas, Q.; Mohsin, M. Economics of energy and environmental efficiency: Evidence from OECD countries. Environ. Sci. Pollut. Res. 2020, 27, 3858–3870. [Google Scholar] [CrossRef]
  51. Toloo, M. On finding the most BCC-efficient DMU: A new integrated MIP–DEA model. Appl. Math. Model. 2012, 36, 5515–5520. [Google Scholar] [CrossRef]
  52. Li, H.; Fang, K.; Yang, W.; Wang, D.; Hong, X. Regional environmental efficiency evaluation in China: Analysis based on the Super-SBM model with undesirable outputs. Math. Comp. Model. 2013, 58, 1018–1031. [Google Scholar] [CrossRef]
  53. Tone, K. A slacks-based measure of efficiency in data envelopment analysis. Eur. J. Oper. Res. 2001, 130, 498–509. [Google Scholar] [CrossRef] [Green Version]
  54. Tone, K. A slacks-based measure of super-efficiency in data envelopment analysis. Eur. J. Oper. Res. 2002, 143, 32–41. [Google Scholar] [CrossRef] [Green Version]
  55. Zhang, Y.; Mao, Y.; Jiao, L.; Shuai, C.; Zhang, H. Eco-efficiency, eco-technology innovation and eco-well-being performance to improve global sustainable development. Environ. Impact Asses. 2021, 89, 106580. [Google Scholar] [CrossRef]
  56. Zhu, W.; Zhu, Y.; Yu, Y. China’s regional environmental efficiency evaluation: A dynamic analysis with biennial Malmquist productivity index based on common weights. Environ. Sci. Pollut. Res. 2020, 27, 39726–39741. [Google Scholar] [CrossRef] [PubMed]
  57. Sun, X.; Chen, Z.; Shi, T.; Yang, G.; Yang, X. Influence of digital economy on industrial wastewater discharge: Evidence from 281 Chinese prefecture-level cities. J. Water Clim. Change 2022, 13, 593–606. [Google Scholar] [CrossRef]
  58. Fan, F.; Lian, H.; Liu, X.; Wang, X. Can environmental regulation promote urban green innovation Efficiency? An empirical study based on Chinese cities. J. Clean. Prod. 2021, 287, 125060. [Google Scholar] [CrossRef]
  59. Zeng, S.; Wang, M. Theoretical and empirical analyses on the factors affecting carbon emissions: Case of Zhejiang Province, China. Environ. Dev. Sustain. 2022, 25, 2522–2549. [Google Scholar] [CrossRef]
  60. Ganda, F. The environmental impacts of financial development in OECD countries: A panel GMM approach. Environ. Sci. Pollut. Res. 2019, 26, 6758–6772. [Google Scholar] [CrossRef] [PubMed]
  61. Liu, X.; Dong, X.; Li, S.; Ding, Y.; Zhang, M. Air pollution and high human capital population migration: An empirical study based on 35 major cities in China. Sustain. Prod. Consump. 2021, 27, 643–652. [Google Scholar] [CrossRef]
  62. Zhao, T.; Zhang, Z.; Liang, S. Digital economy, entrepreneurship, and high-quality economic development: Empirical evidence from urban China. J. Manag. World 2020, 36, 65–76. (In Chinese) [Google Scholar]
  63. Ren, S.; Zheng, J.; Liu, D.; Chen, X. Does emissions trading system improve firm’s total factor productivity—Evidence from Chinese listed companies. China Ind. Econ. 2019, 5, 5–23. [Google Scholar]
  64. Jacobson, L.S.; LaLonde, R.J.; Sullivan, D.G. Earnings losses of displaced workers. Am. Econ. Rev. 1993, 83, 685–709. [Google Scholar]
  65. Jiang, B.; Ding, L.; Fang, X. Sustainable development of new urbanization from the perspective of coordination: A new complex system of Urbanization-Technology Innovation and the Atmospheric Environment. Atmosphere 2019, 10, 652. [Google Scholar] [CrossRef] [Green Version]
Figure 1. Technical route and analysis framework of the study.
Atmosphere 14 00672 g001
Figure 2. Map of the study area: Zhejiang province and 11 prefecture-level cities.
Atmosphere 14 00672 g002
Figure 3. Spatial distribution of PM2.5 concentration in Zhejiang province from 2006 to 2019 (unit: μg/m3).
Atmosphere 14 00672 g003
Figure 4. Comparison of PMEE in different regions of Zhejiang province.
Atmosphere 14 00672 g004
Figure 5. Estimation results of the dummy variable’s parallel trend test.
Atmosphere 14 00672 g005
Figure 6. High and low classification of PM2.5 control performance in Zhejiang province.
Atmosphere 14 00672 g006
Table 1. Summary of application of Data Envelopment Analysis (DEA) in atmospheric environmental efficiency.
AuthorScope of StudyPeriodInput IndicatorsDesirable OutputUndesirable OutputMethod
Lu et al., 2019 [22]11 cities in Zhejiang2006–2016SO2, NOx, smoke and dust emissions, total industrial exhaust emissionsGDPIAQINon-radial DEA Malmquist Index
Wu and Guo, 2021 [24]29 Chinese provinces2012SO2, NOx, soot, coal consumption, car ownership, capital and laborGDPPM2.5 emissionsThe undesirable output DEA model
Piao et al., 2019 [25]30 Chinese provinces2005–2014Employment, energy and water consumption, capital stock GDPCO2, SO2, etc.DEA, ML productivity
Song et al., 2019 [26]30 Chinese provinces2004–2015Employees, consumption of standard coal, capital stockGDPSO2meta-frontier non-radial angle DEA
Deng and Zhang, 2022 [27]285 Chinese cities2011–2018Public service labor force, environmental protection investmentGreen areaSO2, smokeSBM-DEA
Zhang et al., 2016 [28]30 Chinese provinces2005–2011Labor employment, capital
stock and energy consumption
GDPCO2, SO2SBM-DEA
Wang et al., 2018 [29]Provincial thermal
power industry
2006–2014Energy consumption, installed
capacity and employee
Electricity generationCO2, SO2 NOX, soot emissionsDEA-based materials balance approach
Yang and Li, 2018
[30]
39 Chinese industrial
sectors
2003–2014Capital, labor, energy
consumption
Industrial value addedIndustrial waste gas emissionsDEA model
Ma et al., 2021 [31]30 Chinese provinces2001–2018employed persons, total energy and water consumption, capital stock, GDPPM2.5 concentrationSBM-Undesirable-VRS model
Li et al., 2019 [32]31 Chinese cities2013–2017Employees, fix assets and energy
consumption
GDPPM2.5, SO2 and NO2Resample SBM
DEA
Wu et al. 2016 [33]29 Chinese provinces2000–2010Energy, labor and fixed asset
investment
GDPPM2.5 emissionsinput-oriented ZSG-DEA model
Zhang et al., 2021 [2]112 Chinese cities2003–2017Labor, energy and water consumption, fixed asset investmentGDPPM2.5 concentrationSuper-SBM-DEA
GML productivity
Li et al., 2021 [34]260 Chinese cities2003–2018Labor, energy consumption, fixed asset investmentGDPPM2.5 concentrationHybrid-Dynamic-DEA
Notes: GDP, gross domestic product. IAQI, urban environmental air quality index. ZSG-DEA, zero sum gains DEA model. ML productivity, the Malmquist and Luenberger productivity index.
Table 2. Descriptive statistics of variables from 2006 to 2019 in Zhejiang province.
VariableIndicatorVariable NameSampleMeanStandard DeviationMinMax
Input variableEmployed personsLabor154327.43177.9055.84720.00
Energy consumptionEnergy154987.98687.7683.783273.51
Investment in fixed assetsCapital1541797.421484.54210.177241.91
Desirable outputGDPGDP1543318.482842.11335.2015,375.05
Undesirable outputPM2.5 concentrationPM2.515448.3312.5120.1070.90
Key explanatory variableDigital economy levelDe1540.430.310.870.12
Control variableIndustrial structure levelInd15442.706.6023.0054.82
Pollution control levelReg15481,329.477,937.8985.0362,335.0
Technological innovation levelTec1541.720.710.213.29
Foreign direct Investment levelFdi154126,329.2166189.31926720,915
Table 3. Results of PMEE in 11 cities in Zhejiang province from 2006 to 2019.
RegionsCity200620112016201914-Year AverageRank
Hangzhou Bay urban agglomerationHangzhou0.63020.50820.70371.0000.71802
Ningbo0.43030.68091.0001.0000.71753
Jiaxing0.40640.41340.46180.59500.453411
Huzhou0.42660.43680.51030.65780.49529
Shaoxing0.51170.47460.55740.65190.61198
Zhoushan1.00000.93160.84041.00000.93871
Non-Hangzhou Bay areasWenzhou0.73750.50200.48790.69800.64797
Jinhua0.55790.66570.57620.72880.65226
Quzhou0.42880.45390.47870.56360.470410
Taizhou0.61100.59190.51310.67100.66625
Lishui0.53250.77730.64361.00000.70214
Total average0.57020.64450.62930.77870.6430
Table 4. Benchmark regression estimation results.
Variables(1) PMEE(2) PMEE(3) PMEE(4) PMEE(5) PMEE
lnDe0.932 ***
(3.731)
0.947 ***
(3.835)
0.835 ***
(3.429)
0.846 ***
(3.501)
0.908 ***
(2.537)
lnInd −0.043 **
(1.362)
−0.055**
(1.279)
−0.048 **
(1.318)
−0.052 **
(1.294)
lnReg 0.142 ***
(0.921)
0.133 ***
(0.844)
0.107 ***
(0.832)
lnTec 0.065 **
(0.736)
0.058 **
(0.694)
lnFdi −0.052
(0.481)
Constant−8.593 ***
(−5.621)
−7.548 ***
(−4.342)
−5.361 **
(−3.107)
−4.781 **
(−2.329)
−9.382 ***
(−6.218)
Urban fixed effectYesYesYesYesYes
Time fixed effectYesYesYesYesYes
R20.6420.6630.6750.7410.694
Number of samples154154154154154
Number of cities1111111111
Note: **, *** denoted significance level of 5%, and 1%, respectively. The above model adopted the clustering standard error, and the number in brackets is the t value.
Table 5. Endogenous estimation results.
Variables(6) lnPM2.5(7) PMEEFirst Stage of 2SLS Second Stage of 2SLS
lnDe(8) PMEE
lnDe−0.451 ***
(−1.028)
0.914 ***
(2.032)
1.038 ***
(7.841)
L. lnPM2.50.051 ***
(1.424)
L. PME 0.231 ***
(4.782)
0.175 ***
(3.951)
ControlsYesYesYesYes
Urban fixed effectYesYesYesYes
Time fixed effectYesYesYesYes
R20.5830.7280.6220.498
Number of samples154154154154
Number of cities11111111
Note: *** denoted the significance level of 1%. The above model adopted the clustering standard error, and the number in brackets is the t value.
Table 6. Double-difference estimation results of PMEE of “Broadband China” strategy in Zhejiang pilot cities.
Variables(9) PMEE(10) PMEE(11) lnPM2.5(12) lnPM2.5
Policy0.294 ***
(0.472)
0.251 ***
(0.148)
−0.359 ***
(−0.241)
−0.304 ***
(−0.172)
Constant−2.813 ***
(−1.458)
−2.454 ***
(−1.029)
4.216 ***
(1.382)
3.892 ***
(0.722)
ControlsNoYesNoYes
Urban fixed effectYesYesYesYes
Time fixed effectYesYesYesYes
R20.4590.5080.4210.466
Number of samples154154154154
Number of cities11111111
Note: *** denoted the significance level of 1%. The above model adopted the clustering standard error, and the number in brackets is the t value.
Disclaimer/Publisher’s Note: The statements, opinions and data contained in all publications are solely those of the individual author(s) and contributor(s) and not of MDPI and/or the editor(s). MDPI and/or the editor(s) disclaim responsibility for any injury to people or property resulting from any ideas, methods, instructions or products referred to in the content.

