Article

Emissions of PAHs, Nitro-PAHs and Quinones (Oxy-PAHs) Associated to PM1.0 and PM2.5 Emitted by a Diesel Engine Fueled with Diesel-Biodiesel-Ethanol Blends

by
Joilson Nascimento Paim
1,2,
Aldenor Gomes Santos
3,4,
Rennan G. O. Araujo
4,5,
Madson Moreira Nascimento
2,3,4,
Jailson Bittencourt De Andrade
2,3,5 and
Lilian Lefol Nani Guarieiro
2,5,*
1
Departamento de Engenharia Mecânica, Escola Politécnica, Universidade Federal da Bahia, Salvador 40210-630, BA, Brazil
2
Centro Universitário SENAI-CIMATEC, Salvador 41650-110, BA, Brazil
3
Centro Interdisciplinar em Energia e Ambiente—CIEnAm, Universidade Federal da Bahia, Salvador 40170-115, BA, Brazil
4
Instituto de Química, Universidade Federal da Bahia, Campus de Ondina, Salvador 40170-115, BA, Brazil
5
Instituto Nacional de Ciência e Tecnologia INCT, Universidade Federal da Bahia, Salvador 40170-115, BA, Brazil
*
Author to whom correspondence should be addressed.
Atmosphere 2023, 14(4), 656; https://doi.org/10.3390/atmos14040656
Submission received: 15 February 2023 / Revised: 13 March 2023 / Accepted: 24 March 2023 / Published: 31 March 2023
(This article belongs to the Special Issue Air Pollution Exposure and Health Impact Assessment)

Abstract

:
Emissions of PAH, nitro-PAHs, and oxy-PAHs from a diesel engine fueled with diesel-biodiesel-ethanol blends need to be controlled and reduced, as they are unregulated emissions harmful to the environment and human health. The objective of this work was to investigate the effect of ethanol concentration on diesel engine emissions when fueled with diesel–biodiesel–ethanol blends. Ethanol was added with biodiesel–diesel blends. Diesel B7 and two ternary blends, B7E3 and B7E10, with 3% and 10% ethanol, were tested and studied in a diesel engine to determine engine performance characteristics and particulate matter emissions and to quantify polycyclic aromatic compounds (PACs) associated with PM1.0 and PM2.5. Under the same engine conditions, 18 PAHs, 27 nitro-PAHs, and 6 quinones (oxy-PAHs) were determined by GC–MS in real samples obtained from the engine. The mean concentrations of PACs found in the B7, B7E3, and B7E10 blends for PM1.0 ranged from 0.1 µg m−3 (coronene) to 118.1 µg m−3 (2-nitrofluorene). The concentrations for PM2.5 ranged from 0.1 µg m−3 (acenaphthylene) to 99.7 µg m−3 (2-nitrofluorene). Potent mutagens benzanthrone (BA) and 3-nitrobenzanthrone (3-NBA) were found at concentrations ranging from 0.10 µg m−3 to 1.9 µg m−3 and 0.3 µg m−3 to 1.6 µg m−3, respectively. Low molecular weight (LMW) PAHs were mainly PACs bounded to the PM1.0 and PM2.5 particles emitted by B7E10. Flow properties were improved by adding 3% and 10% ethanol to biodiesel. B7E3 and B7E10 blends presented low fuel consumption and a reduction in the emission factor (EF) by the engine. B7E10 blending showed a smaller total concentration of ∑PAH (26.8 µg m−3), ∑nitro-PAH (85.4 µg m−3), and ∑oxy-PAH (6.0 µg m−3) associated with PM2.5 particles compared PM1.0.

1. Introduction

The growth in fuel demand that is arising from industrial development and engine vehicle fleets has increased the use of fossil fuels in the global energy matrix [1,2]. In this context, the need to find alternative fuels and economically viable technologies arouses the interest of many countries in the world. Many researchers are diving into the search for alternative fuels to overcome the fossil fuel crisis [3,4,5,6,7].
The use of renewable fuels is one of the alternatives that could contribute to the advancement of studies aimed at evaluating the performance of automotive systems in order to reduce atmospheric emissions. The mixture of oxygenated fuels and biofuels has been used in diesel cycle engines seeking to promote new applications [8,9,10,11,12,13,14]. However, there is still a need for targeted investigations into the properties of biodiesel exhaust particles and other biofuels, mainly related to toxicity and adverse health effects during exposure [15].
Recently, Yusuf et al. [16] compared the effect of biodiesel compositions on emissions of regulated and unregulated toxic pollutants using the technology of a high-efficiency after-treatment device (HePT) that can be applied in a diesel engine under different engine loads. Gaseous and particulate pollutants were evaluated pre-and post-treatment. The results indicated significant reductions in CO, HC, and NOx emissions with the HePT device. For unregulated emission factors (EFs), PM2.5 species were dominated by OC, and a similar proportion was observed with soot-EC using a HePT device fueled with B25 and B50. The B25 and B50 EFs of total PAHs decreased from 11.7% to 54.8% compared to B0 at all engine loads [16].
The combustion of fuel mixtures containing alcohols and methyl or ethyl esters (biodiesel) in diesel cycle engines provides the oxygen needed to form carbon dioxide (CO2) instead of carbon-rich particles. This, in turn, contributes to lower emissions of smoke, particulate matter (PM), carbon monoxide (CO), and hydrocarbon (HC) emissions. However, it results in higher emissions of nitrogen oxides (NOx) and sulfur (SOx) [6,8].
Several studies with an ethanol content ranging from 3% to 90% [6,8,9,17,18,19,20,21,22,23,24,25,26,27,28] were performed with mixtures containing diesel, biodiesel, and ethanol for use in diesel cycle engines, with the objective of evaluating performance (performance and consumption), emissions of HC, NOx, CO, particulate matter (PM), and volatile organic compounds, including PAHs, generated by diesel engines. The addition of ethanol and/or biodiesel to diesel increases the ignition delay, combustion rate, and thermal efficiency and reduces exhaust fumes. Considering the effect of ethanol that is present in diesel or a diesel-biodiesel blend on unregulated emissions such as PAHs, Yilmaz et al. [29,30] investigated the effects of the fuels on PAH formation and emissions compared to straight diesel fuel in a diesel engine operating with different biodiesel blends consisting of 5%, 20%, and 35% alcohol. The results show how adding 5% alcohol to biodiesel decreased total PAH emissions, and adding 20% and 35% alcohol to biodiesel increased the total PAH emissions compared to neat biodiesel.
Particulate matter (PM) is one of the main pollutants to be emitted in diesel burning due to its complexity and interactions with different chemical substances in the atmosphere [31]. Particle emissions from diesel vehicles are dominated by the size range of final and ultra-fine particles, such as particulate material with an aerodiameter less than 1.0 µm (PM1.0) and 2.5 µm (PM2.5) [32,33]. There is a focus on diesel vehicle emissions as the source of these particles, which are associated with increased concentrations. This is in addition to biofuels, which can become an important target for regulatory action [34]. The exhaust of diesel engines originates from atmospheric particles consisting mainly of large agglomerates of solid carbonaceous compounds, sulfur compounds, and volatile organic compounds (VOCs) [32,35]. The small fraction of diesel that is evaporated and atomized in the combustion process is adsorbed on the surface of the carbonaceous nuclei, condensed on the surface of the particles, and generally consists of aromatic hydrocarbons, quinones, organic compounds, etc., which are considered minority constituents [32,36].
Diesel engines are known to be sources of emissions of polycyclic aromatic hydrocarbons (PAHs) and their nitro-PAHs and quinone derivatives. The occurrence of PAHs, nitro-PAHs and quinones has aroused great interest and concern for health due to their carcinogenic and mutagenic properties [37]. These compounds result from primary emissions from combustion processes, that is, direct combustion sources [37]. Formation occurs during combustion at high temperatures of fuel as part of the unburned fuel and lubricating oil [38,39,40]. Road traffic is considered the main primary source of PAHs, NPAHs, and quinones (Oxy-PAHs) in urban areas [41].
Currently, the effects of diesel-biodiesel-ethanol blends in diesel engines, especially the formation of PAHs, nitro-PAHs, and quinone derivatives are not well known. The literature lacks a greater understanding of the impacts of adding alcohol and biodiesel, including the effects on emissions that are created by these polycyclic aromatic compounds. Although there are studies on diesel-biodiesel-ethanol blends for PAHs, the emission of nitro-PAHs and oxy-PAHs (Quinones) has not yet been investigated. A novel fuel blend, based on the addition of renewable fuels to diesel, with stability, ease of use, and economic viability, allows for synergy with new technologies. The study of the ideal renewable fuel mixture for diesel engines can simultaneously reduce regulated emissions (CO, HC, and NOx) and unregulated emissions such as PAHs and derivatives [29,42].
This study aims to encourage the use of biofuels, carry out tests with diesel-biodiesel-ethanol mixtures in diesel engines, and provide new data to fill in the gaps on this subject in the literature. To achieve this, we investigated the engine performance and emissions of diesel-biodiesel-ethanol mixtures tested with 3% (B7E3) and 10% (B7E10) ethanol to study the effect of ethanol on the emission of particulate matter and polycyclic compound aromatics associated with PM1.0 and PM2.5, produced by the diesel engine and operating with the mixtures B7, B7E3, and B7E10. As a novelty of the present work, there is the investigation of diesel-biodiesel-ethanol mixtures in relation to unregulated emissions through the simultaneous determination of concentrations of 18 PAHs, 27 nitro-PAHs, and 6 Oxy-PAHs (quinones), highlighting the detection of potent BA and 3-NBA mutagens.

2. Materials and Methods

2.1. Fuels and Chemicals

Two kinds of fuel blends, using proportional volumes of commercial diesel (S10, B7 –93% of diesel and 7% of biodiesel), anhydrous ethanol (99.9% m m−1, Merck, Darmstadt, Germany), and pure frying oil biodiesel, were used in this work: (i) a ternary blend with 90% v/v of diesel, 7% v/v of biodiesel and 3% v/v of ethanol (B7E3) and (ii) a ternary blend with 83% v/v of diesel, 7% v/v of biodiesel and 10% v/v of ethanol (B7E10). The biodiesel employed in the tests was donated by a biodiesel plant installed at the Polytechnic School of the Federal University of Bahia (UFBA, Salvador, Bahia, Brazil), with a production capacity of 5,000,000 L per year. Commercial diesel (B7) was purchased at commercial gas stations in the city of Salvador, Bahia, Brazil. The specifications of the fuels are listed in Table 1.

2.2. Sampling: Performance of the Diesel Engine and Particulate Matter Collected

The system that was used for sampling was a compound turbo-compressed engine, with direct fuel injection, for power generation applications (stationary generator engine) MWM, model MS 3.9T, a speed rate of 1800 rpm, four strokes, operating in stationary mode, and with 70% of loading coupled to a steady-state bench dynamometer (Foucault AVL DP 240). The engine and dynamometer’s main characteristics are listed in Table 2a,b, respectively.
For PM1.0 and PM2.5, sampling was carried out with Teflon filters which were 47 mm in diameter and contained 1 μm of the pore (MILIPORE, Ireland); these were placed in an atmosphere with humidity and controlled temperature for 24 h to reduce the interference of humidity in the filter weighing procedure. The ambient temperature ranged from 23 to 27 °C. The measured relative humidity was between 40% and 54%. The PM fractions were collected in cyclone-type samplers with the cut-off for PM1.0 and PM2.5 coupled to a filter support system (model 16,254, Holder Sartorius Stedim). The total volume of the sampled air was 0.240 m3, and the dilution ratio (diesel exhaust: dilution air) varied between 1:15 and 1:46 with an average of 1:30. The sampler was placed at the outlet of the constant volume sampling (CVS) and the exhaust air suction was performed with the aid of a vacuum pump and a flow rate of 8 L min−1 controlled by a Dwyer rotameter (Rate-master model, capacity for 10 L min−1). PM1.0 and PM2.5 samples were collected in triplicate for each fuel blend (B7, B7E3, and B7E10) for 30 min. Figure 1 shows the schematic layout of the engine test bed and sampling system for PM1.0 and PM2.5.
The equation that was used to calculate the FE in emitted particle mass was Equation (1):
FE = (mass of PM emitted/mass of fuel consumed) × dilution factor
The equation that was used to calculate the FE in the mass of an organic compound was Equation (2):
FE = (mass of organic compound contained in PM emitted/mass of fuel consumed) × dilution factor

2.3. Instrumentation and Chemical Analysis

Instrumentation, sample preparation, and chromatographic analysis by GC-MS were performed under the same experimental conditions previously validated by Santos et al. [43] and were applied in the works of both our group [44] and Santos et al. [45] to determine polycyclic aromatic compounds, and contemplate PAHs, nitro-PAHs, and quinones associated with atmospheric particles.
In a brief description, this work utilized a gas chromatograph coupled to a mass spectrometer (GC-MS QP 2010 Ultra, Shimadzu, Japan), equipped with an Rtx-5MS gas capillary column (30 m × 0.250 mm × 0.25 µm, Restek Bellofonte, PE, USA). Oven temperature programming was initiated at 70 °C (2 min) and then rose from 70 to 200 °C (30 °C min−1, 5 min) and 200 to 330 °C (5 °C min−1, 0.67 min). The injector temperature was set at 310 °C, and a transfer line was set to 280 °C. For GC-MS-SIM analysis, the electron ionization mode (EI) (70 eV) was applied. The extraction of PM1.0 and PM2.5 samples followed the procedures described by Santos et al. [43,45]. Sample preparation was performed using a filter piece 4.70 cm2 in diameter, which was then added to a miniaturized micro-extraction device using 500 µL of the extraction solvent (mix of 18% acetonitrile in dichloromethane) and 23 min of sonication [43,45]

2.4. Quality Assurance/Quality Control

All glassware and sampling material were cleaned according to the reference methodology EPA Method 610 for PAH analysis. Before analysis, different analytical blank solutions (instrument, solvent, and method blanks) were assessed to check for the presence of interfering compounds. The instrument blank was evaluated by analyzing the carrier gas in the GC-MS system. The analytical blank solution was evaluated by an extraction solvent using GC-MS, and the blank method was assessed by performing blank solution extraction using only the extraction solvent in the microextraction device. No interfering compounds eluted at the same retention time as the target analytes were detected in the instrument, solvent, or method blanks.
The LOD in an atmospheric concentration (µg m−3) in this study ranged from 0.03 µg m−3 (benzo[a]pyrene) to 0.11 µg m−3 (dibenzo[a,h]anthracene) and between 0.16 µg m−3 (1-nitrobenzo[e]pyrene) and 1.14 µg m−3 (3-nitrophenanthrene), and 0.59 µg m−3 (1,4-naphthoquinone) and 23.6 µg m−3 (9,10-phenanthraquinone) for PAHs, nitro-PAHs, and quinones, respectively. The limit of quantification (LOQ) ranged from 0.09 µg m−3 to 0.37 µg m−3, 0.55 µg m−3 to 3.84 µg m−3, and 1.98 µg m−3 to 71.6 µg m−3 for these same compounds.
In order to assess the extraction efficiency, the method accuracy was evaluated using certified reference material SRM 1649b Urban Dust (NIST). The mean values of recovery were found from 104 ± 12% for PAHs, 89.4 ± 7.2% for nitro-PAHs, and 96.4 ± 5.5 for quinones. To evaluate the extraction efficiency of each batch of samples, we also added two deuterated standards of fluorene-d10 and pyrene-d10. Recovery efficiencies for the deuterated PAHs were 83% and 96%, respectively.

2.5. Risk Assessment based on Incremental Lifetime Cancer Risk

The risk assessment was carried out considering the carcinogenic and mutagenic potential of the studied polycyclic aromatic compounds detected in PM1.0 and PM2.5 and obtained from the diesel-biodiesel-ethanol blends B7, B7E3, and B7E10. The target group for risk assessment was based on three categories: adults (>21 years), adolescents (11–16 years), children (1–11 years), and infants (<1 year) [43].
The mathematical equations, toxicity equivalent factors (TEF), and mutagenic equivalent factors were values for each compound and were used according to those described by Santos, Da Rocha, and De Andrade [45], and the references therein. Briefly, the daily inhalation levels (DIL) were calculated according to Equation (3):
DIL = BaPeq × IR = (∑Ci × TEFi) × IR
where BaPeq was the concentration of each PAH and PAH derivative equivalent to benzo(a)pyrene given in ng m−3. Ci is the concentration of the individual PAH or PAH derivative. TEFi is the toxicity equivalent factor, and IR is the inhalation rate (m−3 d−1). In addition, the incremental lifetime cancer risk (ILCR) was calculated in order to evaluate the inhalation risk for people exposed directly to PM1.0 and PM2.5 emitted by diesel engines [45]. The ILCR was obtained from Equation (4):
ILCR = (DIL × SF × ED × Cf × EF)/(AT × BW)
where SF is the cancer slope factor of benzo[a]pyrene for inhalation exposure (3.14 mg kg−1 day−1). ED (year) is the time of exposure to air particles. Cf is the conversion factor (1 × 10⁻⁶). EF is the exposure frequency (365 days year−1). AT represents the lifespan of carcinogens over 70 years (70 × 365 = 25,550 days), and BW is the body weight of a given individual in a target population. Details of the calculations can be found in Santos, Da Rocha, and De Andrade [45].

3. Results and Discussion

3.1. Specific Fuel Consumption

In the tests, the measurements and monitoring of the consumption of fuel blends by the engine were carried out through the automatic dynamometer management system for the addition of 3% and 10% of anhydrous ethanol into the B7 mixture (B7E3 and B7E10). Figure 2 shows the consumptions by fuel blends (B7, B7E3, and B7E10) for a sampling period of 30 min.
The addition of anhydrous ethanol (E10) to the B7 blend slightly increases the engine’s fuel consumption. The increase in the fuel consumption that was burnt in the tests of the B7E3 and B7E10 blends in relation to B7 was approximately 0.2% and 4.9% for PM1.0 and 0.3% and 6.5% for PM2.5, respectively. These increases were not significant for a 30-min collection. However, the application of B7E3 and B7E10 blends for continuous use can lead to a significant increase in fuel consumption. A higher fuel consumption caused by ethanol blends may be associated with their smaller calorific value. Tse et al., [46] also found similar results, evaluating ternary blends containing a fixed proportion of diesel and biodiesel (85% v/v and 15% v/v), respectively, adding 5% v/v and 10% v/v of ethanol in a diesel cycle engine. Thus, the increase in the concentration of ethanol in diesel/biodiesel blends caused a delay in the ignition and, consequently, an increase in the consumption of the fuel burned in the pre-mix stage.

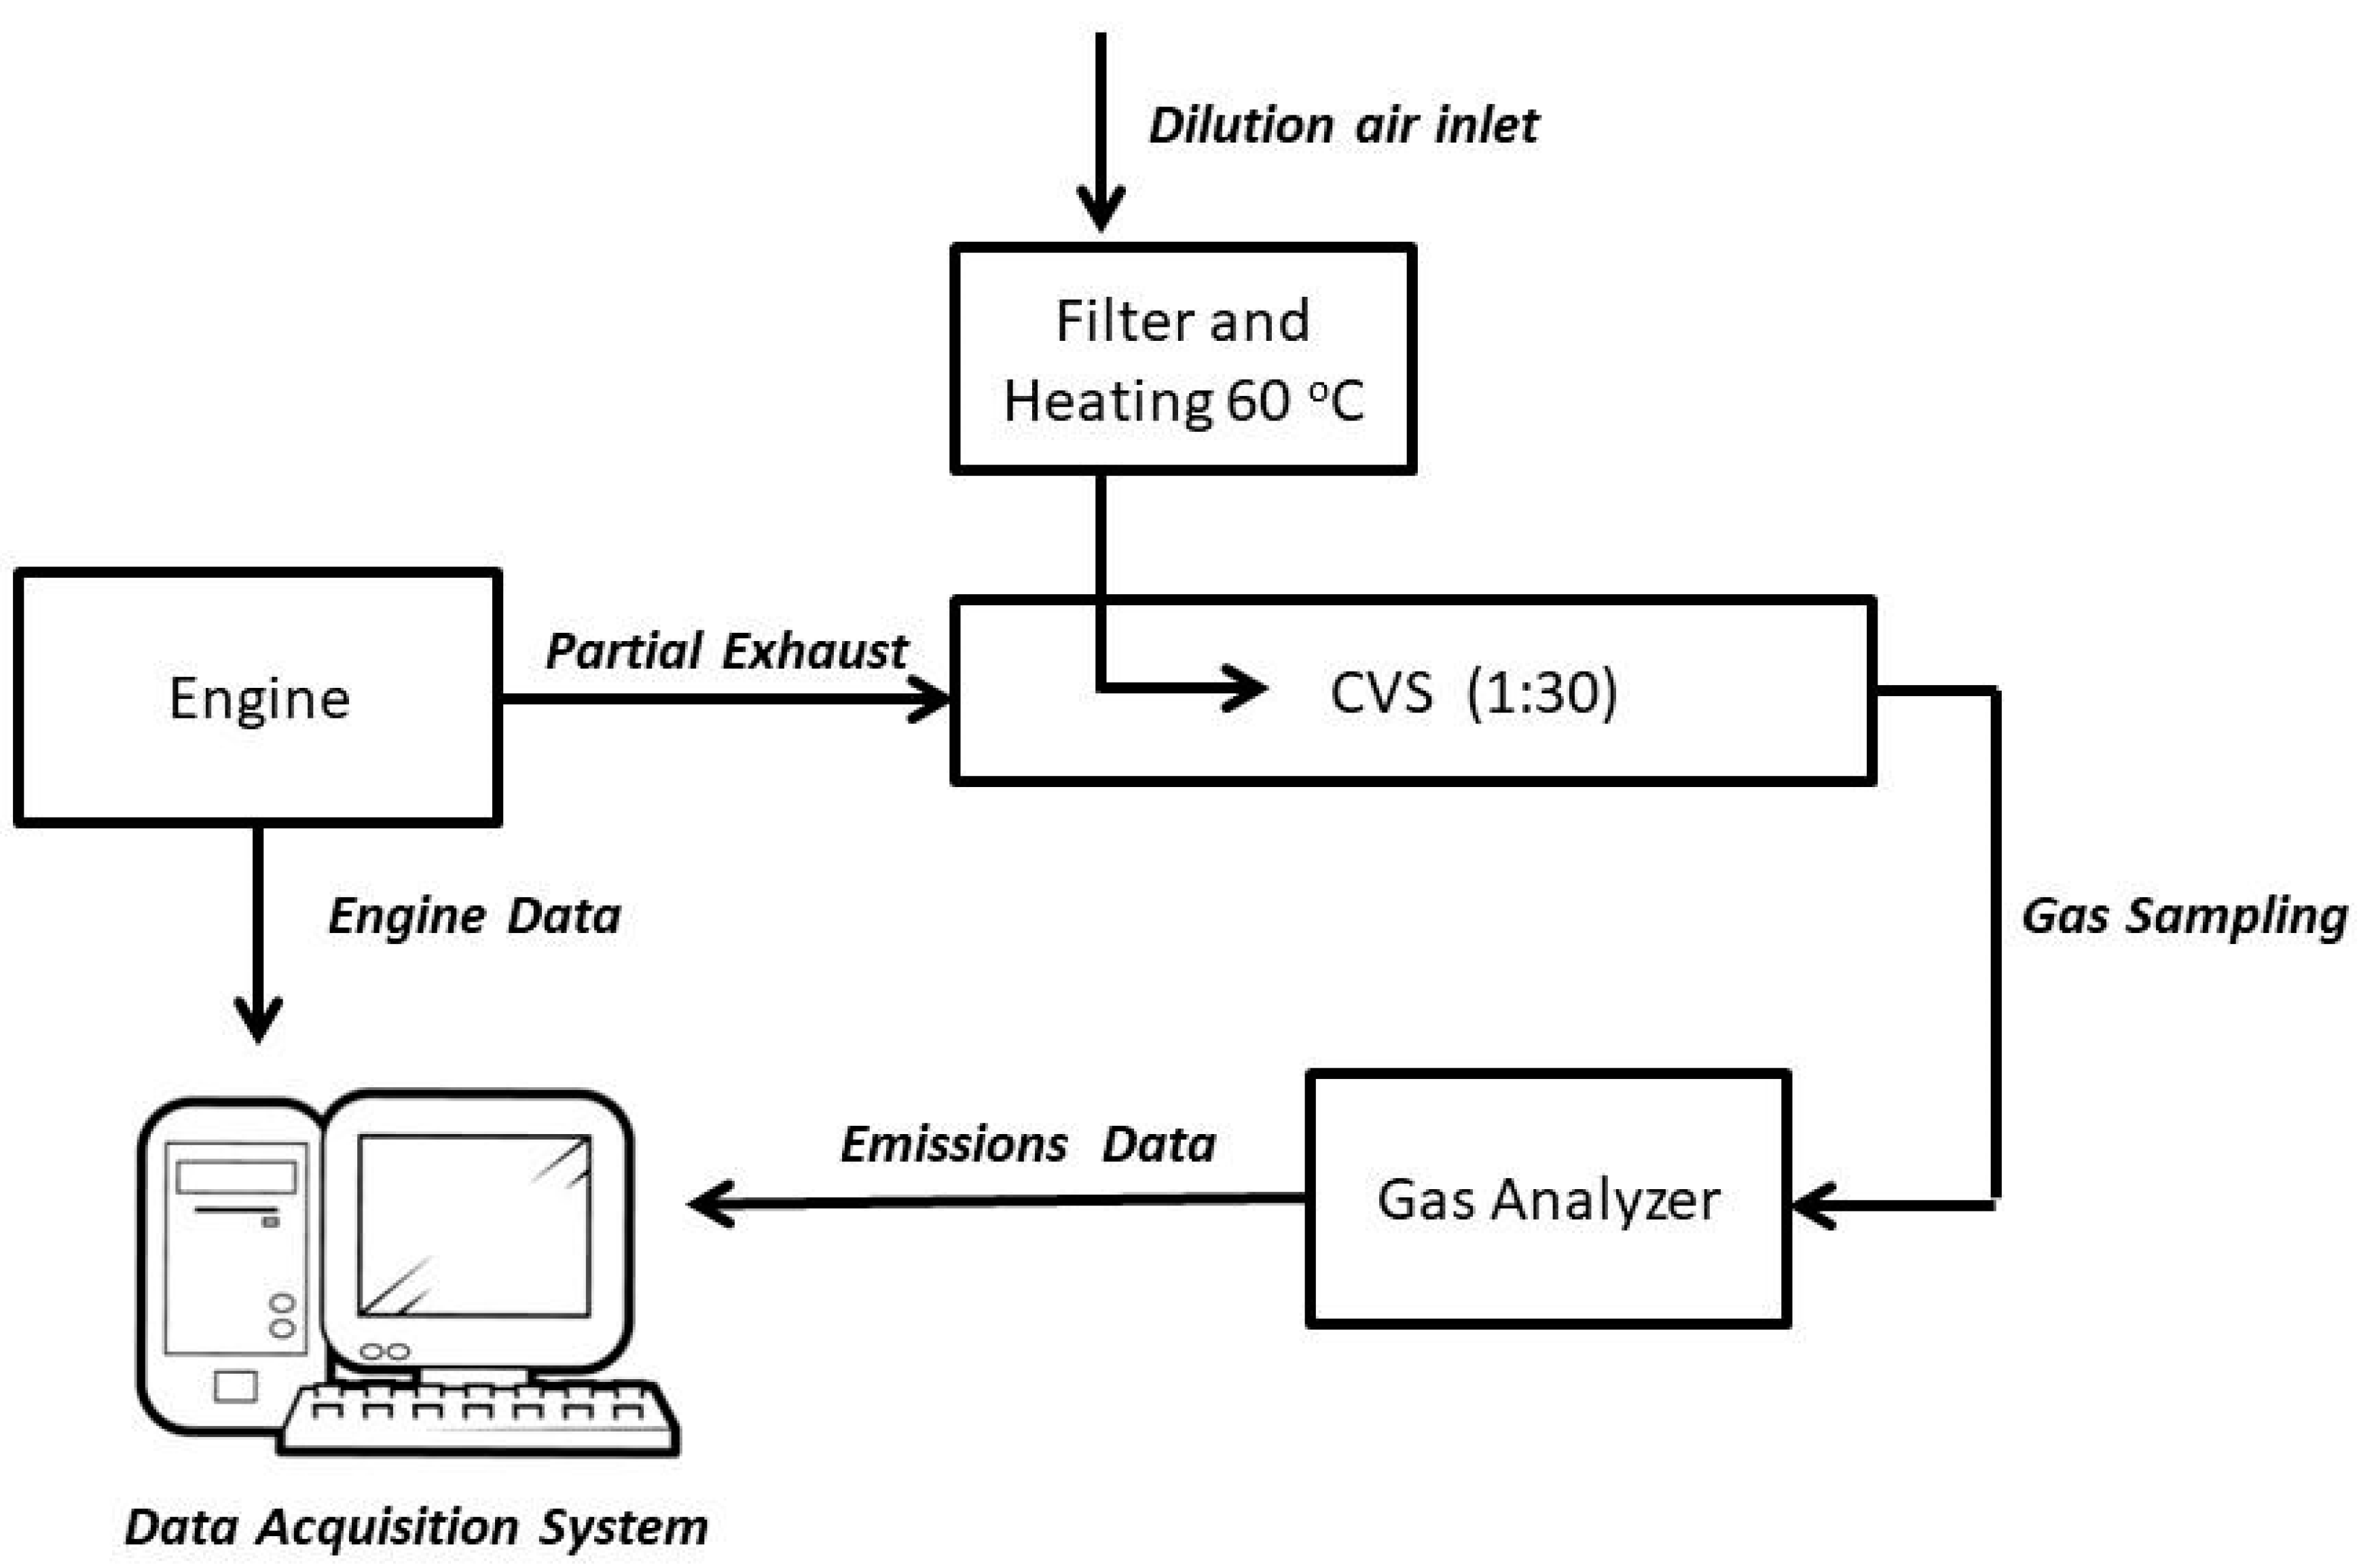
3.2. Emission Factors for PM1.0 and PM2.5

The evaluation of the emission factors (EF) for PM1.0 and PM2.5 were performed for the tests using the fuel blends B7, B7E3, and B7E10. The PM1.0 and PM2.5 EF are shown in Figure 3a and Figure 3b, respectively.
The results obtained for the PM1.0 EF particles showed that the addition of 3% and 10% anhydrous ethanol in the B7 mixture reduced the number of particles emitted by approximately 31% for B7E3 and increased by approximately 23% for B7E10. However, PM2.5 showed an increase of approximately 13% for B7E3 and 35% for B7E10. Ghadikolaei et al. [47] studied the emissions of particulate matter emitted by a diesel engine powered by ternary fuel (diesel-biodiesel-ethanol) and showed that the application of DBE had an effect on reducing particulate matter (PM) emissions. Yang et al. [48] also found similar results for alcohol-containing blends, where the particle number concentrations for all size groups were reduced for biodiesel-pentanol blends under all tested conditions due to a longer ignition delay time, lower viscosity and boiling point, and higher oxygen content of pentanol. In the present study, the results are comparable to the results found for PM1.0 in B7E3 and agree with Tse et al. [46], who reported a reduction in ultrafine particles and nanoparticles in the use of blends containing diesel/biodiesel/ethanol.
However, a significant increase in the concentration of both PM1.0 and PM2.5 particles was observed for the B7E10 fuel blends. According to some studies in the scientific literature, the mode of combustion or engine operation conditions played a more critical role in the reduction of PM than the ethanol concentration in the mixture when it did not exceed 10% by volume [49,50,51,52]. For instance, a study conducted by Prince et al. showed little changes in PM concentrations when an ethanol percentage of up to 30% was used in the fuel blend. However, a larger reduction in PM was observed at ethanol concentrations above 85% [53]. A possible explanation is that higher ethanol concentrations in the fuel blends led to a reduction in soot formation and, consequently, PM reduction through the dilution of more sooting fuel (diesel or gasoline), causing less sooting such as ethanol [52,54,55,56].

3.3. Concentration of PAH, Nitro-PAH and Quinones Associated with PM1.0 and PM2.5

Under the same engine conditions, 18 PAHs, 28 nitro-PAHs, and five quinones (oxy-PAHs) associated with PM1.0 and PM2.5 were emitted by a diesel engine fueled with B7, B7E3, and B7E10 blends, which detected and quantified both PM1.0 and PM2.5. PAHs, niro-PAHs, and Quinones emissions bound to combustion particles are shown in Table 3 and Table 4.
The mean concentrations of PAHs, nitro-PAHs, and quinones for PM1.0 were found between B7, B7E3, and B7E10 blends, which ranged from 0.1 µg m−3 (coronene) to 13.4 µg m−3 (pyrene) for the PAH, from 0.5 µg m−3 (1,4-Naphthoquinone) to 2.9 µg m−3 (9.10-Anthraquinone) for Quinones, and between 0.1 µg m−3 (1-Nitronaphthalene) and 118.1 µg m−3 (2-Nitrofluorene) for nitro-PAH. The values for PM2.5 were from 0.1 µg m−3 (acenaphthylene) to 20.6 µg m−3 (pyrene) for the PAH, for Quinones ranged from 0.9 µg m−3 (1,4-Naphthoquinone) to 4.2 µg m−3 (9.10-Anthraquinone) and between 0.2 µg m−3 (1-Methyl-4-Nitronaphthalene) and 99.7 µg m−3 (2-Nitrofluorene) for nitro-PAH. PAHs from a low molecular weight (LMW) with two aromatic rings, such as naphthalene, acenaphthylene, fluorene, and three aromatic rings, including phenanthrene and fluoranthene, were the compounds observed with higher concentrations bound to the PM1.0 and PM2.5 particles that were emitted. The PAHs that were found were like those presented by Yilmaz and David [29], who reported the presence of PAHs with two aromatic rings (naphthalene, acenaphthylene, fluorene) and three aromatic rings (phenanthrene and fluoranthene). In the investigation into the formation of polycyclic aromatic hydrocarbons (PAHs), the indicated PAHs showed a higher concentration when attached to the particle in tests of a diesel engine fueled with diesel/biodiesel/n-butanol mixtures [29]. Tsai et al. [24] also confirmed that low molecular weight PAHs (LMW-PAHs) were the main PAHs that were emitted by diesel engines operated with different biodiesel blends.
In this study, we highlight the occurrence of two important mutagenic and carcinogenic compounds: benzanthrone (BA) and 3-nitrobenzanthrone (3-NBA). The BA and 3-NBA concentrations presented in this study are the first reported values for diesel exhaust particulate matter (PM1.0 and PM2.5), which were obtained in the diesel engine fueled with diesel-biodiesel-ethanol blends. BA was detected in 100% of the samples, with concentrations ranging from 0.10 µg m−3 (PM1.0) to 1.9 µg m−3 (PM2.5) emitted with fuel blends of B7, B7E3, and B7E10. This compound is an important and potent mutagenic that is associated with vehicle emissions [57] and has been reported in ambient air particles collected in urban and semi-rural areas and at vehicle emission or industrial emissions that have impacted several sites [58,59,60,61,62], with diesel vehicles being the most likely source for benzanthrone (BA). In turn, 3-NBA was detected in 55.5% of the samples, with concentrations ranging from 0.3 µg m−3 (PM1.0) to 1.6 µg m−3 (PM2.5) for the same fuel blends. 3-NBA was detected by Enya et al. [63] and Murahashi [64] in diesel exhaust particles at concentrations of up to 6.6 μg g−1 particles. Our results are not directly comparable with the reported studies, especially concerning particle size, the models of engines, fuels, different concentration units reported, the lack of information regarding sampling data, and the broad sort of analytical methods used. We recently quantified the 3-NBA, presenting the atmospheric occurrence in ambient PM2.5 samples collected from a coastal tropical site in Northeastern Brazil as well as in samples collected in an underground level of a bus station, where bus exhausts contained a mixture of biodiesel to fossil diesel (B4) combustion during commuting [43,45]. This compound is an important mutagen and carcinogenic and suspected human carcinogen that is emitted from diesel engines [64,65]. However, 3-NBA can also be emitted or formed in the atmosphere on the surface of ambient air particulate matter [45,66,67]
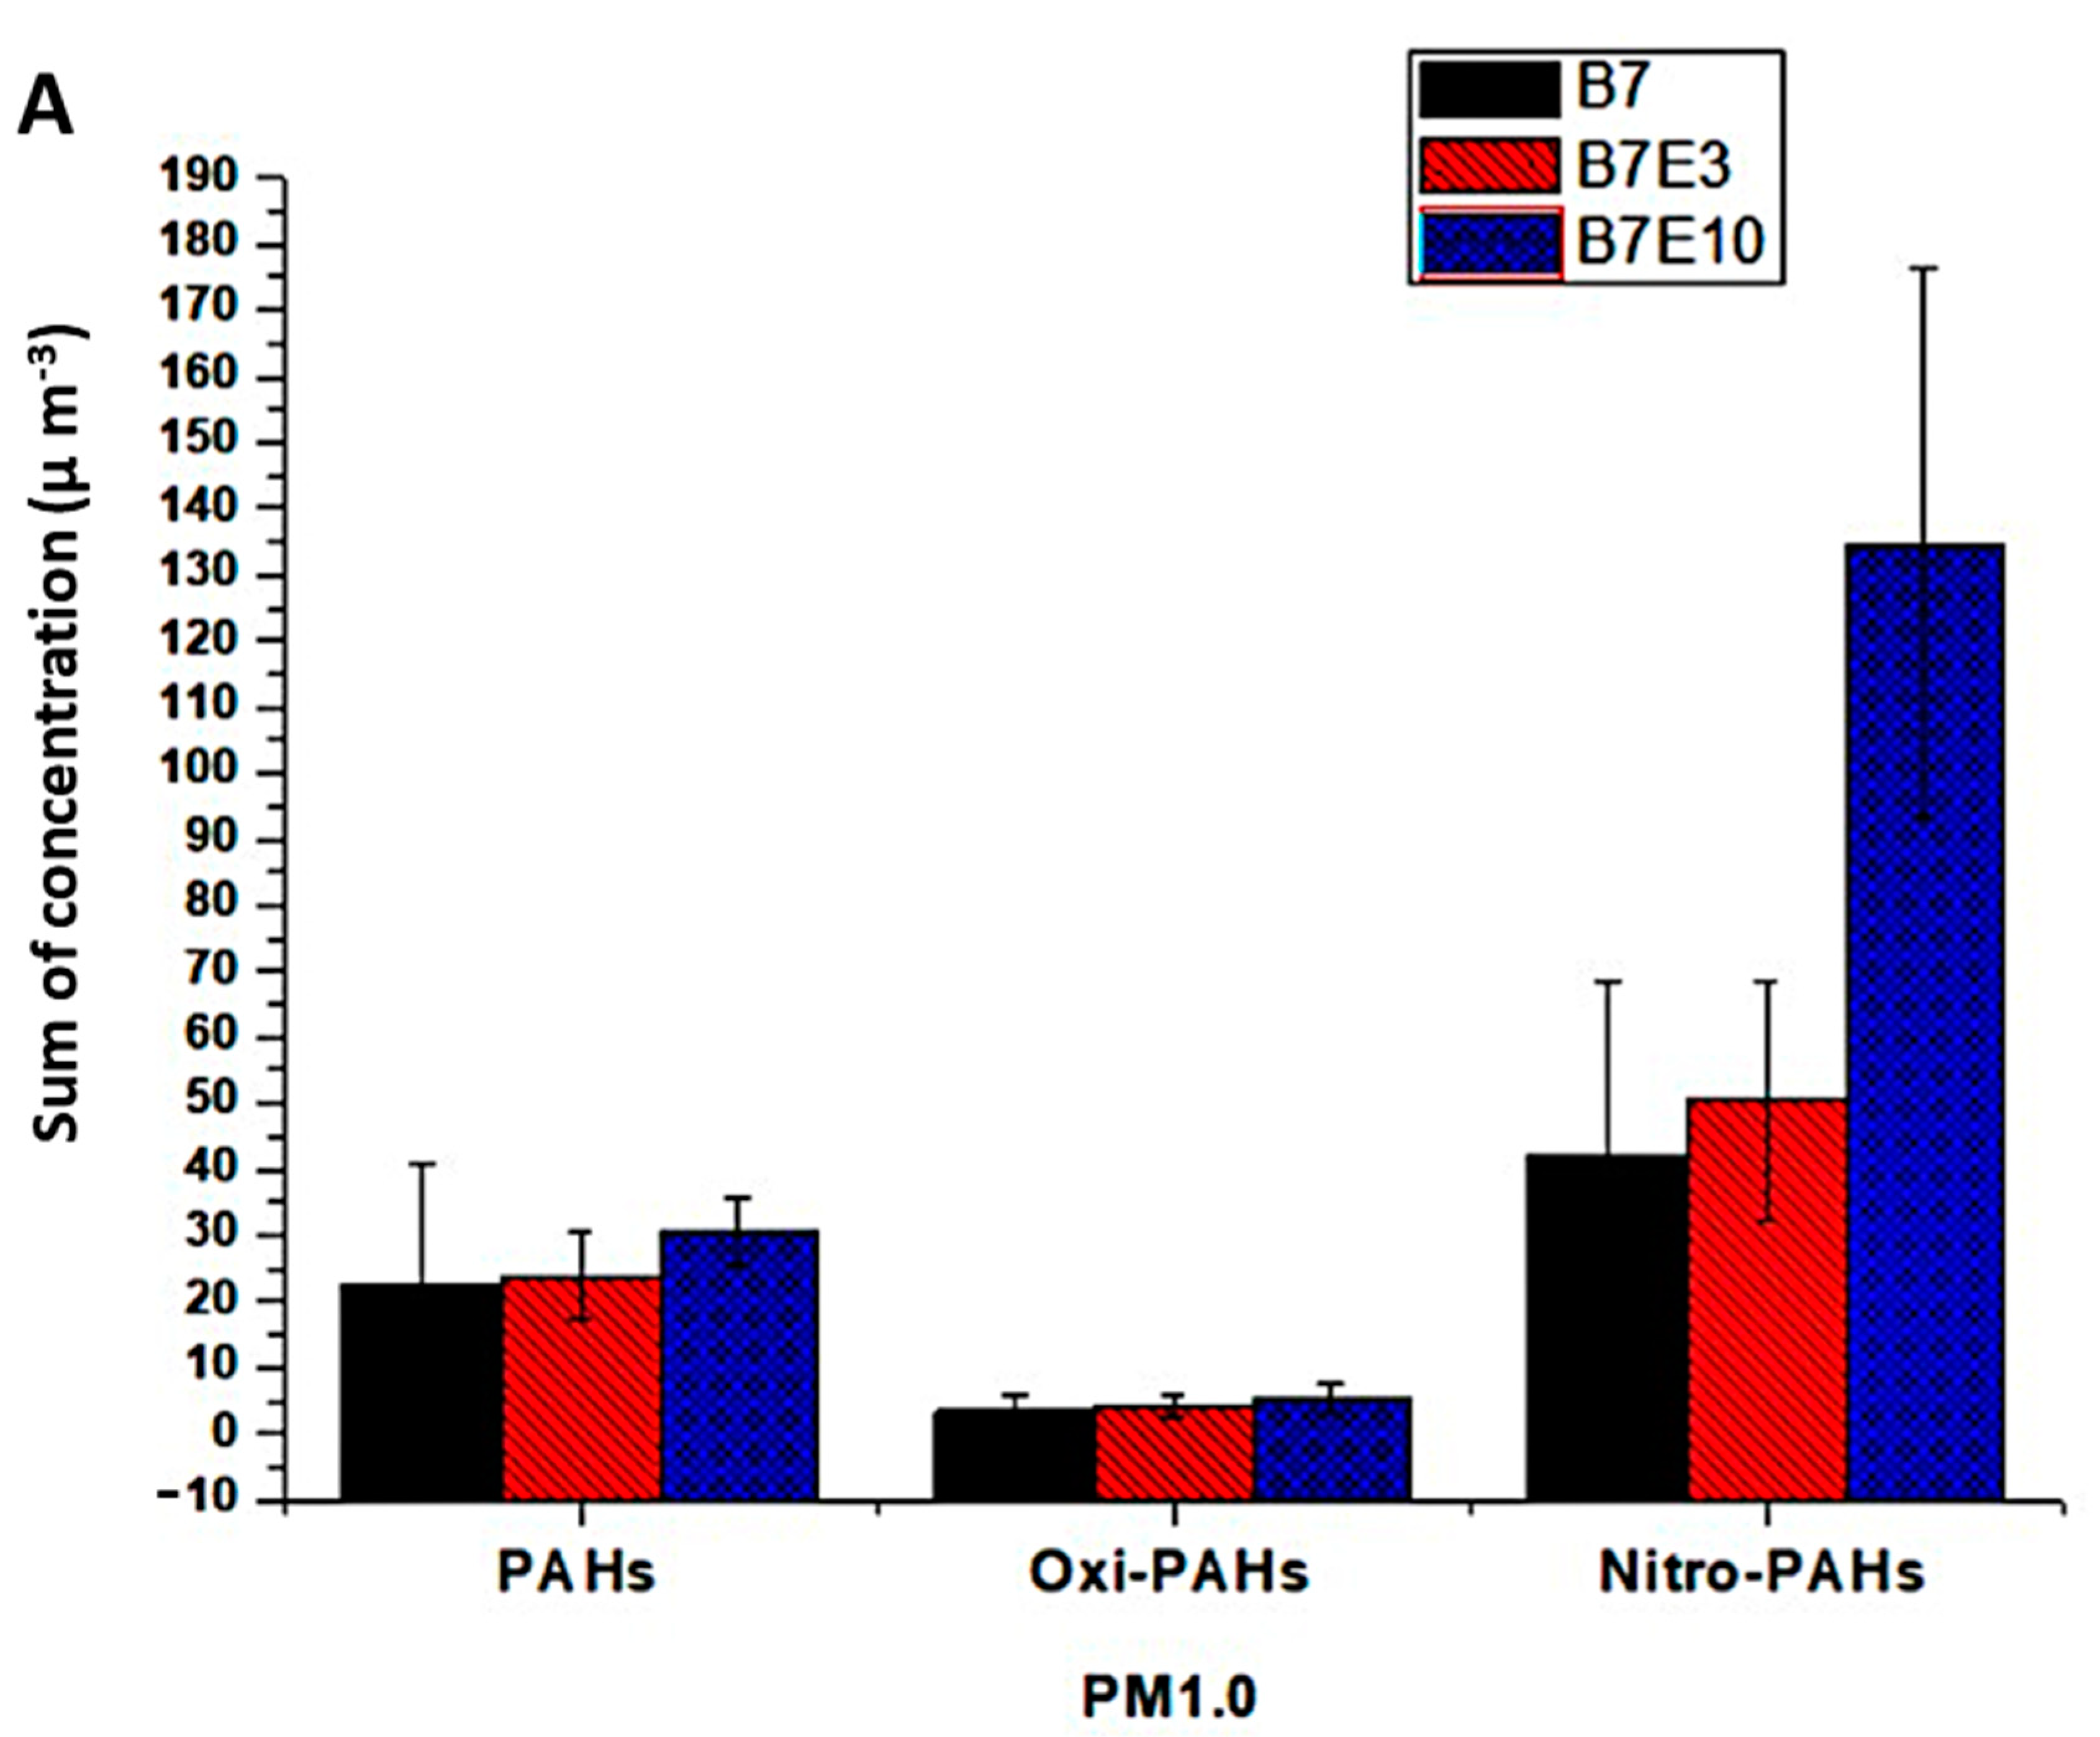
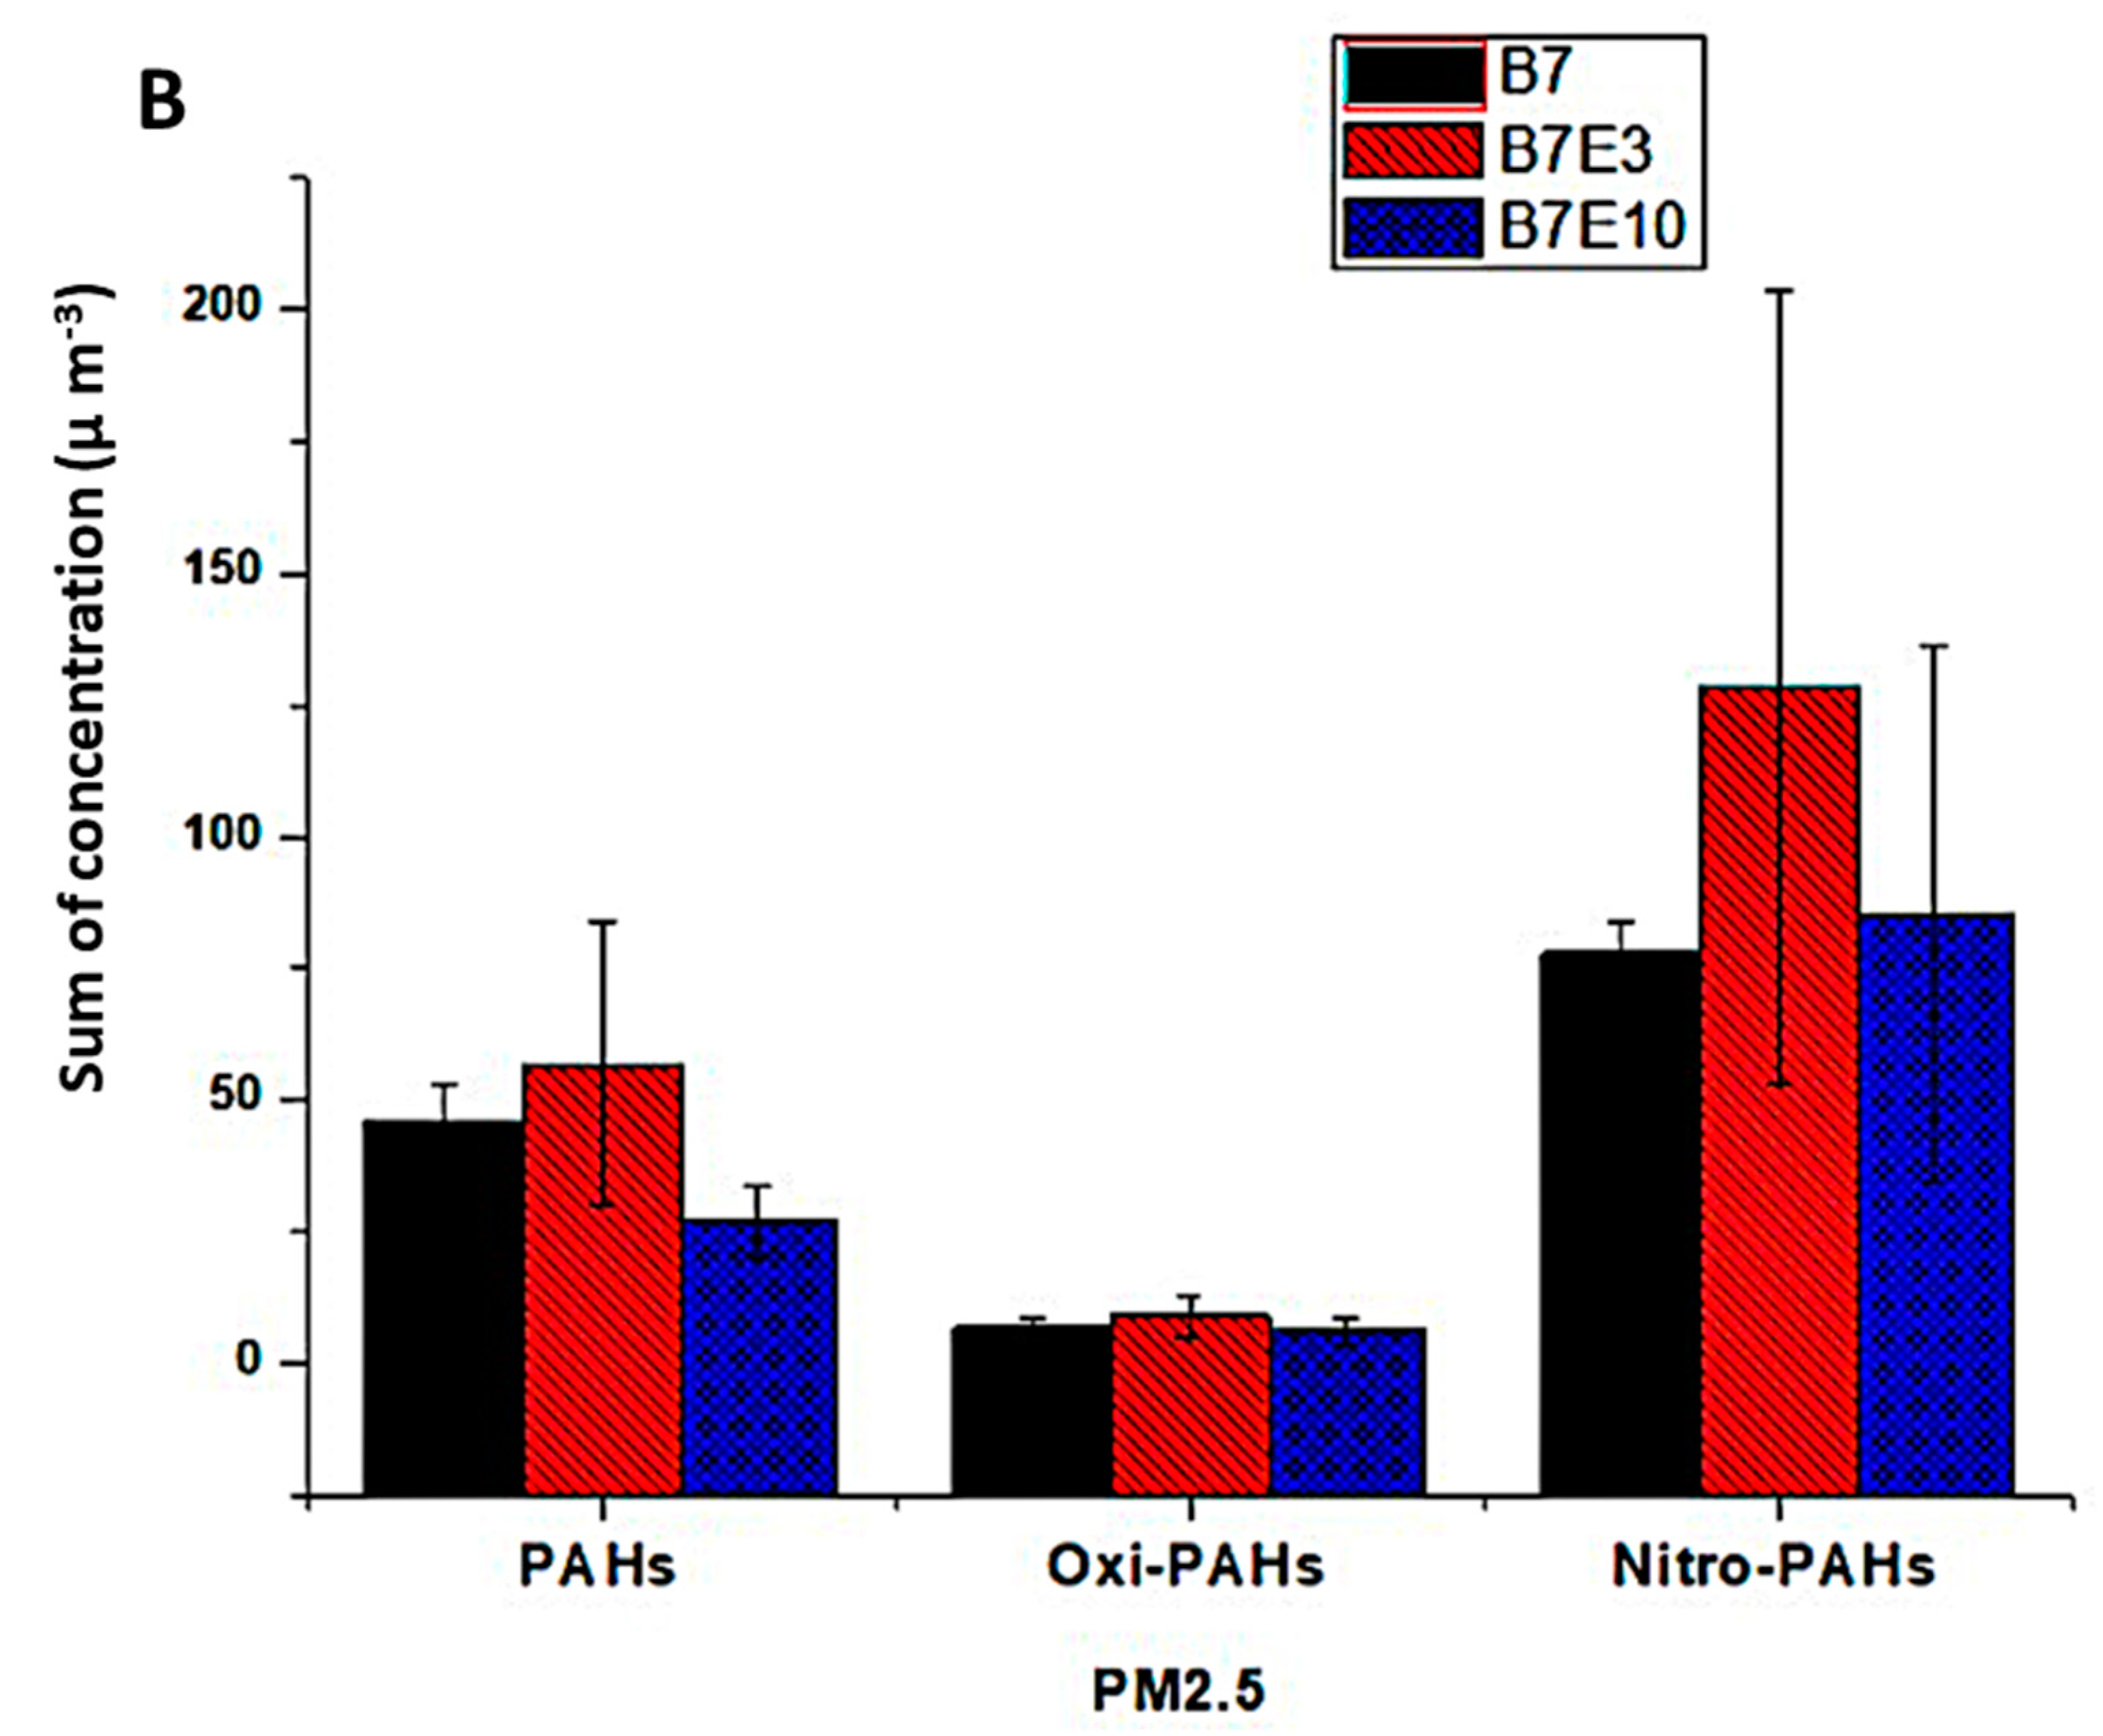
The total concentration for B7, B7E3, and B7E10 blends in PM1,0 was: ∑PAH (22.6, 23.9, 30.5 µg m−3), ∑nitro-PAH (42.1, 50.4, 134.6 µg m−3), and ∑oxy-PAH (3.3, 4.3, 5.3 µg m−3) (Figure 4a). PM2.5 was found in the total concentration from ∑PAH (45.9, 56.7, 26.8 µg m−3), ∑nitro-PAH (77.8, 128.4, 85.4 µg m−3), and ∑oxy-PAH (6.9, 8.8, 6.0 µg m−3) (Figure 4b). B7E10 blending showed a smaller total concentration for PAHs, nitro-PAHs, and quinones associated with PM2.5 particles compared to PM1.0.
Biodiesel and alcohol are two of the most common types of alternative fuels used in diesel engines; however, their effects on the formation of PAHs, mainly nitro-PAHs and quinone derivatives, are not well known today. As far as it is known, our study has been the first to find PAHs and their nitro-PAHs and quinone derivatives in fine particles, such as PM1.0 and PM2.5, emitted from a diesel engine fueled with blends such as B7, B7E3, and B7E10, which brings more concern directly in relation to health-related outcomes than other studies that have considered only larger fractions of particulate matter. However, it is not so simple to compare these results in the literature since different models of engines, fuels, fuel blends, and working conditions have been used.

3.4. Emission Factors for PAH, Nitro-PAH, and Quinones in PM1.0 and PM2.5

From the PAH, nitro-PAH, and quinones were considered as diesel and biodiesel emission markers [24,37,68]; the EF for the major compounds was calculated and quantified in PM1.0 and PM2.5 samples: pyrene (PYR), fluoranthrene (FLT), phenanthrene (PHEN), naphthalene (NAPH), chrysene (CHRYS), nitrofluorene (2N-FLU), 2-nitrophenanthrene (2N-PHEN), 2-nitrobiphenyl (2-NBP), and 9,10-anthraquinones (9,10-AQ). The individual values and total EF of PAH, nitro-PAH, and quinones calculated for B7 with the addition of 3% and 10% anhydrous ethanol are reported in Table 5 for (a) PM1.0 and (b) PM2.5.
The results obtained for B7 complement a study carried out by Guarieiro et al. [68] with the use of B5, showing the impact of emissions from the use of fuels with a higher oxygen content added to B5 (commercial fuel). Another contribution was made by Ying et al. [69] who suggested that fuel reformulation for diesel engines, involving the addition of oxygen to the fuel, could reduce the emission of PAH into the atmosphere. However, the reduction in sulfur content and the reduction in the addition of aromatic compounds are also technological factors that can influence the emission of PAHs into the atmosphere.
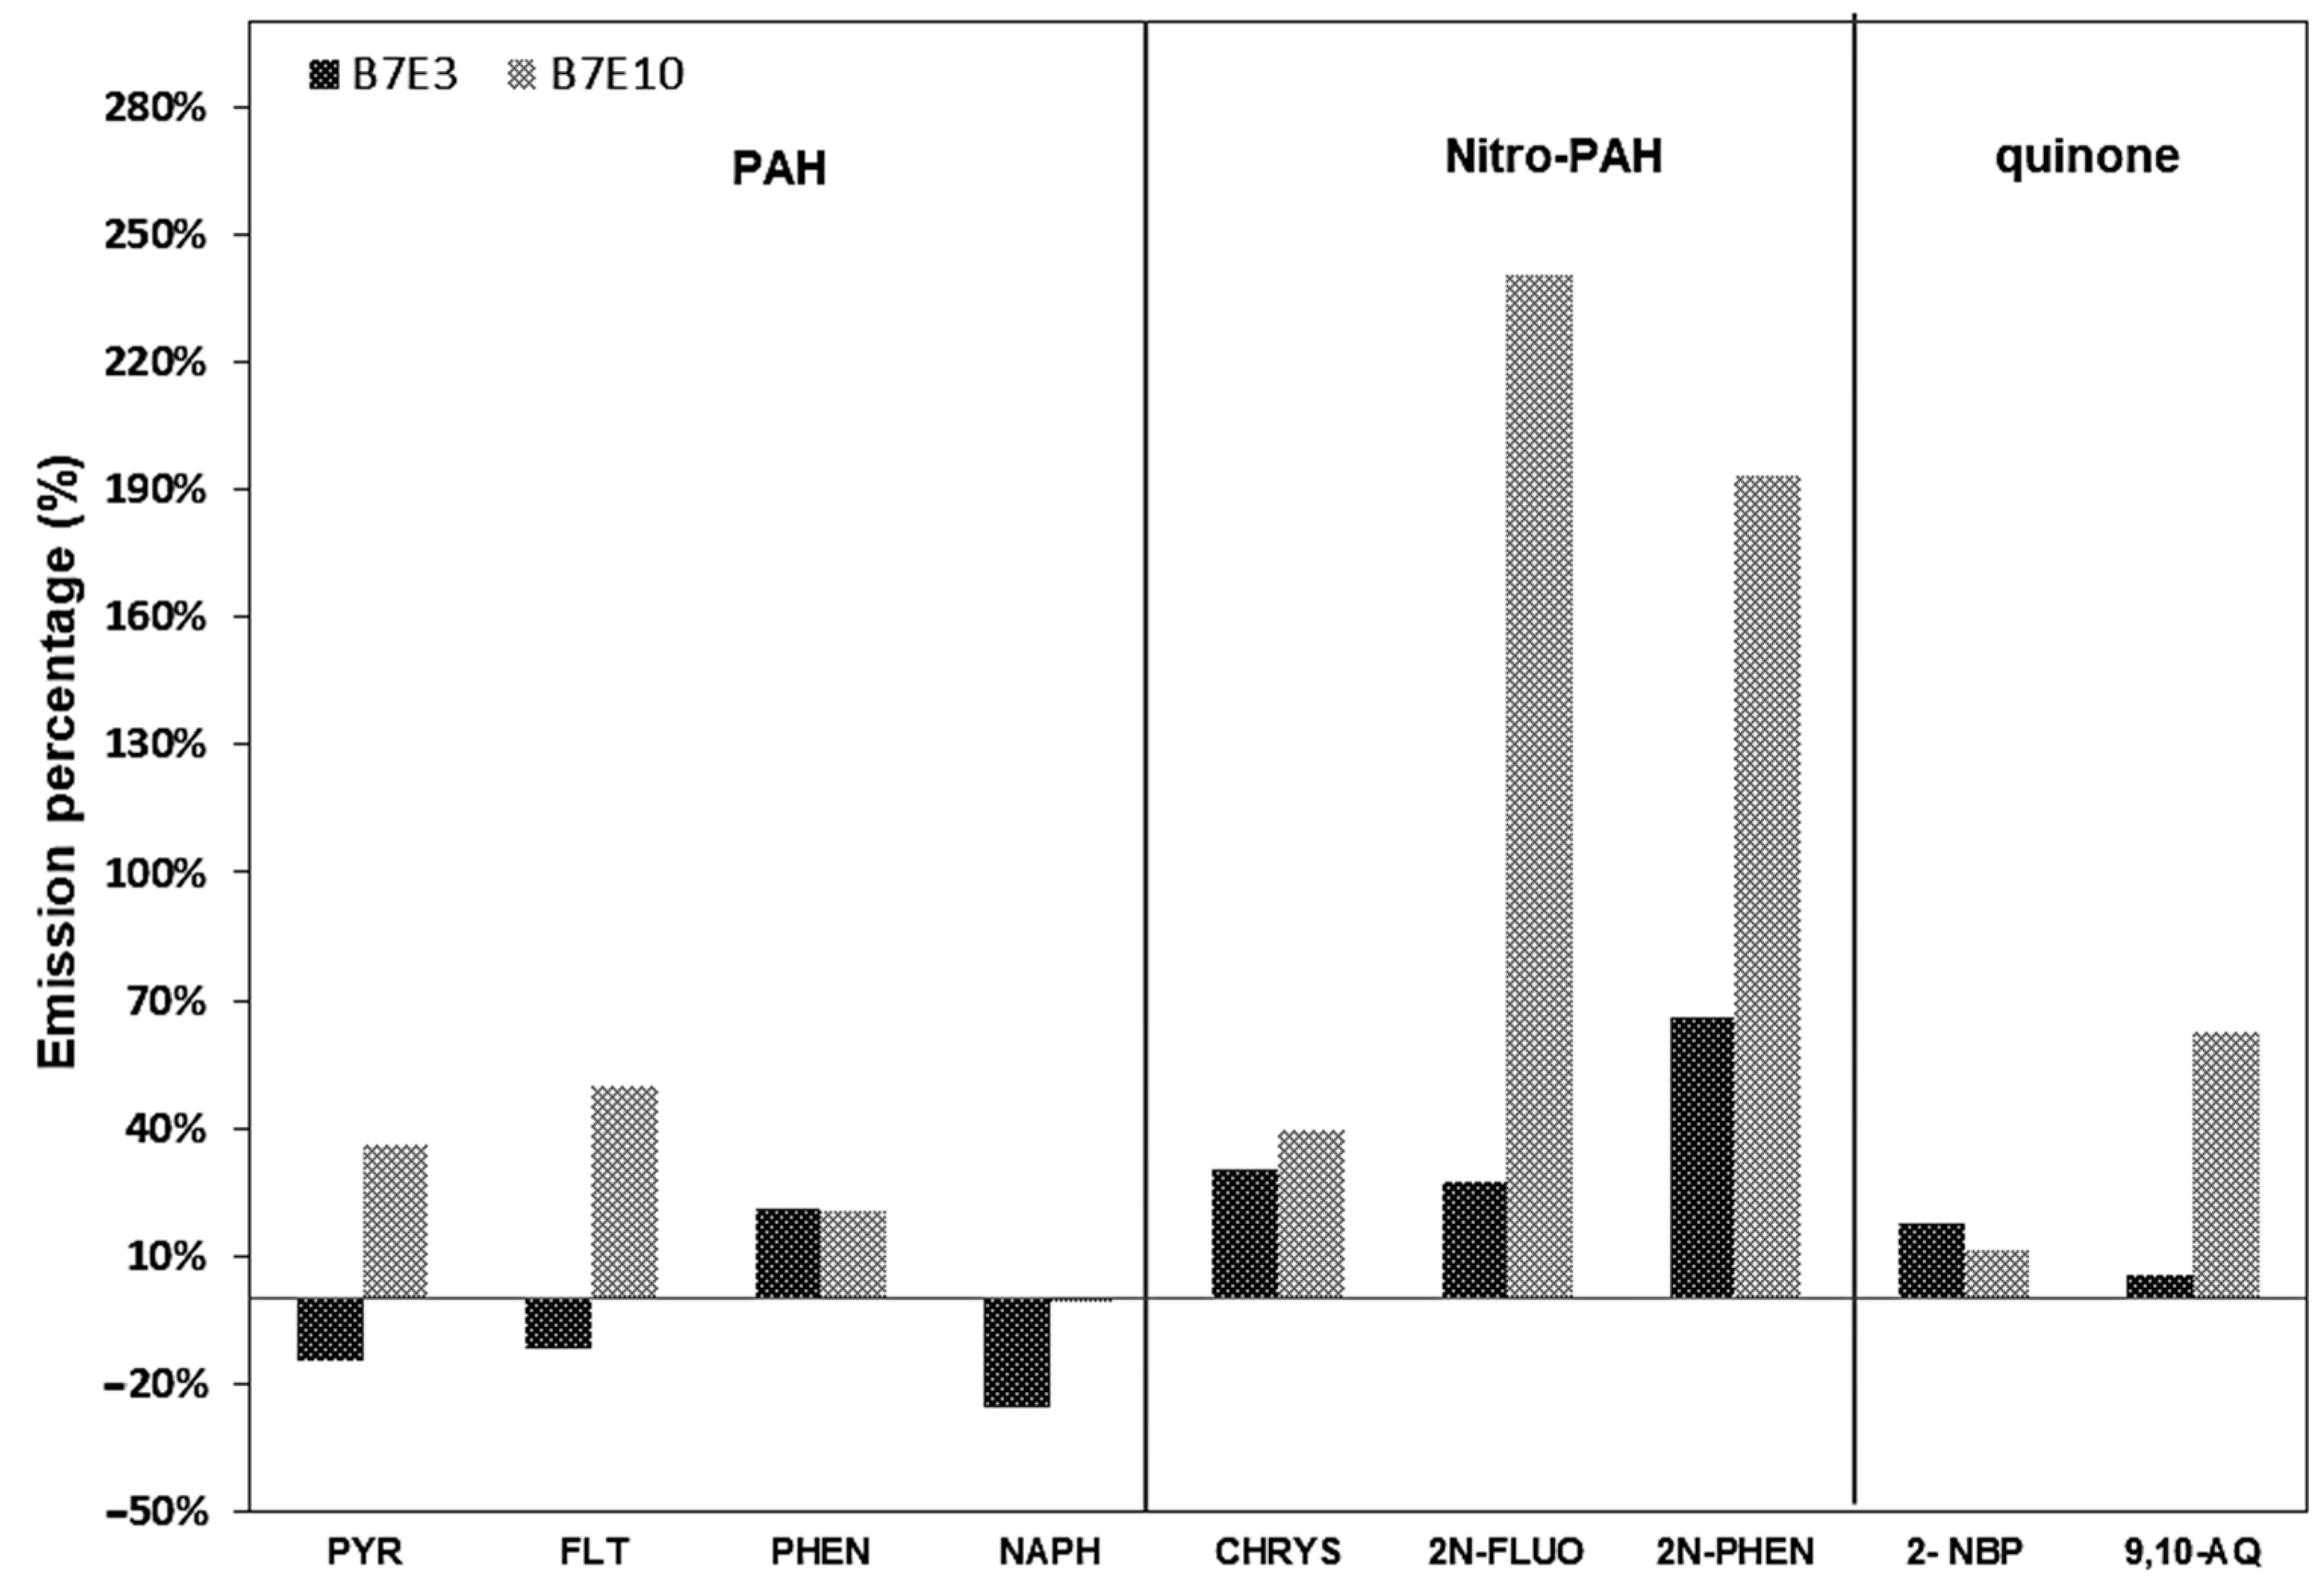
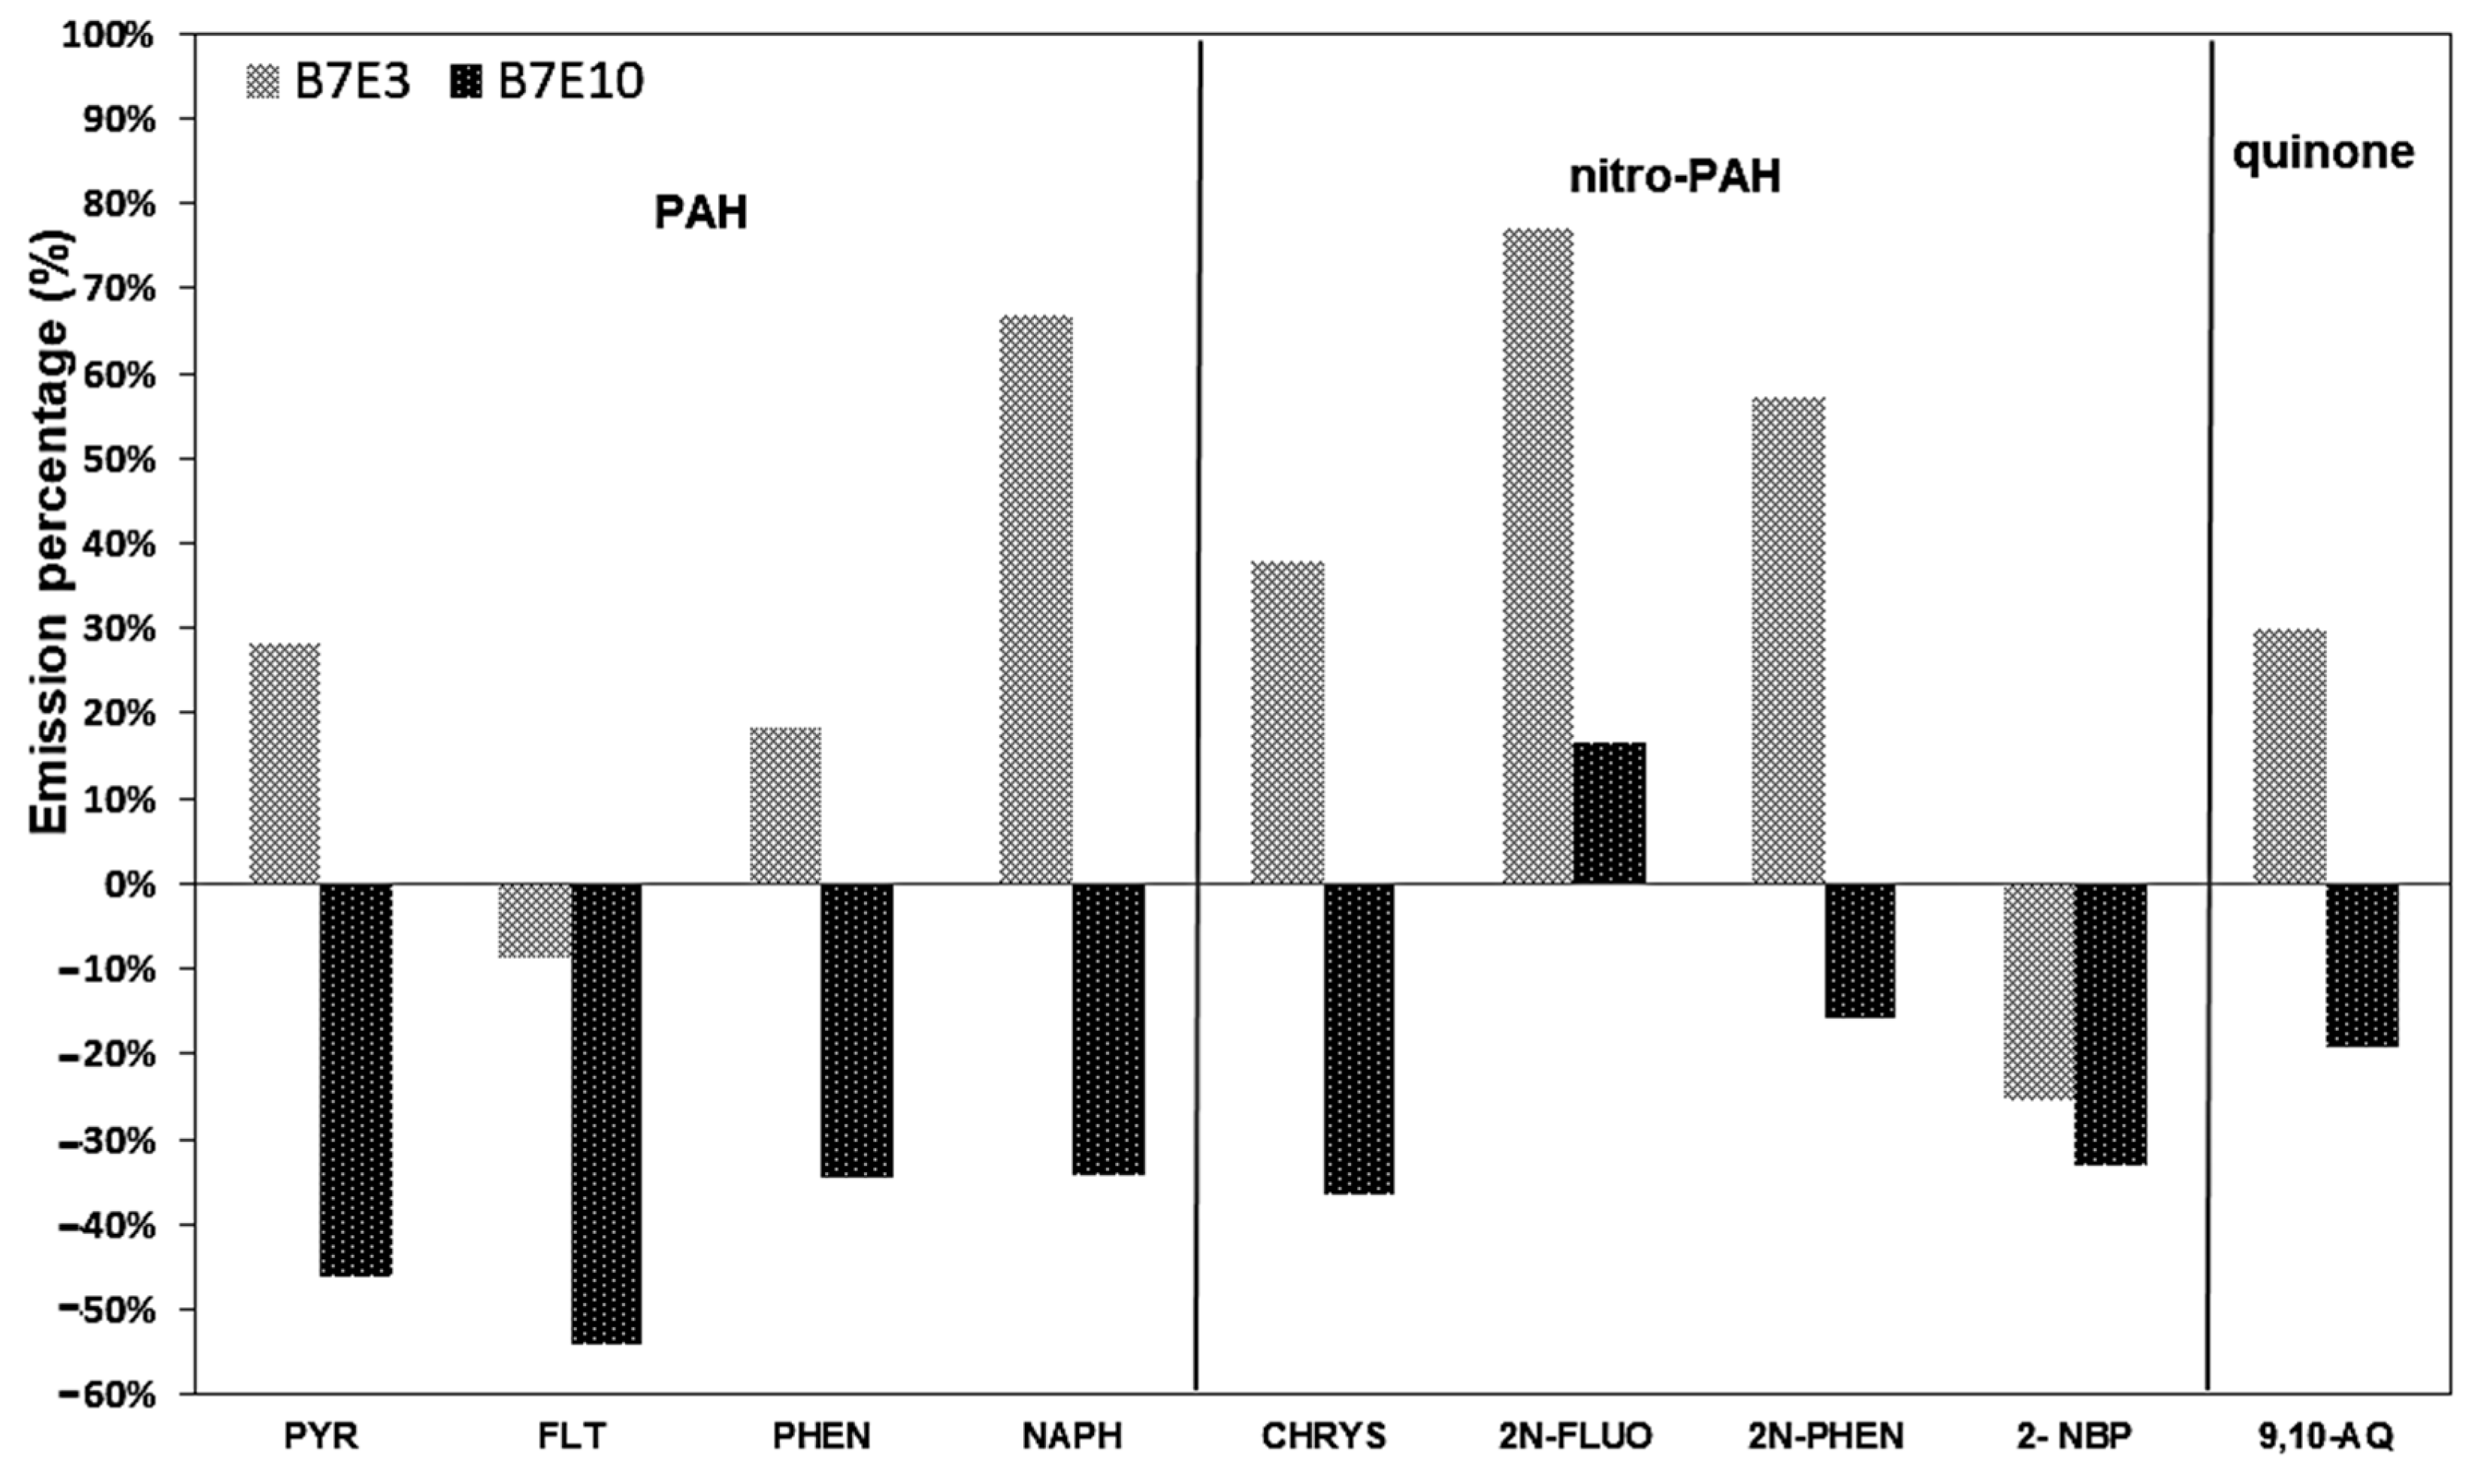
The variation in the percentage for the individual EF of PAH, nitro-PAH, and quinones in relation to the values calculated as a function of B7 can be illustrated in Figure 5 and Figure 6 for PM1.0 and PM2.5, respectively. In PM1.0, by comparing the total values of individual EF for mixtures B7E3 and B7E10 in relation to B7 (Figure 5), there was a significant increase in the total means of PAH, nitro-PAH, and quinones, which was, respectively 145%, 445%, and 62% for the B7E10 blend. On the other hand, in the values of individual EFs for mixtures B7E3 and B7E10 (Figure 6), there was a significant reduction in the total means of EFs for PAH, nitro-PAH, and quinones which were 206%, 32%, and 19%, respectively for mixing B7 in PM2.5.
In general, the addition of 10% anhydrous ethanol in the B7 mixture showed better reduction values for the EF of PAH, nitro-PAH, and quinones for PM2.5 when compared to values obtained for PM1.0. The addition of 3% anhydrous ethanol in the B7 mixture showed a significant increase in the total EF values of PAH, nitro-PAH, and quinones for PM2.5 when compared to PM1.0. According to Keyte et al. [37], and Lee et al. [70] it was reported that blending diesel fuels, biodiesels, and alcohols could reduce emissions from total-PAHs and diesel engines. A study [71] suggested that fuel-rich combustion conditions increased PAH formation during engine operations. Therefore, an adequate supply of oxygen allowed for complete combustion and reduced the formation and emission of pollutants.
Although there is a study on diesel-biodiesel-ethanol blends, what is missing in the literature is a depth of understanding surrounding the impacts of biodiesel alcohol mixtures, including the effects on PAH emissions. Generally, a neat diesel fuel containing a lower fraction of aromatic compounds will produce a smaller mass of PAH than a higher aromatic content fuel [71]. Blending biodiesel has shown contradicting effects on the formation of PAHs in diesel engines once biodiesel fuels derived from rapeseed oil, palm oil, animal fat, and soy oil have been shown to reduce PAH production in diesel blends [50,72,73] methyl esters derived from used fry oil and olive oil may increase PAHs compared to diesel, as would coconut oil [50].
Thus far, only a few studies have specifically explored the formation of PAHs in diesel engines operating with mixtures of biodiesel and alcohol. In two studies by Zhang et al. [74,75], increases and decreases in both PAHs and BaPeq were reported depending on the engine load and alcohol content in the mix. Overall, the results indicate that diesel produces more PAHs than biodiesel because PAHs form due to the PAH content in fuel structures. In addition, the results show that a 10% addition of alcohol to biodiesel decreased PAHs, while a 20% and 40% addition of alcohol to biodiesel started increasing PAHs. This is proof of the reality that the combustion process affects PAH production even if primary fuels are free of PAHs in their fuel structures [21].
In the current study, Yilmaz et al. [30] examined biodiesel blends with a content of 5%, 20%, and 35% by vol. of alcohol and the effects that these fuels have on PAH formation and emissions compared to straight diesel fuel in a diesel engine operating at a constant speed and under varying engine loads. Overall, adding 5% alcohol to biodiesel decreased the total PAH emissions. However, except for 20% propanol, adding 20% and 35% alcohol to biodiesel increased the total PAH emissions compared to neat biodiesel. Similar to the results of our study, the lower alcohol content decreased the emission of PAHs, while a higher alcohol content generated an increase in PAH emissions.
In the current literature, there are no studies that have examined the effects of diesel-biodiesel-ethanol blends on the emissions of compounds such as PAHs, nitro-PAHs, and Quinones. In this work, the results showed that diesel-biodiesel-ethanol fuel blends are alternatives to the use of diesel engines, and this can reduce the EF of PAHs (pyrene, fluoranthene, phenanthrene, naphthalene, and chrysene), nitro-PAH (2-nitrofluorene, 2-nitrophenanthrene, and 2-nitrobiphenyl) and quinone (9,10-anthraquinone) in PM2.5, which is the particle size currently used to assess pollution rates, according to the World Health Organization (WHO).

3.5. Risk Assessment Based on Incremental Lifetime Cancer Risk

In this study, the risk assessment was evaluated considering the carcinogenicity of the PAHs based on the benzo[a]pyrene equivalency detected in the PM1.0 and PM2.5 samples. The risk assessment data relating to inhalation, daily exposure, and incremental lifetime cancer risk for PM1.0 and PM2.5 are summarized in Table 6. For both PM1.0 and PM2.5 samples, it was observed that the blend B7E3 exhibited the highest values for DIL and ILCR, considering all target populations (adults, adolescents, children, and infants). The DIL values ranged from 992 to 3195 ng person−1 day−1, 12,457 to 40,119 ng person−1 day−1, and 1351 to 4352 ng person−1 day−1 for the blends B7, B7E3, and B7E10, respectively. Regarding PM2.5 samples, the DIL values ranged from 1767 to 5692 ng person−1 day−1, 2960 to 4054 ng person−1 day−1, and 1259 to 4054 ng person−1 day−1, for these same blends, respectively. Considering only the carcinogenic potential based on benzo[a]pyrene equivalency, it was observed that in both PM1.0 and PM2.5 samples, the ILCR values ranged from 8.30 × 10⁻⁶ to 4.54 × 10⁻⁴. These values were, respectively, about two or four orders of magnitude higher than those obtained from PM samples collected in an outdoor environment, such as urban and coastal areas [45]. However, it should be kept in mind that the samples in this study were collected in the direct exhaust of a diesel engine, and therefore, the concentrations were naturally higher than those from the real environment. Thus, these data are not directly comparable.

4. Conclusions

In the present work, the emissions of PM1.0, PM2.5 and PAHs, nitro-PAHs, and quinone concentrations associated with particulate matter were collected and evaluated in a diesel cycle engine using B7E3 and B7E10 fuel blends. The addition of anhydrous ethanol to B7 fuel resulted in a slight increase in the fuel burned, which was 0.2% for B7E3 and 4.9% for B7E10. However, the addition of anhydrous ethanol to B7 fuel reduced EF by approximately 31% for B7E3 and increased it by approximately 23% for B7E10. PM2.5 showed an increase in EF of approximately 13% for B7E3 and 35% for B7E10.
The total values of the individual PM1.0 EF for B7E3 and B7E10 blends in relation to B7 significantly increased the total averages of PAH, nitro-PAH, and quinones. On the other hand, the individual EF for both the B7E3 and B7E10 blends in relation to B7 fuel showed a significant reduction in the total means of EF of PAH, nitro-PAH, and quinones which were 206%, 32%, and 19%, respectively for the B7E10 mixture in MP2.5. When 10% anhydrous ethanol was added to the B7 mixture, the individual EF values of PAH, nitro-PAH and quinones showed more significant reductions in PM2.5 particles than for PM1.0 particles.
A risk assessment based on inhalation daily exposure and incremental lifetime cancer risk showed a higher risk for the inhalation exposure of adults, adolescents, and children for both PM1.0 and PM2.5 samples obtained from B7, B7E3, and B7E10 due to burning in a diesel engine. Similarly, the calculated ILCR for these same samples was higher than the values reported in the literature for samples collected in an outdoor environment.
The results of this research highlight the importance of studies that bring answers to the contributions of the use of biofuels in the emission of pollutants, where other biofuels can be studied for a diversification of the world energy matrix.

Author Contributions

Methodology, J.N.P. and M.M.N.; Validation, A.G.S., R.G.O.A. and J.B.D.A.; Formal analysis, M.M.N.; Investigation, J.N.P. and M.M.N.; Data curation, J.N.P. and R.G.O.A.; Supervision, L.L.N.G.; Funding acquisition, L.L.N.G. All authors have read and agreed to the published version of the manuscript.

Funding

This research was funded by FAPESB CB0033/2016.

Acknowledgments

The authors are grateful for scholarships and financial resources for research provided by the Fundação de Amparo à Pesquisa do Estado da Bahia (FAPESB, Salvador, Brazil) and the Conselho Nacional de Desenvolvimento Científico e Tecnológico (CNPq, Brasília, Brazil), INCT of Energy and Environment/CNPQ, PRH27.1 and ANP/FINEP. M.M.N. thanks the CNPq and SENAI-CIMATEC for his fellowship.

Conflicts of Interest

The authors declare no conflict of interest.

References

  1. Yesilyurt, M.K. A Detailed Investigation on the Performance, Combustion, and Exhaust Emission Characteristics of a Diesel Engine Running on the Blend of Diesel Fuel, Biodiesel and 1-Heptanol (C7 Alcohol) as a next-Generation Higher Alcohol. Fuel 2020, 275, 117893. [Google Scholar] [CrossRef]
  2. Shah, S.H.; Raja, I.A.; Rizwan, M.; Rashid, N.; Mahmood, Q.; Shah, F.A.; Pervez, A. Potential of microalgal biodiesel production and its sustainability perspectives in Pakistan. Renew. Sustain. Energy Rev. 2018, 81, 76–92. [Google Scholar] [CrossRef]
  3. Gwalwanshi, M.; Kumar, R.; Kumar Chauhan, M. A Review on Butanol Properties, Production and Its Application in Internal Combustion Engines. Mater. Today Proc. 2022, 62, 6573–6577. [Google Scholar] [CrossRef]
  4. Ağbulut, Ü.; Sarıdemir, S.; Albayrak, S. Experimental Investigation of Combustion, Performance and Emission Characteristics of a Diesel Engine Fuelled with Diesel–Biodiesel–Alcohol Blends. J. Braz. Soc. Mech. Sci. Eng. 2019, 41, 389. [Google Scholar] [CrossRef]
  5. Gebremariam, S.N.; Marchetti, J.M. Economics of Biodiesel Production: Review. Energy Convers. Manag. 2018, 168, 74–84. [Google Scholar] [CrossRef]
  6. Shahir, S.A.; Masjuki, H.H.; Kalam, M.A.; Imran, A.; Fattah, I.M.R.; Sanjid, A. Feasibility of Diesel–Biodiesel–Ethanol/Bioethanol Blend as Existing CI Engine Fuel: An Assessment of Properties, Material Compatibility, Safety and Combustion. Renew. Sustain. Energy Rev. 2014, 32, 379–395. [Google Scholar] [CrossRef]
  7. Sun, Z.-Y.; Li, G.-X. On Reliability and Flexibility of Sustainable Energy Application Route for Vehicles in China. Renew. Sustain. Energy Rev. 2015, 51, 830–846. [Google Scholar] [CrossRef]
  8. Guarieiro, L.L.N.; de Almeida Guerreiro, E.T.; dos Santos Amparo, K.K.; Manera, V.B.; Regis, A.C.D.; Santos, A.G.; Ferreira, V.P.; Leão, D.J.; Torres, E.A.; de Andrade, J.B. Assessment of the Use of Oxygenated Fuels on Emissions and Performance of a Diesel Engine. Microchem. J. 2014, 117, 94–99. [Google Scholar] [CrossRef]
  9. Guarieiro, L.L.N.; de Souza, A.F.; Torres, E.A.; de Andrade, J.B. Emission Profile of 18 Carbonyl Compounds, CO, CO2, and NO Emitted by a Diesel Engine Fuelled with Diesel and Ternary Blends Containing Diesel, Ethanol and Biodiesel or Vegetable Oils. Atmos. Environ. 2009, 43, 2754–2761. [Google Scholar] [CrossRef]
  10. Guarieiro, L.L.N.; Guerreiro, E.T.d.A.; Amparo, K.K.d.S.; Leão, D.J.; Torres, E.A.; Andrade, J.B. Estudo Do Perfil De Distribuição De Tamanho E Número De Partículas Emitidas Na Queima De Misturas De Diesel/Biodiesel/Etanol. Blucher Eng. Proc. 2014, 1, 387–393. [Google Scholar] [CrossRef] [Green Version]
  11. Jiaqiang, E.; Pham, M.; Zhao, D.; Deng, Y.; Le, D.; Zuo, W.; Zhu, H.; Liu, T.; Peng, Q.; Zhang, Z. Effect of Different Technologies on Combustion and Emissions of the Diesel Engine Fueled with Biodiesel: A Review. Renew. Sustain. Energy Rev. 2017, 80, 620–647. [Google Scholar] [CrossRef]
  12. Mirhashemi, F.S.; Sadrnia, H. NOX Emissions of Compression Ignition Engines Fueled with Various Biodiesel Blends: A Review. J. Energy Inst. 2020, 93, 129–151. [Google Scholar] [CrossRef]
  13. Palani, Y.; Devarajan, C.; Manickam, D.; Thanikodi, S. Performance and Emission Characteristics of Biodiesel-Blend in Diesel Engine: A Review. Environ. Eng. Res. 2020, 27, 200338. [Google Scholar] [CrossRef]
  14. Atmanli, A.; Yilmaz, N. An Experimental Assessment on Semi-Low Temperature Combustion Using Waste Oil Biodiesel/C3-C5 Alcohol Blends in a Diesel Engine. Fuel 2020, 260, 116357. [Google Scholar] [CrossRef]
  15. Bilgili, L. Comparative Assessment of Alternative Marine Fuels in Life Cycle Perspective. Renew. Sustain. Energy Rev. 2021, 144, 110985. [Google Scholar] [CrossRef]
  16. Yusuf, A.A.; Yusuf, D.A.; Jie, Z.; Bello, T.Y.; Tambaya, M.; Abdullahi, B.; Muhammed-Dabo, I.A.; Yahuza, I.; Dandakouta, H. Influence of Waste Oil-Biodiesel on Toxic Pollutants from Marine Engine Coupled with Emission Reduction Measures at Various Loads. Atmos. Pollut. Res. 2022, 13, 101258. [Google Scholar] [CrossRef]
  17. Devarajan, Y.; Munuswamy, D.B.; Nalla, B.T.; Choubey, G.; Mishra, R.; Vellaiyan, S. Experimental Analysis of Sterculia Foetida Biodiesel and Butanol Blends as a Renewable and Eco-Friendly Fuel. Ind. Crops. Prod. 2022, 178, 114612. [Google Scholar] [CrossRef]
  18. Mujtaba, M.A.; Kalam, M.A.; Masjuki, H.H.; Gul, M.; Soudagar, M.E.M.; Ong, H.C.; Ahmed, W.; Atabani, A.E.; Razzaq, L.; Yusoff, M. Comparative Study of Nanoparticles and Alcoholic Fuel Additives-Biodiesel-Diesel Blend for Performance and Emission Improvements. Fuel 2020, 279, 118434. [Google Scholar] [CrossRef]
  19. Erdiwansyah; Mamat, R.; Sani, M.S.M.; Sudhakar, K.; Kadarohman, A.; Sardjono, R.E. An Overview of Higher Alcohol and Biodiesel as Alternative Fuels in Engines. Energy Rep. 2019, 5, 467–479. [Google Scholar] [CrossRef]
  20. Zaharin, M.S.M.; Abdullah, N.R.; Najafi, G.; Sharudin, H.; Yusaf, T. Effects of Physicochemical Properties of Biodiesel Fuel Blends with Alcohol on Diesel Engine Performance and Exhaust Emissions: A Review. Renew. Sustain. Energy Rev. 2017, 79, 475–493. [Google Scholar] [CrossRef]
  21. Yilmaz, N.; Davis, S.M. Polycyclic Aromatic Hydrocarbon (PAH) Formation in a Diesel Engine Fueled with Diesel, Biodiesel and Biodiesel/n-Butanol Blends. Fuel 2016, 181, 729–740. [Google Scholar] [CrossRef]
  22. de Oliveira, A.; de Morais, A.M.; Valente, O.S.; Sodré, J.R. Combustion Characteristics, Performance and Emissions from a Diesel Power Generator Fuelled by B7-Ethanol Blends. Fuel Process. Technol. 2015, 139, 67–72. [Google Scholar] [CrossRef]
  23. Shahir, S.A.; Masjuki, H.H.; Kalam, M.A.; Imran, A.; Ashraful, A.M. Performance and Emission Assessment of Diesel–Biodiesel–Ethanol/Bioethanol Blend as a Fuel in Diesel Engines: A Review. Renew. Sustain. Energy Rev. 2015, 48, 62–78. [Google Scholar] [CrossRef]
  24. Tsai, J.-H.; Chen, S.-J.; Huang, K.-L.; Lin, W.-Y.; Lee, W.-J.; Lin, C.-C.; Hsieh, L.-T.; Chiu, J.-Y.; Kuo, W.-C. Emissions from a Generator Fueled by Blends of Diesel, Biodiesel, Acetone, and Isopropyl Alcohol: Analyses of Emitted PM, Particulate Carbon, and PAHs. Sci. Total Environ. 2014, 466–467, 195–202. [Google Scholar] [CrossRef]
  25. Tutak, W. Bioethanol E85 as a Fuel for Dual Fuel Diesel Engine. Energy Convers. Manag. 2014, 86, 39–48. [Google Scholar] [CrossRef]
  26. Yilmaz, N.; Vigil, F.M.; Burl Donaldson, A.; Darabseh, T. Investigation of CI Engine Emissions in Biodiesel–Ethanol–Diesel Blends as a Function of Ethanol Concentration. Fuel 2014, 115, 790–793. [Google Scholar] [CrossRef]
  27. How, H.G.; Masjuki, H.H.; Kalam, M.A.; Teoh, Y.H. Engine Performance, Emission and Combustion Characteristics of a Common-Rail Diesel Engine Fuelled with Bioethanol as a Fuel Additive in Coconut Oil Biodiesel Blends. Energy Procedia 2014, 61, 1655–1659. [Google Scholar] [CrossRef] [Green Version]
  28. Lapuerta, M.; García-Contreras, R.; Campos-Fernández, J.; Dorado, M.P. Stability, Lubricity, Viscosity, and Cold-Flow Properties of Alcohol−Diesel Blends. Energy Fuels 2010, 24, 4497–4502. [Google Scholar] [CrossRef]
  29. Yilmaz, N.; Davis, S.M. Formation of Polycyclic Aromatic Hydrocarbons and Regulated Emissions from Biodiesel and N-Butanol Blends Containing Water. J. Hazard. Mater. 2022, 437, 129360. [Google Scholar] [CrossRef]
  30. Yilmaz, N.; Vigil, F.M.; Donaldson, B. Fuel Effects on PAH Formation, Toxicity and Regulated Pollutants: Detailed Comparison of Biodiesel Blends with Propanol, Butanol and Pentanol. Sci. Total Environ. 2022, 849, 157839. [Google Scholar] [CrossRef]
  31. Nani Guarieiro, L.L.; Nani Guarieiro, A.L. Vehicle Emissions: What Will Change with Use of Biofuel? In Biofuels—Economy, Environment and Sustainability; InTech: London, UK, 2013. [Google Scholar]
  32. Guarieiro, L.L.N.; Vasconcellos, P.C.; Solci, M.C. Air Pollutants from the Burning of Fossil Fuels and Biofuels: A Brief Review. Rev. Virtual Química 2011, 3, 434–445. [Google Scholar] [CrossRef]
  33. Vinikoor-Imler, L.C.; Davis, J.A.; Luben, T.J. An Ecologic Analysis of County-Level PM2.5 Concentrations and Lung Cancer Incidence and Mortality. Int. J. Environ. Res. Public Health 2011, 8, 1865–1871. [Google Scholar] [CrossRef] [Green Version]
  34. Kumar, P.; Robins, A.; Vardoulakis, S.; Britter, R. A Review of the Characteristics of Nanoparticles in the Urban Atmosphere and the Prospects for Developing Regulatory Controls. Atmos. Environ. 2010, 44, 5035–5052. [Google Scholar] [CrossRef] [Green Version]
  35. Wang, Y.; Liu, H.; Lee, C.-F.F. Particulate Matter Emission Characteristics of Diesel Engines with Biodiesel or Biodiesel Blending: A Review. Renew. Sustain. Energy Rev. 2016, 64, 569–581. [Google Scholar] [CrossRef]
  36. Alves, C. Aerossóis Atmosféricos: Perspectiva Histórica, Fontes, Processos Químicos de Formação e Composição Orgânica. Quim Nova 2005, 28, 859–870. [Google Scholar] [CrossRef]
  37. Keyte, I.J.; Albinet, A.; Harrison, R.M. On-Road Traffic Emissions of Polycyclic Aromatic Hydrocarbons and Their Oxy- and Nitro- Derivative Compounds Measured in Road Tunnel Environments. Sci. Total Environ. 2016, 566–567, 1131–1142. [Google Scholar] [CrossRef] [Green Version]
  38. Kooter, I.M.; van Vugt, M.A.T.M.; Jedynska, A.D.; Tromp, P.C.; Houtzager, M.M.G.; Verbeek, R.P.; Kadijk, G.; Mulderij, M.; Krul, C.A.M. Toxicological Characterization of Diesel Engine Emissions Using Biodiesel and a Closed Soot Filter. Atmos. Environ. 2011, 45, 1574–1580. [Google Scholar] [CrossRef]
  39. Li, Q.; Wyatt, A.; Kamens, R.M. Oxidant Generation and Toxicity Enhancement of Aged-Diesel Exhaust. Atmos. Environ. 2009, 43, 1037–1042. [Google Scholar] [CrossRef]
  40. Ravindra, K.; Sokhi, R.; Vangrieken, R. Atmospheric Polycyclic Aromatic Hydrocarbons: Source Attribution, Emission Factors and Regulation. Atmos. Environ. 2008, 42, 2895–2921. [Google Scholar] [CrossRef] [Green Version]
  41. Jang, E.; Alam, M.S.; Harrison, R.M. Source Apportionment of Polycyclic Aromatic Hydrocarbons in Urban Air Using Positive Matrix Factorization and Spatial Distribution Analysis. Atmos. Environ. 2013, 79, 271–285. [Google Scholar] [CrossRef]
  42. Kim, K.H.; Choi, B.; Park, S.; Kim, E.; Chiaramonti, D. Emission Characteristics of Compression Ignition (CI) Engine Using Diesel Blended with Hydrated Butanol. Fuel 2019, 257, 116037. [Google Scholar] [CrossRef]
  43. Santos, A.G.; Regis, A.C.D.; da Rocha, G.O.; Bezerra, M.D.A.; de Jesus, R.M.; de Andrade, J.B. A Simple, Comprehensive, and Miniaturized Solvent Extraction Method for Determination of Particulate-Phase Polycyclic Aromatic Compounds in Air. J. Chromatogr. A 2016, 1435, 6–17. [Google Scholar] [CrossRef]
  44. Pereira, G.M.; Teinilä, K.; Custódio, D.; Gomes Santos, A.; Xian, H.; Hillamo, R.; Alves, C.A.; Bittencourt de Andrade, J.; Olímpio da Rocha, G.; Kumar, P.; et al. Particulate Pollutants in the Brazilian City of São Paulo: 1-Year Investigation for the Chemical Composition and Source Apportionment. Atmos. Chem. Phys. 2017, 17, 11943–11969. [Google Scholar] [CrossRef] [Green Version]
  45. Santos, A.G.; da Rocha, G.O.; de Andrade, J.B. Occurrence of the Potent Mutagens 2- Nitrobenzanthrone and 3-Nitrobenzanthrone in Fine Airborne Particles. Sci. Rep. 2019, 9, 1–13. [Google Scholar] [CrossRef]
  46. Tse, H.; Leung, C.W.; Cheung, C.S. Investigation on the Combustion Characteristics and Particulate Emissions from a Diesel Engine Fueled with Diesel-Biodiesel-Ethanol Blends. Energy 2015, 83, 343–350. [Google Scholar] [CrossRef]
  47. Ghadikolaei, M.A.; Wei, L.; Cheung, C.S.; Yung, K.-F.; Ning, Z. Particulate Emission and Physical Properties of Particulate Matter Emitted from a Diesel Engine Fueled with Ternary Fuel (Diesel-Biodiesel-Ethanol) in Blended and Fumigation Modes. Fuel 2020, 263, 116665. [Google Scholar] [CrossRef]
  48. Yang, K.; Wei, L.; Cheung, C.S.; Tang, C.; Huang, Z. The Effect of Pentanol Addition on the Particulate Emission Characteristics of a Biodiesel Operated Diesel Engine. Fuel 2017, 209, 132–140. [Google Scholar] [CrossRef]
  49. Butler, A.D.; Sobotowski, R.A.; Hoffman, G.J.; Machiele, P. Influence of Fuel PM Index and Ethanol Content on Particulate Emissions from Light-Duty Gasoline Vehicles; SAE Mobilus: Warrendale, PA, USA, 2015. [Google Scholar] [CrossRef]
  50. He, C.; Ge, Y.; Tan, J.; You, K.; Han, X.; Wang, J. Characteristics of Polycyclic Aromatic Hydrocarbons Emissions of Diesel Engine Fueled with Biodiesel and Diesel. Fuel 2010, 89, 2040–2046. [Google Scholar] [CrossRef]
  51. Storey, J.M.E.; Barone, T.L.; Thomas, J.F.; Huff, S.P. Exhaust Particle Characterization for Lean and Stoichiometric DI Vehicles Operating on Ethanol-Gasoline Blends; SAE Mobilus: Warrendale, PA, USA, 2012. [Google Scholar] [CrossRef]
  52. Sakai, S.; Rothamer, D. Effect of Ethanol Blending on Particulate Formation from Premixed Combustion in Spark-Ignition Engines. Fuel 2017, 196, 154–168. [Google Scholar] [CrossRef]
  53. Price, P.; Twiney, B.; Stone, R.; Kar, K.; Walmsley, H. Particulate and Hydrocarbon Emissions from a Spray Guided Direct Injection Spark Ignition Engine with Oxygenate Fuel Blends. SAE Tech. Pap. 2007. [Google Scholar] [CrossRef] [Green Version]
  54. Lemaire, R.; Therssen, E.; Desgroux, P. Effect of Ethanol Addition in Gasoline and Gasoline–Surrogate on Soot Formation in Turbulent Spray Flames. Fuel 2010, 89, 3952–3959. [Google Scholar] [CrossRef]
  55. Golea, D.; Rezgui, Y.; Guemini, M.; Hamdane, S. Reduction of PAH and Soot Precursors in Benzene Flames by Addition of Ethanol. J. Phys. Chem. A 2012, 116, 3625–3642. [Google Scholar] [CrossRef]
  56. Park, S.; Shao, Y.; Liu, J.; Wang, Y. Oxygen Electrocatalysts for Water Electrolyzers and Reversible Fuel Cells: Status and Perspective. Energy Environ. Sci. 2012, 5, 9331. [Google Scholar] [CrossRef]
  57. Kojima, Y.; Inazu, K.; Hisamatsu, Y.; Okochi, H.; Baba, T.; Nagoya, T. Influence of Secondary Formation on Atmospheric Occurrences of Oxygenated Polycyclic Aromatic Hydrocarbons in Airborne Particles. Atmos. Environ. 2010, 44, 2873–2880. [Google Scholar] [CrossRef]
  58. Ahmed, T.M.; Ahmed, B.; Aziz, B.K.; Bergvall, C.; Westerholm, R. Native and Oxygenated Polycyclic Aromatic Hydrocarbons in Ambient Air Particulate Matter from the City of Sulaimaniyah in Iraq. Atmos. Environ. 2015, 116, 44–50. [Google Scholar] [CrossRef]
  59. Cochran, R.E.; Dongari, N.; Jeong, H.; Beránek, J.; Haddadi, S.; Shipp, J.; Kubátová, A. Determination of Polycyclic Aromatic Hydrocarbons and Their Oxy-, Nitro-, and Hydroxy-Oxidation Products. Anal. Chim. Acta 2012, 740, 93–103. [Google Scholar] [CrossRef]
  60. Lim, H.; Sadiktsis, I.; de Oliveira Galvão, M.F.; Westerholm, R.; Dreij, K. Polycyclic Aromatic Compounds in Particulate Matter and Indoor Dust at Preschools in Stockholm, Sweden: Occurrence, Sources and Genotoxic Potential in Vitro. Sci. Total Environ. 2021, 755, 142709. [Google Scholar] [CrossRef]
  61. Moussaoui, Y.; Balducci, C.; Cecinato, A.; Meklati, B.Y. Atmospheric Particulate Organic Matter at Urban and Forest Sites of Northern Algeria. Urban Clim. 2013, 4, 85–101. [Google Scholar] [CrossRef]
  62. Souza, K.F.; Carvalho, L.R.F.; Allen, A.G.; Cardoso, A.A. Diurnal and Nocturnal Measurements of PAH, Nitro-PAH, and Oxy-PAH Compounds in Atmospheric Particulate Matter of a Sugar Cane Burning Region. Atmos. Environ. 2014, 83, 193–201. [Google Scholar] [CrossRef]
  63. Enya, T.; Suzuki, H.; Watanabe, T.; Hirayama, T.; Hisamatsu, Y. 3-Nitrobenzanthrone, a Powerful Bacterial Mutagen and Suspected Human Carcinogen Found in Diesel Exhaust and Airborne Particulates. Environ. Sci. Technol. 1997, 31, 2772–2776. [Google Scholar] [CrossRef]
  64. Murahashi, T. Determination of Mutagenic 3-Nitrobenzanthrone in Diesel Exhaust Particulate Matter by Three-Dimensional High-Performance Liquid Chromatography. Analyst 2003, 128, 42–45. [Google Scholar] [CrossRef]
  65. Arlt, V.M. 3-Nitrobenzanthrone, a Potential Human Cancer Hazard in Diesel Exhaust and Urban Air Pollution: A Review of the Evidence. Mutagenesis 2005, 20, 399–410. [Google Scholar] [CrossRef]
  66. Phousongphouang, P.T.; Arey, J. Sources of the Atmospheric Contaminants, 2-Nitrobenzanthrone and 3-Nitrobenzanthrone. Atmos. Environ. 2003, 37, 3189–3199. [Google Scholar] [CrossRef]
  67. Bandowe, B.A.M.; Meusel, H. Nitrated Polycyclic Aromatic Hydrocarbons (Nitro-PAHs) in the Environment—A Review. Sci. Total Environ. 2017, 581–582, 237–257. [Google Scholar] [CrossRef]
  68. Guarieiro, A.L.N.; Santos, J.V.d.S.; Eiguren-Fernandez, A.; Torres, E.A.; da Rocha, G.O.; de Andrade, J.B. Redox Activity and PAH Content in Size-Classified Nanoparticles Emitted by a Diesel Engine Fuelled with Biodiesel and Diesel Blends. Fuel 2014, 116, 490–497. [Google Scholar] [CrossRef]
  69. Ying, W.; Longbao, Z.; Hewu, W. Diesel Emission Improvements by the Use of Oxygenated DME/Diesel Blend Fuels. Atmos. Environ. 2006, 40, 2313–2320. [Google Scholar] [CrossRef]
  70. Lee, W.-J.; Liu, Y.-C.; Mwangi, F.K.; Chen, W.-H.; Lin, S.-L.; Fukushima, Y.; Liao, C.-N.; Wang, L.-C. Assessment of Energy Performance and Air Pollutant Emissions in a Diesel Engine Generator Fueled with Water-Containing Ethanol–Biodiesel–Diesel Blend of Fuels. Energy 2011, 36, 5591–5599. [Google Scholar] [CrossRef]
  71. Yilmaz, N.; Donaldson, A. Evidence of PAH Production under Lean Combustion Conditions. Fuel 2007, 86, 2377–2382. [Google Scholar] [CrossRef]
  72. Karavalakis, G.; Boutsika, V.; Stournas, S.; Bakeas, E. Biodiesel Emissions Profile in Modern Diesel Vehicles. Part 2: Effect of Biodiesel Origin on Carbonyl, PAH, Nitro-PAH and Oxy-PAH Emissions. Sci. Total Environ. 2011, 409, 738–747. [Google Scholar] [CrossRef]
  73. Bakeas, E.B.; Karavalakis, G. Regulated, Carbonyl and Polycyclic Aromatic Hydrocarbon Emissions from a Light-Duty Vehicle Fueled with Diesel and Biodiesel Blends. Environ. Sci. Process. Impacts 2013, 15, 412–422. [Google Scholar] [CrossRef]
  74. Zhang, Z.-H.; Balasubramanian, R. Influence of Butanol Addition to Diesel–Biodiesel Blend on Engine Performance and Particulate Emissions of a Stationary Diesel Engine. Appl. Energy 2014, 119, 530–536. [Google Scholar] [CrossRef]
  75. Zhang, Z.-H.; Balasubramanian, R. Physicochemical and Toxicological Characteristics of Particulate Matter Emitted from a Non-Road Diesel Engine: Comparative Evaluation of Biodiesel-Diesel and Butanol-Diesel Blends. J. Hazard. Mater. 2014, 264, 395–402. [Google Scholar] [CrossRef]
Figure 1. Schematic layout of the engine test bed and sampling system for PM1.0 and PM2.5.
Atmosphere 14 00656 g001
Figure 2. Fuel consumption B7, B7E3 and B7E10.
Atmosphere 14 00656 g002
Figure 3. (a) PM1.0 emission factor for B7, B7E3 and B7E10 fuel blends; (b) PM2.5 emission factor for B7, B7E3 and B7E10 fuel blends.
Atmosphere 14 00656 g003
Figure 4. The total concentration of PAHs, quinones, and nitro-PAHs found in the particulate matter from B7, B7E3, and B7E10 blends. (A) PM1.0 and (B) PM2.5.
Atmosphere 14 00656 g004aAtmosphere 14 00656 g004b
Figure 5. Percentage variation of individual emission of PAH, nitro-PAH, and quinones when comparing B7E3 and B7E10 with B7 for PM1.0.
Atmosphere 14 00656 g005
Figure 6. Percentage variation of individual emission of PAH, nitro-PAH, and quinones when comparing B7E3 and B7E10 with B7 for PM2.5.
Atmosphere 14 00656 g006
Table 1. Specifications of the fuels used in the preparation of the mixtures.
CharacteristicsStandardLimits
S10 aBiodiesel bEthanol c
Specific mass at 20 °C (kg m−3)ASTM D4052815.0 and 850.0850.0 and 900.0791.5
Kinematic viscosity at 40 °C (mm2 s−1)ASTM D4452.0 and 4.53.0 and 6.0-
Water content, max. (mg kg−1)ASTM D6304--200
a ANP Resolution No. 50 of 12/23/2013; b ANP Resolution No. 45 of 8/25/2014; c ANP Resolution No. 19 of 04/15/2015.
Table 2. Main characteristics of the diesel engine (a) and of the dynamometer (b).
(a)
CharacteristicsDiesel Engine
Power (Stand-by—1500RPM—cv/kW/kVA)80/59/66
Total Displacement (L)3.87
Number of Cylinders4, online
Combustion System4-stroke, Direct Injection
CycleTurbo powered
Compression ratio16:1
CoolingLiquid
Operating Temperature (°C)77/95
(b)
CharacteristicsDynamometer
Product Categorypassive dynamometer
torque measurementload cell
Power (kW)20–500
Torque (Nm)25–2.000
Speed (rpm)8.000–17.000
Table 3. Concentrations of PAH, quinones, and nitro-PAH (µg m−3) in PM1.0 samples.
ClassCompoundB7B7E3B7E10
µg/m3
MeanSDMeanSDMeanSD
PAHNaphthalene2.6±1.02.0±0.82.7±0.8
Acenaphthylene0.4±0.1<0.6 **-<0.6 **-
Acenaphthene0.5±0.50.6±0.30.7±0.1
Fluorene0.5±0.50.6±0.20.6±0.1
Phenanthrene3.1±2.93.7±0.93.9±0.5
Anthracene0.3±0.40.4±0.20.3±0.1
Fluoranthene3.4±3.03.0±0.55.4±0.8
Pyrene9.4±8.08.0±1.313.4±2.0
Benzo(a)anthracene0.5±0.40.8±0.20.7±0.2
Chrysene1.3±1.21.7±0.21.9±0.4
Benzo(b)fluoranthene0.4±0.30.7±0.20.5±0.1
Benzo(k)fluoranthene0.2±0.20.2±0,10.3±0.0
Benzo(a)pyrene<0.2 **-1.3±0.3<0.2 **-
Perylene<0.6 **-<0.6 **-<0.6 **-
Indeno(1,2,3 c,d)pyrene<0.5 **-0.2±0.4<0.5 **-
Dibenzo(a,h)anthracene<0.8 **-0.3±0.4<0.8 **-
Benzo(ghi)perylene<0.5 **-0.3±0.5<0.5 **-
Coronene<0.5 **-0.10.00.10.0
Ʃ22.6±18.523.9±6.530.5±5.1
Oxy-PAsBenzoquinone<7 **-<7 **-<7 **-
1,2-Naphthoquinone0.6±0.61.0±0.21.0±0.1
1,4-Naphthoquinone0.5±0.40.7±0.20.7±0.1
9,10-Phenanthraquinone<5 **-<5 **-<5 **-
9,10-Anthraquinone1.7±1.61.8±0.72.9±0.7
Benzanthrone0.5±0.20.8±0.60.7±0.5
Ʃ3.3±2.84.3±1.75.3±2.4
Nitro- PAH1-Nitronaphthalene0.1±0.10.20.00.20.0
1-Methyl-4-nitronaphthalene0.2±0.20.2±0.10.2±0.2
2-Nitronaphthalene0.5±0.50.6±0.10.8±0.1
2-Nitrobiphenyl1.7±1.52.0±0.32.0±0.4
1-Methyl-5-nitronaphthalene0.5±0.50.8±0.41.2±0.4
1-Methyl-6-nitronaphthalene<55 **-<55 **-<55 **-
2-Methyl-4-nitronaphthalene<62 **-<62 **-<62 **-
3-Nitrobiphenyl0.6±0.50.60.00.9±0.2
4-Nitrobiphenyl0.5±0.40.4±0.30.9±0.1
5-Nitroacenaphthene<52 **-<52 **-<52 **-
2-Nitrofluorene33.1±28.742.2±15.9118.1±37.6
2-Nitrophenanthrene<53 **-<53 **-<53 **-
3-Nitrophenanthrene1.7±1.52.8±0.45.1±1.2
9-Nitrophenanthrene1.2±1.1<35 **-<35 **-
2-Nitroanthracene<33**-<33 **-<33 **-
9-Nitroanthracene1.3±1.2<15 **-<15 **-
2-Nitrofluoranthene<3 9**-<39 **-<39 **-
3-Nitrofluoranthene<36 **-<36 **-<36 **-
1-Nitropyrene<48 **-<48 **-<48 **-
2-Nitropyrene<27 **-<27 **-<27 **-
4-Nitropyrene<22 **-<22 **-<22 **-
7-Nitrobenz(a)anthracene<54 **-<54 **-<54 **-
6-Nitrochrysene<24 **-<24 **-5.2±1.4
3-Nitrobenzanthrone0.7±0.30.6±0.4<4 *-
6-Nitrobenzo[a]pyrene<28 **-<28 **-<28 **-
1-Nitrobenzo[e]pyrene<11 **-<3 *-<3 *-
3-Nitrobenzo[e]pyrene<7 *-<7 *-<7 *-
Ʃ42.1±26.550.4±17.9134.6±41.6
SD: standard deviation//Values of the * LD and ** LQ in ng/m3//Results expressed as mean ± standard deviation (n = 3)
Table 4. Concentrations of PAH, quinones, and nitro-PAH (µg m−3) in PM2.5 samples.
ClassCompoundsB7B7E3B7E10
µg/m3
MeanSDMeanSDMeanSD
PAHNaphthalene4.3±0.67.1±3.92.9±1.0
Acenaphthylene0.10.00.2±0.10.1±0.0
Acenaphthene1.3±0.41.8±0.60.8±0.1
Fluorene1.3±0.31.4±0.60.7±0.2
Phenanthrene10.1±2.79.3±3.74.9±0.7
Anthracene1.3±0.51.0±0.70.4±0.1
Fluoranthene6.7±0.97.9±3.24.6±2.0
Pyrene16.1±1.220.6±9.49.1±1.7
Benzo(a)anthracene0.9±0.11.4±0.90.6±0.2
Chrysene2.7±0.33.7±2.21.8±0.5
Benzo(b)fluoranthene0.5±0.11.2±0.80.4±0.1
Benzo(k)fluoranthene0.4±0.20.8±0.70.4±0.2
Benzo(a)pyrene<0.2 *-<0.2 *-<0.2 *-
Perylene<0.6 *-<0.6 *-<0.6 *-
Indeno(1,2,3 c,d)pyrene<0.5 *-<0.5 *-<0.5 *-
Dibenzo(a,h)anthracene<0.8 *-<0.8 *-<0.8 *-
Benzo(ghi)perylene<0.5 *-<0.5 *-<0.5 *-
Coronene0.2±0.10.3±0.10.10.0
Ʃ45.9±7.356.7±26.926.8±6.8
Oxy-PAHsBenzoquinone<7 *-<7 *-<7 *-
1,2-Naphthoquinone1.6±0.52.4±1.21.5±0.6
1,4-Naphthoquinone1.1±0.21.7±0.80.9±0.1
9,10-Phenanthraquinone<5 *-<5 *-<5 *-
9,10-Anthraquinone3.3±0.74.2±1.72.8±1.2
Benzanthrone0.9±0.50.5±0.20.8±0.7
Ʃ6.9±1.98.8±3.96.0±2.6
Nitro- PAH1-Nitronaphthalene0.3±0.10.4±0.10.3±0.1
1-Methyl-4-nitronaphthalene0.3±0.10.5±0.10.2±0.2
2-Nitronaphthalene1.1±0.41.3±0.20.6±0.5
2-Nitrobiphenyl3.8±0.72.8±0.82.7±0.9
1-Methyl-5-nitronaphthalene1.0±0.31.2±0.11.0±0.2
1-Methyl-6-nitronaphthalene<55 *-<55 *-<55 *-
2-Methyl-4-nitronaphthalene<62 *-<62 *-<62 *-
3-Nitrobiphenyl1.1±0.21.7±0.70.9±0.1
4-Nitrobiphenyl1.1±0.31.3±0.10.8±0.1
5-Nitroacenaphthene<52 *-<52 *-<52 *-
2-Nitrofluorene56.3±0.899.7±66.268.8±44.6
2-Nitrophenanthrene<53 *-<53 *-<53 *-
3-Nitrophenanthrene5.4±1.08.5±3.34.8±1.1
9-Nitrophenanthrene2.4±0.33.6±0.92.1±0.5
2-Nitroanthracene<33 *-<33 *-<33 *-
9-Nitroanthracene3.8±1.7<15 *-<15 *-
2-Nitrofluoranthene<39 *-<39 *-<39 *-
3-Nitrofluoranthene<36 *-<36 *-<36 *-
1-Nitropyrene<48 *-<48 *-<48 *-
2-Nitropyrene<27 *-<27 *-<27 *-
4-Nitropyrene<22 *-<22 *-<22 *-
7-Nitrobenz(a)anthracene<54 *-1.4±1.3<54 *-
6-Nitrochrysene<24 *-5.2±1.81.2±2.1
3-Nitrobenzanthrone1.2±0.40.8±0.01.6±0.0
6-Nitrobenzo[a]pyrene<28 *-<28 *-<28 *-
1-Nitrobenzo[e]pyrene<11 *-<11 *-<11 *-
3-Nitrobenzo[e]pyrene<22 *-<22 *-<22 *-
Ʃ77.8±6.3128.4±75.685.4±50.9
SD: standard deviation//Values of the * LQ in ng/m3//Results expressed as mean ± standard deviation (n = 3)
Table 5. Emission Factors of concentrations of PAHs, nitro-PAHs, and quinones in (a) PM1.0 and (b) PM2.5.
(a) PM1.0
B7B7E3B7E10
MeanSDMeanSDMeanSD
PAHsPYR0.69±0.590.59±0.100.94±0.14
FLT0.25±0.220.22±0.040.38±0.05
PHEN0.23±0.220.27±0.070.27±0.03
NAPH0.19±0.070.14±0.060.19±0.06
CHRYS0.10±0.090.13±0.020.14±0.02
Ʃ1.46±0.211.36±0.171.92±0.29
nitro-PAHs2N-FLUO2.44±2.123.11±1.178.30±2.65
2N-PHEN0.12±0.110.20±0.030.36±0.09
2-NBP0.13±0.110.15±0.020.14±0.03
Ʃ2.69±1.093.46±1.388.81±3.80
quinones9,10-AQ0.13±0.120.13±0.050.21±0.05
Ʃ0.13±0.120.13±0.050.21±0.05
(b) PM2.5
B7B7E3B7E10
MeanSDMeanSDMeanSD
PAHsPYR1.19±0.09)1.52(±0.69)0.64(±0.12)
FLT0.75±0.200.68±0.270.34±0.05
PHEN0.49±0.070.58±0.230.32±0.14
NAPH0.40±0.070.63±0.240.34±0.08
CHRYS0.20±0.020.28±0.160.13±0.04
Ʃ3.03±0.343.69±0.421.77±0.16
nitro PAH2N-FLUO4.15±0.067.34±4.874.84±3.13
2N-PHEN0.31±0.050.52±0.290.21±0.07
2-NBP0.28±0.050.21±0.060.19±0.06
Ʃ7.97±1.8212.04±3.297.13±2.19
quinones9,10-AQ0.24±0.050.31±0.130.19±0.09
Ʃ0.24±0.050.31±0.130.19±0.09
Table 6. Risk exposure by inhalation and incremental lifetime cancer risk for PM1.0 and PM2.5 emitted by engines fueled with diesel/ethanol blends. Data considering only the carcinogenic potential of the studied PAHs and PAH derivatives.
Considering Carcinogenicity Only *
Inhalation Daily Exposure (PM1.0) aIncremental Lifetime Cancer Risk (PM1.0)
CategoriesB7B7E3B7E10B7B7E3B7E10
Adults (>21 years)239330,04332596.71 × 10−58.42 × 10−49.14 × 10−5
Adolescent (11–16 years)319540,11943521.51 × 10−51.90 × 10−42.06 × 10−5
Children (1–11 years)194024,36426433.61 × 10−54.54 × 10−44.92 × 10−5
Infants (<1 year)99212,45713516.54 × 10−58.22 × 10−58.91 × 10−5
Inhalation daily exposure (PM2.5)Incremental lifetime cancer risk (PM2.5)
CategoriesB7B7E3B7E10B7B7E3B7E10
Adults (>21 years)4262713930361.19 × 10−42.00 × 10−48.51 × 10−5
Adolescent (11–16 years)5692953340542.70 × 10−54.52 × 10−51.92 × 10−5
Children (1–11 years)3457578924626.44 × 10−51.08 × 10−44.58 × 10−5
Infants (<1 year)1767296012591.17 × 10−51.95 × 10−58.30 × 10−6
a Values given in ng person-1 day-1. * TEF values equivalent to benzo(a)pyrene. Mutagenic equivalent factor (MEF) used to calculate the mutagenicity of 3-NBA was obtained from 1.8 dinitropyrene due to comparable mutagenicity [45].
Disclaimer/Publisher’s Note: The statements, opinions and data contained in all publications are solely those of the individual author(s) and contributor(s) and not of MDPI and/or the editor(s). MDPI and/or the editor(s) disclaim responsibility for any injury to people or property resulting from any ideas, methods, instructions or products referred to in the content.

