Article

Air Pollutants and Their Impact on Chronic Diseases—A Retrospective Study in Bucharest, Romania

1
Marius Nasta Institute of Pneumology, 050159 Bucharest, Romania
2
Faculty of Medicine, Carol Davila University of Medicine and Pharmacy, 050474 Bucharest, Romania
3
Airly Sp. z o.o., 31-545 Kraków, Poland
4
The Federation for a Clean Environment, 77962 Chiajna, Romania
5
The National Institute for Public Health, 050463 Bucharest, Romania
6
Faculty of International Business and Economics, The Bucharest University of Economic Studies, 010374 Bucharest, Romania
7
Faculty of Economic Cybernetics, Statistics and Informatics, The Bucharest University of Economic Studies, 010552 Bucharest, Romania
8
Faculty of Medicine, Victor Babes University of Medicine and Pharmacy, 300041 Timisoara, Romania
*
Authors to whom correspondence should be addressed.
Atmosphere 2023, 14(5), 867; https://doi.org/10.3390/atmos14050867
Submission received: 3 April 2023 / Revised: 2 May 2023 / Accepted: 6 May 2023 / Published: 12 May 2023
(This article belongs to the Special Issue Air Pollution Exposure and Health Impact Assessment)

Abstract

:
Air pollution is a serious problem in Romania, with the country ranking 13th among the most polluted countries in Europe in the 2021 World Air Quality Report. Despite the recognized impact of pollutants on health, there has been a lack of large-scale studies conducted in Romania. This study investigated the impact of air pollutants on patients with chronic respiratory, cardiovascular, cerebrovascular, or metabolic diseases in Bucharest and its metropolitan area from 20 August 2018 to 1 June 2022. The daily limit values for particulate matter PM10 and PM2.5 were exceeded every month, especially during the cold season, with a decrease during the COVID-19 pandemic restrictions. A significant statistical correlation was found between the monthly average values of PM2.5 and PM10 and hospitalizations for respiratory and cardiovascular diseases. A 10 µg/m3 increase in monthly average values resulted in a 40–60% increase in admissions for each type of pathology, translating to more than 2000 admissions for each pathology for the study period. This study highlights the urgent need for national and local measures to ensure a cleaner environment and enhance public health in Romania according to international regulations.

1. Introduction

Air quality is essential for all beings’ health and, ultimately, life. Several activities such as industry, energy production, heating, agriculture, and transport generate pollution. The European Union (EU) has a comprehensive clean air policy that is built on three pillars: ambient air standards, air pollutant emission reductions, and standards for emissions from key sources of pollution. In May 2021, the European Commission (EC) adopted the EU Action Plan: “Towards a Zero Pollution for Air, Water, and Soil” to create a secure, clean environment for European citizens [1].
Air pollution is defined as the presence of harmful chemicals or compounds in the air that are not normally found there and that can reduce the quality of life and have adverse effects on human health. There are many substances that are considered pollutants, such as carbon monoxide, particulate matter (PM), ground-level ozone, nitrogen oxides, sulfur oxides, and various other compounds [2].
A significant role in air pollution is attributed to PM, defined as solid or liquid particles suspended in air. PM arises as a secondary product of fossil fuel combustion. Inhalable particles are classified by size: PM2.5 (particles 2.5 microns or smaller) and PM10 (particles 10 microns or smaller) [3]. When inhaled, they can be stored in the bronchia and alveoli, impairing gas exchange through their cytotoxic and pro-inflammatory effects. Furthermore, they impede normal endothelial vascular function and increase the risk of various vascular diseases [4]. Understanding the relationship between PM2.5 and PM10 with the main chronic pathologies is the starting point for measures for better air quality. This fact is also confirmed by Manea et al. (2020) who believe that a healthier environment can prevent diseases caused by polluted air and that updating environmental policies makes it possible to improve the quality of the environment by reducing air pollution and, implicitly, the health of the population [5].
Several studies have already shown a significant association between chronic exposure to air pollutants and the prevalence of asthma and chronic obstructive pulmonary disease (COPD) [6,7]. Furthermore, several systematic reviews confirmed that short-term exposure increased exacerbations of asthma and COPD [8,9]. A recent review concluded that both long-term and short-term air pollution increased COVID-19 mortality rates and infectivity in several countries worldwide [10]. Clinical observations in major healthcare units in highly populated settings revealed an increase in cardio-respiratory events in the general population during the previous years, with significant seasonal variability.
Air pollution is a serious concern in Romania. The EC decided to refer Romania to the Court of Justice of the EU on 2 December 2021 on two grounds for non-compliance with EU rules: combating industrial pollution and lack of an air pollution control program [11].
The World Health Organization (WHO) guidelines released in September 2021 state that the annual limit values (ALVs) of PM2.5 should not exceed 5 µg/m3, while daily limit values (DLVs) should not exceed 15 µg/m3 more than 3–4 days per year. The thresholds for PM10 are 15 µg/m3 and 45 µg/m3, respectively [12,13].
In the 2021 World Air Quality Report by IQAir [14], Romania was ranked 66th out of 117 countries worldwide in terms of PM2.5 concentration, with an average of 15.3 µg/m3. Furthermore, Romania was ranked 13th out of 42 European countries with the highest levels of air pollution. In the report, Bucharest was ranked 58th out of 107 regional capital cities worldwide with an annual average PM2.5 concentration of 14.9 µg/m3.
According to the European Environment Agency’s Air Quality in Europe 2022 report [15], air quality has improved in the past decade, with decreasing emissions of air pollutants. However, PM2.5 remains a significant contributor to premature deaths. Although some EU countries, such as Bulgaria and Poland, still have high levels of PM2.5 concentrations, the region has seen improvements in air quality. Several research studies have been conducted in central and western Europe on assessing air pollution characteristics [16,17,18].
In contrast, limited information is available on air pollution in eastern Europe based on ground measurements [19]. In Bucharest [20,21], Iasi [22], and Ploiesti [23], studies mostly assessed the air pollution levels related to weather conditions and local climate.
In this regard, changes are only possible through studies that demonstrate the impact of air pollution on human health. In Romania, research analyzing the direct impact of air pollution on the number of hospitalizations for chronic diseases is still in its early stages. Therefore, the present study aims to be a starting point in determining the influence of pollution levels in cities on the quality of life by analyzing the number of hospitalizations for respiratory and cardiovascular diseases.
Globally, studies have shown that exposure to PM is a major problem for human health and quality of life, resulting in the hospitalization of individuals with respiratory or cardiovascular diseases [24,25,26,27,28,29]. Similarly, national studies in Romania have shown a direct association between increasing levels of air pollutants and the number of hospitalizations for respiratory and cardiovascular diseases in cities/regions [30,31,32,33].
The choice to conduct this analysis for the Bucharest–Ilfov region is not accidental, as the economic development of the area in recent years and population migration from other regions of the country to the capital have led to urban congestion, negatively affecting air quality. This is confirmed in other cities and urban areas, where PM is primarily produced by households and commerce, followed by mineral products and processing industries [33,34]. This fact confirms the seasonal characteristic of the level of suspended particle concentrations during the analyzed period, even if the sources of air pollution can be different [30,31,32]. On the other hand, the atypical period during which the study was conducted showed a decrease in air pollution levels (reduction in commercial activities, public and private transportation, etc.), a fact determined as a result of certain restrictions imposed during the COVID-19 pandemic [19,35,36].
The present study contributes to filling the limited information about the effects of air pollution on health in Romania, but further research on this topic is necessary to analyze the long-term effects of pollutants on health and quality of life. Because atmospheric pollutants do not exist in isolation but are part of a complicated network of elements that includes other environmental contaminants and exposures [26], the authors propose to include in future studies other factors that influence air quality and have a negative effect on human health in the analysis.
In addition to all these points, the concern for the development of ecological and sustainable food systems [37] and support for ecological entrepreneurship [38] offer the possibility of living in a less polluted environment, which facilitates the path towards a sustainable society in which the focus is on improving quality of life. In this sense, the current research aims to be an instrument for raising awareness among the population and government organizations regarding the negative influence of pollutants on the quality of life, which can lead to the creation of new environmental strategies and policies.

2. Materials and Methods

2.1. Study Design and Objectives

This observational, retrospective, and descriptive public health study aimed to reflect the impact of air pollutants on the condition of patients with chronic pathologies in Bucharest and its metropolitan area.
The objectives were as follows:
  • To compare the values of local pollution levels with limits recommended by the EU and WHO;
  • To analyze the correlation between air pollution and the condition of disease in patients with chronic respiratory, cardiovascular, cerebrovascular, or metabolic pathology in the same region.

2.2. Research Setting

Bucharest, the capital of Romania, is a densely populated city where the conversion of former forests to intensive industrial activity has led to substantial air pollution. Illegal activities, such as the burning of pastures during summers and the incineration of waste to extract metals, further degrade air quality. As of 1 January 2022, there were an estimated 3 million people living in the city’s metropolitan area. The study’s setting is a densely populated, highly industrialized region with multiple sources of air pollution, in addition to an already overburdened public healthcare system.

2.3. Data Sources

2.3.1. Air Quality Data

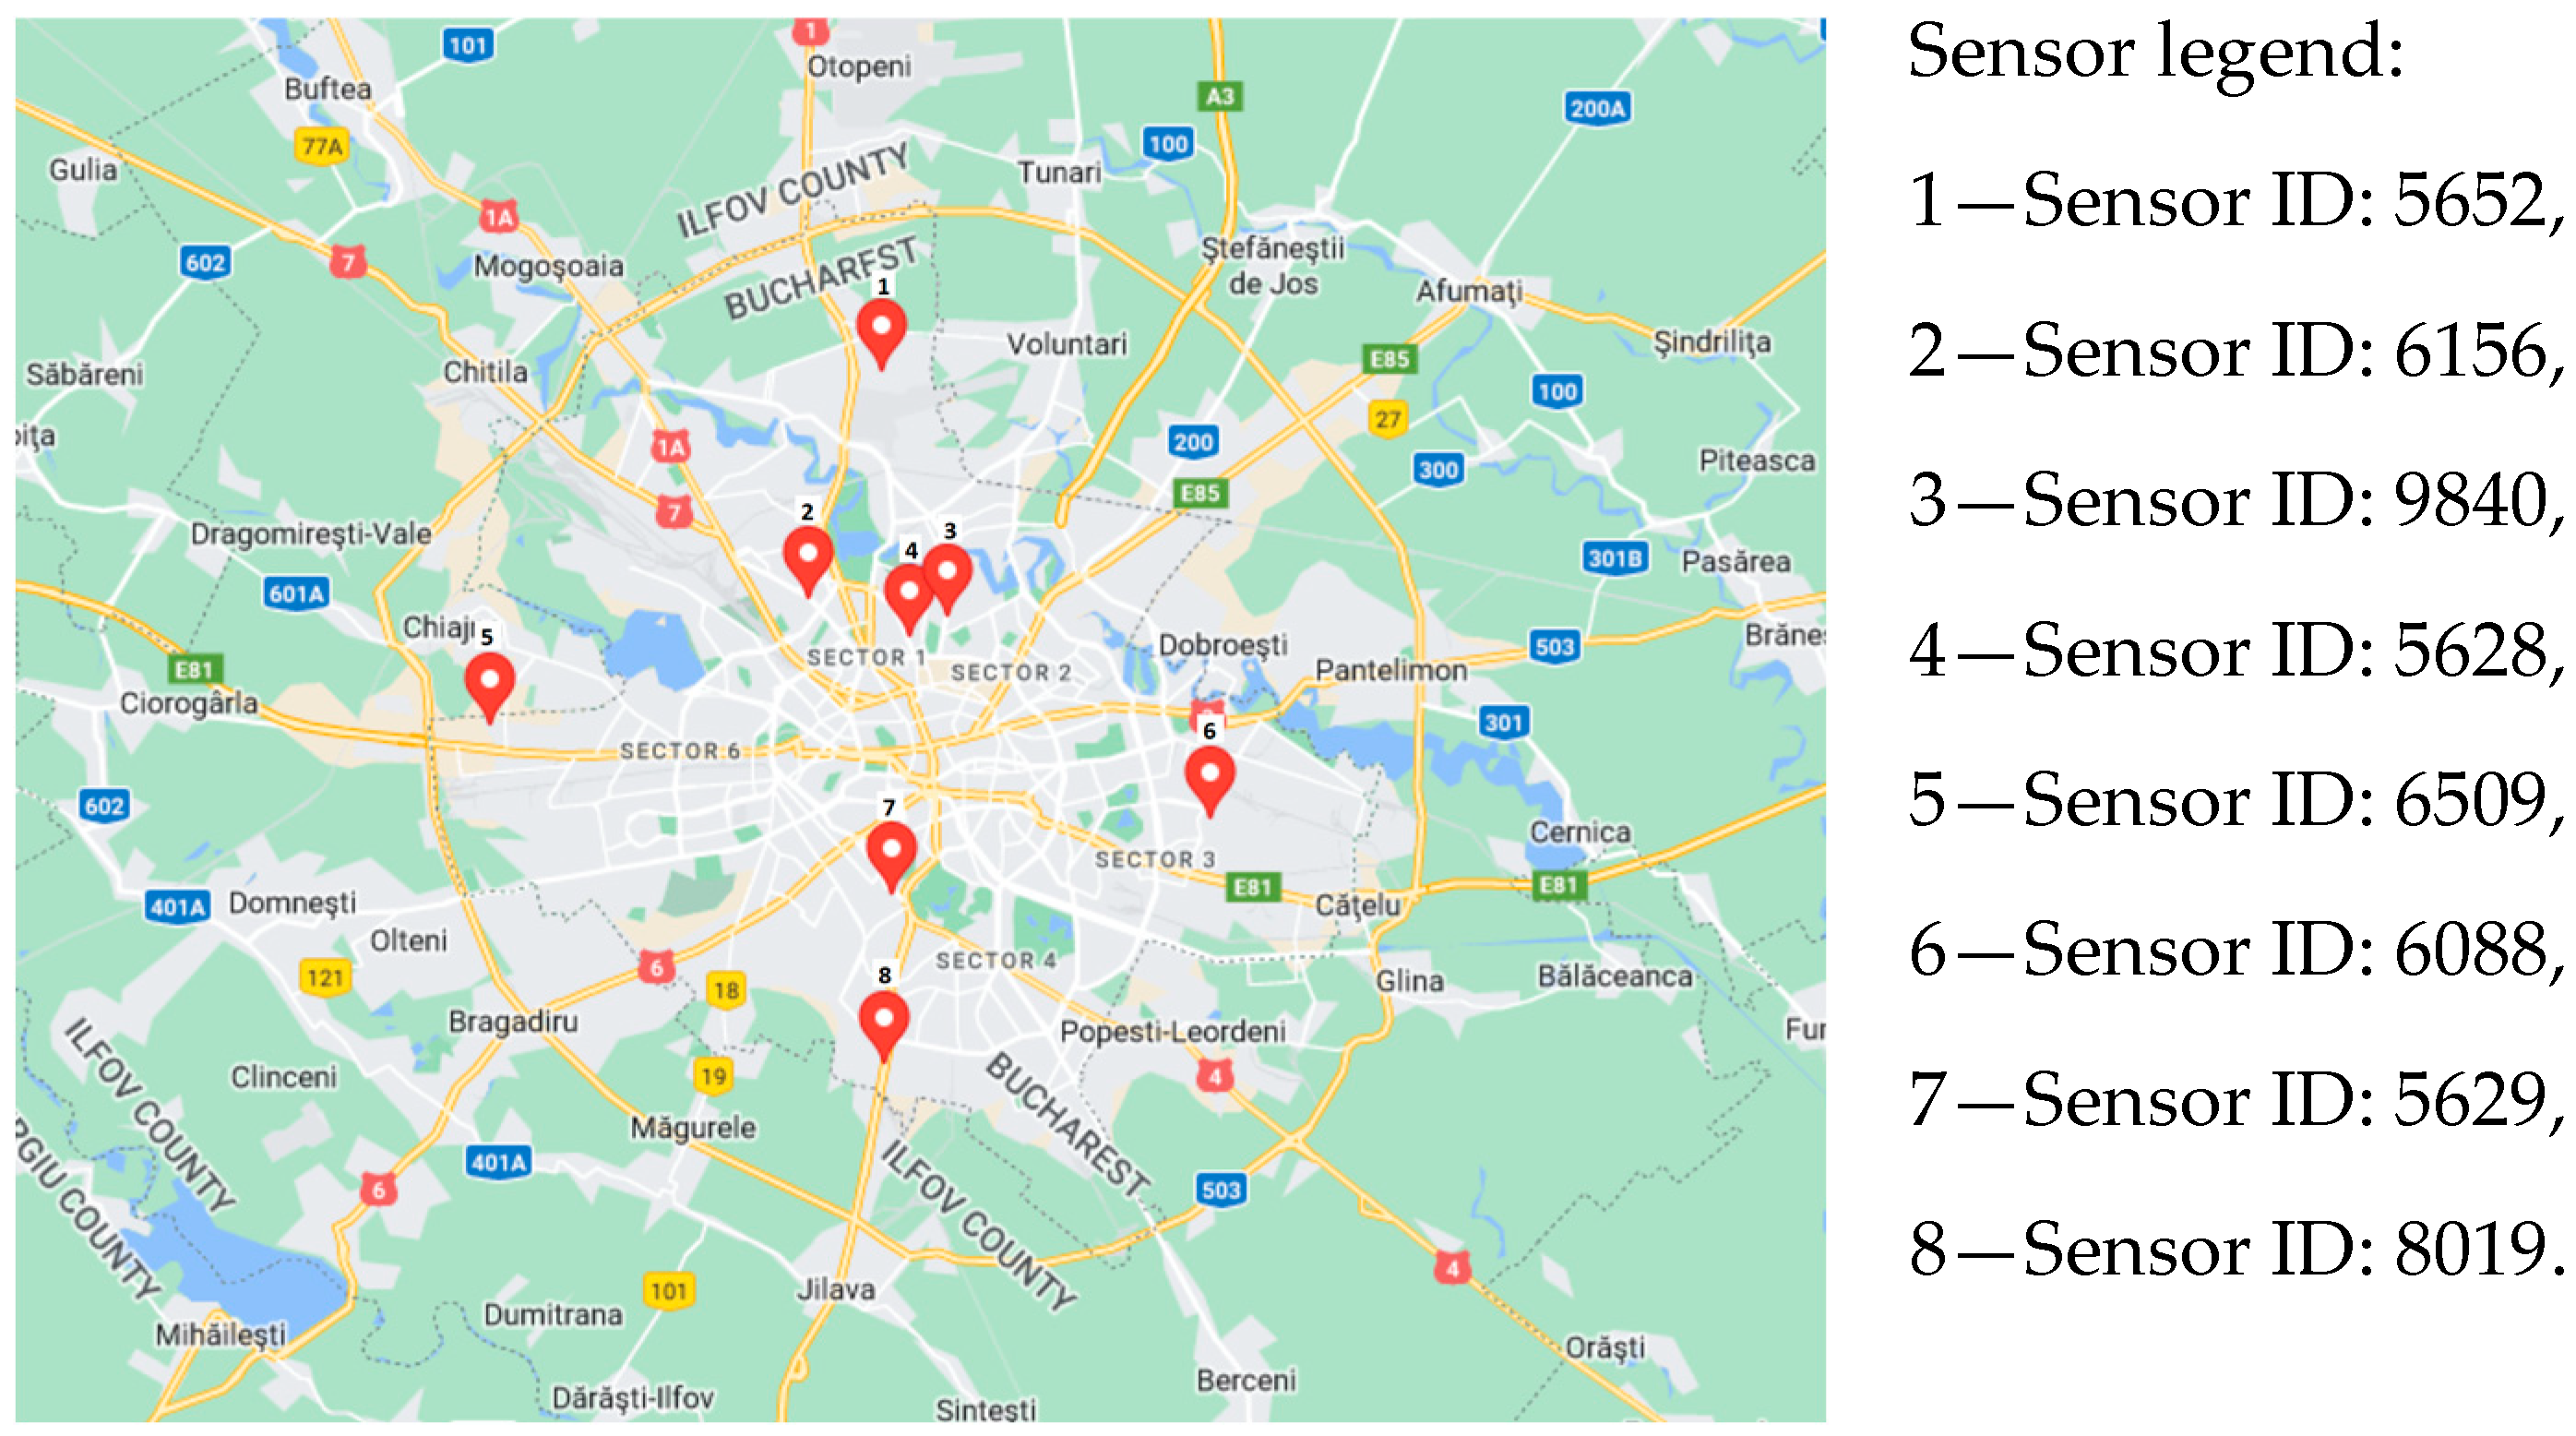
Data regarding air quality data were collected from Airly, a private company that maintains a comprehensive network of PM2.5 and PM10 sensors in major urban areas throughout the country. In Bucharest, analysis of the data revealed a significant increase in the number of sensors during the study period, rising from 16 in 2018 to 106 in 2022.

2.3.2. Hospitalization Data

The National Institute for Public Health (NIPH) provided hospitalization data on chronic pathology based on the following specific criteria:
  • Diagnostic code (according to the International Classification of Diseases, Tenth Revision, ICD-10) at hospital admission: respiratory (COPD, asthma, lung cancer), cardiovascular, cerebrovascular (stroke), or diabetes;
  • Age of 20 years old or above;
  • Residence in the study’s setting.
The period studied was 20 August 2018–1 June 2022.

2.4. Statistical Analysis

The quantitative analysis based on data provided by Airly and NIPH was performed using the XLSTAT software [39].
To verify the research hypotheses that the health status of patients with chronic diseases in Bucharest and its metropolitan area is influenced by the level of atmospheric pollutants, the following steps were taken:
  • Stage 1: In order to ensure the accuracy of the analysis, it was necessary to identify the sensors in Bucharest that recorded the daily level of PM concentrations in suspension. Only the sensors that had more than 1000 records for the analyzed period (20 August 2018–1 June 2022) were selected.
  • Stage 2: Identification of the number of days with exceedances above the daily limit value.
  • Stage 3: Identification of the seasonal characteristics of PM10 and PM2.5 concentrations for an accurate characterization of the pollution level during the analyzed period.
  • Stage 4: Identification of the effects of pollution on human health using correlation analysis.
  • Stage 5: Application of regression models based on the results obtained in Stage 4.
  • Stage 6: Analysis of the future evolution of the effects of pollution on hospitalizations in patients with respiratory, cardiovascular, and cerebrovascular diseases by outlining scenarios determined based on the results obtained in Stage 5.
The unifactorial regression model is based on a mathematical relationship that assumes that a phenomenon (Y—the effect phenomenon) results from two categories of factors: the first category being a single main, causal factor (X), while the second category includes factors specified by the residual variable ε, considered non-essential, with an accidental influence on Y. The specification of the unifactorial model involved defining the endogenous variable (Y) and the exogenous variable (X): y = f ( x ) + ε . The identification of the model required choosing a mathematical function that describes the values of the endogenous variable solely based on the variation in the exogenous variable X [40,41].
The probabilistic model at the level of general community [41],, is as follows:
y i = β 0 + β 1 x i + ε i
where:
  • ( x i , y i ) represent the numerical values of the variables cause and effect registered at the level of the statistical unit i ;
  • β 0 and β 1 represent the parameters of regression equation: β 0 —intercept, the point of intersection of the line of regression with the Oy axis; β 1 —the slope of the regression right or the regression coefficient. This shows with how many units of measure change Y if X increases with a unit of measurement;
  • ε i —residual component (error term) for the statistical unit i .
The real value y i of the Y feature in the probabilistic pattern includes:
  • The theoretical, deterministic component ( y ^ i ), that is, the part of the real value y i that can be determined on the basis of the model for a certain value x i :
    y ^ i = β 0 + β 1 x i
  • The random (residual) component, also called the random error, ( ε i ), representing that part of the real value of Y that cannot be quantified.
    y i = y ^ i + ε i
If the available data come from a sample, we have in pairs of real observations: ( x 1 , y 1 ), ( x 2 , y 2 ), …, ( x n , y n ), based on which the parameters of the equation are estimated, i.e., β 0 and β 1 .
The regression model in the sample is as follows:
y i = b 0 + b 1 x i + e i
with the deterministic component:
y ^ i = b 0 + b 1 x i
where:
  • b 0 —the estimator of the β 0 parameter of the statistical population;
  • b 1 —the estimator of the β 1 parameter of the statistical population;
  • e i —the residual value for the i unit in the sample ( e i = y i y ^ i ).
Analysis of variance (ANOVA) is one of the most commonly used statistical methods in medical research [42]. In this study, ANOVA was used to identify significant differences between the months analyzed, both from the perspective of pollution and the number of hospitalizations. ANOVA is employed to investigate the effect of an independent variable on a dependent variable by analyzing the distinct populations associated with each level of the causal factor and any differences that appear between populations. Depressional analysis (ANOVA) can be performed according to a uni-, bi-, or multifactorial model. In this study, the unifactorial model was used, with the populations classified using a single criterion, r, called a factor [41].

3. Results

3.1. Objective 1: To Compare the Values of Local Pollution Levels with Limits Recommended by EU and WHO

3.1.1. PM10 Concentration by Referring to the Recommendations of EU Directive 2008/50/EC; Law 104/2011

  • Daily limit value (DLV) = 50 μg/m3, which must not be exceeded more than 35 times/year [43];
  • Annual limit value (ALV) = 40 μg/m3 [43].
The importance of air quality monitoring in a setting is reflected by an increased number of sensors, which offer better accuracy in assessment. The total number of sensors in Bucharest, the number of those with more than 50 measurements/year, and the number of those recording DLV exceedances over 35 times/year are shown, for each year of the studied period, in Table 1.
We analyzed the sensors that had more than 50 records/year for the entire period. In 2018, 10 of the 11 active sensors recorded DLV exceedances in a greater number of days than the maximum allowed (35 times/year), and in 2019, from 17 active sensors, 10 of them recorded exceedances. In the COVID-19 pandemic restriction period, in 2020, from forty-eight active sensors, we identified exceedances over 35 times/year of the DLV in only six of them, and similarly, in 2021, only fourteen sensors out of the sixty-one recorded more than thirty-five exceedances of the DLV. In 2022, the average number of days with exceedances was three, but the value was not representative due to the increased heterogeneity of the data. The complete results are reported in Section S1 in the Supplementary Material.
In order to obtain a more accurate picture of the pollution data, it was necessary to retain in the analysis only the sensors with over 1000 measurements for both types of PM (Table 2).
The eight sensors’ locations are indicated in Figure 1. They were dispersed in the central region, as well as in the periphery, so we could consider that by examining their readings, we had a reliable overall picture of the level of pollution in the city.
The analyzed data for the eight selected sensors revealed significant DLV exceedances more than 35 times/year in 2018 and 2019. Starting in 2020, there was a noticeable decrease in the number of DLV exceedances, and in the first 5 months of 2022, all the sensors recorded DLV exceedances in only 5% of the records (Table 3).

3.1.2. Evaluation of PM10 Concentrations by Referring to the WHO Global Air Quality Guidelines (AQGs)

  • DLV = 45 μg/m3 [13];
  • ALV = 15 μg/m3 [13].
The serious impact generated by air pollution on health led, in the fall of 2021, to the modification of reference values for certain atmospheric pollutants, originally established by the WHO in 2005. It should be noted that the new reference values are lower than those established by EU legislation. As expected, decreasing the reference values led to an increase in the number of days with DLV exceedances. This fact was also reflected in the results of the analysis carried out on the eight sensors, which indicated an increase of more than 30% in DLV exceedances established by the WHO compared to those in EU legislation (Table 3 and Table 4).
To summarize, for the whole analyzed period, there were 46,307 values recorded by 143 sensors for PM10 and 42,973 records by 138 sensors for PM2.5. When using the DLV established by EU legislation, 3981 exceedances for PM10 and 8968 exceedances for PM2.5 were observed for all the sensors, whereas, according to the limit values recommended by the WHO, the number of exceeding records was 5526 and 22,493, respectively (Table 5).

3.1.3. Local Pollution Characteristics according to WHO-AQG’s Guidelines

Although for now the standards established by the EU Directive regarding reduction in levels for atmospheric pollutants are less strict than those used in the WHO guidelines, in the long term, the aim is to integrate the DLV established by the WHO into the EU “A clean air program for Europe” [44]. Reducing the levels of atmospheric pollutants is necessary not only in order to protect the health of population but also to reduce the effects of climate change. This fact justifies the continuation of the analysis using the DLV and ALV for PM10 and PM2.5 from the WHO guidelines as reference points as follows:
  • For PM10: DLV = 45 μg/m3; ALV = 15 μg/m3;
  • For PM2.5: DLV = 15 μg/m3, which must not be exceeded more than 3–4 times/year; ALV = 5 μg/m3.
The data from the eight established sensors, with over 1000 records analyzed, were used to determine the number of days exceeding the permissible air pollutant levels annually and over the entire timeframe. The study revealed that the percentage of days with exceedances of the permissible levels of PM10 and PM2.5 was 14–19% and 55–62%, respectively, during the analyzed period (Table 6)
In the PM10 analysis, every month, for each active sensor, the DLV was exceeded, especially in the cold season. The maximum reached was in the period October 2018–March 2019. January 2019 had the highest DLV exceedances (maximum of 26 days, up to 90%). This situation was observed yearly during the analyzed period, but since the COVID-19 restrictions were applied in March 2020, a decrease in the number of DLV exceedances was noticed (Table 7; Tables S7–S9 in the Supplementary Materials).
Regarding PM2.5, our analysis revealed that none of the eight sensors recorded levels below the aforementioned guidelines. As with the PM10 analysis, DLV exceedances were observed primarily during the cold season, with the peak occurring from October 2018 to February 2019. The majority of the DLV exceedances across all the records occurred in January 2019, with 31 measurements exceeding the DLV (Table 8; Tables S10–S12 in the Supplementary Materials).
Contrary to PM10, in the case of PM2.5, an excess of the limits was observed in the period January–March 2022. If, in the case of PM10, the maximum excess of the DLV was 13% (four out of thirty-one measurements in January 2022), for PM2.5, the average number of days with excesses reached up to 26 days/month. All the sensors recorded exceedances between 17 to 29 of the DLV, reaching up to 94%. (See detailed information in Section S2 in the Supplementary Materials).
By examining the daily values, we were able to calculate the annual average values (AAV) of the PM2.5 and PM10 concentrations. Two different methodologies were used for the analysis (Table 9 and Table 10)

3.2. Objective 2: To Analyze the Correlation between Air Pollution and Condition of Disease in Patients with Chronic Respiratory, Cardiovascular, Cerebrovascular, or Metabolic Pathology in the Same Region

The identification of the pollution effects on human health was conducted based on a correlation analysis. Thus, for the period September 2018–December 2021, the number of hospitalizations of people aged 20 years and older by type of selected pathology was analyzed by comparison with the monthly average values (MAV) of the PM10 and PM2.5 concentrations recorded by Airly’s sensors in Bucharest.
From the analysis, direct and statistically significant (p < 0.05) correlations were identified for cardiovascular and cerebrovascular diseases (Table 11; see Section S3 in the Supplementary Materials).
Based on the results, regression models were developed to show the dependence of the admissions numbers for the previously mentioned diseases on PM10 and PM2.5 levels.
An analysis of variance (ANOVA) was used to evaluate the significance of differences between the months of the analyzed period both from the perspective of pollution and the number of hospitalizations. The results obtained showed statistically significant differences only regarding the levels of PM10 and PM2.5 concentrations (see Section S4 in the Supplementary Materials).
It should be noted that in the case of the average number of hospitalizations for respiratory diseases, a large variability in the data was observed from March to May. For these 3 months, an atypical sequence of admissions was identified, with a decrease of up to 70% in April 2020 compared to the previous year, followed by an increase of up to four times in 2021. This decrease in admissions could be explained by the COVID-19 pandemic, both in terms of reducing socioeconomic activities (which has a direct effect on lowering pollution levels) and the population’s exposure to polluted environments, which reduces the risk of respiratory disease exacerbation (Figure 2).
The same trend was identified regarding admissions for cardiovascular diseases in April–May 2020, with an 85% decrease compared to previous the year (Figure 3).

3.2.1. Analysis of the Relationship between Hospital Admissions for Respiratory Diseases and Concentration Levels of PM2.5 and PM10

The quantification of the influence of the pollution level on the number of hospitalizations for patients with respiratory diseases was carried out using a linear regression analysis. In the first regression model, the dependence between the number of hospitalizations (endogenous variable) and the level of PM2.5 (exogenous variable) was analyzed, while the second regression model had the level of PM10 suspended particles as an exogenous variable.
The analysis of the dependence between PM2.5 levels and the number of hospitalizations for respiratory diseases in the period September 2018–December 2021 indicated a valid regression model with a significance level of 5%, explaining approximately 14% of the hospitalizations.
The coefficients of the regression model were statistically significant at a significance level of 5% and showed that the average number of hospitalizations for respiratory diseases, without considering the exogenous factor (PM2.5), was included in the interval [1960, 3826]. An increase of 10 µg/m3 in the monthly average value (MAV) of PM2.5 concentrations generated an increase in hospitalizations with an average number between [90, 938], according to the confidence interval (CI) of the coefficient of the regression model from the performed analysis (Table 12).
In the case of PM10, the regression analysis also produced a valid model that explained approximately 15% of the variation in hospitalizations at a 5% level of significance. As with PM2.5, the coefficients of the regression model were statistically significant at a 5% significance level, indicating that the average number of hospitalizations independent of PM10 fell within the interval [2031, 3804]. According to the parameter’s CI, the number of respiratory hospitalizations increase by a number between [69, 604] for every 10 µg/m3 increase in the MAV of PM10 (Table 13).

3.2.2. Analysis of the Relationship between Hospital Admissions for Cardiovascular Diseases and Concentration Levels of PM2.5 and PM10

Regarding the analysis of the dependence between suspended particles and the number of hospitalizations for patients with cardiovascular diseases, in both the regression models used, the number of hospitalizations represented the endogenous variable, while the exogenous variable was represented by the PM2.5 level in the first regression model and the PM10 level in the second model.
In the first case, the regression model used was valid at a significance level of 5%, and the regression coefficients were statistically significant. The average number of hospitalizations without the influence of PM2.5, according to the CI of the parameter number of hospitalizations, was between [3481, 6483]. Therefore, an increase of 10 µg/m3 in the MAV of PM2.5 led to an increase in the number of hospitalizations with a number between [26, 1392] according to the CI of the parameter of the regression model from the analysis performed (Table 14).
Similarly, without the influence of PM10, the average number of hospitalizations was in the [3606, 6469] range. In addition, an increase in the MAV of PM10 by 10 µg/m3 causes an increase in the number of hospitalizations for cardiovascular diseases, with a number between [25, 888] (Table 15).

3.2.3. Correlations between PM Concentrations and Hospital Admissions for Stroke and Diabetes

The results of the correlation analysis between the MAV of PM2.5 and PM10 and the number of hospitalizations for cerebrovascular diseases (stroke) indicated a medium-intensity positive correlation for the period analyzed.
The resulting regression model, with the number of hospitalizations for cerebrovascular disease (stroke) patients as the endogenous variable and the PM2.5 level as the exogenous variable, was significant at the 5% level. According to the CI of the parameter number of admissions, the average number of admissions for stroke without the influence of PM2.5 was between [50, 71]. Therefore, a 10 µg/m3 increase in the MAV of PM2.5 led to an increase in the number of hospitalizations between [0, 10] according to the confidence interval of the parameter of the regression model derived from the performed analysis (Table 16).
In the case of admissions for diabetes, direct, statistically significant, and strong links were observed with cardiovascular diseases (0.902), asthma (0.875), COPD (0.845), and stroke (0.681), and a moderate link with respiratory diseases (0.371) (Table 11).

3.2.4. Regression-Model-Based Scenarios for the Evolution of Hospitalization Rates

Using the regression equations obtained from the regression models used to analyze the relationship between PM concentrations and the number of hospitalizations for respiratory, cardiovascular, or cerebrovascular (stroke) pathologies, two scenarios (optimistic and pessimistic) regarding the evolution of hospitalization numbers were outlined. In order to more accurately illustrate the effects of pollution, we applied this calculation process both for the daily (DAV) and for the monthly average values (MAV).
  • Optimistic/pessimistic scenarios using DAV;
Analyzing the DAV of PM10 revealed a value of 29.506 µg/m3, but this value was not representative due to the data’s increased heterogeneity. Half of the daily PM10 concentrations measured were greater than 24.06 µg/m3. In the analysis of PM2.5, a wide range of values was also observed, with the DAV of PM2.5 being 20.060 µg/m3 and the majority of daily measurements indicating concentrations greater than 16.905 µg/m3 (Section S5 in the Supplementary Materials).
To determine the optimistic scenario, the lowest DAVs recorded by the eight sensors (0.48 µg/m3 for PM2.5 and 0.71 µg/m3 for PM10) were used as references. In the case of a pessimistic scenario, the highest DAV used as a reference (after removing outlier values) for PM2.5 was 47.15 µg/m3 and for PM10 was 73.22 µg/m3 (Table 17).
  • Optimistic/pessimistic scenarios using MAV.
For the optimistic scenario, the MAV used as reference was the minimum of 8.258 µg/m3 for PM2.5 and 11.728 µg/m3 for PM10. Even though the PM10 and PM2.5 distributions showed some variability in the data, there were no outliers. On the other hand, for the pessimistic scenario, the maximum values of MAV of 41.488 µg/m3 for PM2.5 and 64.667 µg/m3 for PM10 were chosen as reference values (Table 18).

4. Discussion

4.1. General Data on Pollutants

Air pollution can reach various levels depending on the economic activities carried out in a setting, which determines the need to identify diverse, adaptable strategies for control. Similarly, the phenomenon could spread regionally and globally, affecting the economies of large urban agglomerations.
Bessagnet et al. define PM as a group of solid and liquid species that come in a variety of particle sizes and chemical makeups. They state that organic aerosols can be released or created in the atmosphere through the reaction of volatile compounds, but, depending on the surrounding environment, some of these substances can divide into both gas and aerosol phases [45].
The term “particulate matter” refers to coarse particles with a diameter from 2.5 µm to 10µm that are produced by industry, construction, and agriculture. Fine particles (2.5 µm) produced by burning fossil fuels have a tendency to hang around in the atmosphere for a long time and are known to aggravate respiratory and cardiovascular diseases [46].
PM2.5 in particular is produced from a variety of substances, such as sea salt, metal oxides, organic carbon, black carbon, sulfate particles, and many others. PM2.5 exposure is caused by a variety of factors, including local pollution, automobiles, sea salt, crust/road dust, oil burning, and wood burning [47]. Kundu and Stone emphasize that the composition of PM2.5 varies regionally. For instance, rural areas, which are directly impacted by agricultural activities and unpaved roads, have higher levels of crustal materials, while urban areas have higher levels of secondary aerosols and combustion; industrialized areas have elevated amounts of trace metals [48]. Black carbon, polycyclic aromatic hydrocarbons, and n-alkanes make up PM2.5 particles. In line with growing evidence that black carbon is a dangerous component of PM2.5, Yang et al. discovered a link between prolonged exposure to black carbon and an elevated risk of mortality [49].

4.2. Data on the Differences in Reference Values and the Annual Variability

Based on information from the Health Effects Institute in 2020, during 1990–2019, the annual average values of PM2.5 (weighted according to population) in Romania were below the global average but higher than the average for EU countries. A slightly downward trend was observed, similar to that of the average value in the EU, from 22.1 µg/m3 in 1990 to 15.2 µg/m3 in 2016; following this trend, for the next 3 years, the average value would be 15.7 µg/m3 [50].
The national reference values used in Romania were similar to those specified in EU legislation. According to data from the National Agency for Environmental Protection in Romania, air pollution quality was evaluated using the active automatic stations of the National Air Quality Monitoring Network between 2016 and 2021. During this period, the number of automatic active stations increased from 138 to 156 across the country. However, despite these efforts, the analysis of results compared to annual limit values revealed frequent exceedances in several cities, mainly in Iași and Brașov. Notably, Bucharest, Iaşi, and Brașov reported the most frequent exceedances of daily limit values. It is worth noting that the increased number of monitoring stations may have improved the accuracy of the measurements, but more data is needed to confirm this [51].
Our study revealed an increase of more than 30% between the WHO-recommended DLV and that established by EU law. We therefore emphasize the need for the EU Action Plan’s “Towards a Zero Pollution for Air, Water, and Soil” objectives to be implemented and followed at the national level [1].
The WHO’s recommended DLV and ALV for PM10 and PM2.5 were used as a benchmark in our study. During the analyzed period, the proportion of days with PM10 exceedances ranged from 14% to 19%, and for PM2.5, it reached from 55% to 62%. For both types of particles, the analysis revealed that the DLV was exceeded every month, particularly during the cold season (October to March), with January 2019 being the most polluted month in the past four years (PM10 had 77–90% exceedances, while PM2.5 reached 100%). Since the implementation of COVID-19 pandemic restrictions in March 2020, there was a decline in the number of DLV exceedances. By analyzing the daily values, we were able to calculate the AAV for PM2.5 and PM10. We discovered PM2.5 exceedances that were up to four times higher than the WHO-recommended values and PM10 exceedances that were up to twice as high, with a slight decrease in 2020 due to the COVID-19 lockdown.
According to several studies, seasonal fluctuations in PM concentration have a direct and negative impact on human health. A study published in 2021 found that fine PM had a greater impact on cerebrovascular disease mortality during extreme weather conditions, with winter being the season that showed the strongest correlation between weather and mortality [4]. Another study conducted by Gasparrini et al. examined the mortality risk associated with high and low ambient temperatures across multiple countries and found that cold temperatures were responsible for 7.29% of the 74 million deaths studied, while heat was responsible for only 0.42% [52]. A study from 2008 used data from 15 European cities collected between 1990 and 2000 and found that a 1 °C drop in temperature was linked to a 1.35% increase in daily total natural deaths and a 1.72%, 3.30%, and 1.25% increase in cardiovascular, respiratory, and cerebrovascular deaths, respectively [53].

4.3. Correlation of Pollution with Hospital Admissions

Our study found a statistically significant correlation between hospitalizations for respiratory, cardiovascular, and cerebrovascular pathologies and the MAV of PM2.5 and PM10. In the period April–May 2020, hospitalizations for respiratory and cardiovascular diseases showed a decrease of up to 85% compared to the previous year, which was likely due to the COVID-19 pandemic restrictions. The decrease in socioeconomic activity and reduced exposure to polluted environments led to this decrease in admissions, which has been documented worldwide [54,55,56].
Studies have consistently shown a relationship between pollution levels and respiratory [57,58,59,60] and cardiovascular [61] diseases. Seasonal air pollutants can have different effects on different conditions, as previously shown in articles published in the literature. For example, SO2, CO, and O3 have been linked to emergency room visits for community-acquired pneumonia, while PM10 and PM2.5 have been linked to COPD exacerbations. O3 has been linked to heart-failure-related ER visits, NO2 has been linked to myocardial infarction, and SO2 has been linked to cerebrovascular accidents [62].

4.4. Respiratory Diseases—Correlations

Our study highlighted a direct correlation between PM2.5 and PM10 levels and hospitalizations for chronic respiratory diseases. A 10 µg/m3 increase in the MAV of PM2.5 and PM10 led to a proportional increase in hospitalizations, with values ranging from 90 to 938 and from 69 to 604, respectively.
Similar studies have shown that hospital admissions and mortality rates for pulmonary diseases are linked to exposure to PM. A meta-analysis in Korea found that a 10 µg/m3 increase in PM10 concentrations led to a 2.7% increase in COPD admissions and a 1.1% increase in COPD mortality. Short-term exposure to PM2.5 has been linked to an increased risk of asthma exacerbation. In Beijing, Tian et al. found that a 10 µg/m3 increase in PM2.5 was associated with a 0.67% increase in total hospital visits, a 0.65% increase in outpatient visits, and a 0.49% increase in emergency room visits [63]. Li et al. observed a strong correlation between COPD exacerbation and short-term exposure to major air pollutants, in particular O3 and NO2 [9]. In addition, an increase in black carbon concentrations had a direct effect on COPD, showing a 6% increase in hospitalization rates and a 7% increase in mortality rates according to another research article from 2013 [57].

4.5. Cardiovascular Diseases—Correlations

In a similar manner, our study also found a correlation between PM and hospitalizations for cardiovascular diseases. A 10 µg/m3 increase in the MAV of PM2.5 and PM10 resulted in an increase in hospitalizations of [26, 1392] and [25, 888], respectively.
Similar information about the relationship between exposure to PM and cardiovascular diseases is also cited. A meta-analysis [61] found that increases in PM concentrations were linked to hospitalization or death by heart failure, with the strongest association observed on the day of exposure and more persistent effects from PM2.5. It was estimated that a 3.9 µg/m3 decrease in PM2.5 concentrations could prevent 7978 hospitalizations for heart failure in the US. In another meta-analysis, a 10 µg/m3 increase in long-term PM2.5 exposure was linked to increased risks of mortality from ischemic heart disease (23%), cerebrovascular disease (24%), stroke (13%), and myocardial infarction (8%) [64].
In their analysis, the American Cancer Society’s Cancer Prevention Study-II cohort, Thurston et al. found a correlation between an increase in the mortality rate from ischemic heart disease and long-term PM2.5 exposure from burning fossil fuels, particularly coal but also from diesel traffic [65]. Recent research indicates that different PM2.5 components have different effects on cardiovascular health; for example, some metals found in PM2.5 have been linked to higher levels of inflammatory blood markers and an increased risk of coronary events [66]. In light of this emerging research, which suggests that variations in PM2.5 components may also contribute to differences in findings between studies, a better understanding of the role of PM2.5 components on cardiovascular health is required.
Furthermore, our statistical analysis highlighted a correlation between an increased risk of cardiovascular pathology and patients who developed asthma and COPD, a relationship that requires additional studies to clarify the pathophysiological mechanisms that interconnect these pathologies. The question arises whether, in patients who have both cardiovascular diseases and chronic lung diseases, living in a polluted environment can bring an increased risk compared to patients who only suffer from one of the two pathologies.

4.6. Cerebrovascular Diseases (Stroke)—Correlations

In addition, according to our research, there was a positive association between the MAV of PM2.5 or PM10 and the number of hospitalizations for stroke. We found that an increase of 10 µg/m3 in the MAV of PM2.5 led to an increase in hospitalizations, with the number ranging from [0, 10].
Similar research has found a link between short-term exposure to air pollutants and stroke-related hospitalizations. A study conducted in Ireland revealed that short-term exposure to air pollutants, specifically PM2.5, during the winter season, may lead to an increased number of admissions for stroke, with a reported risk ratio of 1.024 [67]. Furthermore, according to a recent study conducted in South Korea [68], long-term exposure to several air pollutants, including PM10, appears to increase the risk of developing stroke [68]. A study conducted in Sweden revealed a strong association between exposure to black carbon and stroke incidence, with a 4.1% increase in the number of stroke cases per 0.31 mg/m3 [69]. On the other hand, unlike our study, the data reported by the Swedish authors failed to reveal any association between exposure to PM2.5 or PM10 and stroke incidence.

4.7. Metabolic Diseases (Diabetes)—Correlations

According to clinical studies [70,71] diabetes patients are more likely to develop cardiovascular diseases, with a risk of dying from cardiovascular causes up to four times higher than matched people without diabetes. Furthermore, scientific publications support the assumption that pollution, mainly exposure to PM2.5 may have a direct correlation with diabetes-related mortality. Some of the pathophysiological mechanisms involved in increased mortality caused by pollution in diabetic patients are: resistance to insulin, liver, central nervous system and adipose tissue inflammation, and reduced thermogenesis [72]. Even though our study found no direct link between PM2.5 or PM10 exposure and the number of diabetes hospitalizations, we cannot rule out the possibility of an indirect link via a cardiovascular disease.
The direct impact of pollution on diabetes and the incidence of metabolic imbalances may be exerted only after a longer exposure, thus making it more difficult to be evaluated during a short-term analysis. Considering this aspect, it is important to extend the analysis over a longer period of time to investigate if this relationship does exist, considering the chronic evolution of diabetes, and also whether other air pollutants are more strongly involved in this association.

4.8. Lung Cancer—Correlations

Our statistical analysis did not reveal a causal relationship between pollution and lung cancer, which can be explained by the short period of study. Data from the literature reveal that the average time of exposure to pollutants for the development of lung cancer is 10–30 years [73]. Furthermore, multiple factors, most notably smoking, have been linked to the development of lung cancer; thus, determining the extent to which the disease can be linked to pollution is difficult [74]. Some authors point towards the lack of sufficient proper data in medical publications, since a study on the risk of lung cancer development and its association with air pollution may be difficult to conduct, especially as there are some other major factors involved in the etiology, such as smoking [73]. This is an individual habit, and thus it is prone to population-based studies rather than epidemiologic studies, which are usually conducted when assessing the influence of air pollutants.
A French study published by Lequi et al. documented the incidence of cancer and specifically lung cancer in a French community over a period of 26 years, reporting a statistically significant risk ratio of 1.17 for all types of cancer and 1.31 for lung cancer, with a lag period of 10 years for every interquartile black carbon increase, thus suggesting that air pollutants may be partially involved in the etiology of lung cancer, especially in highly polluted areas [75]. Therefore, despite not managing to report any statistically significant association between the two factors in our study, we do not completely exclude the possibility that exposure to high levels of PM2.5 and PM10 may, in fact, play a much more prominent role in the development of lung cancer than previously expected. In order to clarify such a delicate and crucial matter, a larger study that spans a longer period of follow-up should be conducted.

4.9. Data Concerning Scenarios for the Evolution of Hospitalization Rates

Another noteworthy aspect that we found in our study was the pessimistic and optimistic scenarios regarding the link between PM exposure and the number of admissions. For both PM2.5 and PM10, for the DAV and MAV, there was an increase of 40–60% in the number of admissions for respiratory and cardiovascular diseases when comparing the optimistic and pessimistic scenarios. This translates to an increase of more than 2000 admissions for each type of disease for the whole period, thus leading to a higher burden on the healthcare system. This emphasizes the importance of accelerating efforts to reduce air pollution in accordance with WHO guidelines.

4.10. Limitations of the Study

The results of the regression analysis showed that the level of pollution had a significant impact on hospitalizations for respiratory and cardiovascular diseases. This would be more conclusive if the data used in the regression models covered a longer period. One of the limitations of the current study is its short period, which did not allow for finding statistical correlations between air pollution and chronic diseases, which require long-term exposure to risk factors. In addition, an increase in the number of hospitalizations does not provide a complete picture of how pollution affects patients with chronic diseases because some disease exacerbations are treated by family doctors or in outpatient services, and these data were not included in our study.

5. Conclusions

Although it has previously been observed that air pollution significantly triggers the exacerbation of chronic diseases, we presented data to demonstrate that peaks in the levels of PM in the air have a strong impact on public health in Bucharest and its metropolitan area.
The results of the analysis indicated that the exposure of the population to fine particles in suspension caused an increase in the number of hospital admissions, which was significantly higher in the cases of pollution with PM2.5, regardless of whether it referred to diseases of the respiratory system, cardiovascular system, stroke, or diabetes. Thus, the degree of air pollution has a direct and proportional impact on human health. A reduction in pollution as a consequence of measures taken during the COVID-19 pandemic was also confirmed in Bucharest, one of the most polluted capitals in the EU.
A direct correlation between the monthly average values of PM2.5 and PM10 and the number of admissions for cardiovascular and respiratory diseases was observed, thus indicating the need for setting up a framework for in-depth observational studies and strong intervention by stakeholders involved in the decision-making process impacting public health and the environment.
The findings of the current study highlight the necessity of carrying out additional research, both by expanding the targeted pathologies and the period of study and by assessing the impact of air pollution on health services and the economy.

Supplementary Materials

The following supporting information can be downloaded at: https://www.mdpi.com/article/10.3390/atmos14050867/s1, Section S1–Section S5. Table S1. Daily records and number of exceedances of the DLV in Bucharest for 2018 (20.08.2018-31.12.2018). Table S2. Daily records and number of exceedances of the daily limit value in Bucharest for the year 2019. Table S3. Daily records and number of exceedances of the daily limit value in Bucharest for the year 2020. Table S4. Daily records and number of exceed-ances of the daily limit value in Bucharest for the year 2021. Table S5. Daily records and number of exceedances of the daily limit value in Bucharest for the year 2022 (01.01.2022–01.06.2022) at sensors with more than 50 measurements. Table S6. Daily records and number of exceedances of the daily limit value in Bucharest for 2022—outliers list. Figure S1. Box-plot diagram for the analysis of the distribution of days with exceedances from the year 2022. Table S7. Monthly records (PM10) for the eight sensors. Table S8. Synthesis for all sensors (PM10)—monthly average values for the eight sensors for days with DLV exceedances. Table S9. Share of days with ex-ceedances in total records (PM10) for the eight sensors (%). Table S10. Monthly records (PM2.5) for the eight sensors. Table S11. Synthesis for all sensors (PM2.5)—monthly average values for the eight sensors for days with exceedances of the DLV. Table S12. Share of days with exceedances in total records (PM2.5) for the eight sensors (%). Table S13. p-values (Spearman). Figure S2. Correlogram. Table S14. ANOVA—PM2.5. Table S15. ANOVA—PM10. Table S16. Descriptive statistics—PM10 and PM2.5. Figure S3. Box-plot.

Author Contributions

Conceptualization, B.M.; data curation, D.P., D.M. and M.M.; formal analysis, D.P., D.M. and M.M.; investigation, D.B.; methodology, D.B., D.M. and M.M.; project administration, B.M.; resources, M.G., C.F.G. and S.P.; supervision, B.M.; validation, E.I., B.T. and F.D.M.; visualization, D.B.; writing—original draft, D.B., T.C.P., R.M.F. and A.L.I.; writing—review and editing, B.M., E.I., B.T. and F.D.M. All authors have read and agreed to the published version of the manuscript.

Funding

This research received no external funding. The APC was funded by the authors.

Institutional Review Board Statement

Not applicable.

Informed Consent Statement

Not applicable.

Data Availability Statement

The data presented in this study are available on request from the corresponding author.

Conflicts of Interest

The authors declare no conflict of interest.

References

  1. Zero Pollution Action Plan. Available online: https://environment.ec.europa.eu/strategy/zero-pollution-action-plan_en (accessed on 17 December 2022).
  2. Air Pollutants|Air|CDC. Available online: https://www.cdc.gov/air/pollutants.htm (accessed on 18 October 2022).
  3. Manisalidis, I.; Stavropoulou, E.; Stavropoulos, A.; Bezirtzoglou, E. Environmental and Health Impacts of Air Pollution: A Review. Front. Public Health 2020, 8, 14. [Google Scholar] [CrossRef] [PubMed]
  4. Park, S.K. Seasonal Variations of Fine Particulate Matter and Mortality Rate in Seoul, Korea with a Focus on the Short-Term Impact of Meteorological Extremes on Human Health. Atmosphere 2021, 12, 151. [Google Scholar] [CrossRef]
  5. Manea, D.I.; Titan, E.; Mihai, M.; Apostu, S.A.; Vasile, V. Good Practices on Air Quality, Pollution and Health Impact at EU Level. Amfiteatru Econ. 2020, 22, 256–274. [Google Scholar] [CrossRef]
  6. Doiron, D.; de Hoogh, K.; Probst-Hensch, N.; Fortier, I.; Cai, Y.; De Matteis, S.; Hansell, A.L. Air Pollution, Lung Function and COPD: Results from the Population-Based UK Biobank Study. Eur. Respir. J. 2019, 54, 1802140. [Google Scholar] [CrossRef]
  7. Tiotiu, A.I.; Novakova, P.; Nedeva, D.; Chong-Neto, H.J.; Novakova, S.; Steiropoulos, P.; Kowal, K. Impact of Air Pollution on Asthma Outcomes. Int. J. Environ. Res. Public Health 2020, 17, 6212. [Google Scholar] [CrossRef] [PubMed]
  8. Chi, R.; Li, H.; Wang, Q.; Zhai, Q.; Wang, D.; Wu, M.; Liu, Q.; Wu, S.; Ma, Q.; Deng, F.; et al. Association of Emergency Room Visits for Respiratory Diseases with Sources of Ambient PM2.5. J. Environ. Sci. 2019, 86, 154–163. [Google Scholar] [CrossRef] [PubMed]
  9. Li, J.; Sun, S.; Tang, R.; Qiu, H.; Huang, Q.; Mason, T.; Tian, L. Major Air Pollutants and Risk of COPD Exacerbations: A Systematic Review and Meta-Analysis. Int. J. Chron. Obstruct. Pulmon. Dis. 2016, 11, 3079–3091. [Google Scholar] [CrossRef]
  10. Yates, E.F.; Zhang, K.; Naus, A.; Forbes, C.; Wu, X.; Dey, T. A Review on the Biological, Epidemiological, and Statistical Relevance of COVID-19 Paired with Air Pollution. Environ. Adv. 2022, 8, 100250. [Google Scholar] [CrossRef]
  11. Air Quality: Commission Decides to Refer Romania. Available online: https://ec.europa.eu/commission/presscorner/detail/en/ip_21_6264 (accessed on 17 December 2022).
  12. Hoffmann, B.; Boogaard, H.; de Nazelle, A.; Andersen, Z.J.; Abramson, M.; Brauer, M.; Brunekreef, B.; Forastiere, F.; Huang, W.; Kan, H.; et al. WHO Air Quality Guidelines 2021–Aiming for Healthier Air for All: A Joint Statement by Medical, Public Health, Scientific Societies and Patient Representative Organisations. Int. J. Public Health 2021, 66, 1604465. [Google Scholar] [CrossRef]
  13. WHO. WHO Global Air Quality Guidelines: Particulate Matter (PM2.5 and PM10), Ozone, Nitrogen Dioxide, Sulfur Dioxide and Carbon Monoxide; World Health Organization: Geneva, Switzerland, 2021; p. 1302. [Google Scholar]
  14. IQAir. IQAir World Air Quality Report 2021; Paper Knowledge: Toward a Media History of Documents; IQAir: Goldach, Switzerland, 2022; p. 43. [Google Scholar]
  15. European Environmental Agency (EEA). Air Quality in Europe 2022; Report No. 05/2022; European Environmental Agency (EEA): Copenhagen, Denmark, 2022. [Google Scholar]
  16. Volná, V.; Blažek, Z.; Krejčí, B. Assessment of Air Pollution by PM10 Suspended Particles in the Urban Agglomeration of Central Europe in the Period from 2001 to 2018. Urban Clim. 2021, 39, 100959. [Google Scholar] [CrossRef]
  17. Rodrigues, V.; Gama, C.; Ascenso, A.; Oliveira, K.; Coelho, S.; Monteiro, A.; Hayes, E.; Lopes, M. Assessing Air Pollution in European Cities to Support a Citizen Centered Approach to Air Quality Management. Sci. Total Environ. 2021, 799, 149311. [Google Scholar] [CrossRef]
  18. Mücke, H.-G.; Wagener, S.; Werchan, M.; Bergmann, K.-C. Measurements of Particulate Matter and Pollen in the City of Berlin. Urban Clim. 2014, 10, 621–629. [Google Scholar] [CrossRef]
  19. Sanda, M.; Dunea, D.; Iordache, S.; Predescu, L.; Predescu, M.; Pohoata, A.; Onutu, I. Recent Urban Issues Related to Particulate Matter in Ploiesti City, Romania. Atmosphere 2023, 14, 746. [Google Scholar] [CrossRef]
  20. Proorocu, M.; Odagiu, A.; Oroian, I.G.; Ciuiu, G.; Dan, V. Particulate matter status in Romanian urban areas: PM10 pollution levels in Bucharest. Environ. Eng. Manag J. 2014, 13, 3115–3122. [Google Scholar] [CrossRef]
  21. Lorga, G.; Raicu, C.B.; Stefan, S. Annual Air Pollution Level of Major Primary Pollutants in Greater Area of Bucharest. Atmos. Pollut. Res. 2015, 6, 824–834. [Google Scholar] [CrossRef]
  22. Sfîcă, L.; Iordache, I.; Ichim, P.; Leahu, A.; Cazacu, M.-M.; Gurlui, S.; Trif, C.-R. The Influence of Weather Conditions and Local Climate on Particulate Matter (PM10) Concentration in Metropolitan Area of Iasi, Romania. Present Environ. Sustain. Dev. 2018, 12, 47–69. [Google Scholar] [CrossRef]
  23. Dunea, D.; Iordache, S.; Radulescu, C.; Pohoata, A.; Dulama, I. A Multidimensional Approach to the Influence of Wind on the Variations of Particulate Matter and Associated Heavy Metals in Ploiesti City. Rom. J. Phys. 2016, 61, 1354–1368. [Google Scholar]
  24. Alotaibi, R.; Bechle, M.; Marshall, J.D.; Ramani, T.; Zietsman, J.; Nieuwenhuijsen, M.J.; Khreis, H. Traffic Related Air Pollution and the Burden of Childhood Asthma in the Contiguous United States in 2000 and 2010. Environ. Int. 2019, 127, 858–867. [Google Scholar] [CrossRef] [PubMed]
  25. Chen, H.; Quick, M.; Kaufman, J.S.; Chen, C.; Kwong, J.C.; van Donkelaar, A.; Meng, J.; Martin, R.V.; Kim, J.; Lavigne, E.; et al. Impact of Lowering Fine Particulate Matter from Major Emission Sources on Mortality in Canada: A Nationwide Causal Analysis. Proc. Natl. Acad. Sci. USA 2022, 119, e2209490119. [Google Scholar] [CrossRef]
  26. Thangavel, P.; Park, D.; Lee, Y.-C. Recent Insights into Particulate Matter (PM2.5)-Mediated Toxicity in Humans: An Overview. Int. J. Environ. Res. Public Health 2022, 19, 7511. [Google Scholar] [CrossRef]
  27. Stafoggia, M.; Oftedal, B.; Chen, J.; Rodopoulou, S.; Renzi, M.; Atkinson, R.W.; Bauwelinck, M.; Klompmaker, J.O.; Mehta, A.; Vienneau, D.; et al. Long-Term Exposure to Low Ambient Air Pollution Concentrations and Mortality among 28 Million People: Results from Seven Large European Cohorts within the ELAPSE Project. Lancet Planet. Health 2022, 6, e9–e18. [Google Scholar] [CrossRef] [PubMed]
  28. Mao, L.; Xu, J.; Xu, Z.; Xia, X.; Li, B.; He, J.; Zhao, P.; Pan, J.; Zhang, D.; Su, Y.; et al. A Child with Household Transmitted COVID-19. BMC Infect. Dis. 2020, 20, 329. [Google Scholar] [CrossRef] [PubMed]
  29. Zhang, Y.; Ma, Y.; Feng, F.; Cheng, B.; Wang, H.; Shen, J.; Jiao, H. Association between PM10 and Specific Circulatory System Diseases in China. Sci. Rep. 2021, 11, 12129. [Google Scholar] [CrossRef] [PubMed]
  30. Bodor, K.; Szép, R.; Bodor, Z. The Human Health Risk Assessment of Particulate Air Pollution (PM2.5 and PM10) in Romania. Toxicol. Rep. 2022, 9, 556–562. [Google Scholar] [CrossRef] [PubMed]
  31. Bodor, K.; Micheu, M.M.; Keresztesi, Á.; Birsan, M.-V.; Nita, I.-A.; Bodor, Z.; Petres, S.; Korodi, A.; Szép, R. Effects of PM10 and Weather on Respiratory and Cardiovascular Diseases in the Ciuc Basin (Romanian Carpathians). Atmosphere 2021, 12, 289. [Google Scholar] [CrossRef]
  32. Enescu, R.E.; Dincă, L.; Zup, M.; Davidescu, Ș.; Vasile, D. Assessment of Soil Physical and Chemical Properties among Urban and Peri-Urban Forests: A Case Study from Metropolitan Area of Brasov. Forests 2022, 13, 1070. [Google Scholar] [CrossRef]
  33. Maftei, C.; Muntean, R.; Poinareanu, I. The Impact of Air Pollution on Pulmonary Diseases: A Case Study from Brasov County, Romania. Atmosphere 2022, 13, 902. [Google Scholar] [CrossRef]
  34. Chereches, I.A.; Arion, I.D.; Muresan, I.C.; Gaspar, F. Study of the Effects of the COVID-19 Pandemic on Air Quality: A Case Study in Cluj-Napoca, Romania. Sustainability 2023, 15, 2549. [Google Scholar] [CrossRef]
  35. Zwanka, R.J.; Buff, C. COVID-19 Generation: A Conceptual Framework of the Consumer Behavioral Shifts to Be Caused by the COVID-19 Pandemic. J. Int. Consum. Mark. 2021, 33, 58–67. [Google Scholar] [CrossRef]
  36. Sarmadi, M.; Rahimi, S.; Rezaei, M.; Sanaei, D.; Dianatinasab, M. Air Quality Index Variation before and after the Onset of COVID-19 Pandemic: A Comprehensive Study on 87 Capital, Industrial and Polluted Cities of the World. Environ. Sci. Eur. 2021, 33, 134. [Google Scholar] [CrossRef]
  37. Jurconi, A.; Ioana Maria, P.; Manea, D.-I.; Mihai, M.; Pamfilie, R. The Impact of the “Green Transition” in the Field of Food Packaging on the Behavior of Romanian Consumers. Amfiteatru Econ. 2022, 24, 395–409. [Google Scholar] [CrossRef]
  38. Vasilescu, M.D.; Dimian, G.C.; Gradinaru, G.I. Green Entrepreneurship in Challenging Times: A Quantitative Approach for European Countries. Econ. Res. Istraživanja 2023, 36, 1828–1847. [Google Scholar] [CrossRef]
  39. Addinsoft. XLSTAT Statistical and Data Analysis Solution. New York, USA. 2023. Available online: https://www.xlstat.com/en (accessed on 10 October 2022).
  40. Popa, M. Statistici Multivariate Aplicate in Psihologie; Editura Polirom: Bucharest, Romania, 2010; pp. 125–128. [Google Scholar]
  41. Voineagu, V.; Titan, E.; Radu, S.; Ghita, S.; Todose, D.; Boboc, C.; Pele, D. Teorie Si Practica Econometrica; Meteor Press: Bucharest, Romania, 2007; ISBN 978-973-728-240-8. [Google Scholar]
  42. Kim, T.K. Understanding One-Way ANOVA Using Conceptual Figures. Korean J. Anesthesiol. 2017, 70, 22. [Google Scholar] [CrossRef] [PubMed]
  43. Directive 2008/50/EC of the European Parliament and of the Council of 21 May 2008 on Ambient Air Quality and Cleaner Air for Europe. Available online: https://webarchive.nationalarchives.gov.uk/eu-exit/https://eur-lex.europa.eu/legal-content/EN/TXT/?uri=CELEX:02008L0050-20150918 (accessed on 10 October 2022).
  44. Exceedance of Air Quality Standards in Europe. Available online: https://www.eea.europa.eu/ims/exceedance-of-air-quality-standards (accessed on 18 October 2022).
  45. Bessagnet, B.; Allemand, N.; Putaud, J.-P.; Couvidat, F.; André, J.-M.; Simpson, D.; Pisoni, E.; Murphy, B.N.; Thunis, P. Emissions of Carbonaceous Particulate Matter and Ultrafine Particles from Vehicles-A Scientific Review in a Cross-Cutting Context of Air Pollution and Climate Change. Appl. Sci. 2022, 12, 3623. [Google Scholar] [CrossRef] [PubMed]
  46. Praveen, J.K.; Michael, L.C. Kumar and Clark’s Clinical Medicine, 10th ed.; Elsevier: Amsterdam, The Netherlands, 2020; Volume 10, pp. 1138–1143. [Google Scholar]
  47. Masri, S.; Kang, C.-M.; Koutrakis, P. Composition and Sources of Fine and Coarse Particles Collected during 2002–2010 in Boston, MA. J. Air Waste Manag. Assoc. 2015, 65, 287–297. [Google Scholar] [CrossRef] [PubMed]
  48. Kundu, S.; Stone, E.A. Composition and Sources of Fine Particulate Matter across Urban and Rural Sites in the Midwestern United States. Environ. Sci. Process. Impacts 2014, 16, 1360–1370. [Google Scholar] [CrossRef]
  49. Yang, J.; Sakhvidi, M.J.Z.; de Hoogh, K.; Vienneau, D.; Siemiatyck, J.; Zins, M.; Goldberg, M.; Chen, J.; Lequy, E.; Jacquemin, B. Long-Term Exposure to Black Carbon and Mortality: A 28-Year Follow-up of the GAZEL Cohort. Environ. Int. 2021, 157, 106805. [Google Scholar] [CrossRef]
  50. Health Effects Institute. State of Global Air 2020; Special Report; Health Effects Institute: Boston, MA, USA, 2020; ISSN 2578-6873. Available online: https://www.stateofglobalair.org/ (accessed on 18 January 2023).
  51. Reţeaua Naţională de Monitorizare Automată a Calităţii Aerului (RNMCA)—Reteaua Nationala de Monitorizare a Calitatii Aerului–ANPM. Available online: http://www.anpm.ro/reteaua-nationala-de-monitorizare-a-calitatii-aerului/-/asset_publisher/MCtW0ySppoYG/content/reţeaua_naţională_de_monitorizare_automată_a_calităţii_aerului_%28rnmca%29_ (accessed on 18 October 2022).
  52. Gasparrini, A.; Guo, Y.; Hashizume, M.; Lavigne, E.; Zanobetti, A.; Schwartz, J.; Tobias, A.; Tong, S.; Rocklöv, J.; Forsberg, B.; et al. Mortality Risk Attributable to High and Low Ambient Temperature: A Multicountry Observational Study. Lancet 2015, 386, 369–375. [Google Scholar] [CrossRef] [PubMed]
  53. Analitis, A.; Katsouyanni, K.; Biggeri, A.; Baccini, M.; Forsberg, B.; Bisanti, L.; Kirchmayer, U.; Ballester, F.; Cadum, E.; Goodman, P.G.; et al. Effects of Cold Weather on Mortality: Results From 15 European Cities Within the PHEWE Project. Am. J. Epidemiol. 2008, 168, 1397–1408. [Google Scholar] [CrossRef]
  54. Birkmeyer, J.D.; Barnato, A.; Birkmeyer, N.; Bessler, R.; Skinner, J. The Impact of The COVID-19 Pandemic On Hospital Admissions In The United States. Health Aff. 2020, 39, 2010–2017. [Google Scholar] [CrossRef]
  55. Ii, M.; Watanabe, S. The Paradox of the COVID-19 Pandemic: The Impact on Patient Demand in Japanese Hospitals. Health Policy 2022, 126, 1081–1089. [Google Scholar] [CrossRef] [PubMed]
  56. Shah, S.A.; Brophy, S.; Kennedy, J.; Fisher, L.; Walker, A.; Mackenna, B.; Curtis, H.; Inglesby, P.; Davy, S.; Bacon, S.; et al. Impact of First UK COVID-19 Lockdown on Hospital Admissions: Interrupted Time Series Study of 32 Million People. eClinicalMedicine 2022, 49, 101462. [Google Scholar] [CrossRef]
  57. Gan, W.Q.; FitzGerald, J.M.; Carlsten, C.; Sadatsafavi, M.; Brauer, M. Associations of Ambient Air Pollution with Chronic Obstructive Pulmonary Disease Hospitalization and Mortality. Am. J. Respir. Crit. Care Med. 2013, 187, 721–727. [Google Scholar] [CrossRef]
  58. Garshick, E. Effects of Short- and Long-Term Exposures to Ambient Air Pollution on COPD. Eur. Respir. J. 2014, 44, 558–561. [Google Scholar] [CrossRef]
  59. Guarnieri, M.; Balmes, J.R. Outdoor Air Pollution and Asthma. Lancet 2014, 383, 1581–1592. [Google Scholar] [CrossRef] [PubMed]
  60. Kyung, S.Y.; Jeong, S.H. Particulate-Matter Related Respiratory Diseases. Tuberc. Respir. Dis. 2020, 83, 116. [Google Scholar] [CrossRef] [PubMed]
  61. Shah, A.S.; Langrish, J.P.; Nair, H.; McAllister, D.A.; Hunter, A.L.; Donaldson, K.; Newby, D.E.; Mills, N.L. Global Association of Air Pollution and Heart Failure: A Systematic Review and Meta-Analysis. Lancet 2013, 382, 1039–1048. [Google Scholar] [CrossRef] [PubMed]
  62. Pothirat, C.; Chaiwong, W.; Liwsrisakun, C.; Bumroongkit, C.; Deesomchok, A.; Theerakittikul, T.; Limsukon, A.; Tajarernmuang, P.; Phetsuk, N. Acute Effects of Air Pollutants on Daily Mortality and Hospitalizations Due to Cardiovascular and Respiratory Diseases. J. Thorac. Dis. 2019, 11, 3070–3083. [Google Scholar] [CrossRef]
  63. Tian, Y.; Xiang, X.; Juan, J.; Sun, K.; Song, J.; Cao, Y.; Hu, Y. Fine Particulate Air Pollution and Hospital Visits for Asthma in Beijing, China. Environ. Pollut. 2017, 230, 227–233. [Google Scholar] [CrossRef]
  64. Alexeeff, S.E.; Liao, N.S.; Liu, X.; Van Den Eeden, S.K.; Sidney, S. Long-Term PM 2.5 Exposure and Risks of Ischemic Heart Disease and Stroke Events: Review and Meta-Analysis. J. Am. Heart Assoc. 2021, 10, e016890. [Google Scholar] [CrossRef]
  65. Thurston, G.D.; Burnett, R.T.; Turner, M.C.; Shi, Y.; Krewski, D.; Lall, R.; Ito, K.; Jerrett, M.; Gapstur, S.M.; Diver, W.R.; et al. Ischemic Heart Disease Mortality and Long-Term Exposure to Source-Related Components of U.S. Fine Particle Air Pollution. Environ. Health Perspect. 2016, 124, 785–794. [Google Scholar] [CrossRef]
  66. Niu, J.; Liberda, E.N.; Qu, S.; Guo, X.; Li, X.; Zhang, J.; Meng, J.; Yan, B.; Li, N.; Zhong, M.; et al. The Role of Metal Components in the Cardiovascular Effects of PM2.5. PLoS ONE 2013, 8, e83782. [Google Scholar] [CrossRef]
  67. Byrne, C.P.; Bennett, K.E.; Hickey, A.; Kavanagh, P.; Broderick, B.; O’Mahony, M.; Williams, D.J. Short-Term Air Pollution as a Risk for Stroke Admission: A Time-Series Analysis. Cerebrovasc. Dis. 2020, 49, 404–411. [Google Scholar] [CrossRef] [PubMed]
  68. Kim, S.Y.; Kim, J.-H.; Kim, Y.H.; Wee, J.H.; Min, C.; Han, S.-M.; Kim, S.; Choi, H.G. Short- and Long-Term Exposure to Air Pollution Increases the Risk of Stroke. Int. J. Stroke 2022, 17, 654–660. [Google Scholar] [CrossRef] [PubMed]
  69. Ljungman, P.L.S.; Andersson, N.; Stockfelt, L.; Andersson, E.M.; Sommar, J.N.; Eneroth, K.; Gidhagen, L.; Johansson, C.; Lager, A.; Leander, K.; et al. Long-Term Exposure to Particulate Air Pollution, Black Carbon, and Their Source Components in Relation to Ischemic Heart Disease and Stroke. Environ. Health Perspect. 2019, 127, 107012. [Google Scholar] [CrossRef] [PubMed]
  70. Almourani, R.; Chinnakotla, B.; Patel, R.; Kurukulasuriya, L.R.; Sowers, J. Diabetes and Cardiovascular Disease: An Update. Curr. Diab. Rep. 2019, 19, 161. [Google Scholar] [CrossRef]
  71. Dal Canto, E.; Ceriello, A.; Rydén, L.; Ferrini, M.; Hansen, T.B.; Schnell, O.; Standl, E.; Beulens, J.W. Diabetes as a Cardiovascular Risk Factor: An Overview of Global Trends of Macro and Micro Vascular Complications. Eur. J. Prev. Cardiol. 2019, 26, 25–32. [Google Scholar] [CrossRef]
  72. Münzel, T.; Sørensen, M.; Gori, T.; Schmidt, F.P.; Rao, X.; Brook, J.; Chen, L.C.; Brook, R.D.; Rajagopalan, S. Environmental Stressors and Cardio-Metabolic Disease: Part I–Epidemiologic Evidence Supporting a Role for Noise and Air Pollution and Effects of Mitigation Strategies. Eur. Heart J. 2016, 38, 550–556. [Google Scholar] [CrossRef]
  73. Lipfert, F.W.; Wyzga, R.E. Longitudinal Relationships between Lung Cancer Mortality Rates, Smoking, and Ambient Air Quality: A Comprehensive Review and Analysis. Crit. Rev. Toxicol. 2019, 49, 790–818. [Google Scholar] [CrossRef]
  74. Bade, B.C.; Cruz, C.S.D. Lung Cancer 2020. Clin. Chest Med. 2020, 41, 1–24. [Google Scholar] [CrossRef]
  75. Lequy, E.; Siemiatycki, J.; de Hoogh, K.; Vienneau, D.; Dupuy, J.-F.; Garès, V.; Hertel, O.; Christensen, J.H.; Zhivin, S.; Goldberg, M.; et al. Contribution of Long-Term Exposure to Outdoor Black Carbon to the Carcinogenicity of Air Pollution: Evidence Regarding Risk of Cancer in the Gazel Cohort. Environ. Health Perspect. 2021, 129, 37005. [Google Scholar] [CrossRef] [PubMed]
Figure 1. Distribution of sensors analyzed in Bucharest (www.googlemaps.com, accessed on 1 May 2023).
Atmosphere 14 00867 g001
Figure 2. Monthly evolution of the hospitalizations with respiratory diseases per year (September 2018–December 2021).
Atmosphere 14 00867 g002
Figure 3. Monthly evolution of hospitalizations with cardiovascular diseases per year (September 2018–December 2021).
Atmosphere 14 00867 g003
Table 1. The characteristics of the sensors analyzed in Bucharest during the period 20 August 2018–1 June 2022.
YearTotal Number of SensorsNo. of Sensors with More than 50 Measurements/YearNo. of Sensors Recording DLV Exceedances over 35 Times/Year
2018 (20 August–31 December)161110
2019201710
202061486
2021716114
2022 (1 January–1 June)10668-
Table 2. Sensors with more than 1000 records included in the analysis and the number of days with measurements for PM during the period 20 August 2018–1 June 2022.
Sensor IDNumber of Days with Measurements for PM10Number of Days with Measurements for PM2.5
562913811381
565213791379
608813541354
615613431343
650913111311
984012931293
562811921192
801911551155
Table 3. Daily PM10 records and number of DLV exceedances according to EU legislation for sensors with a number of records more than 1000 during the period 20 August 2018–1 June 2022.
Sensor ID20182019202020212022
NDRNDLVE% DENDRNDLVE% DENDRNDLVE% DENDRNDLVE% DENDRNDLVE% DE
5628134433236548133191862891038500
562913348363657220366431236529815221
565213151393656518366361036532915211
608810653503657420366349365401115221
61569550533657521366371036531815232
6509644570365641836524736522615200
8019---28242153665515355501415275
9840965658314772536633936529815221
NDR—number of daily records; NDLVE—number of DLV exceedances; % DE—share of days with exceedances.
Table 4. Daily PM10 records and number of DLV exceedances according to WHO for sensors with a number of records more than 1000 during the period 20 August 2018–1 June 2022.
Sensor ID20182019202020212022
NDRNDLVE% DENDRNDLVE% DENDRNDLVE% DENDRNDLVE% DENDRNDLVE% DE
5628134564236572203192482891768511
5629133564236589243665415365391115243
5652131614736585233664613365491315221
60881066158365100273664512365531515243
615695606336597273664713365541515232
65096450783659325365349365371015221
8019- - - 28256203666919355661915285
984096636631499323664211365451215232
NDR—number of daily records; NDLVE—number of DLV exceedances; % DE—share of days with exceedances.
Table 5. Comparison between EU/WHO of registrations and exceedances during the period 20 August 2018–1 June 2022.
PM10PM2.5According to EU LegislationAccording to WHO Guidelines
PM10 > 50 μg/m3PM2.5 >25 μg/m3PM10 > 45 μg/m3PM2.5 > 15 μg/m3
No. of sensors1431388610092125
No. of records46,30742,97339818968552622,493
Table 6. The number of days with a level above the admissible limit for the established sensors.
PM10PM2.5
Sensor IDNo. of Exceeded Days % DESensor IDNo. of Exceeded Days% DE
608826319%608883962%
615626119%615682662%
984025219%565279157%
565224318%650979060%
562924218%984077360%
650921616%562975154%
801919917%801967558%
562817014%562866155%
% DE—share of days with exceedances.
Table 7. Distribution of positive differences from the admissible value by sensor and month (PM10).
Year20182019202020212022
Sensor 89101112123456789101112123456789101112123456789101112123456
56280017182124143000001123151921000000101 00000011060001
5629001517242616610000115519235500000021361287000000930121000
565200152125261671000011061821520000001125108800000012101101000
6088 01722222716820000116921245200000019498700000113132211000
6156 01720232517810100113102121530000001134108800100112113111000
6509 226222421930000111717206100000013355300000112101011000
8019 4300001168242695100000317812101000000111166431000
9840 017232328187200001149202042000000111488100000113131111000
No records Atmosphere 14 00867 i001
Table 8. Distribution of positive differences from the admissible values by sensor and month (PM2.5).
Year20182019202020212022
Sensor 89101112123456789101112123456789101112123456789101112123456
562882223292931272421811156122629283018189140011593 91203121511262825212022
5629718242730312729198101541128293030232012140021626263025221502658222721181719700
5652421242831312726197813682428303020219130011425273026232213131611262926252025900
6088 7272931312728211212201015273031302021110410117262830262623031417152829252622271100
6156 2252830312728201114191413272931302220122512417252630252017031520132730252621281100
6509 23131312731241415191315272931312120111300114242427242015031222132728262121291200
8019 7191412171016273031302322133311316292730282620031116182030272823291200
9840 3302931312727208767152830313020191225012192728302680131420132629252421271100
No records Atmosphere 14 00867 i001
Table 9. Option A—using daily measurements for the eight sensors during the period 2019–2021.
PM10
Annual Limit Value 15 µg/m3 (WHO)
PM2.5
Annual Limit Value 5 μg/m3 (WHO)
Average (μg/m3)StdDev (μg/m3)Coefficient of Variation (%)Average (μg/m3)StdDev (μg/m3)Coefficient of Variation (%)
201933.7020.4661%23.0613.3458%
202025.1620.2180%17.3113.2076%
202127.4815.5356%18.299.8854%
Table 10. Option B—using daily measurements resulting from the elimination of outlier values for the eight sensors during the period 2019–2021.
PM10
Annual Limit Value 15 μg/m3 (WHO)
PM2.5
Annual Limit Value 5 μg/m3 (WHO)
Average (μg/m3)StdDev (μg/m3)Coefficient of Variation (%)Average (μg/m3)StdDev (μg/m3)Coefficient of Variation (%)
201930.7415.6251%20.769.3845%
202022.4914.9066%15.349.1460%
202126.6314.0153%17.768.8950%
Table 11. Correlation matrix (Spearman).
VariablesAverage of PM10Average of PM2.5Cardiovascular DiseasesStrokeRespiratory DiseasesAsthmaCOPDDiabetesLung Cancer
Average of PM1010.9880.3340.3740.5140.2900.2720.2510.069
Average of PM2.50.98810.3330.3670.5260.2940.2730.2760.045
Cardiovascular diseases0.3340.33310.7500.3680.9180.9000.9020.259
Stroke0.3740.3670.75010.4300.6550.6400.6810.300
Respiratory diseases0.5140.5260.3680.43010.2230.1970.3710.342
Asthma0.2900.2940.9180.6550.22310.9540.8750.093
COPD0.2720.2730.9000.6400.1970.95410.8450.103
Diabetes0.2510.2760.9020.6810.3710.8750.84510.110
Lung cancer0.0690.0450.2590.3000.3420.0930.1030.1101
Values in bold are different from 0 with a significance level alpha = 0.05.
Table 12. Regression of PM2.5 and number of hospitalizations for respiratory diseases.
Analysis of Variance (Respiratory Diseases):
SourceDFSum of SquaresMean SquaresFPr > F
Model18631133.0978631133.0976.0210.019
Error3854469826.9031433416.497
Corrected total3963100960.000
Computed against model Y = Mean(Y)
Model Parameters (Respiratory Diseases):
SourceValueStandard ErrortPr > |t|Lower Bound (95%)Upper Bound (95%)
Interception2892.873460.6946.279<0.00011960.2473825.500
Average of PM2.551.41120.9512.4540.0198.99893.824
Equation of the model (respiratory diseases): respiratory diseases = 2892.873 + 51.41*average of PM2.5.
Table 13. Regression of PM10 and number of hospitalizations for respiratory diseases.
Analysis of Variance (Respiratory Diseases):
SourceDFSum of SquaresMean SquaresFPr > F
Model19180878.2789180878.2786.4700.015
Error3853920081.7221418949.519
Corrected total3963100960.000
Computed against model Y = Mean(Y)
Model Parameters (Respiratory Diseases):
SourceValueStandard ErrortPr > |t|Lower Bound (95%)Upper Bound (95%)
Interception2917.708437.9776.662<0.00012031.0703804.347
Average of PM1033.61513.2152.5440.0156.86260.369
Equation of the model (respiratory diseases): respiratory diseases = 2917.708 + 33.615*average of PM10.
Table 14. Regression of PM2.5 and number of hospitalizations for cardiovascular diseases.
Analysis of Variance (Cardiovascular Diseases):
SourceDFSum of SquaresMean SquaresFPr > F
Model116416519.92116416519.9214.4220.042
Error38141063981.6793712210.044
Corrected total39157480501.600
Computed against model Y = Mean(Y)
Model Parameters (Cardiovascular Diseases):
SourceValueStandard ErrortPr > |t|Lower Bound (95%)Upper Bound (95%)
Interception4982.227741.3836.720<0.00013481.3766483.079
Average of PM2.570.90333.7162.1030.0422.648139.157
Equation of the model (cardiovascular diseases): cardiovascular diseases = 4982.227 + 70.9023*average of PM2.5.
Table 15. Regression of PM10 and number of hospitalizations for cardiovascular diseases.
Analysis of Variance (Cardiovascular Diseases):
SourceDFSum of SquaresMean SquaresFPr > F
Model116936285.15616936285.1564.5790.039
Error38140544216.4443698532.012
Corrected Total39157480501.600
Computed against model Y = Mean(Y)
Model Parameters (Cardiovascular Diseases):
SourceValueStandard ErrortPr > |t|Lower Bound (95%)Upper Bound (95%)
Interception5037.524707.1037.124<0.00013606.0686468.979
Average of PM1045.65721.3362.1400.0392.46588.849
Equation of the model (cardiovascular diseases): cardiovascular diseases = 5037.524 + 45.657*average of PM10.
Table 16. Regression of PM2.5 and number of hospitalizations for stroke.
Analysis of Variance (Stroke)
SourceDFSum of SquaresMean SquaresFPr > F
Model1896.391896.3914.8960.033
Error386957.209183.084
Corrected total397853.600
Computed against model Y = Mean(Y)
Model Parameters (Stroke):
SourceValueStandard ErrortPr > |t|Lower Bound (95%)Upper Bound (95%)
Interception60.8975.20711.696<0.000150.35771.437
Average of PM2.50.5240.2372.2130.0330.0451.003
Equation of the model (Stroke): Stroke = 60.897 + 0.524*average of PM2.5.
Table 17. PM2.5 vs. PM10 scenarios (minimum and maximum for daily values).
PM2.5 ScenariosPM10 Scenarios
Number of Admissions of Persons with:Optimistic Pessimistic Optimistic Pessimistic
Minimum Value
0.48 µg/m3
Maximum Value
47.15 µg/m3
Minimum Value
0.71 µg/m3
Maximum Value
73.22 µg/m3
Respiratory diseases2918531729425379
Cardiovascular diseases5016832550708381
Cerebrovascular diseases61866187
The maximum values for both suspended particles in the pessimistic scenario (PM2.5 = 47.15 µg/m3 and PM10 = 73.22 µg/m3) were found to be significantly higher than the DLV in WHO guidelines (PM2.5 = 15 µg/m3 and PM10 = 45 µg/m3).
Table 18. PM2.5 vs. PM10 scenarios (minimum and maximum of monthly average values).
PM2.5 ScenariosPM10 Scenarios
Number of Admissions of Persons with:Optimistic Pessimistic Optimistic Pessimistic
Minimum Monthly Value
8.258 µg/m3
Maximum Monthly Value
41.488 µg/m3
Minimum Monthly Value
11.728 µg/m3
Maximum Monthly Value
64.667 µg/m3
Respiratory diseases3317502433125092
Cardiovascular diseases5568792155737990
Cerebrovascular diseases65836584
Disclaimer/Publisher’s Note: The statements, opinions and data contained in all publications are solely those of the individual author(s) and contributor(s) and not of MDPI and/or the editor(s). MDPI and/or the editor(s) disclaim responsibility for any injury to people or property resulting from any ideas, methods, instructions or products referred to in the content.

