

Applications of CNOP-P Method to Predictability Studies of Terrestrial Ecosystems
Abstract
:1. Introduction
2. Results of Reviews
2.1. The Impact of Moisture Index Perturbation on the Stability of Grassland Ecosystem Equilibrium
2.2. The Impact of Uncertainties in Climate Change on the Uncertainties in Simulated Terrestrial Ecosystems

| Sources of Uncertainty | Descriptions/Limitations | Reference |
|---|---|---|
| Moisture index | Stability analysis of grassland ecosystem equilibrium was shown due to moisture index perturbation using CNOP-P method. A theoretical model was employed. | Sun and Mu [43] |
| Climate condition | Uncertainties in simulated soil carbon due to temperature and precipitation perturbations were estimated using the CNOP-P method. | Sun and Mu [45] |
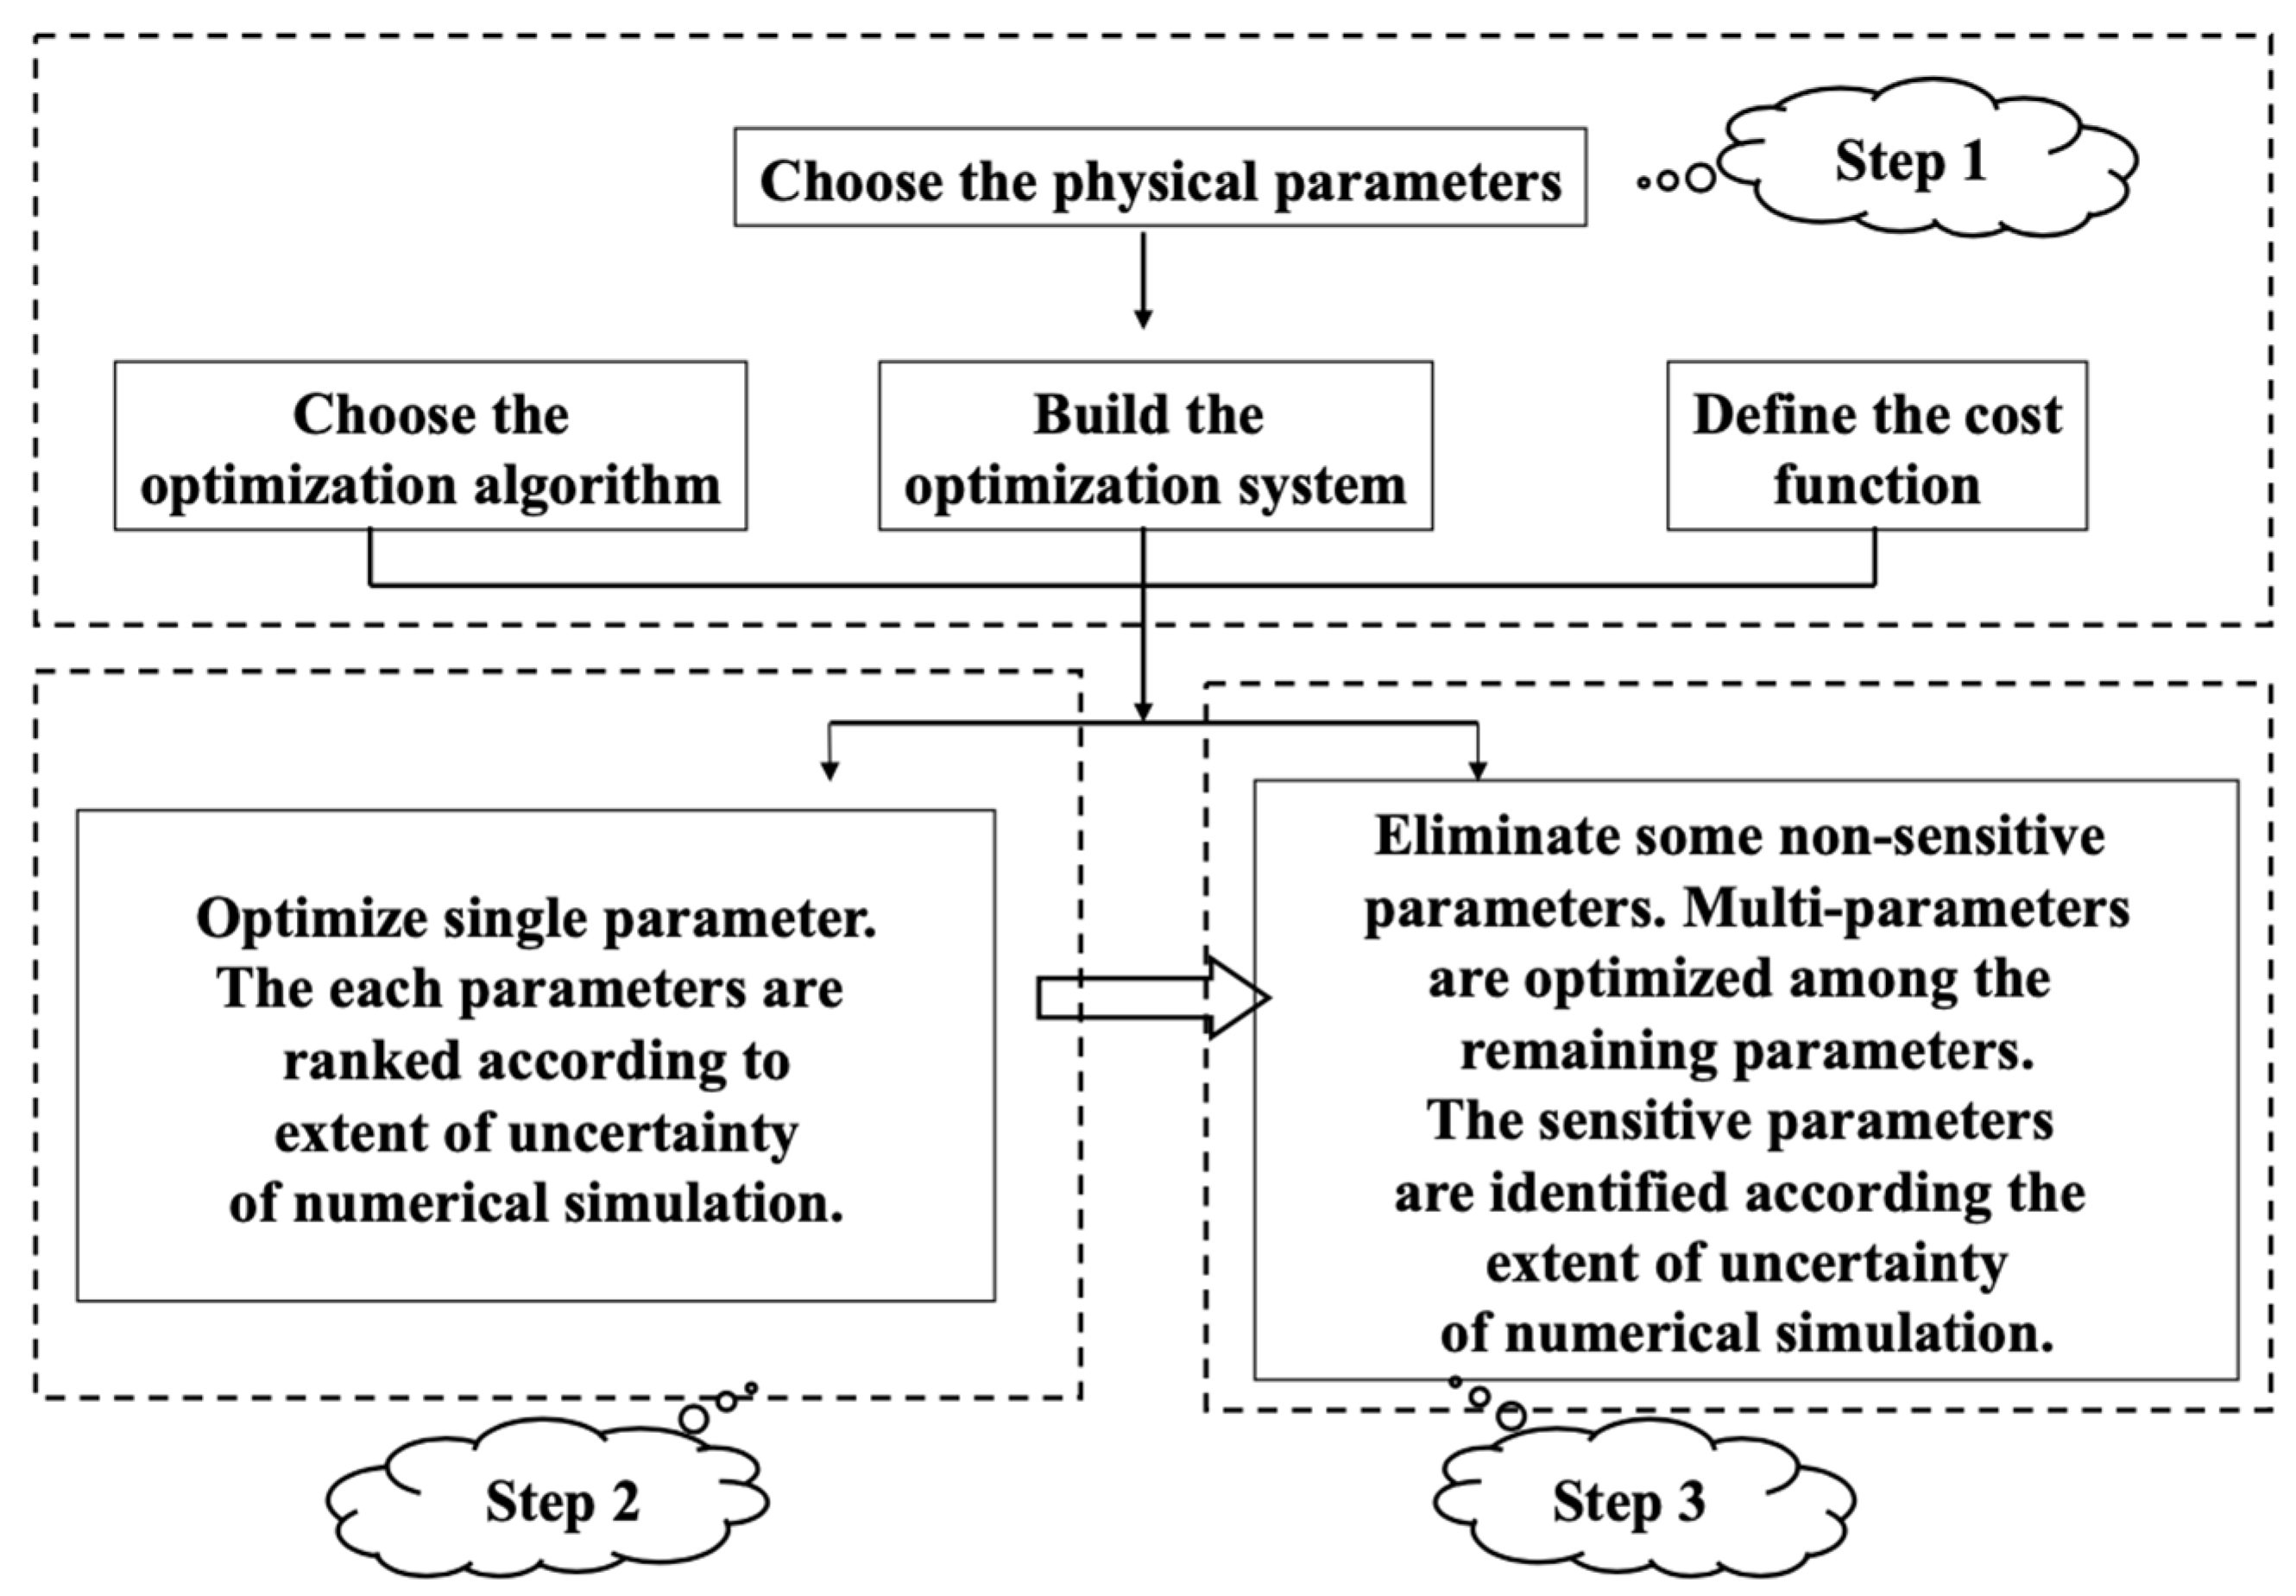
| Physical parameters | A new parameter sensitivity analysis method based on CNOP-P was proposed. The new method was applied to identify the most sensitive physical parameters set to uncertainties in simulated NPP in China. The improvement extent by reducing the errors of sensitive physical parameters set determined by the new method was evaluated. | Sun and Mu [46] |
| Physical parameters | The new parameter sensitivity analysis method based on CNOP-P was applied to identify the most sensitive physical parameters set to uncertainties in simulated soil carbon in China. | Sun and Mu [47] |
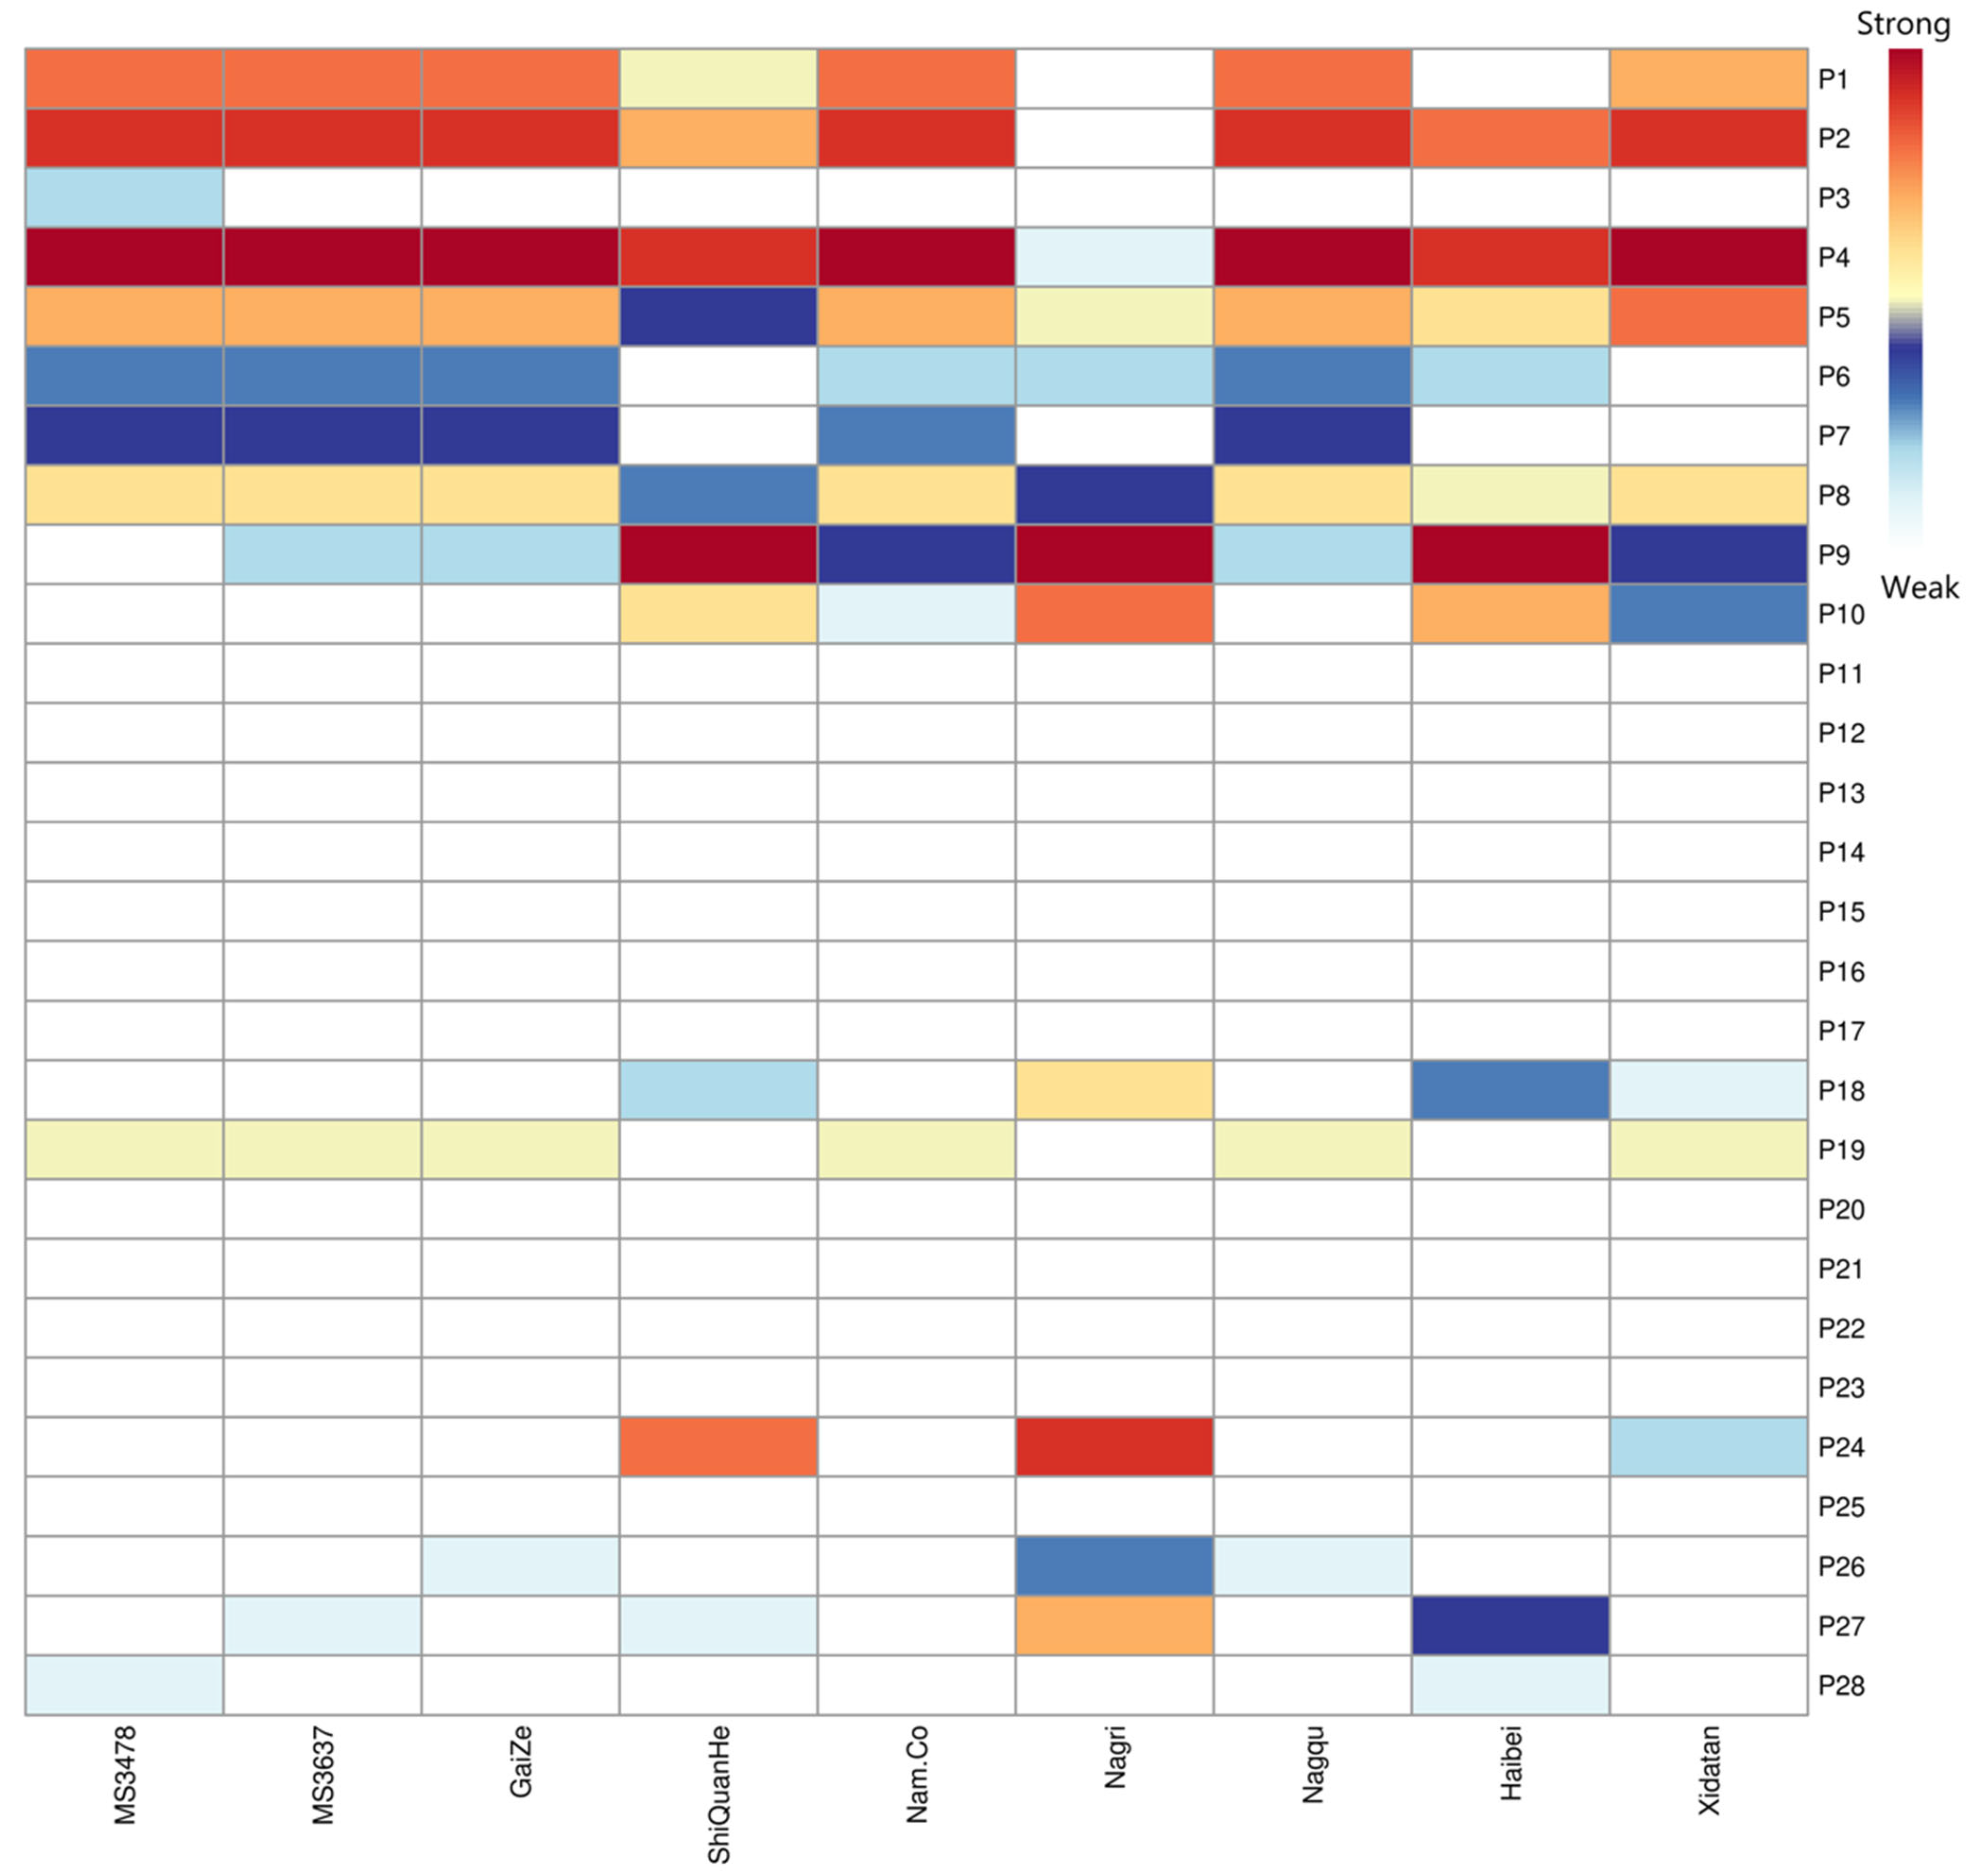
| Physical parameters | The new parameter sensitivity analysis method based on CNOP-P was applied to identify the most sensitive physical parameters set to uncertainties in simulated ET over the TP. The improvement extent by reducing the errors of sensitive physical parameters set determined by the new method was evaluated. | Sun et al. [48] |
2.3. The Impact of Uncertainties in Physical Parameters on the Terrestrial Ecosystem
2.3.1. The Sensitivity Analysis Method Based on CNOP-P
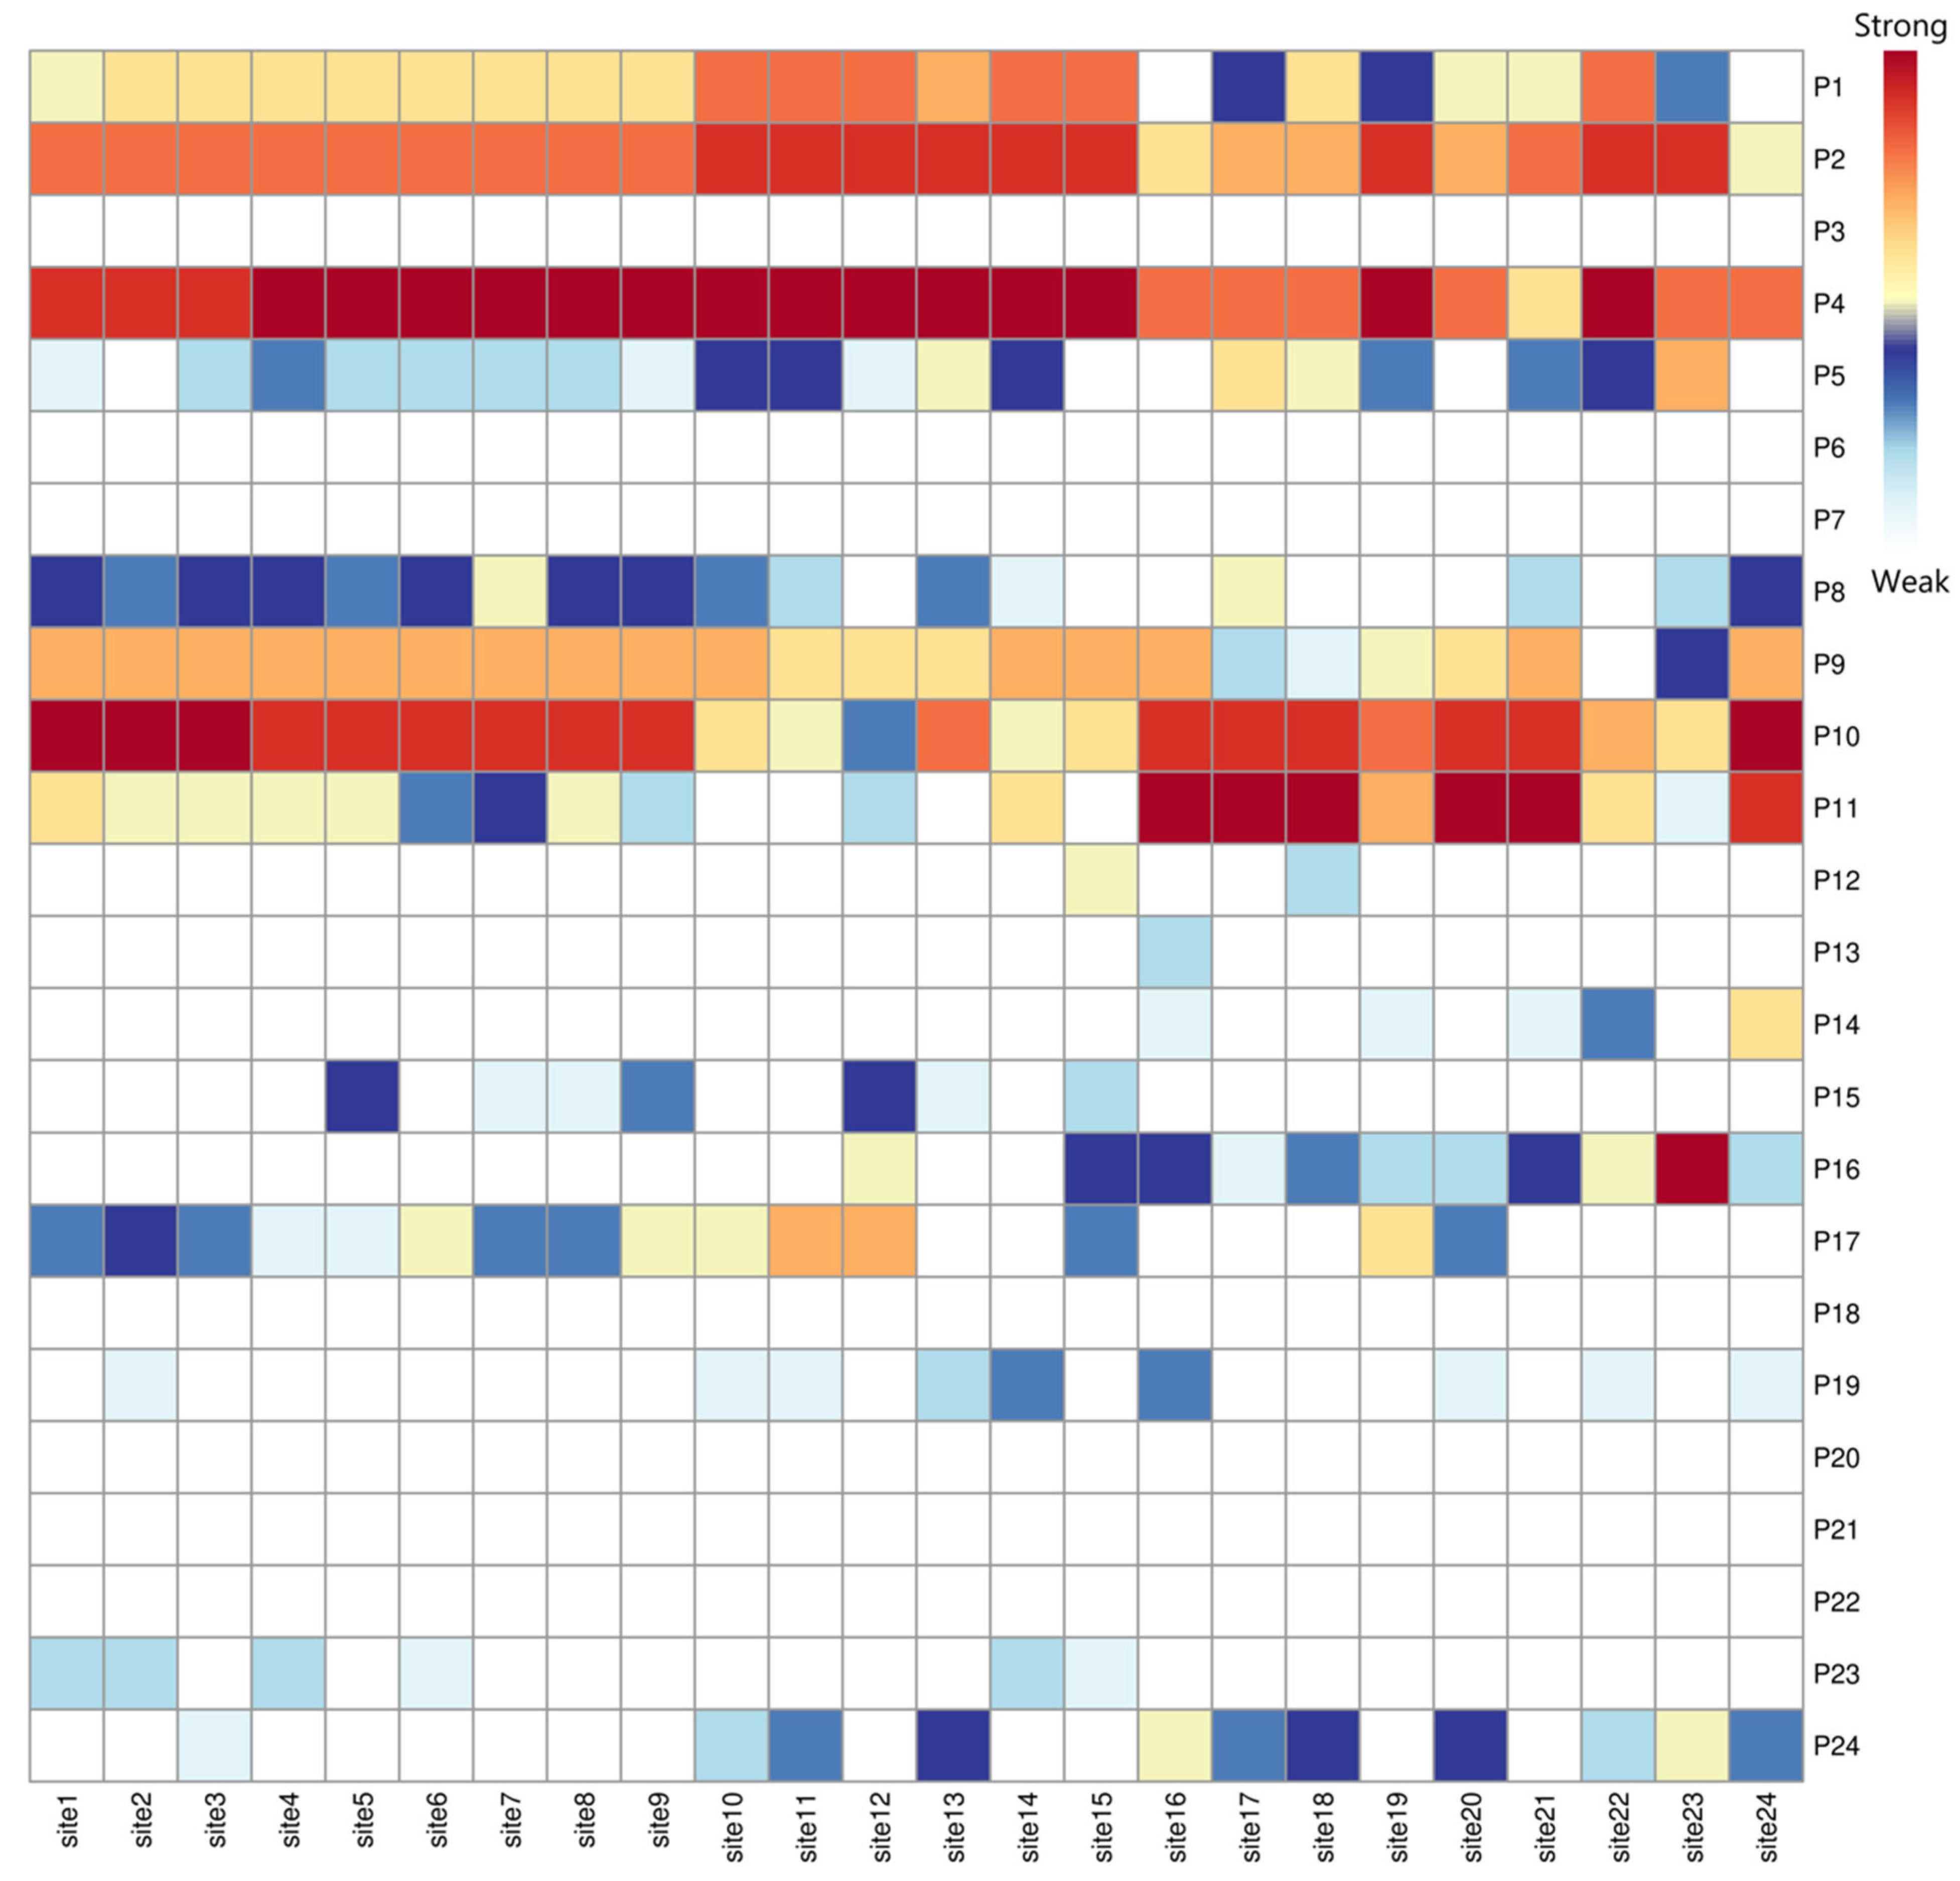
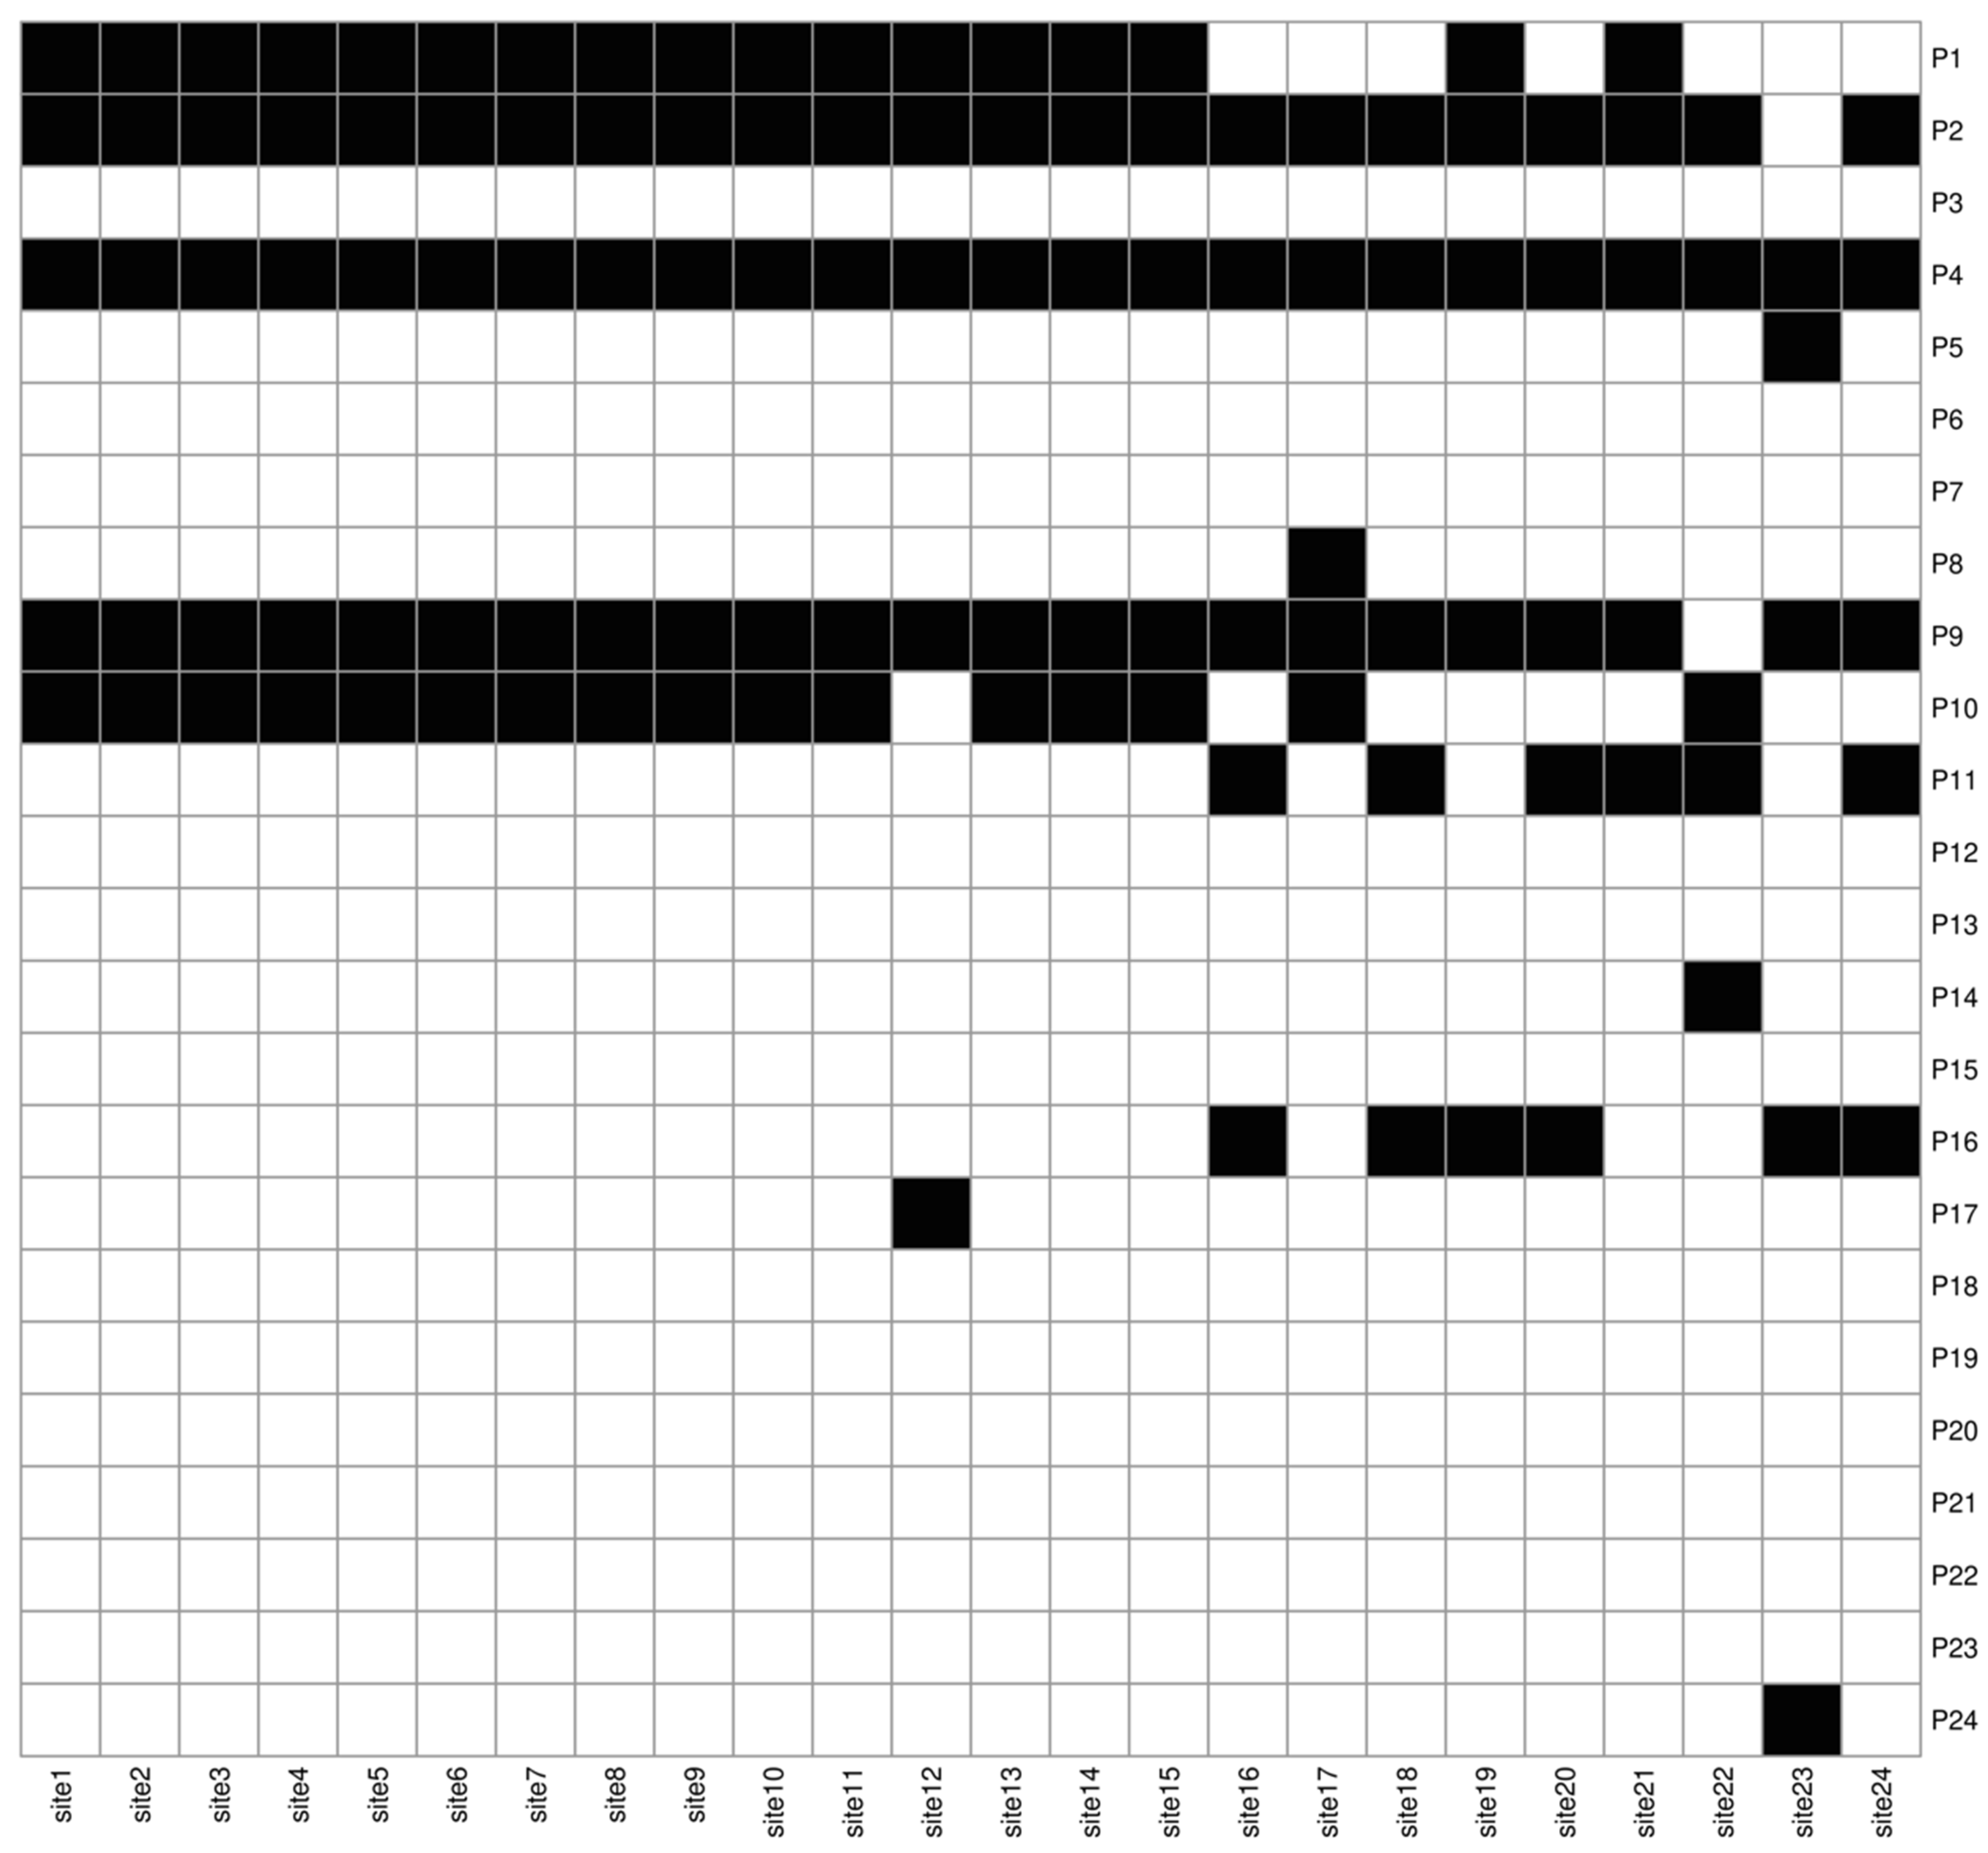
2.3.2. Identification of Sensitive Physical Parameters
2.3.3. Evaluation of Simulation Ability and Prediction Skill by Reducing the Errors of Sensitive Physical Parameters
3. Discussion
4. Conclusions
Supplementary Materials
Author Contributions
Funding
Institutional Review Board Statement
Informed Consent Statement
Data Availability Statement
Acknowledgments
Conflicts of Interest
References
- Yuan, Q.; Wu, S.; Zhao, D.; Dai, E.; Chen, L.; Zhang, L. Modeling net primary productivity of the terrestrial ecosystem in China from 1961 to 2005. J. Geogr. Sci. 2014, 24, 3–17. [Google Scholar] [CrossRef]
- Chen, Z.; Chen, J.M.; Zheng, X.; Jiang, F.; Qin, J.; Zhang, S.; Yuan, W.; Ju, W.; Mo, G. Optimizing photosynthetic and respiratory parameters based on the seasonal variation pattern in regional net ecosystem productivity obtained from atmospheric inversion. Sci. Bull. 2015, 60, 1943–1950. [Google Scholar] [CrossRef] [Green Version]
- Friedlingstein, P.; Jones, M.W.; O’Sullivan, M.; Andrew, R.M.; Hauck, J.; Peters, G.P.; Peters, W.; Pongratz, J.; Sitch, S.; Le Quéré, C.; et al. Global Carbon Budget 2019. Earth Syst. Sci. Data 2019, 11, 1783–1838. [Google Scholar] [CrossRef] [Green Version]
- Tian, H.; Melillo, J.; Lu, C.; Kicklighter, D.; Liu, M.; Ren, W.; Xu, X.; Chen, G.; Zhang, C.; Pan, S.; et al. China’s terrestrial carbon balance: Contributions from multiple global change factors. Glob. Biogeochem. Cycles 2011, 25, GB1007. [Google Scholar] [CrossRef] [Green Version]
- Luo, Y.; Keenan, T.F.; Smith, M. Predictability of the terrestrial carbon cycle. Glob. Change Biol. 2015, 21, 1737–1751. [Google Scholar] [CrossRef] [Green Version]
- Roberts, A.M.I.; Tansey, C.; Smithers, R.J.; Phillimore, A.B. Predicting a change in the order of spring phenology in temperate forests. Glob. Change Biol. 2015, 21, 2603–2611. [Google Scholar] [CrossRef] [Green Version]
- Tagesson, T.; Schurgers, G.; Horion, S.; Ciais, P.; Tian, F.; Brandt, M.; Ahlström, A.; Wigneron, J.-P.; Ardö, J.; Olin, S.; et al. Recent divergence in the contributions of tropical and boreal forests to the terrestrial carbon sink. Nat. Ecol. Evol. 2020, 4, 202–209. [Google Scholar] [CrossRef] [PubMed]
- Liddicoat, S.K.; Wiltshire, A.J.; Jones, C.D.; Arora, V.K.; Brovkin, V.; Cadule, P.; Hajima, T.; Lawrence, D.M.; Pongratz, J.; Schwinger, J.; et al. Compatible fossil fuel CO2 emissions in the CMIP6 earth system models’ historical and shared socioeconomic pathway experiments of the twenty-first century. J. Clim. 2021, 34, 2853–2875. [Google Scholar] [CrossRef]
- Lawrence, D.M.; Fisher, R.A.; Koven, C.D.; Oleson, K.W.; Swenson, S.C.; Bonan, G.; Collier, N.; Ghimire, B.; van Kampenhout, L.; Kennedy, D.; et al. The community land model version 5: Description of new features, benchmarking, and impact of forcing uncertainty. J. Adv. Model. Earth Syst. 2019, 11, 4245–4287. [Google Scholar] [CrossRef] [Green Version]
- Lombardozzi, D.L.; Lu, Y.; Lawrence, P.J.; Lawrence, D.M.; Swenson, S.; Oleson, K.W.; Wieder, W.R.; Ainsworth, E.A. Simulating agriculture in the community land model version 5. J. Geophys. Res. Biogeosci. 2020, 125, e2019JG005529. [Google Scholar] [CrossRef]
- Xia, J.; Chen, J.; Piao, S.; Ciais, P.; Luo, Y.; Wan, S. Terrestrial carbon cycle affected by non-uniform climate warming. Nat. Geosci. 2014, 7, 173–180. [Google Scholar] [CrossRef]
- Shen, X.; Jiang, M.; Lu, X.; Liu, X.; Liu, B.; Zhang, J.; Wang, X.; Tong, S.; Lei, G.; Wang, S.; et al. Aboveground biomass and its spatial distribution pattern of herbaceous marsh vegetation in China. Sci. China Earth Sci. 2021, 64, 1115–1125. [Google Scholar] [CrossRef]
- Shen, X.; Liu, B.; Henderson, M.; Wang, L.; Jiang, M.; Lu, X. Vegetation Greening, Extended Growing Seasons, and Temperature Feedbacks in Warming Temperate Grasslands of China. J. Clim. 2022, 35, 5103–5117. [Google Scholar] [CrossRef]
- Post, J.; Hattermann, F.F.; Krysanova, V.; Suckow, F. Parameter and input data uncertainty estimation for the assessment of long-term soil organic carbon dynamics. Environ. Model. Softw. 2008, 23, 125–138. [Google Scholar] [CrossRef]
- Cao, M.K.; Prince, S.D.; Li, K.R.; Tao, B.; Small, J.; Shao, X.M. Response of terrestrial carbon uptake to climate interannual variability in China. Glob. Chang. Biol. 2003, 9, 536–546. [Google Scholar] [CrossRef]
- Botta, A.; Foley, J.A. Effects of climate variability and disturbances on the Amazonian terrestrial ecosystem dynamics. Glob. Biogeochem. Cycles 2002, 16, 1070. [Google Scholar] [CrossRef] [Green Version]
- Mitchell, S.W.; Csillag, F. Assessing the stability and uncertainty of predicted vegetation growth under climatic variability: Northern mixed grass prairie. Ecol. Model. 2001, 139, 101–121. [Google Scholar] [CrossRef]
- Zaghloul, M.S.; Ghaderpour, E.; Dastour, H.; Farjad, B.; Gupta, A.; Eum, H.; Achari, G.; Hassan, Q.K. Long Term Trend Analysis of River Flow and Climate in Northern Canada. Hydrology 2022, 9, 197. [Google Scholar] [CrossRef]
- Li, Z.; Wu, Y.; Wang, R.; Liu, B.; Qian, Z.; Li, C. Assessment of Climatic Impact on Vegetation Spring Phenology in Northern China. Atmosphere 2023, 14, 117. [Google Scholar] [CrossRef]
- Dastour, H.; Ghaderpour, E.; Zaghloul, M.S.; Farjad, B.; Gupta, A.; Eum, H.; Achari, G.; Hassan, Q.K. Wavelet-based spatiotemporal analyses of climate and vegetation for the Athabasca river basin in Canada. Int. J. Appl. Earth Obs. Geoinf. 2022, 114, 103044. [Google Scholar] [CrossRef]
- Wang, S.; Tian, H.; Liu, J.; Pan, S. Pattern and change of soil organic carbon storage in China: 1960s–1980s. Tellus B 2003, 55, 416–427. [Google Scholar] [CrossRef]
- Eglin, T.; Ciais, P.; Piao, S.L.; Barre, P.; Bellassen, V.; Cadule, P.; Chenu, C.; Gasser, T.; Koven, C.; Reichstein, M.; et al. Historical and future perspectives of global soil carbon response to climate and land-use changes. Tellus B 2010, 62, 700–718. [Google Scholar] [CrossRef] [Green Version]
- Pan, Z.; Andrade, D.; Segal, M.; Wimberley, J.; McKinney, N.; Takle, E.S. Uncertainty in future soil carbon trends at a central U.S. site under an ensemble of GCM scenario climates. Ecol. Model. 2010, 221, 876–881. [Google Scholar] [CrossRef]
- Rayner, P.J.; Scholze, M.; Knorr, W.; Kaminski, T.; Giering, R.; Widmann, H. Two decades of terrestrial carbon fluxes from a carbon cycle data assimilation system (CCDAS). Glob. Biogeochem. Cycles 2005, 19, GB2026. [Google Scholar] [CrossRef] [Green Version]
- Mo, X.; Chen, J.M.; Ju, W.; Black, T.A. Optimization of ecosystem model parameters through assimilating eddy covariance flux data with an ensemble Kalman filter. Ecol. Model. 2008, 217, 157–173. [Google Scholar] [CrossRef]
- Sitch, S.; Smith, B.; Prentice, I.C.; Arneth, A.; Bondeau, A.; Cramer, W.; Kaplan, J.O.; Levis, S.; Lucht, W.; Sykes, M.T.; et al. Evaluation of ecosystem dynamics, plant geography and terrestrial carbon cycling in the LPJ dynamic vegetation model. Glob. Chang. Biol. 2003, 9, 161–185. [Google Scholar] [CrossRef]
- Collatz, G.J.; Berry, J.A.; Farquhar, G.D.; Pierce, J. The relationship between the Rubisco reaction mechanism and models of photosynthesis. Plant Cell Environ. 1990, 13, 219–225. [Google Scholar] [CrossRef]
- Zaehle, S.; Sitch, S.; Smith, B.; Hatterman, F. Effects of parameter uncertainties on the modeling of terrestrial biosphere dynamics. Glob. Biogeochem. Cycles 2005, 19, GB3020. [Google Scholar] [CrossRef]
- Pitman, A.J. Assesing the sensitivity of a land-surface scheme to the parameter values using a single column model. J. Clim. 1994, 7, 1856–1869. [Google Scholar] [CrossRef]
- Jackson, C.; Xia, Y.; Sen, M.K.; Stoffa, P.L. Optimal parameter and uncertainty estimation of a land surface model: A case study using data from Cabauw, Netherlands. J. Geophys. Res. 2003, 108, 4583. [Google Scholar] [CrossRef] [Green Version]
- Bastidas, L.A.; Hogue, T.S.; Sorooshian, S.; Gupta, H.V.; Shuttleworth, W.J. Parameter sensitivity analysis for different complexity land surface models using multicriteria methods. J. Geophys. Res. 2006, 111, D20101. [Google Scholar] [CrossRef] [Green Version]
- Henderson-Sellers, A. Assessing the Sensitivity of a Land-Surface Scheme to Parameters Used In Tropical-Deforestation Experiments. Q.J.R. Meteorol. Soc. 1992, 118, 1101–1116. [Google Scholar] [CrossRef]
- Bastidas, L.A.; Gupta, H.V.; Sorooshian, S.; Shuttleworth, W.J.; Yang, Z.L. Sensitivity analysis of a land surface scheme using multicriteria methods. J. Geophys. Res. 1999, 104, 19481–19490. [Google Scholar] [CrossRef] [Green Version]
- Mu, M.; Duan, W.S.; Wang, B. Conditional nonlinear optimal perturbation and its applications. Nonlinear. Proc. Geoph. 2003, 10, 493–501. [Google Scholar] [CrossRef]
- Mu, M.; Duan, W.S.; Wang, Q.; Zhang, R. An extension of conditional nonlinear optimal perturbation approach and its applications. Nonlinear Proc. Geoph 2010, 17, 211–220. [Google Scholar] [CrossRef]
- Mu, M.; Xu, H.; Duan, W.S. A kind of initial errors related to spring predictability barrier for El Niño events in Zebiak-Cane model. Geophys. Res. Lett. 2007, 34, L03709. [Google Scholar] [CrossRef]
- Mu, M.; Jiang, Z.N. A method to find perturbations that trigger blocking onset: Conditional nonlinear optimal perturbations. J. Atmos. Sci. 2008, 65, 3935–3946. [Google Scholar] [CrossRef]
- Mu, M.; Zhou, F.F.; Wang, H.L. A method for identifying the sensitive areas in targeted observations for tropical cyclone prediction: Conditional nonlinear optimal perturbation. Mon. Weather Rev. 2009, 137, 1623–1639. [Google Scholar] [CrossRef] [Green Version]
- Mu, M.; Duan, W.S.; Tang, Y.M. The predictability of atmospheric and oceanic motions: Retrospect and prospects. Sci. China Earth Sci. 2017, 60, 2001–2012. [Google Scholar] [CrossRef]
- Wang, Q.; Mu, M.; Sun, G.D. A useful approach to sensitivity and predictability studies in geophysical fluid dynamics: Conditional non-linear optimal perturbation. Natl. Sci. Rev. 2019, 7, 214–223. [Google Scholar] [CrossRef] [Green Version]
- Mu, M. Methods, current status, and prospect of targeted observation. Sci. China Earth Sci. 2013, 56, 1997–2005. [Google Scholar] [CrossRef]
- Mu, M.; Wang, Q. Applications of nonlinear optimization approach to atmospheric and oceanic sciences. Sci. Sin. Math. 2017, 47, 1207–1222. (In Chinese) [Google Scholar] [CrossRef] [Green Version]
- Sun, G.D.; Mu, M. Response of a grassland ecosystem to climate change in a theoretical model. Adv. Atmos. Sci. 2011, 28, 1266–1278. [Google Scholar] [CrossRef]
- Lal, R. Soil carbon sequestration impacts on global climate change and food security. Science 2004, 304, 1623–1627. [Google Scholar] [CrossRef] [PubMed] [Green Version]
- Sun, G.D.; Mu, M. Responses of soil carbon variation to climate variability in China using the LPJ model. Theor. Appl. Climatol. 2012, 110, 143–153. [Google Scholar] [CrossRef]
- Sun, G.D.; Mu, M. A new approach to identify the sensitivity and importance of physical parameters combination within numerical models, using the Lund–Potsdam–Jena (LPJ) model as an example. Theor. Appl. Climatol. 2017, 128, 587–601. [Google Scholar] [CrossRef] [Green Version]
- Sun, G.D.; Mu, M. A flexible method to determine the sensitive physical parameter combination for soil carbon under five plant types. Ecosphere 2017, 8, e01920. [Google Scholar] [CrossRef]
- Sun, G.; Mu, M.; You, Q. Identification of key physical processes and improvements for simulating and predicting net primary production over the Tibetan Plateau. J. Geophys. Res. Atmos. 2020, 125, e2020JD033128. [Google Scholar] [CrossRef]


Disclaimer/Publisher’s Note: The statements, opinions and data contained in all publications are solely those of the individual author(s) and contributor(s) and not of MDPI and/or the editor(s). MDPI and/or the editor(s) disclaim responsibility for any injury to people or property resulting from any ideas, methods, instructions or products referred to in the content. |
© 2023 by the authors. Licensee MDPI, Basel, Switzerland. This article is an open access article distributed under the terms and conditions of the Creative Commons Attribution (CC BY) license (https://creativecommons.org/licenses/by/4.0/).
Share and Cite
Sun, G.; Mu, M. Applications of CNOP-P Method to Predictability Studies of Terrestrial Ecosystems. Atmosphere 2023, 14, 617. https://doi.org/10.3390/atmos14040617
Sun G, Mu M. Applications of CNOP-P Method to Predictability Studies of Terrestrial Ecosystems. Atmosphere. 2023; 14(4):617. https://doi.org/10.3390/atmos14040617
Chicago/Turabian StyleSun, Guodong, and Mu Mu. 2023. "Applications of CNOP-P Method to Predictability Studies of Terrestrial Ecosystems" Atmosphere 14, no. 4: 617. https://doi.org/10.3390/atmos14040617