Article

Responses of Picea meyeri to Climatic Factors Revealed by Tree Ring Isotopes and Water Use Efficiency on Luya Mountain of North-Central China

1
College of Urban and Environmental Sciences, Northwest University, Xi’an 710127, China
2
Shaanxi Key Laboratory of Earth Surface System and Environment Carrying Capacity, Northwest University, Xi’an 710127, China
*
Author to whom correspondence should be addressed.
Atmosphere 2023, 14(4), 615; https://doi.org/10.3390/atmos14040615
Submission received: 17 February 2023 / Revised: 16 March 2023 / Accepted: 23 March 2023 / Published: 24 March 2023
(This article belongs to the Special Issue Paleoclimate Reconstruction)

Abstract

:
Along with tree ring width, carbon isotopes are also good proxies for climate change. Water use efficiency (WUE) can be calculated more quickly and accurately based on carbon isotopes. In this study, according to the principle of dendroclimatology, the sequence of δ13C and WUE of tree rings of Picea meyeri are built. Pearson correlation analysis and multiple regression analysis are used to explore the response of carbon stable isotopes of Picea meyeri to climate change, which revealed the relationship between δ13C of Picea meyeri and climatic factors. Based on δ13C, we calculated the WUE of Picea meyeri and analyzed its response to climate change. The main conclusions are as follows: (1) The δ13C of Picea meyeri decreases year-by-year from 1957 to 2020, in the range from −23.89‰~−21.67‰, and the average value is −22.67‰. The water use efficiency of Picea meyeri increases in the range from 17.26~61.31, with an average of 39.45. (2) The δ13C of Picea meyeri is negatively correlated with temperature, which has the highest correlation with the temperature of the growing season (c5–c9), and its coefficient is higher than that of the mean temperature of each month. (3) There is a significant positive correlation between WUE sequence and temperature. Meanwhile, due to the effect of precipitation and temperature, the Picea meyeri is subject to drought stress to some extent. Above all, temperature is the main climatic factor affecting the δ13C and WUE of Picea meyeri on Luya mountain.

1. Introduction

Picea meyeri is a unique and special tree species in China, which is distributed mostly throughout north-central China. The Taiga Forest of Picea meyeri, Larix principis-rupprechtii and Pinus tabulaeformis are distributed throughout the area of Luya Mountain above 2000 m [1]. At present, studies on tree-ring δ13C are concentrated in northwest China and southwest China, especially the upper limit of the forest in the arid region of northwest China [2,3,4,5,6]. There are few studies on tree-ring δ13C in north-central China. The previous research on the response of Picea meyeri to climate change on Luya mountain are based on the width of the tree ring and earlywood and latewood [1,7,8,9,10].
Compared with tree ring width, the stable isotopes of tree rings are less affected by age change and sensitivity to climate change [11]. Only some tree species have “juvenile effect”, which δ13C increases with age in the first 20 years [2], and no “juvenile effect” was observed in δ18O, δD [12]. Earlier studies mostly used whole wood directly for stable carbon isotope ratio (δ13C) determination. Some results show that the expression of climate information by δ13C is affected by different wood components and the change in proportion [13,14,15]. However, the C in α-cellulose remained relatively stable after fractionation in the carbon fixation process of photosynthesis, and it also has a single composition, stable structure and more climate information, which gradually replaced whole wood for isotope determination [16,17].
Earlier studies focused on atmospheric CO2 concentration variation calculated by δ13C [18], and subsequent studies mostly focused on the response of δ13C to climate change [19]. Carbon isotope studies in China developed later than other countries. Li et al. obtained the evidence of the change in atmospheric CO2 concentration from δ13C of Pinus tabuliformis in the 1990s, which was the first study on tree ring carbon isotopes in China [20]. Since then, studies on stable carbon isotopes of tree rings in China have developed rapidly. Chen et al. analyzed the effect of atmospheric CO2 on tree rings δ13C of Picea schrenkiana [3], Picea crassifolia [4] and Sabina przewalskii [5] and their response to climate change. Xu et al. [21] found that Pinus koraiensis δ13C in northeast China showed a significant negative correlation with low cloud cover during the period of strong light from May to July. Meanwhile, power spectrum analysis showed that the El Niño–Southern Oscillation and East Asian monsoon had a positive periodic effect on Pinus koraiensis δ13C [21]. Liu et al. [22] concluded that in the Greater Khingan Mountains region, temperature and humidity from July–September have a stronger influence on Larix gmelinii δ13C than that of Pinus sylvestris.
The δ13C can also be used to study the WUE of trees, which provides evidence for the water–carbon coupling of forest under climate change [23]. In ecology, WUE is expressed as the ratio of net primary productivity (NPP) to total evapotranspiration (ET) of an ecosystem [24]. WUE can be used as an important parameter to characterize the photosynthesis and transpiration of plants, which has attracted much attention in the academic world. However, traditional methods to calculate WUE, such as harvest, photosynthesizer and microweather method, are limited due to unreliable data and more destruction to vegetation [25]. Using stable carbon isotopes to calculate WUE directly shows the quantitative relationship between photosynthetic intensity and stomatal conductance [26]. Most of the current studies on WUE use leaf δ13C and a few use tree ring δ13C, which have proved that the increase in temperature in the growing season would lead to the increase in WUE, which would promote the growth of trees to some extent [27,28]. However, the WUE of Populus euphratica is negatively correlated with temperature in arid areas [29]. Some shrubs, such as Encelia frutescens and Ambrosia salsola, had significant effects on annual precipitation and CO2 concentration [30].
In the context of climate warming, it is very important to study the response of trees to climate change using multiple indicators. The study of the Picea meyeri response to climate change on Luya Mountain by using the stable isotopes of tree rings is yet to be reported. δ13C of tree rings is different from that of tree ring width, which contains more accurate and precise climate information. δ13C can be used to calculate WUE accurately and quickly. The δ13C and WUE of Picea meyeri are measured and analyzed in this paper, which can be used to explore the response to climate change. This study has certain reference value for studying forest dynamics and forest management in north-central China under the global warming trend.

2. Materials and Methods

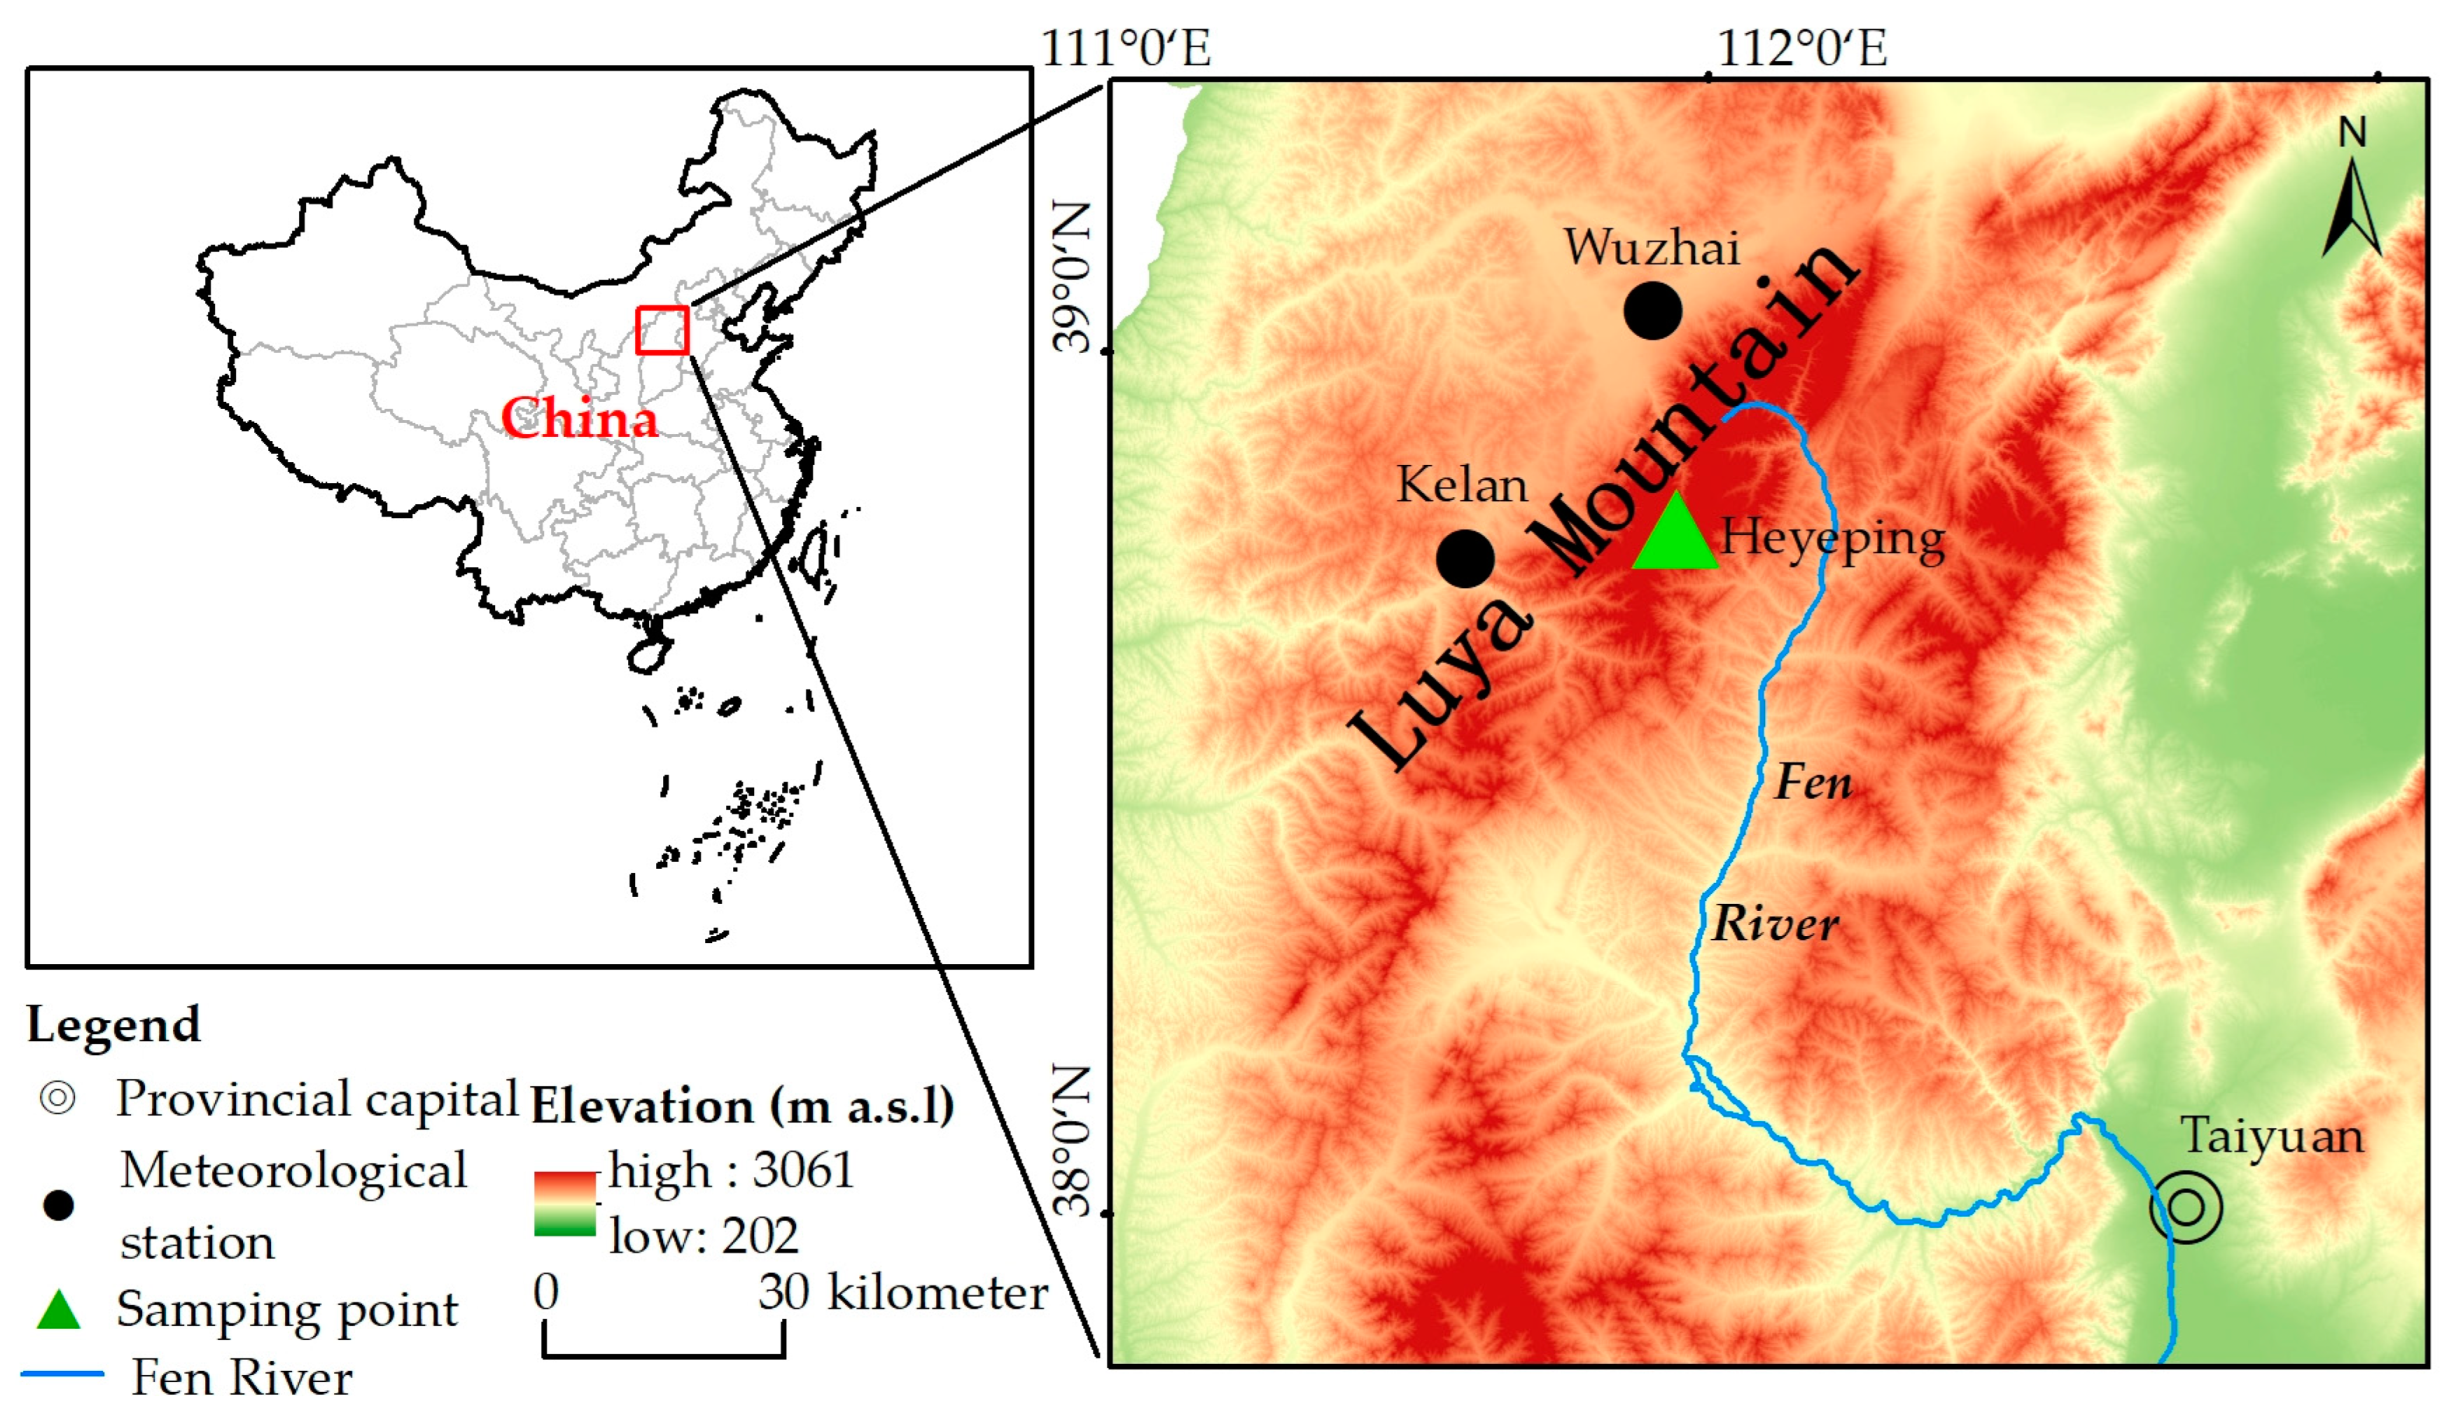
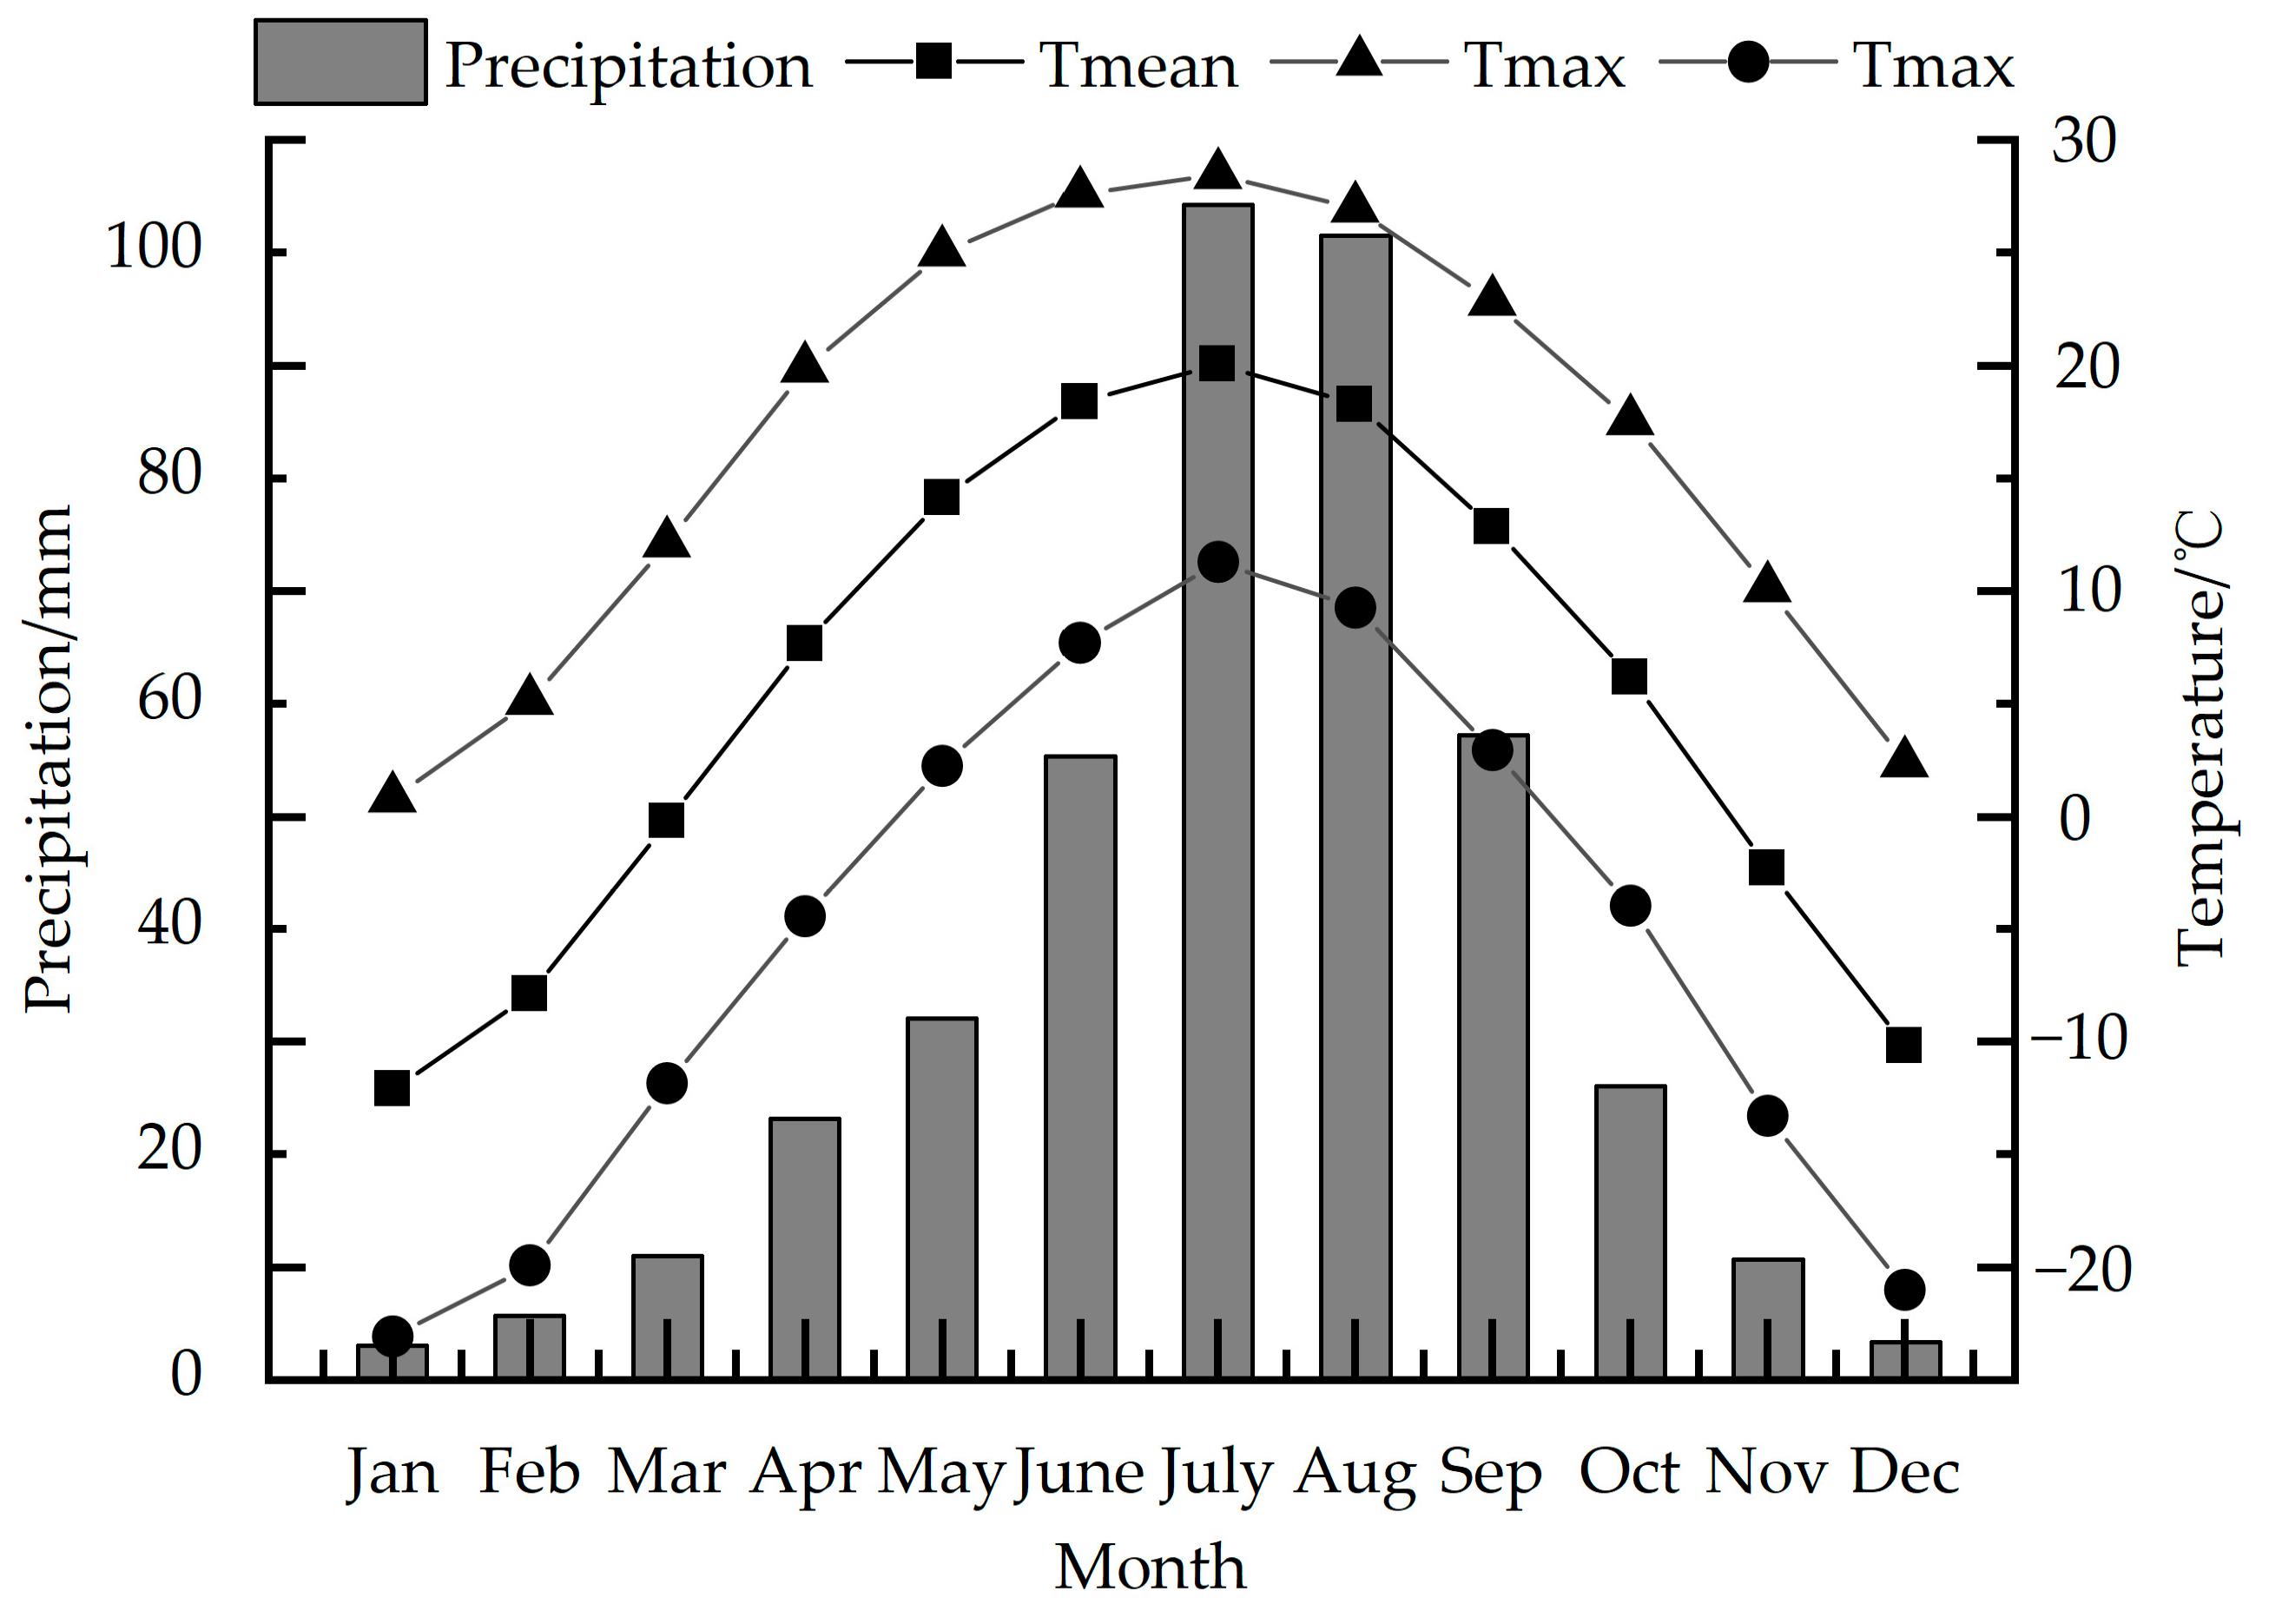
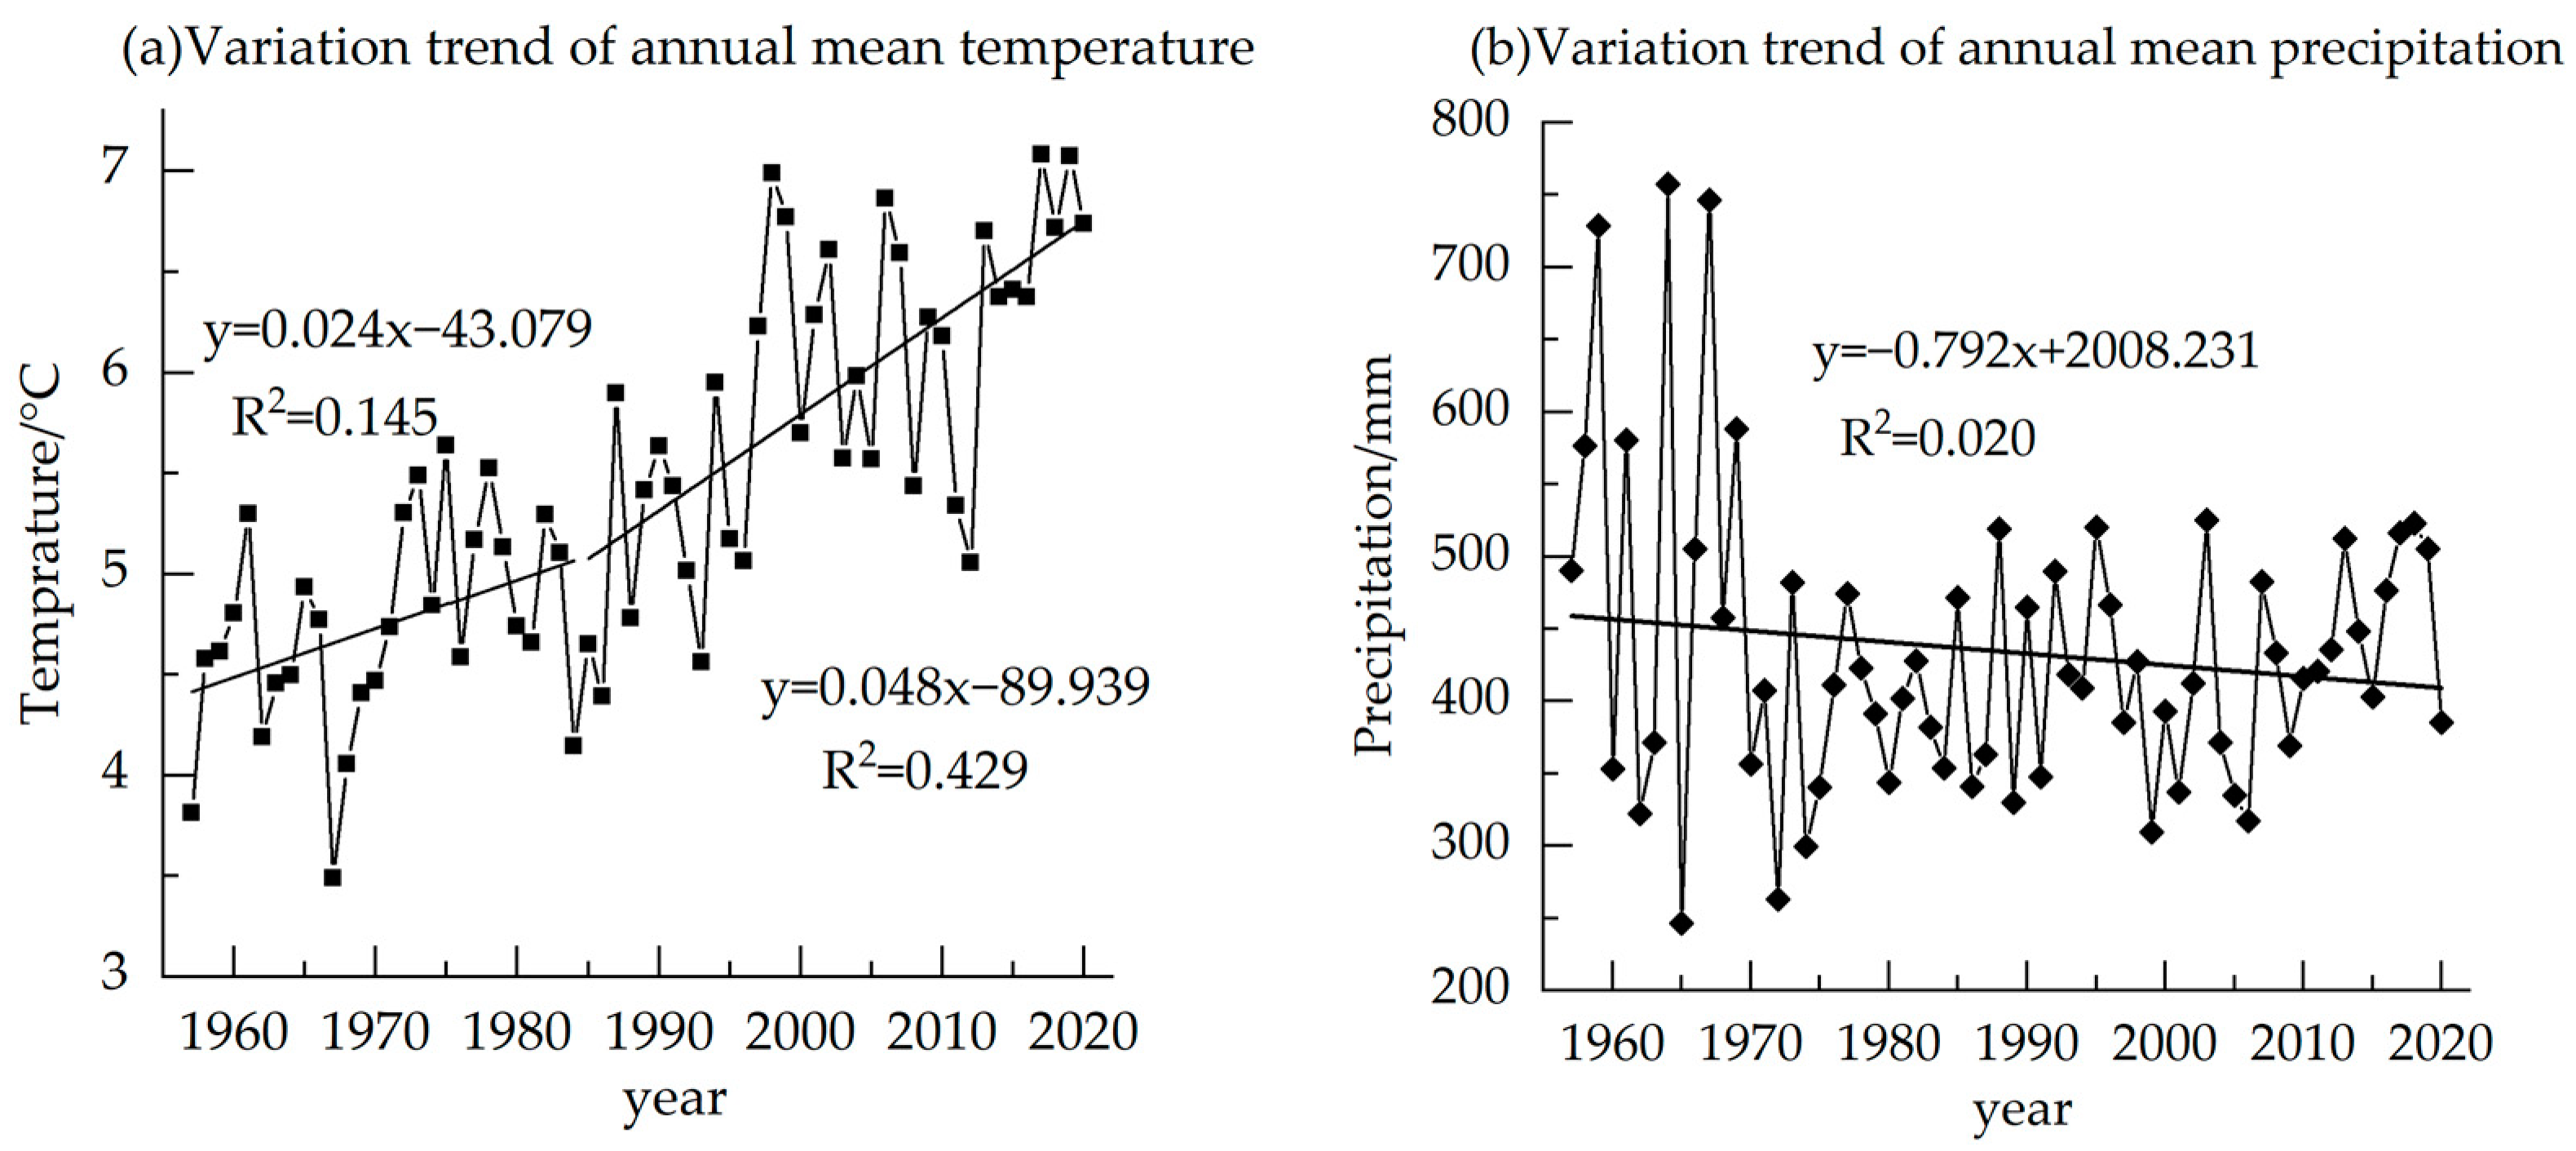
2.1. Overview of the Study Area

Luya Mountain belongs to Guancen Mountain, located in the northern section of Lüliang Mountain. Its main peak, Heyeping, is 2783 m above sea level, and its geographical coordinates are 38°35′ N~38°45′ N, 111°50′ E~112°05′ E. It is the source of Fen River (Figure 1), which is the second largest tributary of the Yellow River. Luya Mountain is located on the precipitation line, at which 400 mm of annual precipitation falls, belonging to the warm temperate zone and the boundary of the semi-humid and semi-arid zones. The mountain is northeast–southwest-oriented, which becomes the natural barrier to the East Asian summer monsoon. Luya Mountain is high and steep, and the vertical zonality of vegetation and soil is obvious. The main tree species are Pinus tabuliformis, Larix principis-rupprechtii and Picea meyeri. The distribution of forest and shrub is over 1850 m and Picea meyeri is the construction species. There is subalpine shrub meadow (2450–2772 m), cold-temperature coniferous forest (1750–2600 m), mixed coniferous broad-leaved forest (1700–1850 m), deciduous broad-leaved forest (1350–1700 m) and a forest steppe (1300–1500 m) from top to bottom. The soil types are subalpine meadow zonal soils, brown zonal soils, leached cinnamon soils, cinnamon soils and chestnut cinnamon soils [9,31,32].
According to the observation data of the Wuzhai (38°43′ N, 111°35′ E, 1396.7 m) and Kelan meteorological stations (38°55′ N, 111°49′ E, 1401.0 m), which are the closest to Luya Mountain, we use the average data of the two stations to represent the meteorological data of the study area (38°44′ N, 111°50′ E, 2501 m) (Figure 2). This region has formed a typical temperate continental monsoon climate, with obvious temperature differences between winter and summer, and the precipitation is mostly concentrated in summer. Here, summer is hot and rainy, and winter is cold and dry. Meteorological disasters mainly include frost, and spring drought is more serious in some areas [33,34].

2.2. Sample Collection and Treatment

For sample collection, 52 Picea meyeri core samples were collected from 26 trees in the area of Luya Mountain (38°44′ N, 111°50′ E, 2501 m); two cores from the diameter at breast height (1.3 m) and the base (0.3 m) of each tree. After natural drying, fixing and fitting, LinTab™6 (accuracy: 0.001 mm) was used to measure the ring width, and COFECHA [35] was used for cross-dating. The correlation coefficients of seven trees reached the requirement of the carbon isotope study of tree rings that are used for stable carbon isotope analysis [16]. The sample sizes and the standard chronologies are shown in Figure 3.
The average diameter at breast height of Picea meyeri is 47.77 cm, and the average tree age is 77 years. In order to avoid the “juvenile effect” [2], we eliminated the first 15 years. Therefore, the valid years of the isotope sample are from 1957–2020. With reference to the methods of previous studies stated below [36,37,38], tree ring δ13C was analyzed and determined. Traditional isotope extraction methods need to peel every ring into a centrifuge tube before the experiment, which takes a significant amount of time and effort. With an optimized method from Kagawa et al. [36], experimental efficiency was improved. The specific steps are showed in Appendix A.
After the treatment, the appropriate number of samples were weighed and sent into the combustion tube (1000 °C) (Thermo 253 Plus mass spectrometer, Thermo Fisher Scientific, Bremen, Germany) by automatic sampler under the special ultra-clean tin cup tightly wrapped. The samples were fully burned in the combustion tube filled with chromium trioxide catalyst under the oxygen-rich condition, and the C element was converted to CO2. The samples were detected the 13C and 12C ratio by isotope mass spectrometer, and compared with the international standard material (Pee Dee Belnite or PDB) [16] to calculate the δ13C value of the sample; the experimental systematic error was less than 0.2‰.

2.3. Calculation of WUE

According to the carbon isotope fractionation model equation established by Farquhar et al. [39,40]:
Δ 13 C = a + ( b     a ) ( C i / C a )
Δ 13 C = δ 13 C a     δ 13 C p 1 + δ 13 C p 1000
In Equations (1) and (2), ∆13C represents the discrimination value of stable carbon isotopes in tree rings; Ci and Ca is the tree intercellular and atmospheric CO2, respectively; a is the diffusion fractionation coefficient for CO2, which is approximately 4.4‰ [12]; b is the carboxylation fractionation coefficient, which is approximately 27‰ [12]; thus, Ci can be expressed as:
C i = C a [ ( δ 13 C p     δ 13 C a + a ) / ( a     b ) ]
WUE can be expressed as the ratio of the assimilation rate (A) to stomatal conductance (g), and WUE can be calculated using Equation (4):
WUE = A g = C a C i 1 . 6 = C a ( b     Δ 13 C ) 1 . 6 ( b     a )
In Equation (3), δ13Cp and δ13Ca represent stable carbon isotope values for trees and atmosphere, respectively. In Equation (4), A is the assimilation rate of trees, g is the stomatal conductance of leaves, and 1.6 is the diffusion ratio of water vapor and CO2 in the air.

2.4. Data Collection and Processing

SPSS19.0 software was used to analyze the correlation between δ13C and WUE of Picea meyeri and mean temperature (Tmean), mean precipitation (Pmean), maximum temperature (Tmax), minimum temperature (Tmin), relative humidity (RH) and vapor pressure deficit (VPD). The meteorological data of the Wuzhai and Kelan meteorological stations, which are the closest to the sampling point, are selected as reference stations. The data were provided by the China Meteorological Data Service Center (http://data.cma.cn/ accessed on 3 June 2022). CO2 concentration in the calculation of WUE of plant data was from McCarroll et al. [12] and the NOAA website (https://gml.noaa.gov/ accessed on 22 March 2022).

3. Results

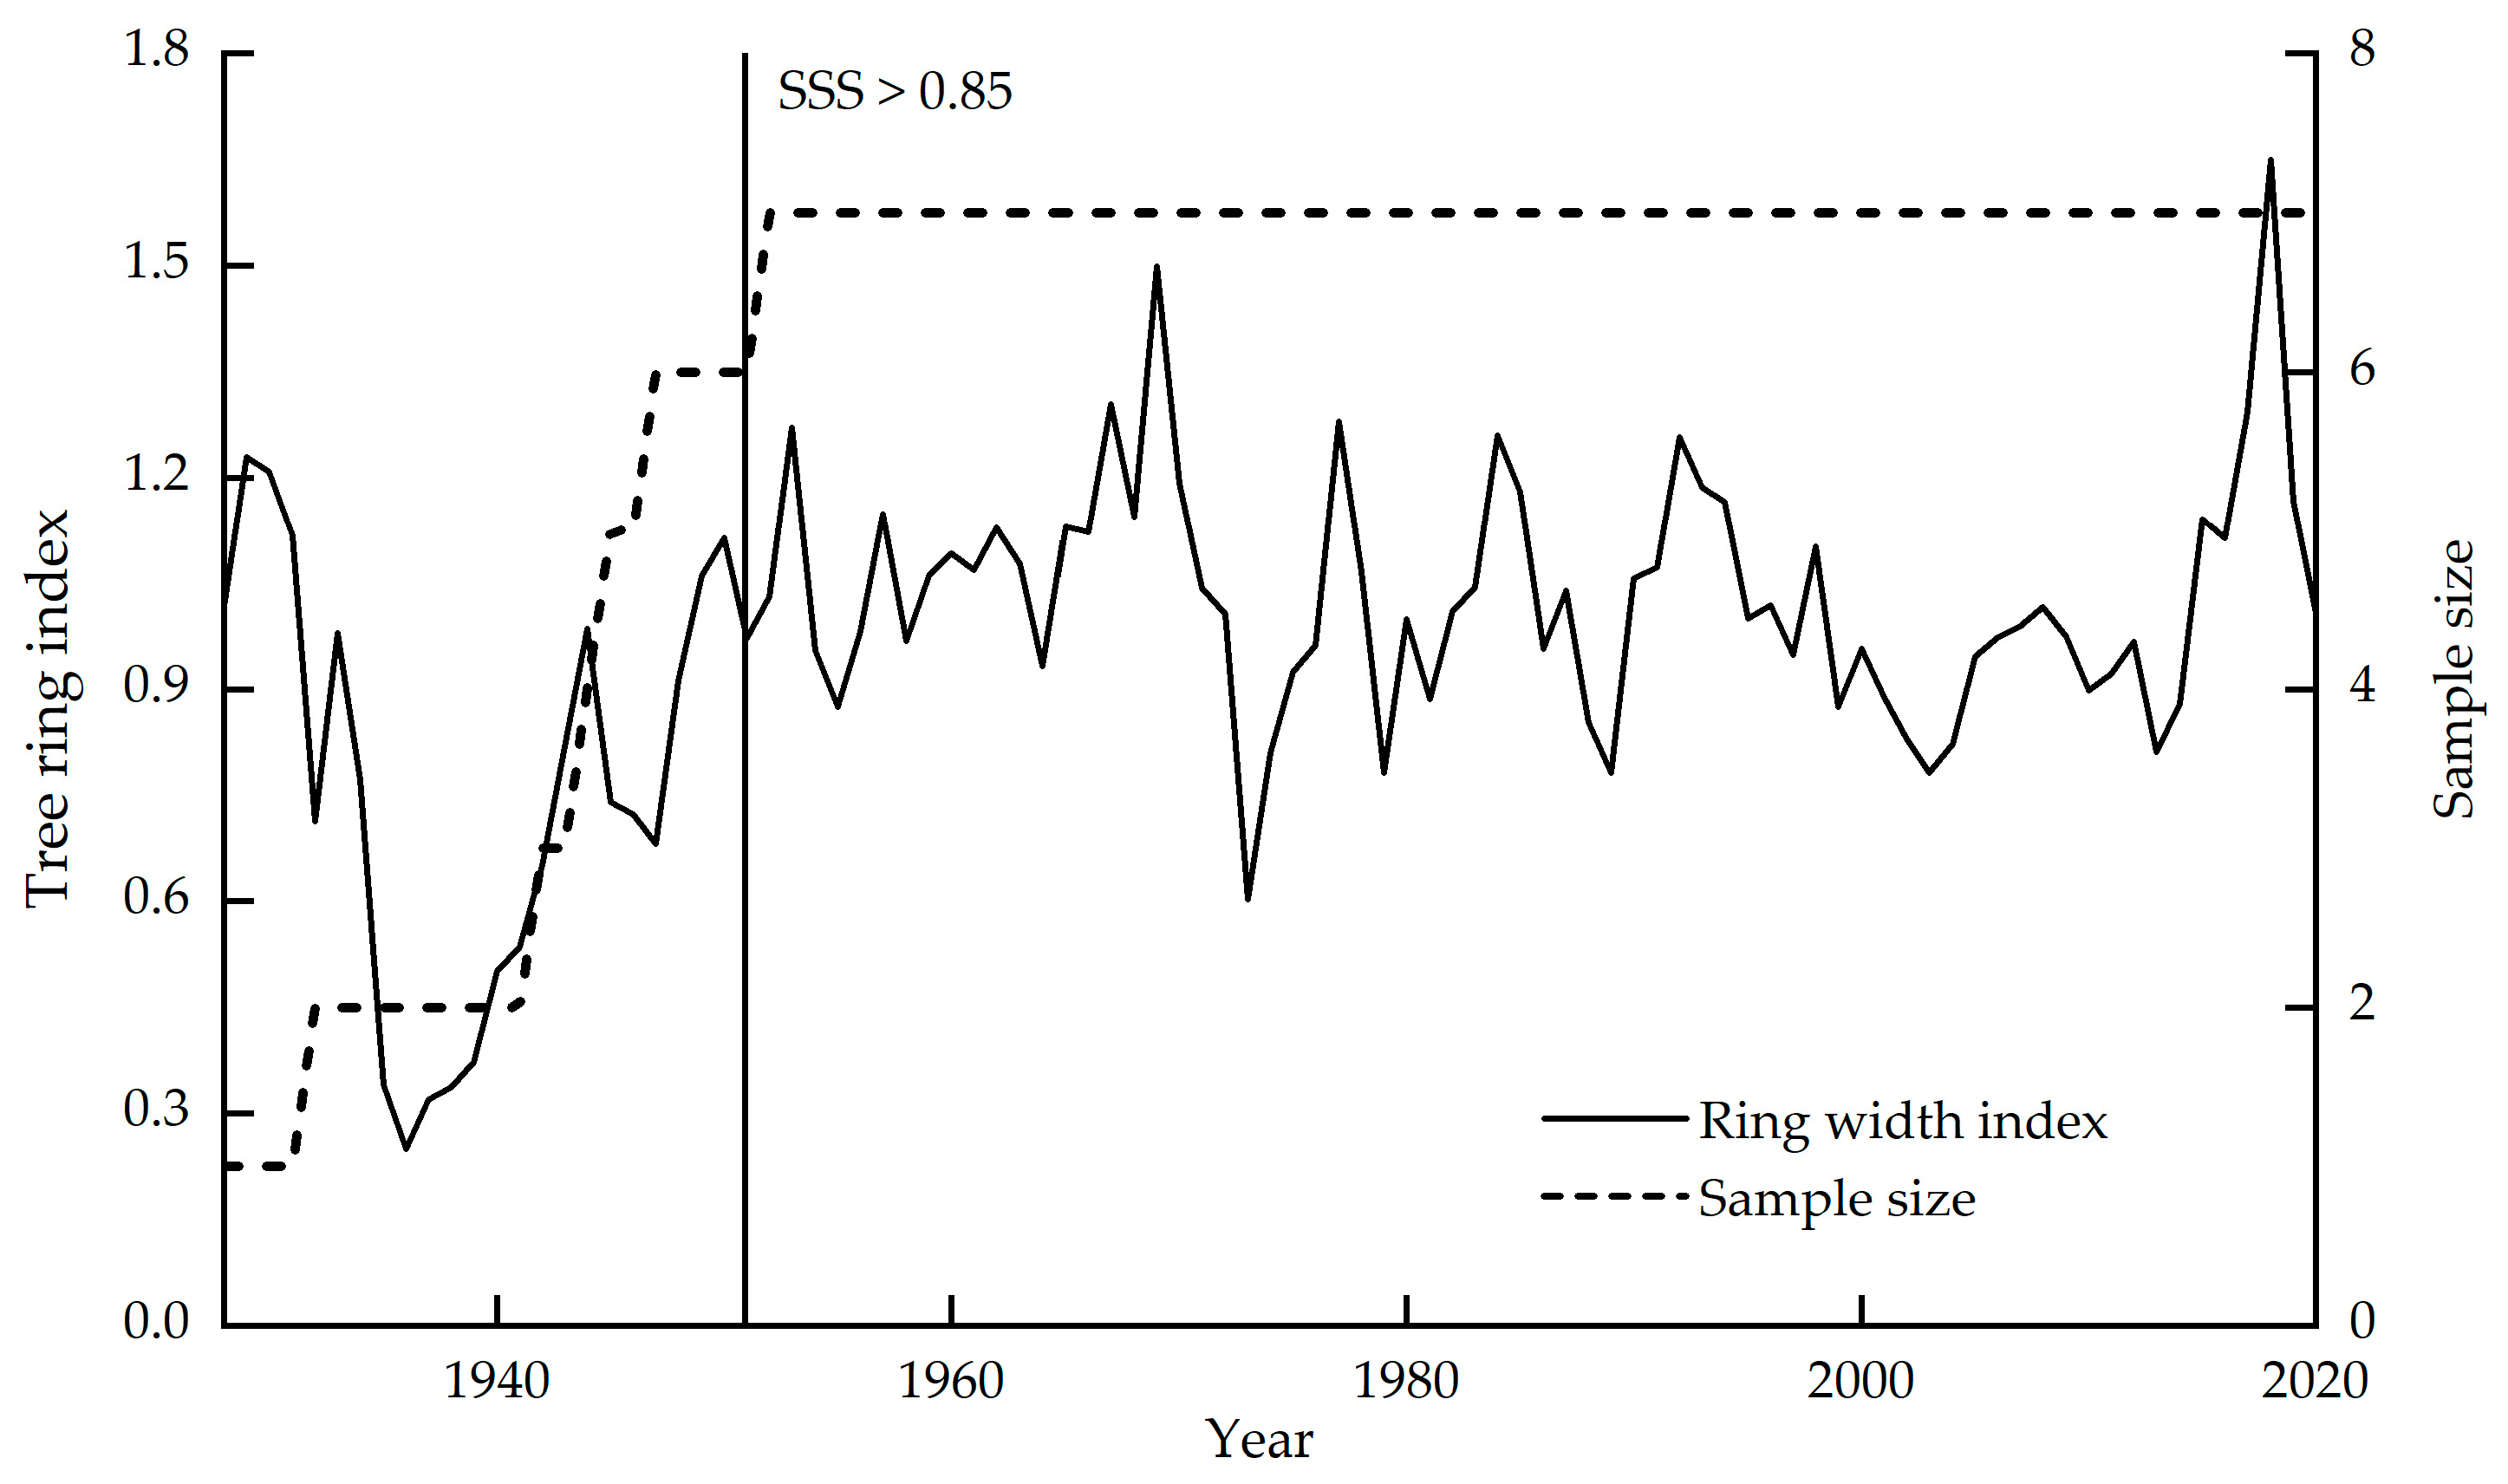
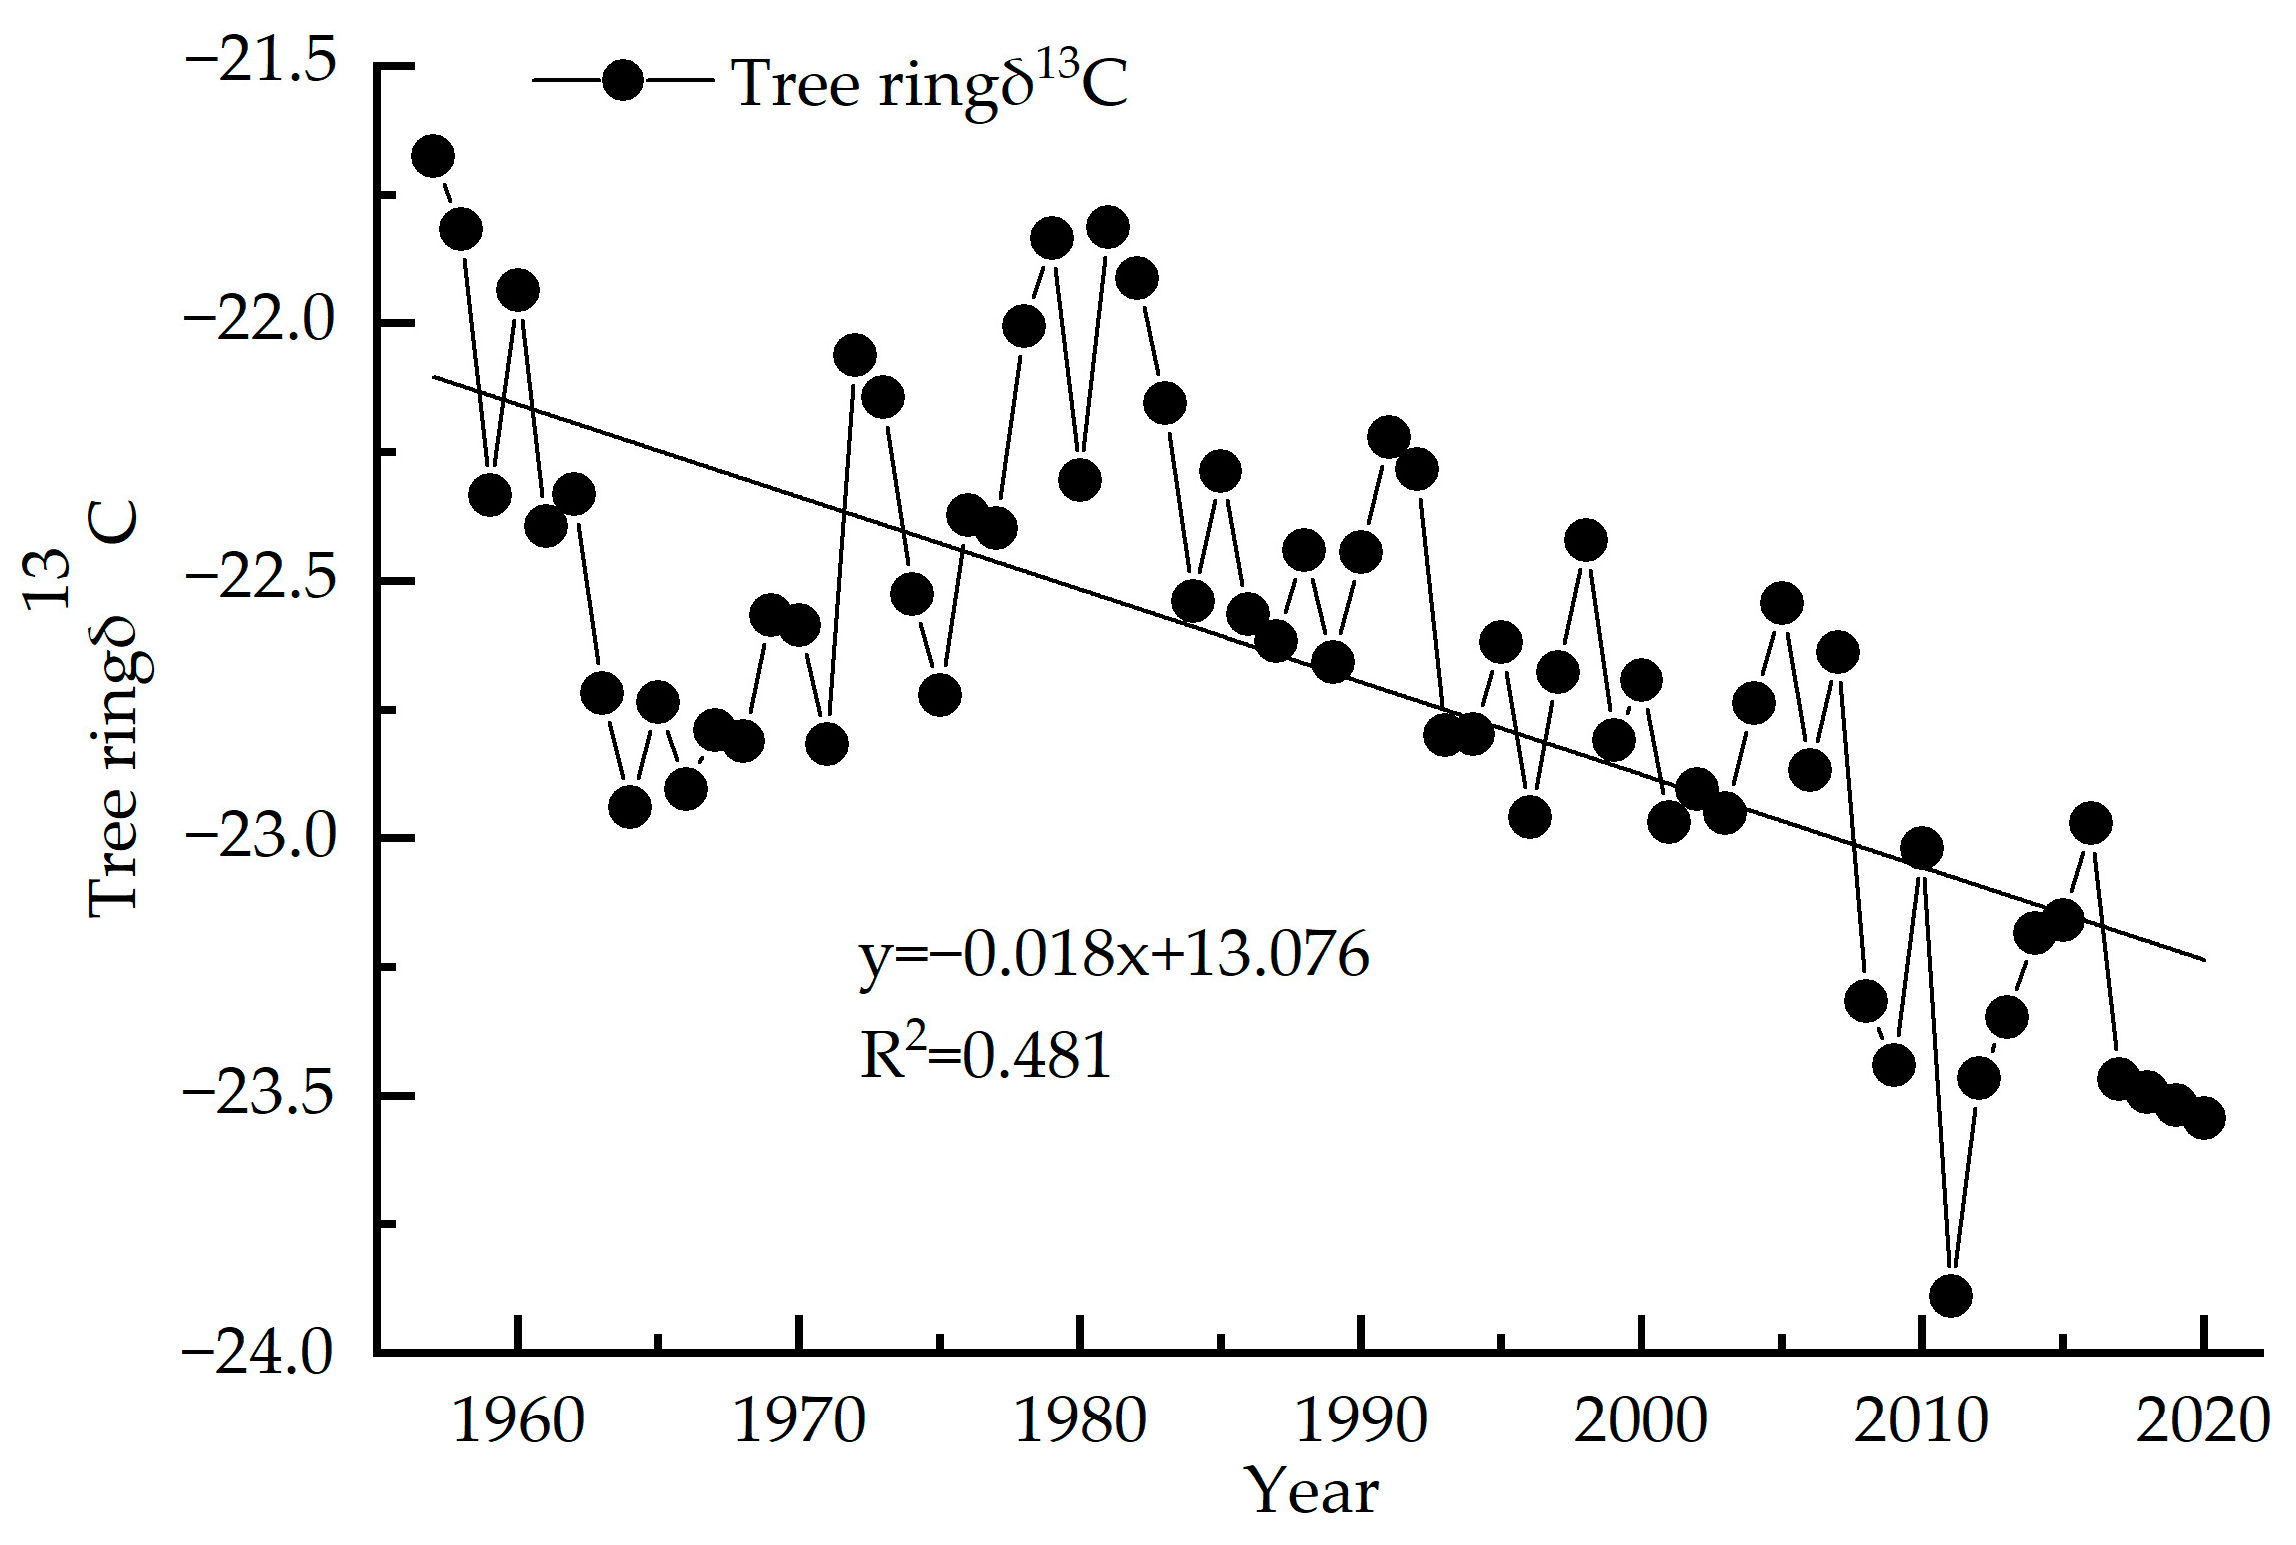
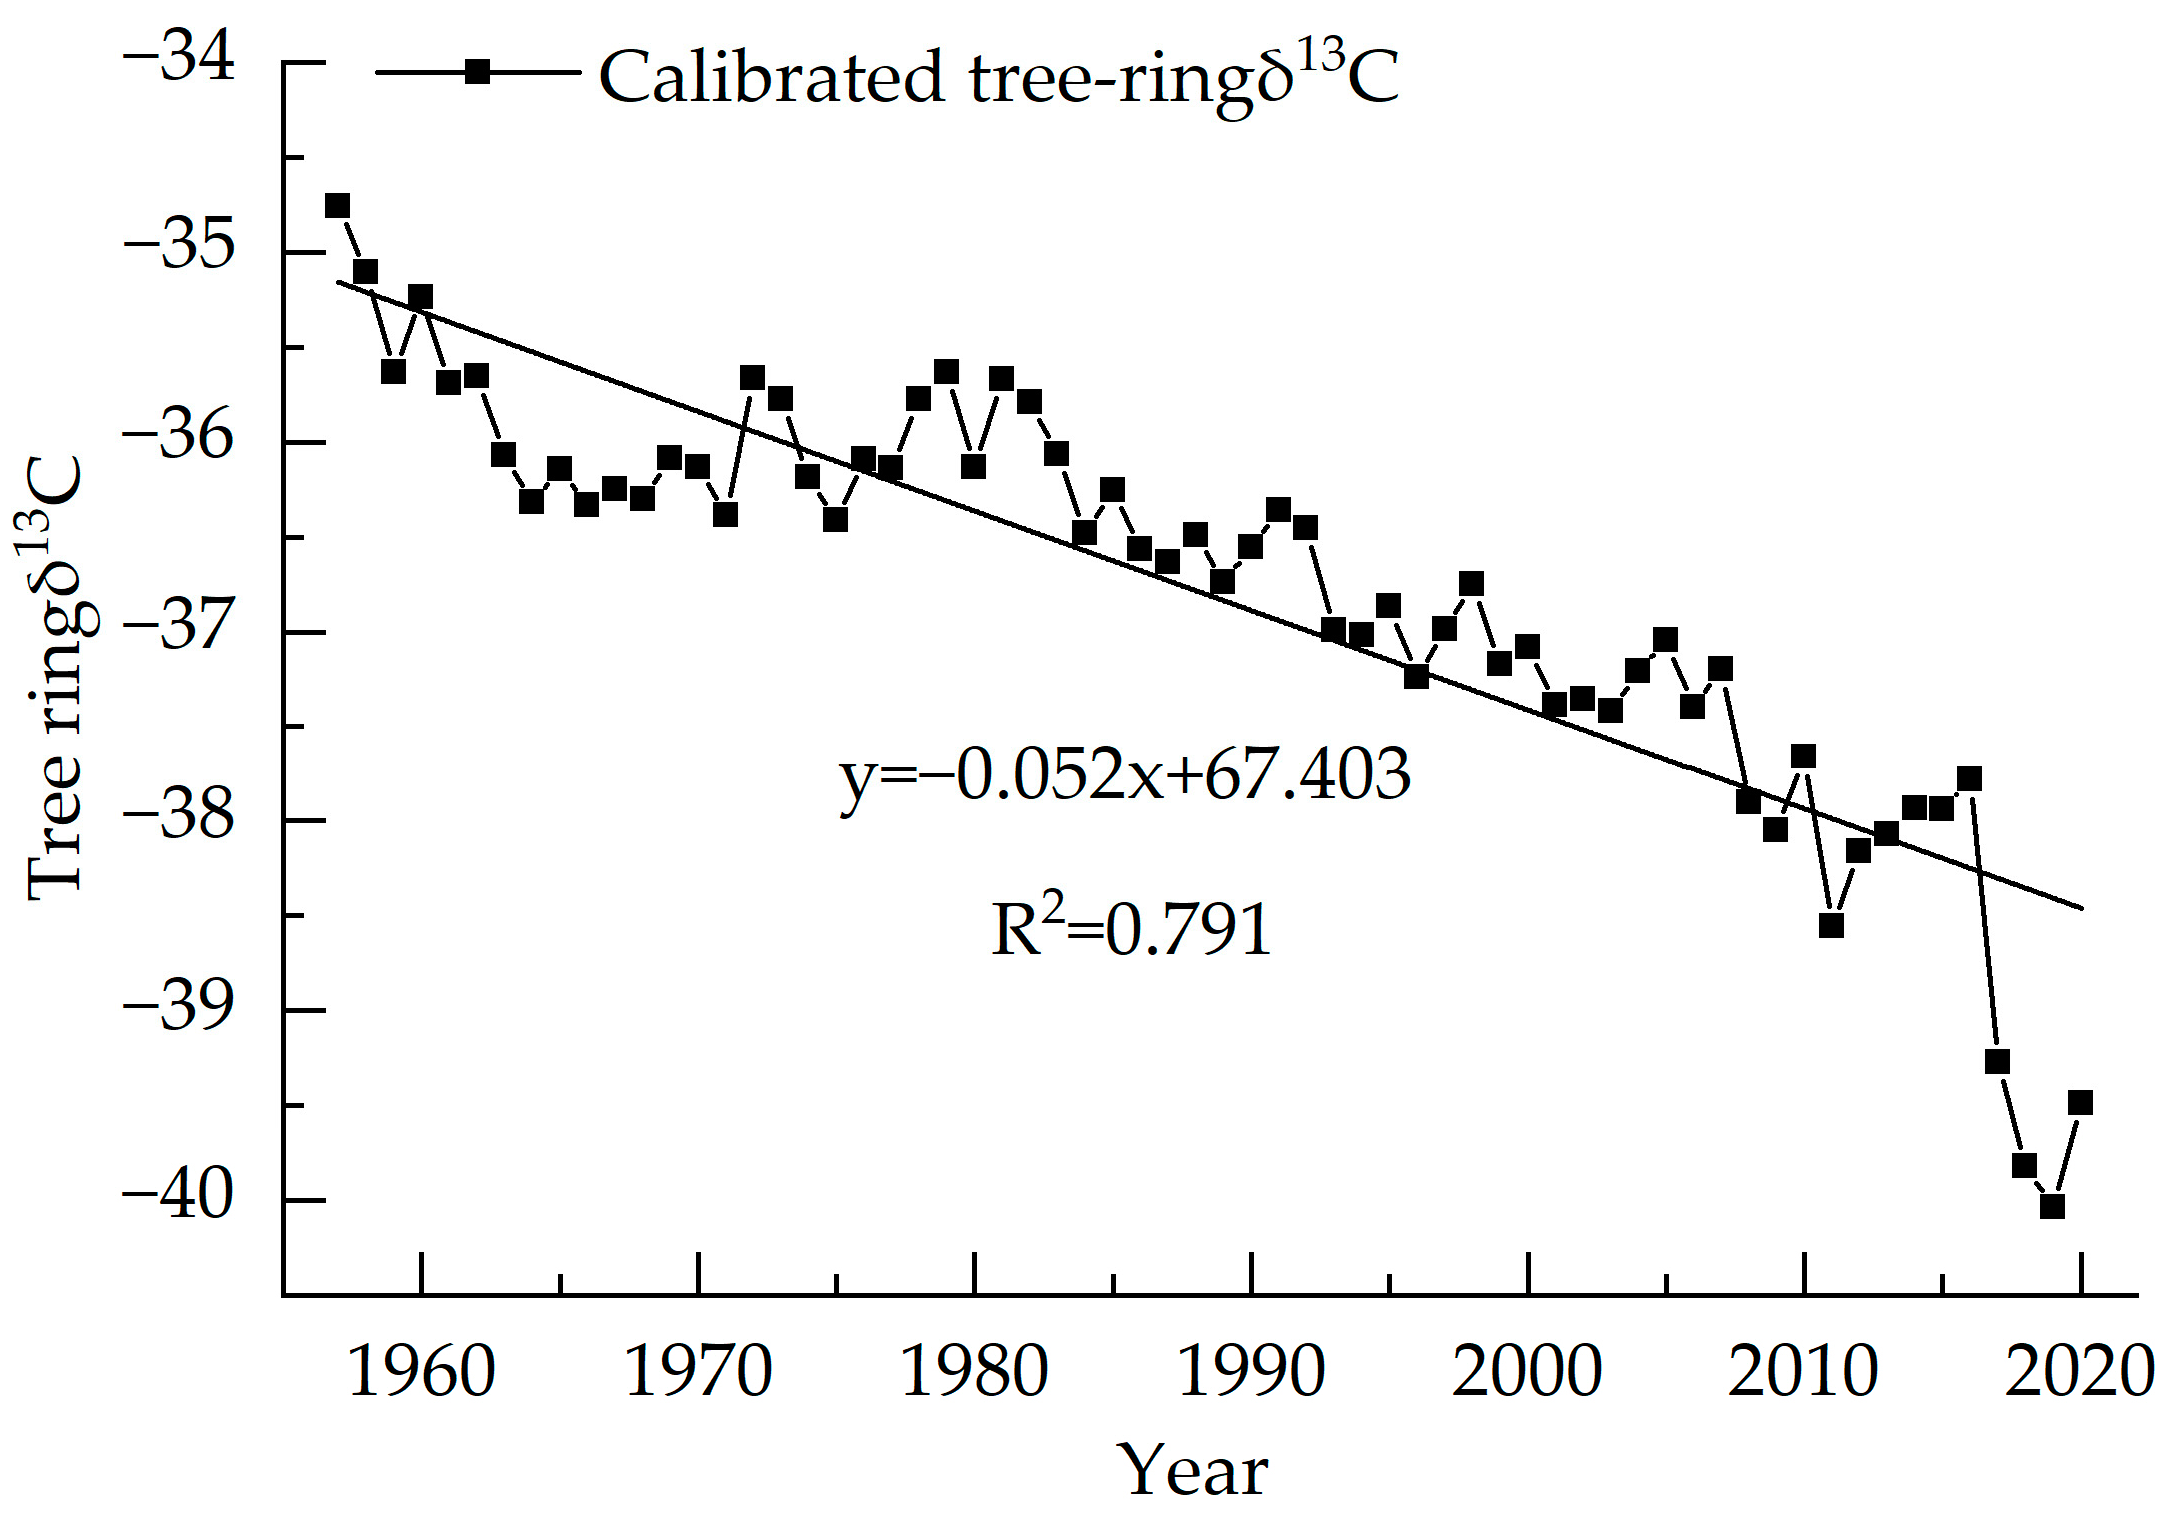
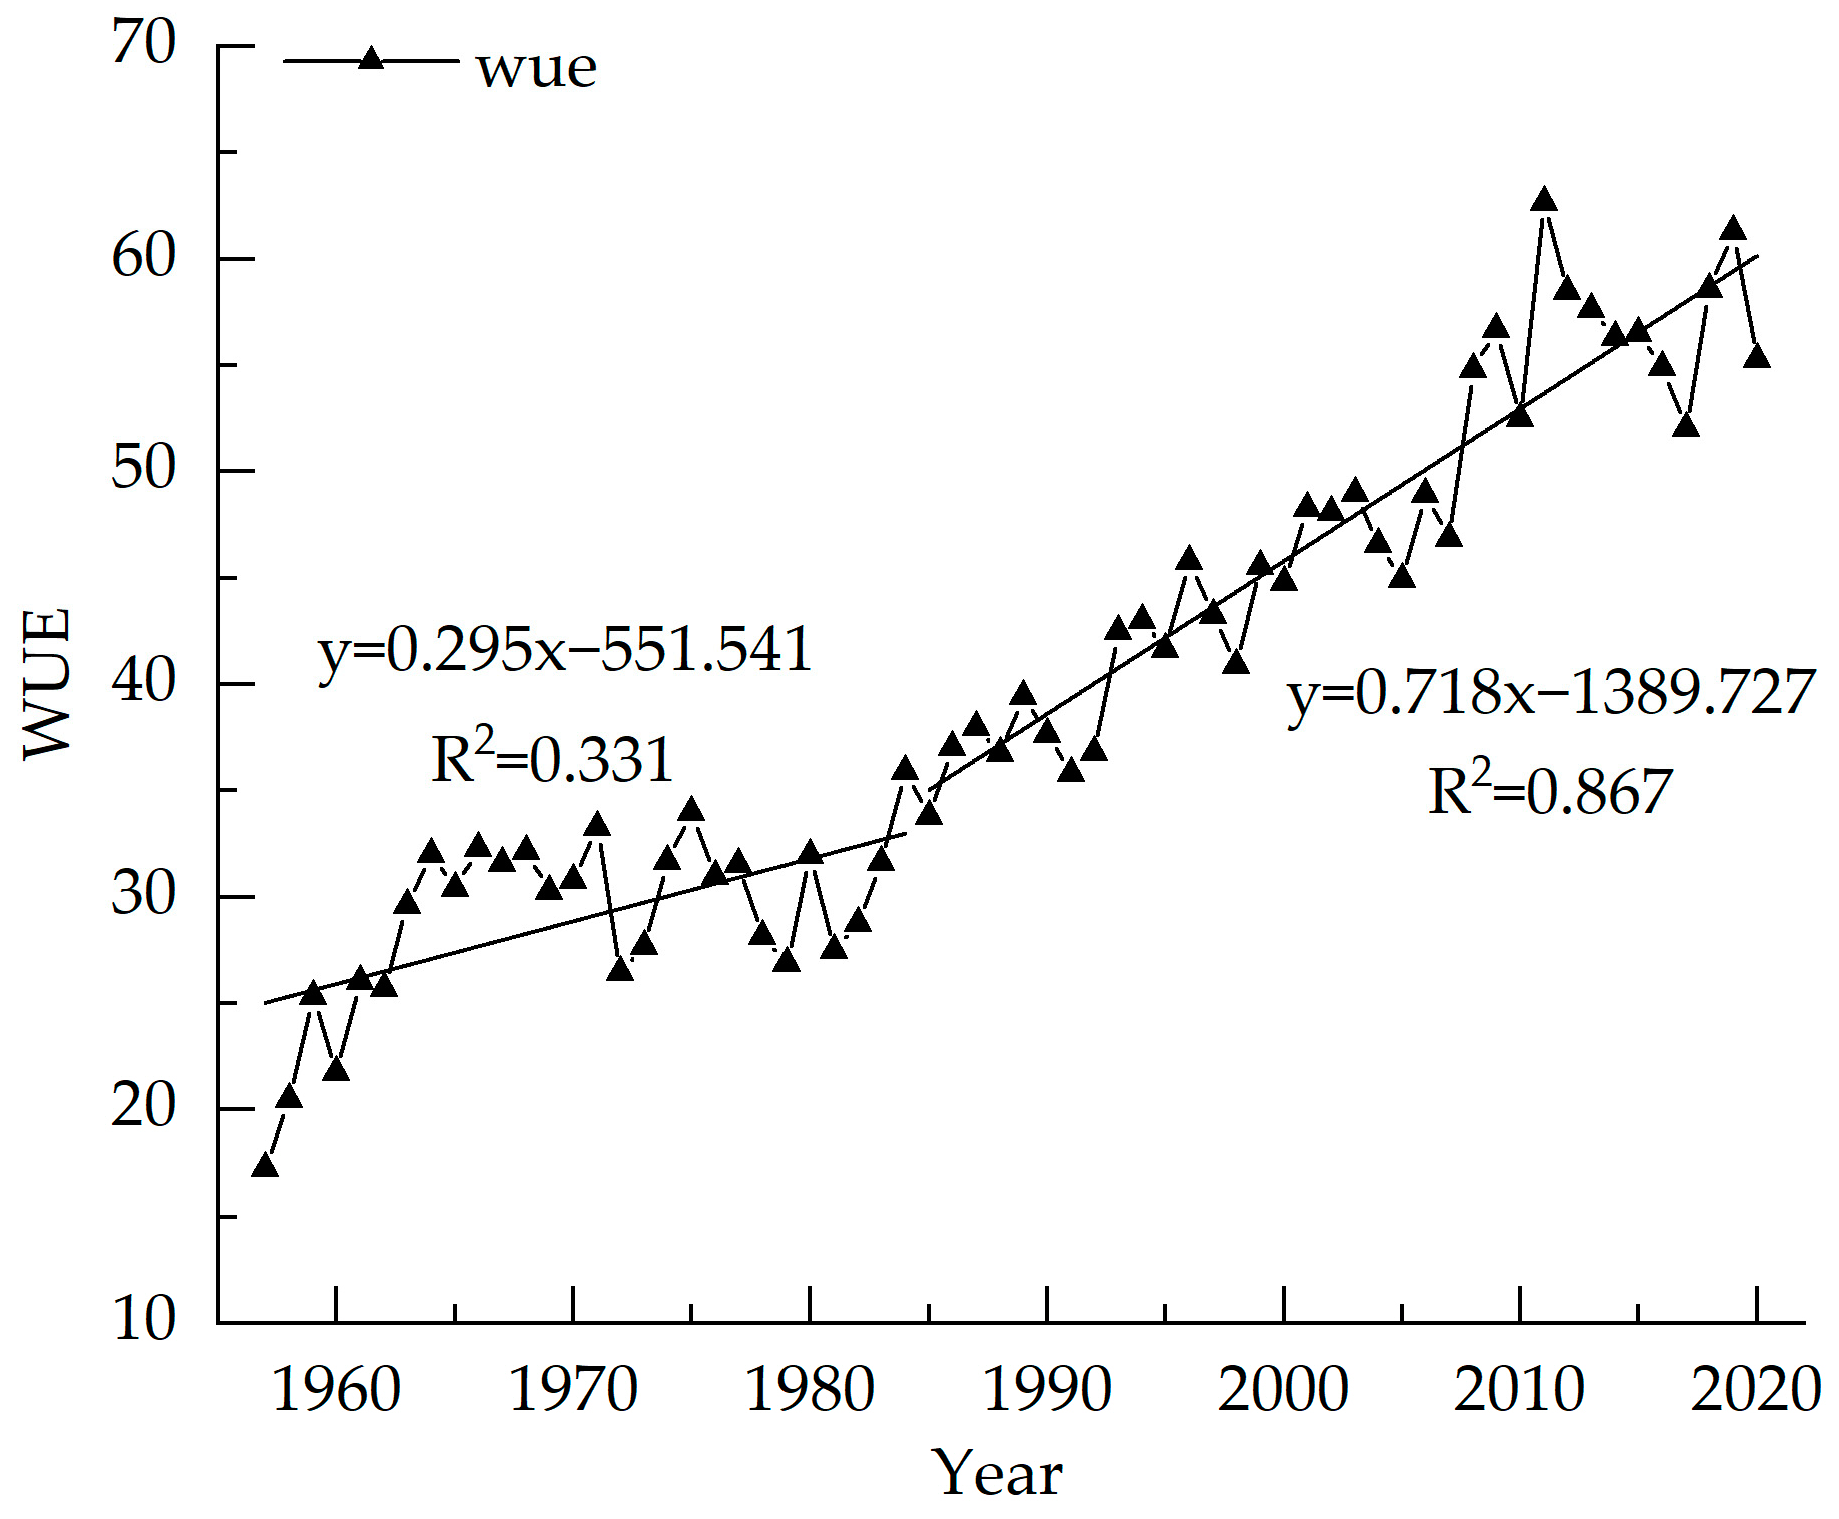
3.1. Picea Meyeri δ13C Value and WUE Sequence Characteristics

The variation range of the stable carbon isotope value sequence of tree rings (1957–2020) is −23.89‰~−21.67‰, with an average value of −22.67‰ (Figure 4). The δ13C value of tree rings decreases year-by-year with an average reduction of 0.03‰ per year. The highest δ13C value is −21.67‰ in 1957 and the lowest value is −23.89‰ in 2011. According to the test of the outlier, δ13 C from 1957, 2011 and from 2017–2020 all show anomalies, and after correction by quadratic polynomial, no longer show anomalies. The linear regression equation of this sequence shows R2 = 0.481, p < 0.01, indicating a significant decreasing trend.
Trees use CO2 through photosynthesis to feed their growth. During the process, the CO2 produced by the respiration of surrounding trees can cause tree ring δ13C to change in value. The burning of chemical fuels causes the δ13C value of the atmosphere to decrease, making the δ13C of plants much lower than the former. Liu et al. indicate that atmospheric CO2 has nothing to do with climate change, thus, atmospheric CO2 should be excluded in the research [41]. McCarroll’s equation was used to correct the carbon isotope sequence [12], as shown in Equation (5), and the result of the calibration is shown in Figure 5.
δ 13 C = δ 13 C p     ( δ 13 C a + 6 . 4 )
In Equation (5), δ13Cp and δ13Ca are the tree ring measured δ13C and atmospheric background δ13C value, respectively.
The variation range of WUE is from 17.26–61.31 from 1957 to 2020, with an average value of 39.45, which is consistent with the WUE of the evergreen coniferous forest [42]. The value of WUE of Picea meyeri increases year-by-year, with an average increase of 0.69 per year. The highest value is 61.31 in 2019 and the lowest value is 17.26 in 1957. Figure 6 shows that the WUE is stable from 1957 to 1985 with small fluctuations, and the average value is 30.89. The fitting equation shows that WUE increases slightly from 1957–1985 (R2 = 0.331, p < 0.01) and significantly after 1985 (R2 = 0.867, p < 0.01), which may be similar to the slight increment in 1990 and 2005. The WUE sequence generally has a significant increasing trend.

3.2. Response of Stable Carbon Isotope Sequence to Changes in Temperature and Precipitation

The above analyses show that the variation trends of δ13C and WUE of Picea meyeri are the opposite. In order to investigate the possible “lag phenomenon”, correlation analysis should be made between the two sequences and the meteorological factors of the previous year. The Pearson correlation analysis results of the two sequences and climate factors, such as average annual temperature and annual precipitation, are shown in Table 1. The results of the mean temperature (Tmean), maximum temperature (Tmax), minimum temperature (Tmin), mean precipitation (Pmean), relative humidity (RH) and vapor pressure deficit (VPD) in p9 (previous September) to c12 (current December) and the growing season (c5–9, May–September of the current year) are shown in Figure 7.
The temperature subtly changed from 1957–1985, but showed an obvious upward trend from 1985–2020, with an average of 5.40 °C (Figure 8). There is no obvious change in precipitation in the region, with an average annual precipitation of 433.83 mm (Figure 8). The correlation of δ13C and annual mean temperature is found with Pearson correlation, reaching −0.711 (p < 0.01) (Table 1). The correlations with annual Tmax, RH and VPD are also significantly correlated (Table 1). Similar to the monthly scale correlation, the negative correlation between δ13C and annual mean precipitation is also not significant (Table 1).
The coefficient of autocorrelation of the δ13C sequence is 0.866, which shows that there is a significant “lag phenomenon” of climate on δ13C, that is to say, the growth of Picea meyeri is not only related to the climate factors of the current year, but also influenced by the climate change of the previous year. Figure 7 shows that the δ13C of Picea meyeri is negatively correlated with the mean temperature of each month from 1957 to 2020. At the same time, the correlation between δ13C and the temperature of the growing season (c5–9) month is obviously higher (r = −0.591, p < 0.01) than that of any single month of the growing season. The correlation between δ13C and precipitation is rather low and not significant. It is only negatively correlated with precipitation in October of last year, even though the correlation coefficient reached more than 0.200, it is still not significant. It is significantly negatively correlated with precipitation in February of the current year (r = −0.267, p < 0.05), but not significantly correlated with other months or the growing season months. The correlation of δ13C and Tmax and Tmin of each month also reaches a significant level, showing a significantly negative correlation with Tmax of each month (p < 0.05); a slightly negative correlation with Tmin is found, but it only reaches significance in June, and no significant correlation with other months. The correlation between δ13C and relative humidity is poor, and it is only significant with December of last year and March of the current year (r = 0.343, p < 0.01; r = 0.330, p < 0.01, respectively). The VPD of only September of last year and the current year are significantly positively correlated with δ13C (r = 0.340, p < 0.01; r = 0.325, p < 0.01). No significant correlation is found in other months.

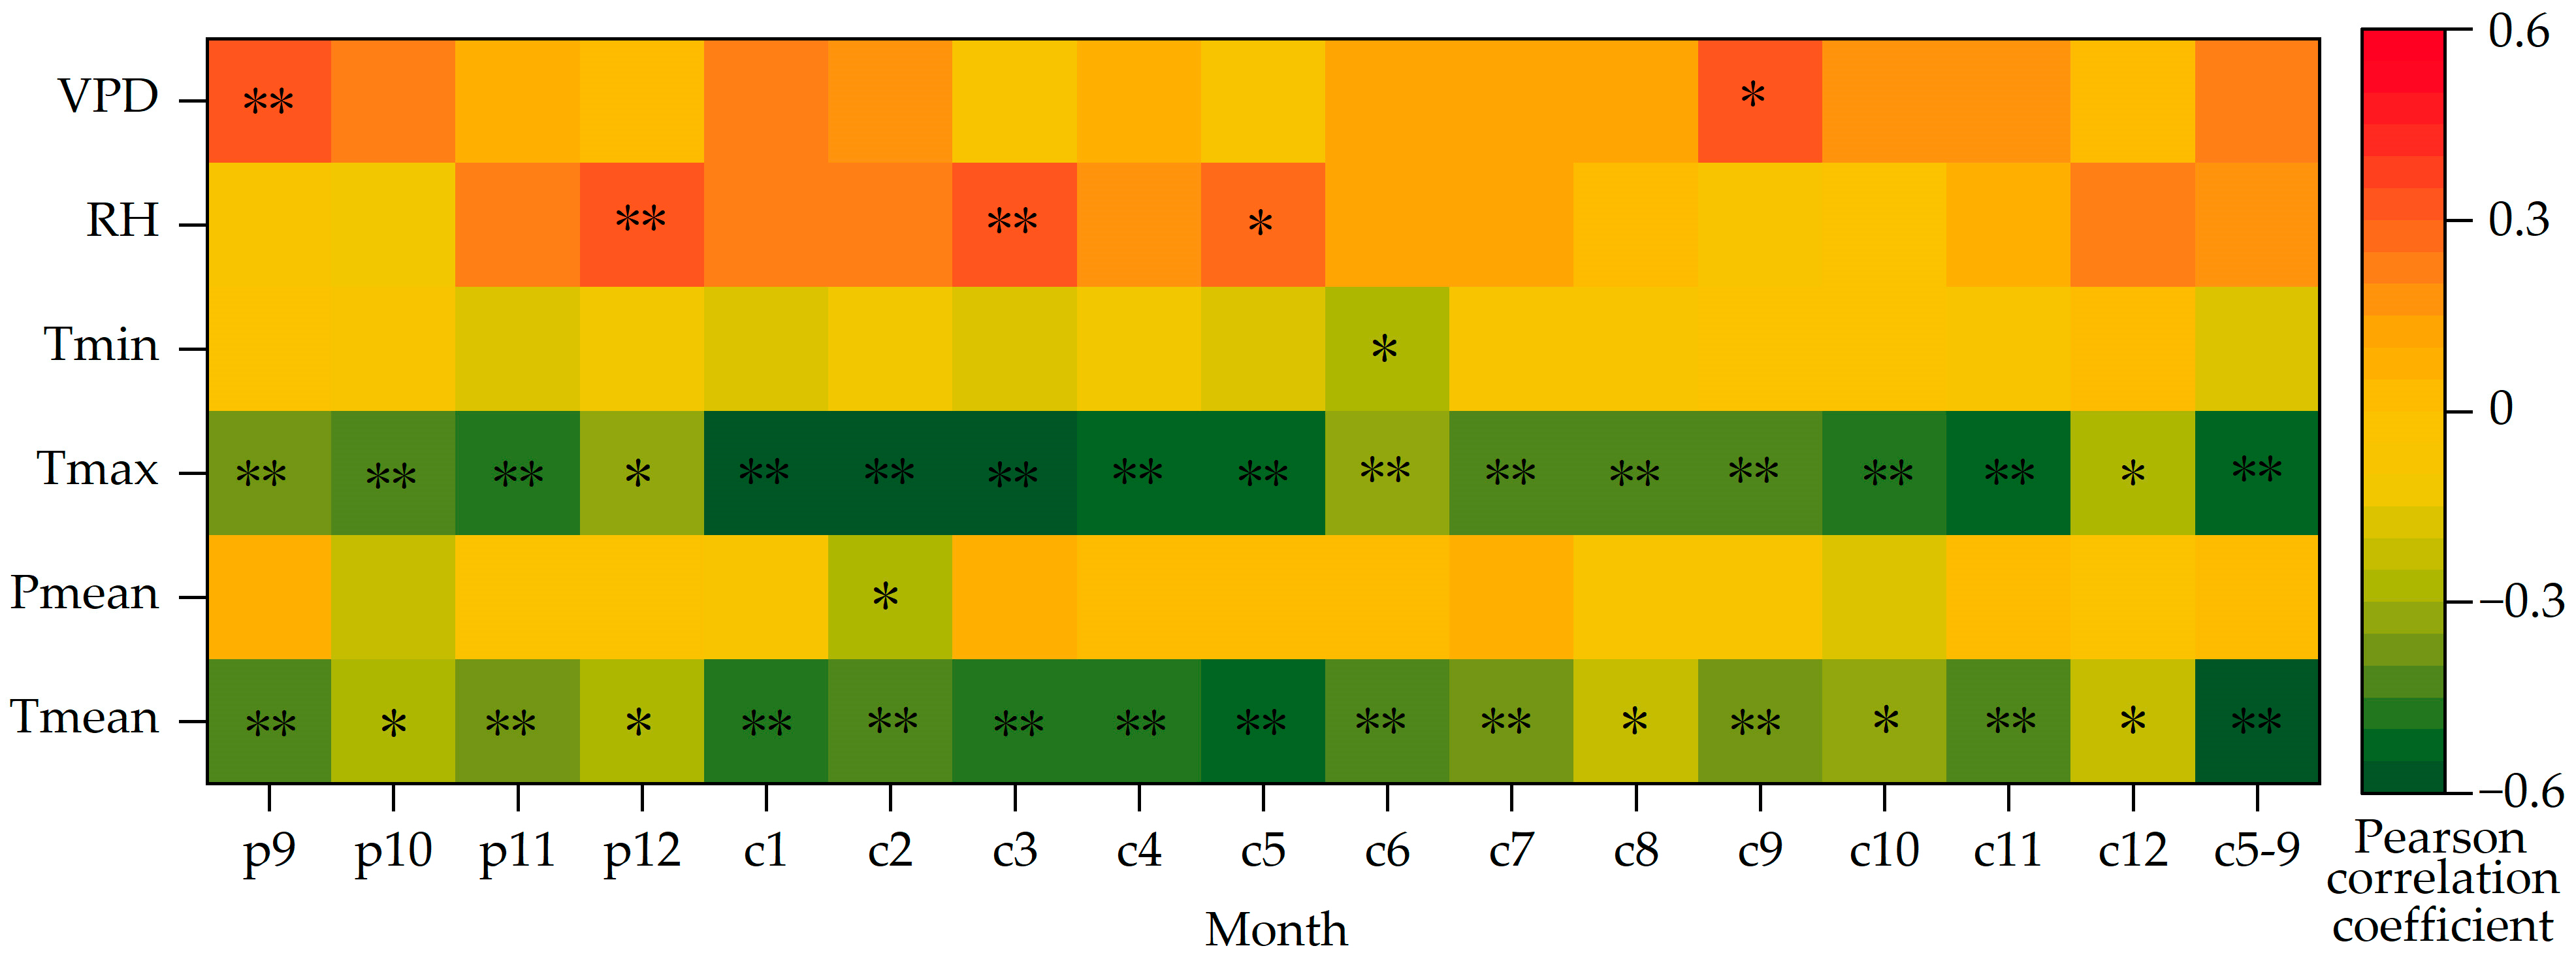
3.3. Relationship between δ13C and Climate Factors

Figure 7 indicates that the correlation between δ13C of Picea meyeri and climate factors is significantly correlated with Tmean, growing season temperature and Tmax, but is not significantly correlated with Pmean, Tmin, VPD and RH. To explore the influence of δ13C of Picea meyeri, climate factors that have the greatest influence are selected to establish the multiple regression equation. The result in SPSS shows that R = 0.760, R2 = 0.578 and adjusted R2 = 0.541.
Y = 23 . 578     0 . 654 Tmean 5 9     0 . 115 Tmax 2     0 . 040 Pc 2 + 0 . 019 Rc 3 + 0 . 030 Vp 9
In this equation, Y is the Picea meyeri tree ring δ13C value, Tmean5–9 represents the mean temperature of the growing season, Tmax2 represents the maximum temperature in February, Pc2 represents the mean precipitation in February, Rc3 represents relative humidity in March and Vp9 represents the vapor pressure deficit in September last year.

3.4. Response of WUE to Climate Change

The inter-annual variation in precipitation of the study area from 1957–2020 and the correlation analysis of WUE show that the annual precipitation is positively correlated with WUE, with the Pearson correlation coefficient of −0.718 (p < 0.01). The water use efficiency of Picea meyeri increases with the increase in precipitation. In addition, WUE is significantly correlated with Tmax, Tmin, RH and VPD (Figure 9).
As shown in Figure 9, WUE has a significant positive correlation with temperature. Similar to δ13C, the growing season temperature has a significant cumulative effect on WUE (r = −0.526, p < 0.01), which is higher than that of any single month of the growing season. However, the relationship between WUE sequence and monthly precipitation is not statistically significant, only significantly correlated with precipitation in February of the current year (r = 0.345, p < 0.05). It is negatively correlated with precipitation in summer, but the correlation is still not significant. The correlation between WUE and RH is poor, and only has a significant negative correlation with the RH in December and March of last year. There is a significant negative correlation with VPD in September of last year and the current year.

4. Discussion

4.1. Analysis of the Main Climate Impact Factors of δ13C of Picea meyeri

Photosynthesis in plants absorbs and uses 12C, allowing carbon isotope fractionation. Temperature and precipitation affect tree ring δ13C by affecting photosynthesis. Thus, it is considered that the tree ring δ13C can record long-term changes in ambient temperature and precipitation. Higher temperatures early in the growing season promote tree photosynthesis, resulting in lower fractionation of carbon isotopes and tree ring δ13C increase, that is, air temperature and δ13C is positively correlated. This result can be proved by the studies of Pinus tabulaeformis on Helan Mountain [41], Pinus massica on Zijin Mountain in south China [43], Larix sibirica on the Altai Mountains [44], Picea likiangensis on the Tibetan plateau [45] and Abies pindrow in central Himalaya [46].
However, if high temperature leads to relative drought or drought stress [8], the correlation of δ13C and temperature is negative. The δ13C of Picea meyeri selected in this study is negatively correlated with the temperature of each month and the combined temperature of each month (Figure 6), and the correlation of the temperature of the growing season is significantly negative (r = −0.591, p < 0.01), which is better than that of the temperature of each month, indicating that the temperature of the growing season has a significantly cumulative effect. On the annual scale, there is a significant negative correlation between δ13C and temperature (r = −0.775, p < 0.01) (Table 1). This result is contrary to that of Pinus tabulaeformis on Helan Mountain and other studies mentioned above [41,43,44,45,46]. The reason may be that the quantity and activity of the enzymes of photosynthesis decrease when the temperature is too high [47]. In addition, high temperature increases evapotranspiration, which leads to the decrease in soil water. To solve the drought stress, the stomata conductance decreases and CO2 entering cells decreases, which weakens photosynthesis and indirectly restricts the growth of trees [48]. The significant negative correlation between δ13C and the Tmax can also explain the increase in temperature having an inhibitory effect on δ13C. Additionally, the effect of Tmax is obviously higher than the Tmin and the Tmean. Yang et al. used the Dendrometer to monitor the growth of Picea meyeri, and the result showed that the growth of Picea meyeri is in a significant negative correlation with the temperature in sunny conditions [1]. In addition, temperatures that are too high decrease soil water, which indirectly inhibits the growth of trees, showing that the increase in temperature weakens the assimilation effect of Picea meyeri, so the δ13C is negatively correlated with temperature.
Precipitation is an important factor affecting the growth; however, Picea meyeri in the treeline is restricted mostly by temperature [1,7,8]. In this study, the correlation between δ13C and monthly precipitation is quite low and does not reach the significance level of 0.05, which is only significant with precipitation in February (r = −0.267, p < 0.05). When Picea meyeri start to grow, the increase in soil moisture in spring leads to an increase in stomatal conductance, allowing the entry of intracellular CO2, which contains mostly 12C, leading to a low δ13C value. In the annual scale, the nagetive correlation between δ13C and precipitation is very low and not significant (Figure 8). This is because at the treeline, precipitation is far from sufficient to satisfy the growth of trees and the fractionation of carbon isotopes. Therefore, when there is no significant increase in precipitation, tree ring δ13C is still negatively correlated with precipitation [6].

4.2. Analysis of the Main Climate Impact Factors of WUE of Picea meyeri

The trend of WUE of Picea meyeri on Luya mountain is consistent with that of the Larix sibirica of the Altai Mountains in North China [44], Robinia pseudoacacia in central China [49], Pinus sylvestris and Picea abies in central Europe [50], Pinus nigra in northeast Spain [51] and other tree species which show a significant increasing trend. The water use efficiency of Picea meyeri is negatively correlated with temperature, and the coefficient is extremely low. The reason is that Picea meyeri at the treeline is so sensitive to temperature limitation that it has a strong response to climate warming [52]. The temperature in the Luya mountain area shows a significant rising trend, and the precipitation decreases, which is sufficient to prove that there is a warming and drying trend in this area (Figure 7). The correlation between the average annual temperature of Luya Mountain and WUE is greater than that of the growing season, which is possible because the increase in temperature in autumn and winter prolonged the end date of cambium activity [53], which improved the WUE of Picea meyeri. In the early spring, the temperature gradually increases and the snow melts, so the period of dormancy is gradually stopped. The WUE is in a significant positive correlation with the precipitation and temperature in February, which is the early growth season of Picea meyeri. The increasing temperature can effectively reduce the inhibitory effect of low temperature on the roots and reduce the dormancy, photosynthesis is enhanced, and WUE is in a significant positive correlation with temperature. In the period, temperature is the limiting effect of WUE. From 1957 to 2020, the temperature in the study area increased significantly, while WUE showed a consistent increasing trend. At the annual scale, WUE showed a significantly positive correlation with temperature and a very low correlation with precipitation (Table 1). Studies show that NPP and ET are much more affected by temperature than precipitation [24].
Due to drought stress [8,54,55], the unnecessary water loss is reduced by the reduction in the stomatal conductance of Picea meyeri to maintain its physiological activity. Meanwhile, with the reduction in the stomatal conductance, intercellular CO2 reduces, leading to a high WUE, showing that the growth of the Picea meyeri in the treeline might be in a good condition in climate warming conditions. In this study, the correlation is so poor with precipitation that it is only positively correlated with the precipitation in February. The increase in precipitation in spring would lead to the increase in WUE, which might be because the precipitation before the growing season strengthens the carbon fixation ability of Picea meyeri. In addition, according to Fan et al. [56], global warming has affected the distribution of willows, which can predict the expansion of distribution in high latitudes (Arctic regions). Moreover, Liu et al. [57] used the TWINSPAN (Two Way Indicator Species Analysis) method to classify species and niches, which indicated that the distribution of spruce and fir forests showed obvious stand replacement in high altitudes (Changbaishan National Nature Reserve, Antu, China). In that case, we assume that Picea meyeri on Luya mountain might expand to higher altitudes, leaving lower niches for the deciduous tree species. Meanwhile, the RH and VPD are negatively correlated with WUE, and the correlation is only in a few months. Further study shows that neither precipitation, RH or VPD are the limiting factor of WUE, but temperature factors are the limiting factor of WUE.

5. Conclusions

The δ13C of Picea meyeri from 1957 to 2020 showed a significant decreasing trend. WUE showed an increasing trend, and it increased more significantly from 1985 to 2020 than that from 1957 to 1984. Therefore, the growth of Picea meyeri is good in climate warming conditions. Tree ring delta δ13C has a significant negative correlation with Tmean and Tmax in the growing season, and an insignificant relationship with Pmean, RH and Tmin. WUE has a significant positive correlation with Tmean, and a low correlation with Pmean. It is not difficult to see that the impact of temperature in Luya Mountain is stronger than precipitation in both δ13C and WUE. Therefore, the main impact factor of δ13C in tree rings of Picea meyeri is temperature rather than precipitation, and Picea meyeri is also highly affected by drought stress.

Author Contributions

Y.H. and S.L. conceived the idea; Y.H., Y.G., R.F. and H.Z. performed the experiment; Y.H., J.W., Q.L. and Y.Z. analyzed the data; Y.H. wrote the manuscript; S.L. reviewed and approved the final manuscript. All authors have read and agreed to the published version of the manuscript.

Funding

The research was funded by a General Program from the Natural Science Foundation of Shaanxi Province (no. 2014JQ5172), the Open Fund Project of the State Key Laboratory of Loess and Quaternary Geology (no. SKLLQG1611) and the National Forestry Public Welfare Industry Scientific Research Project of China (no. 201304309).

Institutional Review Board Statement

Not applicable.

Informed Consent Statement

Not applicable.

Data Availability Statement

The data presented in this study are available upon request from the corresponding author.

Conflicts of Interest

The authors declare no conflict of interest.

Appendix A

(1) Use a slicing machine to cut the sample core into laths 1.00 mm thick. In order to avoid carbon source pollution, the impurities are rinsed with deionized water, and the samples are fixed in a customized poly tetra fluoroethylene (PTFE) box and sealed with cotton thread.
(2) Put the fixed PTFE box into the conical flask and treat the laths with a benzene:ethanol mixture (2:1) of 225 mL and 200 mL of acetone in a 70 °C constant temperature water bath, then conduct extraction for 24 h, respectively. Next, put them in boiling water for 10 min and then air dry.
(3) Put the samples into a beaker and add 20% NaClO2 solution and 20% CH₃COOH solution mixture to a total of 500 mL, and add the solvents, in turn, every 30 min in a 70 °C constant temperature water bath until the tree core sample turns white and semitransparent, then rinse with distilled water.
(4) Next, add 100 mL 10% NaOH solution, 17% NaOH solution and 1% HCl solution into the beaker in sequence. Wash the laths with distilled water when the acid–base indicator shows neutral, then air dry at room temperature.
(5) Remove the samples from the PTFE box and separate the individual tree rings by ophthalmologic knife one-by-one from outside to inside on the glass plate under the microscope in the order of year and place the cores of the same year in a glass bottle and mark with the year.

References

  1. Yang, Y.; Zhang, W.; Ren, F.; Wang, G.; Dong, M. Stem radius growth features of Picea meyeri and its relationship with environmental factors at the treeline of Luya Mountain. Acta Ecol. Sin. 2009, 29, 6793–6804. (In Chinese) [Google Scholar] [CrossRef]
  2. Liu, X.; Xu, G.; Wang, W.; Wu, G.; Zeng, X.; An, W.; Zhang, X. Tree-ring stable isotopes proxies: Progress problems and prospects. Quat. Sci. 2015, 35, 1245–1260. (In Chinese) [Google Scholar] [CrossRef]
  3. Chen, T.; Qin, D.; Li, J.; Ren, J.; Sun, W. Response of CO2 concentration parameters and water-use efficiency derived from tree-ring δ13C series to atmospheric CO2 increase. J. Glaciol. Geocryol. 2001, 23, 41–45. (In Chinese) [Google Scholar] [CrossRef]
  4. Chen, T.; Qin, D.; He, Y.; Li, J.; Liu, X.; Ren, J. Feasibility study on extracting atmospheric carbon information from tree-ring carbon sequence. Mar. Geol. Quat. Geol. 2002, 22, 79–83. (In Chinese) [Google Scholar] [CrossRef]
  5. Chen, T.; Chen, F.; An, L.; Liu, X. Variations of tree-ring and foliar δ13C values of Sabina przewalskii with altitude. J. Glaciol. Geocryol. 2004, 26, 767–771. (In Chinese) [Google Scholar] [CrossRef]
  6. Qin, L.; Shang, H.; Zhang, T.; Liu, W.; Zhang, R. Response comparison of the tree-ring δ13C to climate on the southern and northern slopes of Tianshan Mountains. Acta Ecol. Sin. 2021, 41, 5713–5724. (In Chinese) [Google Scholar] [CrossRef]
  7. Jiang, Y.; Yang, Y.; Dong, M.; Zhang, W.; Ren, F. Comparison of radial growth characteristics of Picea meyeri and Larix principis-rupprechtii in Luya mountain. Chin. J. Appl. Ecol. 2009, 20, 1271–1277. (In Chinese) [Google Scholar] [CrossRef]
  8. Zhang, W.; Jiang, Y.; Wang, M.; Zhang, L.; Dong, M.; Guo, Y. The response of radial growth of Picea meyeri with different altitudes on the sunny slope of Luya Mountain to climate warming. Chin. J. Plant Ecol. 2013, 37, 1142–1152. (In Chinese) [Google Scholar] [CrossRef]
  9. Wang, J.; Li, S.; Guo, Y.; Yang, Q.; Ren, R.; Han, Y. Responses of Larix principis-rupprechtii Radial Growth to Climatic Factors at Different Elevations on Guancen Mountain, North-Central China. Forests 2022, 13, 99. [Google Scholar] [CrossRef]
  10. Guo, Y.; Li, S.; Wang, J.; Han, Y. Response divergence of radial growth to climate change in earlywood and latewood of Larix principis-rupprechtii in Luya Mountain. Arid. Zone Res. 2022, 39, 1449–1463. (In Chinese) [Google Scholar] [CrossRef]
  11. Wilson, A.T.; Grinsted, M.J. 12C/13C in cellulose and lignin as palaeothermometers. Nature 1977, 265, 133–135. [Google Scholar] [CrossRef]
  12. Mccarroll, D.; Loader, N.J. Stable isotopes in tree rings. Quat. Sci. Rev. 2004, 23, 771–801. [Google Scholar] [CrossRef]
  13. Borella, S.; Leuenberger, M.; Saurer, M.; Siegwolf, R. Reducing uncertainties in δ13C analysis of tree rings: Pooling, milling, and cellulose extraction. J. Geophys. Res. 1998, 103, 19519–19526. [Google Scholar] [CrossRef]
  14. Ma, L.; Liu, Y.; Zhao, J. Relationship between stable carbon isotope content and environment in tree rings of Pinus Tabulaeformis in Helan Mountain. Environ. Sci. 2003, 24, 49–53. (In Chinese) [Google Scholar] [CrossRef]
  15. Zhao, Y.; Wang, J.; Shang, Z. Sensitivity of tree ring stable carbon isotopes to climate change: Research progress and review. Chin. J. Ecol. 2014, 33, 2538–2547. (In Chinese) [Google Scholar] [CrossRef]
  16. Wu, X. Tree Rings and Climate Change; Beijing Meteorological Press: Beijing, China, 1990. (In Chinese) [Google Scholar]
  17. Macfarlane, C.; Warren, C.R.; White, D.A.; Adams, M.A. A rapid and simple method for processing wood to crude cellulose for analysis of stable carbon isotopes in tree rings. Tree Physiol. 1999, 19, 831–835. [Google Scholar] [CrossRef]
  18. Freyer, H.D.; Belacy, N. 13C/12C records in northern hemispheric trees during the past 500 years—Anthropogenic impact and climatic superpositions. J. Geophys. Res. Ocean. 1983, 88, 6844–6852. [Google Scholar] [CrossRef]
  19. Young, G.H.F.; Bale, R.J.; Loader, N.J.; Mccarroll, D.; Nayling, N.; Vousden, N. Central England temperature since AD 1850: The potential of stable carbon isotopes in British oak trees to reconstruct past summer temperatures. J. Quat. Sci. 2012, 27, 606–614. [Google Scholar] [CrossRef]
  20. Li, Z.; Liu, R.; An, Z.; Liu, Y.; Wu, X. Tree-ring evidence for stable carbon isotopes from increasing atmospheric CO2 concentration since the Industrial Revolution. Chin. Sci. Bull. 1994, 39, 2172–2174. (In Chinese) [Google Scholar]
  21. Xu, H.; Hong, Y.; Zhu, Y.; Liu, G. Information of low cloud amount recorded in δ13C series of tree ring cellulose of Pinus Koraiensis in Antu Area. Geochimica 2002, 31, 309–314. (In Chinese) [Google Scholar] [CrossRef]
  22. Liu, X.; Zhao, L.; Voelker, S.; Xu, G.; Zeng, X.; Zhang, X.; Zhang, L.; Sun, W.; Zhang, Q.; Wu, G.; et al. Warming and CO2 enrichment modified the ecophysiological responses of Dahurian larch and Mongolia pine during the past century in the permafrost of northeastern China. Tree Physiol. 2018, 39, 88–103. [Google Scholar] [CrossRef]
  23. Xu, G.; Liu, X.; Qin, D.; Chen, T.; An, W.; Wang, W.; Wu, G.; Zeng, X.; Ren, J. Climate warming and increasing atmospheric CO2 have contributed to increased intrinsic water-use efficiency on the northeastern Tibetan Plateau since 1850. Trees 2013, 27, 465–475. [Google Scholar] [CrossRef]
  24. Zhang, Y.; Pang, R.; Gu, F.; Liu, S. Temporal-spatial variations of WUE and its response to climate change in alpine area of southwestern China. Acta Ecol. Sin. 2016, 36, 1515–1525. (In Chinese) [Google Scholar] [CrossRef]
  25. Pieters, A.J.; Núñez, M. Photosynthesis, water use efficiency, and the δ13C in two rice genotypes with contrasting response to water deficit. Photosynthetica 2008, 46, 574–580. [Google Scholar] [CrossRef]
  26. Leavitt, S.W.; Szejner, P. Intra-annual tree-ring isotope variations: Do they occur when environment remains constant? Trees 2022, 36, 865–868. [Google Scholar] [CrossRef]
  27. Pu, X.; Wang, X.; Lyu, L. Recent warming-induced tree growth enhancement at the Tibetan treeline and the link to improved water-use efficiency. Forests 2021, 12, 1702. [Google Scholar] [CrossRef]
  28. Quadri, P.; Silva, L.; Zavaleta, E.S. Climate-induced reversal of tree growth patterns at a tropical treeline. Sci. Adv. 2021, 7, eabb7572. [Google Scholar] [CrossRef] [PubMed]
  29. Cao, S.; Feng, Q.; Si, J.; Chang, Z.; Cao, G.; Chen, K. Research on characteristics of water use efficiency variations of Populus euphratica during the growing season in extremely arid region of China. J. Desert Res. 2012, 32, 724–729. (In Chinese) [Google Scholar]
  30. Kannenberg, S.A.; Driscoll, A.W.; Szejner, P.; Anderegg, W.R.L.; Ehleringer, J.R. Rapid increases in shrubland and forest intrinsic water-use efficiency during an ongoing megadrought. Proc. Natl. Acad. Sci. USA 2021, 118, e2118052118. [Google Scholar] [CrossRef]
  31. Zhang, J. Vertical zones of vegetation in Luya Mountain in Shanxi Province. Sci. Geogr. Sin. 1989, 9, 346–353. (In Chinese) [Google Scholar] [CrossRef]
  32. Ma, Z. Shanxi Vegetation; Science and Technology Press: Beijing, China, 2000. (In Chinese) [Google Scholar]
  33. Ge, Q. Climate Change in Past Dynasties of China; Science Press: Beijing, China, 2011. (In Chinese) [Google Scholar]
  34. Yi, L.; Liu, Y.; Song, H.; Li, Q.; Cai, Q.; Yang, Y.; Sun, J. Summer temperature variations since 1676 AD in Luya Mountain, Shanxi Province of China, inferred from tree rings. J. Glaciol. Geocryol. 2006, 28, 330–336. (In Chinese) [Google Scholar] [CrossRef]
  35. Holmes, R.L. Computer-assisted quality control in tree-ring dating and measurement. Tree-Ring Bull. 1983, 43, 69–75. [Google Scholar]
  36. Kagawa, A.; Sano, M.; Nakatsuka, T.; Ikeda, T.; Kubo, S. An optimized method for stable isotope analysis of tree rings by extracting cellulose directly from cross-sectional laths. Chem. Geol. 2015, 393–394, 16–25. [Google Scholar] [CrossRef] [Green Version]
  37. Green, J.W. Methods of Carbonhy Date Chemistry; Academic Press: New York, NY, USA, 1963. [Google Scholar]
  38. Liu, X.; Liu, Y.; Xu, G.; Cai, Q.; An, W.; Wang, W. Pretreatment of tree-ring samples for stable isotope analysis. J. Glaciol. Geocryol. 2010, 32, 1242–1250. (In Chinese) [Google Scholar]
  39. Farquhar, G.D.; O’Leary, M.H.; Berry, J.A. On the relationship between carbon isotope discrimination and intercellular carbon dioxide concentration in leaves. Aust. J. Plant Physiol. 1982, 9, 121–137. [Google Scholar] [CrossRef]
  40. Farquhar, G.D.; Ehleringer, J.R.; Hubick, K.T. Carbon isotope discrimination and photosynthesis. Annu. Rev. Plant Physiol. Plant Mol. Biol. 1989, 40, 503–537. [Google Scholar] [CrossRef]
  41. Liu, Y.; Ma, L.; Cai, Q.; An, Z.; Liu, W.; Gao, L. Reconstruction of summer (June–August) air temperature in Helan Mountain since 1890 using tree ring stable carbon isotopes. Sci. Sin. 2002, 32, 667–674. (In Chinese) [Google Scholar] [CrossRef]
  42. Hu, Z.; Yu, G.; Wang, Q.; Zhao, F. Ecosystem level water use efficiency: A review. Acta Ecol. Sin. 2009, 29, 1498–1507. (In Chinese) [Google Scholar] [CrossRef]
  43. Wang, J.; He, Q.; Shang, Z.; Qian, J.; Yang, H.; Zhao, X. Sensitivity of the pine tree δ13C on MT. Zijin at Nanjing to climatic change. Resour. Environ. Yangtze Basin 2012, 21, 1106–1111. (In Chinese) [Google Scholar]
  44. Sidorova, O.V.C.; Myglan, V.S.; Fonti, M.V.; Saurer, M. Isotopic responses to dry and wet episodes as captured in tree rings of southern Altai relict forests. Eur. J. For. Res. 2021, 140, 527–535. [Google Scholar] [CrossRef]
  45. Pu, X.; Wang, X.; Lyu, L. Tree-Ring isotopes provide clues for sink limitation on treeline formation on the Tibetan Plateau. Atmosphere 2021, 12, 540. [Google Scholar] [CrossRef]
  46. Pandey, S.; Cherubini, P.; Saurer, M.; Carrer, M.; Petit, G. Effects of climate change on treeline trees in Sagarmatha (Mt. Everest, Central Himalaya). J. Veg. Sci. 2020, 31, 1144–1153. [Google Scholar] [CrossRef]
  47. Zheng, Z. The Analysis of the Stable Carbon Isotope Composition of Tree Rings of Pinus Thunbergii and Climate Significance in Tashan Mountain, Shandong Province. Master’s Thesis, Shandong Normal University, Jinan, China, 2014. [Google Scholar]
  48. Liu, Y.; Wang, Y.; Li, Q.; Song, H.; Linderholm, H.W.; Leavitt, S.W.; Wang, R.; An, Z. Tree-ring stable carbon isotope-based May-July temperature reconstruction over Nanwutai, China, for the past century and its record of 20th century warming. Quat. Sci. Rev. 2014, 93, 67–76. [Google Scholar] [CrossRef]
  49. Zhou, J.; Meng, P.; Zhang, J.; Guan, C.; Sun, S. Differences in the response of radial growth and intrinsic water use efficiency of Robinia pseudoacacia to climatic factors in Minquan of He’nan province and Baishui of Shaanxi Province. For. Res. 2021, 34, 1–8. (In Chinese) [Google Scholar] [CrossRef]
  50. Treml, V.; Tumajer, J.; Jandová, K.; Oulehle, F.; Rydval, M.; Čada, V.; Treydte, K.; Mašek, J.; Vondrovicová, L.; Lhotáková, Z.; et al. Increasing water-use efficiency mediates effects of atmospheric carbon, sulfur, and nitrogen on growth variability of central European conifers. Sci. Total Environ. 2022, 838, 156483. [Google Scholar] [CrossRef]
  51. Manrique-Alba, À.; Beguería, S.; Tomas-Burguera, M.; Camarero, J.J. Increased post-drought growth after thinning in Pinus nigra plantations. Forests 2021, 12, 985. [Google Scholar] [CrossRef]
  52. Zhang, W.; Jiang, Y.; Dong, M.; Kang, M.; Yang, H. Relationship between the radial growth of Picea meyeri and climate along elevations of the Luyashan Mountain in North-Central China. For. Ecol. Manag. 2012, 265, 142–149. [Google Scholar] [CrossRef]
  53. Liu, N.; Liu, Y.; Zhou, Q.; Bao, G. Droughts and broad-scale climate variability reflected by temperature sensitive tree growth in the Qinling Mountains, central China. Int. J. Biometeorol. 2013, 57, 169–177. [Google Scholar] [CrossRef]
  54. Liang, E.; Shao, X.; Hu, Y.; Lin, J. Dendroclimatic evaluation of climate-growth relationships of Meyer spruce (Picea meyeri) on a sandy substrate in semi-arid grassland, north China. Trees 2001, 15, 230–235. [Google Scholar] [CrossRef]
  55. Liang, E.; Shao, X.; Kong, Z.; Lin, J. The extreme drought in the 1920s and its effect on tree growth deduced from tree ring analysis: A case study in North China. Ann. For. Sci. 2003, 60, 145–152. [Google Scholar] [CrossRef] [Green Version]
  56. Fan, R.; Tanekura, K.; Morozumi, T.; Shingubara, R.; Tei, S.; Nogovitcyn, A.; Starostin, E.; Maximov, T.C.; Sugimoto, A. Adaptation of Willows in River Lowlands to Flooding under Arctic Amplification: Evidence from Nitrogen Content and Stable Isotope Dynamics. Wetlands 2020, 40, 2413–2424. [Google Scholar] [CrossRef]
  57. Liu, W.; Cao, W. Niche characteristics of main plant species in spruce-fir forests in Changbai Mountains. Chin. J. Ecol. 2011, 30, 1766–1774. (In Chinese) [Google Scholar] [CrossRef]
Figure 1. Distribution of meteorological station and tree ring sample sites.
Atmosphere 14 00615 g001
Figure 2. Precipitation, average temperature, maximum temperature and minimum temperature in the study area from 1957 to 2020.
Atmosphere 14 00615 g002
Figure 3. Standard chronologies and sample sizes of the annual ring widths of picea meyeri on Luya Mountain.
Atmosphere 14 00615 g003
Figure 4. Tree ring δ13C of Picea meyeri chronologies on Luya mountain.
Atmosphere 14 00615 g004
Figure 5. Calibrated tree ring δ13C of Picea meyeri chronologies on Luya mountain.
Atmosphere 14 00615 g005
Figure 6. Inter-annual variations of WUE of Picea meyeri on Luya mountain.
Atmosphere 14 00615 g006
Figure 7. Correlations between δ13C of Picea meyeri and monthly meteorological factors on Luya mountain (c represents the current year and p represents the previous year; * and ** symbol represent significant correlation at the 0.05 and 0.01 level, respectively).
Atmosphere 14 00615 g007
Figure 8. Variation trend of annual mean temperature and annual mean precipitation in the study area from 1957 to 2020.
Atmosphere 14 00615 g008
Figure 9. Correlations between WUE of Picea meyeri and monthly meteorological factors on Luya mountain (c represents the current year and p represents the previous year; * and ** symbol represent significant correlation at the 0.05 and 0.01 level, respectively).
Atmosphere 14 00615 g009
Table 1. The relationship between δ13C and WUE of Picea meyeri and annual meteorological factor on Luya mountain.
TmeanPmeanTmaxTminRHVPD
δ 13 C −0.711 **−0.005−0.676 **−0.1620.347 **0.263 *
WUE0.718 **−0.0610.457 **0.424 **−0.342 **−0.254 *
* and ** symbol represent significant correlation at the 0.05 and 0.01 level, respectively.
Disclaimer/Publisher’s Note: The statements, opinions and data contained in all publications are solely those of the individual author(s) and contributor(s) and not of MDPI and/or the editor(s). MDPI and/or the editor(s) disclaim responsibility for any injury to people or property resulting from any ideas, methods, instructions or products referred to in the content.

