Article

Emission Source Areas of Fine Particulate Matter (PM2.5) in Ho Chi Minh City, Vietnam

by
Tuyet Nam Thi Nguyen
1,*,
Nguyen Xuan Du
2 and
Nguyen Thi Hoa
1
1
Faculty of Environment, Saigon University (SGU), Ho Chi Minh City 74900, Vietnam
2
Division of Project and Infrastructure Management, Saigon University (SGU), Ho Chi Minh City 74900, Vietnam
*
Author to whom correspondence should be addressed.
Atmosphere 2023, 14(3), 579; https://doi.org/10.3390/atmos14030579
Submission received: 26 February 2023 / Revised: 12 March 2023 / Accepted: 14 March 2023 / Published: 17 March 2023
(This article belongs to the Special Issue Air Quality in Metropolitan Areas and Megacities)

Abstract

:
This study aims to determine emission source areas of fine particulate matter (PM2.5) in Ho Chi Minh (HCM) City, Vietnam, using a conditional bivariate probability function (CBPF) and hybrid receptor models, including three-dimensional potential source contribution function (3D-PSCF) and concentration-weighted trajectory (3D-CWT), considering latitudes, longitudes, and height of trajectory segments. Uncertainties of the CBPF and 3D-PSCF/3D-CWT were evaluated based on the 95th confidence intervals and 95% confidence levels, respectively. For the local scale, PM2.5 in HCM City was primarily emitted from shallow or common ground sources (e.g., vehicle emissions) throughout the year. Regarding non-local source areas, PM2.5 in HCM City is contributed by those originated from the East Sea (e.g., shipping emissions) and southeastern Vietnam (e.g., Binh Duong and Dong Nai provinces) having several industrial zones with PM2.5 emission sources, especially in the dry season (December to April of the following year). In the rainy season (May–November), PM2.5 derived from emission sources in the Mekong Delta (e.g., biomass burning) might be transported to HCM City. However, contribution of the non-local sources to PM2.5 pollution in HCM City during the rainy season is less important because of PM2.5 deposition stemmed from the high rainfall amount in this season.

1. Introduction

Vietnam is situated in Southeast Asia, bordered to the west by Laos and Cambodia and to the north by China. The Vietnamese economy is one of the most rapidly rising in Asia. Additionally, Vietnam has become a long-term desirable market because of its average annual growth rate of gross domestic product, steady population growth, and prosperity increase [1]. Most of Vietnam’s area is covered by mountains and hills, with the remainder being flat plains. In addition, the topography of Vietnam diminishes from the northwest to the southeast, causing Vietnamese’s climate to change significantly according to latitude and relief [2]. Particularly, northern Vietnam experiences significant temperature variations among seasons (i.e., spring, summer, fall, and winter), whereas southern Vietnam is mostly warm throughout the year and has two seasons per year (i.e., dry and rainy seasons) [3].
Ho Chi Minh (HCM) City, located in southern Vietnam, is the political, economic, and cultural hub of the country. Due to its high population and traffic density [4], HCM City has faced several environmental problems, including air pollution. The levels of air pollutants in HCM City, such as particulate matter (PM), nitrogen oxide (NOx), sulphate dioxide (SO2), carbon monoxide (CO), and ozone (O3), were reported to noticeably exceed the thresholds for air pollutants introduced by the World Health Organization (WHO) and Vietnamese government [5,6,7]. In particular, considering the global air quality guidelines suggested by WHO, the 24 h (annual) average concentrations of PM2.5 (PM lower than 2.5 μm), PM10 (PM lower than 10 μm), NO2, and SO2 are 15 (5), 45 (15), 25 (10), and 40 μg m−3, respectively [8]. For the Vietnamese air quality guidelines, the thresholds for 24 h (annual) average concentrations of PM2.5, PM10, NO2, and SO2 are 50 (25), 150 (50), 100 (40), and 125 (50) μg m−3, respectively [9]. Regarding air pollution in HCM City, the 24 h (annual) average concentrations of PM2.5, PM10, NO2, and SO2 were reported as (36.3), 73, 22, and 22 μg m−3, respectively [5,6]. These concentrations relatively reached the thresholds issued by the Vietnamese government but were 2–6 times higher than the those introduced by WHO. Thus, exposure to these pollutants (i.e., PM, NOx, SO2, CO, and O3) through inhalation and/or dermal contact can adversely affect human health. Of these pollutants, fine particulate matter, also called PM2.5, is one of the most frequently monitored pollutants [10] because compositions of PM2.5 can contain several toxic chemicals, such as trace metals (e.g., arsenic, lead, and mercury), organic compounds (e.g., polycyclic aromatic hydrocarbons and polychlorinated biphenyls), and inorganic compounds (e.g., anions and cations). In addition, PM2.5 has a small size (i.e., lower than 2.5 μm), thus, it can deeply penetrate the human respiratory system and cause many diseases, such as lung irritation, coughing, asthma, and lung cancer [11].
Based on the emission inventory analysis, PM2.5 in HCM City has been noted to be mainly emitted from transportation activities, industrial productions, and household emissions [12,13,14]. Additionally, according to directions of backward air trajectories, several regions were reported to be the possible emission source areas of PM2.5 in HCM City, such as the Mekong Delta at southwestern HCM City [5,15], and some provinces in southeastern Vietnam, including Binh Duong, Dong Nai, and Binh Phuoc provinces [14]. However, to improve the accuracy of source area identification, the backward air trajectories should be associated with PM2.5 concentrations at the receptor site [16]. Moreover, information on determining the emission source areas of PM2.5 in HCM City using receptor models, linking air parcels or winds to pollutant concentrations, is limited. Thus, studies on this issue are essential to further understand PM2.5 pollution and support decision-making related to atmospheric contamination in HCM City, a metropolis of Vietnam.
To identify emission source areas of PM2.5, conditional bivariate probability function (CBPF) and hybrid receptor models can be used. The CBPF approach combines pollutant concentrations at receptor site, wind direction, and wind speed to determine emission source areas of pollutants [17]. In addition, the CBPF has been widely used to determine local source areas of air pollutants [18,19,20,21] because pollutant dispersion on a local scale (e.g., over a small area) is mainly affected by wind. Added to this, a combination of the CBPF prediction surfaces and their lower/upper 95th confidence intervals should be employed to increase reliability of the emission source areas [22]; however, this approach has not been commonly used in previous studies [18,19,20]. The hybrid receptor models combine pollutant concentrations and geocoordinates of backward air trajectories arriving at the receptor site; therefore, this model type can be used to identify emission source areas of air pollutants at a non-local scale (e.g., over several hundred to thousands of kilometers from the receptor site) [16,23,24]. Of these models, potential source contribution function (PSCF) and concentration-weighted trajectory (CWT) models have been extensively applied because of their relatively straightforward performance [25]. Particularly, in the PSCF/CWT analysis, the study area is divided into numerous grid cells. The value of each is determined based on the endpoints of air trajectories falling inside each cell together with the pollutant concentrations associated with the air trajectories [26]. Generally, grid cells with high PSCF/CWT values are suggestive of emission source areas of air pollutants [27].
Recently, three-dimensional (3D) hybrid receptor models, considering longitudes, latitudes, and heights of trajectory segments, have been introduced and widely applied to improve the accuracy of model outputs [18,23,28,29]. One of the approaches is to consider trajectory segments transporting within the air mixing layer [18,30], since air pollutants are well-mixed and diffused in this layer once they are released [31]. Added to this, air trajectory segments higher than the mixing heights are likely to capture air pollutants originated from other source areas [18]. Therefore, the 3D hybrid receptor models (e.g., 3D-PSCF and 3D-CWT), considering vertical transport of trajectory segments, have been reported to identify emission source areas of air pollutants more effectively. Additionally, uncertainties of the 3D hybrid receptor models should be evaluated to limit the misinterpretation of source areas, which can be stemmed from a small number of trajectory segments [32] and/or trailing effects [16]. In this regard, a weighting function can be used to lower the uncertainty of 3D hybrid receptor models [32] and it has been shown to noticeably affect the output of 3D-PSCF/3D-CWT [18]. However, previous studies mostly used a single set of the weighting functions, which can lead to the omission in identifying emission source areas. Consequently, various sets of the weighting functions should be used to avoid this limitation and provide uncertainty of the 3D hybrid receptor models.
This study aims to identify emission source areas of PM2.5 in HCM City at local and non-local scales (i.e., inside and outside the city, respectively), utilizing the CBPF, 3D-PSCF, and 3D-CWT models. In addition, variations in the PM2.5 mass concentrations and their relationships with several meteorological parameters (e.g., air temperature, air pressure, and wind speed) are evaluated. Notably, uncertainties of the CBPF and 3D-PSCF/3D-CWT were evaluated based on the upper/lower 95th confidence intervals and the 95% confidence levels, respectively. The findings of this study add to the understanding of identifying emission source areas of PM2.5 and to the decision-making related to air pollution reduction in HCM City, a metropolis of Vietnam.

2. Materials and Methods
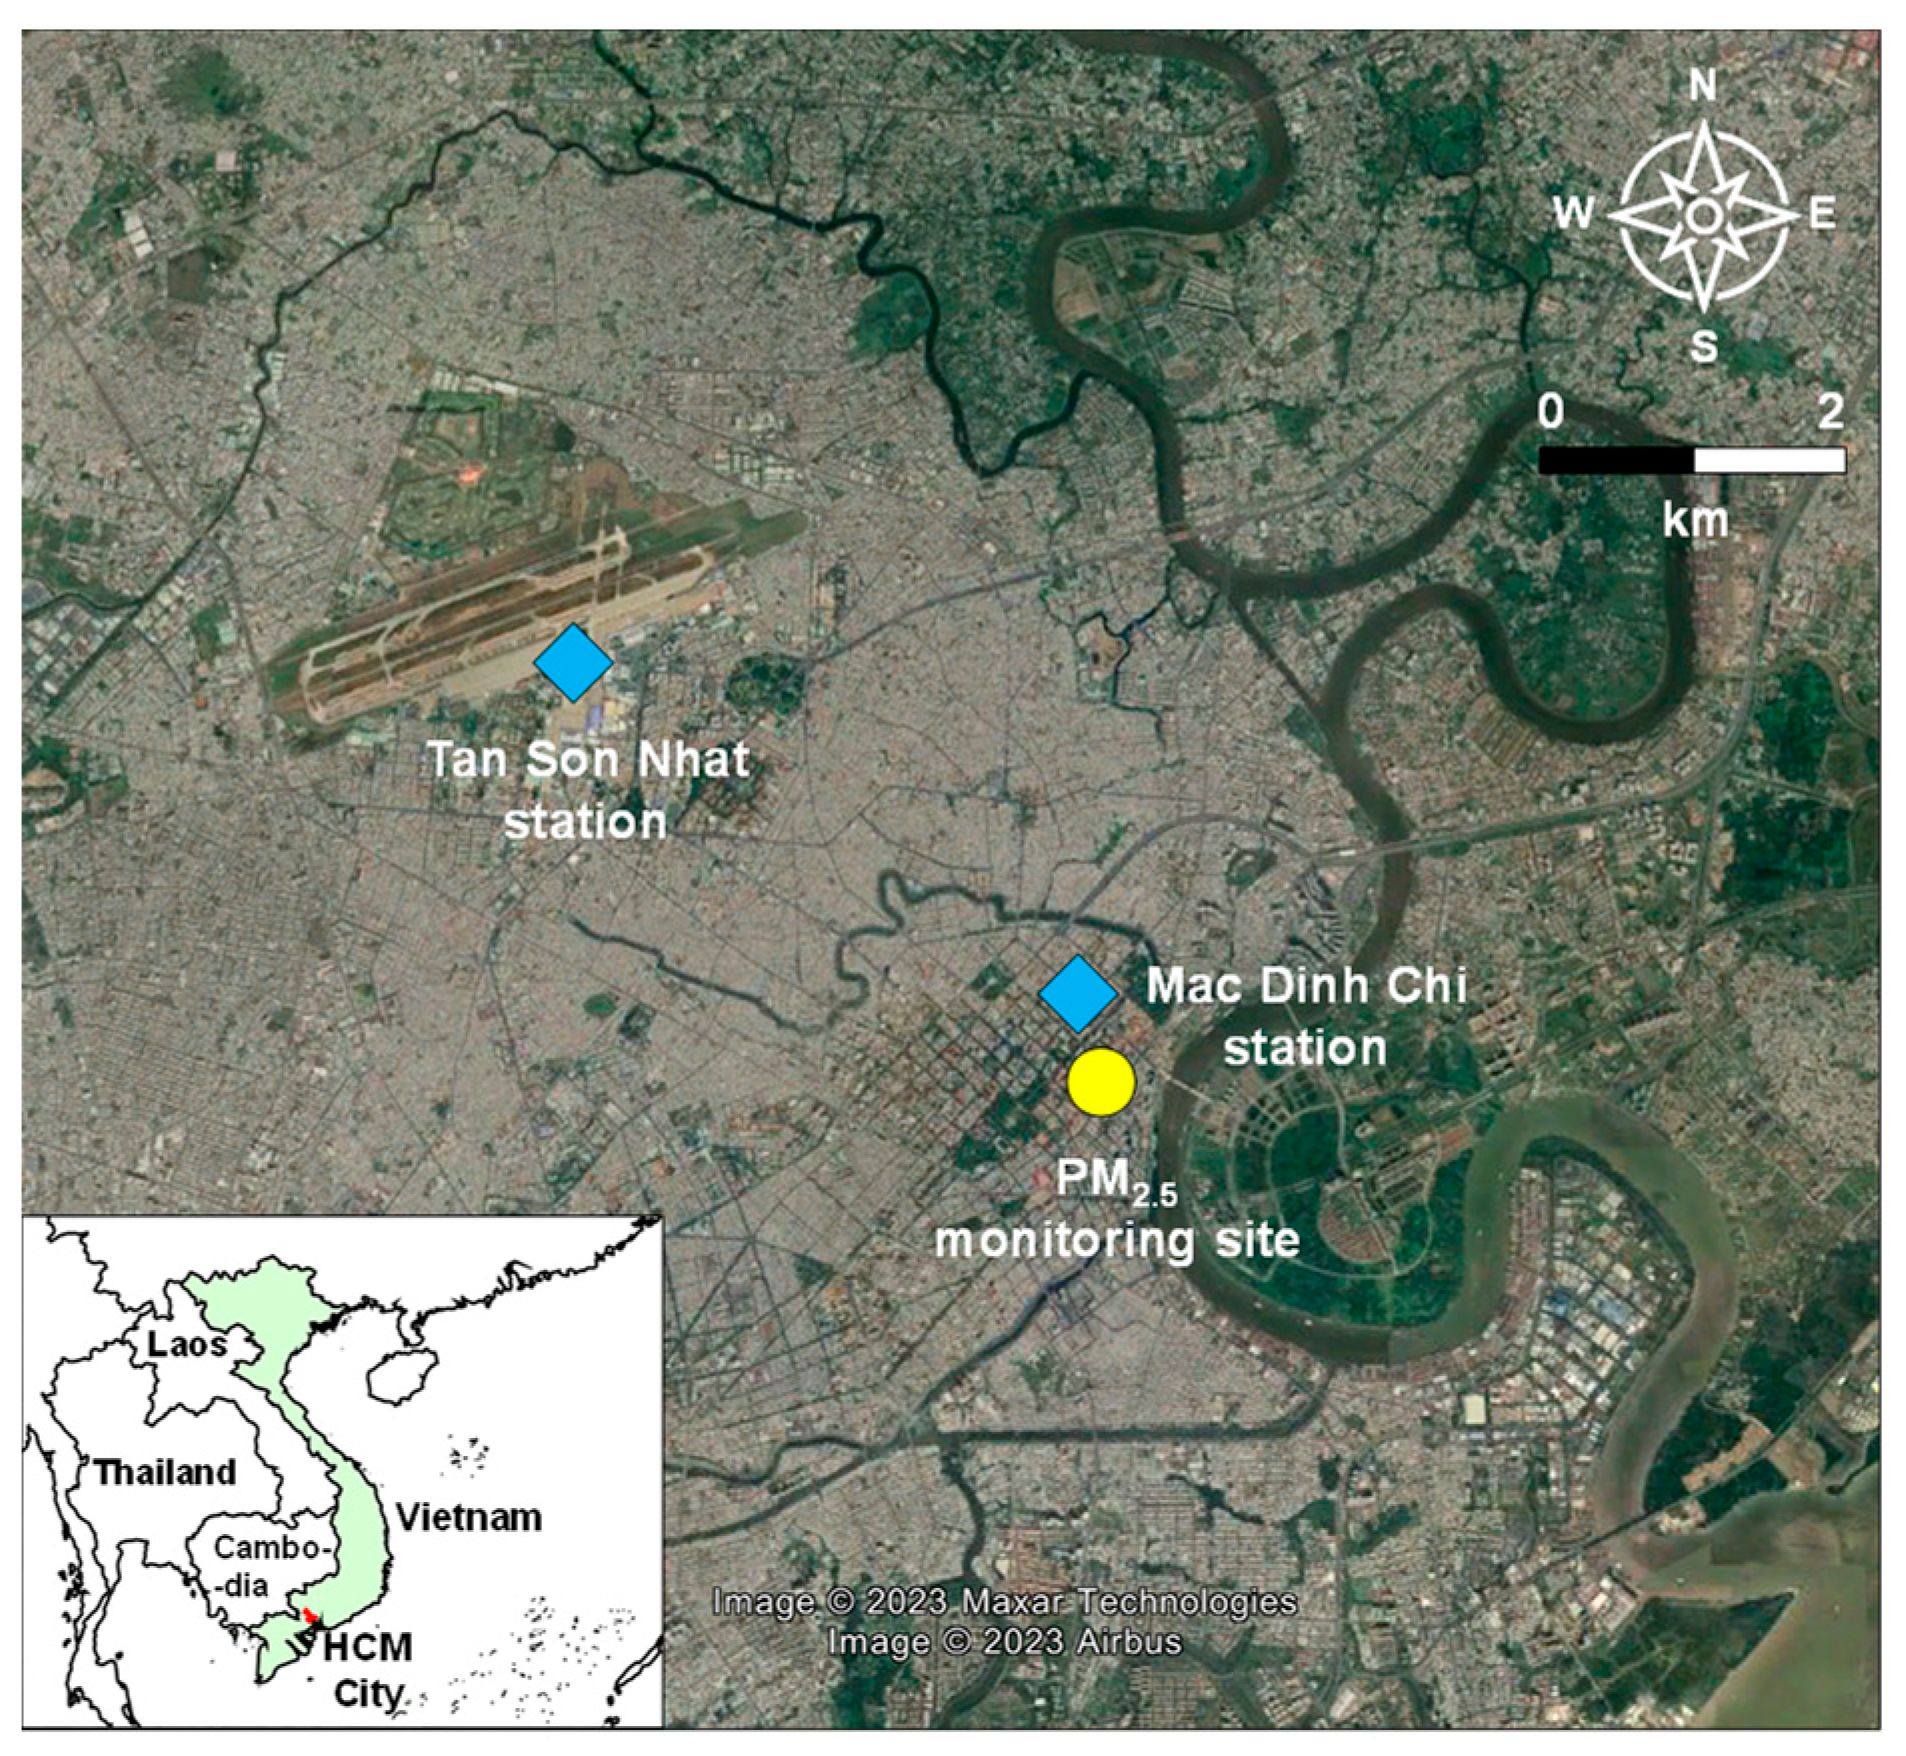
2.1. Study Area

Ho Chi Minh (HCM) city has two distinct seasons: the dry season lasting from December to April of the following year and the rainy season covering a period from May to November [4]. The average ambient air temperature and annual rainfall amount of HCM City are approximately 28.4 °C and 2100 mm, respectively [2]. The ambient air temperature of the dry season (28.1–29.3 °C) tends to be higher than that of the rainy season (26.9–27.5 °C) [4]. In addition, the rainfall amount is relatively low in the dry season; however, it rises dramatically in the rainy season and accounts for approximately 80–90% of the total annual rainfall amount, owing to the frequency of rain events in the rainy season [2].
In terms of air pollution, transportation activities have been noted as one of the primary emission sources of air pollutants (e.g., PM2.5, NOx, SO2, CO, and volatile organic compounds (VOCs)) in HCM City [12,14] due to many vehicles (e.g., approximately 8 million) operating in the city [33]. Furthermore, industrial activities, especially textile and food industrial production, have also been one of the main emission sources of air pollutants in HCM City [12,14,34] because fossil fuels, such as diesel oil and coal, are used in the manufacture of these industrial types [12].

2.2. Data Collection

2.2.1. Mass Concentrations of PM2.5

The hourly mass concentrations of PM2.5 from 1 January 2019 to 31 December 2020 in this study were obtained from the air pollutant data which are available via the US Environmental Protection Agency (EPA) and the AirNow platform (https://www.airnow.gov/international/, accessed on 15 March 2021), accessed on 15 March 2021. The monitoring site (latitude: 10°47′0.1″ N and longitude: 106°42′2.2″ E) is located at the US Consulate General Ho Chi Minh City in a downtown area of District 1, HCM City (Figure 1). The mass concentrations of PM2.5 were determined based on the beta-ray attenuation method [35,36], meaning that the relative shift in the intensity of beta ray passing through un-sampled and sampled filter tapes was used to calculate the mass of PM2.5 depositing on the filters [37]. The dataset of PM2.5 mass concentrations was firstly checked for invalid values (i.e., QC invalid labeled, missing, negative, and impossibly high values). The invalid data, accounting for 2.99% of the whole dataset, was regarded as null data and filled in using linear interpolation [38]. Consequently, the final dataset had a total number of 17,520 values of the PM2.5 mass concentrations.

2.2.2. Meteorological Data

Apart from the PM2.5 mass concentrations, meteorological data in HCM City (i.e., ambient air temperature, wind speed, wind direction, dewpoint temperature, and air pressure) were also gathered to understand relationships between the meteorological parameters and the PM2.5 mass concentrations in HCM City. The hourly data of these meteorological parameters were downloaded from the National Centers for Environmental Information (NCEI) (https://www.ncei.noaa.gov/maps/hourly/, accessed on 15 March 2021) and the selected station is Tan Son Nhat (ID: 4890009999, latitude: 10°49′2″ N, longitude: 106°40′1″ E) (Figure 1). In addition, hourly data of relative humidity in the study period (1 January 2019–31 December 2020) were calculated based on the downloaded data of the ambient air temperature and dewpoint temperature data following Lawrence [39]. Data on the rainfall amount in HCM City during the study period were also obtained from the Mac Dinh Chi station (latitude: 10°47′2″ N, longitude: 106°42′1″ E) (Figure 1), operated by the Hydrometeorological Observatory, Southern region of Vietnam.

2.2.3. Satellite-Derived Data

The satellite-derived data, including aerosol optical depth (AOD) and incoming shortwave flux in the study period (i.e., 1 January 2019 to 31 December 2020), were also collected to support the result interpretation. In particular, this study used the daily AOD at 550 nm with 1 degree spatial resolution from the Moderate Resolution Imaging Spectroradiometer (MODIS) onboard the Terra satellite [40]. The bounding domain for downloading the AOD values was 85°–125° E and 5°–30° N. Additionally, to know the solar radiation intensity in HCM City, hourly data on incoming shortwave flux for 0.5° × 0.625° grid cells over a domain encompassing 10.5°–11° E and 106.5°–107° N were obtained from the Modern-Era Retrospective Analysis for Research and Applications version 2 (MERRA-2) [41]. Moreover, precipitation data over the study area were obtained from the Integrated Multi-satellite Retrievals for Global Precipitation Measurement (GPM IMERG) final product [42] to support the interpretation of PM2.5 transport from non-local source areas to HCM City.

2.3. Conditional Bivariate Probability Function (CBPF)

To identify emission source types (e.g., stack and shallow level sources) and emission source areas of PM2.5 at a local scale (i.e., inside HCM City), the CBPF tool can be used [17]. This is because diffusion of PM2.5 at the local scale (e.g., over a small area) is mostly affected by wind speed that is associated with the CBPF. The CBPF for the dry and rainy seasons of HCM City were calculated using this equation [17]:
  CBPF θ , u = m θ , u | C     x n θ , u
where ∆θ and ∆u indicate wind sector and wind speed, respectively. C is the PM2.5 mass concentration higher than threshold x (i.e., 75th percentiles of the PM2.5 mass concentrations) connected with wind sector ∆θ and wind speed ∆u. mθ,∆u is the number of times the PM2.5 mass concentrations in wind sector ∆θ and for wind speed ∆u greater than the threshold x. nθ,∆u represents the total number of samples for the corresponding wind sectors and wind speed intervals. Considering the CBPF uncertainty, this study simultaneously used the prediction and uncertainty CBPF plots, showing the predicted emission source areas and the lower or upper 95% confidence intervals, respectively [22]. The CBPF uncertainty plots were computed using the Generalized Additive Model (GAM) [22,43]. The openair package [22] installed in the RStudio Desktop [44], an open-source software, was used to generate the CBPF prediction and uncertainty plots. Generally, the potential source areas contributing to the higher mass concentrations of PM2.5 are marked by the high CBPF probabilities. Additionally, areas with similar probabilities between the prediction and uncertainty plots indicate emission source areas having high reliability. On the other hand, the suggested source areas are relatively uncertain due to a lack of data on the corresponding wind speed and wind sector [43].

2.4. Backward Air Trajectory and Trajectory Cluster Analysis

2.4.1. Backward Air Trajectory

The emission source areas of PM2.5 on the non-local scale (i.e., outside HCM City) can be identified using the 3D-PSCF and/or 3D-CWT models adopting the backward air trajectory [45]. This study used the Hybrid Single-Particle Lagrangian Integrated Trajectory (HYSPLIT) model version 5.1.0 [46] coupled with Global Data Assimilation System (GDAS1) meteorological data (https://www.ready.noaa.gov/gdas1.php, accessed on 15 March 2021) to simulate the backward air trajectories arriving at the PM2.5 monitoring site in HCM City from 1 January 2019 to 31 December 2020. The total run time for backward air trajectory simulation was 96 h (4 days), and the starting heights of the trajectories were set at 50% and 100% of the mixing layer height at the receptor site to acquire high resolution of the hybrid receptor model. A total of 35,040 air trajectories (365 monitoring days × 2 years × 2 starting heights × 24 hrs/day) were used in this study. The uncertainty of air trajectory simulation was also considered by removing trajectory segments exceeded 50% of the mixing layer height [18].

2.4.2. Trajectory Cluster Analysis

To determine the main directions of backward air trajectories, trajectory cluster analysis, performed using TrajStat 1.5.3 [27], was used to group the air trajectories according to their directions and lengths. The Euclidean distance was selected for the clustering and was calculated based on this equation.
d 12 =   i = 1 n [ X 1   ( i )     X 2   ( i ) ] 2 + [ Y 1   ( i )     Y 2   ( i ) ] 2  
where d12 indicates the Euclidean distance between two backward trajectories. X1, X2 and Y1, Y2 represent the latitudes and longitudes of these trajectories, respectively. The fluctuation in the total spatial variance (TSV) was computed to identify the number of clusters, and a significant change in the TSV implies an adequate cluster number [47].

2.5. Three-Dimensional Hybrid Receptor Models

To determine emission source areas of PM2.5 in HCM City at the non-local scale (i.e., outside HCM City), this study used the 3D-PSCF and 3D-CWT models, considering the heights, latitudes, and longitudes of trajectory segments. The 3D-PSCF model was computed following Equation (3) [16].
3 D - PSCF = m i j n i j
where 3D-PSCF represents the three-dimensional potential source contribution function. mij is the number of endpoints falling within cell (i,j) when the PM2.5 mass concentrations are higher than the threshold values (i.e., 75th percentiles). nij denotes the number of times the trajectories were processed as described in Section 2.4.
The 3D-CWT model was also computed to confirm the PM2.5 emission source areas suggested by the 3D-PSCF and to clarify source areas with high, moderate, and low emissions [16]. The 3D-CWT model was calculated using Equation (4) [16].
3 D - CWT = 1 l = 1 M τ i j l   ×   l = 1 M ( C j   ×   τ i j l )  
where M denotes the total number of backward air trajectories, τijl is the endpoint number of trajectory l falling in cell (i,j) and processed as described in Section 2.4. Cj is the PM2.5 mass concentrations at the receptor site. The 3D-PSCF and 3D-CWT models were performed independently for the dry and wet seasons. In addition, the model outputs were multiplied by weighting functions (W) to reduce uncertainty of the 3D-PSCF and 3D-CWT values stemming from the low values of nij and τijl. The bootstrapping technique was applied to generate the W values by assuming the W to follow data distribution referred in previous studies [18,24,27,29,48]. The W were then simulated repeatedly 500 times before being multiplied by the 3D-PSCF and 3D-CWT values. Following this approach, the 3D-PSCF and 3D-CWT values were also generated 500 times, and their upper confidence levels were reported. The W values and their distribution are shown in Equation (5).
W = { 1 . 00   ( constant   distribution ) ,   2 s     N 0 . 50 0 . 70   ( min - max   distribution ) ,   s     N   <   2 s 0 . 25 0 . 42   ( min - max   distribution ) ,   0 . 5 s     N   <   s 0 . 05 0 . 17   ( min - max   distribution ) ,   N     0 . 5 s
where s is the average number of trajectory endpoints per cell, which are 11 and 30 for the dry and rainy seasons, respectively. N is the total number of trajectory endpoints in each grid cell. The 3D-PSCF and 3D-CWT models were computed for 0.25° × 0.25° grid cells over a domain surrounding 85°–125° E and 5°–25° N using the TrajStat tool [27]. Generally, areas showing the high 3D-PSCF or 3D-CWT values can be considered as possible source areas of PM2.5 [16].

2.6. Data Visualization and Statistical Analysis

The 3D-PSCF and 3D-CWT values were illustrated using ArcMap software version 10.8 (ESRI, USA). In addition, the OriginPro software version 2020 (Origin Lab, USA) was used to plot the PM2.5 mass concentrations and values of the meteorological parameters, as well as to conduct the statistical analysis, including the statistical hypothesis test, correlation analysis, and partial least squares regression (PLS). The PLS was used to evaluate the relations between PM2.5 mass concentrations and meteorological parameters since this approach can effectively deal with multicollinearity problem [49], which is the linear relationships among independent variables (i.e., the meteorological parameters) in the regression analysis causing less reliable results of the regression model [50].

3. Results and Discussion

3.1. Mass Concentrations of PM2.5

In general, the mean of PM2.5 mass concentrations in the dry and rainy seasons of HCM City were 25.2 and 23.9 μg m–3, respectively. The relatively lower mass concentrations of PM2.5 in the rainy season is contributed by the higher rainfall amount in this season (Figure S1 in the Supplementary Information), removing PM2.5 from the atmosphere via wet deposition [51]. In addition, November exhibited the highest mean PM2.5 mass concentration (35.1 μg m–3), followed by December (33.4 μg m–3) and January (32.7 μg m–3) (Figure 2a). The lower ambient air temperature of these months (27.6±0.4 °C), compared with the others (28.8 ± 1.0 °C) (Figure S2), can lead to the lower air mixing height in these months (i.e., November, December, and January) [51], enhancing the PM2.5 accumulation and resulting in the greater PM2.5 mass concentrations in November, December, and January. Moreover, the highest PM2.5 mass concentration in November would also be contributed by the temperature inversion, which discourages dispersion of air pollutants and contributes to their higher concentrations [52], since the temperature inversion can more frequently occur in November [53]. The lowest mean concentrations of PM2.5 were found in March (16.8 μg m–3), followed by August (18.2 μg m–3) (Figure 2a). These observations are due to the highest wind speeds in March and August (Figure S3) increasing the PM2.5 dispersion and leading to a decrease in PM2.5 mass concentrations.
In terms of diurnal variation, PM2.5 mass concentrations in the dry and rainy seasons of HCM City had a unimodal distribution, with a significant peak in the morning rush hours (i.e., 7:00–9:00 LT) (Figure 2b,c). After this peak, the PM2.5 mass concentrations were gradually decreased until late afternoon (e.g., 16:00 LT) and slightly increased around evening rush hours (e.g., 17:00–19:00 LT). Then PM2.5 reached the lowest mean concentrations at midnight (e.g., 23:00 to 1:00 LT) and increased gradually to peak around the morning rush hours (e.g., 7:00–9:00 LT) (Figure 2b,c). The highest PM2.5 mass concentrations in the morning rush hours of both the dry and rainy seasons are primarily due to the dense automobiles (e.g., bus, car, and motorbike) during this period [54,55]. Transportation activities have also been mentioned as an important emission source of PM2.5 in HCM City [12,56]. Furthermore, the lower PM2.5 mass concentration after the morning rush hours until late afternoon (e.g., 16:00 LT) can be due to a decline in vehicle exhaust after rush hours and an expansion of planetary boundary layer, enhancing the diffusion of air pollutants during daytime [51].
Notably, no obvious peaks in the PM2.5 mass concentrations were observed in the evening rush hours (e.g., 17:00–18:00 LT) (Figure 2b,c) when the significant vehicle density also occurs. This finding is consistent with previous studies on PM2.5 pollution in HCM City [5] and suggests that the highest PM2.5 mass concentrations in the morning rush hours might be affected by not only vehicle emissions but also other factors, such as secondary organic aerosol (SOA). The SOA can be formed from the nucleation or condensation of pre-existing particles [57,58] and oxidation of VOCs [59]. The VOCs can be originated from transportation activities [60] and can react with free radicals, such as OH, O3, and NO3, to form low-volatility products, subsequently condensing onto particles to form SOA [61,62]. Moreover, the higher solar radiation in the morning (Figure S4) would promote the formation of radicals (i.e., OH, O3, and NO3) through photochemical reactions [63], and thus, increase the SVOCs oxidation to form more SOA.
The PM2.5 mass concentrations observed in this study were compared with those in previous studies on PM2.5 pollution in Vietnam and other countries in Southeast Asia. Generally, the mass concentrations of PM2.5 in HCM City were approximately 3 times lower than those in Ha Noi City, the capital of Vietnam [64,65], and were comparable with those in some other cities of Southeast Asia, such as Bangkok in Thailand [66,67] Bandung in Indonesia [68] and Kuala Lumpur in Malaysia [69]. More information about this comparison is shown in Table S1. In addition, the relationships between several meteorological parameters and the PM2.5 mass concentrations were evaluated using the PLS approach and correlation analysis. Briefly, wind speed showed the significantly negative relations with the PM2.5 mass concentrations in the dry and rainy seasons (Figures S5 and S6). The relative humidity and ambient air temperature also had the remarkably negative relations to the PM2.5 mass concentrations, especially in the rainy season (Figures S5 and S6). More discussion on this issue is presented in Text S1.

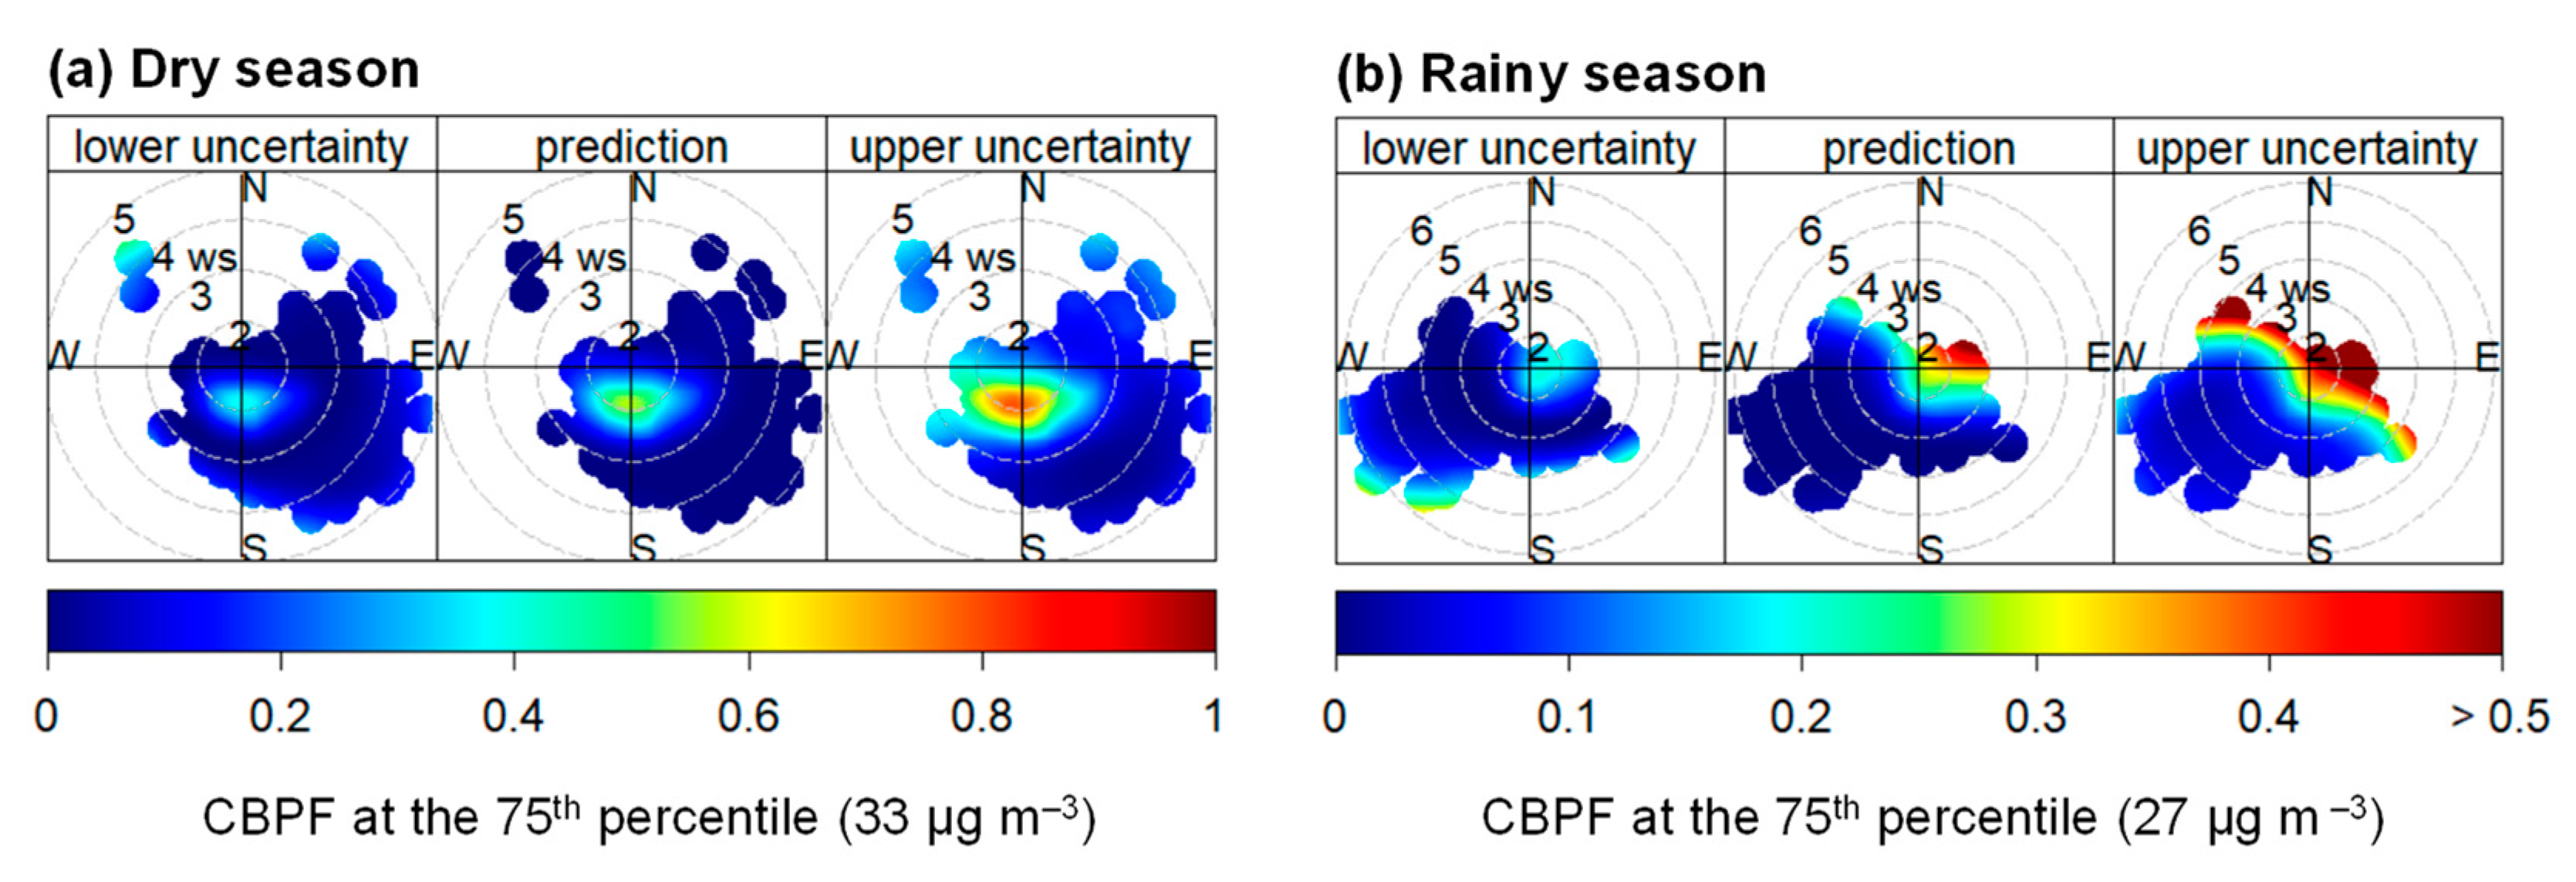
3.2. Local Emission Source Areas of PM2.5

The CBPF plots for identifying emission source areas of PM2.5 at the local scale (i.e., inside HCM City) are shown in Figure 3. Three same-scale plots were simultaneously considered, including the prediction plot illustrating the predicted areas, the lower and upper uncertainty plots presenting the lower and upper limits of the 95% confidence intervals, respectively. As shown in Figure 3, the CBPF prediction plots of the dry and rainy seasons had the highest probabilities associated with relatively low wind speed (i.e., <3 m/s), suggesting shallow or common ground sources of PM2.5 (e.g., vehicle and household emissions) [17] as low wind speed tends to disperse PM2.5 over a small area [20]. This result is supported by previous studies also noting that particulate matters (i.e., PM10 and PM2.5) in HCM City have been primarily emitted from on-road emission sources, such as exhaustion from motorcycles (e.g., cars, buses, and trucks) [12,70].
Taking in account the CBPF uncertainty, the lower and upper uncertainty plots of the dry season showed similar areas to the prediction plot (Figure 3a), indicating that the PM2.5 emission sources of the dry season (i.e., shallow or common ground sources) were real and not an artifact due to a lack of PM2.5 mass concentrations observed in the corresponding wind speeds and wind sectors [17,22]. For the rainy season, the upper uncertainty plot of this season highlighted the PM2.5 sources at the southeast and northwest associated with high wind speed (i.e., >3 m/s) (Figure 3b). These sources might be stack emissions [17] from the industrial zones located in the southeast and northwest of HCM City, such as the Linh Trung, Binh Chieu, and Tan Tao industrial zones [12]. Industrial activities in these zones (e.g., textile and food manufacturing) [12] emit a large amount of PM2.5 since their production uses fuel (e.g., diesel oil, coal, and wood), one of the major sources of PM2.5 [60]. In addition, PM2.5 originated from these industrial zones is transported to the monitoring site by the seasonal wind (Figure S7). However, the high CBPF probabilities of the southeast and northwest areas were only shown in the upper uncertainty CBPF plot (Figure 3b); therefore, PM2.5 emission sources in these areas might be uncertain due to a lack of observation data in the corresponding wind sectors and wind speeds [43]. Thus, further studies are essential to confirm the PM2.5 emission sources in southeast and northwest of HCM City in the rainy season.

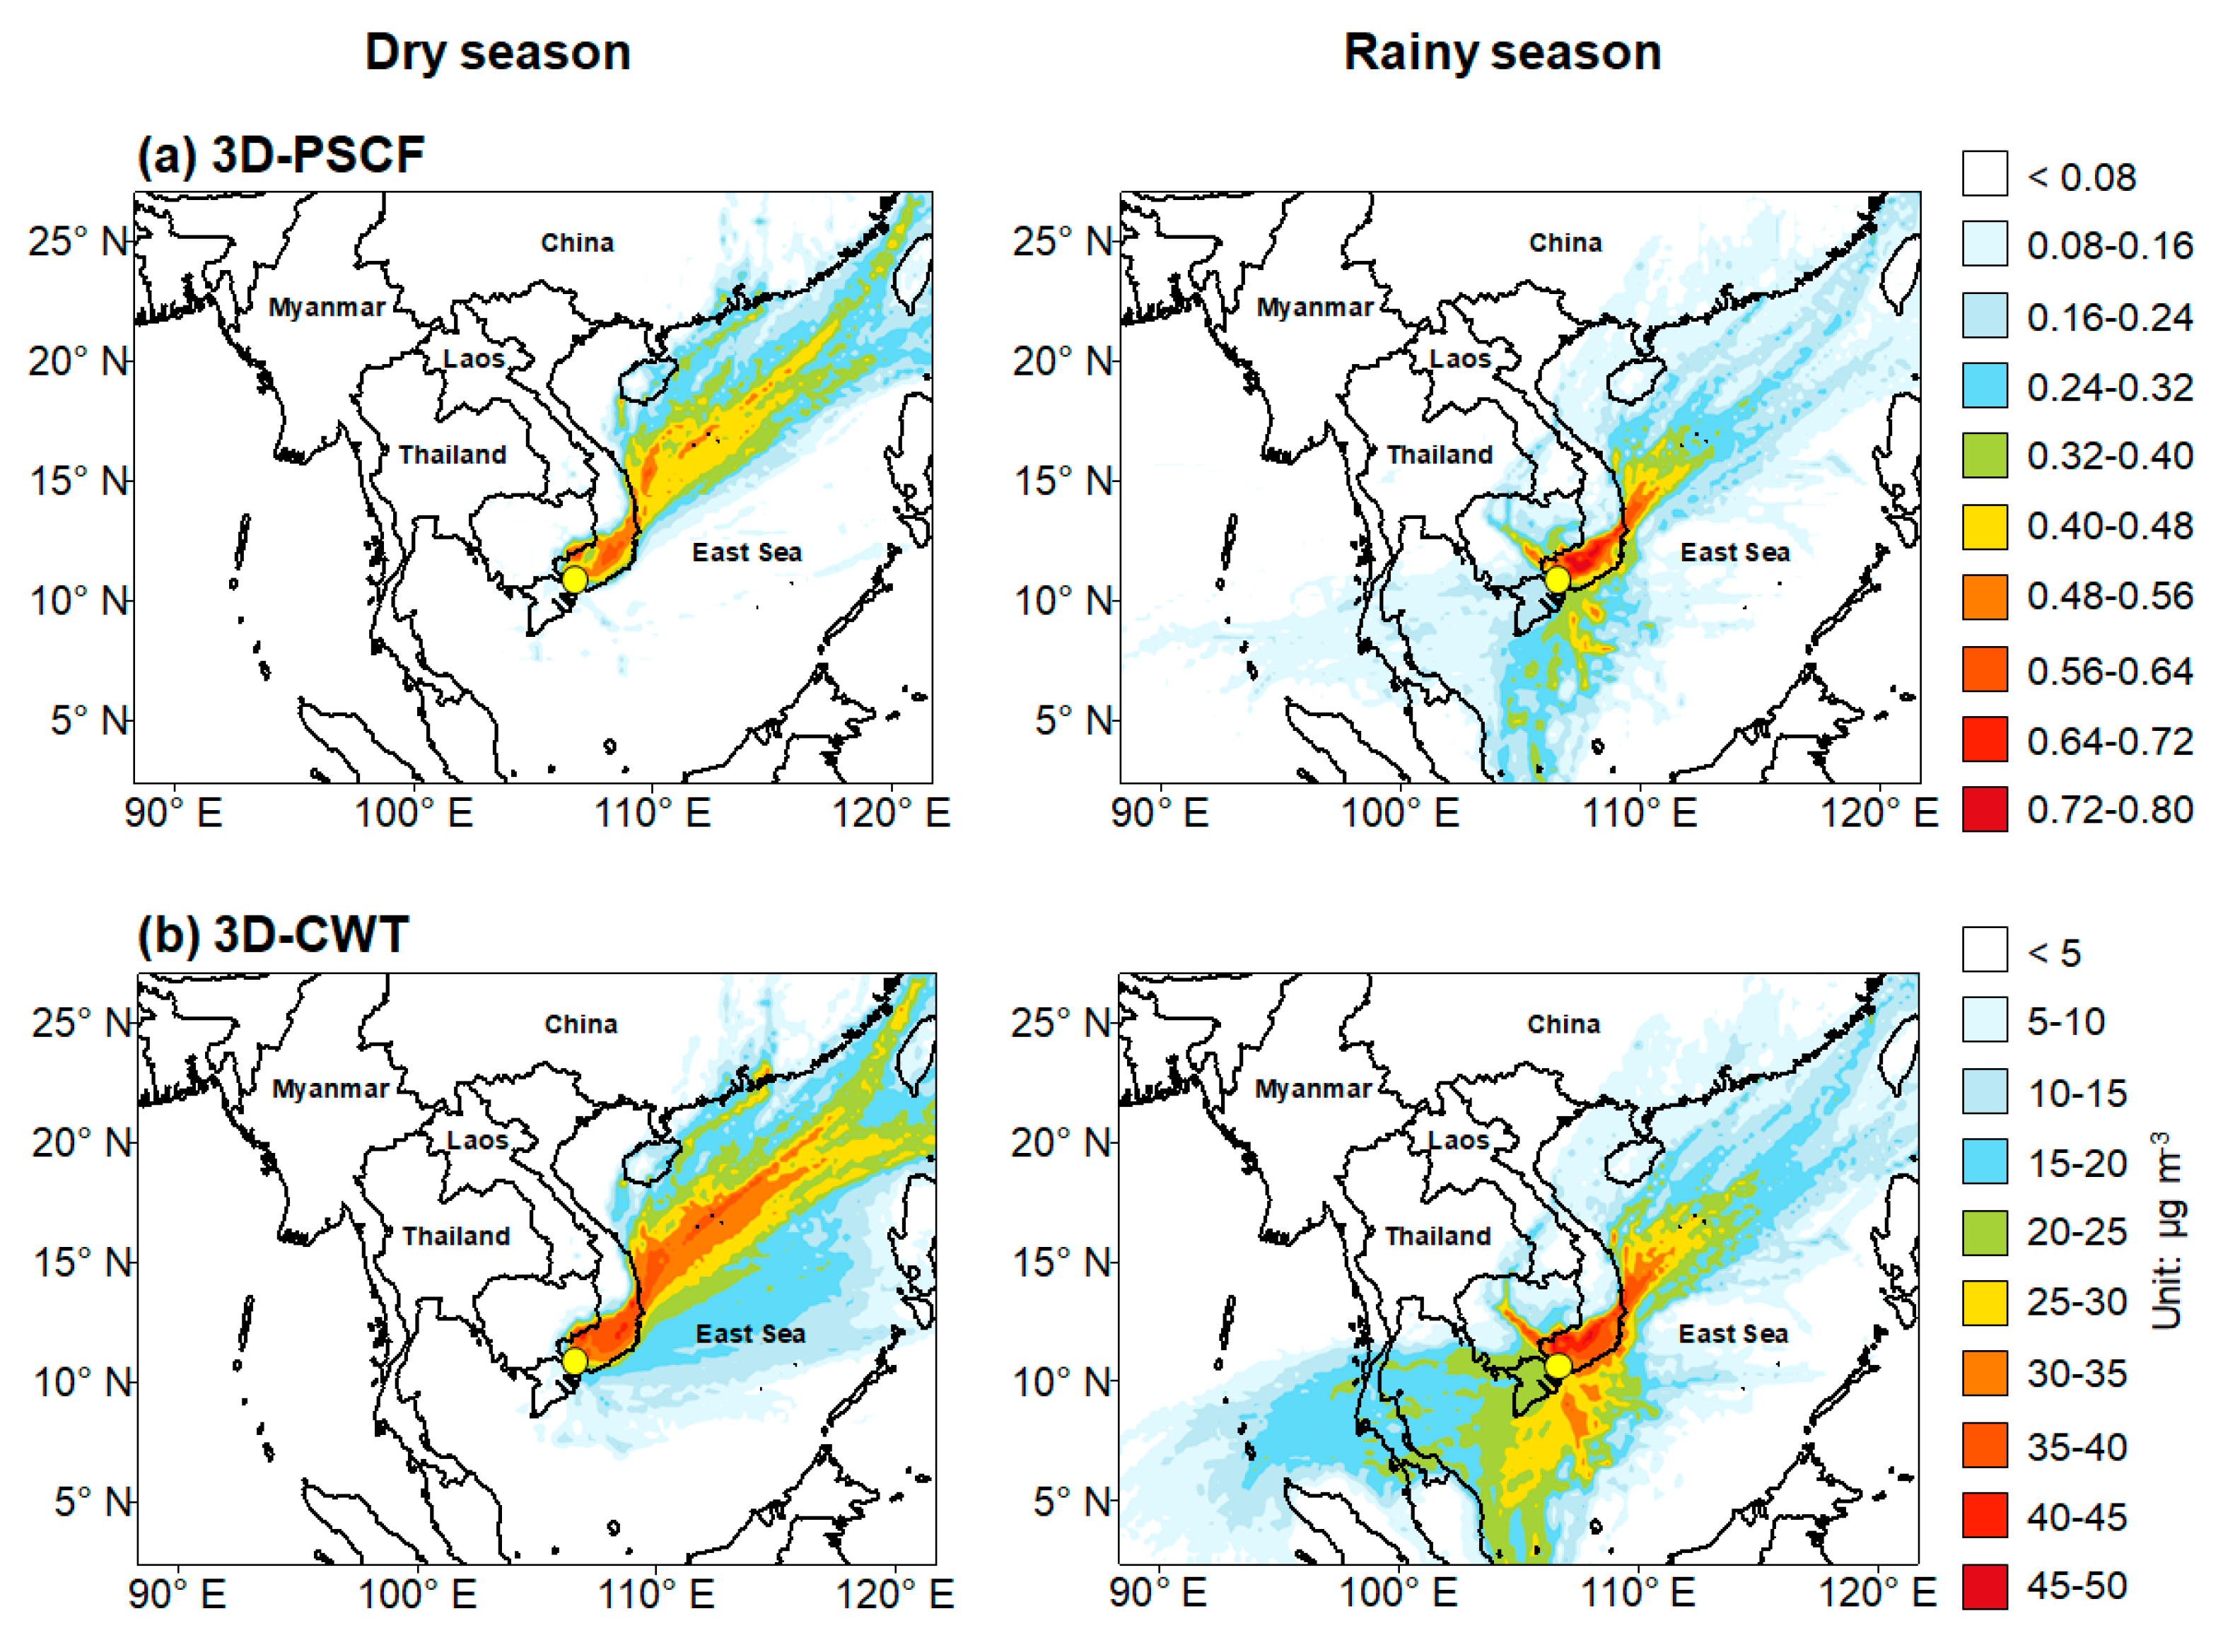
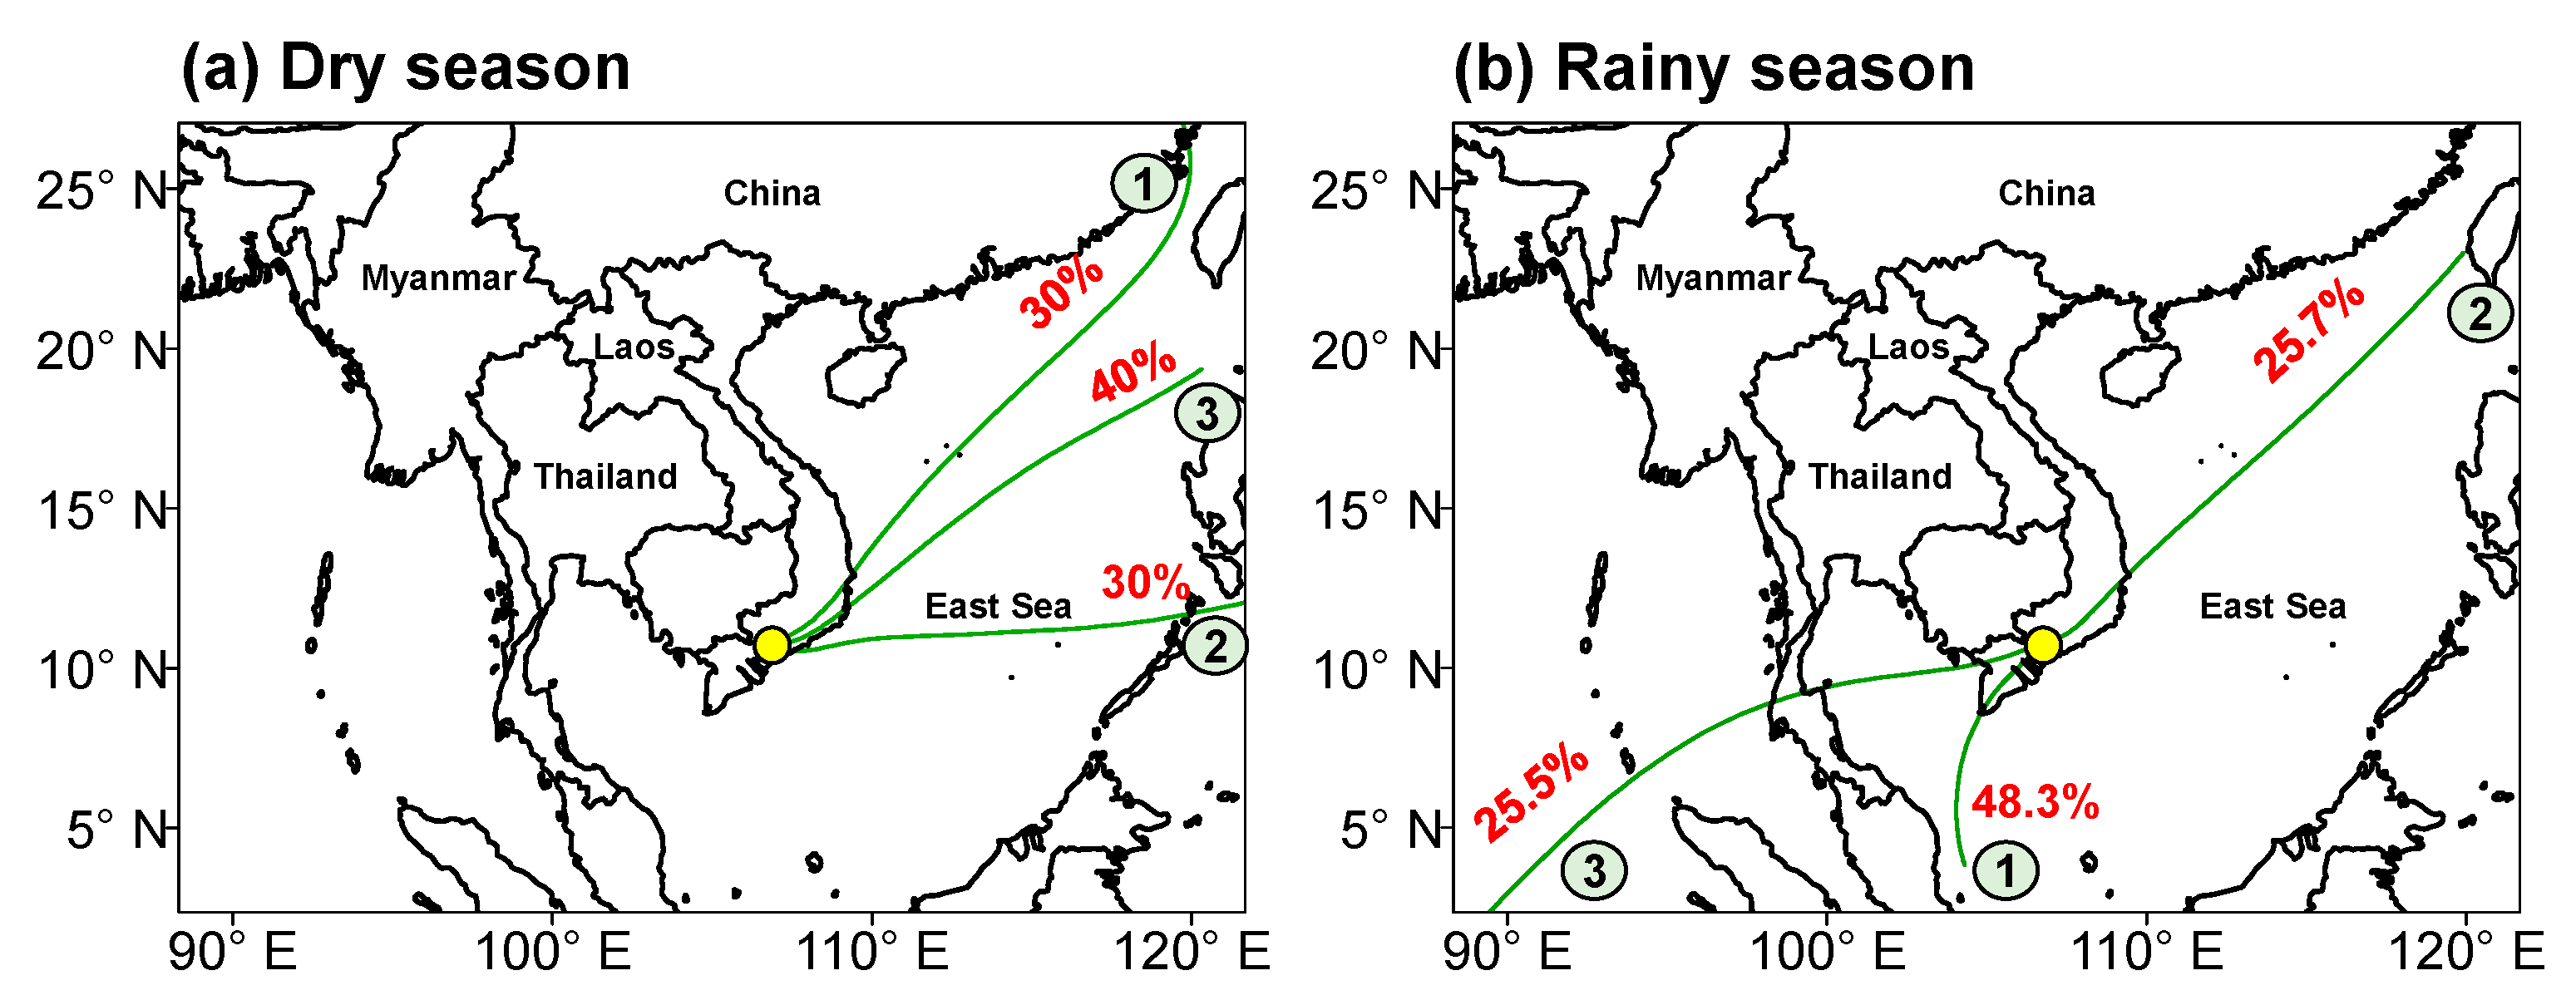
3.3. Non-Local Emission Source Areas of PM2.5

The emission source areas of PM2.5 at a non-local scale (i.e., outside HCM City) were identified using the 3D-PSCF and 3D-CWT models considering longitudes, latitudes, and heights of trajectory segments (Figure 4). In general, areas showing the higher 3D-PSCF and the 3D-CWT values are possibly regarded as emission source areas of PM2.5 at the receptor site [71]. In other words, PM2.5 originated from these areas can be transported to the receptor site by air masses. Regarding the dry season, an increase in PM2.5 mass concentrations at the receptor site in HCM City are contributed by PM2.5 emitted from the East Sea (i.e., from shipping emissions) and the southeastern Vietnam (Figure 4), covering some provinces with several industrial zones, such as Dong Nai and Binh Duong provinces [2] (Figure S8). The productions emitting a large of amount of PM2.5 in such industrial zones of these provinces are textile and food industries, metal, plastic, and paper productions, wood processing, and construction [2]. In addition, results from the trajectory cluster analysis revealed that in the dry season air trajectories arriving at the receptor site in HCM City mostly came from the southeastern Vietnam (i.e., 70% of the total air masses) (Figure 5). Added to this, the mean of PM2.5 mass concentrations corresponding to each trajectory cluster showed the higher values when air parcels came from the southeastern Vietnam (Table S2). These observations emphasized the contribution of PM2.5 emission sources in the southeastern Vietnam (e.g., industrial zones in some provinces, such as Binh Duong and Dong Nai) to the elevation of PM2.5 mass concentrations in HCM City.
For the rainy season, the 3D-PSCF and 3D-CWT results also suggested the East Sea and southeastern Vietnam as possible source areas of PM2.5 at the receptor site in HCM City (Figure 4). However, these sources might have less effect on the PM2.5 mass concentrations in HCM City in the rainy season because air parcels arriving from the southeast contributed to approximately 26% of the total air trajectories reaching the monitoring site in the rainy season (Figure 5b). In addition, the 3D-PSCF and 3D-CWT also highlighted the Mekong Delta, located southwest of HCM City (Figure S8), as the potential source area of PM2.5 in HCM City in the rainy season (Figure 4). The air masses passing by the Mekong Delta accounted for over 70% of the total air trajectories reaching the receptor site in this season (Figure 5b). Additionally, AOD values over the Mekong Delta were high in the rainy season (Figure S9), which could be because of biomass-burning activities (e.g., burning straw and crop residuals) after harvesting the summer–autumn rice crops (i.e., around June–September) [5]. These findings indicate that PM2.5 originated from the Mekong Delta can transported to HCM City by air masses. However, it should be noted that during the rainy season, transport of PM2.5 (i.e., middle- or long-range transport) from outside (i.e., the Mekong Delta and southeastern Vietnam) to HCM City is affected by wet deposition of PM2.5 caused by the high rainfall amount over southern Vietnam, including HCM City and its surrounding regions (Figure S10). Thus, the contributions of non-local emission sources to the PM2.5 pollution in HCM City during the rainy season can be less important compared with those of the local emission sources (e.g., vehicle emissions).

4. Conclusions

In this study, the local and non-local source areas of PM2.5 in HCM City, Vietnam, were identified using the CBPF and 3D-PSCF/3D-CWT models. Uncertainties of these models were evaluated using the upper/lower 95th confidence intervals of the CBPF prediction surfaces and the 95% upper confidence levels, computed from the dataset of 3D-PSCF/3D-CWT generated using the bootstrap technique. Additionally, the mass concentrations of PM2.5 and their relationships with meteorological parameters (e.g., air temperature, air pressure, and wind speed) were evaluated. The results showed that the PM2.5 mass concentrations in the dry season were higher than those in the rainy season because of the deposition of PM2.5 caused by the high rainfall amount during rainy season. For the diurnal variation, the PM2.5 mass concentrations in HCM City followed a unimodal distribution, with a significant peak in the morning rush hours (i.e., 7:00–9:00 LT) due to a contribution of SOA, which can be formed in the morning of HCM City.
Regarding the local source areas, the CBPF revealed that PM2.5 in HCM City was mainly emitted from shallow or common ground sources (e.g., vehicle and household emissions) throughout the year. Additionally, PM2.5 emitted in the northwest and southeast of HCM City might be transported to the receptor site in the rainy season. However, these emission source areas have uncertainty due to a lack of data, thus, further studies are essential to confirm our findings.
In terms of the non-local source areas, PM2.5 originated in the East Sea (i.e., from shipping emissions) and southeastern Vietnam (e.g., from several industrial zones in the region) can transported to HCM City, especially in the dry season. Additionally, in the rainy season, the Mekong Delta, located southwest of HCM City, might be the emission source area of PM2.5 in this city. However, the contributions of non-local sources to the PM2.5 pollution in HCM City might be less important in the rainy season because PM2.5 can be removed from the air during its transport as a result of wet deposition under the effect of the large rainfall amount and great rain event frequency during the rainy season. Results from this study can add more information on the identification of emission source areas of air pollutants as well as support decision-making related to the reduction in PM2.5 pollution in Vietnam.

Supplementary Materials

The following supporting information can be downloaded at: https://www.mdpi.com/article/10.3390/atmos14030579/s1, Figure S1: Monthly rainfall amount in HCM City; Figure S2: Monthly variations in the relative humidity and ambient air temperature in HCM City; Figure S3: Monthly wind speed in HCM City; Figure S4: Hourly variations in the incoming shortwave flux, relative humidity, and ambient air temperature; Table S1: Mass concentrations of PM2.5 in HCM City and some other cities in Asia; Figure S5: Results of the PLS; Figure S6: Correlation matrix of PM2.5 concentrations and meteorological parameters; Text S1: Relationships between the PM2.5 mass concentrations and meteorological parameters; Figure S7: Wind directions of the dry and rainy seasons; Figure S8: Locations of HCM City and its surrounding regions; Table S2: Mass concentrations of PM2.5 in each trajectory cluster; Figure S9: Aerosol optical depth (AOD) in Vietnam; Figure S10: Daily accumulated precipitation in Vietnam.

Author Contributions

Conceptualization, T.N.T.N.; methodology, T.N.T.N.; validation, T.N.T.N. and N.T.H.; formal analysis, T.N.T.N.; investigation and resources, N.X.D.; data curation, N.T.H.; writing—original draft preparation, T.N.T.N.; writing—review and editing, T.N.T.N.; N.X.D. and N.T.H.; supervision, T.N.T.N.; project administration, N.X.D.; funding acquisition, N.X.D. and T.N.T.N. All authors have read and agreed to the published version of the manuscript.

Funding

This research was supported by Saigon University (SGU), grant code TD2021-07.

Data Availability Statement

The datasets generated and/or analyzed during the current study are available from the corresponding author upon reasonable request.

Acknowledgments

The authors would like to thank Pham The Bao (Saigon University) because of his contribution to the pre-processing (filtration) of the backward air trajectories using computer coding.

Conflicts of Interest

The authors declare no conflict of interest.

References

  1. ADB. Vietnam: Validation of the Country Partnership Strategy Final Review, 2016–2020; Asian Development Bank (ADB): Mandaluyong, Philippines, 2021. [Google Scholar]
  2. MONRE. Report of the National Environmental Status; Ministry of Natural Resources and Environment of Vietnam (MONRE): Ha Noi, Vietnam, 2021. [Google Scholar]
  3. WBG. Climate Risk Country Profile: Vietnam; The World Bank Group and Asian Developement Bank: Manila, Philippines, 2021. [Google Scholar]
  4. DONRE. Report of the Environmental Status of Ho Chi Minh City; Department of Natural Resources and Environment (DONRE): Ho Chi Minh, Vietnam, 2021. [Google Scholar]
  5. Hien, T.T.; Chi, N.D.T.; Nguyen, N.T.; Vinh, L.X.; Takenaka, N.; Huy, D.H. Current status of fine particulate matter (PM2.5) in Vietnam’s most populous city, Ho Chi Minh City. Aerosol Air Qual. Res. 2019, 19, 2239–2251. [Google Scholar] [CrossRef] [Green Version]
  6. Le, T.G.; Ngo, L.; Mehta, S.; Do, V.D.; Thach, T.Q.; Vu, X.D.; Nguyen, D.T.; Cohen, A. Effects of short-term exposure to air pollution on hospital admissions of young children for acute lower respiratory infections in Ho Chi Minh City, Vietnam. Res. Rep. (Health Eff. Inst.) 2012, 169, 5–72. [Google Scholar]
  7. Toriyama, K.; Fukae, K.; Suda, Y.; Kiyose, T.; Oda, T.; Fujii, Y.; Doan Thien Chi, N.; Huu Huy, D.; Thi Hien, T.; Takenaka, N. NO2 and HONO concentrations measured with filter pack sampling and high HONO/NO2 ratio in Ho Chi Minh city, Vietnam. Atmos. Res. 2019, 214, 116865. [Google Scholar] [CrossRef]
  8. WHO. WHO Global Air Quality Guidelines: Particulate Matter (PM2.5 and PM10), Ozone, Nitrogen Dioxide, Sulfur Dioxide and Carbon Monoxide; WHO (World Health Organization): Geneva, Switzerland, 2021. [Google Scholar]
  9. MONRE. National Technical Regulation on Ambient Air Quality (QCVN 05:2013/BTNMT); MONRE (Ministry of Natuaral Resources and Environmemt): Ha Noi, Vietnam, 2013. [Google Scholar]
  10. Adgate, J.L.; Mongin, S.J.; Pratt, G.C.; Zhang, J.; Field, M.P.; Ramachandran, G.; Sexton, K. Relationships between personal, indoor, and outdoor exposures to trace elements in PM2.5. Sci. Total Environ. 2007, 386, 21–32. [Google Scholar] [CrossRef]
  11. Xing, Y.-F.; Xu, Y.-H.; Shi, M.-H.; Lian, Y.-X. The impact of PM2.5 on the human respiratory system. J. Thorac. Dis. 2016, 8, E69–E74. [Google Scholar] [CrossRef]
  12. Ho, Q.B.; Vu, H.N.K.; Nguyen, T.T.; Nguyen, T.T.H.; Nguyen, T.T.T. A combination of bottom-up and top-down approaches for calculating of air emission for developing countries: A case of Ho Chi Minh City, Vietnam. Air Qual. Atmos. Health 2019, 12, 1059–1072. [Google Scholar] [CrossRef]
  13. Nguyen, T.T.Q.; Takeuchi, W.; Misra, P.; Hayashida, S. Technical note: Emission mapping of key sectors in Ho Chi Minh City, Vietnam, using satellite-derived urban land use data. Atmos. Chem. Phys. 2021, 21, 2795–2818. [Google Scholar] [CrossRef]
  14. Ho, B.Q.; Vu, K.H.N.; Nguyen, T.T.; Nguyen, H.T.T.; Ho, D.M.; Nguyen, H.N.; Nguyen, T.T.T. Study loading capacties of air pollutant emissions for developing countries: A case of Ho Chi Minh City, Vietnam. Sci. Rep. 2020, 10, 5827. [Google Scholar] [CrossRef] [Green Version]
  15. Huy, D.H.; Hien, T.T.; Takenaka, N. Influence of urban outflow on water-soluble ions in PM2.5 and >PM2.5 particles at a suburban Ho Chi Minh City site, Vietnam. Atmos. Res. 2022, 272, 106144. [Google Scholar] [CrossRef]
  16. Hsu, Y.-K.; Holsen, T.M.; Hopke, P.K. Comparison of hybrid receptor models to locate PCB sources in Chicago. Atmos. Res. 2003, 37, 545–562. [Google Scholar] [CrossRef]
  17. Uria-Tellaetxe, I.; Carslaw, D.C. Conditional bivariate probability function for source identification. Environ. Model. Softw. 2014, 59, 1–9. [Google Scholar] [CrossRef] [Green Version]
  18. Nguyen, T.N.T.; Vuong, Q.T.; Lee, S.-J.; Xiao, H.; Choi, S.-D. Identification of source areas of polycyclic aromatic hydrocarbons in Ulsan, South Korea, using hybrid receptor models and the conditional bivariate probability function. Environ. Sci. Process. Impacts 2022, 24, 140–151. [Google Scholar] [CrossRef]
  19. Ali-Taleshi, M.S.; Moeinaddini, M.; Riyahi Bakhtiari, A.; Feiznia, S.; Squizzato, S.; Bourliva, A. A one-year monitoring of spatiotemporal variations of PM2.5-bound PAHs in Tehran, Iran: Source apportionment, local and regional sources origins and source-specific cancer risk assessment. Environ. Pollut. 2021, 274, 115883. [Google Scholar] [CrossRef]
  20. Mukherjee, A.; Agrawal, M. Assessment of local and distant sources of urban PM2.5 in middle Indo-Gangetic plain of India using statistical modeling. Atmos. Res. 2018, 213, 275–287. [Google Scholar] [CrossRef]
  21. Squizzato, S.; Cazzaro, M.; Innocente, E.; Visin, F.; Hopke, P.K.; Rampazzo, G. Urban air quality in a mid-size city—PM2.5 composition, sources and identification of impact areas: From local to long range contributions. Atmos. Res. 2017, 186, 51–62. [Google Scholar] [CrossRef] [Green Version]
  22. Carslaw, D.C.; Ropkins, K. openair—An R package for air quality data analysis. Environ. Modell. Softw. 2012, 27–28, 52–61. [Google Scholar] [CrossRef]
  23. Kim, I.S.; Wee, D.; Kim, Y.P.; Lee, J.Y. Development and application of three-dimensional potential source contribution function (3D-PSCF). Environ. Sci. Pollut. Res. 2016, 23, 16946–16954. [Google Scholar] [CrossRef]
  24. Cai, Q.; Tong, L.; Zhang, J.; Zheng, J.; He, M.; Lin, J.; Chen, X.; Xiao, H. Characteristics of long-range transported PM2.5 at a coastal city using the single particle aerosol mass spectrometry. Environ. Eng. Res. 2019, 24, 690–698. [Google Scholar] [CrossRef] [Green Version]
  25. Wang, Y.Q. An open source software suite for multi-dimensional meteorological data computation and visualisation. J. Open Res. Softw. 2019, 7, 21. [Google Scholar] [CrossRef] [Green Version]
  26. Fan, A.; Hopke, P.K.; Raunemaa, T.M.; Öblad, M.; Pacyna, J.M. A study on the potential sources of air pollutants observed at Tjörn, Sweden. Environ. Sci. Pollut. Res. 1995, 2, 107–115. [Google Scholar] [CrossRef]
  27. Wang, Y.Q.; Zhang, X.Y.; Draxler, R.R. TrajStat: GIS-based software that uses various trajectory statistical analysis methods to identify potential sources from long-term air pollution measurement data. Environ. Modell. Softw. 2009, 24, 938–939. [Google Scholar] [CrossRef]
  28. Kim, I.S.; Lee, J.Y.; Wee, D.; Kim, Y.P. Estimation of the contribution of biomass fuel burning activities in North Korea to the air quality in Seoul, South Korea: Application of the 3D-PSCF method. Atmos. Res. 2019, 230, 104628. [Google Scholar] [CrossRef]
  29. Dimitriou, K.; Grivas, G.; Liakakou, E.; Gerasopoulos, E.; Mihalopoulos, N. Assessing the contribution of regional sources to urban air pollution by applying 3D-PSCF modeling. Atmos. Res. 2021, 248, 105187. [Google Scholar] [CrossRef]
  30. Stojić, A.; Stanišić Stojić, S. The innovative concept of three-dimensional hybrid receptor modeling. Atmos. Res. 2017, 164, 216–223. [Google Scholar] [CrossRef]
  31. Wagner, P.; Schäfer, K. Influence of mixing layer height on air pollutant concentrations in an urban street canyon. Urban Clim. 2017, 22, 64–79. [Google Scholar] [CrossRef]
  32. Pekney, N.J.; Davidson, C.I.; Zhou, L.; Hopke, P.K. Application of PSCF and CPF to PMF-modeled sources of PM2.5 in Pittsburgh. Aerosol Sci. Technol. 2006, 40, 952–961. [Google Scholar] [CrossRef] [Green Version]
  33. Vu, H.N.K.; Ha, Q.P.; Nguyen, D.H.; Nguyen, T.T.T.; Nguyen, T.T.; Nguyen, T.T.H.; Tran, N.D.; Ho, B.Q. Poor air quality and its association with mortality in Ho Chi Minh City: Case Study. Atmosphere 2020, 11, 750. [Google Scholar] [CrossRef]
  34. Ho, B.Q.; Khue Vu, H.N.; Nguyen, T.T.; Nguyen, T.-T.G.; Diep, T.-Q.N.; Vo, P.L.; Pham, T.-K.N. Modeling impacts of industrial park activity on air quality of surrounding area for identifying isolation distance: A case of Tan Tao Industrial Park, Ho Chi Minh City, Viet Nam. IOP Conf. Ser. Earth Environ. Sci. 2022, 964, 012023. [Google Scholar] [CrossRef]
  35. Mukherjee, A.; Toohey, D.W. A study of aerosol properties based on observations of particulate matter from the U.S. Embassy in Beijing, China. Earth’s Future 2016, 4, 381–395. [Google Scholar] [CrossRef]
  36. Ali, S.M.; Malik, F.; Anjum, M.S.; Siddiqui, G.F.; Anwar, M.N.; Lam, S.S.; Nizami, A.-S.; Khokhar, M.F. Exploring the linkage between PM2.5 levels and COVID-19 spread and its implications for socio-economic circles. Environ. Res. 2021, 193, 110421. [Google Scholar] [CrossRef]
  37. Shukla, K.; Aggarwal, S.G. A technical overview on beta-attenuation method for the monitoring of particulate matter in ambient air. Aerosol Air Qual. Res. 2022, 22, 220195. [Google Scholar] [CrossRef]
  38. Huang, G. Missing data filling method based on linear interpolation and lightgbm. J. Phys. Conf. Ser. 2021, 1754, 012187. [Google Scholar] [CrossRef]
  39. Lawrence, M.G. The relationship between relative humidity and the dewpoint temperature in moist air: A simple conversion and applications. Bull. Am. Meteorol. Soc. 2005, 86, 225–234. [Google Scholar] [CrossRef]
  40. Platnick, S. MODIS Atmosphere L3 Monthly Product. NASA MODIS Adaptive Processing System, Goddard Space Flight Center, USA. 2015. Available online: http://dx.doi.org/10.5067/MODIS/MOD08_M3.006 (accessed on 1 February 2022).
  41. Global Modeling and Assimilation Office (GMAO). MERRA-2 tavg1_2d_rad_Nx: 2d,1-Hourly, Time-Averaged, Single-Level, Assimilation, Radiation Diagnostics V5.12.4, Greenbelt, MD, USA, Goddard Earth Sciences Data and Information Services Center (GES DISC). 2015. Available online: https://disc.gsfc.nasa.gov/datasets/M2T1NXRAD_5.12.4/summary (accessed on 1 February 2022).
  42. Huffman, G.J.; Stocker, E.F.; Bolvin, D.T.; Nelkin, E.J.; Tan, J. GPM IMERG Final Precipitation L3 1 day 0.1 degree x 0.1 degree V06, Edited by Andrey Savtchenko, Greenbelt, MD, Goddard Earth Sciences Data and Information Services Center (GES DISC). 2019. Available online: https://catalog.data.gov/dataset/gpm-imerg-final-precipitation-l3-1-day-0-1-degree-x-0-1-degree-v06-gpm-3imergdf-at-ges-dis (accessed on 1 February 2022).
  43. Jeričević, A.; Gašparac, G.; Mikulec, M.M.; Kumar, P.; Prtenjak, M.T. Identification of diverse air pollution sources in a complex urban area of Croatia. J. Environ. Manag. 2019, 243, 67–77. [Google Scholar] [CrossRef]
  44. Team, R. RStudio: Integrated Development for R. Available online: http://www.rstudio.com/ (accessed on 1 February 2022).
  45. Simmonds, P.G.; Seuring, S.; Nickless, G.; Derwent, R.G. Segregation and interpretation of ozone and carbon monoxide measurements by air mass origin at the TOR station mace head, Ireland from 1987 to 1995. J. Atmos. Chem. 1997, 28, 45–59. [Google Scholar] [CrossRef]
  46. Stein, A.F.; Draxler, R.R.; Rolph, G.D.; Stunder, B.J.B.; Cohen, M.D.; Ngan, F. NOAA’s HYSPLIT atmospheric transport and dispersion modeling system. Bull. Am. Meteorol. Soc. 2015, 96, 2059–2077. [Google Scholar] [CrossRef]
  47. Edwards, A.W.F.; Cavalli-Sforza, L.L. A method for cluster analysis. Biometrics 1965, 21, 362–375. [Google Scholar] [CrossRef]
  48. Zong, Z.; Wang, X.; Tian, C.; Chen, Y.; Fu, S.; Qu, L.; Ji, L.; Li, J.; Zhang, G. PMF and PSCF based source apportionment of PM2.5 at a regional background site in North China. Atmos. Res. 2018, 203, 207–215. [Google Scholar] [CrossRef] [Green Version]
  49. Wondola, D.; Aulele, S.; Lembang, F. Partial Least Square (PLS) method of addressing multicollinearity problems in multiple linear regressions (Case studies: Cost of electricity bills and factors affecting it). J. Phys. Conf. Ser. 2020, 1463, 012006. [Google Scholar] [CrossRef]
  50. Čulić, V. Triggering of cardiac arrhythmias. J. Am. Coll. Cardiol. 2014, 63, 1226–1227. [Google Scholar] [CrossRef] [Green Version]
  51. Chen, Z.; Chen, D.; Zhao, C.; Kwan, M.-P.; Cai, J.; Zhuang, Y.; Zhao, B.; Wang, X.; Chen, B.; Yang, J.; et al. Influence of meteorological conditions on PM2.5 concentrations across China: A review of methodology and mechanism. Environ. Int. 2020, 139, 105558. [Google Scholar] [CrossRef]
  52. Gramsch, E.; Cáceres, D.; Oyola, P.; Reyes, F.; Vásquez, Y.; Rubio, M.A.; Sánchez, G. Influence of surface and subsidence thermal inversion on PM2.5 and black carbon concentration. Atmos. Res. 2014, 98, 290–298. [Google Scholar] [CrossRef]
  53. Nam, N.T.T.; Trinh, N.N.; Thu, N.T.M.; Bảo, P.T. Characteristics and effect of the temperature inversion on concentrations of fine particulate matter (PM2.5) in Ho Chi Minh city, Vietnam. J. Hydro-Meteorol. 2023, 746, 87–95. [Google Scholar] [CrossRef]
  54. Pushpawela, B.; Shelton, S.; Liyanage, G.; Jayasekara, S.; Rajapaksha, D.; Jayasundara, A.; Jayasuriya, L.D. Changes of Air Pollutants in Urban Cities during the COVID-19 Lockdown-Sri Lanka. Aerosol Air Qual. Res. 2023, 23, 220223. [Google Scholar] [CrossRef]
  55. Shelton, S.; Liyanage, G.; Jayasekara, S.; Pushpawela, B.; Rathnayake, U.; Jayasundara, A.; Jayasooriya, L.D. Seasonal Variability of Air Pollutants and Their Relationships to Meteorological Parameters in an Urban Environment. Adv. Meteorol. 2022, 2022, 5628911. [Google Scholar] [CrossRef]
  56. Huong Giang, N.T.; Kim Oanh, N.T. Roadside levels and traffic emission rates of PM2.5 and BTEX in Ho Chi Minh City, Vietnam. Atmos. Environ. 2014, 94, 806–816. [Google Scholar] [CrossRef]
  57. Liang, L.; Engling, G.; Cheng, Y.; Zhang, X.; Sun, J.; Xu, W.; Liu, C.; Zhang, G.; Xu, H.; Liu, X.; et al. Influence of high relative humidity on secondary organic carbon: Observations at a background site in East China. J. Meteorol. Res. 2019, 33, 905–913. [Google Scholar] [CrossRef]
  58. Pushpawela, B.; Jayaratne, R.; Morawska, L. The influence of wind speed on new particle formation events in an urban environment. Atmos. Res. 2019, 215, 37–41. [Google Scholar] [CrossRef]
  59. Shrivastava, M.; Cappa, C.D.; Fan, J.; Goldstein, A.H.; Guenther, A.B.; Jimenez, J.L.; Kuang, C.; Laskin, A.; Martin, S.T.; Ng, N.L.; et al. Recent advances in understanding secondary organic aerosol: Implications for global climate forcing. Rev. Geophys. 2017, 55, 509–559. [Google Scholar] [CrossRef] [Green Version]
  60. Harrison, R.M.; Allan, J.; Carruthers, D.; Heal, M.R.; Lewis, A.C.; Marner, B.; Murrells, T.; Williams, A. Non-exhaust vehicle emissions of particulate matter and VOC from road traffic: A review. Atmos. Res. 2021, 262, 118592. [Google Scholar] [CrossRef]
  61. Kroll, J.H.; Seinfeld, J.H. Chemistry of secondary organic aerosol: Formation and evolution of low-volatility organics in the atmosphere. Atmos. Res. 2008, 42, 3593–3624. [Google Scholar] [CrossRef]
  62. Pushpawela, B.; Jayaratne, R.; Morawska, L. Differentiating between particle formation and growth events in an urban environment. Atmos. Chem. Phys. 2018, 18, 11171–11183. [Google Scholar] [CrossRef] [Green Version]
  63. Sadanaga, Y.; Matsumoto, J.; Kajii, Y. Photochemical reactions in the urban air: Recent understandings of radical chemistry. J. Photochem. Photobiol. C Photochem. Rev. 2003, 4, 85–104. [Google Scholar] [CrossRef]
  64. Hai, C.D.; Kim Oanh, N.T. Effects of local, regional meteorology and emission sources on mass and compositions of particulate matter in Hanoi. Atmos. Res. 2013, 78, 105–112. [Google Scholar] [CrossRef]
  65. Thuy, N.T.T.; Dung, N.T.; Sekiguchi, K.; Thuy, L.B.; Hien, N.T.T.; Yamaguchi, R. Mass concentrations and carbonaceous compositions of PM1.0, PM2.5, and PM10 at urban locations of Hanoi, Vietnam. Aerosol Air Qual. Res. 2018, 18, 1591–1605. [Google Scholar] [CrossRef] [Green Version]
  66. Oanh, N.T.K.; Kongpran, J.; Hang, N.T.; Parkpian, P.; Hung, N.T.Q.; Lee, S.B.; Bae, G.N. Characterization of gaseous pollutants and PM2.5 at fixed roadsides and along vehicle traveling routes in Bangkok Metropolitan Region. Atmos. Res. 2013, 77, 674–685. [Google Scholar]
  67. ChooChuay, C.; Pongpiachan, S.; Tipmanee, D.; Suttinun, O.; Deelaman, W.; Wang, Q.; Xing, L.; Li, G.; Han, Y.; Palakun, J.; et al. Impacts of PM2.5 sources on variations in particulate chemical compounds in ambient air of Bangkok, Thailand. Atmos. Pollut. Res. 2020, 11, 1657–1667. [Google Scholar] [CrossRef]
  68. Sinaga, D.; Setyawati, W.; Cheng, F.Y.; Lung, S.-C.C. Investigation on daily exposure to PM2.5 in Bandung city, Indonesia using low-cost sensor. J. Expo. Sci. Environ. Epidemiol. 2020, 30, 1001–1012. [Google Scholar] [CrossRef]
  69. Khan, M.F.; Sulong, N.A.; Latif, M.T.; Nadzir, M.S.M.; Amil, N.; Hussain, D.F.M.; Lee, V.; Hosaini, P.N.; Shaharom, S.; Yusoff, N.A.Y.M.; et al. Comprehensive assessment of PM2.5 physicochemical properties during the Southeast Asia dry season (southwest monsoon). J. Geophys. Res. Atmos. 2016, 121, 14,589–14,611. [Google Scholar] [CrossRef]
  70. Nguyen, D.L.; Czech, H.; Pieber, S.M.; Schnelle-Kreis, J.; Steinbacher, M.; Orasche, J.; Henne, S.; Popovicheva, O.B.; Abbaszade, G.; Engling, G.; et al. Carbonaceous aerosol composition in air masses influenced by large-scale biomass burning: A case study in northwestern Vietnam. Atmos. Chem. Phys. 2021, 21, 8293–8312. [Google Scholar] [CrossRef]
  71. Hsu, Y.-K.; Holsen, T.M.; Hopke, P.K. Locating and quantifying PCB sources in Chicago:  Receptor modeling and field sampling. Environ. Sci. Technol. 2003, 37, 681–690. [Google Scholar] [CrossRef]
Figure 1. Location of the PM2.5 monitoring site and the meteorological stations in Ho Chi Minh City of Vietnam.
Atmosphere 14 00579 g001
Figure 2. Mean of PM2.5 mass concentrations in HCM City shown in monthly and seasonal variation, diurnal variation in the dry season, and diurnal variation in the rainy season. The whiskers represent standard deviations of the mean.
Atmosphere 14 00579 g002
Figure 3. CBPF plots of PM2.5 in the dry and rainy seasons of HCM City during the study period.
Atmosphere 14 00579 g003
Figure 4. Bootstrapped 3D-PSCF and 3D-CWT results for PM2.5 at the 95% upper confidence levels in the dry and rainy seasons. The yellow circles represent the receptor site in HCM City.
Atmosphere 14 00579 g004
Figure 5. Trajectory cluster analysis plots of PM2.5 in the dry and rainy seasons of HCM City. The numbers in each circle indicate cluster number. The percentages represent the contribution of each trajectory cluster.
Atmosphere 14 00579 g005
Disclaimer/Publisher’s Note: The statements, opinions and data contained in all publications are solely those of the individual author(s) and contributor(s) and not of MDPI and/or the editor(s). MDPI and/or the editor(s) disclaim responsibility for any injury to people or property resulting from any ideas, methods, instructions or products referred to in the content.

