

Assessment of Air Pollution in Different Areas (Urban, Suburban, and Rural) in Slovenia from 2017 to 2021
 ,
,
Abstract
:1. Introduction
2. Methodology
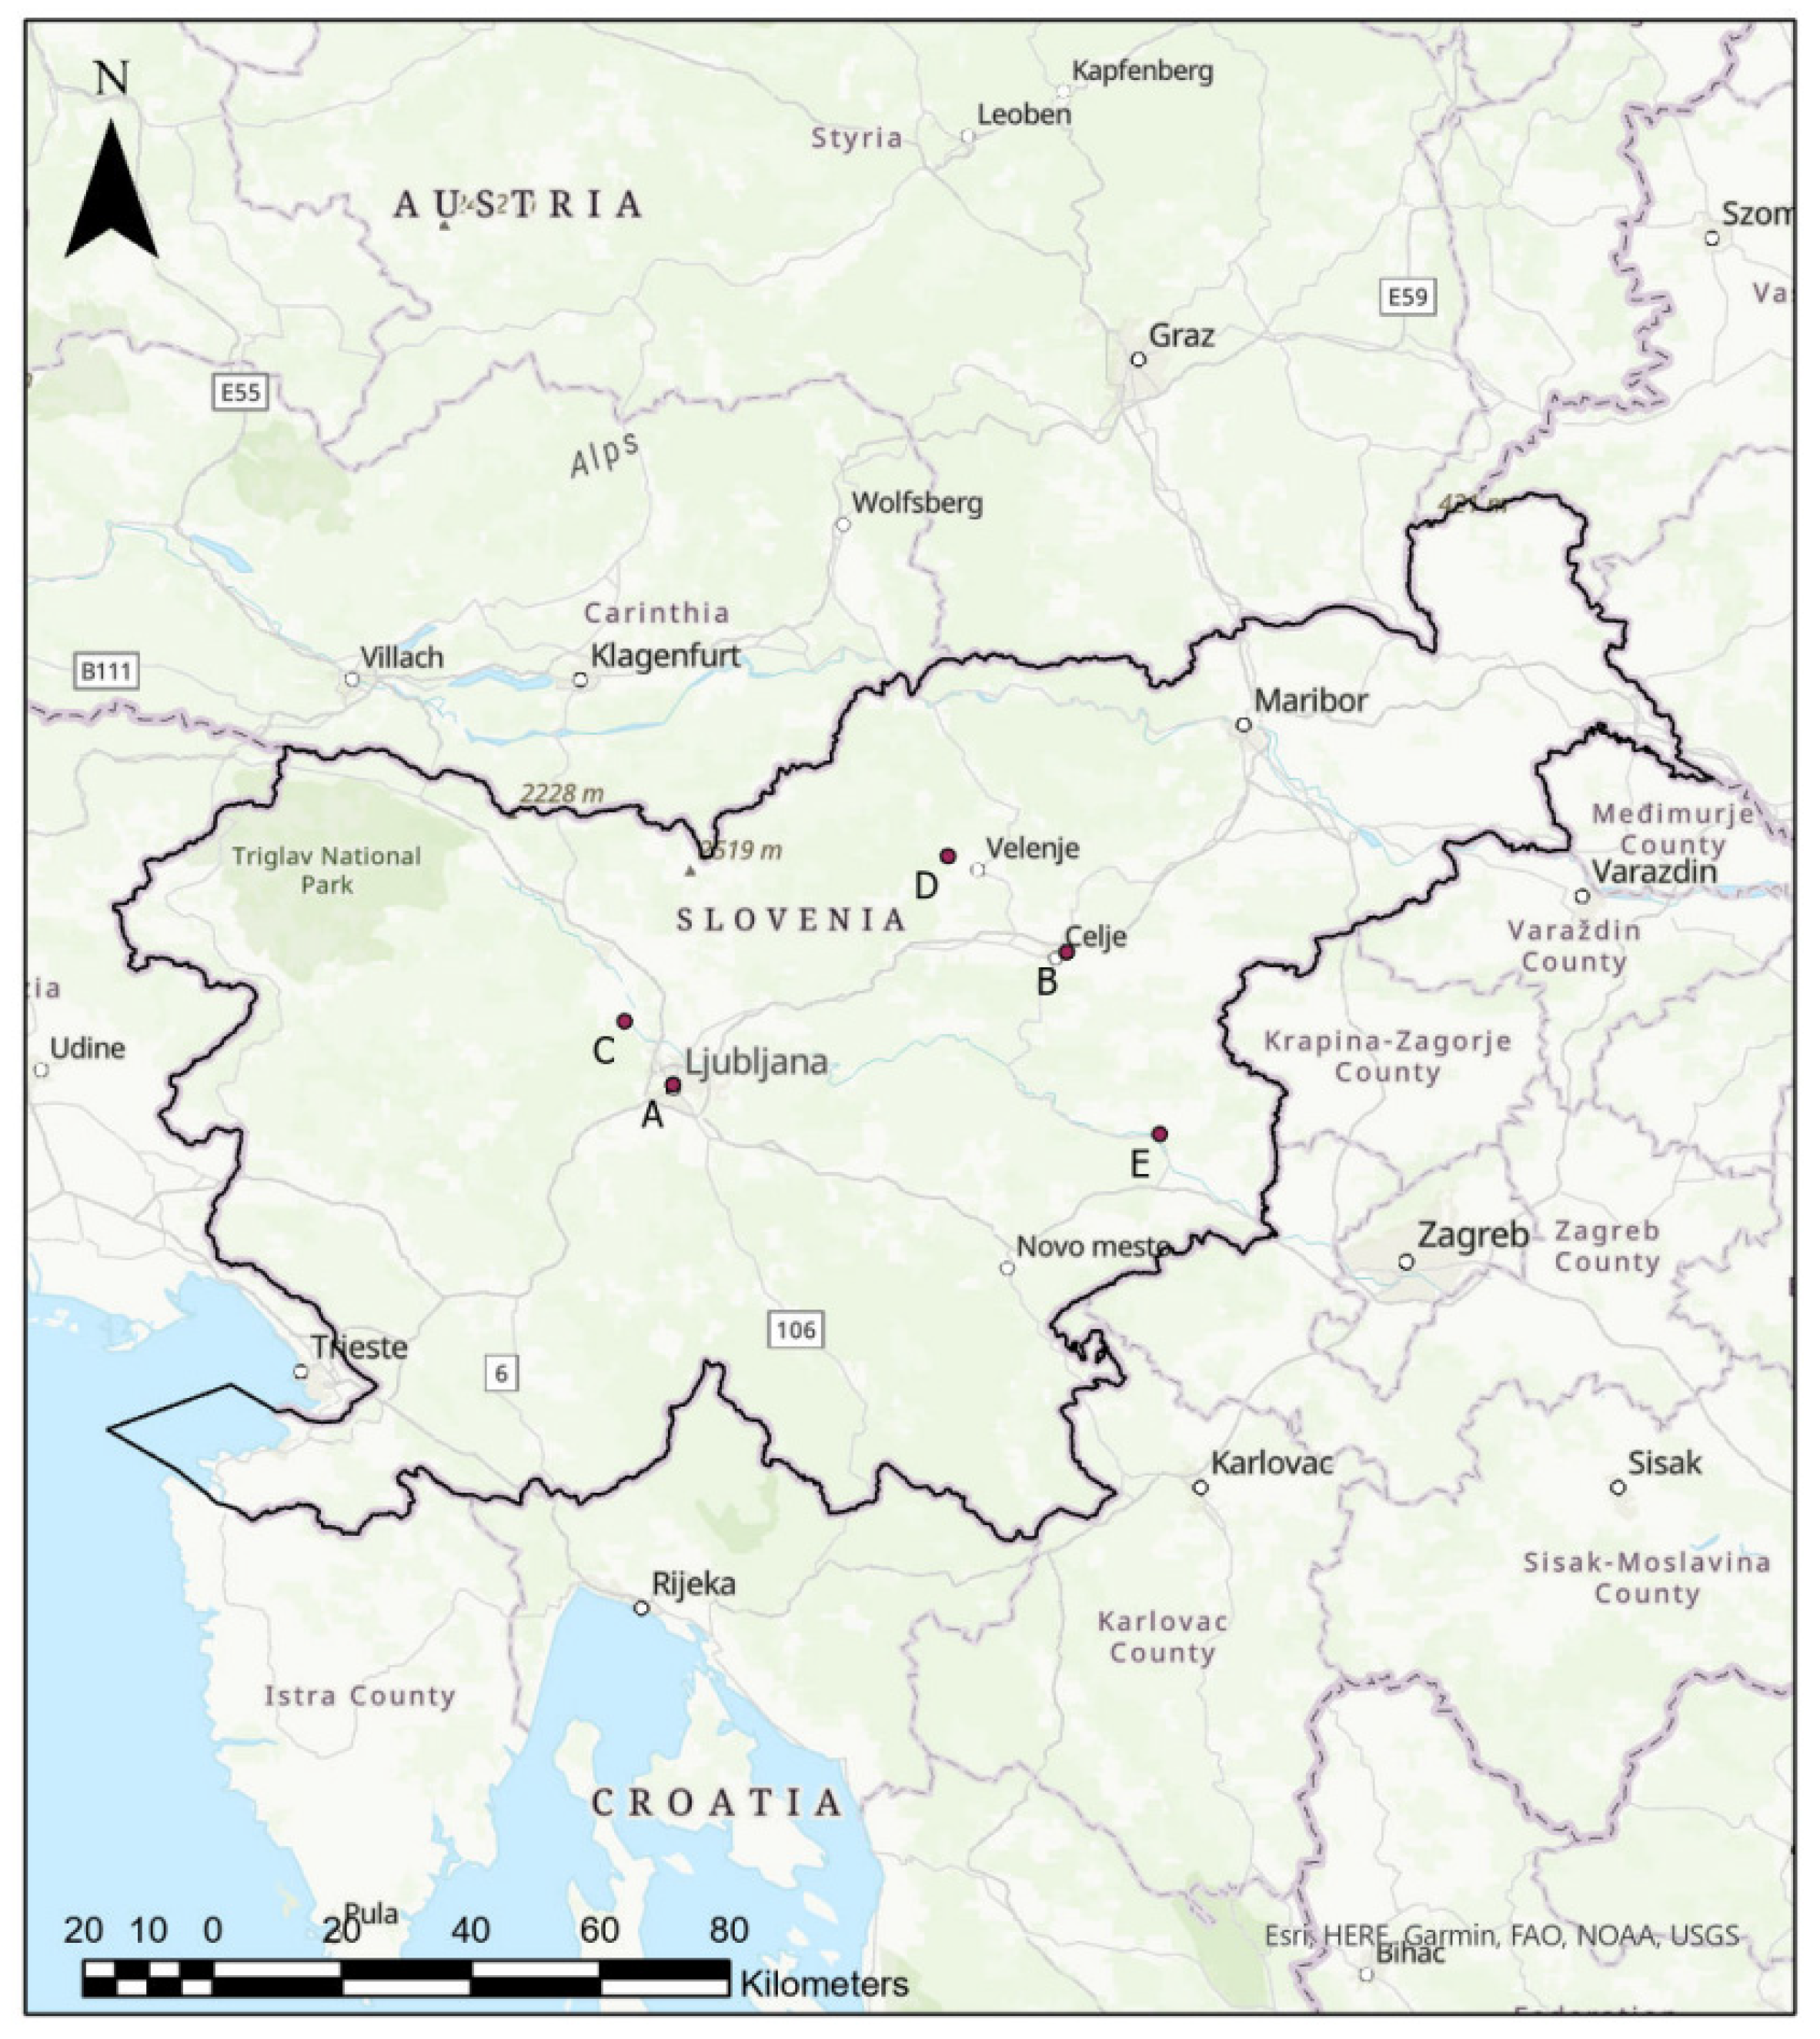
2.1. Study Area
2.2. Location Description
2.3. Data Sources and Collection
2.4. Evaluation Method
3. Results and Discussion
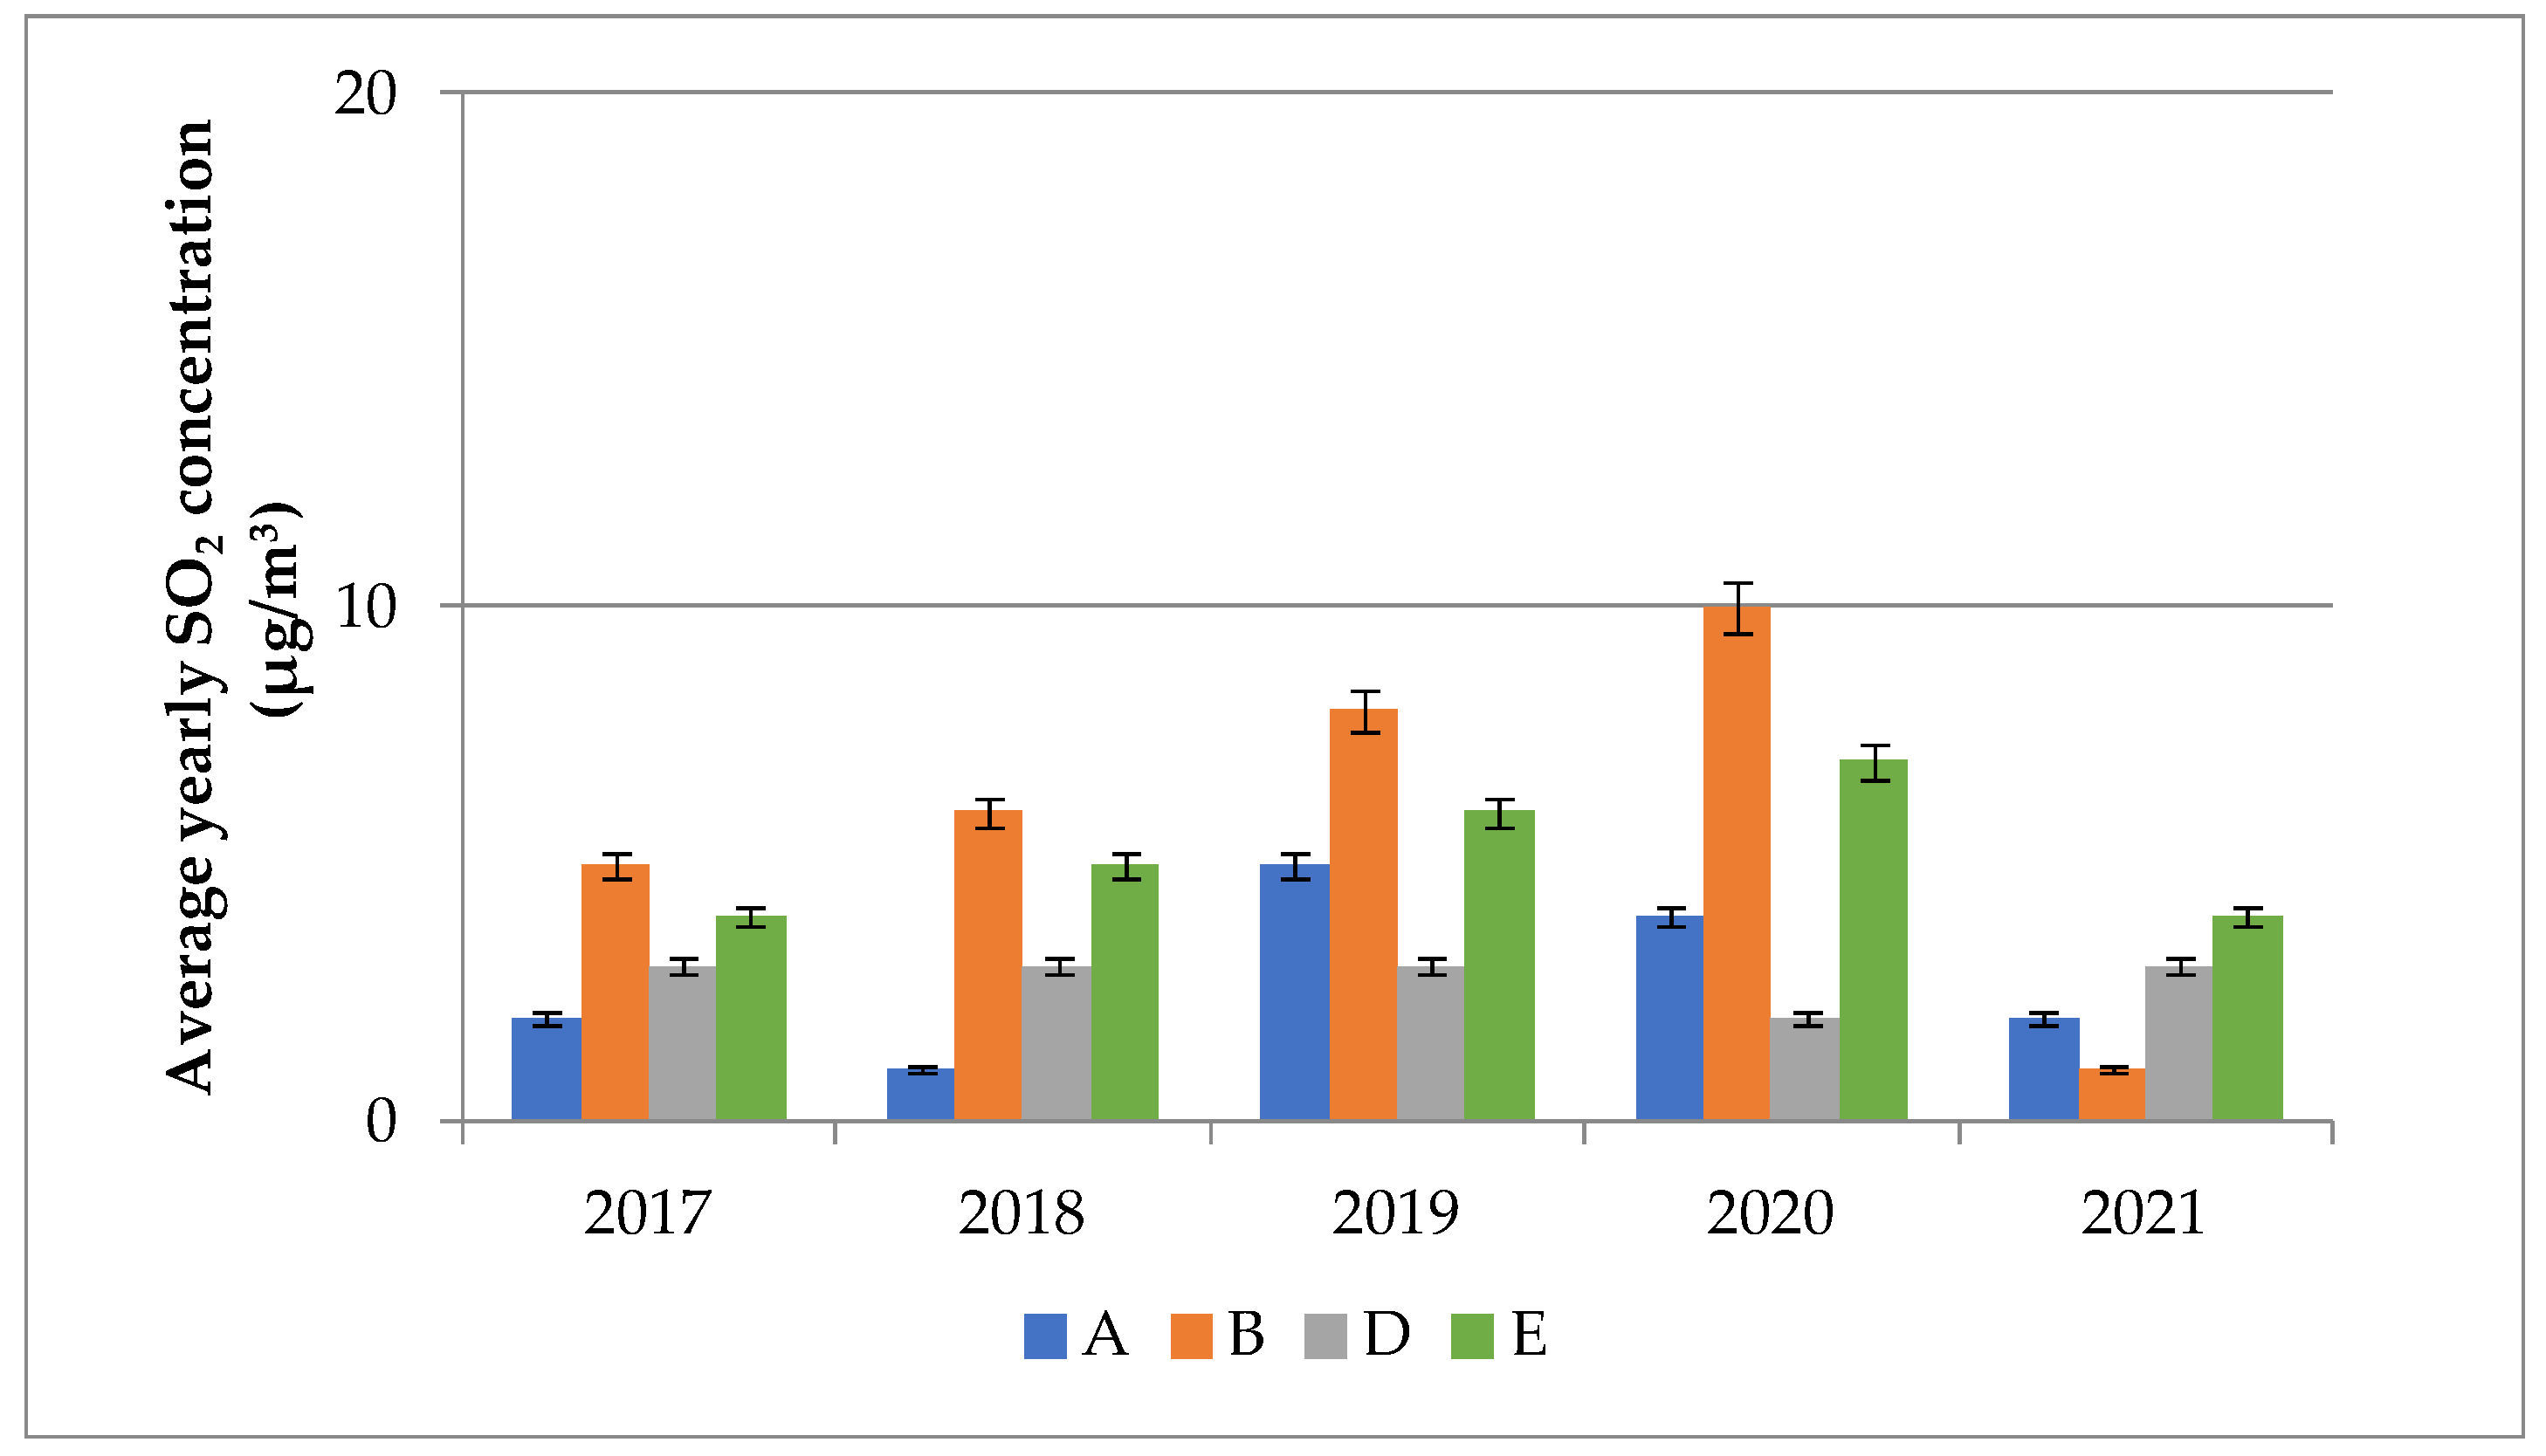
3.1. SO2 Concentrations between 2017 and 2021
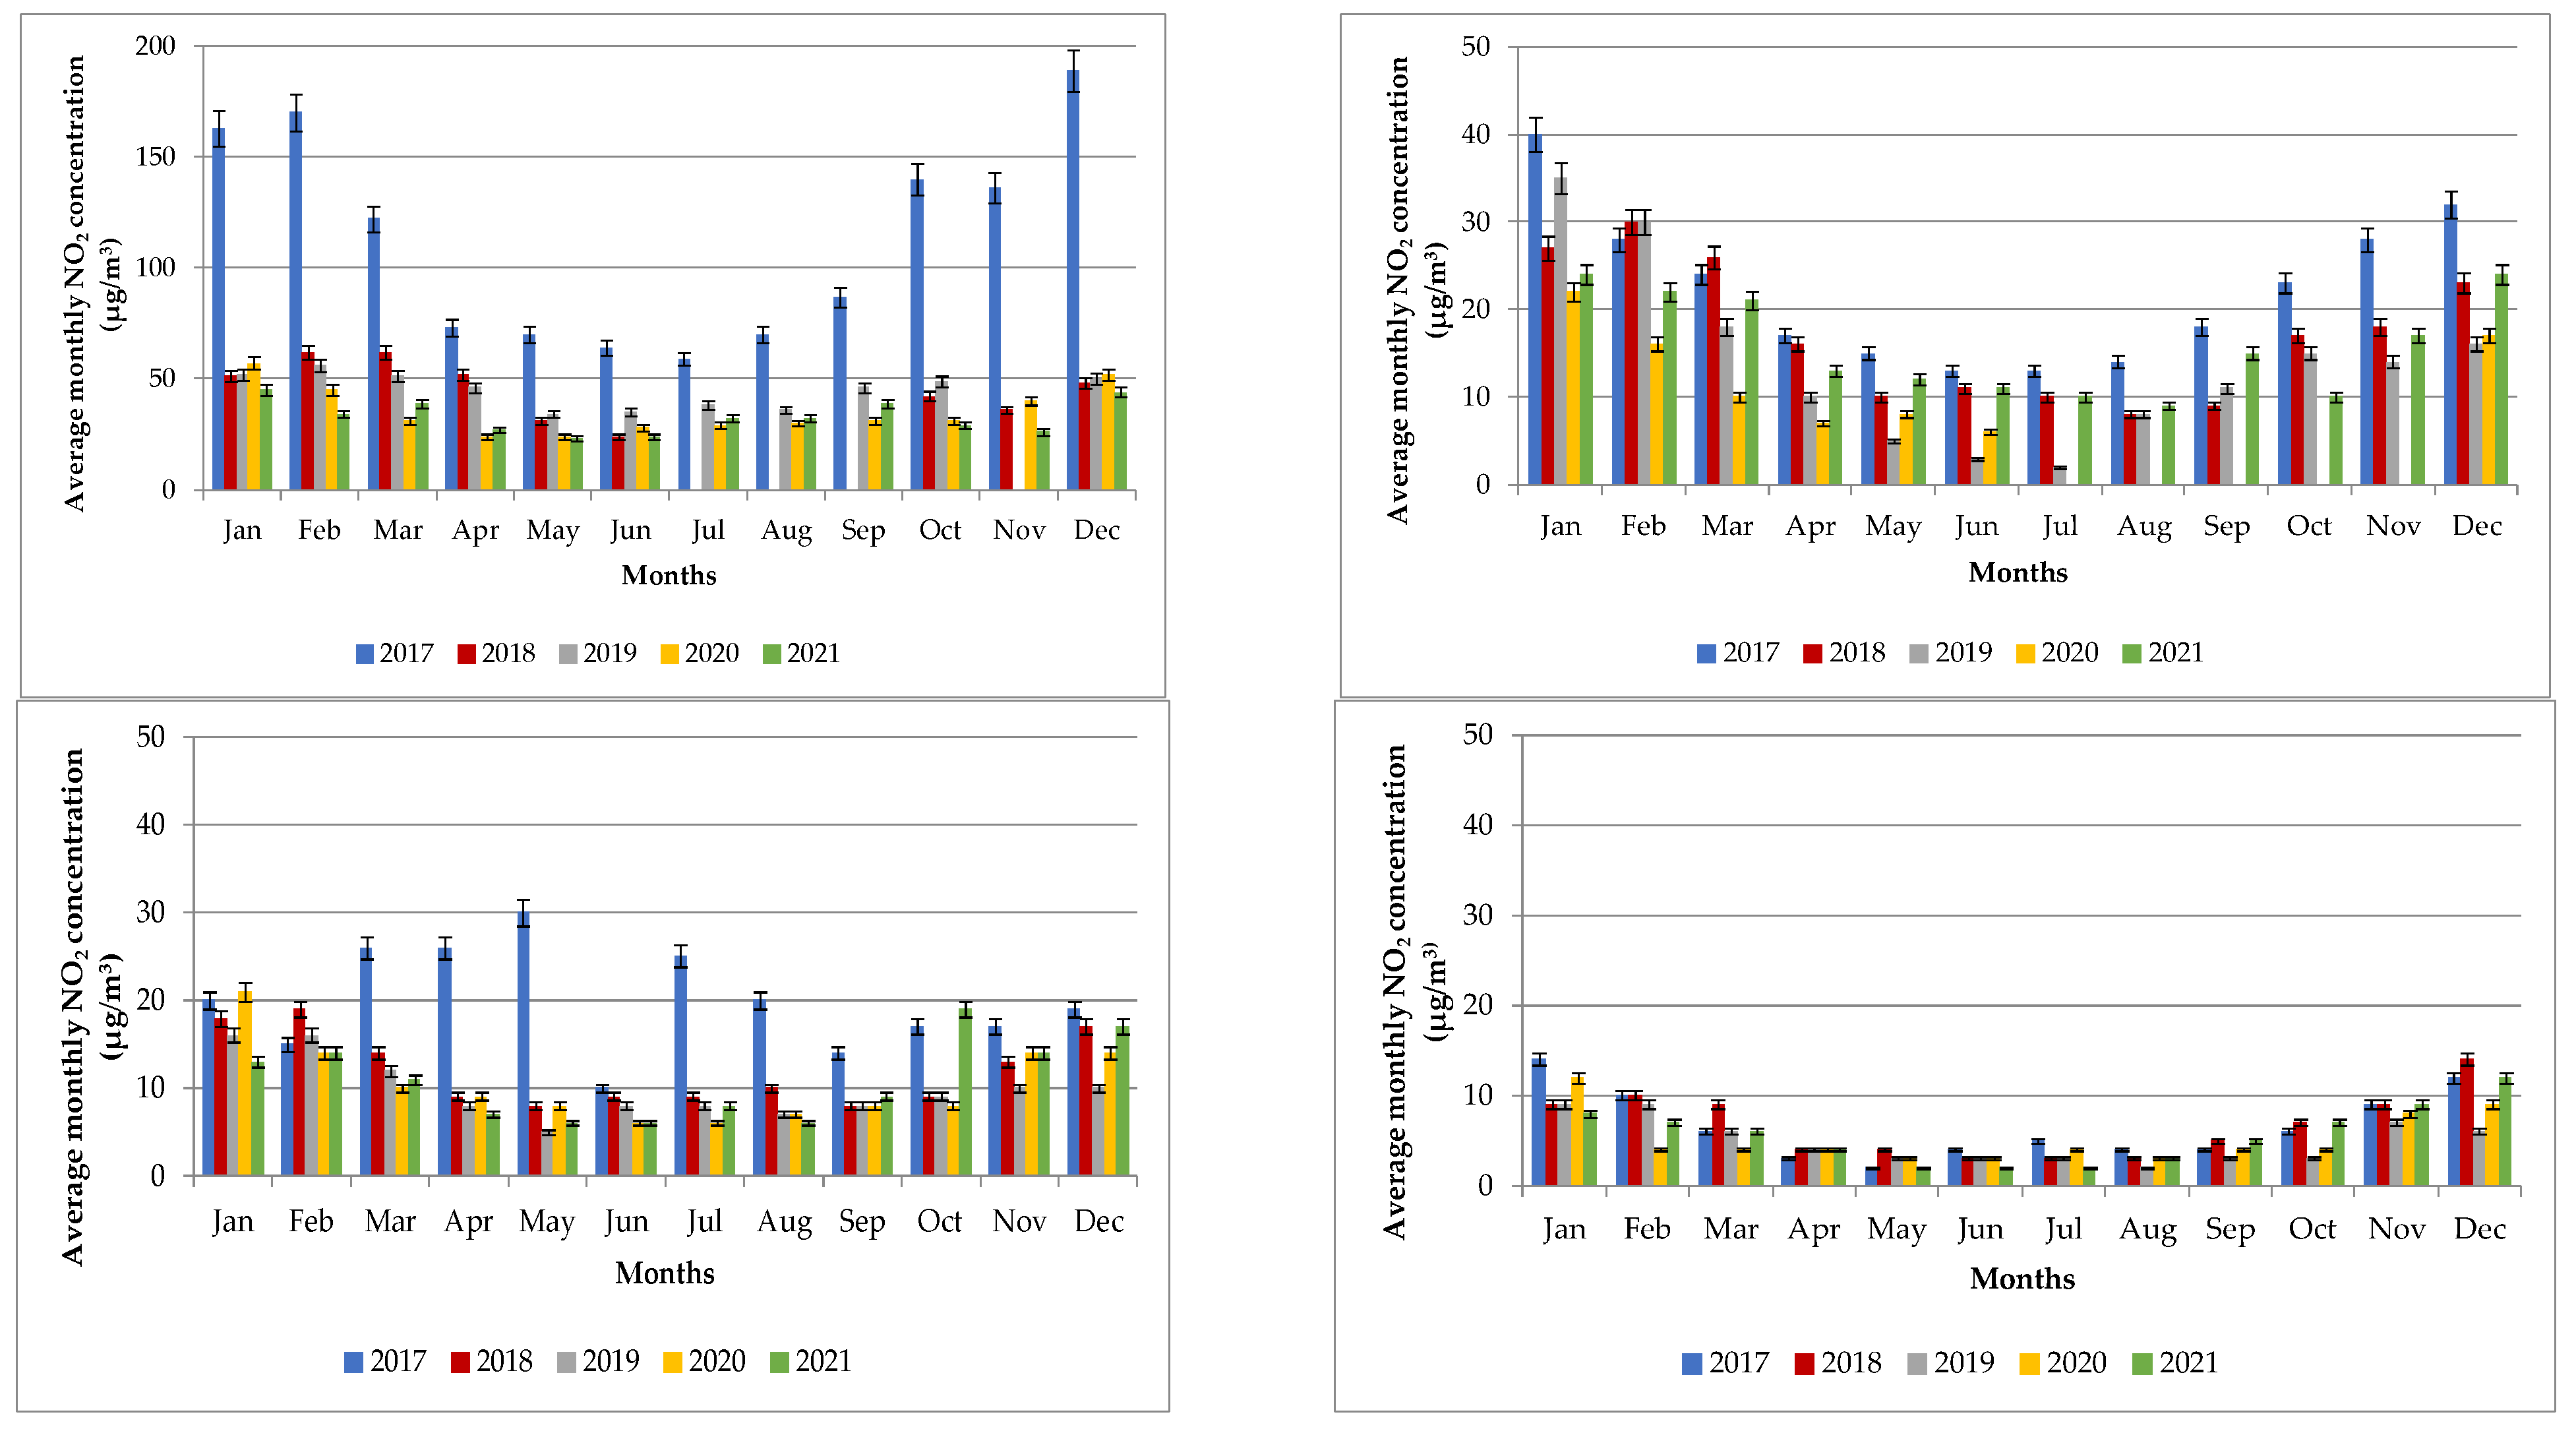
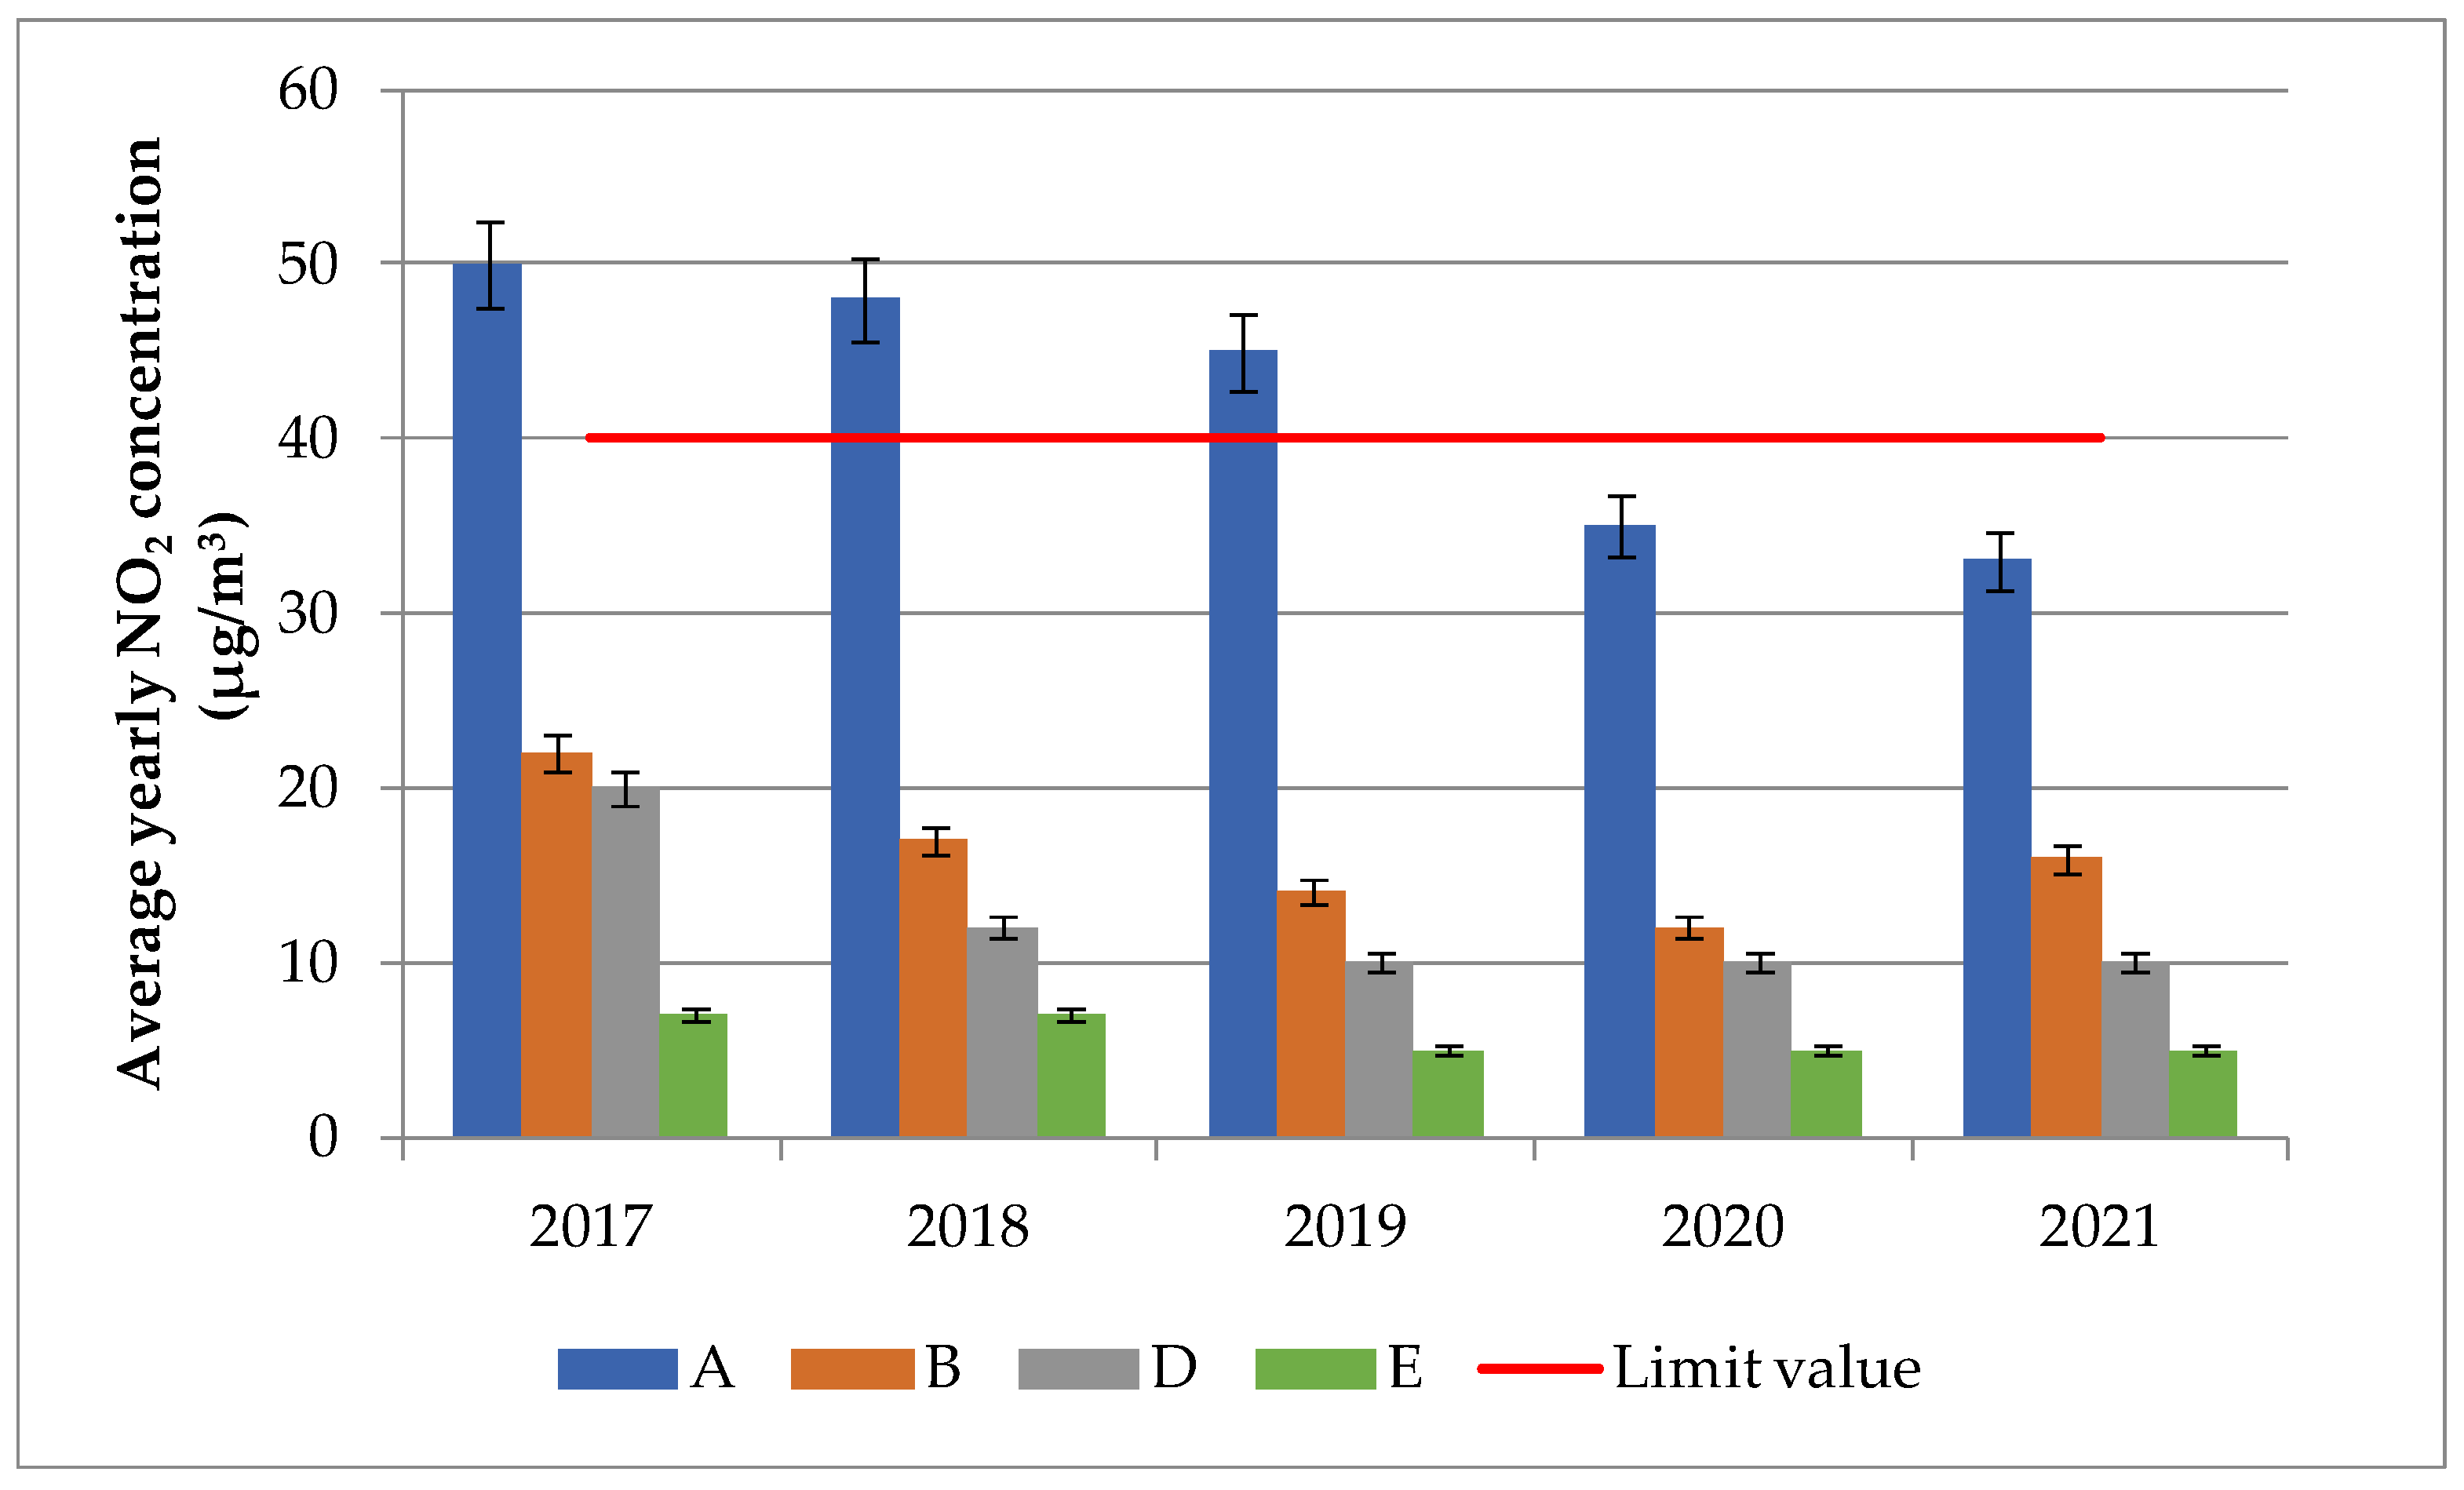
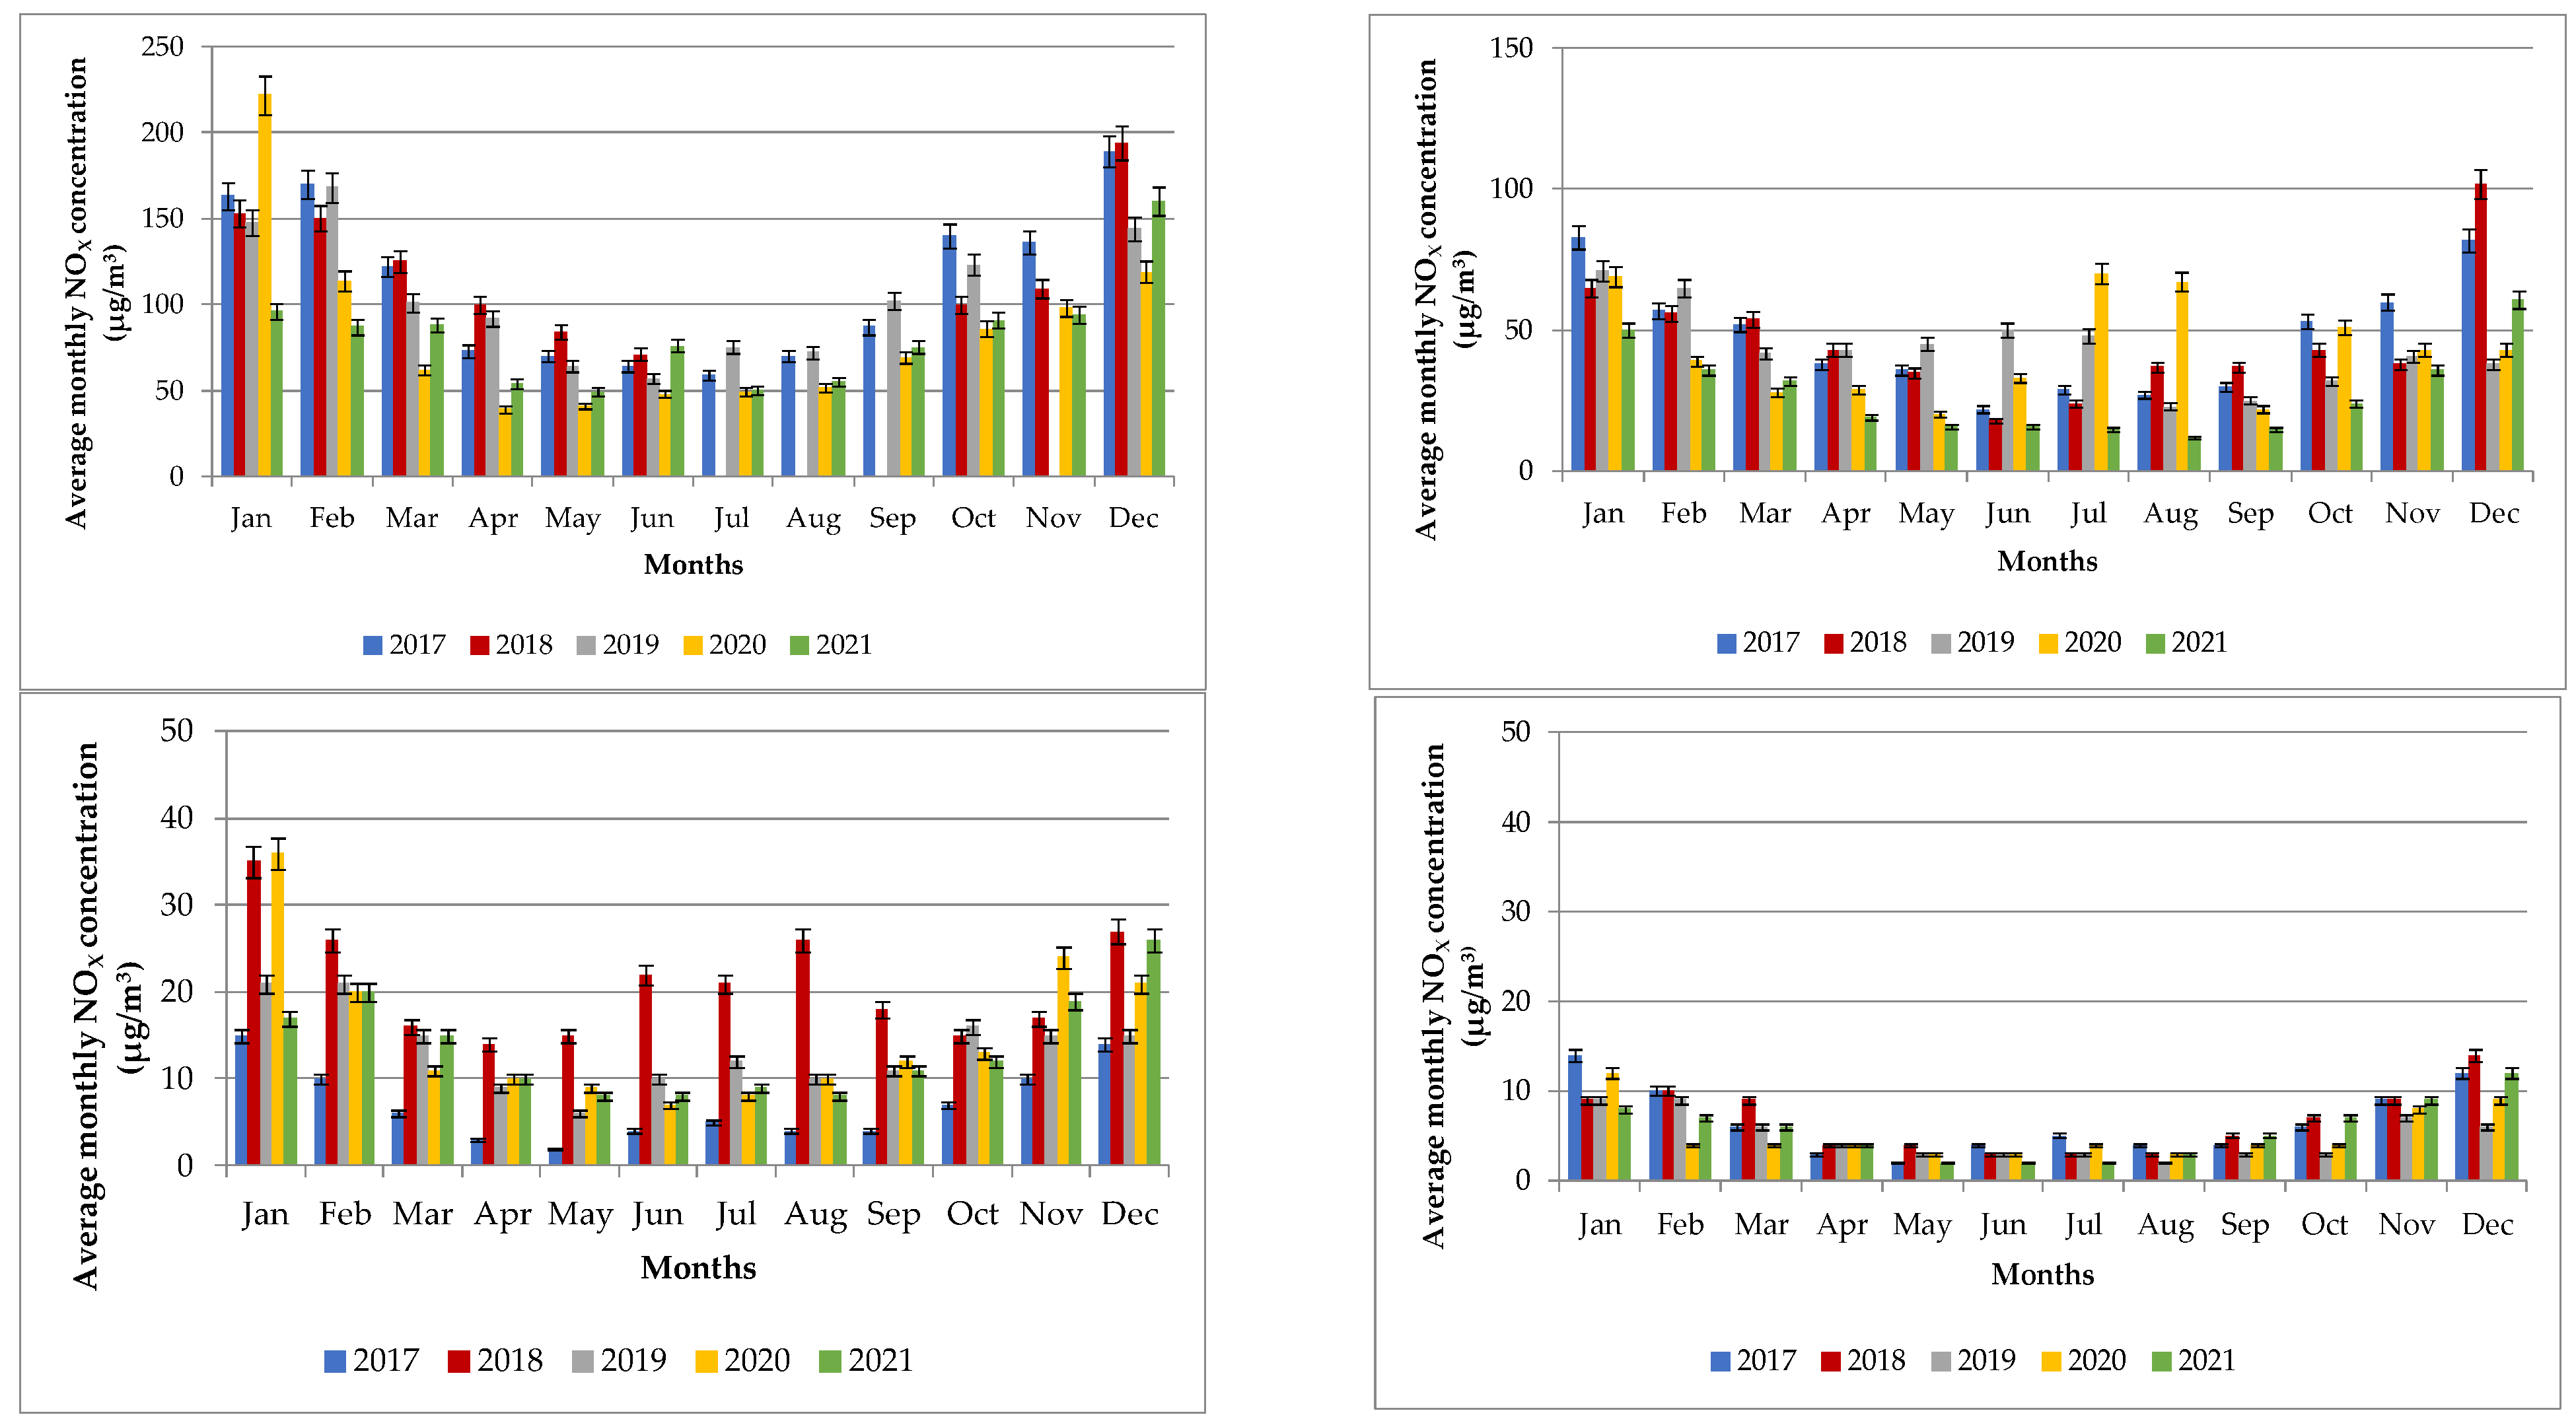
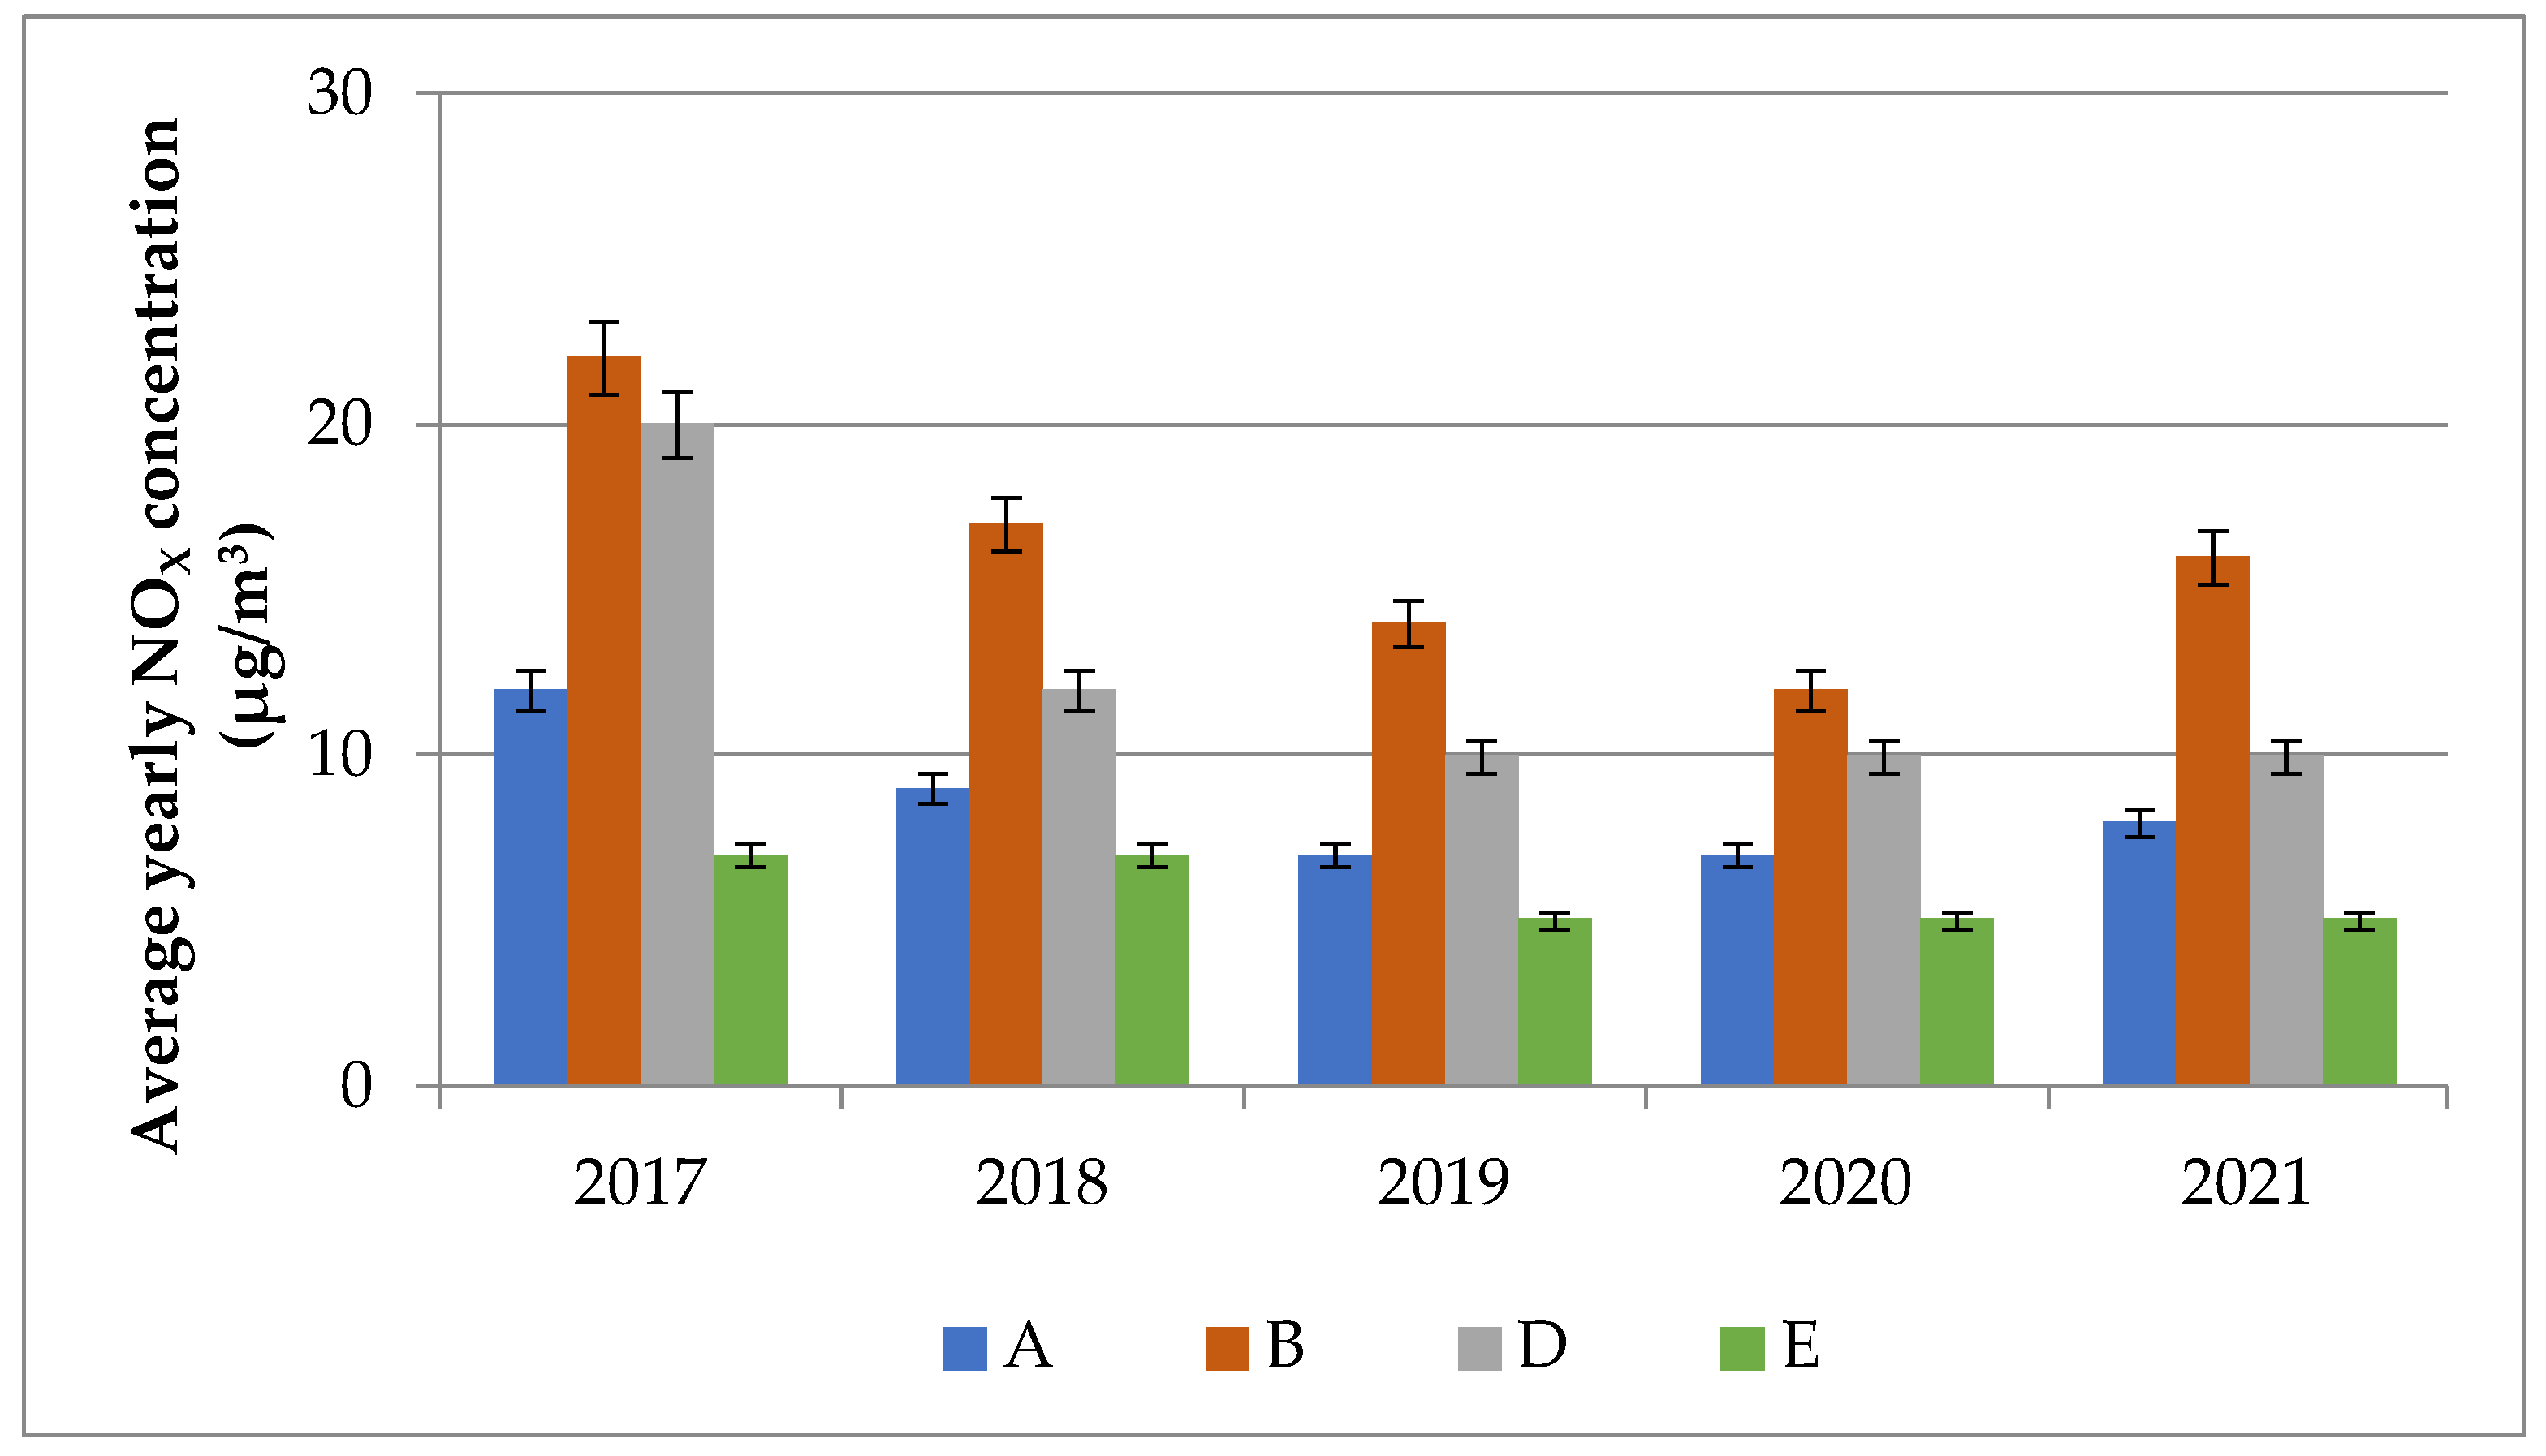
3.2. NO2 and NOX Concentrations between 2017 and 2021
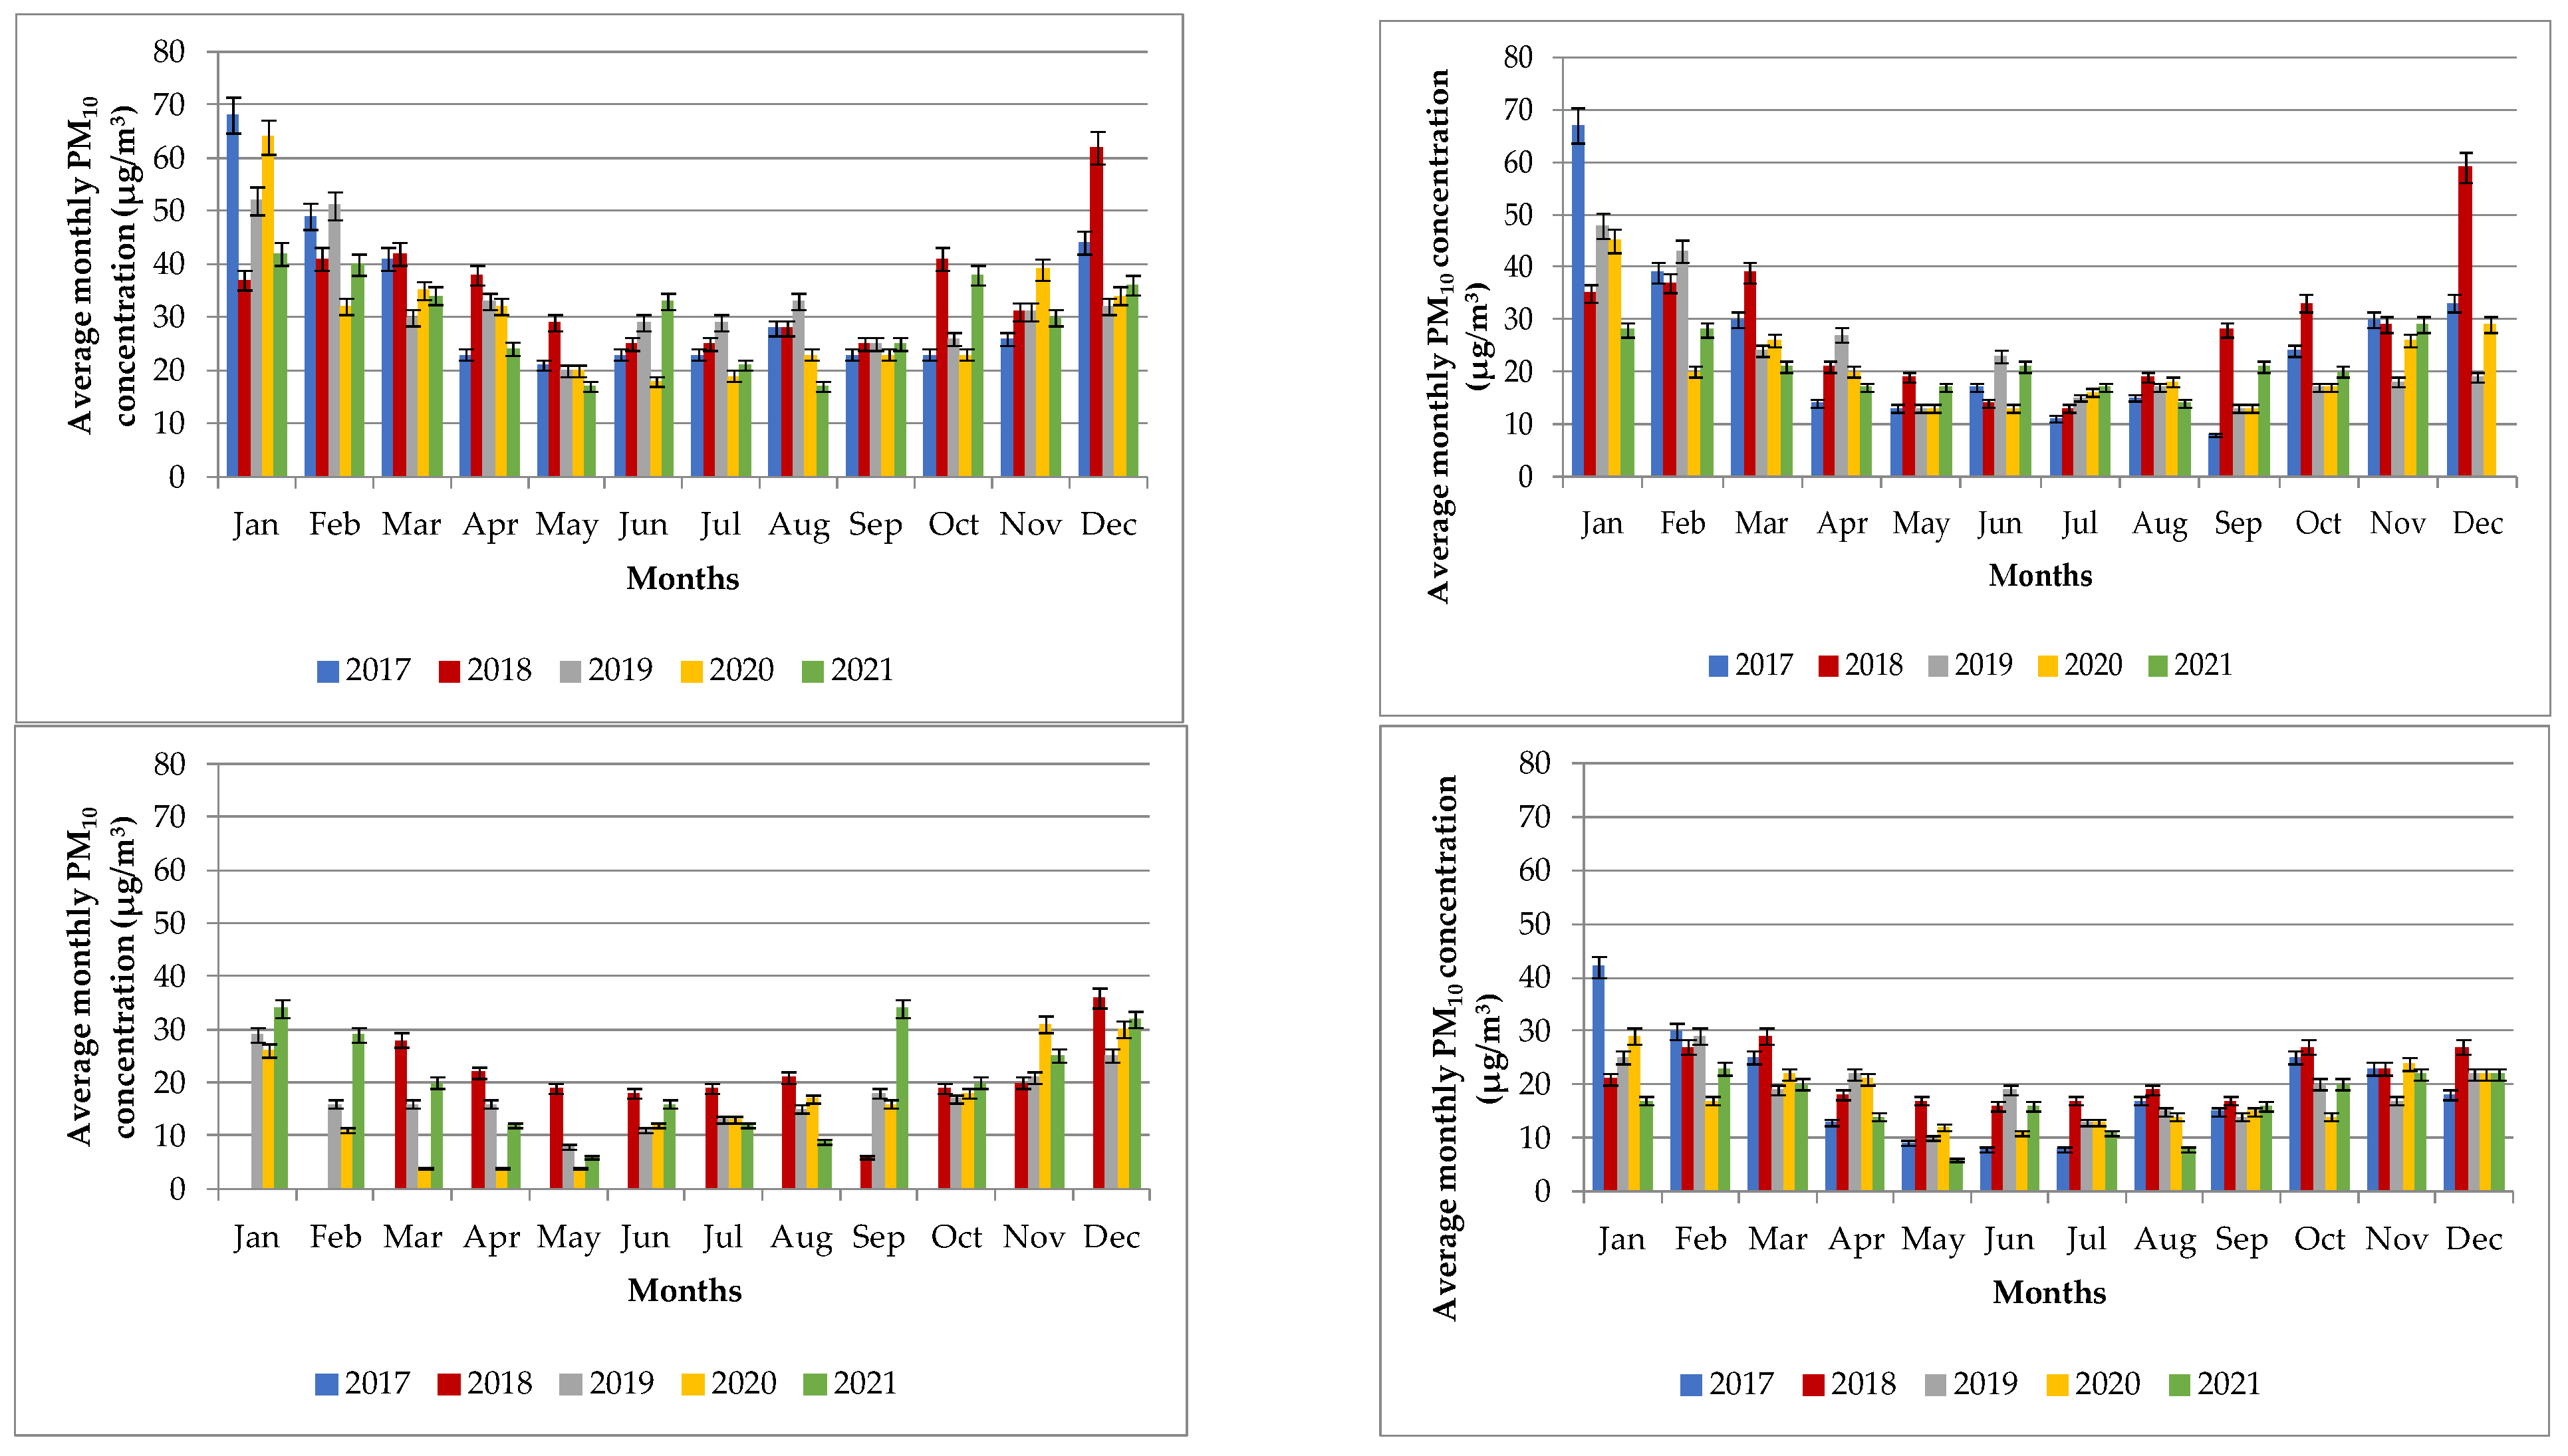
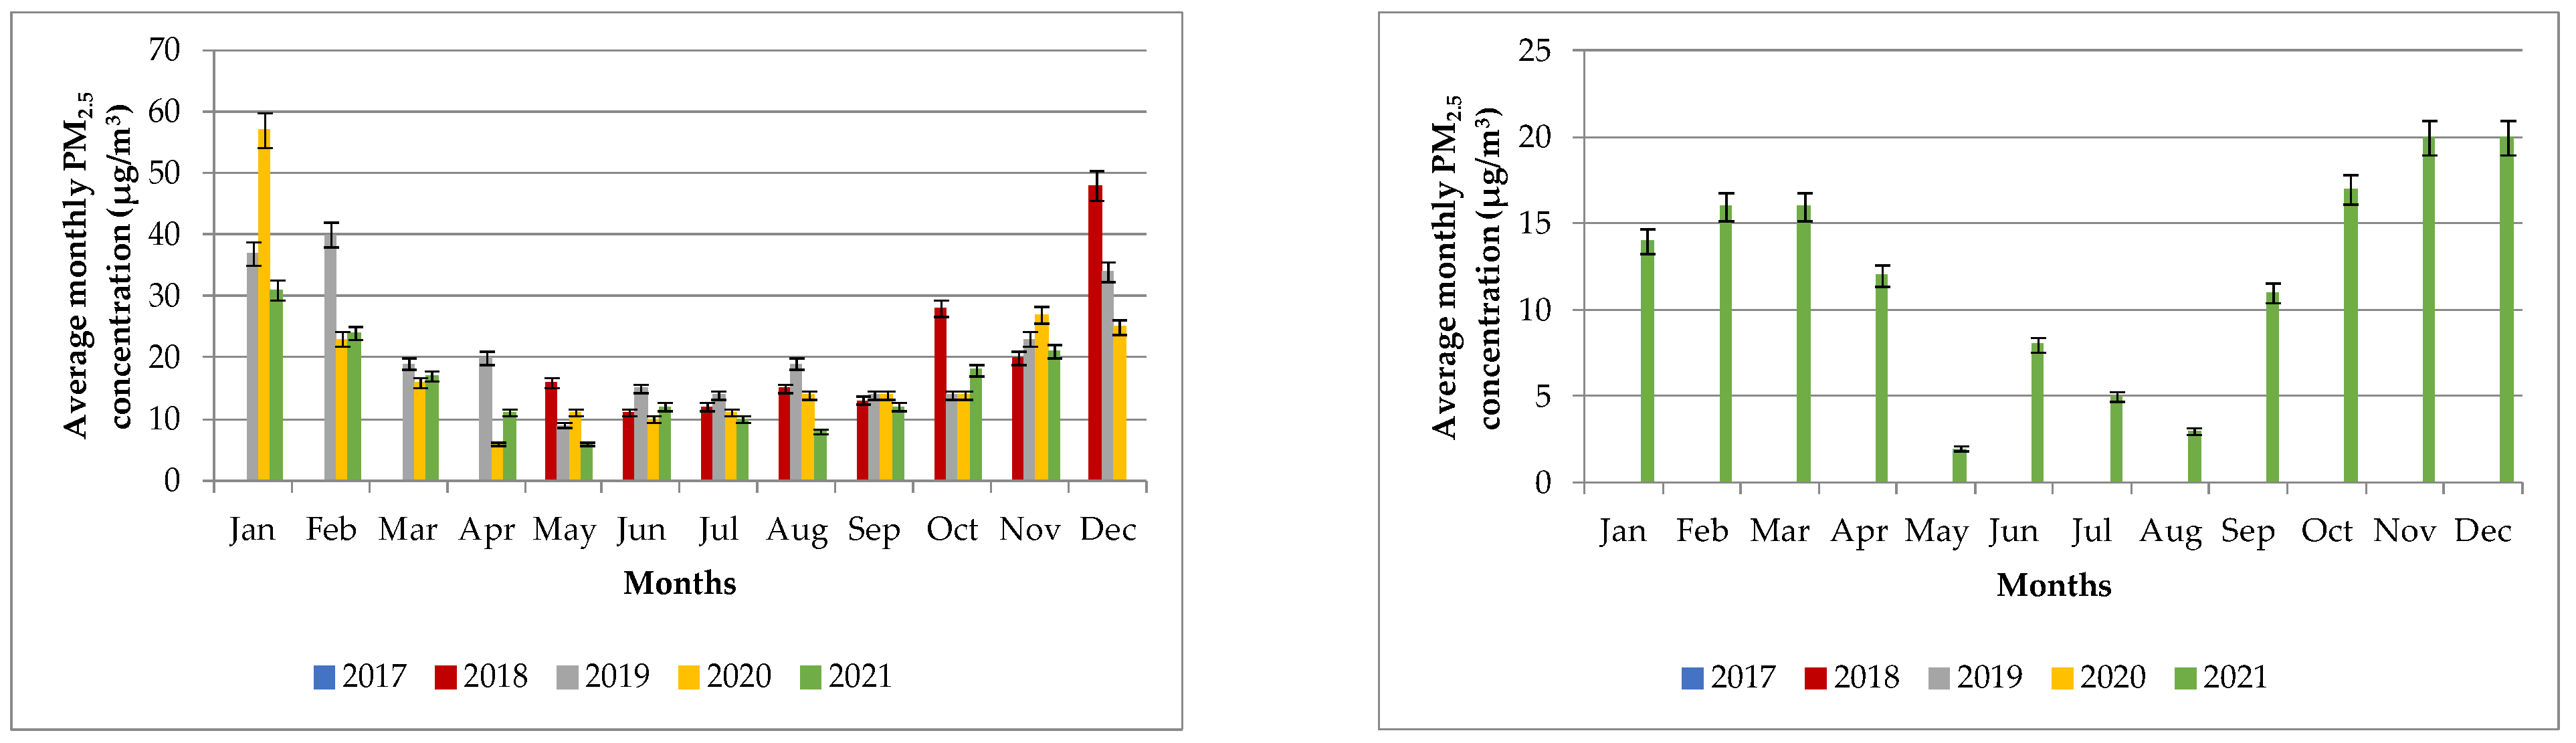
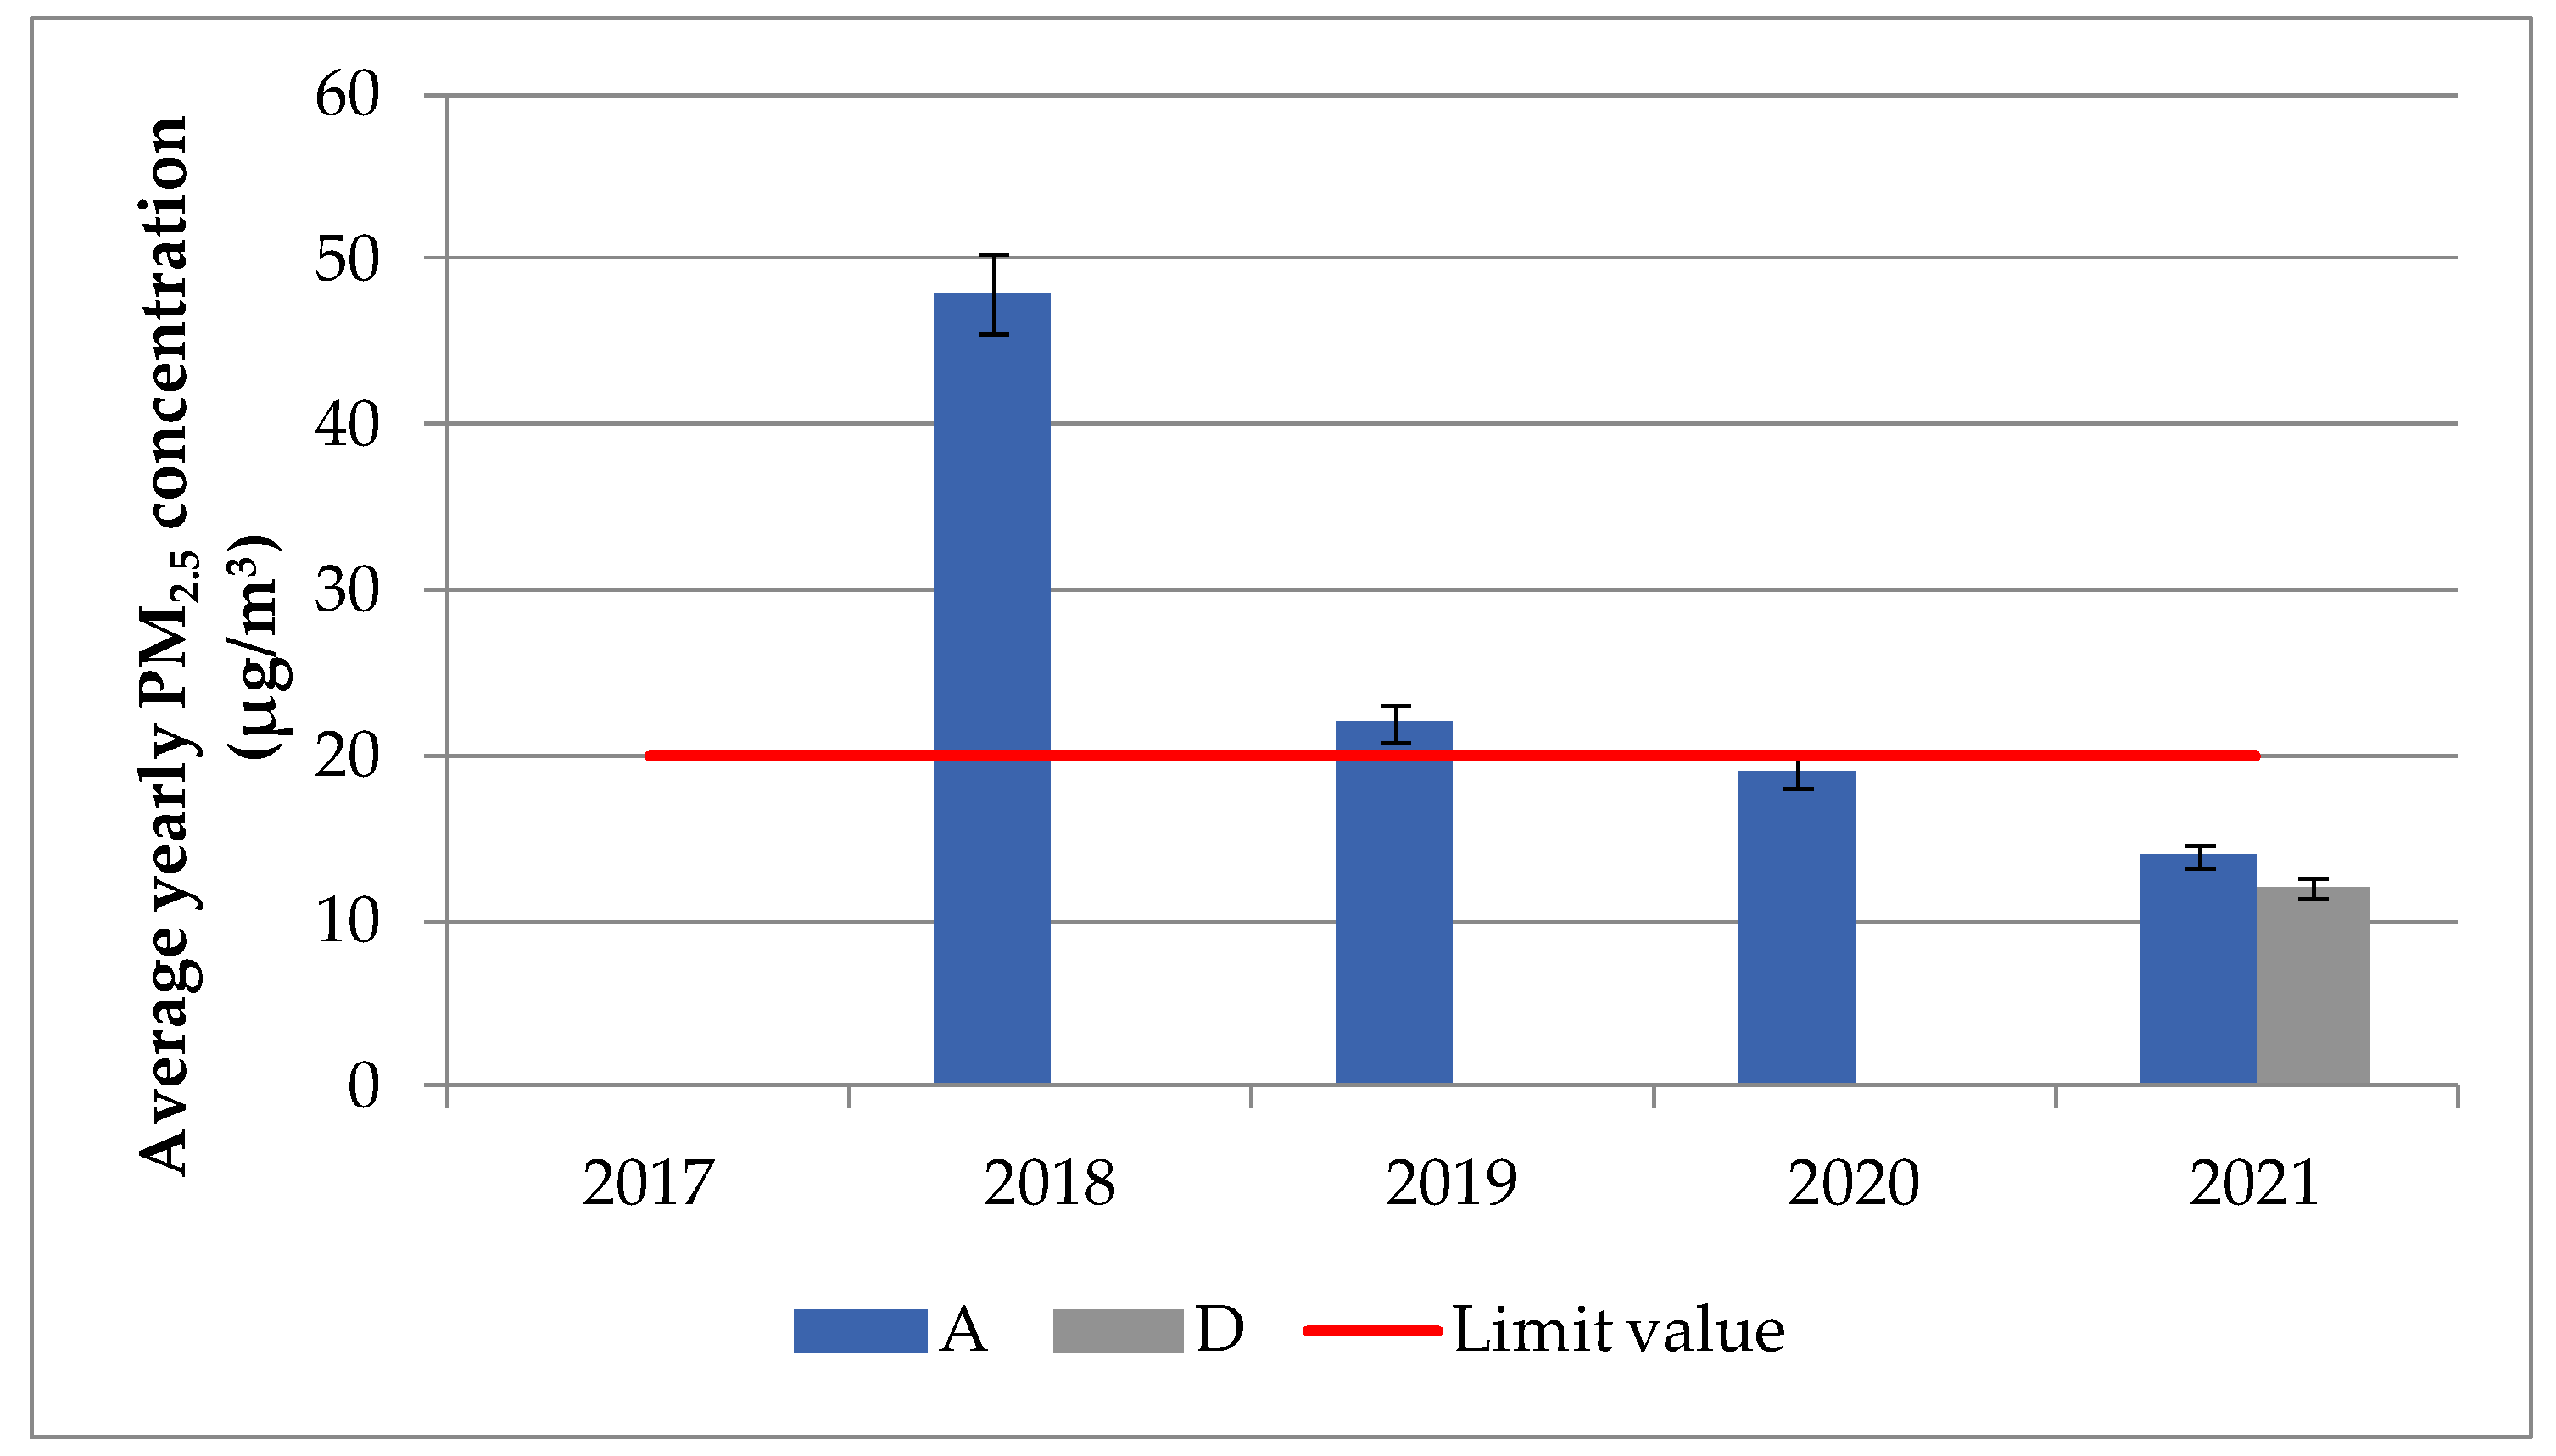
3.3. PM10 and PM2.5 Concentrations between 2017 and 2021
3.4. Correlation between NOX and NO2 during 2019 and 2020
3.5. Correlation between PM10 and PM2.5
3.6. Meteorological Conditions
3.7. Emission Sources in the Republic of Slovenia
4. Conclusions
Supplementary Materials
Author Contributions
Funding
Institutional Review Board Statement
Informed Consent Statement
Data Availability Statement
Conflicts of Interest
Abbreviations
| ARSO | Slovenian Environment Agency |
| EEA | European Environment Agency |
| EU | European Union |
| EIMV | Elektroinštitut Milan Vidmar |
| NIJZ | National Institute for Public Health |
| SM | Supplementary Materials |
| RS | Republic of Slovenia |
| WHO | World Health Organization |
References
- World Health Assembly, 71. Health, Environment and Climate Change: Report by the Director-General; World Health Organization: Geneva, Switzerland, 2018; Volume 2016, pp. 1–7. [Google Scholar]
- Jesemann, A.; Matthias, V.; Böhner, J. Using Neural Network NO2-Predictions to Understand Air Quality Changes in Urban Areas—A Case Study in Hamburg. Atmosphere 2022, 13, 1929. [Google Scholar] [CrossRef]
- Pucer, J.F.; Strumbelj, E. Impact of Changes in Climate on Air Pollution in Slovenia between 2002 and 2017. Environ. Pollut. 2018, 242, 398–406. [Google Scholar] [CrossRef] [PubMed]
- Zheng, H.; Yang, Z.; Yang, J.; Tao, Y.; Zhang, L. Comprehensive Evaluation of Environmental Air Quality Based on the Entropy Weights and Concentration Variation Trends of Pollutants. Atmosphere 2022, 13, 1978. [Google Scholar] [CrossRef]
- Gjerek, M.; Koleša, T.; Logar, M.; Matevž, L.; Murovec, M.; Rus, M.; Žabkar, R. Kakovost Zraka v Sloveniji v Letu 2020; Agencija Republike Slovenia za Okolje: Ljubljana, Slovenia, 2021. Available online: https://www.arso.gov.si/zrak/kakovost%20zraka/poro%C4%8Dila%20in%20publikacije/kakovost_letna.html (accessed on 8 March 2023).
- European Environment Agency (EEA). Air Quality in Europe—2020 Report; European Environment Agency (EEA): Copenhagen, Denmark, 2020; Available online: https://www.eea.europa.eu/publications/air-quality-in-europe-2020-report (accessed on 8 March 2023).
- World Health Organization (WHO). WHO Global Air Quality Guidelines, Update 2021; World Health Organization: Geneva, Switzerland, 2021; Available online: https://www.who.int/health-topics/air-pollution#tab=tab_1 (accessed on 8 March 2023).
- Brauer, M.; Casadei, B.; Harrington, R.A.; Kovacs, R.; Sliwa, K.; Davaakhuu, N.; Hadley, M.; Kass, D.; Miller, M.; Consuelo Escamilla Nuñez, M.; et al. Taking a Stand Against Air Pollution—The Impact on Cardiovascular Disease: A Joint Opinion from the World Heart Federation, American College of Cardiology, American Heart Association, and the European Society of Cardiology. J. Am. Coll. Cardiol. 2021, 77, 1684–1688. [Google Scholar] [CrossRef] [PubMed]
- Cohen, A.J.; Brauer, M.; Burnett, R.; Anderson, H.R.; Frostad, J.; Estep, K.; Balakrishnan, K.; Brunekreef, B.; Dandona, L.; Dandona, R.; et al. Estimates and 25-Year Trends of the Global Burden of Disease Attributable to Ambient Air Pollution: An Analysis of Data from the Global Burden of Diseases Study 2015. Lancet 2017, 389, 1907–1918. [Google Scholar] [CrossRef] [PubMed] [Green Version]
- Pandey, A.; Brauer, M.; Cropper, M.L.; Balakrishnan, K.; Mathur, P.; Dey, S.; Turkgulu, B.; Kumar, G.A.; Khare, M.; Beig, G.; et al. Health and Economic Impact of Air Pollution in the States of India: The Global Burden of Disease Study 2019. Lancet Planet. Health 2021, 5, e25–e38. [Google Scholar] [CrossRef]
- Maftei, C.; Muntean, R.; Poinareanu, I. The Impact of Air Pollution on Pulmonary Diseases: A Case Study from Brasov County, Romania. Atmosphere 2022, 13, 902. [Google Scholar] [CrossRef]
- World Health Organization (WHO). Air Quality Guidelines, Global Update 2005; World Health Organization: Geneva, Switzerland, 2006; Available online: https://apps.who.int/iris/handle/10665/107823 (accessed on 8 March 2023).
- Gjerek, M.; Koleša, T.; Logar, M.; Matevž, L.; Murovec, M.; Rus, M.; Žabkar, R. Kakovost Zraka v Sloveniji v Letu 2017; Agencija Republike Slovenia za Okolje: Ljubljana, Slovenia, 2018; Volume 127. Available online: https://www.arso.gov.si/zrak/kakovost%20zraka/poro%C4%8Dila%20in%20publikacije/kakovost_letna.html (accessed on 8 March 2023).
- Ivanovski, M.; Lavrič, P.D.; Vončina, R.; Goričanec, D.; Urbancl, D. Improvement of Air Quality during the COVID-19 Lockdowns in the Republic of Slovenia and Its Connection with Meteorology. Aerosol Air Qual. Res. 2022, 22, 1–17. [Google Scholar] [CrossRef]
- Nacionalni Inštitut za javno zdravje (NIJZ). Ocena Vpliva Onesnaženosti Zraka z Delci (PM) Na Umrljivost v Slovenskih Krajih; Nacionalni Inštitut za Javno Zdravje (NIJZ): Ljubljana, Slovenia, 2018; Available online: https://nijz.si/moje-okolje/zrak/ocena-vpliva-onesnazenosti-zraka-z-delci-pm25-na-umrljivost-v-krajih-s-prekomerno-onesnazenim-zrakom-opazovalno-obdobje-2017-2019/ (accessed on 8 March 2023).
- Ivanovski, M.; Dolšak Lavrič, P.; Miklavčič, N.; Kovačič, D.V.R. Rezultati Meritev Okoljskega Merilnega Sistema Mestne Občine Celje—AMP Gaji: Leto 2020: Študija Št. 2475; Elektroinštitut Milan Vidmar: Ljubljana, Slovenia, 2021; Available online: http://www.okolje.info/index.php/arhiv-porocil (accessed on 8 March 2023).
- Bec, D.; Ciglenički, D.; Dolšak Lavrič, P.; Gjerek, M.; Koleša, T.; Logar, M.; Matavž, L.; Murovec, M.; Rus, M.; Žabkar, R. Kakovost Zraka v Republiki Sloveniji v Letu 2021; Agencija Republike Slovenia za Okolje: Ljubljana, Slovenia, 2021. Available online: https://www.arso.gov.si/zrak/kakovost%20zraka/poro%C4%8Dila%20in%20publikacije/kakovost_letna.html (accessed on 8 March 2023).
- Shi, J.; Liu, S.; Qu, Y.; Zhang, T.; Dai, W.; Zhang, P.; Li, R.; Zhu, C.; Cao, J. Variations of the Urban PM2.5 Chemical Components and Corresponding Light Extinction for Three Heating Seasons in the Guanzhong Plain, China. J. Environ. Manag. 2023, 327, 116821. [Google Scholar] [CrossRef]
- Wang, L.; Guan, Q.; Wang, F.; Yang, L.; Liu, Z. Association between Heating Seasons and Criteria Air Pollutants in Three Provincial Capitals in Northern China: Spatiotemporal Variation and Sources Contribution. Build. Environ. 2018, 132, 233–244. [Google Scholar] [CrossRef]
- Calkins, C.; Ge, C.; Wang, J.; Anderson, M.; Yang, K. Effects of Meteorological Conditions on Sulfur Dioxide Air Pollution in the North China Plain during Winters of 2006–2015. Atmos. Environ. 2016, 147, 296–309. [Google Scholar] [CrossRef]
- Chen, J.; Huang, S.; Shen, Z.; Song, M.; Zhu, Z. Impact of Sulfur Dioxide Emissions Trading Pilot Scheme on Pollution Emissions Intensity: A Study Based on the Synthetic Control Method. Energy Policy 2022, 161, 112730. [Google Scholar] [CrossRef]
- Boogaard, H.; Kos, G.P.A.; Weijers, E.P.; Janssen, N.A.H.; Fischer, P.H.; van der Zee, S.C.; de Hartog, J.J.; Hoek, G. Contrast in Air Pollution Components between Major Streets and Background Locations: Particulate Matter Mass, Black Carbon, Elemental Composition, Nitrogen Oxide and Ultra Fi Ne Particle Number. Atmos. Environ. 2011, 45, 650–658. [Google Scholar] [CrossRef]
- Dales, R.; Blanco-Vidal, C.; Romero-Meza, R.; Schoen, S.; Lukina, A.; Cakmak, S. The Association between Air Pollution and COVID-19 Related Mortality in Santiago, Chile: A Daily Time Series Analysis. Environ. Res. 2021, 198, 111284. [Google Scholar] [CrossRef]
- Sokhi, R.S.; Singh, V.; Querol, X.; Finardi, S.; Targino, A.C.; de Fatima Andrade, M.; Pavlovic, R.; Garland, R.M.; Massagué, J.; Kong, S.; et al. A Global Observational Analysis to Understand Changes in Air Quality during Exceptionally Low Anthropogenic Emission Conditions. Environ. Int. 2021, 157, 106818. [Google Scholar] [CrossRef]
- Wang, L.; Wang, J.; Tan, X.; Fang, C. Analysis of NOx Pollution Characteristics in the Atmospheric Environment in Changchun City. Atmosphere 2020, 11, 30. [Google Scholar] [CrossRef] [Green Version]
- Gasmi, K.; Aljalal, A.; Al-basheer, W. Analysis of NOx, NO and NO2 ambient levels as a function of meteorological parameters in Dhahran, Saudi Arabia. WIT Trans. Ecol. Environ. 2017, 211, 77–86. [Google Scholar] [CrossRef] [Green Version]
- Benchrif, A.; Wheida, A.; Tahri, M.; Shubbar, R.M.; Biswas, B. Air Quality during Three COVID-19 Lockdown Phases: AQI, PM2.5 and NO2 Assessment in Cities with More than 1 Million Inhabitants. Sustain. Cities Soc. 2021, 74, 103170. [Google Scholar] [CrossRef]
- Travaglio, M.; Yu, Y.; Popovic, R.; Selley, L.; Leal, N.S.; Martins, L.M. Links between Air Pollution and COVID-19 in England. Environ. Pollut. 2021, 268, 115859. [Google Scholar] [CrossRef]
- Hilker, N.; Wang, J.M.; Jeong, C.H.; Healy, R.M.; Sofowote, U.; Debosz, J.; Su, Y.; Noble, M.; Munoz, A.; Doerksen, G.; et al. Traffic-Related Air Pollution near Roadways: Discerning Local Impacts from Background. Atmos. Meas. Tech. 2019, 12, 5247–5261. [Google Scholar] [CrossRef] [Green Version]
- Demirgok, B.; Thiruvengadam, A.; Pradhan, S.; Besch, M.; Thiruvengadam, P.; Posada, F.; Quiros, D.C.; Hu, S. Real-World Emissions from Modern Heavy-Duty Vehicles: Sensitivity Analysis of in-Use Emissions Analysis Methods. Atmos. Environ. 2021, 252, 118294. [Google Scholar] [CrossRef]
- Talbi, A.; Kerchich, Y.; Kerbachi, R.; Boughedaoui, M. Assessment of Annual Air Pollution Levels with PM1, PM2.5, PM10 and Associated Heavy Metals in Algiers, Algeria. Environ. Pollut. 2018, 232, 252–263. [Google Scholar] [CrossRef] [PubMed]
- Usman, F.; Zeb, B.; Alam, K.; Valipour, M.; Ditta, A.; Sorooshian, A.; Roy, R.; Ahmad, I.; Iqbal, R. Exploring the Mass Concentration of Particulate Matter and Its Relationship with Meteorological Parameters in the Hindu-Kush Range. Atmosphere 2022, 13, 1628. [Google Scholar] [CrossRef]
- Truong, A.H.; Kim, M.T.; Nguyen, T.T.; Nguyen, N.T. Methane, Nitrous Oxide and Ammonia Emissions from Livestock Farming in the Red River Delta, Vietnam: An Inventory and Projection for 2000–2030. Sustainability 2018, 10, 3826. [Google Scholar] [CrossRef] [Green Version]
- Jiaxin, C.; Hui, H.; Feifei, W.; Mi, Z.; Ting, Z.; Shicheng, Y.; Ruoqiao, B.; Nan, C.; Ke, X.; Hao, H. Air Quality Characteristics in Wuhan (China) during the 2020 COVID-19 Pandemic. Environ. Res. 2021, 195, 110879. [Google Scholar] [CrossRef]
- Khatri, P.; Hayasaka, T. Impacts of COVID-19 on Air Quality over China: Links with Meteorological Factors and Energy Consumption. Aerosol Air Qual. Res. 2021, 21, 1–18. [Google Scholar] [CrossRef]
- Zhu, Y.; Xie, J.; Huang, F.; Cao, L. Association between Short-Term Exposure to Air Pollution and COVID-19 Infection: Evidence from China. Sci. Total Environ. 2020, 727, 138704. [Google Scholar] [CrossRef]
- Karagulian, F.; Belis, C.A.; Dora, C.F.C.; Prüss-Ustün, A.M.; Bonjour, S.; Adair-Rohani, H.; Amann, M. Contributions to Cities’ Ambient Particulate Matter (PM): A Systematic Review of Local Source Contributions at Global Level. Atmos. Environ. 2015, 120, 475–483. [Google Scholar] [CrossRef]
- Dolšak Lavrič, P.; Hofer, B.; Ivanovski, M.; Kovačič, D.; Miklavčič, N.V.R. Poročilo o Meritvah Kakovosti Zraka AMP Agenciji Republike Slovenije Za Okolje, Leto 2020; Agenciji Republike Slovenije Za Okolje: Ljubljana, Slovenia, 2020; Available online: http://www.okolje.info/index.php/arhiv-porocil (accessed on 8 March 2023).


| Sampling Location | Altitude (m) | GKKY | GKKX | Area Type | Measurement Type | Pollutants Measured | Meteorological Data Measured |
|---|---|---|---|---|---|---|---|
| A | 299 | 461,919.00 | 101,581.00 | Urban | Traffic | SO2, NO2, NOX, PM10, and PM2.5 | Air temperature (°C), Wind direction and speed (m/s), Humidity (%) |
| B | 240 | 522,888.00 | 122,129.00 | Urban | Background | SO2, NO2, NOX | |
| C | 346 | 454,441.00 | 111,411.00 | Suburban | Background | PM10 | |
| D | 362 | 504,504.00 | 137,017.00 | Suburban | Industrial | SO2, NO2, NOX, PM10, and PM2.5 | |
| E | 390 | 537,299.00 | 93,935.00 | Rural | Background | SO2, NO2, NOX |
| A | B | D | E | ||
|---|---|---|---|---|---|
| 2017 | average | 111.92 ± 5.97 | 47.42 ± 2.37 | 7.00 ± 0.35 | 6.16 ± 0.31 |
| min. | 59.00 ± 2.95 | 22.00 ± 1.10 | 2.00 ± 0.10 | 2.00 ± 0.10 | |
| max. | 159.00 ± 9.45 | 83.00 ± 4.15 | 15.00 ± 0.75 | 15.00 ± 0.75 | |
| 2018 | average | 90.50 ± 4.53 | 46.00 ± 2.30 | 21.00 ± 1.05 | 7.58 ± 0.38 |
| min. | 0.00 ± 0.00 | 18.00 ± 0.90 | 14.00 ± 0.70 | 4.00 ± 0.20 | |
| max. | 194.00 ± 9.70 | 102.00 ± 5.10 | 35.00 ± 1.75 | 15.00 ± 0.75 | |
| 2019 | average | 90.50 ± 4.53 | 43.58 ± 2.18 | 13.42 ± 0.67 | 5.58 ± 0.28 |
| min. | 0.00 ± 0.00 | 23.00 ± 1.15 | 6.00 ± 0.30 | 3.00 ± 0.15 | |
| max. | 168.00 ± 8.40 | 71.00 ± 3.55 | 21.00 ± 1.05 | 10.00 ± 0.50 | |
| 2020 | average | 83.30 ± 4.17 | 42.83 ± 2.14 | 15.08 ± 0.75 | 6.08 ± 0.30 |
| min. | 39.00 ± 1.95 | 20.00 ± 1.00 | 7.00 ± 0.35 | 2.00 ± 0.10 | |
| max. | 222.00 ± 11.10 | 70.00 ± 3.50 | 36.00 ± 1.80 | 15.00 ± 0.75 | |
| 2021 | average | 81.30 ± 4.01 | 27.67 ± 1.36 | 13.58 ± 0.70 | 6.16 ± 0.31 |
| min. | 49.00 ± 2.45 | 12.00 ± 0.60 | 8.00 ± 0.40 | 2.00 ± 0.10 | |
| max. | 160.00 ± 8.00 | 61.00 ± 3.05 | 26.00 ± 1.30 | 14.00 ± 0.70 |
| 2019 | 2020 | 2021 | |||||
|---|---|---|---|---|---|---|---|
| NO2 | NOX | NO2 | NOX | NO2 | NOX | ||
| A | NO2 | 1 | 1 | 1 | |||
| NOX | +0.84 * | 1 | +0.93 * | 1 | +0.94 * | 1 | |
| B | NO2 | 1 | 1 | 1 | |||
| NOX | +0.73 * | 1 | +0.72 * | 1 | +0.81 * | 1 | |
| D | NO2 | 1 | 1 | 1 | |||
| NOX | +0.82 * | 1 | +0.92 * | 1 | +0.89 * | 1 | |
| E | NO2 | 1 | 1 | 1 | |||
| NOX | +0.80 * | 1 | +0.70 * | 1 | +0.72 | 1 | |
| 2019 | 2020 | 2021 | |||||
|---|---|---|---|---|---|---|---|
| PM10 | PM2.5 | PM10 | PM2.5 | PM10 | PM2.5 | ||
| A | PM10 | 1 | 1 | 1 | |||
| PM2.5 | +0.957 * | 1 | +0.94 * | 1 | +0.94 * | 1 | |
| D | PM10 | 1 | 1 | 1 | |||
| PM2.5 | +0.92 * | 1 | +0.92 * | 1 | +0.77 * | 1 | |
Disclaimer/Publisher’s Note: The statements, opinions and data contained in all publications are solely those of the individual author(s) and contributor(s) and not of MDPI and/or the editor(s). MDPI and/or the editor(s) disclaim responsibility for any injury to people or property resulting from any ideas, methods, instructions or products referred to in the content. |
© 2023 by the authors. Licensee MDPI, Basel, Switzerland. This article is an open access article distributed under the terms and conditions of the Creative Commons Attribution (CC BY) license (https://creativecommons.org/licenses/by/4.0/).
Share and Cite
Ivanovski, M.; Alatič, K.; Urbancl, D.; Simonič, M.; Goričanec, D.; Vončina, R. Assessment of Air Pollution in Different Areas (Urban, Suburban, and Rural) in Slovenia from 2017 to 2021. Atmosphere 2023, 14, 578. https://doi.org/10.3390/atmos14030578
Ivanovski M, Alatič K, Urbancl D, Simonič M, Goričanec D, Vončina R. Assessment of Air Pollution in Different Areas (Urban, Suburban, and Rural) in Slovenia from 2017 to 2021. Atmosphere. 2023; 14(3):578. https://doi.org/10.3390/atmos14030578
Chicago/Turabian StyleIvanovski, Maja, Kris Alatič, Danijela Urbancl, Marjana Simonič, Darko Goričanec, and Rudi Vončina. 2023. "Assessment of Air Pollution in Different Areas (Urban, Suburban, and Rural) in Slovenia from 2017 to 2021" Atmosphere 14, no. 3: 578. https://doi.org/10.3390/atmos14030578