
Climate Change, Land Use, and Vegetation Evolution in the Upper Huai River Basin
 ,
,  ,
,
Abstract
:1. Introduction
2. Study Area
3. Data Source
3.1. Meteorological Data
3.2. Data on Land Cover
3.3. Vegetation Data
4. Methods
4.1. Climate Variable Analysis
4.1.1. Innovative Trend Analysis Method (ITAM)
4.1.2. Mann–Kendall (M–K) Test Method
4.1.3. Sen’s Slope Estimator Test
4.2. Analysis of Land Use and Land Cover
4.3. Vegetation Analysis
5. Results and Discussions
5.1. Trends of Observed Climate Changes
5.2. Change Detection and Classification of Land Cover
5.3. NDVI
5.4. Implication of Climate Change over Land Cover/Use of Huai River Basin
6. Conclusions
Author Contributions
Funding
Institutional Review Board Statement
Informed Consent Statement
Data Availability Statement
Acknowledgments
Conflicts of Interest
References
- Dastour, H.; Ghaderpour, E.; Zaghloul, M.S.; Farjad, B.; Gupta, A.; Eum, H.; Achari, G.; Hassan, Q.K. Wavelet-based spatiotemporal analyses of climate and vegetation for the Athabasca river basin in Canada. Int. J. Appl. Earth Obs. Geoinf. 2022, 114, 103044. [Google Scholar] [CrossRef]
- Afzal, A.; Bhutto, J.K.; Alrobaian, A.; Kaladgi, A.R.; Khan, S.A. Modelling and Computational Experiment to Obtain Optimized Neural Network for Battery Thermal Management Data. Energies 2022, 14, 7370. [Google Scholar] [CrossRef]
- Gedefaw, M. Assessment of changes in climate extremes of temperature over Ethiopia. Cogent Eng. 2023, 10, 2178117. [Google Scholar] [CrossRef]
- Zhang, M.; Kafy, A.-A.; Ren, B.; Zhang, Y.; Tan, S.; Li, J. Application of the Optimal Parameter Geographic Detector Model in the Identification of Influencing Factors of Ecological Quality in Guangzhou, China. Land 2022, 11, 1303. [Google Scholar] [CrossRef]
- Feng, J.; Yan, D.; Li, C.; Bao, S.; Gao, Y. Assessing the impact of climate variability on potential evapotranspiration during the past 50 years in North China. J. Food Agric. Environ. 2013, 11, 1025–1031. [Google Scholar]
- Conway, D. A water balance model of the Upper Blue Nile in Ethiopia. Hydrol. Sci. J. 2009, 42, 265–286. [Google Scholar] [CrossRef] [Green Version]
- Zhang, M.; Al Kafy, A.; Xiao, P.; Han, S.; Zou, S.; Saha, M.; Zhang, C.; Tan, S. Impact of urban expansion on land surface temperature and carbon emissions using machine learning algorithms in Wuhan, China. Urban Clim. 2023, 47, 101347. [Google Scholar] [CrossRef]
- Guidigan, M.L.G.; Sanou, C.L.; Ragatoa, D.S.; Fafa, C.O.; Mishra, V.N. Assessing Land Use/Land Cover Dynamic and Its Impact in Benin Republic Using Land Change Model and CCI-LC Products. Earth Syst. Environ. 2019, 3, 127–137. [Google Scholar] [CrossRef]
- Yates, B.D.N.; Strzepek, K.M. Modeling the Nile basin under climatic change. J. Hydrol. Eng. 1998, 3, 98–108. [Google Scholar] [CrossRef]
- Liang, L.; Zhao, L.A.; Gong, Y.F. Probability distribution of summer daily precipitation in the Huaihe Basin of China based on the gamma distribution. Acta Meteorol. Sin. 2012, 26, 72. [Google Scholar] [CrossRef]
- Wurbs, R.A.; Muttiah, R.S.; Felden, F. Incorporation of Climate Change in Water Availability Modeling. J. Hydrol. Eng. 2006, 10, 375–385. [Google Scholar] [CrossRef]
- Duveiller, G.; Hooker, J.; Cescatti, A. The mark of vegetation change on Earth’s surface energy balance. Nat. Commun. 2018, 9, 1–12. [Google Scholar] [CrossRef] [Green Version]
- Novillo, C.J.; Arrogante-Funes, P.; Romero-Calcerrada, R. Recent NDVI Trends in Mainland Spain: Land-Cover and Phytoclimatic-Type Implications. ISPRS Int. J. Geo-Information 2019, 8, 43. [Google Scholar] [CrossRef] [Green Version]
- Abate, T.; Angassa, A. Conversion of savanna rangelands to bush dominated landscape in Borana, Southern Ethiopia. Ecol. Process. 2016, 5, 1–18. [Google Scholar] [CrossRef] [PubMed] [Green Version]
- Bičík, I.; Himiyama, Y.; Feranec, J.; Kupková, L. Land Use/Cover Changes in Selected Regions in the World–IX; IGU Commission on LUCC, Charles University in Prague: Prague, Czech Republic, 2014. [Google Scholar]
- Lawler, J.J.; Lewis, D.J.; Nelson, E.; Plantinga, A.J.; Polasky, S.; Withey, J.C.; Helmers, D.P.; Martinuzzi, S.; Pennington, D.; Radeloff, V.C. Projected land-use change impacts on ecosystem services in the United States. Proc. Natl. Acad. Sci. USA 2014, 111, 7492–7497. [Google Scholar] [CrossRef] [Green Version]
- Pozen, D.E. The mosaic theory, national security, and the freedom of information act. Yale Law J. 2005, 115, 630–681. [Google Scholar]
- Defries, R.S.; Rudel., T.; Uriarte, M.; Hansen, M. Deforestation driven by urban population growth and agricultural trade in the twenty-first century. Nat. Geosci. 2010, 3, 178–181. [Google Scholar] [CrossRef]
- Li, G.; Zhang, F.; Jing, Y.; Liu, Y.; Sun, G. Science of the Total Environment Response of evapotranspiration to changes in land use and land cover and climate in China during 2001–2013. Sci. Total Environ. 2017, 596–597, 256–265. [Google Scholar] [CrossRef]
- Getachew. Uc Santa Cruz. Powered by Calif. Digit. Libr. Univ. Calif. 2013, 1–168. [Google Scholar]
- Haregeweyn, N.; Tsunekawa, A.; Tsubo, M.; Meshesha, D.; Adgo, E.; Poesen, J.; Schütt, B. Analyzing the hydrologic effects of region-wide land and water development interventions: A case study of the Upper Blue Nile basin. Reg. Environ. Chang. 2015, 16, 951–966. [Google Scholar] [CrossRef]
- Kearney, J. Food consumption trends and drivers. Philos. Trans. R. Soc. B Biol. Sci. 2010, 365, 2793–2807. [Google Scholar] [CrossRef] [PubMed] [Green Version]
- Blumstein, M.; Thompson, J.R. Land-use impacts on the quantity and configuration of ecosystem service provisioning in Massachusetts, USA. J. Appl. Ecol. 2015, 52, 1009–1019. [Google Scholar] [CrossRef]
- Getachew, H.E.; Melesse, A.M. The Impact of Land Use Change on the Hydrology of the Angereb Watershed, Ethiopia. Int. J. Water Sci. 2014, 1, 1–7. [Google Scholar] [CrossRef]
- She, D.X.; Xia, J.; Zhang, Y.Y.; Du, H. The trend analysis and statistical distribution of extreme rainfall events in the Huaihe River basin in the past 50 years. Acta Geogr. Sin. 2011, 66, 1200. [Google Scholar]
- Wang, K.Q.; Zeng, Y.; Xie, Z.Q. Chang trend of temperature and precipitation in Huaihe river basin from 1961–2008. J. Meteorol. Sci. 2012, 32, 671. [Google Scholar]
- Yilma, A.D.; Awulachew, S.B. Characterization and Atlas of the Blue Nile Basin and its Sub basins. Int. Water Manag. Inst. 2009. [Google Scholar]
- Tekleab, S.; Mohamed, Y.; Uhlenbrook, S. Hydro-climatic trends in the Abay/Upper Blue Nile basin, Ethiopia. Phys. Chem. Earth 2013, 61–62, 32–42. [Google Scholar] [CrossRef]
- Kim, U.; Kaluarachchi, J.J. Application of parameter estimation and regionalization methodologies to ungauged basins of the Upper Blue Nile River Basin, Ethiopia. J. Hydrol. 2008, 362, 39–56. [Google Scholar] [CrossRef]
- Running, S.W.; Loveland, T.R.; Pierce, L.L.; Nemani, R.; Hunt, E. A remote sensing based vegetation classification logic for global land cover analysis. Remote. Sens. Environ. 1995, 51, 39–48. [Google Scholar] [CrossRef]
- Kim, U.; Kaluarachchi, J.J. Climate Change Impacts on Water Resources in the Upper Blue Nile River Basin, Ethiopia1. JAWRA J. Am. Water Resour. Assoc. 2009, 45, 1361–1378. [Google Scholar] [CrossRef]
- Seleshi, Y.; Zanke, U. Recent changes in rainfall and rainy days in Ethiopia. Int. J. Clim. 2004, 24, 973–983. [Google Scholar] [CrossRef]
- Gedefaw, M.; Wang, H.; Yan, D.; Song, X.; Yan, D.; Dong, G.; Wang, J.; Girma, A.; Ali, B.A.; Batsuren, D.; et al. Trend Analysis of Climatic and Hydrological Variables in the Awash River Basin, Ethiopia. Water 2018, 10, 1554. [Google Scholar] [CrossRef] [Green Version]
- Yan, D.; Ludwig, F.; Huang, H.Q.; Werners, S.E. Many-objective robust decision making for water allocation under climate change. Sci. Total. Environ. 2017, 607–608, 294–303. [Google Scholar] [CrossRef]
- Gedefaw, M.; Yan, D.; Wang, H.; Qin, T.; Girma, A.; Abiyu, A.; Batsuren, D. Innovative Trend Analysis of Annual and Seasonal Rainfall Variability in Amhara Regional State, Ethiopia. Atmosphere 2018, 9, 326. [Google Scholar] [CrossRef] [Green Version]
- Butt, A.; Shabbir, R.; Ahmad, S.S.; Aziz, N. Land use change mapping and analysis using Remote Sensing and GIS: A case study of Simly watershed, Islamabad, Pakistan. Egypt. J. Remote. Sens. Space Sci. 2015, 18, 251–259. [Google Scholar] [CrossRef] [Green Version]
- Schmidt, E.; Kedir, M. Urbanization and Spatial Connectivity in Ethiopia: Urban Growth Analysis Using GIS. ESSP II Work 2009. 3.
- Goward, S.N.; Markham, B.; Dye, D.G.; Dulaney, W.; Yang, J. Normalized difference vegetation index measurements from the advanced very high resolution radiometer. Remote. Sens. Environ. 1991, 35, 257–277. [Google Scholar] [CrossRef]
- Li, X.; Zhang, L.; Yang, G.; Li, H.; He, B.; Chen, Y.; Tang, X. Impacts of human activities and climate change on the water environment of Lake Poyang Basin, China. Geoenviron. Disasters 2015, 2, 1–2. [Google Scholar] [CrossRef] [Green Version]
- Yan, D.H.; Wang, H.; Li, H.H.; Wang, G.; Qin, T.L.; Wang, D.Y.; Wang, L.H. Quantitative analysis on the environmental impact of large-scale water transfer project on water resource area in a changing environment. Hydrol. Earth Syst. Sci. 2012, 16, 2685–2702. [Google Scholar] [CrossRef] [Green Version]
- IPCC. Who is Who in the IPCC? Wmo 2004, 96–97. [Google Scholar]
- Gu, X.; Zhang, Q.; Singh, V.P.; Shi, P. Changes in magnitude and frequency of heavy precipitation across China and its po-tential links to summer temperature. J. Hydrol. 2017, 547, 718–731. [Google Scholar] [CrossRef] [Green Version]
- Wagena, M.B.; Sommerlot, A.; Abiy, A.Z.; Collick, A.S.; Langan, S.; Fuka, D.R.; Easton, Z.M. Climate change in the Blue Nile Basin Ethiopia: Implications for water resources and sediment transport. Clim. Chang. 2016, 139, 229–243. [Google Scholar] [CrossRef]
- Geremew, A.A. Assessing the Impacts of Land Use and Land Cover Change on Hydrology of Watershed: A Case Study on Gilgel–Abbay Watershed, Lake Tana. Ph.D. Thesis, Bahir Dar University, Bahir Dar, Ethiopia, 2013; p. 82. [Google Scholar]
- Gebrehiwot, S.G.; Bewket, W.; Gärdenäs, A.I.; Bishop, K. Forest cover change over four decades in the Blue Nile Basin, Ethiopia: Comparison of three watersheds. Reg. Environ. Chang. 2013, 14, 253–266. [Google Scholar] [CrossRef]
- Liu, H.; Yin, Y. Response of forest distribution to past climate change: An insight. Chin. Sci. Bull. 2013, 58, 4426–4436. [Google Scholar] [CrossRef] [Green Version]
- Rouse, W.; Haas, H.; Deering, W. 20 monitoring vegetation systems in the great plains with arts. 2018. [Google Scholar]
- Li, Z.; Liu, W.Z.; Zhang, X.C.; Zheng, F.L. Impacts of land use change and climate variability on hydrology in an agri-cultural catchment on the Loess Plateau of China. J. Hydrol. 2009, 377, 35–42. [Google Scholar] [CrossRef]
- Liu, F.; Qin, T.; Girma, A.; Wang, H.; Weng, B.; Yu, Z.; Wang, Z. Dynamics of Land-Use and Vegetation Change Using NDVI and Transfer Matrix: A Case Study of the Huaihe River Basin. Pol. J. Environ. Stud. 2018, 28, 213–223. [Google Scholar] [CrossRef]


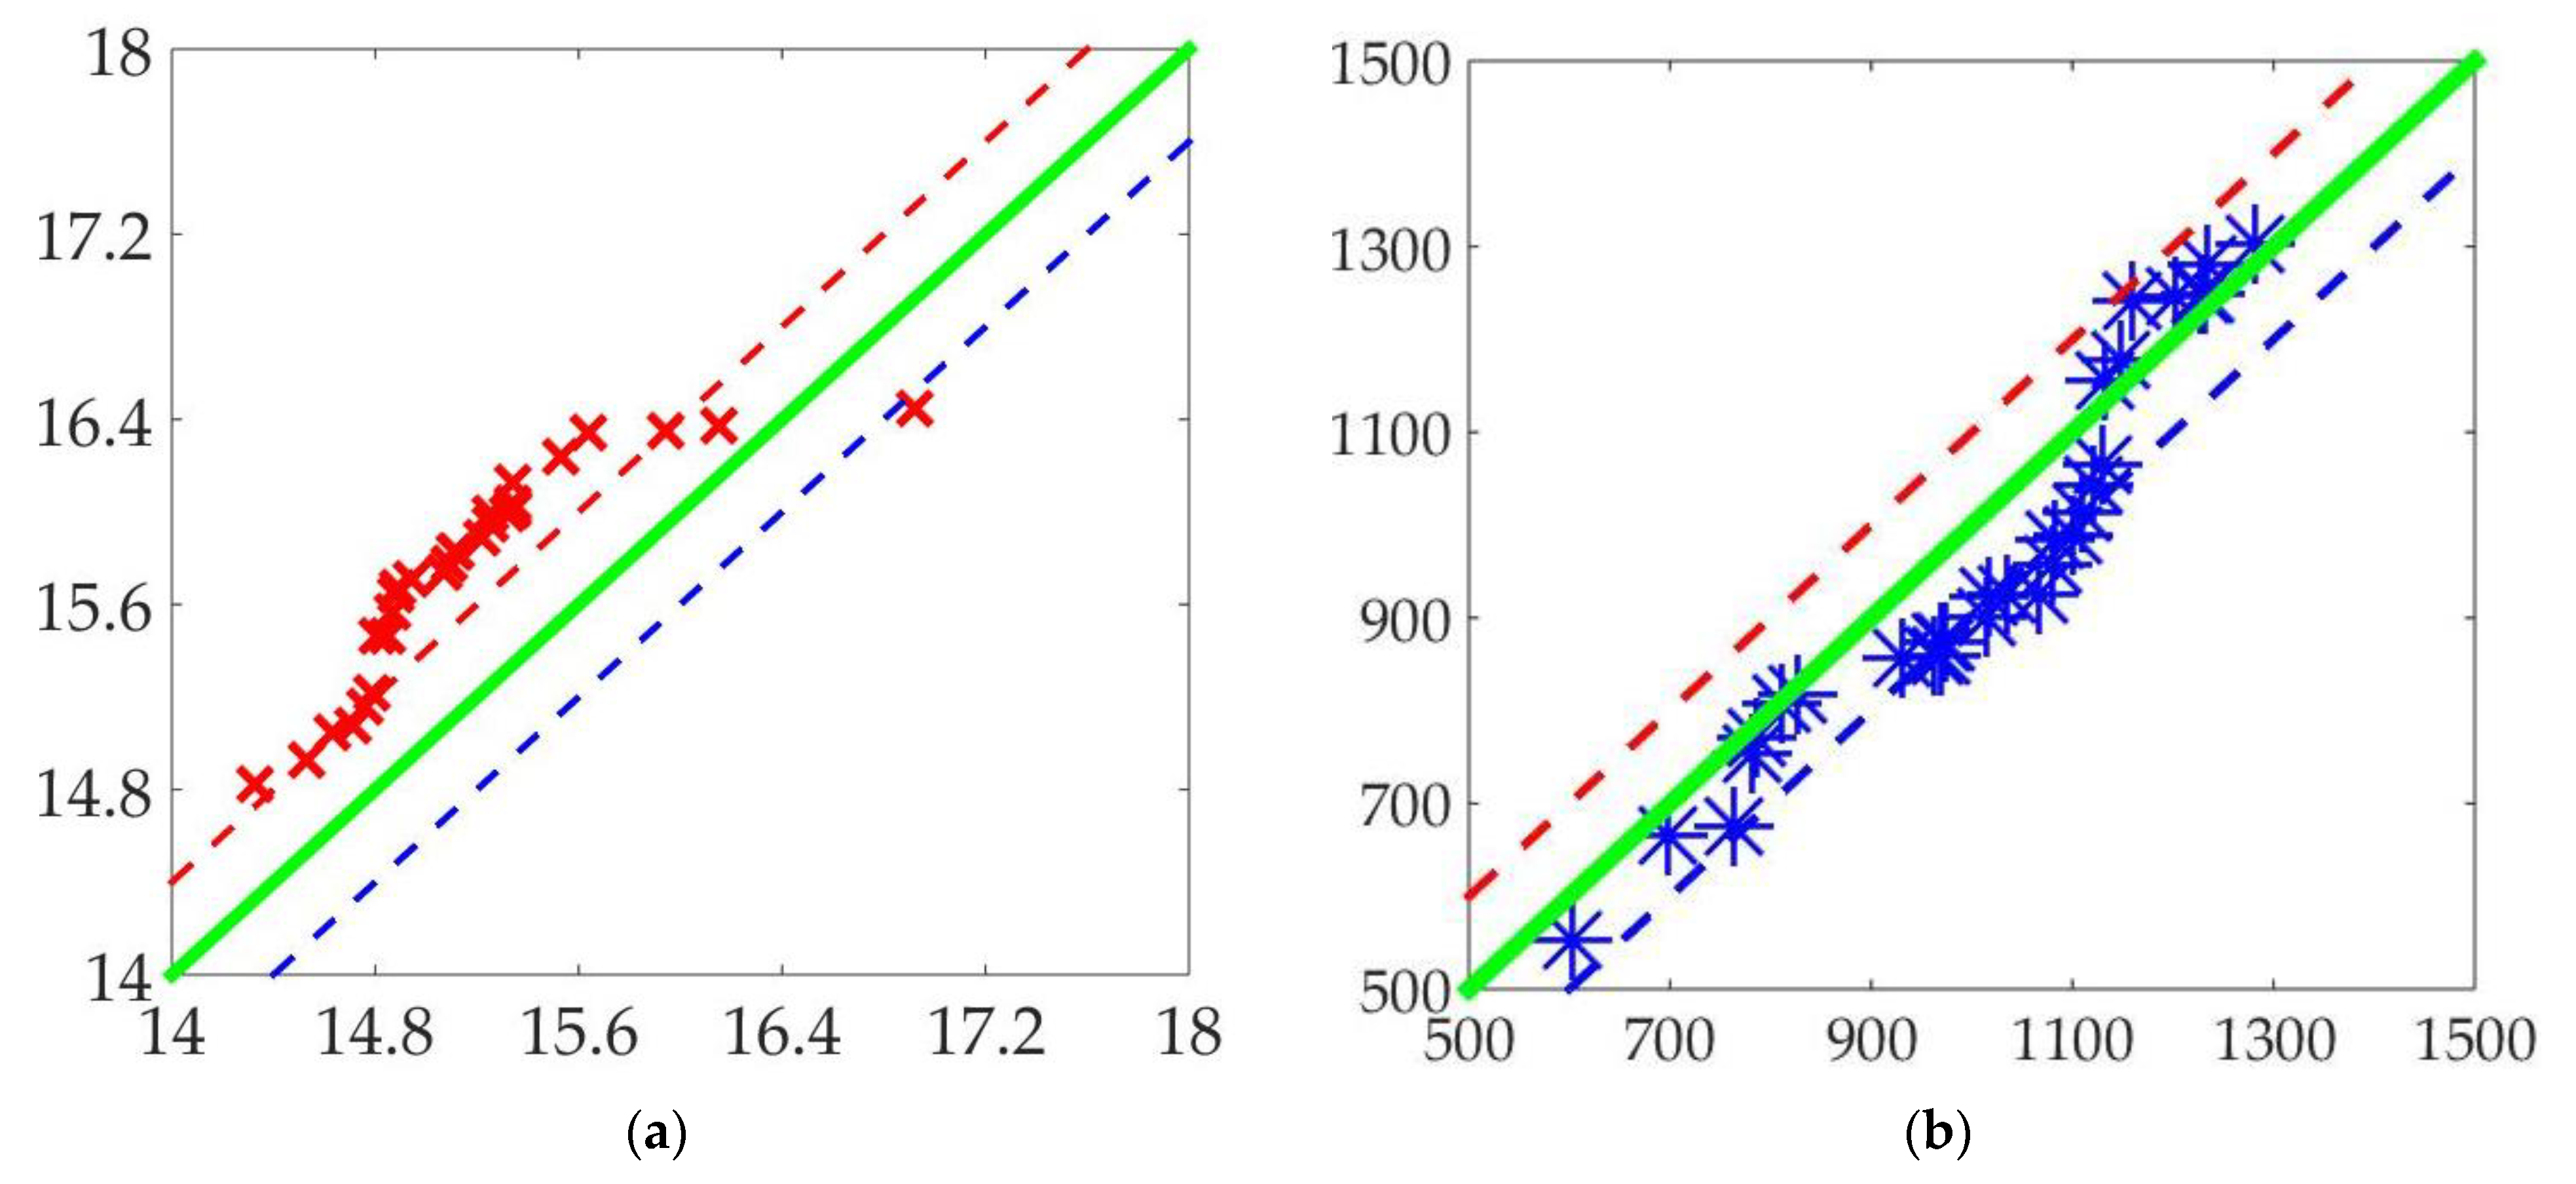
| Stations | Altitude (m) | Latitude (N) | Longitude (E) | Annual Mean Precipitation (mm) | Annual Mean Temperature (°C) |
|---|---|---|---|---|---|
| Xiangcheng | 149.1 | 32.383333 | 113.416667 | 1124.69 | 15.37 |
| Zhumadian | 82.7 | 33.533333 | 114.016667 | 953.42 | 15.12 |
| Gushi | 42.9 | 32.163333 | 115.616667″ | 1064.62 | 15.64 |
| Fuyang | 60.5 | 31.733333 | 116.516667 | 910.07 | 15.34 |
| Xinyang | 68.1 | 31.413333 | 116.316667″ | 839.09 | 15.52 |
| Xichong | 71.5 | 31.563333 | 114.116667 | 1089.32 | 15.77 |
| Rating | Gray Scale Value Division | The Percentage of Vegetation Cover | Land-Use/Landcover Type | Vegetation Coverage Evaluation |
|---|---|---|---|---|
| Level 1 | 191~255 | >60% | Forest land, dense shrub land, and shrub land. | Excellent |
| Level 2 | 156~190 | 30%~60% | Potential degraded land, good farmland, high coverage grassland, and forest land. | Good |
| Level 3 | 139~155 | 15%~30% | Grassland, the middle plain has fixed sand, and beach. | Medium |
| Level 4 | 128~138 | 5%~15% | Forest land, desert grassland, and scattered vegetation. | Subalternation |
| Level 5 | below 128 | below 5% | Artificial water areas, desert, residential areas, etc. | Inferior |
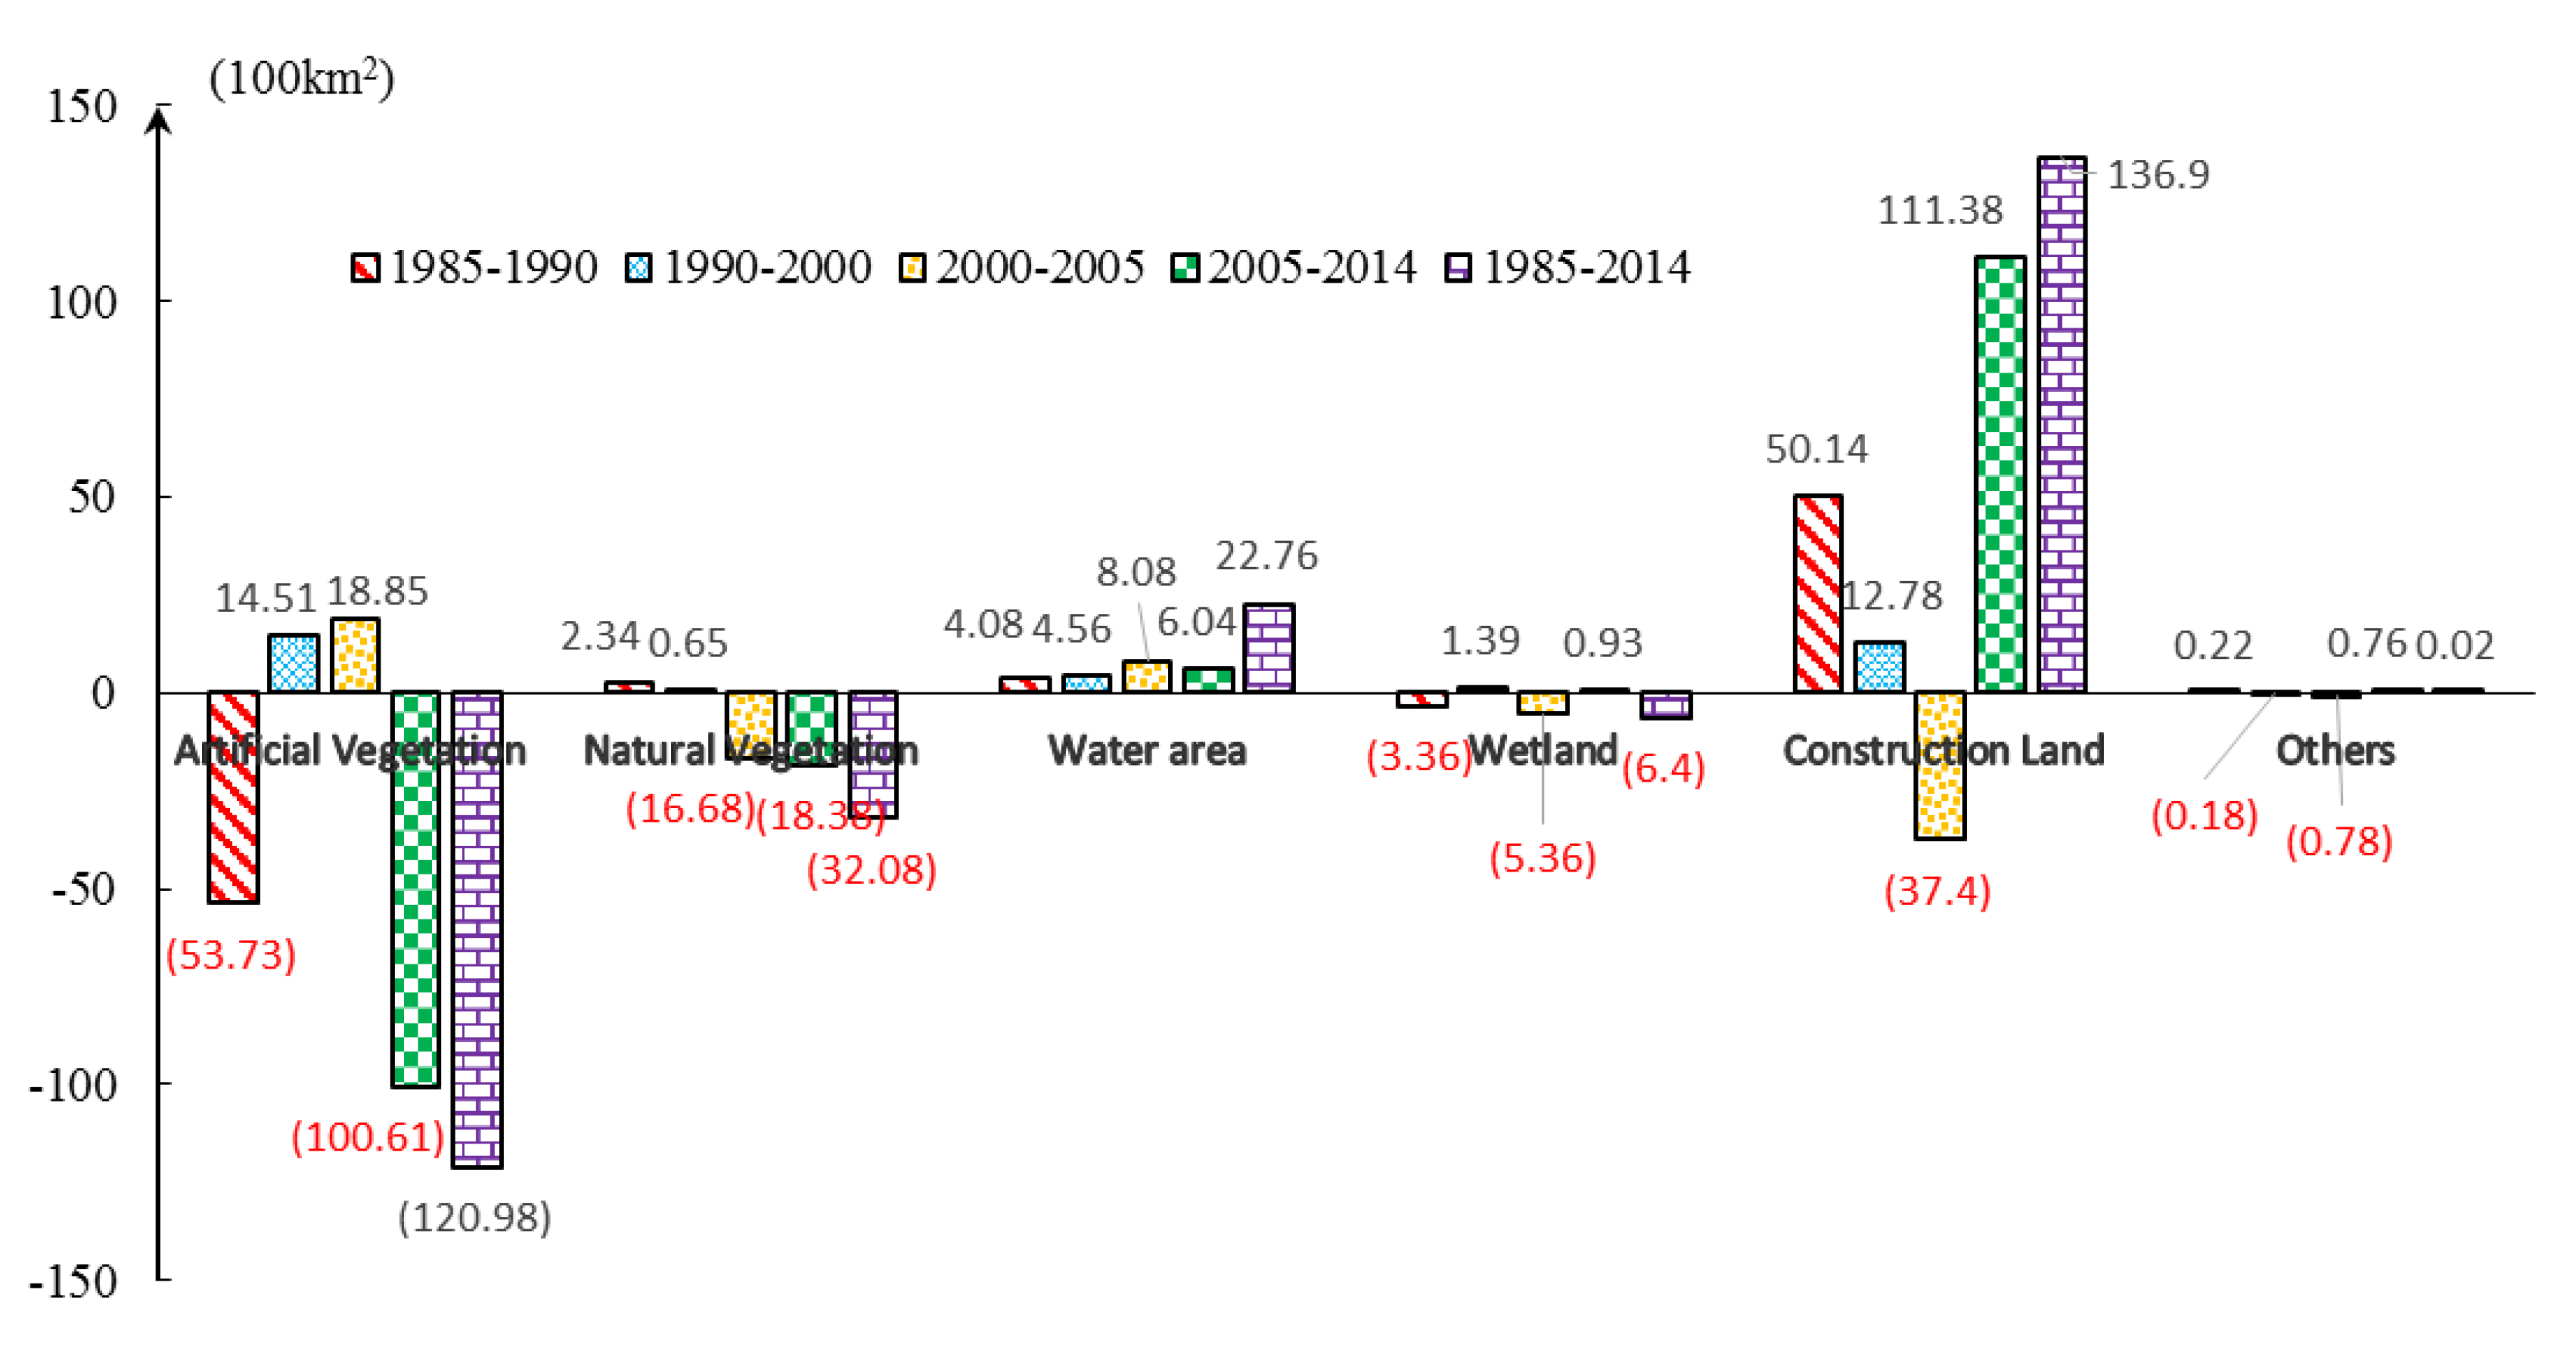
| Land-Use/Cover Type | 1985–1990 | 1990–2000 | 2000–2005 | 2005–2014 | 1985–2014 |
|---|---|---|---|---|---|
| Artificial Vegetation (AV) | −0.56 | 0.16 | 0.21 | −1.04 | −1.32 |
| Natural Vegetation (NV) | 0.16 | 0.05 | −1.09 | −1.28 | −2.38 |
| Artificial water area (AW) | 3.03 | 2.94 | 4.54 | 2.78 | 9.15 |
| Wetland (W) | −0.71 | 0.31 | −1.15 | 0.23 | −1.44 |
| Resident construction land (RCL) | 3.45 | 0.76 | −2.13 | 7.04 | 6.41 |
| Others (O) | 2.18 | −1.57 | −7.47 | 11.55 | 0.21 |
| (LC) Comprehensive land-use dynamic degree | 0.44 | 0.14 | 0.33 | 0.57 | 0.46 |
| Land Use Type | AV | NV | AW | W | RCL | Others |
|---|---|---|---|---|---|---|
| Natural Vegetation | 7.44 | 91.82 | 0.208 | 0.264 | 0.202 | 0.065 |
| Artificial Vegetation | 93.541 | 2.269 | 0.121 | 0.447 | 3.588 | 0.034 |
| Artificial water area | 31.086 | 6.071 | 42.135 | 15.643 | 5.03 | 0.035 |
| Wetland | 8.222 | 1.434 | 2.195 | 87.362 | 0.775 | 0.012 |
| Resident construction land | 45.984 | 1.682 | 0.299 | 0.305 | 51.668 | 0.062 |
| Others | 11.843 | 36.978 | 0.055 | 0.079 | 4.709 | 46.337 |
Disclaimer/Publisher’s Note: The statements, opinions and data contained in all publications are solely those of the individual author(s) and contributor(s) and not of MDPI and/or the editor(s). MDPI and/or the editor(s) disclaim responsibility for any injury to people or property resulting from any ideas, methods, instructions or products referred to in the content. |
© 2023 by the authors. Licensee MDPI, Basel, Switzerland. This article is an open access article distributed under the terms and conditions of the Creative Commons Attribution (CC BY) license (https://creativecommons.org/licenses/by/4.0/).
Share and Cite
Girma, A.; Yan, D.; Wang, K.; Birara, H.; Gedefaw, M.; Batsuren, D.; Abiyu, A.; Qin, T.; Mekonen, T.; Abate, A. Climate Change, Land Use, and Vegetation Evolution in the Upper Huai River Basin. Atmosphere 2023, 14, 512. https://doi.org/10.3390/atmos14030512
Girma A, Yan D, Wang K, Birara H, Gedefaw M, Batsuren D, Abiyu A, Qin T, Mekonen T, Abate A. Climate Change, Land Use, and Vegetation Evolution in the Upper Huai River Basin. Atmosphere. 2023; 14(3):512. https://doi.org/10.3390/atmos14030512
Chicago/Turabian StyleGirma, Abel, Denghua Yan, Kun Wang, Hailu Birara, Mohammed Gedefaw, Dorjsuren Batsuren, Asaminew Abiyu, Tianlin Qin, Temesgen Mekonen, and Amanuel Abate. 2023. "Climate Change, Land Use, and Vegetation Evolution in the Upper Huai River Basin" Atmosphere 14, no. 3: 512. https://doi.org/10.3390/atmos14030512