Article

Trends and Variability in Flood Magnitude: A Case Study of the Floods in the Qilian Mountains, Northwest China

1
Qilian Alpine Ecology and Hydrology Research Station, Key Laboratory of Ecohydrology of Inland River Basin, Northwest Institute of Eco-Environment and Resources, Chinese Academy of Sciences, Lanzhou 730000, China
2
University of Chinese Academy of Sciences, Beijing 100049, China
3
National Cryosphere Desert Data Center, Lanzhou 730000, China
4
Hydrological Station of Gansu Province, Lanzhou 730000, China
*
Author to whom correspondence should be addressed.
Atmosphere 2023, 14(3), 557; https://doi.org/10.3390/atmos14030557
Submission received: 18 February 2023 / Revised: 11 March 2023 / Accepted: 13 March 2023 / Published: 14 March 2023

Abstract

:
Analyzing trends in flood magnitude changes, and their underlying causes, under climate change, is a key challenge for the effective management of water resources in arid and semi-arid regions, particularly for inland rivers originating in the Qilian Mountains (QMs). Sen’s slope estimator and the Mann–Kendall test were used to investigate the spatial and temporal trends in flood magnitude, based on the annual maximum peak discharge (AMPD) and Peaks Over Threshold magnitude (POT3M) flood series, of twelve typical rivers, from 1970 to 2021. The results showed that, in the AMPD series, 42% of the rivers had significantly decreasing trends, while 8% had significantly increasing trends; in the POT3M series, 25% of the rivers had significantly decreasing trends, while 8% had significantly increasing trends. The regional differences in the QMs from east to west were that, rivers in the eastern region (e.g., Gulang, Zamu, and Xiying rivers) showed significantly decreasing trends in the AMPD and POT3M series; most rivers in the central region had non-significant trends, while the Shule river in the western region showed a significantly increasing trend. Temperatures and precipitation showed a fluctuating increasing trend after 1987, which were the main factors contributing to the change in flood magnitude trends of the AMPD and POT3M flood series in the QMs. Regional differences in precipitation, precipitation intensity, and the ratio of glacial meltwater in the eastern, central and western regions, resulted in the differences in flood magnitude trends between the east and west.

1. Introduction

River flooding is one of the most concerning natural disaster issues. According to the United Nations Office for Disaster Risk Reduction, floods have been the most frequent of all recorded natural disasters worldwide, accounting for 43% of all disasters, with global average annual losses estimated at USD 104 billion [1]. It is estimated that the losses are likely to increase in the future, with climate change, economic acceleration, and urbanization development [2,3]. The IPCC [4] has shown that climate change is already an undeniable phenomenon and that the occurrence of extreme flood events is also associated with rising temperatures, heavy precipitation, and an accelerated hydrological cycle at global and regional scales [5,6,7]. Catastrophic floods, primarily associated with climate change, have also attracted public attention, and have been the focus of much research [8,9,10,11]. Many recent flood events around the world have led to growing concern that flood disasters are becoming more frequent and severe [5,12,13,14].
The flood variability induced by extreme climate change, has become a very focal area of research in the past two decades. Many studies worldwide have focused their attention on the issue of fluvial flooding, mainly on the impact of changes in magnitude, frequency, and timing of flood events on a regional, continental, or global scale [5,6,7,12,13,14]. Recent studies have shown that not only has the changing climate shifted the timing of flooding in Europe, but the increased precipitation in autumn and winter has also led to increased flooding in the northwest, while decreased precipitation, warmer temperatures, and increased evapotranspiration have led to decreased flooding in the southeast [6,7]. Significant trends in flood magnitudes were found in the time series based on the annual maximum and Peaks Over Threshold, in Canada [14]. The trend of increasing magnitude and extent of floods is due to the correlation among the magnitude, extent of precipitation, soil moisture, and the shift in flood generation processes [15]. Some studies have shown that more frequent heavy precipitation and increased moisture in the catchment area, in the context of climate change, are expected to result in a greater risk of flooding in the future [11,16,17].
In China, a nationwide characterization of flood hazards, based on a dataset of 1120 hydrographic stations, has been presented [18], and changes in flood characteristics in the Yangtze and Pearl River basins in southern China have also been studied [19,20]. Some studies have also been carried out in arid and semi-arid regions of northwest China, such as the increase in the magnitude of floods in the Tarim River basin after the 1990s, especially in the case of high-latitude rivers [21]. Typical basins in the Tien Shan Mountains, such as the Tuoshikan River and the Kumalak River, have shown a significant increase in flood magnitude in response to climate change over the last 50 years [22,23]. The QMs, which are located in northwest China, are the origin of inland rivers in the Hexi Corridor, and an important region for the economic development of the Belt and Road Initiative. The Hexi Corridor, which is a typical arid and semi-arid area in northwest China, is divided into three sub-basins from east to west, namely the Shiyang River basin (SYRB), the Hei River basin (HRB), and the Shule River basin (SLRB) [24]. Wang et al. [25] have analyzed the trends in the frequency of floods in the QMs using the flood series of twelve rivers from 1970–2019, and the results show that the frequency of floods, mainly small floods in summer, is increasing, and medium and large floods are generally decreasing. There are differences between the eastern and western regions, with decreases in the east and increases in the west. However, temperature and precipitation in the northwest region have been increasing since 1987 [26,27], and the trend in flood magnitude of the 12 major rivers in the QMs is still unknown. The impact of climate change on river flood magnitude remains an important issue, due to the complex changes in precipitation, topography, and the hydrological cycle.
In this study, the impact of meteorological variables on the variability in flood magnitude in the QMs was comprehensively assessed, through flood information and meteorological data. The main objectives of this paper are (1) to assess the characteristics of the variability in AMPD and POT3M magnitude series at temporal scales, for twelve rivers in the QMs; (2) to identify regional differences in AMPD and POT3M magnitude series from east to west; and (3) to explore the causes of flood magnitude variability, including the analysis of meteorological variables in the QMs. Regional differences in precipitation, topography, and the hydrologic cycle have led to complex changes in increasing and decreasing flood magnitudes. Analyzing and exploring the changes in flood magnitude characteristics over the historical period is not only necessary for the scientific management of water resources, but also important for the social development and safety of people’s property, in the middle and lower reaches. This finding will raise new concerns about the changes in flood magnitude in the QMs, northwest China, under climate change.

2. Materials and Methods
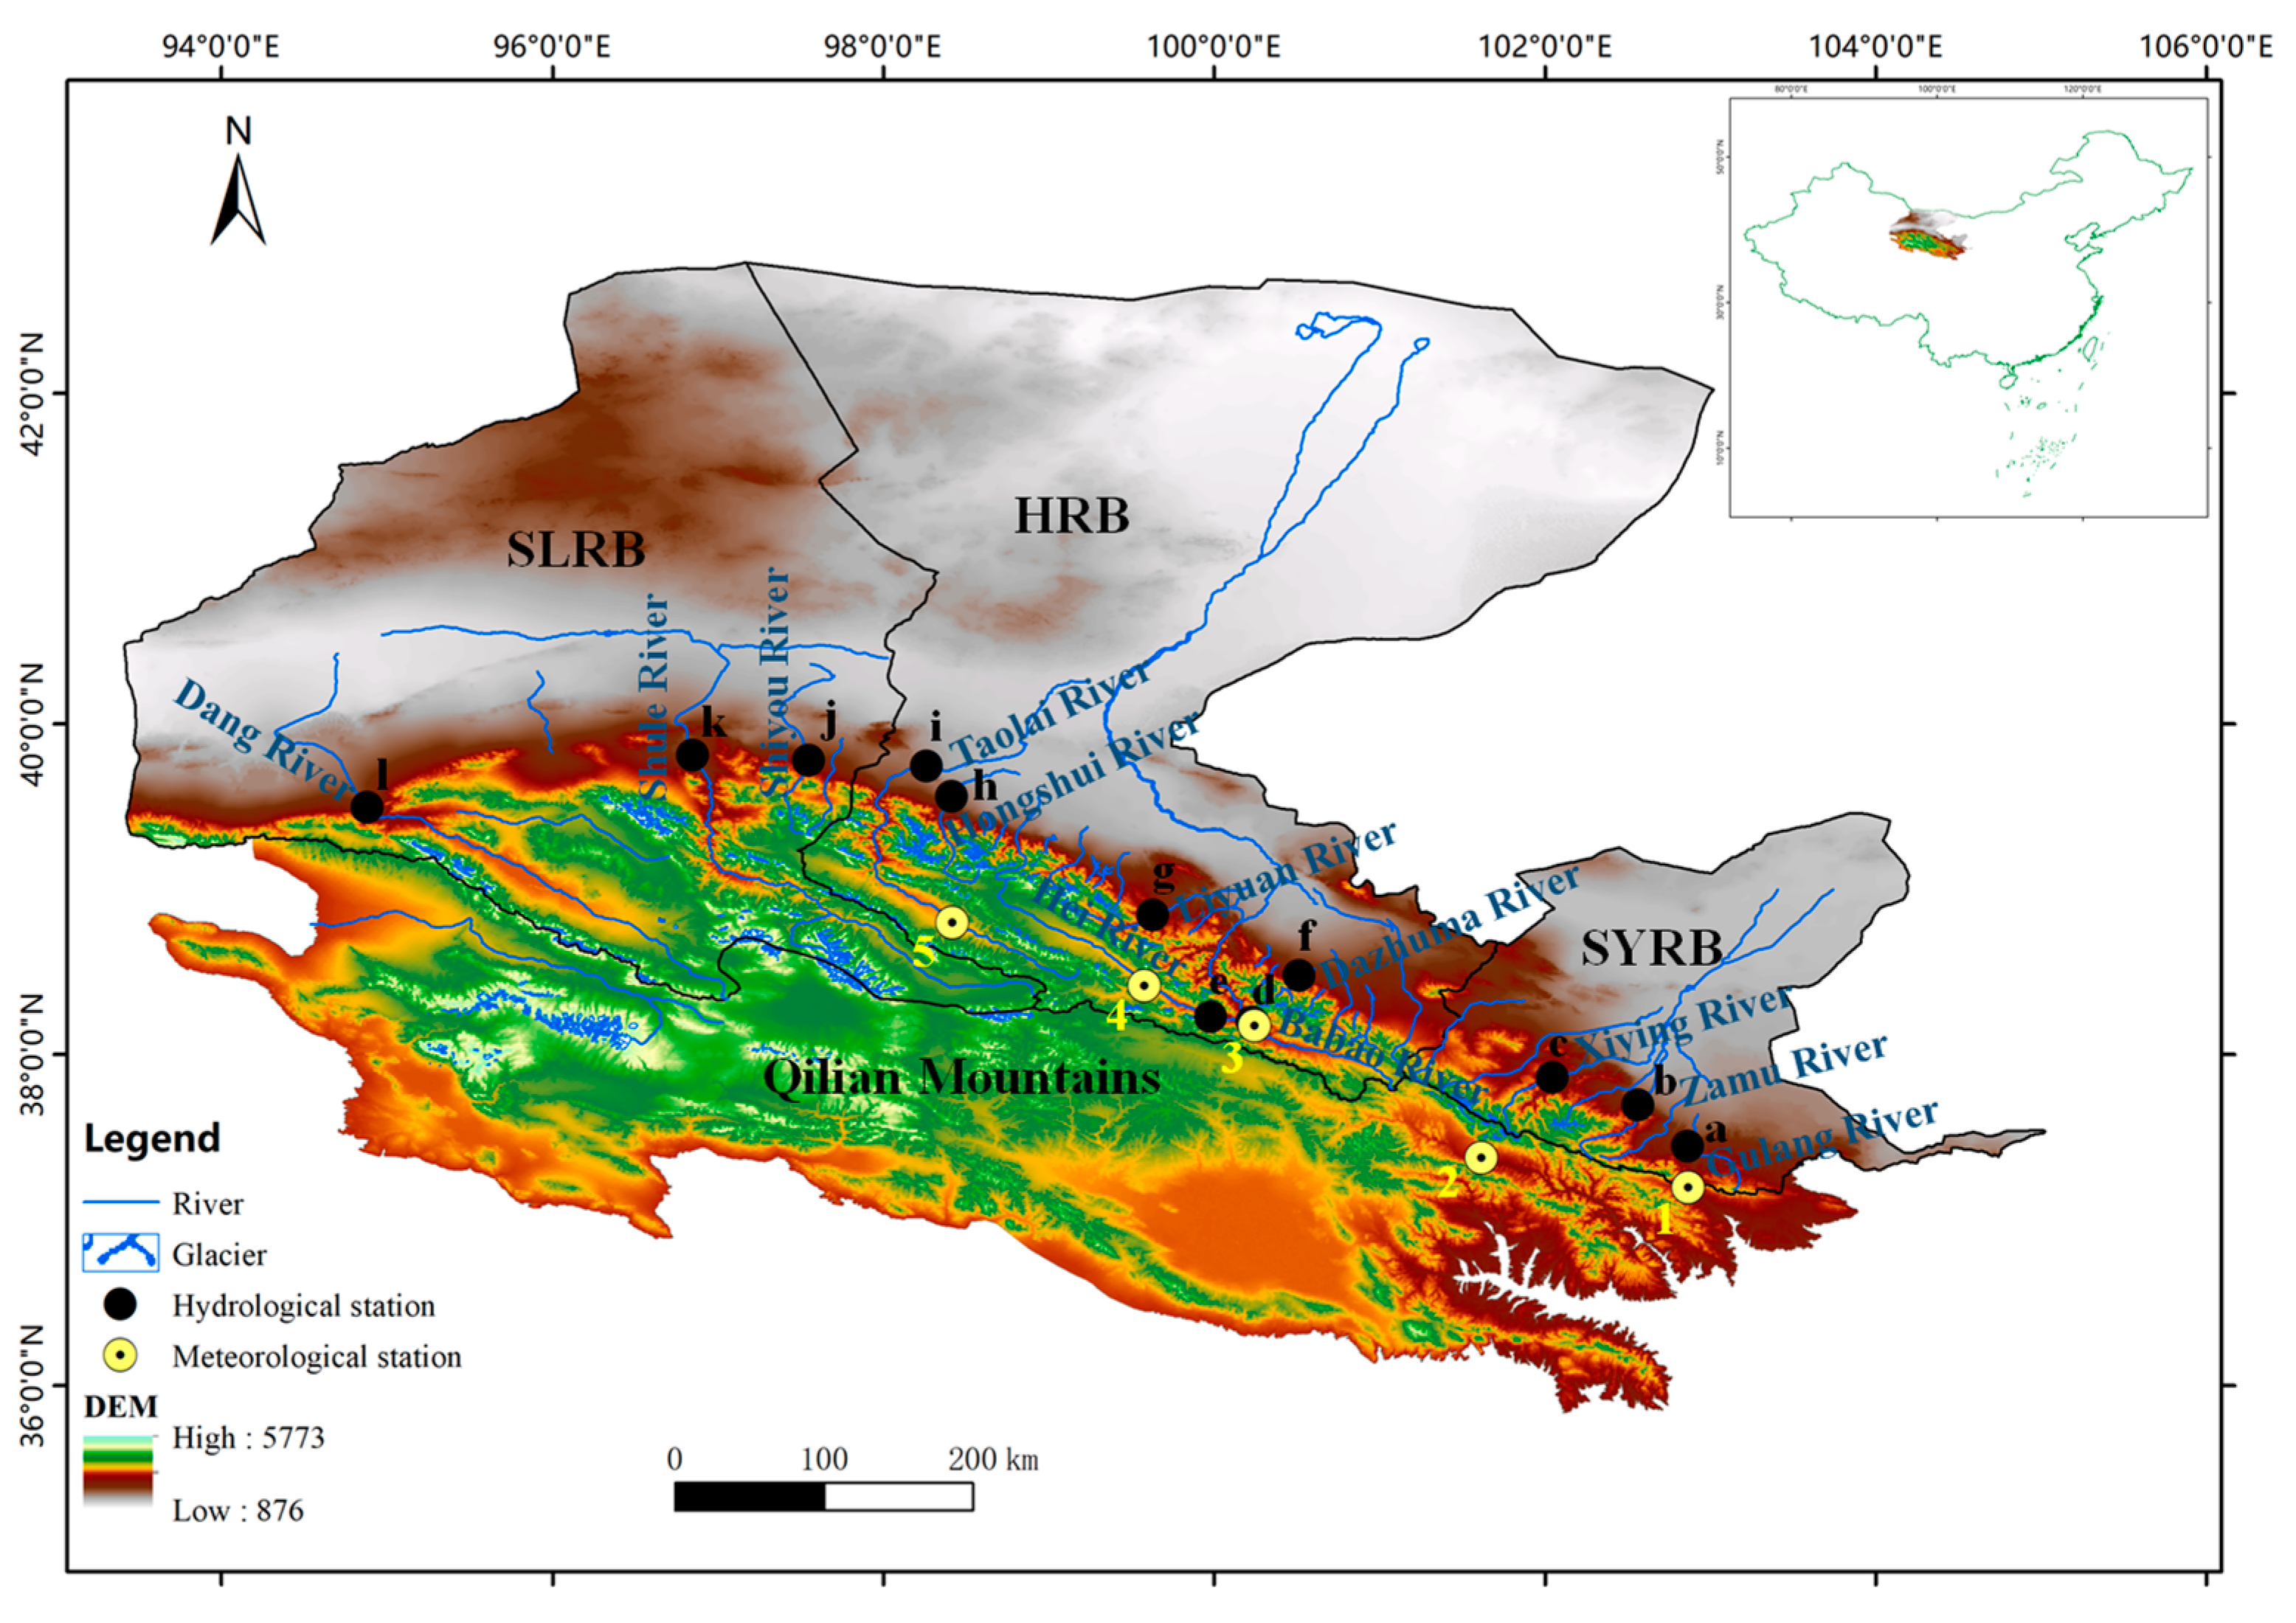
2.1. Study Area

The QMs, whose geographical boundary is approximately 93.4°–103.4° E and 35.8°–40.0° N, are located in northwest China, and consist of several parallel mountains and broad valleys (Figure 1). The elevation ranges from below 3000 m to above 5000 m, with most peaks exceeding 4000 m [28]. There are large vertical differences in climate. Alpine areas are mainly subject to the coupling zone of three atmospheric circulation systems: westerly flow, the East Asian monsoon, and the Tibetan Plateau monsoon, and mean annual precipitation is 301.9 mm [29,30]. The northern part of the Qilian Mountains is the Hexi Corridor, which is geographically located between 92.4°–104.2° E and 37.3°–42.3° N, with a total area of 2.15 × 10⁵ km2. The Hexi Corridor is a typical arid and semi-arid region in northwest China (Figure 1). The region is located in a narrow corridor extending from the east to the west, for more than 1000 km, and from the south to the north for 100–200 km [24]. The Hexi Corridor is the most important passage from northern China to Central Asia, and is an important part of the historical Silk Road. In this study, twelve rivers, which originate from the northern slopes of the QMs and end at the northern oasis of the Hexi Corridor, were selected as the study subject, and divided into three sub-basins from east to west.

2.2. Data

The dataset for this study includes meteorological data and historical flood discharges from 1970 to 2021. The discharge data were selected for analysis from twelve rivers originating from the QMs (Figure 1, Table 1), the upstream areas of which are mostly located in the high-altitude mountainous regions of the QMs, with little disturbance from human activities and no hydraulic projects, such as reservoirs and dykes. Peak flood discharges were collected from the Hydrological Yearbook of the People’s Republic of China. Meteorological data were obtained from the National Meteorological Center of China’s Meteorological Administration. All flood data and meteorological data have been subjected to strict quality control (e.g., extreme value test), reasonableness checks, and a standard normal homogeneity test [31,32,33], and missing meteorological data for individual years have been interpolated with a gap-filling method, after correlation check analysis [34]. The general information on the hydrological stations is shown in Table 1, and the basic information on the meteorological stations is shown in Table 2.
The continuously recorded AMPD and POT3M flood series were derived from hydrological stations originating from twelve rivers (i.e., three rivers in SYRB, six rivers in HRB, and three rivers in SLRB). Daily temperature and precipitation data from five meteorological stations were selected to analyze trends.

2.3. Methods

2.3.1. Determination of Flood Independence in the POT3M Flood Series

In this study, the POT3M sampling method was also used to supplement the AMPD sampling, with information such as flood magnitude, and this method has a good application in inland river basins in arid regions. The independence of the flood peak was determined by Lang et al. [35].
{ D > 5 + l o g ( A ) Q m i n < 3 4 m i n ( Q 1 , Q 2 )              
where D denotes the flood duration between the two flood peaks; A denotes the catchment area in km2; and Q1 and Q2 denote the magnitude of the two flood flows in m3/s, respectively.

2.3.2. Test Methods for Trend and Abrupt Change Analysis

The non-parametric method is well suited to detecting trends and significance levels in hydrometeorological time series. In this study, the Sen’s slope estimator [36] and the Mann–Kendall test (M–K test) [37,38], which are widely used to identify trends in hydrometeorological variables, were employed to explore trends in the flood and climate variables [39,40,41,42].
Sen’s slope estimator is as follows.
β = m e d i a n ( x j x k j k )         j > k
where the β symbol indicates whether a trend is positive or negative, while its value reflects the magnitude of the steepness of the trend, and xj and xk are the data values at times j and k (j > k).
Additionally, The M–K test statistic S, is calculated as:
S = i = 1 n 1 j = i + 1 n s g n ( x ( j ) x ( i ) )
where
s g n ( x ( j ) x ( i ) ) = { 1             i f       x ( j ) x ( i ) > 0 0             i f       x ( j ) x ( i ) = 0 1       i f       x ( j ) x ( i ) < 0
A positive (negative) value of S indicates an increasing (decreasing) trend. When n > 8, the statistic S is approximately normally distributed, and its mean E(S) and variance Var(S) are identified as follows:
E ( S ) = 0
V a r ( S ) = 1 18 [ n ( n 1 ) ( 2 n + 5 ) i = 1 m t i ( t i 1 ) ( 2 t i + 5 ) ]
Z = { S 1 V a r ( S )       i f       S > 0 0                           i f       S = 0 S + 1 V a r ( S )       i f       S < 0  
where n is the number of data points; m is the number of tied groups, and t i denotes the number of ties of extent i. The null hypothesis is rejected if the absolute value of Z is greater than the theoretical value Z 1 α 2 , where α is the statistical significance level. In this study, all trend results were evaluated at 90%, 95%, and 99% significance levels, respectively.
The sequential Mann–Kendall (SQ–MK) [43,44] test constructs the order series of the time series X.
s k = i = 1 k r i         ( k = 2 , 3 , , n )
where n is the length of the time series X.
r i = { + 1       x i x j 0                                       ( j = 1 , 2 , , i )
Assuming that the time series X is random, define the statistic:
U F = [ s k E ( s k ) ] V a r ( s k )           ( k = 1 , 2 , , n )
where U F 1 = 0 , E ( s k ) and V a r ( s k ) are the mean and variance of s k , and x 1 ,   x 2 , ,   x n are independent of each other, when they have the same continuous distribution, which can be deduced from the following equation:
E ( s k ) = n ( n 1 ) 4         ( 2 k n )
V a r ( s k ) = n ( n 1 ) ( 2 n + 5 ) 72         ( 2 k n )
where U F is the standard normal distribution, which is the sequence calculated for the order of the time series X ( x 1 ,   x 2 , ,   x n ).
The inverse order of the time series X ( x n ,   x n 1 , ,   x 1 ) is used to calculate the statistic U B , for the inverse series of the time series X.
In this paper, given a significance level of α = 0.05 (95% significance level), then the critical value U 0.05 = ± 1.96 , and the two statistic series curves of U F and U B , and the two straight lines of ±1.96, are plotted on a single graph. If U F and U B intersect between the critical values, then the intersection point corresponds to the time at which the mutation of time series X begins.

2.3.3. Meteorological Variables

Six temperature and precipitation indices were employed to analyze the meteorological variables and to explore the changes in temperature and precipitation (Table 3).

3. Results

3.1. Flood Independence Analysis

Flood independence analysis is a prerequisite for determining trends in the AMPD and POT3M flood series. In order to make the assumption of independence of the sampled flood peaks reasonable, the flood independence criterion method proposed by Lang et al. [35] was used, while the POT3M sampling method, applied in the arid and semi-arid regions of northwest China, was considered [21,23]. For the AMPD and POT3M flood series of the 12 rivers in the study, all sampled flood peaks comply with the two conditions of the flood independence criterion method, in terms of duration, D, and intermediate minimum flow, Qmin, and thus flood independence was valid.

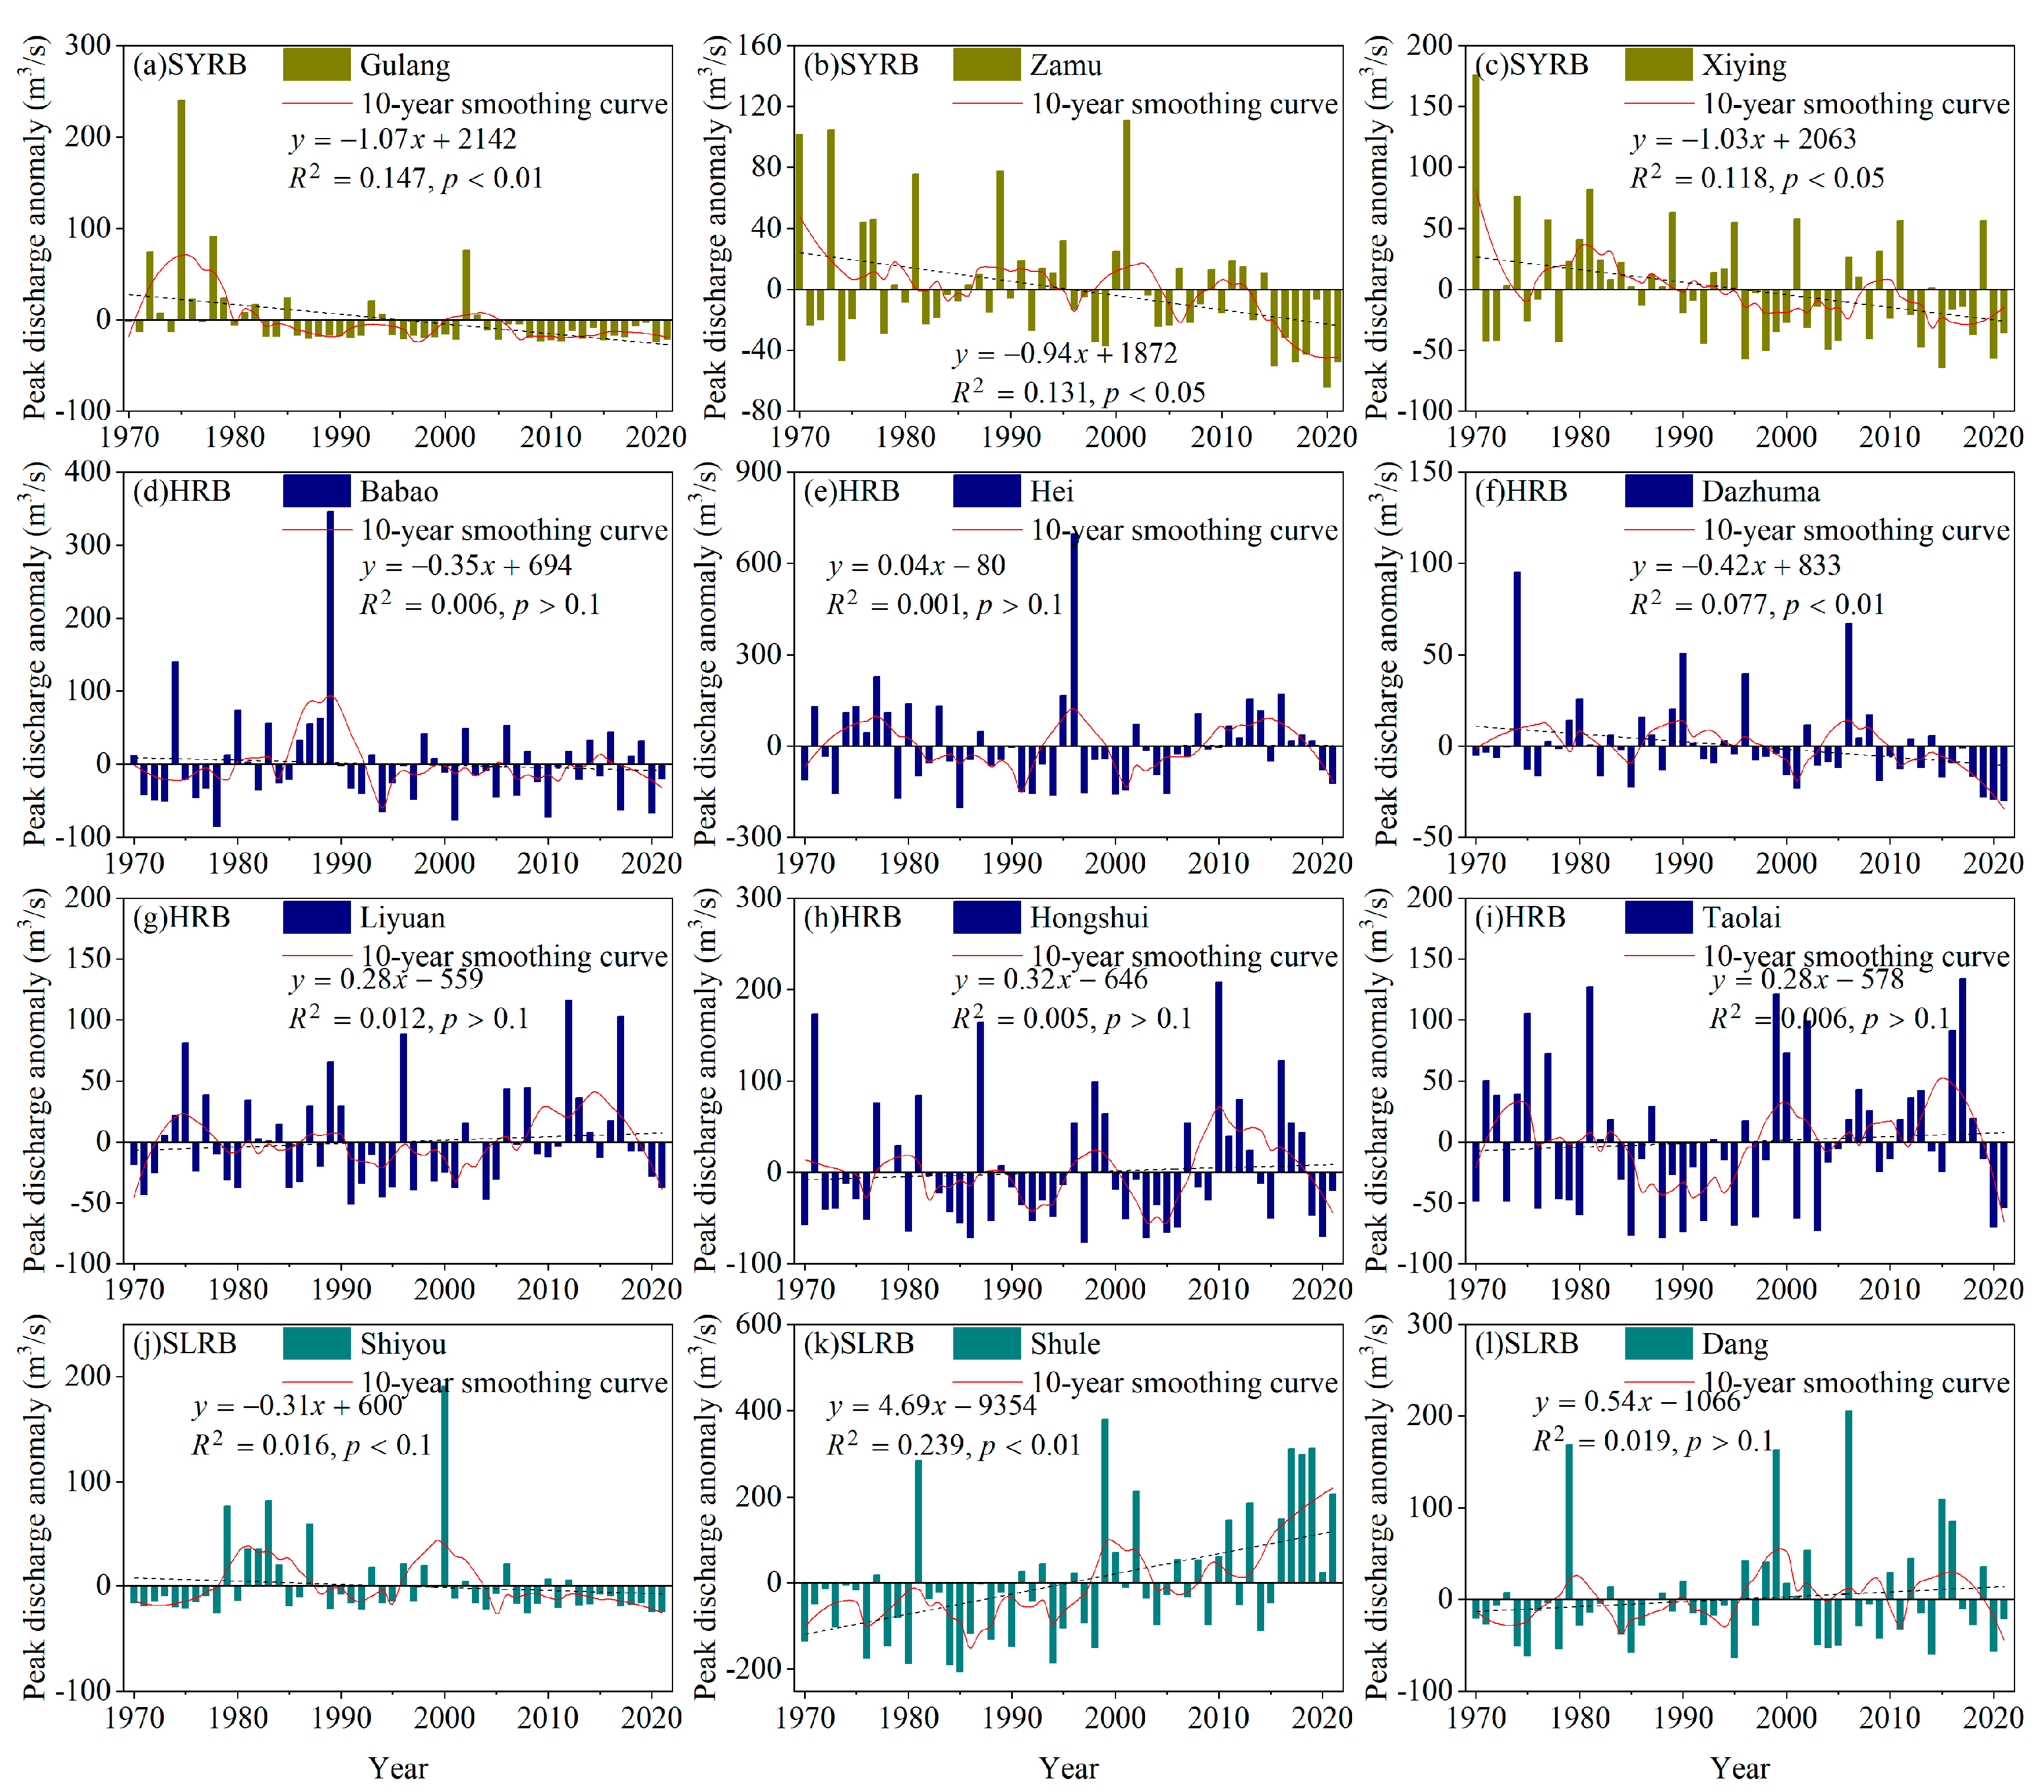
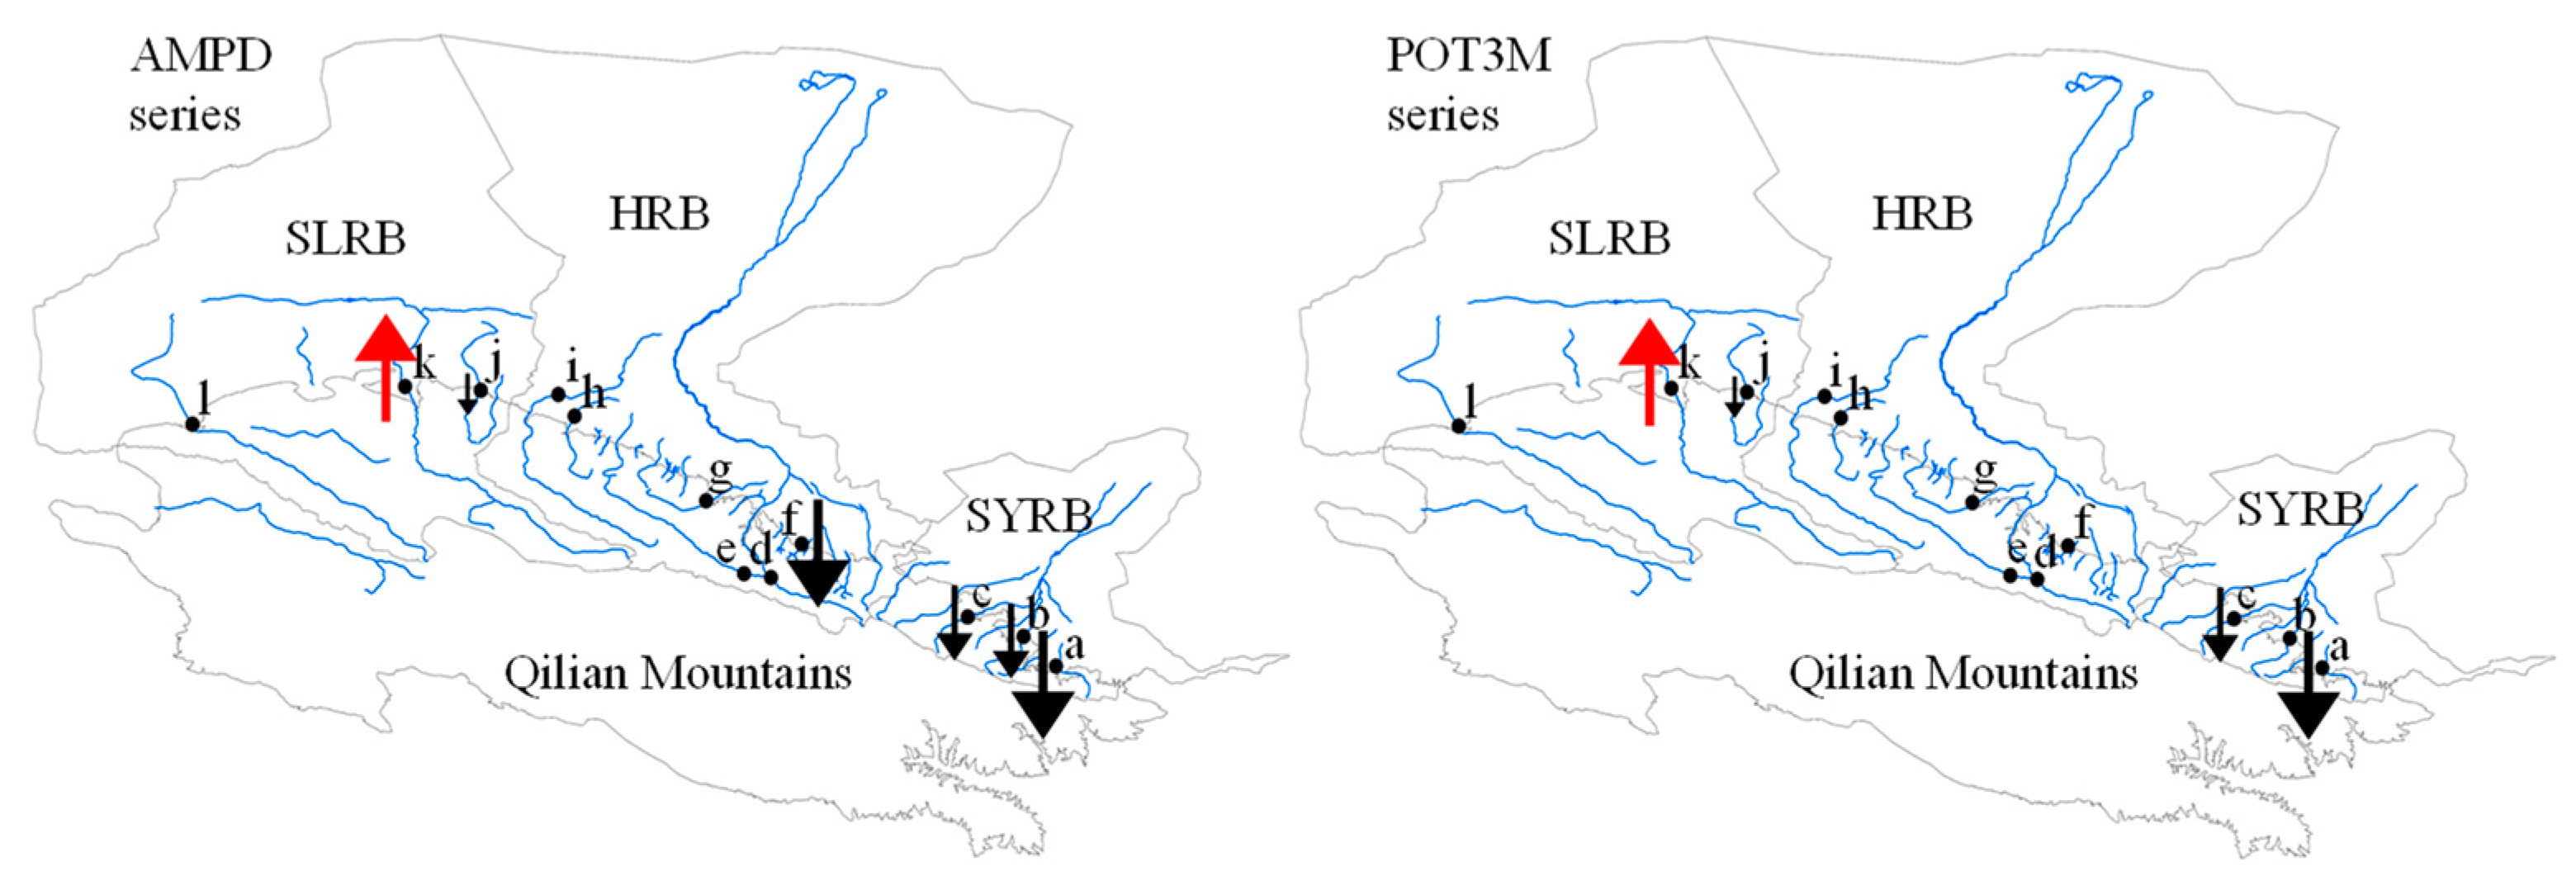
3.2. Trends in AMPD Series

The AMPD series of twelve rivers in the QMs were tested using Sen’s slope estimator and the M–K test, and the results are shown in Figure 2 and Table 4. Five rivers exhibited significantly decreasing trends, while one river showed a significantly increasing trend, and six rivers had non-significant trends. In SYRB (a–c rivers), Gulang, Zamu, and Xiying rivers showed decreasing trends in AMPD at 99%, 95%, and 95% significance levels, respectively. In HRB (d–i rivers), five rivers (Babao, Hei, Liyuan, Hongshui, and Taolai rivers) showed non-significant trends, while Dazhuma River showed a decreasing trend, at the significance level of 99%. However, in SLRB (j–l rivers), Shiyou River showed a decreasing trend at the significance level of 90% and Shule River exhibited an increasing trend at the significance level of 99%, while Dang River had a non-significant trend. The trend line of AMPD for the twelve rivers is shown in Figure 2, where the evolutionary trend in historical floods can be seen. Although the AMPD trends are different among the eastern, central, and western parts of the QMs, most of the rivers presented obvious decreasing trends from 1970 to 2021, especially in the eastern and central regions.

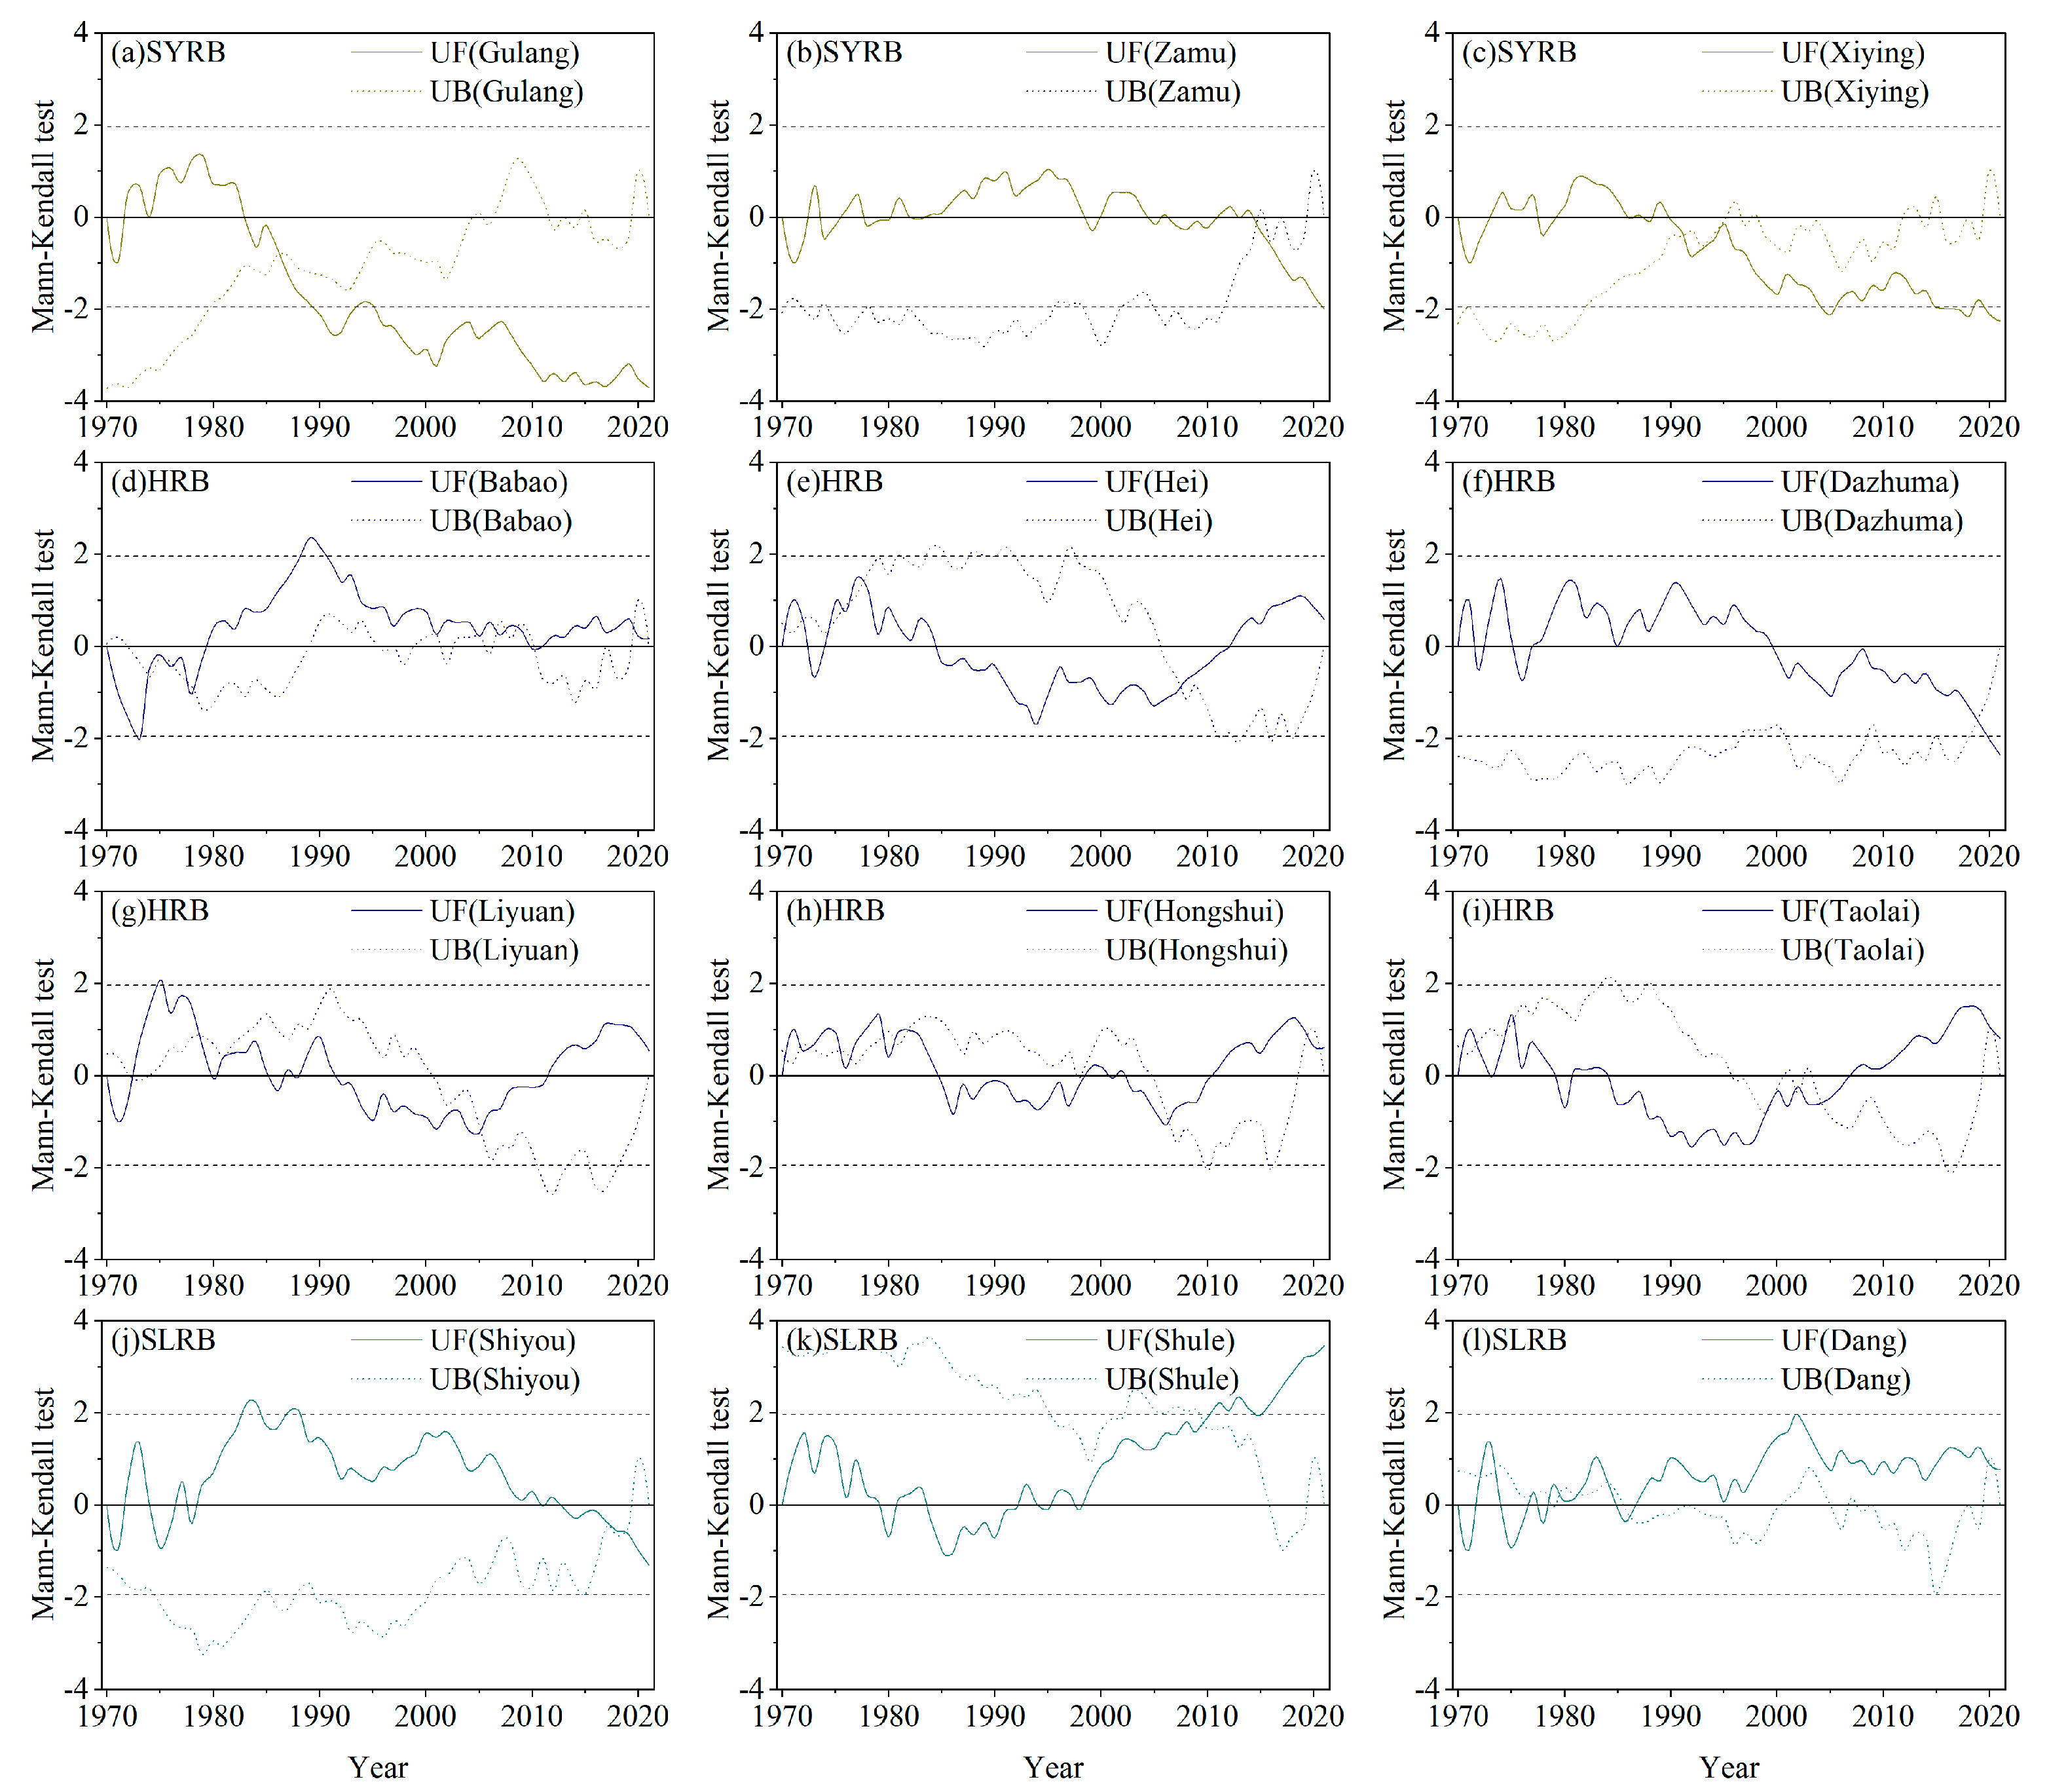
3.3. Abrupt Behavior for Changes in AMPD Series

The twelve rivers, that originate at high-altitude in the QMs, are mainly recharged by precipitation, snow, and glacial meltwater and have specific, typical flood generation mechanisms. Heavy precipitation and the melting of snow and ice water, due to increased temperatures, are the main factors in flood generation. As a result, the magnitude of floods has fluctuated over the 50 years of observation, but the structure is stable. The results of the SQ-MK test for twelve representative rivers are shown in Figure 3. Six of the twelve rivers exceeded the critical value of 1.96, for which α = 0.05 in the significance test. Thus, the AMPD series showed abrupt changes. Among them, in the eastern region of QMs, the SQ-MK test values of the Gulang and Xiying rivers continued to decrease and break the critical values during the period 1970–2021, but the SQ-MK test values of the Zamu River fluctuated steadily. In the central region, the change points of the Babao and Dazhuma rivers occurred in 1989 and 2020, with the significance level of 95%. However, the Hei, Liyuan, Hongshui, and Taolai rivers all showed stable fluctuation from 1970 to 2021, without breaking the critical values. In the western region of the QMs, the SQ-MK test values of the Shiyou, Shule, and Dang rivers behaved differently. Shiyou River showed an increasing trend from 1970 to 1984 and broke the critical value in 1983, followed by a continuous decreasing trend from 1985–2021. Though it had a decreasing trend from 1970 to 1986, Shule River showed a continuously increasing trend after 1987, bypassing the critical value of 1.96, to a value of 3.47. From 1970 to 2021, Dang River did not break through the critical value and presented a slightly increasing trend. In Figure 3, most of the change points can be seen after the mid-1990s, whereas significant trends occurred in SYRB (a and c), HRB (f), and SLRB (k).

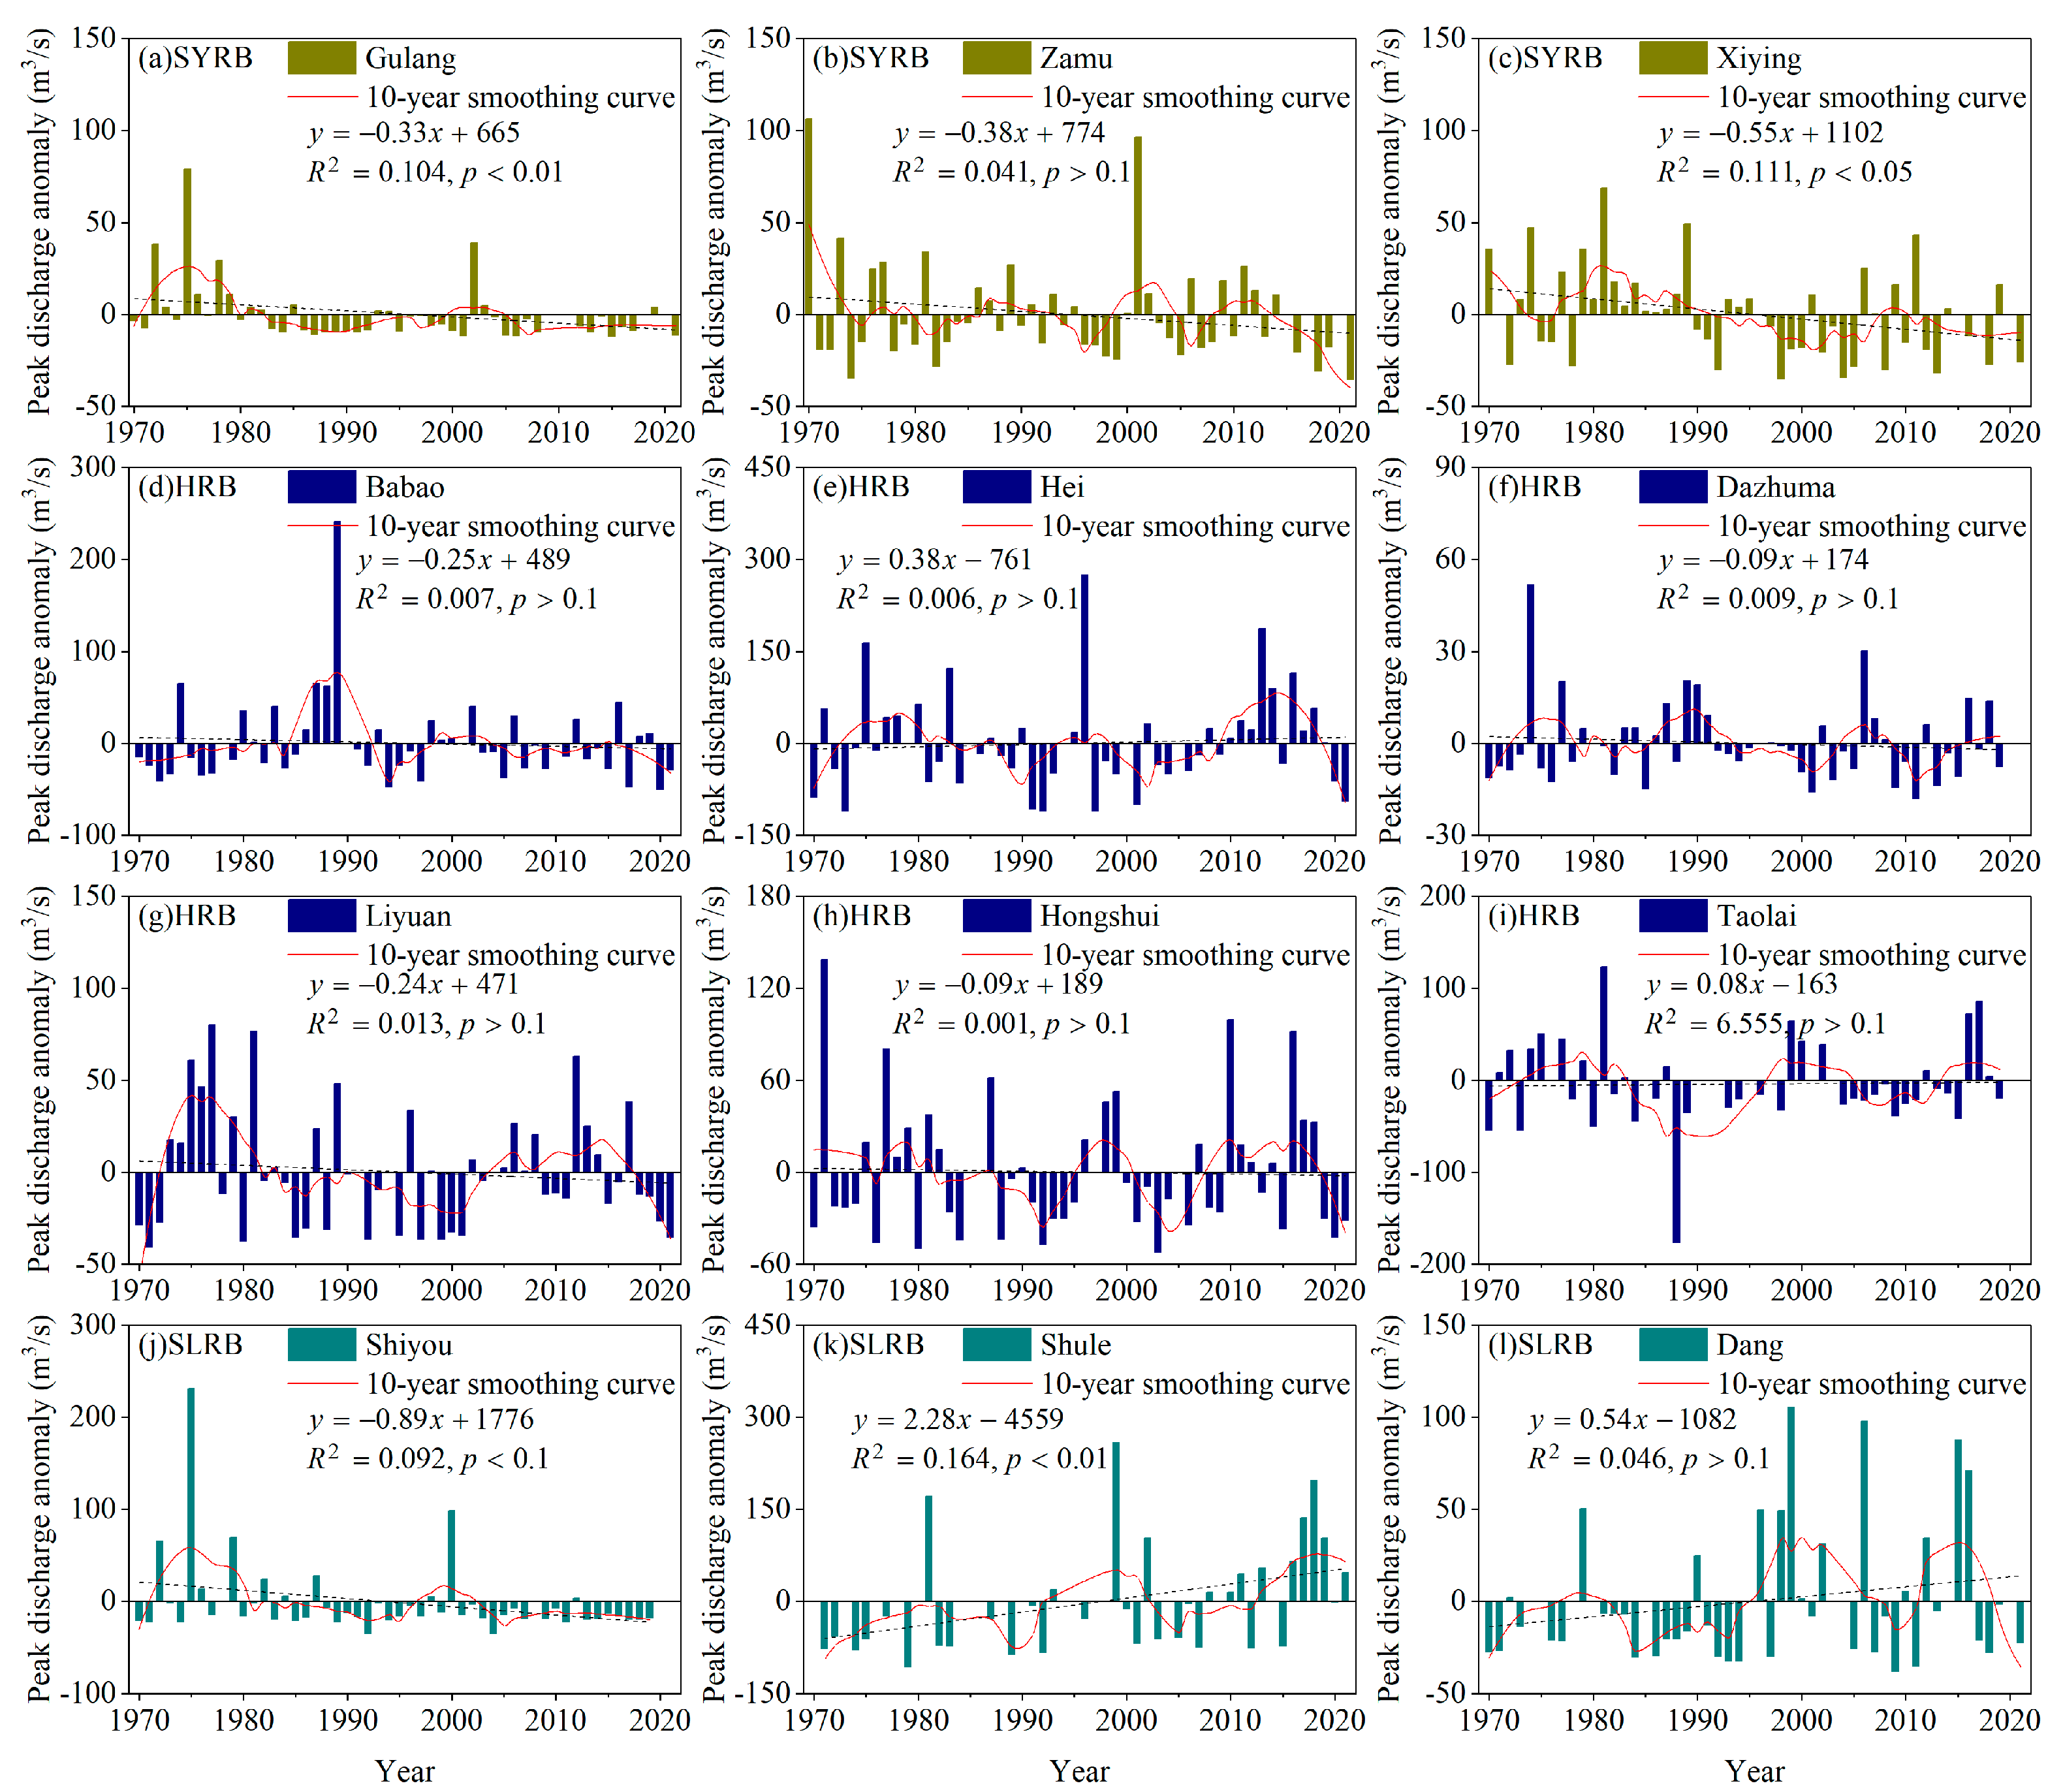
3.4. Trends in POT3M Flood Series

Twelve rivers in the QMs were selected to calculate the trends of the POT3M flood series and the statistical results are presented in Figure 4 and Table 4. Significantly increasing and decreasing trends of the POT3M series were detected at 90%, 95%, and 99% significance levels, respectively. The results demonstrate that Shule River in SLRB displayed a significantly increasing trend, at the significance level of 99%, while the Gulang and Xiying rivers in SYRB, and Shiyou River in SLRB showed decreasing trends, at the significance levels of 99%, 95%, and 90%, respectively. It should be noted again, that non-significant trends were found in the Zamu, Babao, Hei, Dazhuma, Liyuan, Hongshui, Taolai, and Dang rivers. Compared to the AMPD series, more reliable conclusions could be drawn from these series, because samplings of the POT3M series provided more flood information. By comparing the trends of the POT3M series and AMPD series in Table 4 in parallel, the trends of increasing and decreasing are consistent for most of the rivers, with some differences in the Zamu and Dazhuma rivers, which are mainly caused by the different flood information of the sample selection.

3.5. Trends of Flood Magnitude in the Eastern, Central, and Western Regions

According to the regional comparative analysis of the different flood series from the flood observation dataset, the flood magnitude trends for twelve rivers in the QMs are both increasing and decreasing in the eastern, central, and western regions, as shown in Figure 5 and Table 4. In the eastern SYRB (a–c rivers), the results of the AMPD and POT3M series showed an overall decreasing trend from 1970 to 2021, with different significance levels. In the central HRB (d–i rivers), there were minor differences in the trends of the AMPD and POT3M series. In the trend in the AMPD series, five of the six rivers were non-significant trends, except for the Dazhuma River, which exhibited a decreasing trend at the significance level of 99%. However, in the trend in the POT3M series, all six rivers showed non-significant trends. Among the western SLRB (j–l rivers), Shiyou River displayed a decreasing trend, at the significance level of 90%, in both the AMPD and POT3M series, Shule River showed an increasing trend at the significance level of 99% in both the AMPD and POT3M series, whereas Dang River had a non-significant trend during the period of 1970–2021.

4. Discussion

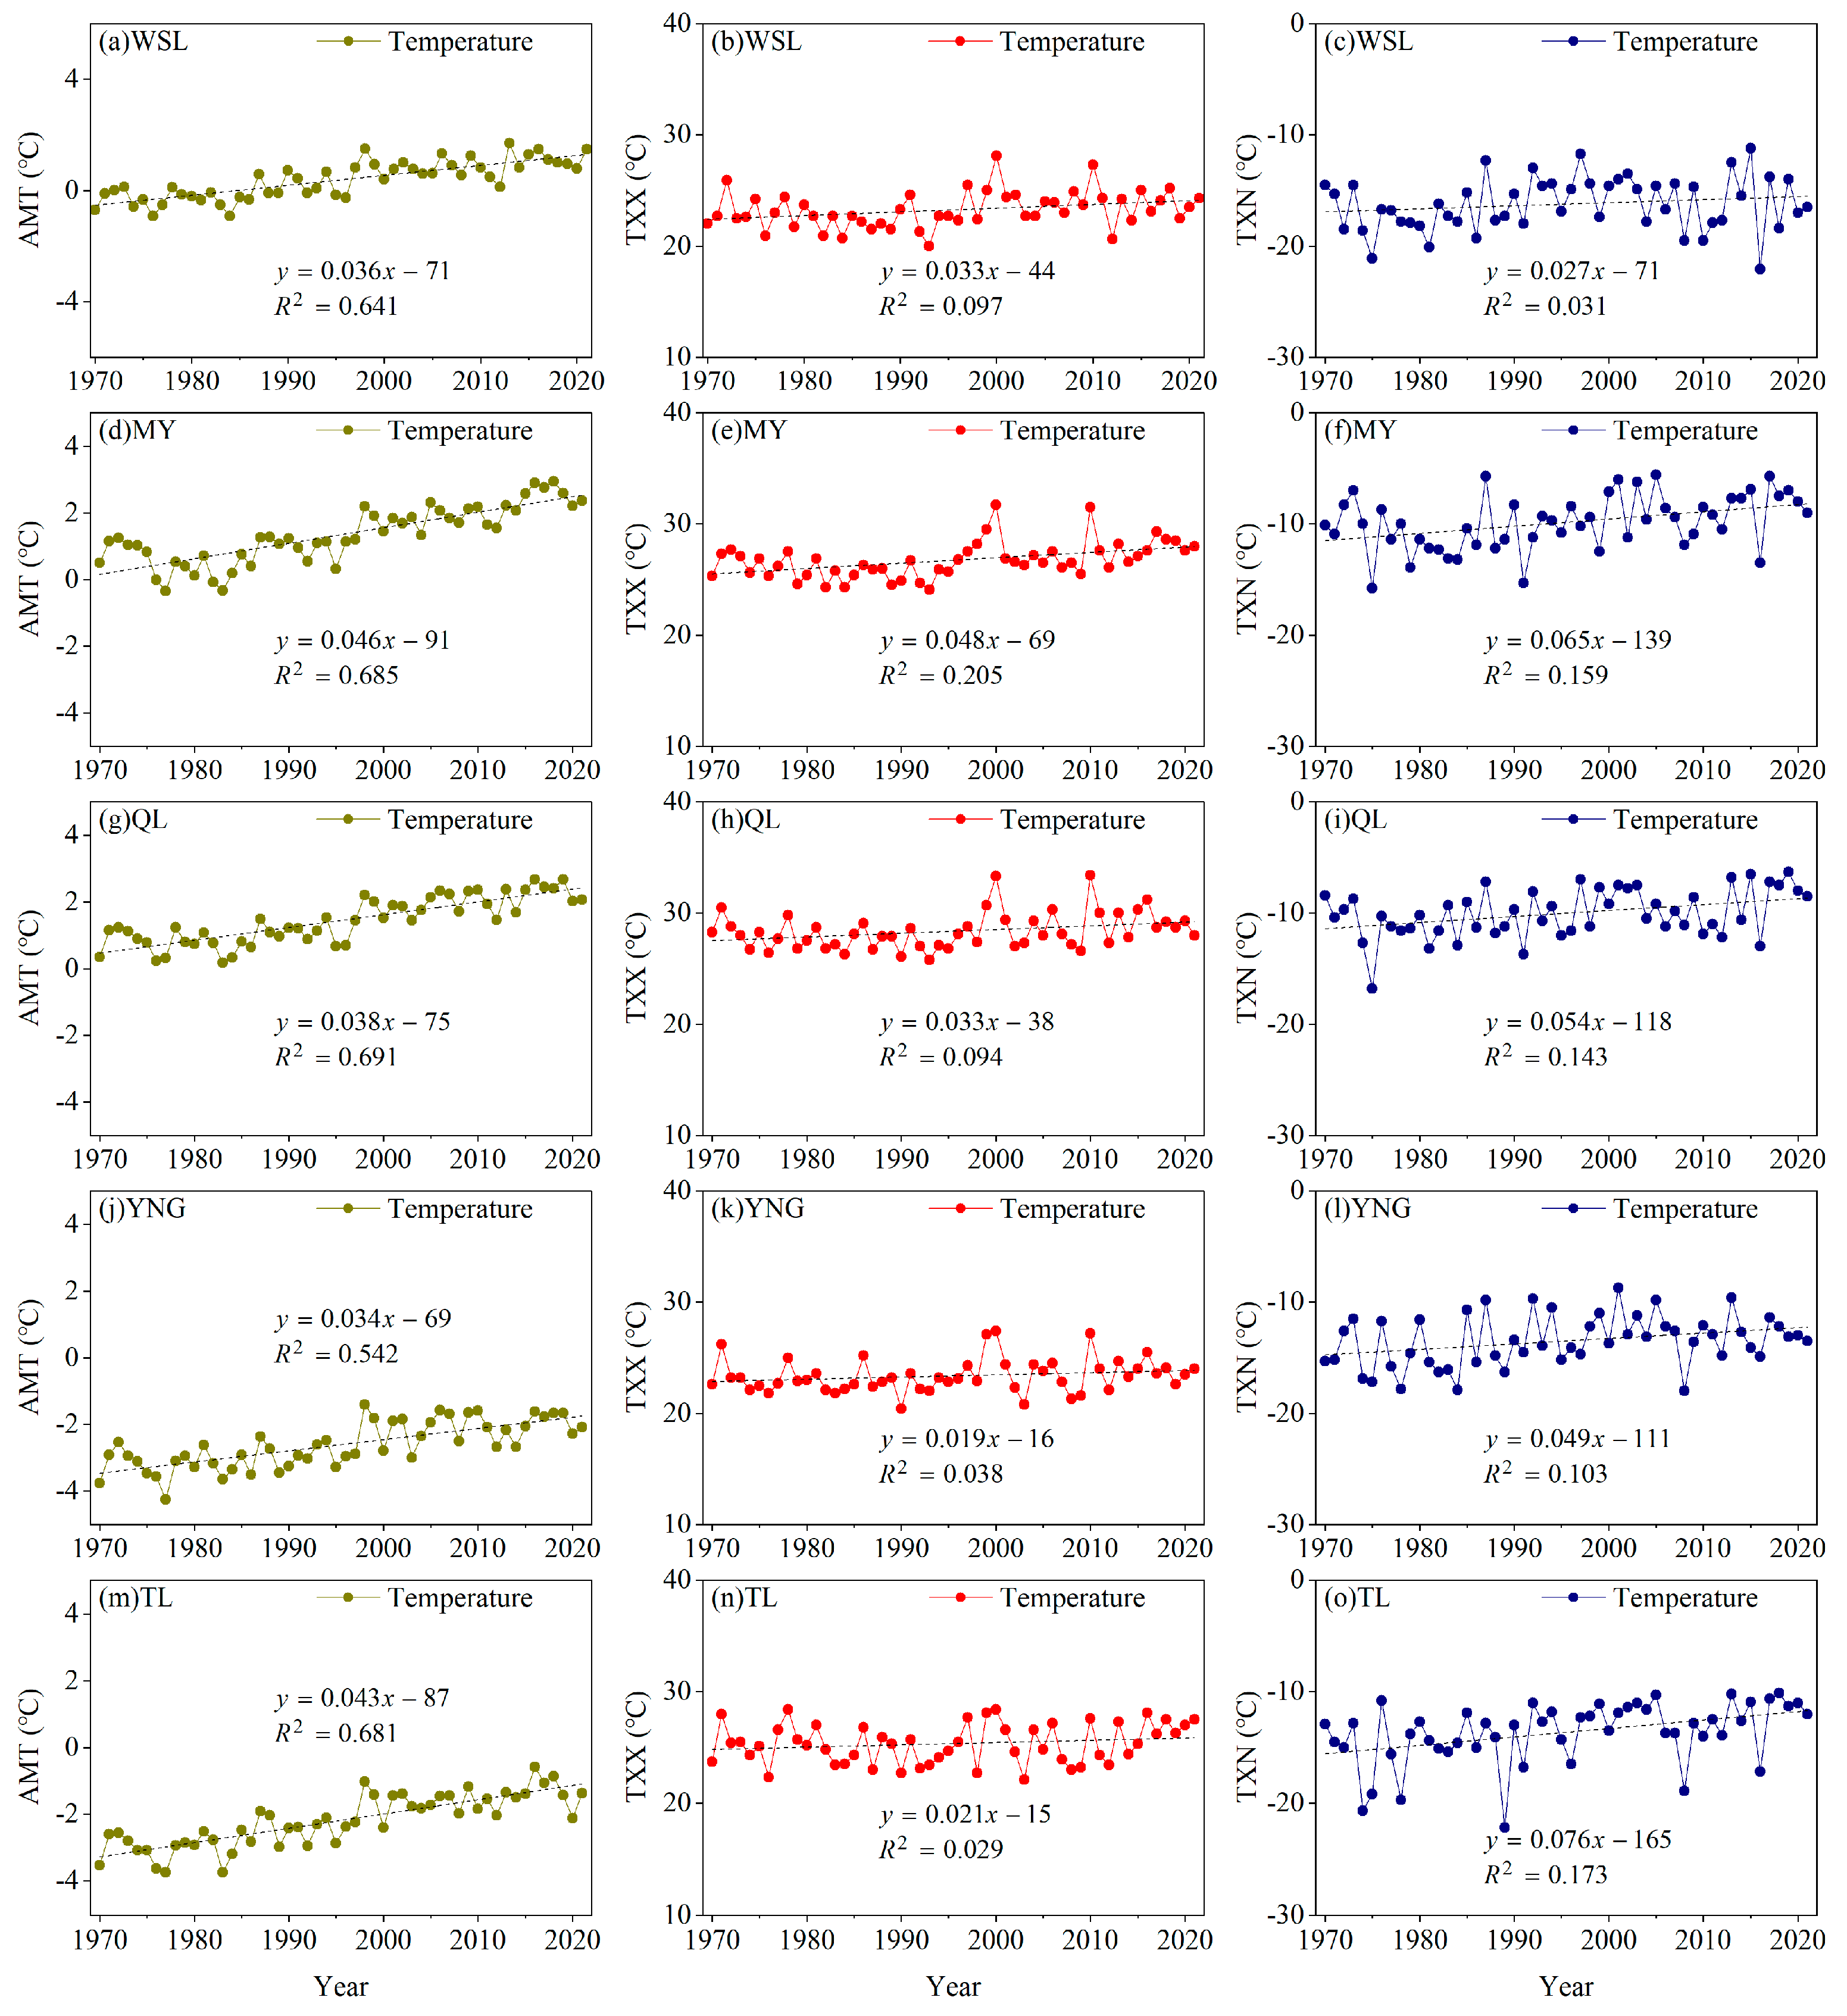
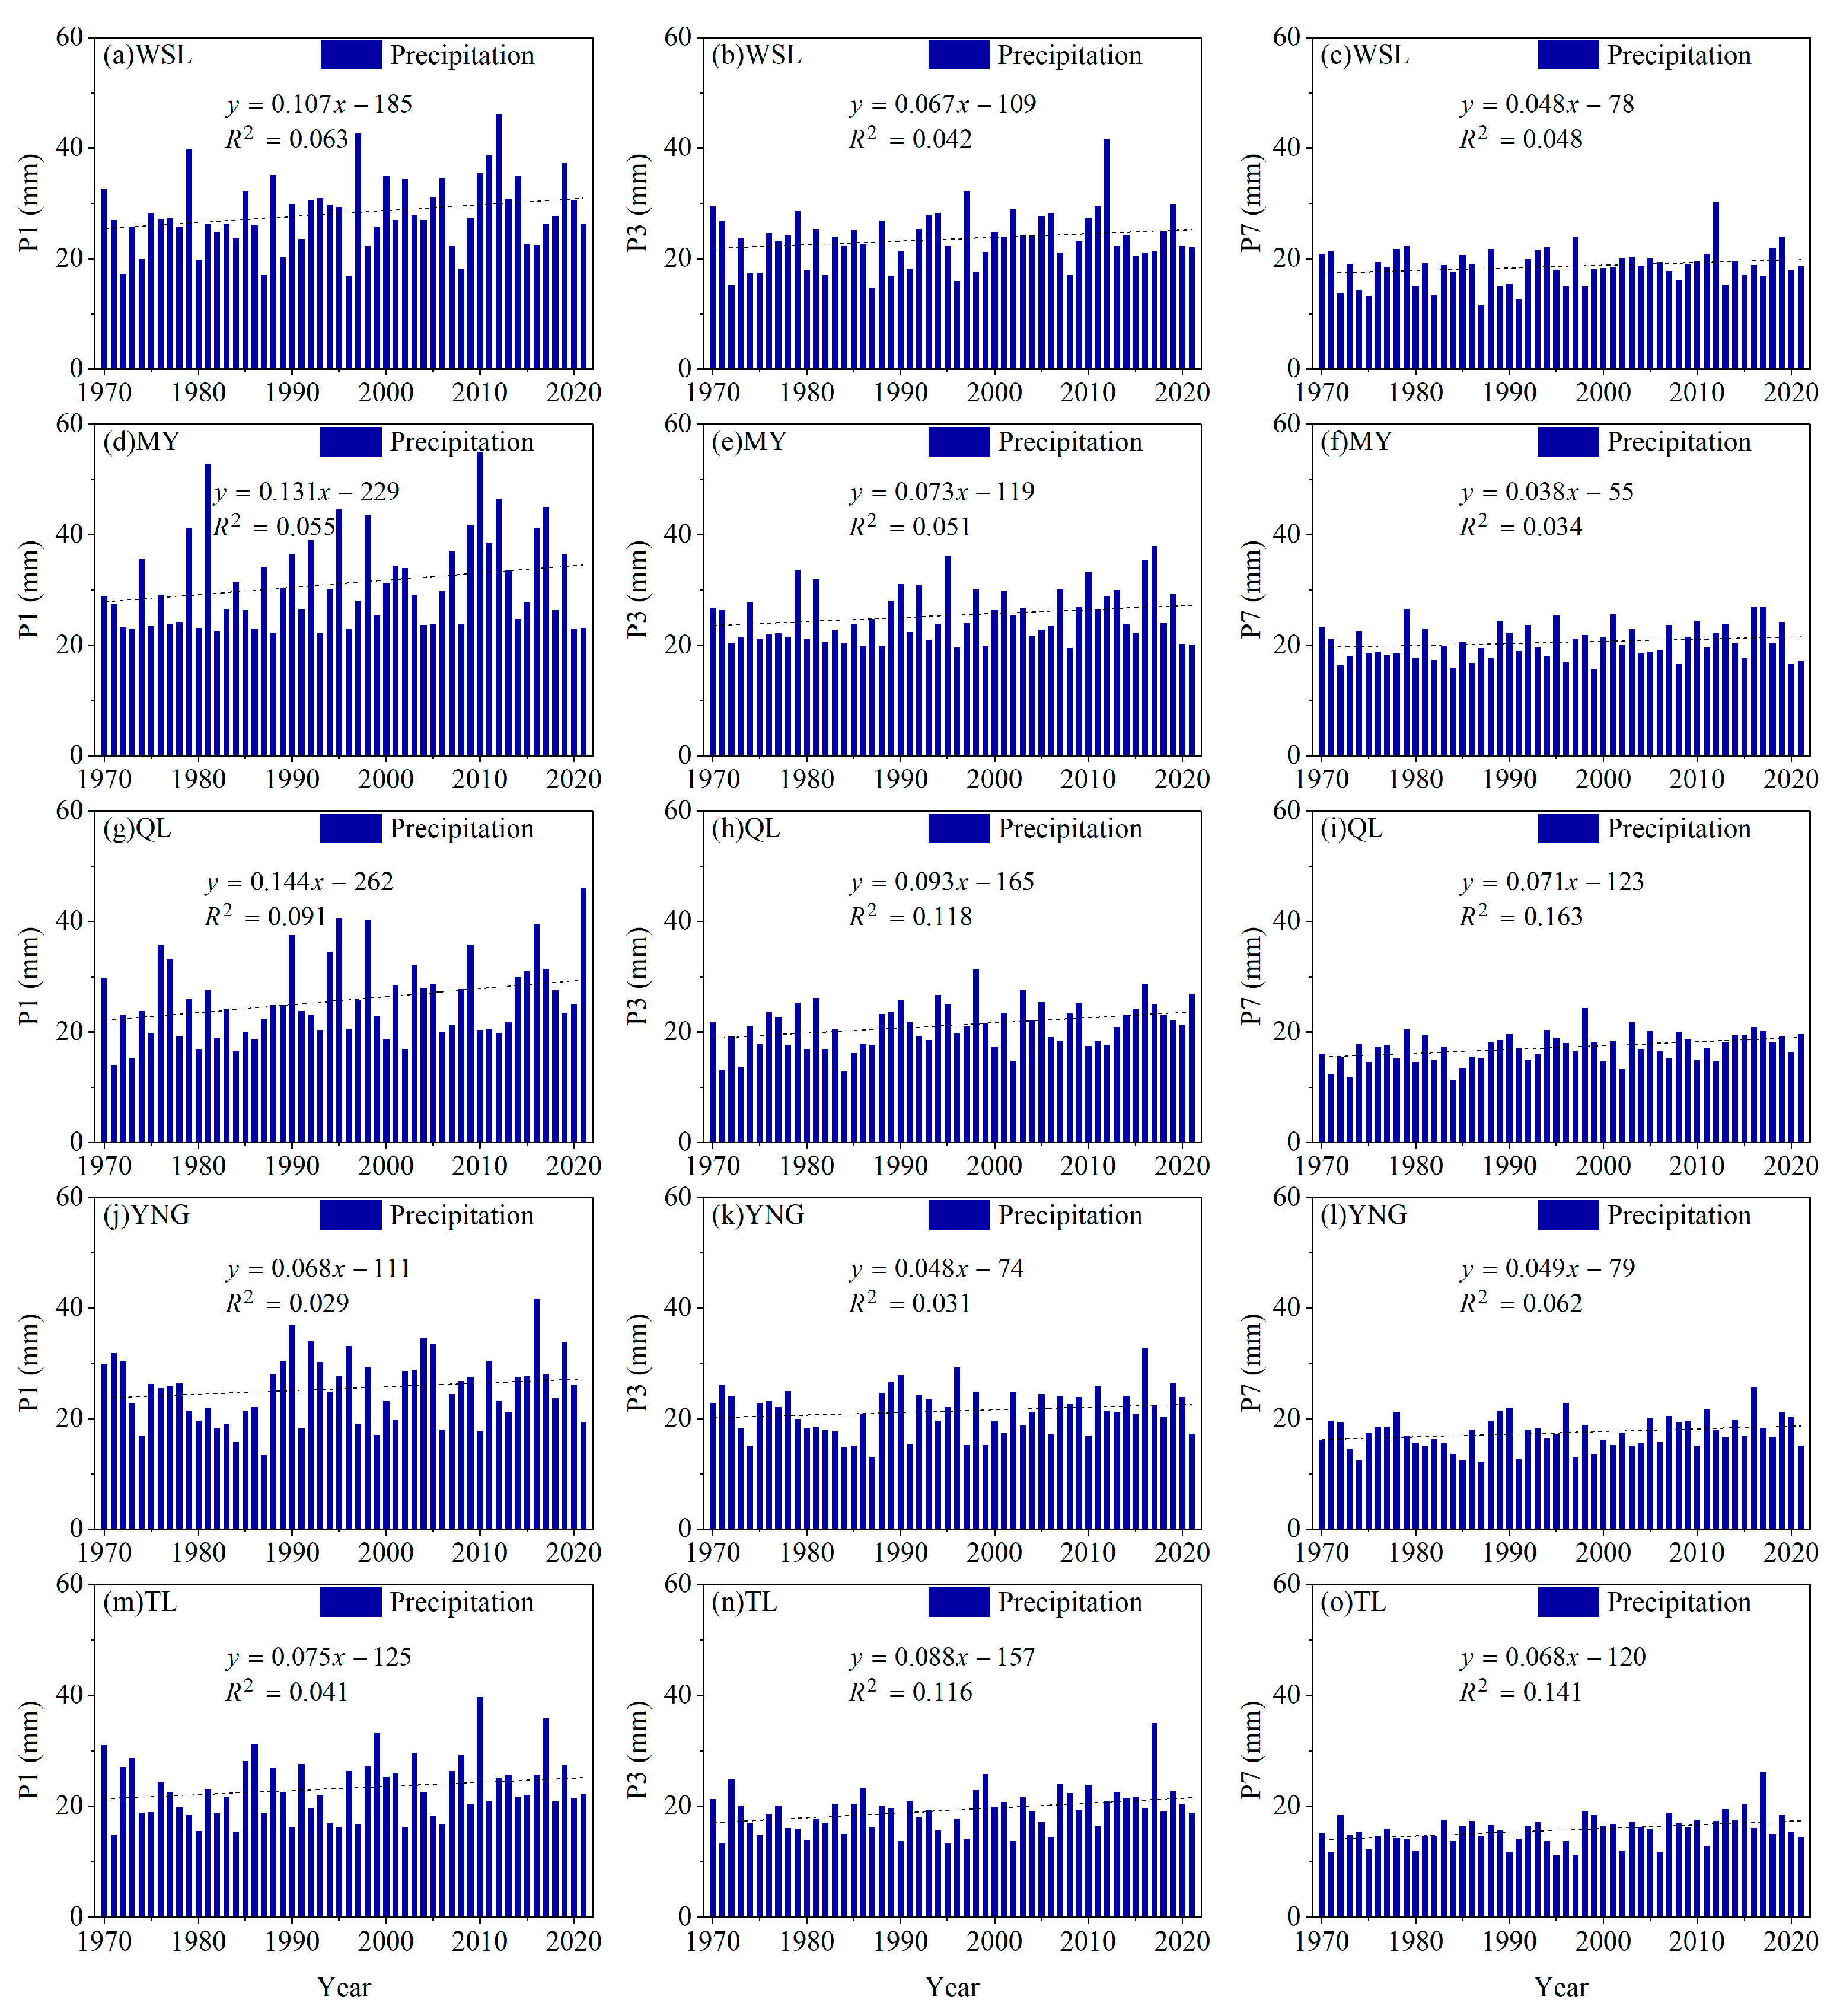
4.1. Attribution of Climate Change to Variability in Flood Magnitude

The results of this study indicate that the flood magnitude of the QMs changed significantly from east to west during the period 1970–2021. The linear trends of the AMPD and POT3M series show a decreasing trend in flood magnitude for SYRB in the east (e.g., Gulang, Zamu, and Xiying rivers), a slight fluctuation for six rivers in HRB in the central part, and an increasing trend, with larger values, for SLRB in the west (e.g., Shule River). The AMPD and POT3M series differ slightly, in that the AMPD series shows more rivers with a decreasing trend (e.g., Zamu and Dazhuma rivers), as shown in Figure 2, Figure 4 and Figure 5, and Table 4. A recent study has shown that climate change in the Qilian Mountains region has led to variations in the frequency of floods of different levels, with a decrease in SYRB in the east, a slight fluctuation in HRB in the center, and an increase in SLRB in the west, and the main factors causing those changes in flood frequency in the QMs are heavy rainfall, abnormal warming, and accelerated glacial melting [25]. Even changes in river discharge in arid and semi-arid regions of northwest China are associated with climate change [21,22,23,45]. In the past decades, e.g., Shi, et al. [27] have confirmed that the climate of arid and semi-arid regions in northwest China changed from warm-dry to warm-wet during 1961–2003, and Chen, et al. [26] also found an increasing trend in temperature and precipitation in arid northwest China during 1960–2015, and precipitation started to rise sharply after 1987. Climate change may cause high temperatures and heavy precipitation, which in turn lead to changes in flooding [46,47,48].
Twelve rivers, originating in the high-altitude mountainous regions of the QMs, have a special and typical flooding mechanism, mainly influenced by heavy precipitation and the melting of snow and ice water, due to rising temperatures. Owing to the complex topography of the QMs, the high altitude, and the inconvenient access, only five national meteorological stations are located at high-altitude in the mountains, while the rest of the meteorological stations are located in the piedmont and oasis plain areas. In this study, five meteorological stations in high-altitude mountainous areas, were selected to calculate trends using daily precipitation and temperature data for the period 1970–2021. To better explore the meteorological factors affecting the variation in flood magnitude in the QMs, temperature and precipitation trends at five meteorological stations were analyzed, by defining six temperature and precipitation indices (Figure 6 and Figure 7). Over the past 52 years, temperature and precipitation in SYRB, HRB, and SLRB have generally increased to different degrees (Figure 6 and Figure 7). Although the only five meteorological stations in the high-altitude mountainous regions do not correspond to analyzing the temperature and precipitation change patterns of the twelve rivers one by one, it can be found that the trend varies from region to region. In terms of the causes of variation in flood magnitude generated in the twelve rivers, it is mainly influenced by temperature, heavy precipitation, substratum, and topography, but in high-altitude areas of the QMs, heavy precipitation is the main factor causing the variation in flood magnitude. According to the analysis of the data from five meteorological stations, temperature and precipitation have generally increased at different rates in SYRB, HRB, and SLRB over the past 52 years (Figure 6 and Figure 7), however, the magnitudes of the AMPD and POT3M series have increased or decreased in different rivers (e.g., Gulang, Zamu, Xiying, Dazhuma, Shiyou, and Shule rivers), the possible causes are the regional differences of heavy precipitation in the upper reaches of the rivers, which are responsible for the changes in flood magnitude.
Among high-latitude rivers in northwest and southwest China, similar results of increasing and decreasing trends in the magnitude of river floods due to climate change, dominated by changes in temperature and precipitation, have been obtained in the Tien Shan Mountains, Aksu, Tarim, and Lancang–Mekong river basins [21,22,23,49]. In Central Asia, climate change is leading to an increased risk of flooding and landslides, and the likelihood of glacial lake outburst flooding is expected to increase with rising temperatures and an increase in the number of glacial lakes [50]. Similar studies can be compared in Europe, increases and decreases in temperature, evaporation, and precipitation in different regions have led to increased flooding in the northwest and decreased flooding in the south and east. Flood magnitude trends in different regions of Europe range from an increase of 11% to a decrease of 23%, per decade [6]. Even in Canada and North America, the trend of increasing and decreasing flood magnitude in different regions over the past decades has been identified by researchers [14]. Despite the spatial heterogeneity of the observed records of temperature, precipitation, and flooding in different regions, it is reasonable that the variation in flood magnitudes in the high-altitude mountains of the QMs found in our study, is mainly attributed to climate change.

4.2. Regional Differences in the Evolution of Flood Magnitude

The long-term variability in the AMPD and POT3M flood series highlights the regional differences in understanding the evolution of flood magnitude in the QMs. Analysis of the datasets shows a clear regional pattern of flooding trends across the QMs (Figure 2, Figure 4 and Figure 5), with a decreasing trend in SYRB in the east, a slight fluctuation for six rivers in HRB in the central part, and an increasing trend with larger values in SLRB in the west (e.g., Shule River). In arid and semi-arid regions, for the twelve inland rivers originating in the QMs, regional variations in flood magnitudes are mainly caused by heavy precipitation, abnormal warming, and accelerated glacial melting. Regional differences in precipitation and precipitation intensity, river catchment, underlying surface, and topography are the main drivers of flood magnitude variability. Nevertheless, the climate shows great variability with altitude, and most precipitation events in mountainous regions are influenced by three main sources of water vapor; namely, the East Asian monsoon, the Tibetan Plateau monsoon, and the westerly circulation [29]. The SYRB in the east, HRB in the center, and SLRB in the west are mainly influenced by the combination of the East Asian monsoon, the Tibetan Plateau monsoon, and the westerly circulation, respectively. The enhanced westerly circulation and increased water vapor, are the main factors leading to the increased precipitation in the QMs [30,51]. Different climate types result in different regional precipitation and precipitation intensities, causing differences in flood magnitude trends in the eastern, central, and western regions. In addition, due to the different glacier coverage areas and reserves in the eastern, central and western regions of the QMs, (Table 5), the eastern part is the smallest, the central part is larger, and the western part is the largest. The glaciers in the east are retreating rapidly, while the central and western regions are retreating more slowly in turn [52]. Due to the differences in glacier area and glacial meltwater ratios in the upper reaches of the twelve rivers in three sub-basins, the three rivers in the eastern SYRB have the smallest glacial meltwater ratios, whereas the three rivers in the western SLRB have the largest (Table 5) [53,54]. Differences in precipitation and the proportion of glacial meltwater, due to temperature increases in the east and west regions are the main reasons for the spatial patterns of flood magnitude variation in those three main regions (Figure 2, Figure 4 and Figure 5).
The trend comparison of the AMPD and POT3M series, shows that in the eastern part of the QMs, three rivers (e.g., Gulang, Zamu, and Xiying rivers) showed an overall decreasing trend, at the significance level of 99% or 95%. In the central region, most of the rivers showed non-significant trends, except for minor differences in individual rivers. For example, in the AMPD series, Dazhuma River exhibited a decreasing trend at the significance level of 99%. In the western region, Shule River displayed a significant increasing trend at the significance level of 99%, whereas Shiyou River was decreasing at the significance level of 90%, and Dang River had a non-significant trend. Similar results for regional differences in flood magnitude trends can also be found for the Tien Shan Mountains, and Aksu and Tarim rivers, in northwest China, as well as in Europe and North America [6,14,21,22,23].

5. Conclusions

In this study, flood events of twelve inland rivers in the QMs, northwest China, were examined, using Sen’s slope estimator and the M–K test, for the continuously recorded AMPD and POT3M flood series, from 1970 to 2021. Through analyzing the trends, abrupt changes, and causes of flood magnitude changes, the main findings can be summarized as follows:
1. The evolution of the flood magnitude of the twelve rivers originating in the QMs over the last 52 years, has been mainly influenced by the gradual increase in temperature and precipitation. The main factors causing abrupt changes in flood magnitude are heavy precipitation events and anomalous warming.
2. The trend analysis of the AMPD and POT3M magnitude series of the twelve rivers, for the period of 1970–2021, shows that the spatial distribution of flood magnitude changes is different. The AMPD and POT3M series show a decreasing trend in SYRB in the east (e.g., Gulang, Zamu, and Xiying rivers), a slight fluctuation for six rivers in HRB in the central region, and an increasing trend, with larger significance values, in SLRB in the west (e.g., Shule River), especially since 1987.
In the future, research on the formation process of flood events in arid and semi-arid regions should be strengthened, including elements such as meteorological variables related to flood frequency, the timing of flood peak occurrence, and flood magnitude. These findings can suggest solutions for water resources management and influence decisions for adaptation to climate change.

Author Contributions

Conceptualization, X.W.; data curation, C.H.; funding acquisition, R.C.; investigation, K.L.; methodology, X.W. and Y.Y.; project administration, J.L.; resources, R.C.; software, X.W. and Z.L.; supervision, R.C.; validation, K.L.; writing—original draft, X.W.; Writing—review and editing, Z.L. All authors have read and agreed to the published version of the manuscript.

Funding

This research was funded by the National Key Research and Development Program of China, grant number 2019YFC1510505, the National Natural Science Foundation of China, grant number 42171145, the Natural Science Foundation of Gansu Province, China, grant number 21JR7RA043, the Qinghai Key R&D and Transformation Program, grant number 2020-SF-146, and the open research fund of the National Cryosphere Desert Data Center, grant number 2021kf09.

Institutional Review Board Statement

Not applicable.

Informed Consent Statement

Not applicable.

Data Availability Statement

Meteorological data were collected by the National Climate Center of the China Meteorological Administration and are available on http://data.cma.cn/ under request (accessed on 10 October 2022). Flood data were collected by the Bureau of Hydrology and Water Resources of Gansu Province, China, and are available under request.

Acknowledgments

We are very grateful for the support of the National Meteorological Center of China’s Meteorological Administration on meteorological data and the Hydrological Station of Gansu Province regarding the experimental flood data. We would like to thank the editor and four anonymous reviewers for their insightful and constructive comments that greatly improved the paper.

Conflicts of Interest

The authors declare no conflict of interest.

References

  1. Desai, B.; Maskrey, A.; Peduzzi, P.; De Bono, A.; Herold, C. Making Development Sustainable: The Future of Disaster Risk Management, Global Assessment Report on Disaster Risk Reduction; United Nations Office for Disaster Risk Reduction (UNISDR): Geneva, Switzerland, 2015; Available online: https://archive-ouverte.unige.ch/unige:78299 (accessed on 10 October 2022).
  2. Winsemius, H.C.; Aerts, J.; van Beek, L.P.H.; Bierkens, M.F.P.; Bouwman, A.; Jongman, B.; Kwadijk, J.C.J.; Ligtvoet, W.; Lucas, P.L.; van Vuuren, D.P.; et al. Global drivers of future river flood risk. Nat. Clim. Chang. 2016, 6, 381–385. [Google Scholar] [CrossRef] [Green Version]
  3. Hirabayashi, Y.; Mahendran, R.; Koirala, S.; Konoshima, L.; Yamazaki, D.; Watanabe, S.; Kim, H.; Kanae, S. Global flood risk under climate change. Nat. Clim. Chang. 2013, 3, 816–821. [Google Scholar] [CrossRef]
  4. IPCC. Intergovernmental Panel on Climate Change, Climate Change 2021: Impacts, Adaptation, and Vulnerability; Cambridge Univ. Press: Cambridge, UK, 2021. [Google Scholar]
  5. Kundzewicz, Z.W.; Su, B.; Wang, Y.J.; Wang, G.J.; Wang, G.F.; Huang, J.L.; Jiang, T. Flood risk in a range of spatial perspectives—From global to local scales. Nat. Hazards Earth Syst. 2019, 19, 1319–1328. [Google Scholar] [CrossRef] [Green Version]
  6. Bloeschl, G.; Hall, J.; Viglione, A.; Perdigao, R.A.P.; Parajka, J.; Merz, B.; Lun, D.; Arheimer, B.; Aronica, G.T.; Bilibashi, A.; et al. Changing climate both increases and decreases European river floods. Nature 2019, 573, 108. [Google Scholar] [CrossRef]
  7. Bloschl, G.; Hall, J.; Parajka, J.; Perdigao, R.A.P.; Merz, B.; Arheimer, B.; Aronica, G.T.; Bilibashi, A.; Bonacci, O.; Borga, M.; et al. Changing climate shifts timing of European floods. Science 2017, 357, 588–590. [Google Scholar] [CrossRef] [Green Version]
  8. Wilby, R.L.; Keenan, R. Adapting to flood risk under climate change. Prog. Phys. Geogr. 2012, 36, 348–378. [Google Scholar] [CrossRef]
  9. Nigel, W.; Gosling, S.N. The impacts of climate change on river flood risk at the global scale. Clim. Chang. 2014, 134, 387–401. [Google Scholar] [CrossRef] [Green Version]
  10. Cornwall, W. Europe’s deadly floods leave scientists stunned. Science 2021, 373, 372–373. [Google Scholar] [CrossRef]
  11. Alfieri, L.; Bisselink, B.; Dottori, F.; Naumann, G.; de Roo, A.; Salamon, P.; Wyser, K.; Feyen, L. Global projections of river flood risk in a warmer world. Earths Future 2017, 5, 171–182. [Google Scholar] [CrossRef]
  12. Hodgkins, G.A.; Whitfield, P.H.; Burn, D.H.; Hannaford, J.; Renard, B.; Stahl, K.; Fleig, A.K.; Madsen, H.; Mediero, L.; Korhonen, J.; et al. Climate-driven variability in the occurrence of major floods across North America and Europe. J. Hydrol. 2017, 552, 704–717. [Google Scholar] [CrossRef] [Green Version]
  13. Mediero, L.; Santillan, D.; Garrote, L.; Granados, A. Detection and attribution of trends in magnitude, frequency and timing of floods in Spain. J. Hydrol. 2014, 517, 1072–1088. [Google Scholar] [CrossRef]
  14. Zadeh, S.M.; Burn, D.H.; O’Brien, N. Detection of trends in flood magnitude and frequency in Canada. J. Hydrol.-Reg. Stud. 2020, 28, 13. [Google Scholar] [CrossRef]
  15. Kemter, M.; Merz, B.; Marwan, N.; Vorogushyn, S.; Bloschl, G. Joint Trends in Flood Magnitudes and Spatial Extents Across Europe. Geophys. Res. Lett. 2020, 47, e2020GL087464. [Google Scholar] [CrossRef] [Green Version]
  16. Archfield, S.; Hirsch, R.; Viglione, A.; Blöschl, G. Using a peaks-over-threshold approach to assess changes in flood magnitude, volume, duration, and frequency across the United States. In Proceedings of the EGU General Assembly Conference, Vienna, Austria, 27 April–2 May 2014. [Google Scholar]
  17. Murray, V.; Ebi, K.L. IPCC Special Report on Managing the Risks of Extreme Events and Disasters to Advance Climate Change Adaptation (SREX). J. Epidemiol. Community Health 2012, 66, 759–760. [Google Scholar] [CrossRef]
  18. Yang, L.; Wang, L.C.; Li, X.; Gao, J. On the flood peak distributions over China. Hydrol. Earth Syst. Sci. 2019, 23, 5133–5149. [Google Scholar] [CrossRef] [Green Version]
  19. Xiong, B.; Xiong, L.H.; Guo, S.L.; Xu, C.Y.; Xia, J.; Zhong, Y.X.; Yang, H. Nonstationary Frequency Analysis of Censored Data: A Case Study of the Floods in the Yangtze River From 1470 to 2017. Water Resour. Res. 2020, 56, 20. [Google Scholar] [CrossRef]
  20. Gu, X.; Zhang, Q.; Wang, Z. Evaluation on Stationarity Assumption of Annual Maximum Peak Flows during 1951-2010 in the Pearl River Basin. J. Nat. Resour. 2015, 30, 824–835, (In Chinese with English Abstract). [Google Scholar]
  21. Zhang, Q.; Gu, X.H.; Singh, V.P.; Sun, P.; Chen, X.H.; Kong, D.D. Magnitude, frequency and timing of floods in the Tarim River basin, China: Changes, causes and implications. Glob. Planet. Chang. 2016, 139, 44–55. [Google Scholar] [CrossRef] [Green Version]
  22. Mao, W.; Fan, J.; Shen, Y.; Yang, Q.; Gao, Q.; Wang, G.; Wang, S.; Wu, S. Variations of Extreme Flood of the Rivers in Xinjiang Region and Some Typical Watersheds from Tianshan Mountains and Their Response to Climate Change in Recent 50 Years. J. Glaciol. Geocryol. 2012, 34, 1037–1046, (In Chinese with English Abstract). [Google Scholar]
  23. Jiang, J.X.; Cai, M.; Xu, Y.J.; Fang, G.H. The changing trend of flooding in the Aksu River basin. J. Glaciol. Geocryol. 2021, 43, 1200–1209, (In Chinese with English Abstract). [Google Scholar]
  24. Zhang, Y.Y.; Fu, G.B.; Sun, B.Y.; Zhang, S.F.; Men, B.H. Simulation and classification of the impacts of projected climate change on flow regimes in the arid Hexi Corridor of Northwest China. J. Geophys. Res.-Atmos. 2015, 120, 7429–7453. [Google Scholar] [CrossRef]
  25. Wang, X.L.; Chen, R.S.; Li, H.Y.; Li, K.L.; Liu, J.F.; Liu, G.H. Detection and attribution of trends in flood frequency under climate change in the Qilian Mountains, Northwest China. J. Hydrol.-Reg. Stud. 2022, 42, 101153. [Google Scholar] [CrossRef]
  26. Chen, Y.N.; Li, Z.; Fan, Y.T.; Wang, H.J.; Deng, H.J. Progress and prospects of climate change impacts on hydrology in the arid region of northwest China. Environ. Res. 2015, 139, 11–19. [Google Scholar] [CrossRef] [PubMed]
  27. Shi, Y.F.; Shen, Y.; Li, D.L.; Zhang, G.W.; Ding, Y.; Hu, R.J.; Kang, E.S. Discussion on the present climate change from warm-dry to warm-wet in northwest china. Quatern. Sci. 2003, 23, 152–164, (In Chinese with English Abstract). [Google Scholar]
  28. Wang, X.; Chen, R.; Han, C.; Yang, Y.; Liu, J.; Liu, Z.; Song, Y. Changes in river discharge in typical mountain permafrost catchments, northwestern China. Quatern. Int. 2019, 519, 32–41. [Google Scholar] [CrossRef]
  29. Zhang, Q.; Yu, Y.X.; Zhang, J. Characteristics of Water Cycle in the Qilian Mountains and the Oases in Hexi Inland River Basins. J. Glaciol. Geocryol. 2008, 30, 907–913, (In Chinese with English Abstract). [Google Scholar]
  30. Wang, L.; Chen, R.S.; Han, C.T.; Wang, X.Q.; Liu, G.H.; Song, Y.X.; Yang, Y.; Liu, J.F.; Liu, Z.W.; Liu, X.J.; et al. Change characteristics of precipitation and temperature in the Qilian Mountains and Hexi Oasis, Northwestern China. Environ. Earth Sci. 2019, 78, 13. [Google Scholar] [CrossRef]
  31. Guan, Y.H.; Zheng, F.L.; Zhang, X.C.; Wang, B. Trends and variability of daily precipitation and extremes during 1960–2012 in the Yangtze River Basin, China. Int. J. Climatol. 2017, 37, 1282–1298. [Google Scholar] [CrossRef]
  32. Hussain, A.; Cao, J.H.; Ali, S.; Muhammad, S.; Ullah, W.; Hussain, I.; Akhtar, M.; Wu, X.Q.; Guan, Y.H.; Zhou, J.X. Observed trends and variability of seasonal and annual precipitation in Pakistan during 1960-2016. Int. J. Climatol. 2022, 42, 8313–8332. [Google Scholar] [CrossRef]
  33. Hussain, A.; Cao, J.H.; Hussain, I.; Begum, S.; Akhtar, M.; Wu, X.Q.; Guan, Y.H.; Zhou, J.X. Observed Trends and Variability of Temperature and Precipitation and Their Global Teleconnections in the Upper Indus Basin, Hindukush-Karakoram-Himalaya. Atmosphere 2021, 12, 973. [Google Scholar] [CrossRef]
  34. Zhang, Q.; Singh, V.P.; Li, J.F.; Chen, X.H. Analysis of the periods of maximum consecutive wet days in China. J. Geophys. Res.-Atmos. 2011, 116, D23106. [Google Scholar] [CrossRef]
  35. Lang, M.; Ouarda, T.; Bobee, B. Towards operational guidelines for over-threshold modeling. J. Hydrol. 1999, 225, 103–117. [Google Scholar] [CrossRef]
  36. Sen, P.K. Estimates of the regression coefficient based on Kendall’s tau. J. Am. Stat. Assoc. 1968, 63, 1379–1389. [Google Scholar] [CrossRef]
  37. Mann, H.B. Nonparametric test against trend. Econometrica 1945, 13, 245–259. [Google Scholar] [CrossRef]
  38. Kendall, M.G. Rank Correlation Methods. Brit. J. Psychol. 1975, 25, 86–91. [Google Scholar] [CrossRef]
  39. Sang, Y.F.; Wang, Z.; Liu, C. Comparison of the MK test and EMD method for trend identification in hydrological time series. J. Hydrol. 2014, 510, 293–298. [Google Scholar] [CrossRef]
  40. Yang, Y.; Chen, R.S.; Liu, G.H.; Liu, Z.W.; Wang, X.Q. Trends and variability in snowmelt in China under climate change. Hydrol. Earth Syst. Sci. 2022, 26, 305–329. [Google Scholar] [CrossRef]
  41. Gocic, M.; Trajkovic, S. Analysis of changes in meteorological variables using Mann-Kendall and Sen’s slope estimator statistical tests in Serbia. Glob. Planet. Chang. 2013, 100, 172–182. [Google Scholar] [CrossRef]
  42. Li, Z.L.; Xu, Z.X.; Li, J.Y.; Li, Z.J. Shift trend and step changes for runoff time series in the Shiyang River basin, northwest China. Hydro. Process 2008, 22, 4639–4646. [Google Scholar] [CrossRef]
  43. Mosmann, V.; Castro, A.; Fraile, R.; Dessens, J.; Sanchez, J.L. Detection of statistically significant trends in the summer precipitation of mainland Spain. Atmos. Res. 2004, 70, 43–53. [Google Scholar] [CrossRef]
  44. Bari, S.H.; Rahman, M.T.U.; Hoque, M.A.; Hussain, M.M. Analysis of seasonal and annual rainfall trends in the northern region of Bangladesh. Atmos. Res. 2016, 176, 148–158. [Google Scholar] [CrossRef]
  45. Wang, Y.; Qin, D. Influence of Climate Change and Human Activity on Water Resources in Arid Region of Northwest China: An Overview. Clim. Chang. Res. 2017, 13, 483–493, (In Chinese with English Abstract). [Google Scholar] [CrossRef]
  46. Cao, B.; Pan, B.; Wang, J.; Shangguan, D.; Wen, Z.; Qi, W.; Cui, H.; Lu, Y. Changes in the glacier extent and surface elevation along the Ningchan and Shuiguan river source, eastern Qilian Mountains, China. Quatern. Res. 2014, 81, 531–537. [Google Scholar] [CrossRef]
  47. Tian, H.; Yang, T.; Liu, Q. Climate change and glacier area shrinkage in the Qilian mountains, China, from 1956 to 2010. Ann. Glaciol. 2014, 55, 187–197. [Google Scholar] [CrossRef] [Green Version]
  48. Zhang, Y.; Liu, S.; Shangguan, D.; Li, J.; Zhao, J. Thinning and shrinkage of Laohugou No. 12 glacier in the Western Qilian Mountains, China, from 1957 to 2007. J. Mt. Sci. 2012, 9, 343–350. [Google Scholar] [CrossRef]
  49. Wang, S.; Zhang, L.; She, D.; Wang, G.; Zhang, Q. Future projections of flooding characteristics in the Lancang-Mekong River Basin under climate change. J. Hydrol. 2021, 602, 126778. [Google Scholar] [CrossRef]
  50. Reyer, C.P.O.; Otto, I.M.; Adams, S.; Albrecht, T.; Baarsch, F.; Cartsburg, M.; Coumou, D.; Eden, A.; Ludi, E.; Marcus, R.; et al. Climate change impacts in Central Asia and their implications for development. Reg. Environ. Chang. 2017, 17, 1639–1650. [Google Scholar] [CrossRef]
  51. Chen, R.S.; Han, C.T.; Liu, J.F.; Yang, Y.; Liu, Z.W.; Wang, L.; Kang, E.S. Maximum precipitation altitude on the northern flank of the Qilian Mountains, northwest China. Hydrol. Res. 2018, 49, 1696–1710. [Google Scholar] [CrossRef]
  52. Wang, P.; Li, Z.Q.; Gao, W.Y. Rapid Shrinking of Glaciers in the Middle Qilian Mountain Region of Northwest China during the Last similar to 50 Years. J. Earth Sci. 2011, 22, 539–548. [Google Scholar] [CrossRef]
  53. Sun, M.P.; Liu, S.Y.; Yao, X.J.; Guo, W.Q.; Xu, J.L. Glacier changes in the Qilian Mountains in the past half-century: Based on the revised First and Second Chinese Glacier Inventory. J. Geogr. Sci. 2018, 28, 206–220. [Google Scholar] [CrossRef] [Green Version]
  54. Liu, G.H.; Chen, R.S.; Li, K.L. Glacial Change and Its Hydrological Response in Three Inland River Basins in the Qilian Mountains, Western China. Water 2021, 13, 2213. [Google Scholar] [CrossRef]
Figure 1. Location of the study area. (a−c) Denote Gulang, Zamu, and Xiying rivers in SYRB, (d−i) denote Babao, Hei, Dazhuma, Liyuan, Hongshui, and Taolai rivers in HRB, (j−l) denote Shiyou, Shule, and Dang rivers in SLRB, respectively. (1−5) Denote Wushaoling, Menyuan, Qilian, Yeniugou and Tuole meteorological stations, respectively.
Atmosphere 14 00557 g001
Figure 2. Trends of AMPD for 12 representative rivers in the QM region, northwest China. (ac) Gulang, Zamu, and Xiying rivers in SYRB, (di) Babao, Hei, Dazhuma, Liyuan, Hongshui, and Taolai rivers in HRB, (jl) Shiyou, Shule, and Dang rivers in SLRB, respectively.
Atmosphere 14 00557 g002
Figure 3. Trends of SQ–MK test in AMPD for 12 representative rivers in the QM region, northwest China. (ac) Denote Gulang, Zamu, and Xiying rivers in SYRB, (di) denote Babao, Hei, Dazhuma, Liyuan, Hongshui, and Taolai rivers in HRB, (jl) denote Shiyou, Shule, and Dang rivers in SLRB, respectively.
Atmosphere 14 00557 g003
Figure 4. Trends of POT3M flood series for 12 representative rivers in the QM region, northwest China. (ac) Denote Gulang, Zamu, and Xiying rivers in SYRB, (di) denote Babao, Hei, Dazhuma, Liyuan, Hongshui, and Taolai rivers in HRB, (jl) denote Shiyou, Shule, and Dang rivers in SLRB, respectively.
Atmosphere 14 00557 g004
Figure 5. Trends in AMPD and POT3M flood series for 12 representative rivers in the QM region, northwest China. (a–c) Denote Gulang, Zamu, and Xiying rivers in SYRB, (d–i) denote Babao, Hei, Dazhuma, Liyuan, Hongshui, and Taolai rivers in HRB, (j–l) denote Shiyou, Shule, and Dang rivers in SLRB, respectively. A big arrow indicates a statistically increasing trend (red) and decreasing trend (black), at the significance level of 99%, a medium arrow indicates a statistically increasing trend (red) and decreasing trend (black), at the significance level of 95%, a small arrow indicates a statistically increasing trend (red) and decreasing trend (black), at the significance level of 90%. No marked symbol at stations represents a non-significant trend.
Atmosphere 14 00557 g005
Figure 6. Temporal variations in temperature indices at meteorological stations in the QM region. The stations are, WSL: Wushaoling; MY: Menyuan; QL: Qilian; YNG: Yeniugou; TL: Tuole. (ac) WSL; (df) MY; (gi) QL; (jl) YNG; (mo) TL. Definitions of these temperature indices are given in Table 3.
Atmosphere 14 00557 g006
Figure 7. Temporal variations in precipitation indices at meteorological stations in the QM region. The stations are, WSL: Wushaoling; MY: Menyuan; QL: Qilian; YNG: Yeniugou; TL: Tuole. (ac) WSL; (df) MY; (gi) QL; (jl) YNG; (mo) TL. Definitions of these precipitation indices are given in Table 3.
Atmosphere 14 00557 g007
Table 1. Basic information on hydrological stations/catchments.
River BasinCodeRiver NameDischarge StationLongitudeLatitudeAltitude (m)Data Series
SYRBaGulangGulang102°52′37°27′20721970–2021
bZamuZamusi102°34′37°42′20101970–2021
cXiyingJiutiaoling102°03′37°52′22701970–2021
HRBdBabaoQilian100°14′38°12′27101970–2021
eHeiZhamashike99°59′38°14′28101970–2021
fDazhumaWafangcheng100°31′38°29′24401970–2021
gLiyuanSunan99°38′38°51′22641970–2021
hHongshuiXindi98°25′39°34′18801970–2021
iTaolaiJiayuguan98°16′39°45′16951970–2021
SLRBjShiyouYumen97°33′39°47′23001970–2021
kShuleChangmabao96°51′39°49′20801970–2021
lDangheDangchengwan94°53′39°30′21761970–2021
Table 2. Basic information on meteorological stations in the QMs.
CodeMeteorological StationLongitudeLatitudeAltitude (m)Data Series
1Wushaoling102°52′37°12′30451970–2021
2Menyuan101°37′37°23′28501970–2021
3Qilian100°15′38°11′27871970–2021
4Yeniugou99°35′38°25′3320 1970–2021
5Tuole98°25′38°48′33671970–2021
Table 3. Definitions of the six temperature and precipitation indices used in this study.
AbbreviationsMeteorological IndicesUnit
AMTAnnual mean temperature°C
TXXAnnual maximum value of daily maximum temperature°C
TXNAnnual minimum value of daily maximum temperature°C
P1Maximum daily precipitation in 1 yearmm
P33-day mean maximum precipitation in 1 yearmm
P77-day mean maximum precipitation in 1 yearmm
Table 4. Results of trend analysis of AMPD and POT3M series, in the QM region, northwest China.
River BasinCodeAMPD SeriesMean Value (m3/s)POT3M Series Threshold Value (m3/s)
SYRBaZ(−3.71) S(0.01)↓27Z(−2.59) S(0.01)↓5
bZ(−2.04) S(0.05)↓101Z(−1.04) NS55
cZ(−2.28) S(0.05)↓129Z(−2.35) S(0.05)↓79
HRBdZ(0.11) NS143Z(−0.14) NS75
eZ(0.54) NS314Z(0.61) NS158
fZ(−2.37) S(0.01)↓43Z(−0.17) NS16
gZ(0.49) NS99Z(−0.49) NS56
hZ(0.58) NS145Z(−0.01) NS69
iZ(0.72) NS171Z(0.25) NS121
SLRBjZ(−1.33) S(0.1)↓34Z(−1.61) S(0.1)↓13
kZ(3.44) S(0.01)↑338Z(3.14) S(0.01)↑251
lZ(0.73) NS90Z(0.77) NS39
In Table 4, the M–K test for the AMPD and POT3M series detected trends at 90%, 95%, and 99% significance levels, respectively; S means statistically significant at the significance level shown in parentheses; NS means not significant; “↑” and “↓” mean increasing and decreasing trend. (a–l) Denote: Gulang, Zamu, Xiying, Babao, Hei, Dazhuma, Liyuan, Hongshui, Taolai, Shiyou, Shule, and Dang rivers, respectively. The corresponding hydrological stations for the (a–l) rivers are Gulang, Zamusi, Jiutiaoling, Qilian, Zhamashike, Wafangcheng, Sunan, Xindi, Jiayuguan, Yumen, Changmabao, and Dangchengwan, respectively.
Table 5. Glacier area and percentage of glacier meltwater runoff in this study [25,54].
River BasinRiver NameGlacier Area (km2)Glacial Meltwater Ratio (%)Periods
SYRBGulang1960s–2010s
Zamu3.751.31960s–2010s
Xiying19.775.31960s–2010s
HRBBabao1960s–2010s
Hei58.902.71960s–2010s
Dazhuma5.9411.41960s–2010s
Liyuan16.287.11960s–2010s
Hongshui125.6244.01960s–2010s
Taolai137.8917.21960s–2010s
SLRBShiyou6.3819.31960s–2010s
Shule469.5242.21960s–2010s
Danghe233.8346.81960s–2010s
Disclaimer/Publisher’s Note: The statements, opinions and data contained in all publications are solely those of the individual author(s) and contributor(s) and not of MDPI and/or the editor(s). MDPI and/or the editor(s) disclaim responsibility for any injury to people or property resulting from any ideas, methods, instructions or products referred to in the content.

