
Performance of the WRF Model for the Forecasting of the V-Shaped Storm Recorded on 11–12 November 2019 in the Eastern Sicily
 , , , ,
  , and
, and 
Abstract
:1. Introduction
2. Materials and Methods
2.1. The Weather Research and Forecasting Model
2.2. Synoptic Analysis
3. Results and Discussion
4. Conclusions
Author Contributions
Funding
Informed Consent Statement
Data Availability Statement
Acknowledgments
Conflicts of Interest
References
- Lionello, P.; Scarascia, L. The relation between climate change in the Mediterranean region and global warming. Reg. Environ. Change 2018, 18, 1481–1493. [Google Scholar] [CrossRef]
- Ulbrich, U.; May, W.; Li, L.; Lionello, P.; Pinto, J.G.; Somot, S. The Mediterranean climate change under global warming. Dev. Earth Environ. Sci. 2006, 4, 399–415. [Google Scholar] [CrossRef]
- Giannakopoulos, C.; Le Sager, P.; Bindi, M.; Moriondo, M.; Kostopoulou, E.; Goodess, C.M. Climatic changes and associated impacts in the Mediterranean resulting from a 2 C global warming. Glob. Planet. Change 2009, 68, 209–224. [Google Scholar] [CrossRef]
- Paeth, H.; Hense, A. Mean versus extreme climate in the Mediterranean region and its sensitivity to future global warming conditions. Meteorol. Z. 2009, 329–347. [Google Scholar] [CrossRef] [PubMed]
- Fan, Y.; Lu, J.; Li, L. Mechanism of the Centennial Subpolar North Atlantic Cooling Trend in the FGOALS-g2 Historical Simulation. J. Geophys. Res. Ocean. 2021, 126, e2021JC017511. [Google Scholar] [CrossRef]
- Li, L.; Lozier, M.S.; Li, F. Century-long cooling trend in subpolar North Atlantic forced by atmosphere: An alternative explanation. Clim. Dyn. 2022, 58, 2249–2267. [Google Scholar] [CrossRef]
- Liang, Y.-C.; Yu, J.-Y.; Saltzman, E.S.; Wang, F. Linking the tropical Northern Hemisphere pattern to the Pacific warm blob and Atlantic cold blob. J. Clim. 2017, 30, 9041–9057. [Google Scholar] [CrossRef]
- Garcia-Monteiro, S.; Sobrino, J.A.; Julien, Y.; Soria, G.; Skokovic, D. Surface Temperature trends in the Mediterranean Sea from MODIS data during years 2003–2019. Reg. Stud. Mar. Sci. 2022, 49, 102086. [Google Scholar] [CrossRef]
- Juza, M.; Fernández-Mora, À.; Tintoré, J. Sub-Regional Marine Heat Waves in the Mediterranean Sea From Observations: Long-Term Surface Changes, Sub-Surface and Coastal Responses. Front. Mar. Sci. 2022, 9, 785771. [Google Scholar] [CrossRef]
- Caruso, C.G.; Lazzaro, G.; Longo, M.; Scirè Scappuzzo, S.; Italiano, F. Shallow sea monitoring systems for the “Distributed Laboratory over the Sea” in Panarea island. In Proceedings of the 2022 IEEE International Workshop on Metrology for the Sea, Milazzo, Italy, 3–5 October 2022; Learning to Measure Sea Health Parameters (MetroSea). MetroSea: Milazzo, Italy, 2022; pp. 424–428. [Google Scholar] [CrossRef]
- Longo, M.; Lazzaro, G.; Caruso, C.G.; Corbo, A.; Sciré Scappuzzo, S.; Italiano, F.; Gattuso, A.; Romano, D. Hydro-acoustic signals from the Panarea shallow hydrothermal field: New inferences of a direct link with Stromboli. Geol. Soc. London Spec. Publ. 2021, 519, SP519-2020. [Google Scholar] [CrossRef]
- Furcolo, P.; Pelosi, A.; Rossi, F. Statistical identification of orographic effects in the regional analysis of extreme rainfall. Hydrol. Process. 2016, 30, 1342–1353. [Google Scholar] [CrossRef]
- Grazzini, F.; Craig, G.C.; Keil, C.; Antolini, G.; Pavan, V. Extreme precipitation events over northern Italy. Part I: A systematic classification with machine-learning techniques. Q. J. R. Meteorol. Soc. 2020, 146, 69–85. [Google Scholar] [CrossRef] [Green Version]
- Lin, Y.-L.; Chiao, S.; Wang, T.-A.; Kaplan, M.L.; Weglarz, R.P. Some common ingredients for heavy orographic rainfall. Weather. Forecast. 2001, 16, 633–650. [Google Scholar] [CrossRef]
- Liotta, M.; Favara, R.; Valenza, M. Isotopic composition of the precipitations in the central Mediterranean: Origin marks and orographic precipitation effects. J. Geophys. Res. Atmos. 2006, 111, D19. [Google Scholar] [CrossRef] [Green Version]
- Rontu, L. Studies on Orographic Effects in a Numerical Weather Prediction Model; Finnish Meteorological Institute: Helsinki, Finland, 2007. [Google Scholar]
- Ntwali, D.; Ogwang, B.A.; Ongoma, V. The impacts of topography on spatial and temporal rainfall distribution over Rwanda based on WRF model. Atmos. Clim. Sci. 2016, 6, 145–157. [Google Scholar] [CrossRef] [Green Version]
- Lee, J.W.; Hong, S.Y. A numerical simulation study of orographic effects for a heavy rainfall event over Korea using the WRF model. Atmosphere 2006, 16, 319–332. [Google Scholar]
- Lagouvardos, K.; Karagiannidis, A.; Dafis, S.; Kalimeris, A.; Kotroni, V. Ianos—A hurricane in the Mediterranean. Bull. Am. Meteorol. Soc. 2022, 103, E1621–E1636. [Google Scholar] [CrossRef]
- Gonzalez-Aleman, J.J.; Pascale, S.; Gutierrez-Fernandez, J.; Murakami, H.; Gaertner, M.A.; Vecchi, G.A. Potential increase in hazard from Mediterranean hurricane activity with global warming. Geophys. Res. Lett. 2022, 46, 1754–1764. [Google Scholar] [CrossRef]
- Forestieri, A.; Lo Conti, F.; Blenkinsop, S.; Cannarozzo, M.; Fowler, H.J.; Noto, L.V. Regional frequency analysis of extreme rainfall in Sicily (Italy). Int. J. Climatol. 2018, 38, e698–e716. [Google Scholar] [CrossRef]
- Aronica, G.T.; Brigandí, G.; Morey, N. Flash floods and debris flow in the city area of Messina, north-east part of Sicily, Italy in October 2009: The case of the Giampilieri catchment. Nat. Hazards Earth Syst. Sci. 2012, 12, 1295–1309. [Google Scholar] [CrossRef]
- Cassola, F.; Ferrari, F.; Mazzino, A.; Lacorata, G.; Rotunno, R. Numerical simulations of Mediterranean heavy precipitation events with the WRF model: A verification exercise using different approaches. Atmos. Res. 2015, 164, 210–225. [Google Scholar] [CrossRef]
- Avolio, E.; Federico, S. WRF simulations for a heavy rainfall event in southern Italy: Verification and sensitivity tests. Atmos. Res. 2018, 209, 14–35. [Google Scholar] [CrossRef]
- Caccamo, M.T.; Castorina, G.; Colombo, F.; Insinga, V.; Maiorana, E.; Magazù, S. Weather forecast performances for complex orographic areas: Impact of different grid resolutions and of geographic data on heavy rainfall event simulations in Sicily. Atmos. Res. 2017, 198, 22–33. [Google Scholar] [CrossRef]
- Lagasio, M.; Parodi, A.; Procopio, R.; Rachidi, F.; Fiori, E. Lightning Potential Index performances in multimicrophysical cloud-resolving simulations of a back-building mesoscale convective system: The Genoa 2014 event. J. Geophys. Res. Atmos. 2017, 122, 4238–4257. [Google Scholar] [CrossRef]
- Coleman, J.; Law, K. Meteorology. In Reference Module in Earth Systems and Environmental Sciences; Elsevier: Amsterdam, The Netherlands, 2015. [Google Scholar] [CrossRef]
- Roger, S.R.; Pielke, A. Mesoscale Meteorological Modeling; Academic Press Inc: Cambridge, MA, USA, 2013; Volume 98. [Google Scholar]
- Delrieu, G.; Nicol, J.; Yates, E.; Kirstetter, P.-E.; Creutin, J.-D.; Anquetin, S.; Obled, C.; Saulnier, G.-M.; Ducrocq, V.; Gaume, E.; et al. The catastrophic flash-flood event of 8–9 September 2002 in the Gard Region, France: A first case study for the Cévennes–Vivarais Mediterranean Hydrometeorological Observatory. J. Hydrometeorol. 2005, 6, 34–52. [Google Scholar] [CrossRef] [Green Version]
- Ducrocq, V.; Braud, I.; Davolio, S.; Ferretti, R.; Flamant, C.; Jansa, A.; Kalthoff, N.; Richard, E.; Taupier-Letage, I.; Ayral, P.; et al. HyMeX-SOP1: The field campaign dedicated to heavy precipitation and flash flooding in the northwestern Mediterranean. Bull. Am. Meteorol. Soc. 2014, 95, 1083–1100. [Google Scholar] [CrossRef] [Green Version]
- Rebora, N.; Molini, L.; Casella, E.; Comellas, A.; Fiori, E.; Pignone, F.; Siccardi, F.; Silvestro, F.; Tanelli, S.; Parodi, A. Extreme rainfall in the Mediterranean: What can we learn from observations? J. Hydrometeorol. 2013, 14, 906–922. [Google Scholar] [CrossRef]
- Federico, S.; Torcasio, R.C.; Puca, S.; Vulpiani, G.; Comellas Prat, A.; Dietrich, S.; Avolio, E. Impact of radar reflectivity and lightning data assimilation on the rainfall forecast and predictability of a summer convective thunderstorm in Southern Italy. Atmosphere 2021, 12, 958. [Google Scholar] [CrossRef]
- Duffourg, F.; Nuissier, O.; Ducrocq, V.; Flamant, C.; Chazette, P.; Delanoë, J.; Doerenbecher, A.; Fourrié, N.; Di Girolamo, P.; Lac, C.; et al. Offshore deep convection initiation and maintenance during the HyMeX IOP 16a heavy precipitation event. Q. J. R. Meteorol. Soc. 2016, 142, 259–274. [Google Scholar] [CrossRef]
- Capecchi, V.; Antonini, A.; Benedetti, R.; Fibbi, L.; Melani, S.; Rovai, L.; Ricchi, A.; Cerrai, D. Assimilating X-and S-band Radar Data for a Heavy Precipitation Event in Italy. Water 2021, 13, 1727. [Google Scholar] [CrossRef]
- Ferretti, R.; Pichelli, E.; Gentile, S.; Maiello, I.; Cimini, D.; Davolio, S.; Miglietta, M.M.; Panegrossi, G.; Baldini, L.; Pasi, F.; et al. Overview of the first HyMeX Special Observation Period over Italy: Observations and model results. Hydrol. Earth Syst. Sci. 2014, 18, 1953–1977. [Google Scholar] [CrossRef] [Green Version]
- Fiori, E.; Comellas, A.; Molini, L.; Rebora, N.; Siccardi, F.; Gochis, D.J.; Tanelli, S.; Parodi, A. Analysis and hindcast simulations of an extreme rainfall event in the Mediterranean area: The Genoa 2011 case. Atmos. Res. 2014, 138, 13–29. [Google Scholar] [CrossRef] [Green Version]
- Fiori, E.; Ferraris, L.; Molini, L.; Siccardi, F.; Kranzlmueller, D.; Parodi, A. Triggering and evolution of a deep convective system in the Mediterranean Sea: Modelling and observations at a very fine scale. Q. J. R. Meteorol. Soc. 2017, 143, 927–941. [Google Scholar] [CrossRef]
- Lagasio, M.; Silvestro, F.; Campo, L.; Parodi, A. Predictive capability of a high-resolution hydrometeorological forecasting framework coupling WRF cycling 3dvar and Continuum. J. Hydrometeorol. 2019, 20, 1307–1337. [Google Scholar] [CrossRef]
- Poletti, M.L.; Silvestro, F.; Davolio, S.; Pignone, F.; Rebora, N. Using nowcasting technique and data assimilation in a meteorological model to improve very short range hydrological forecasts. Hydrol. Earth Syst. Sci. 2019, 23, 3823–3841. [Google Scholar] [CrossRef] [Green Version]
- Castorina, G.; Colombo, F.; Caccamo, M.T.; Cannuli, A.; Insinga, V.; Maiorana, E.; Magazù, S. Cultural Heritage and Natural Hazard: How WRF Model Can Help to Protect and Safe Archaeological Sites. Int. J. Res. Environ. Sci. 2017, 3, 37–42. [Google Scholar]
- Powers, J.G. The Weather Research and Forecasting Model Overview, System Efforts, and Future Directions. Bull. Am. Meteorol. Soc. 2017, 98, 1717–1737. [Google Scholar] [CrossRef]
- Colombo, F.; Castorina, G.; Caccamo, M.T.; Insinga, V.; Maiorana, E.; Magazù, S. IT Technologies for Science Application: Using Meteorological Local Area Model to Contrast the Hydrogeological Risks. Hydrol. Curr. Res. 2017, 8, 4. [Google Scholar] [CrossRef] [Green Version]
- Skamarock, W.C.; Klemp, J.B.; Dudhia, J.; Gill, D.O.; Liu, Z.; Berner, J.; Wang, W.; Powers, J.G.; Duda, M.G.; Barker, D.M.; et al. A Description of the Advanced Research WRF Model Version 4; Mesoscale and Microscale Meteorology Laboratory NCAR: Boulder, CO, USA, 2019. [Google Scholar]
- Ooyama, K.V. A thermodynamic foundation for modeling the moist atmosphere. J. Atmos. Sci. 1990, 47, 2580–2593. [Google Scholar] [CrossRef]
- Laprise, R. The Euler equations of motion with hydrostatic pressure as an independent variable. Mon. Weather Rev. 1992, 120, 197–207. [Google Scholar] [CrossRef]
- Skamarock, W.C.; Klemp, J.B.; Dudhia, J. Prototypes for the WRF (Weather Research and Forecasting) model. Am. Meteorol. Soc. 2001, J11–J15, preprints. [Google Scholar]
- Bonekamp, P.N.J.; Collier, E.; Immerzeel, W.W. The impact of spatial resolution, land use, and spinup time on resolving spatial precipitation patterns in the Himalayas. J. Hydrometeorol. 2018, 19, 1565–1581. [Google Scholar] [CrossRef] [Green Version]
- Kleczek, M.A.; Steeneveld, G.-J.; Holtslag, A.A.M. Evaluation of the weather research and forecasting mesoscale model for GABLS3: Impact of boundary-layer schemes, boundary conditions and spin-up. Bound.-Layer Meteorol. 2014, 152, 213–243. [Google Scholar] [CrossRef]
- Liu, Y.; Chen, Y.; Lu, Z.; WANG, J.; Chen, C.-N.; Rico-Ramirez, M.A.; Han, D. Optimal spin-up time exploration of the WRF model by using various hydrometeor species as the initial conditions. Agu Fall Meet. Abstr. 2020, 2020, A183-0007. Available online: https://ui.adsabs.harvard.edu/abs/2020AGUFMA183.0007L (accessed on 23 January 2023).
- Wang, S.; Huang, S.; Li, Y. Sensitive numerical simulation and analysis of rainstorm using nested WRF model. J. Hydrodyn. 2006, 18, 578–586. [Google Scholar] [CrossRef]
- Jee, J.B.; Kim, S. Sensitivity Study on High-Resolution WRF Precipitation Forecast for a Heavy Rainfall Event. Atmosphere 2017, 8, 96. [Google Scholar] [CrossRef] [Green Version]
- Wang, W.; Gill, D. WRF nesting. In WRF Tutorial; NCAR: Boulder, CO, USA, 2012. [Google Scholar]
- Emmanouil, G.; Vlachogiannis, D.; Sfetsos, A. Exploring the ability of the WRF-ARW atmospheric model to simulate different meteorological conditions in Greece. Atmos. Res. 2021, 247, 105226. [Google Scholar] [CrossRef]
- Castorina, G.; Caccamo, M.T.; Magazù, S. Study of convective motions and analysis of the impact of physical parametrization on the WRF-ARW forecast model. Atti Della Accad. Peloritana 2019, 97, A19. [Google Scholar]
- Castorina, G.; Caccamo, M.T.; Colombo, F.; Magazù, S. The Role of Physical Parameterizations on the Numerical Weather Prediction: Impact of Different Cumulus Schemes on Weather Forecasting on Complex Orographic Areas. Atmosphere 2021, 12, 616. [Google Scholar] [CrossRef]
- Castorina, G.; Caccamo, M.T.; Magazù, S.; Restuccia, L. Multiscale mathematical and physical model for the study of nucleation processes in meteorology. Atti Della Accad. Peloritana 2018, 96, A6. [Google Scholar]
- Castorina, G.; Caccamo, M.T.; Insinga, V.; Magazù, S.; Munaò, G.; Ortega, C.; Semprebello, A.; Rizza, U. Impact of the Different Grid Resolutions of the WRF Model for the Forecasting of the Flood Event of 15 July 2020 in Palermo (Italy). Atmosphere 2022, 13, 1717. [Google Scholar] [CrossRef]
- Iacono, M.J.; Delamere, J.S.; Mlawer, E.J.; Shephard, M.W.; Clough, S.A.; Collins, W.D. Radiative forcing by long-lived greenhouse gases: Calculations with the AER radiative transfer models. J. Geophys. Res. Atmos. 2008, 113, D13103. [Google Scholar] [CrossRef]
- Janjić, Z.I. The Step-Mountain Eta Coordinate Model: Further Developments of the Convection, Viscous Sublayer, and Turbulence Closure Schemes. Mon. Weather Rev. 1994, 122, 927–945. [Google Scholar] [CrossRef]
- Mesinger, F. Forecasting upper tropospheric turbulence within the framework of the Mellor-Yamada 2.5 closure. In Research Activities in Atmospheric and Oceanic Modelling; CAS/JSC WGNE Rep. No. 18; WMO: Geneva, Switzerland, 1993; pp. 4.28–4.29. [Google Scholar]
- Mukul Tewari, N.; Tewari, M.; Chen, F.; Wang, W.; Dudhia, J.; LeMone, M.; Mitchell, K.; Ek, M.; Gayno, G.; Wegiel, J.; et al. Implementation and verification of the unified NOAH land surface model in the WRF model. In Proceedings of the 20th Conference on Weather Analysis and Forecasting/16th Conference on Numerical Weather Prediction, Seattle, WA, USA, 10 January 2004; pp. 11–15. [Google Scholar]
- Thompson, G.; Field, P.R.; Rasmussen, R.M.; Hall, W.D. Explicit Forecasts of Winter Precipitation Using an Improved Bulk Microphysics Scheme. Part II: Implementation of a New Snow Parameterization. Mon. Weather Rev. 2008, 136, 5095–5115. [Google Scholar] [CrossRef]
- Kain, J.S. The Kain-Fritsch Convective Parameterization: An Update. J. Appl. Meteorol. 2004, 43, 170–181. [Google Scholar] [CrossRef]
- Villalba-Pradas, A.; Tapiador, F.J. Empirical values and assumptions in the convection schemes of numerical models. Geosci. Model Dev. 2022, 15, 3447–3518. [Google Scholar] [CrossRef]
- Somses, S.; Bopape, M.J.M.; Ndarana, T.; Fridlind, A.; Matsui, T.; Phaduli, E.; Limbo, A.; Maikhudumu, S.; Maisha, R.; Rakate, E. Convection Parametrization and Multi-Nesting Dependence of a Heavy Rainfall Event over Namibia with Weather Research and Forecasting (WRF) Model. Climate 2020, 8, 112. [Google Scholar] [CrossRef]
- Use of four-dimensional data assimilation in a limited-area mesoscale model Part II: Effects of data assimilation within the planetary boundary layer. Mon. Weather. Rev. 1991, 119, 734–754. [CrossRef]
- WRF Sensitivity Analysis in Wind and Temperature Fields Simulation for the Northern Sahara and the Mediterranean Basin. Atmosphere 2020, 11, 259. [CrossRef] [Green Version]
- Four dimensional data assimilation (FDDA) impacts on WRF performance in simulating inversion layer structure and distributions of CMAQ-simulated winter ozone concentrations in Uintah Basin. Atmos. Environ. 2018, 177, 75–92. [CrossRef]
- Hersbach, H.; Bell, B.; Berrisford, P.; Horányi, A.; Sabater, J.M.; Nicolas, J.; Radu, R.; Schepers, D.; Simmons, A.; Soci, C.; et al. Global reanalysis: Goodbye ERA-Interim, hello ERA5. ECMWF Newsl. 2019, 159, 17–24. [Google Scholar]
- Caccamo, M.T.; Castorina, G.; Catalano, F.; Magazù, S. Rüchardt’s experiment treated by Fourier transform. Eur. J. Phys. 2019, 40, 025703. [Google Scholar] [CrossRef]
- Castorina, G.; Caccamo, M.T.; Magazù, S. A new approach to the adiabatic piston problem through the arduino board and innovative frequency analysis procedures. In New Trends in Physics Education Research; Magazù, S., Ed.; Nova Science Publishers: Hauppauge, NY, USA, 2018; pp. 133–156. [Google Scholar]


| Namelist Variable | 9 km domain | 3 km domain | |
|---|---|---|---|
| Long-wave Radiation | ra_lw_physics | RRTMG [58] | RRTMG [58] |
| Short-wave Radiation | ra_sw_physics | RRTMG [58] | RRTMG [58] |
| PBL Model | bl_pbl_physics | MYJ [59,60] | MYJ [59,60] |
| Land–Surface | sf_surface_physics | NLSM [61] | NLSM [61] |
| Microphysics | mp_physics | Thompson [62] | Thompson [62] |
| Cumulus | cu_physics | Kain–Fritsch [63] | Explicit [64,65] |
| Stations | Observed | WRF—No FDDA |
|---|---|---|
| Erice (TP) | 30.8 | 29.6 |
| Trapani Fulgatore (TP) | 36.6 | 39.1 |
| Lascari (PA) | 24.0 | 19.3 |
| Mezzojuso (PA) | 37.4 | 37.6 |
| Termini Imerese (PA) | 29.2 | 25.6 |
| Caronia Pomiere (ME) | 115.4 | 104.1 |
| Cesarò Vignazza (ME) | 101.8 | 151.3 |
| Montalbano Elicona (ME) | 86.6 | 141.2 |
| Pettineo (ME) | 47.6 | 33.7 |
| Bronte (CT) | 108.4 | 109.9 |
| Linguaglossa North Etna (CT) | 293.6 | 328.3 |
| Mazzarrone (CT) | 90.4 | 95.3 |
| Paternò (CT) | 89.2 | 120.6 |
| Agira (EN) | 101.6 | 81.2 |
| Enna (EN) | 67.8 | 67.4 |
| Augusta (SR) | 60.4 | 128.4 |
| Palazzolo Acreide (SR) | 69.8 | 154.8 |
| Siracusa (SR) | 57.6 | 122.1 |
| Acate (RG) | 82.4 | 100.6 |
| Comiso (RG) | 82.2 | 83.9 |
| Modica (RG) | 82.2 | 137.5 |
| Santa Croce Camerina (RG) | 87.4 | 102.9 |
| Gela (CL) | 114.4 | 97.2 |
| Butera (CL) | 102.2 | 91.3 |
| Agrigento Mandrascava (AG) | 78.6 | 83.5 |
| Licata (AG) | 95.6 | 84.4 |
| Sciacca (AG) | 50.8 | 57.9 |
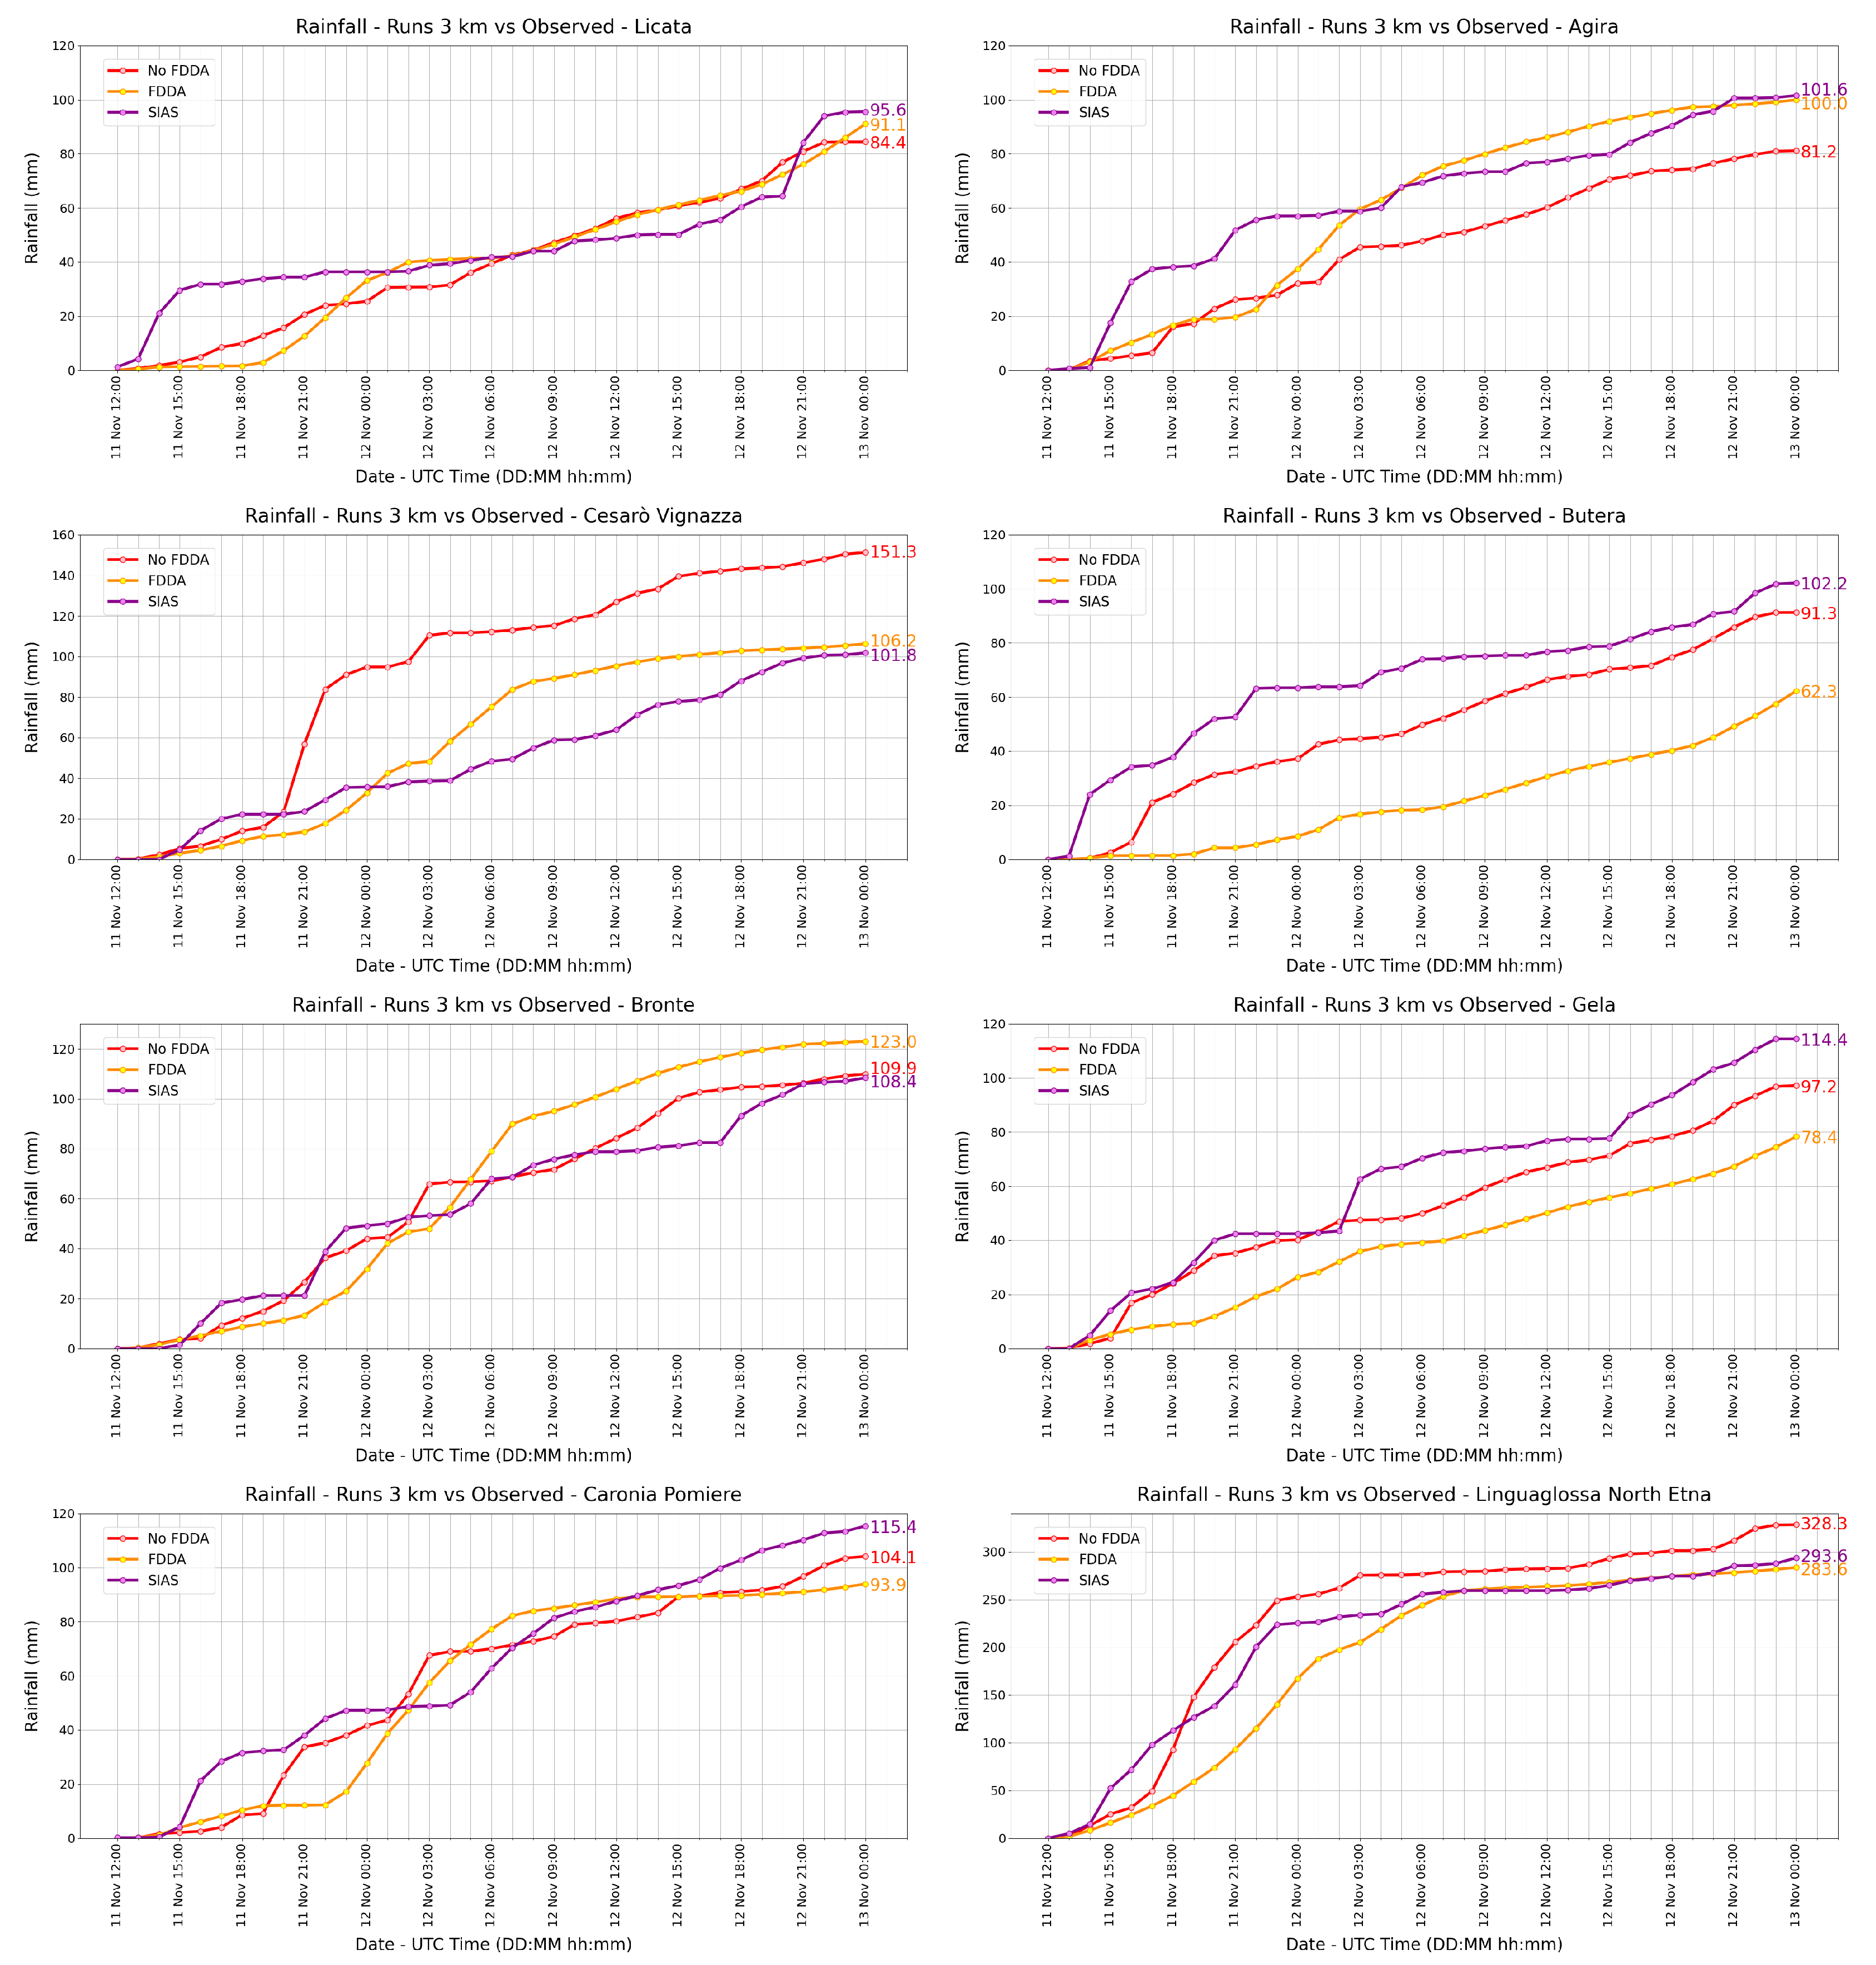
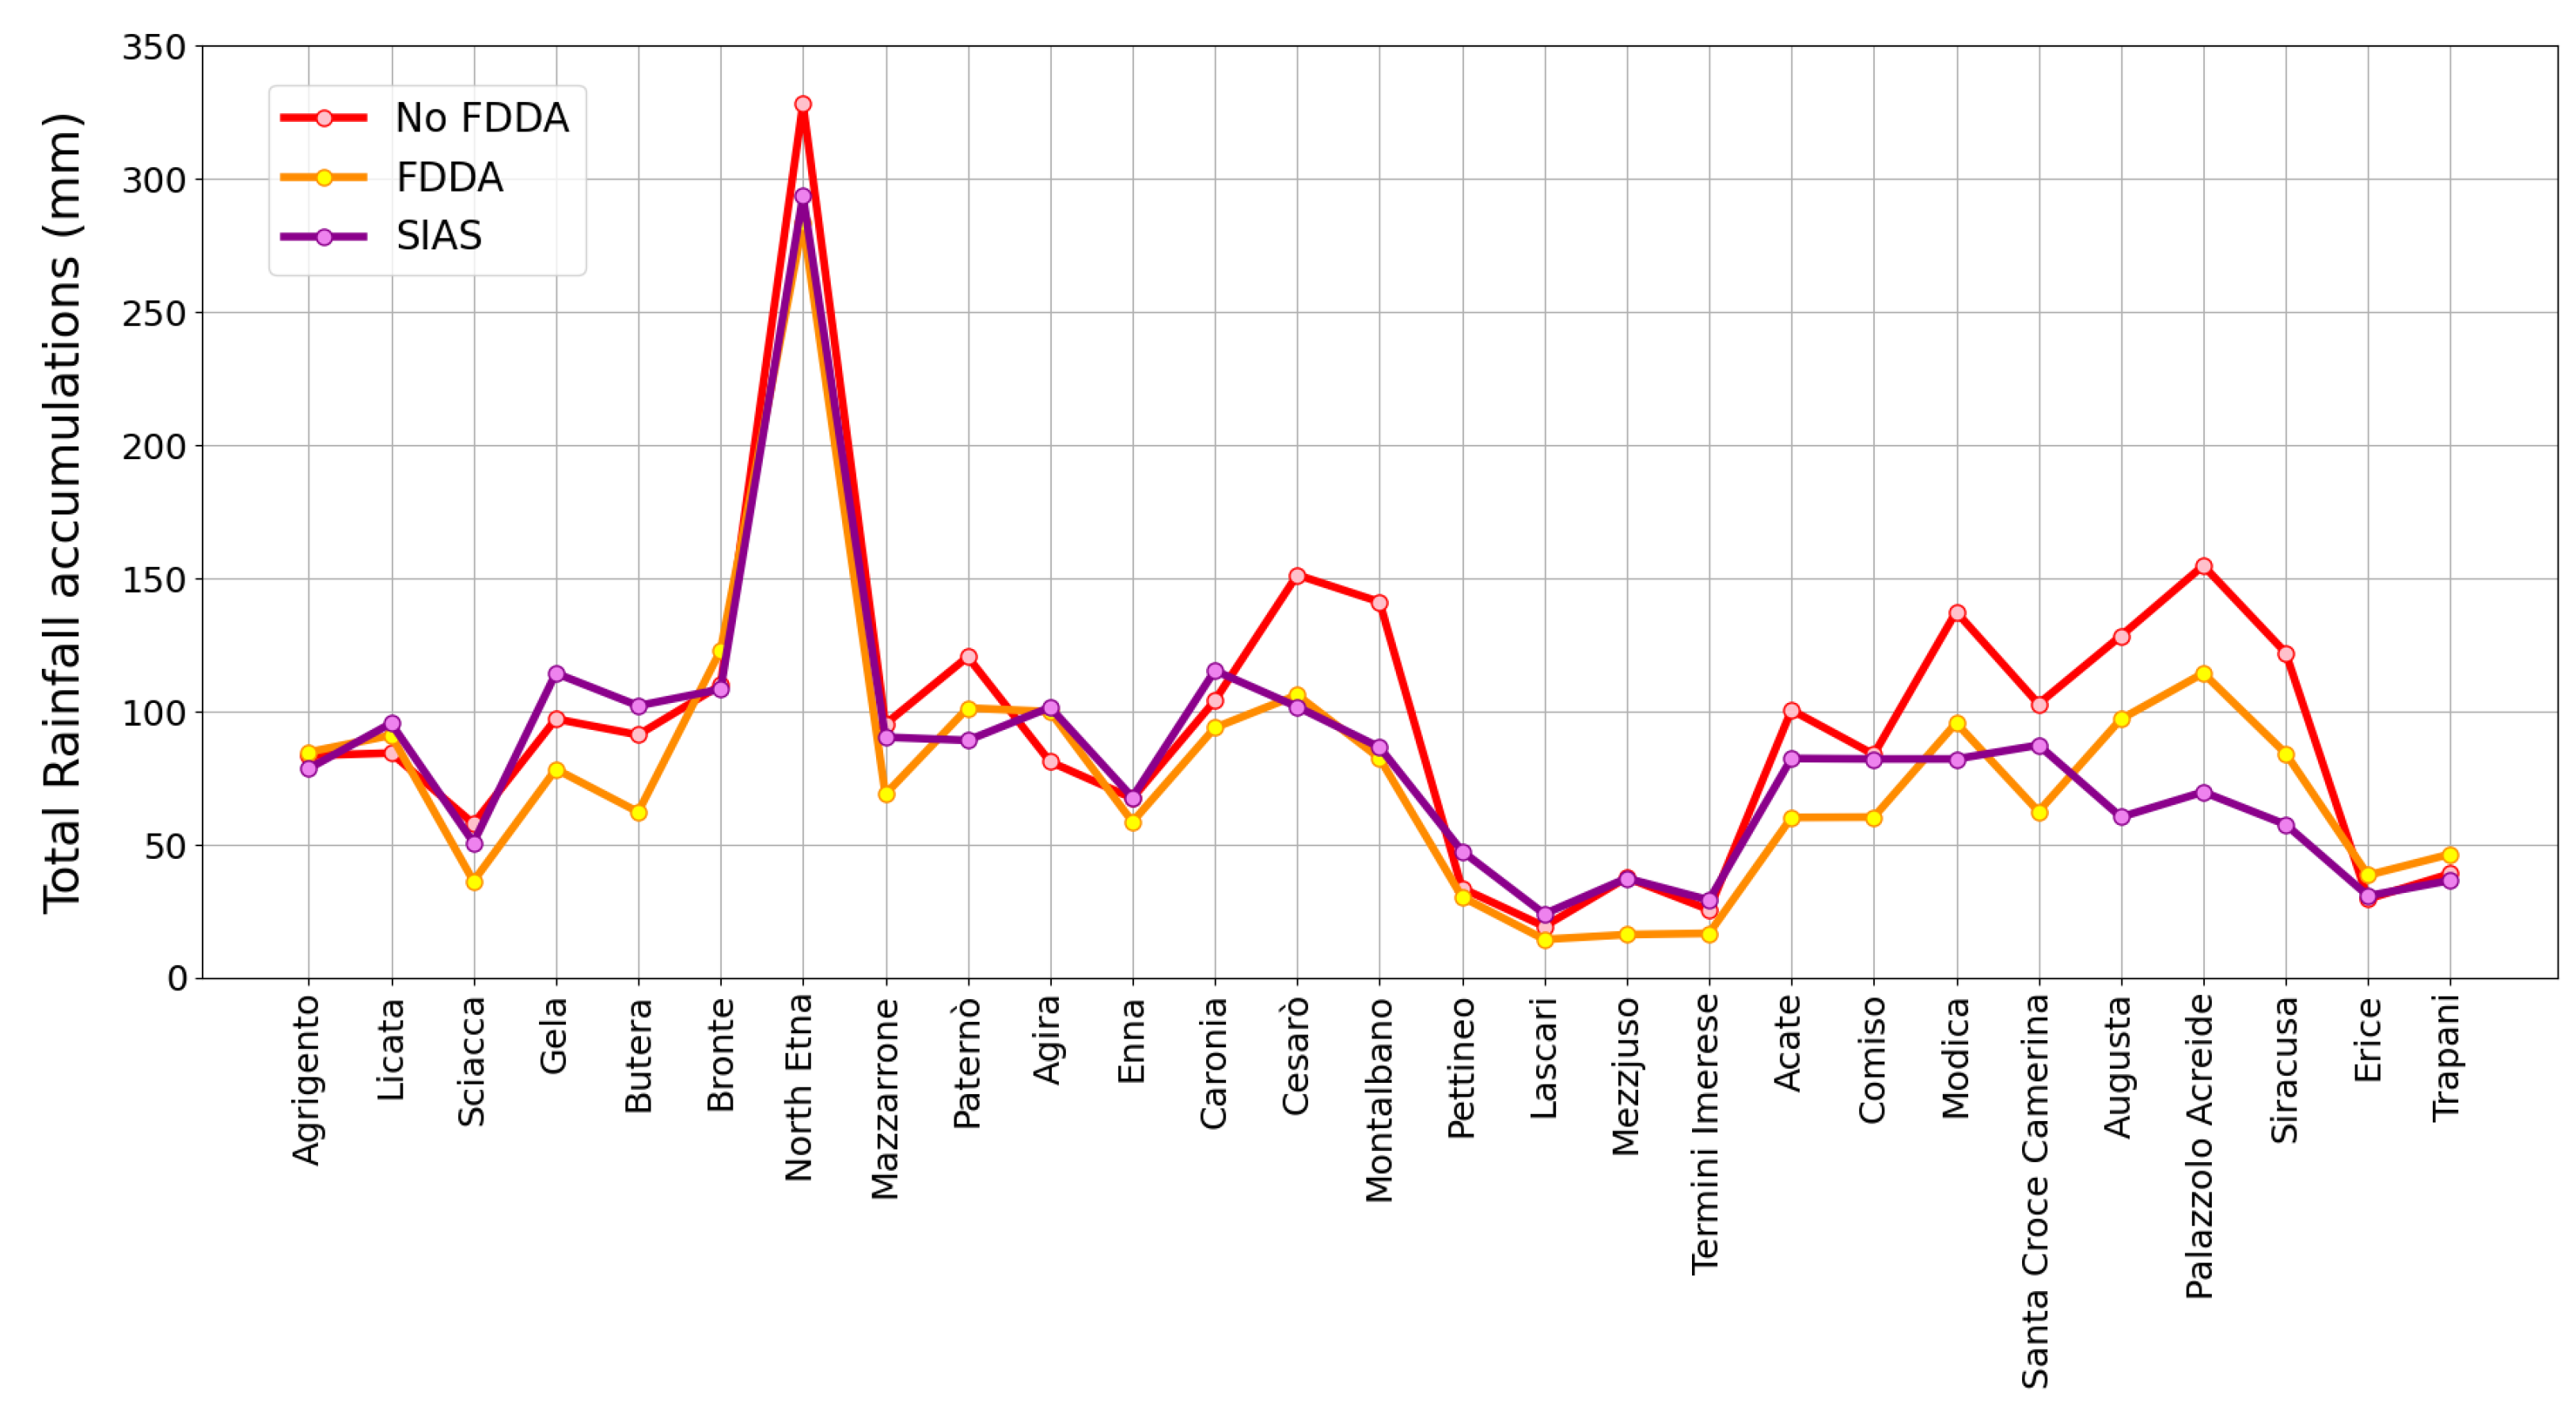
| Stations | Observed | WRF—No FDDA | WRF—FDDA |
|---|---|---|---|
| Erice (TP) | 30.8 | 29.6 | 38.6 |
| Trapani Fulgatore (TP) | 36.6 | 39.1 | 46.5 |
| Lascari (PA) | 24.0 | 19.3 | 14.4 |
| Mezzojuso (PA) | 37.4 | 37.6 | 16.2 |
| Termini Imerese (PA) | 29.2 | 25.6 | 16.7 |
| Caronia Pomiere (ME) | 115.4 | 104.1 | 93.9 |
| Cesarò Vignazza (ME) | 101.8 | 151.3 | 106.2 |
| Montalbano Elicona (ME) | 86.6 | 141.2 | 82.5 |
| Pettineo (ME) | 47.6 | 33.7 | 30.4 |
| Bronte (CT) | 108.4 | 109.9 | 123.0 |
| Linguaglossa North Etna (CT) | 293.6 | 328.3 | 283.5 |
| Mazzarrone (CT) | 90.4 | 95.3 | 68.9 |
| Paternò (CT) | 89.2 | 120.6 | 101.3 |
| Agira (EN) | 101.6 | 81.2 | 100.0 |
| Enna (EN) | 67.8 | 67.4 | 58.4 |
| Augusta (SR) | 60.4 | 128.4 | 97.2 |
| Palazzolo Acreide (SR) | 69.8 | 154.8 | 114.4 |
| Siracusa (SR) | 57.6 | 122.1 | 84.3 |
| Acate (RG) | 82.4 | 100.6 | 60.2 |
| Comiso (RG) | 82.2 | 83.9 | 60.4 |
| Modica (RG) | 82.2 | 137.5 | 95.7 |
| Santa Croce Camerina (RG) | 87.4 | 102.9 | 62.5 |
| Gela (CL) | 114.4 | 97.2 | 78.4 |
| Butera (CL) | 102.2 | 91.3 | 62.3 |
| Agrigento Mandrascava (AG) | 78.6 | 83.5 | 84.8 |
| Licata (AG) | 95.6 | 84.4 | 91.1 |
| Sciacca (AG) | 50.8 | 57.9 | 36.3 |
Disclaimer/Publisher’s Note: The statements, opinions and data contained in all publications are solely those of the individual author(s) and contributor(s) and not of MDPI and/or the editor(s). MDPI and/or the editor(s) disclaim responsibility for any injury to people or property resulting from any ideas, methods, instructions or products referred to in the content. |
© 2023 by the authors. Licensee MDPI, Basel, Switzerland. This article is an open access article distributed under the terms and conditions of the Creative Commons Attribution (CC BY) license (https://creativecommons.org/licenses/by/4.0/).
Share and Cite
Castorina, G.; Semprebello, A.; Insinga, V.; Italiano, F.; Caccamo, M.T.; Magazù, S.; Morichetti, M.; Rizza, U. Performance of the WRF Model for the Forecasting of the V-Shaped Storm Recorded on 11–12 November 2019 in the Eastern Sicily. Atmosphere 2023, 14, 390. https://doi.org/10.3390/atmos14020390
Castorina G, Semprebello A, Insinga V, Italiano F, Caccamo MT, Magazù S, Morichetti M, Rizza U. Performance of the WRF Model for the Forecasting of the V-Shaped Storm Recorded on 11–12 November 2019 in the Eastern Sicily. Atmosphere. 2023; 14(2):390. https://doi.org/10.3390/atmos14020390
Chicago/Turabian StyleCastorina, Giuseppe, Agostino Semprebello, Vincenzo Insinga, Francesco Italiano, Maria Teresa Caccamo, Salvatore Magazù, Mauro Morichetti, and Umberto Rizza. 2023. "Performance of the WRF Model for the Forecasting of the V-Shaped Storm Recorded on 11–12 November 2019 in the Eastern Sicily" Atmosphere 14, no. 2: 390. https://doi.org/10.3390/atmos14020390