Article

Study on the Peak Factor of the Wind-Induced Response of Super-High-Rise Buildings

1
School of Civil Engineering, Henan Polytechnic University, Jiaozuo 454000, China
2
School of Civil Engineering, Wuhan University, Wuhan 430072, China
*
Author to whom correspondence should be addressed.
Atmosphere 2023, 14(2), 379; https://doi.org/10.3390/atmos14020379
Submission received: 10 January 2023 / Revised: 8 February 2023 / Accepted: 13 February 2023 / Published: 15 February 2023
(This article belongs to the Special Issue Advances in Computational Wind Engineering and Wind Energy)

Abstract

:
The wind-induced responses of tall buildings are stochastic processes, and the peak factor is an important parameter to evaluate the extreme value of the wind-induced response in wind-resistant design. The existing research on the peak factor mainly focuses on the wind pressure on the building surface, but rarely concerns the wind-induced response peak factor of the structures. In view of this, the peak factor of the wind-induced response of super-high-rise buildings was studied in this paper. Firstly, a series of wind tunnel tests of the multi-degree-of-freedom aero-elastic models (MDOF) were carried out, wherein the along-wind and cross-wind responses were measured. Thereafter, the peak factor of wind-induced response was calculated using the peak factor method, classical extreme value theory, and the improved peak factor method. It was found that the peak factor calculated by the improved peak factor method is in good agreement with classical extreme value theory, which indicates that the improved peak factor method is applicable to calculate the peak factor of the wind-induced response of high-rise buildings. The results calculated using the improved peak factor method show that the peak factor of cross-wind response varies significantly with the wind speed, varying from about 2.5 to 5.5. The peak factor of cross-wind response first increases and then decreases with the increase in the wind speed, reaches the minimum near the critical wind speed of vortex-induced vibration (VIV), and increases again when the wind speed is larger than the VIV wind speed. Finally, an empirical formula for the cross-wind response peak factor was proposed as a function of the reduced wind speed, aspect ratio, and damping ratio of the structure.

1. Introduction

As is well known, the wind pressure and wind-induced responses of tall buildings are stochastic processes, and the peak factor is an important parameter to evaluate the extreme wind load and wind-induced response in wind-resistant design. Therefore, it is of great engineering significance to study the peak factor of these stochastic processes. Many researchers have studied the peak factor of wind pressure. As early as the 1960s, Davenport [1] established the peak factor method based on the Gaussian hypothesis, which has attracted wide attention. Thereafter, many research works indicated that the wind pressure in some areas of the building surface presents obvious non-Gaussian characteristics, and the peak factor of wind pressure calculated by the Gaussian hypothesis will be much smaller than the actual result [2,3,4,5,6], which led to the proposal of calculation methods to evaluate the non-Gaussian fluctuating wind pressure. Kareem et al. [6] established the corresponding relationship between non-Gaussian random variables and Gaussian random variables using the moment-based Hermite transformation model and proposed an improved peak factor method. Kwon and Kareem [7] compared the peak factors calculated by the Davenport method and the non-Gaussian Hermite method and found that the Hermite method is more accurate to calculate the peak factor of non-Gaussian wind pressure of low-rise buildings. Winterstein et al. [8] proposed a method to convert non-Gaussian processes into Gaussian processes by Hermite series approximations. Tognarelli et al. [9] and Winterstein et al. [10] proposed an improved Hermite series method based on the Hermite series method. Peng et al. [11] proposed an analytical formula to express the correlation relationship between Gaussian and non-Gaussian processes on the basis of the Hermite polynomial model. Huang et al. [12,13] proposed the translated-peak-process method, suitable for all non-Gaussian processes. Sadek et al. [14] put forward the extreme value calculation method of the non-Gaussian process based on the zero crossing theory. Quan et al. [15] put forward a calculation method of wind pressure peak factor that is suitable for short time history on the basis of generalized extreme value theory. Huang et al. [16] proposed an empirical method of wind pressure peak factor based on Hermite polynomials.
At present, the peak factor of wind-induced response under different wind speeds is usually regarded as a constant in the wind-resistant design of real tall buildings. However, many wind tunnel tests and full-scale measurements found that the peak factor of wind-induced response varies greatly under different wind speeds. According to the research results on the wind response of flexible structures [17,18,19,20,21], the peak factor of cross-wind response is significantly different under different reduced wind speeds, and usually reaches the minimum value near the critical wind speed of VIV.
Unfortunately, the existing research on the peak factor mainly focuses on the wind pressure on the building surface, but rarely concerns the wind-induced response peak factor of the structures. Therefore, whether the calculation method of the wind pressure peak factor is applicable to the calculation of the wind-induced response peak factor is worth studying, as is how to choose the value of wind-induced response peak factor in wind-resistant design. In view of this, this study carried out a series of multi-degree-of-freedom aero-elastic model wind tunnel tests to preliminarily study the peak factor of the wind-induced response of super high-rise buildings. Firstly, wind tunnel tests of multi-degree-of-freedom aero-elastic models (MDOF) were carried out, wherein the along-wind and cross-wind responses of the MDOF model were measured. Thereafter, the peak factor of wind-induced response was calculated using the peak factor method, classical extreme value theory, and the improved peak factor method. Finally, an empirical formula for the cross-wind response peak factor was proposed as a function of the reduced wind speed, aspect ratio, and damping ratio of the structure.

2. Wind Tunnel Test of Aero-Elastic Model

2.1. Design of MDOF Model Skeleton

Three types of MDOF aero-elastic models were installed in the wind tunnel, having a square prism section with aspect ratios of 10, 13, and 16, respectively. The aero-elastic models were fabricated as six-lumped-mass systems to simulate super-high-rise buildings of 600 m, 780 m, and 900 m, respectively. The skeleton of the MDOF models consisted of aluminum columns and rigid plates. Striking a balance between blockage ratio requirements and easy operation, a length scale of 1:600 was adopted for the three models (Table 1).
The MDOF model skeleton is composed of six rigid plates and five elastic columns. The thick central column is a standard square column (Figure 1a,e), and four thin specially shaped columns at each side can be moved horizontally to adjust the mode shape and stiffness (Figure 1b,g). In this way, the sway frequency and torsion frequency—including the sway mass and moment of inertia, as well as the sway stiffness and rotational stiffness—can be adjusted easily to meet the requirements of a similar ratio at the same time. The skeleton is made of aluminum alloy-6061. The rigid plate is a specially shaped plate with a thickness of 10 mm (see Figure 1c,f). In order to control the moving accuracy of the thin columns, several positioning convex blocks were fitted into the rigid plate; after that, fixtures made of organic glass were used to connect the columns and rigid plates. In addition, these convex blocks can fit snugly into the holes of four thin columns. Several vertical and horizontal screw holes on the rigid plates can be used to fix the additional mass of blocks and the outer-skin plate, respectively. The bottom plate is shown in Figure 1d. There are five square holes in the bottom plate. The intermediate thick column and the surrounding thin column can be inserted into these holes snugly, and bolts can then fasten the columns and the bottom plate together. The segmented outer-skin plate can then be placed on the model skeleton to simulate the body shape of the structure after the model skeleton is completed (see Figure 1h).
The damping ratio of the model made by the above method is usually less than 1% and the minimum damping ratio is about 0.5%. The model damping can be increased by adding energy dissipation materials at the four corners of the model. The energy dissipation materials are light and flexible foam strips. As shown in Figure 1g, the rigid plate of each floor is square with chamfering angles, and there are six grooves on each foam strip. The strips were connected to rigid plates by chamfering angles and grooves. The damping can be simulated by changing the geometric size of the foam strips. The foam strip is so light and flexible that it does not affect the stiffness and mode shape of the MDOF model. After the MDOF model was completed, the natural frequency and damping ratio can be identified by free vibration tests and Fourier transform. More details about damping adjustment as well as the identification of natural frequency and mode shape can be referred to in the related study of the authors [22,23], which are not presented again here. The dynamic properties of each MDOF model are presented in Table 2. The Reynolds number of each case in Table 2 is about 2.0 × 10⁴~1.3 × 10⁵.
M = 0 H m ( z ) ϕ 2 ( z ) d z 0 H ϕ 2 ( z ) d z
S c = 2 M ξ s ρ a D 2
where m(z) and ϕ(z) are the mass per unit length and the mode shape of the model, respectively; H is the height of the models; and ξs, ρa, and D are the structural damping ratio, the air density, and the width of the model, respectively.

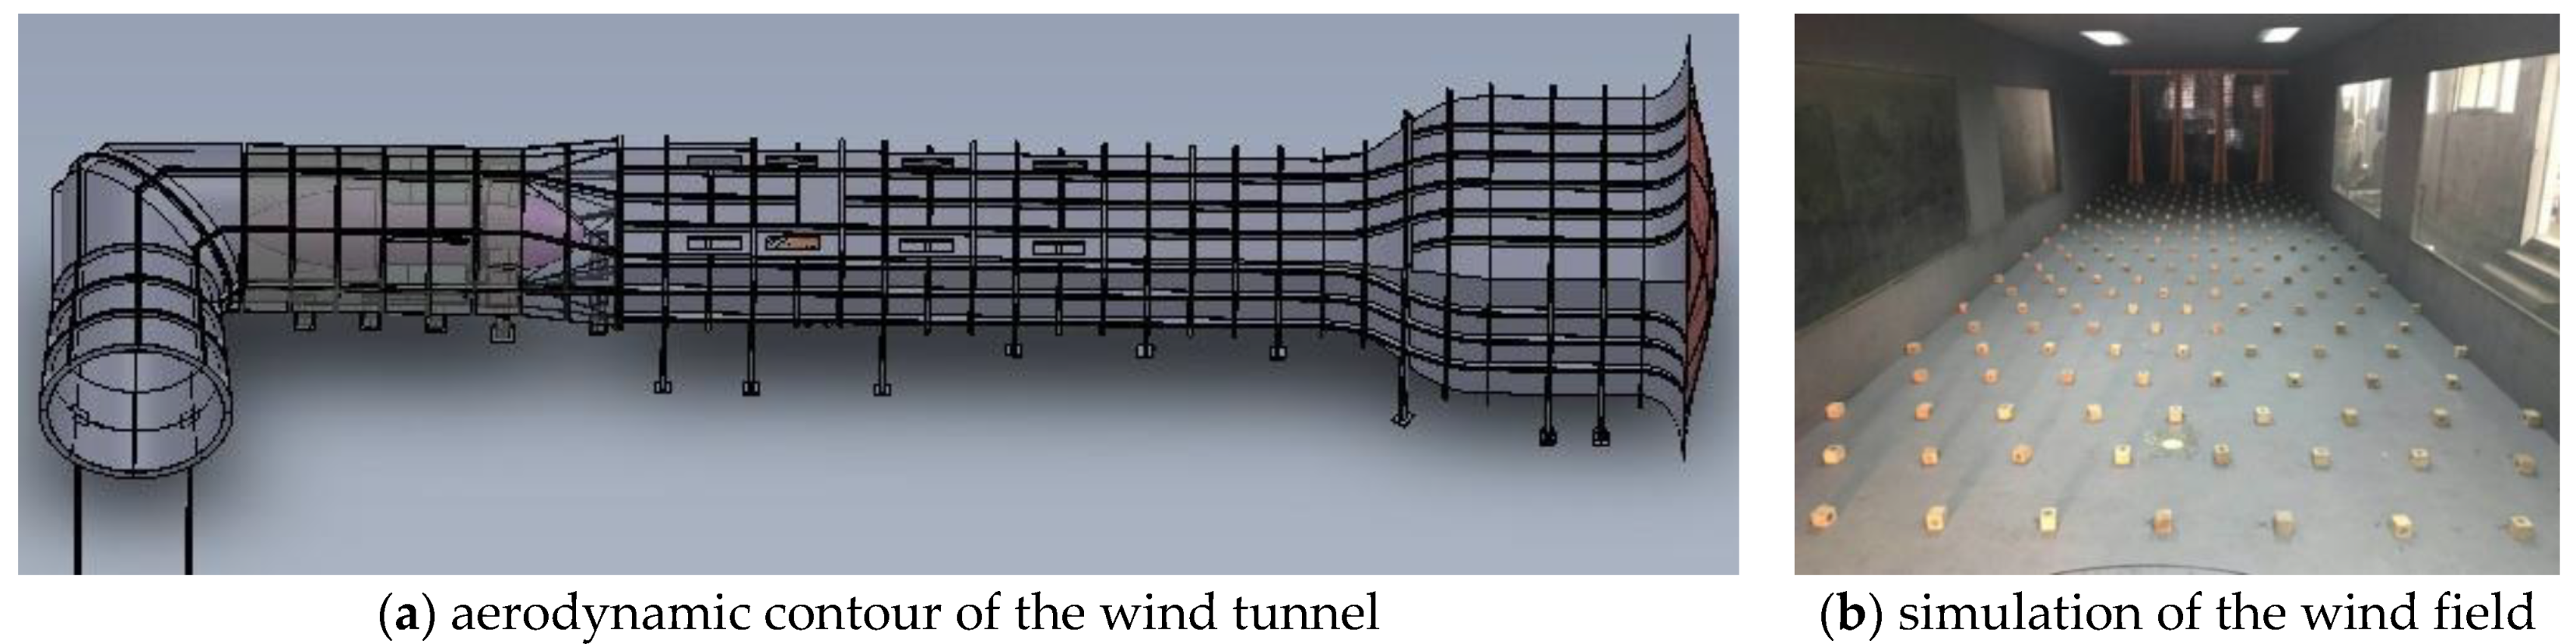
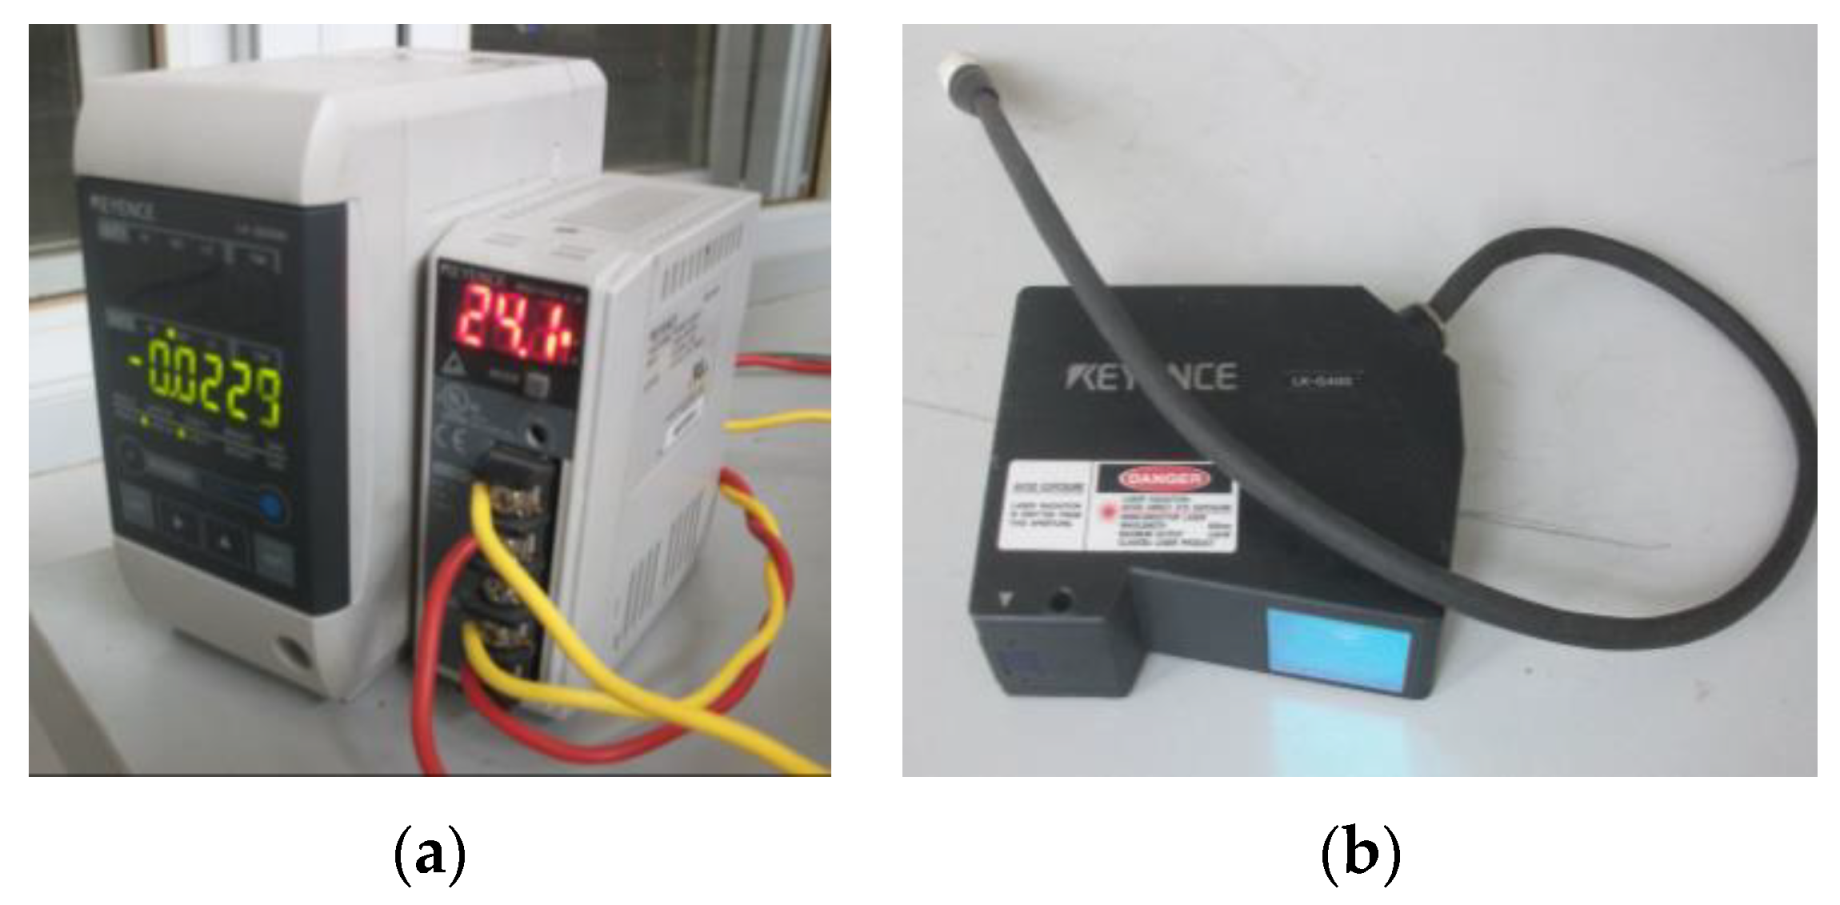
2.2. Wind Tunnel Test

The wind tunnel test was conducted in the boundary layer wind tunnel of Wuhan University, China. The cross section of the wind tunnel is 3.2 m wide × 2.1 m high. The wind speed in this wind tunnel can be continuously adjusted in the range of 0~30 m/s. The ground roughness was simulated using a set of spires and roughness elements upwind of the building model. The aerodynamic contour and simulated turbulent wind field of the wind tunnel are shown in Figure 2. The mean velocity profiles and turbulence intensity of the MDOF model are illustrated in Figure 3, where the power-law of 0.3 means the city center terrain category (terrain category D according to China’s Code 2012 [24]).
For all of the test cases of this study, the displacement response at the top of the models was measured by a laser displacement meter (see Figure 4); the sampling frequency was 500 Hz. Two laser displacement meters were used to measure the along-wind and cross-wind responses, respectively; the sampling time of test case 0 was about 2000 s for each test wind speed; and the sampling time of test case 1~16 was about 100 s for each test wind speed. The test wind speed at the top of the aero-elastic model is about 4~16 m/s for every test case.

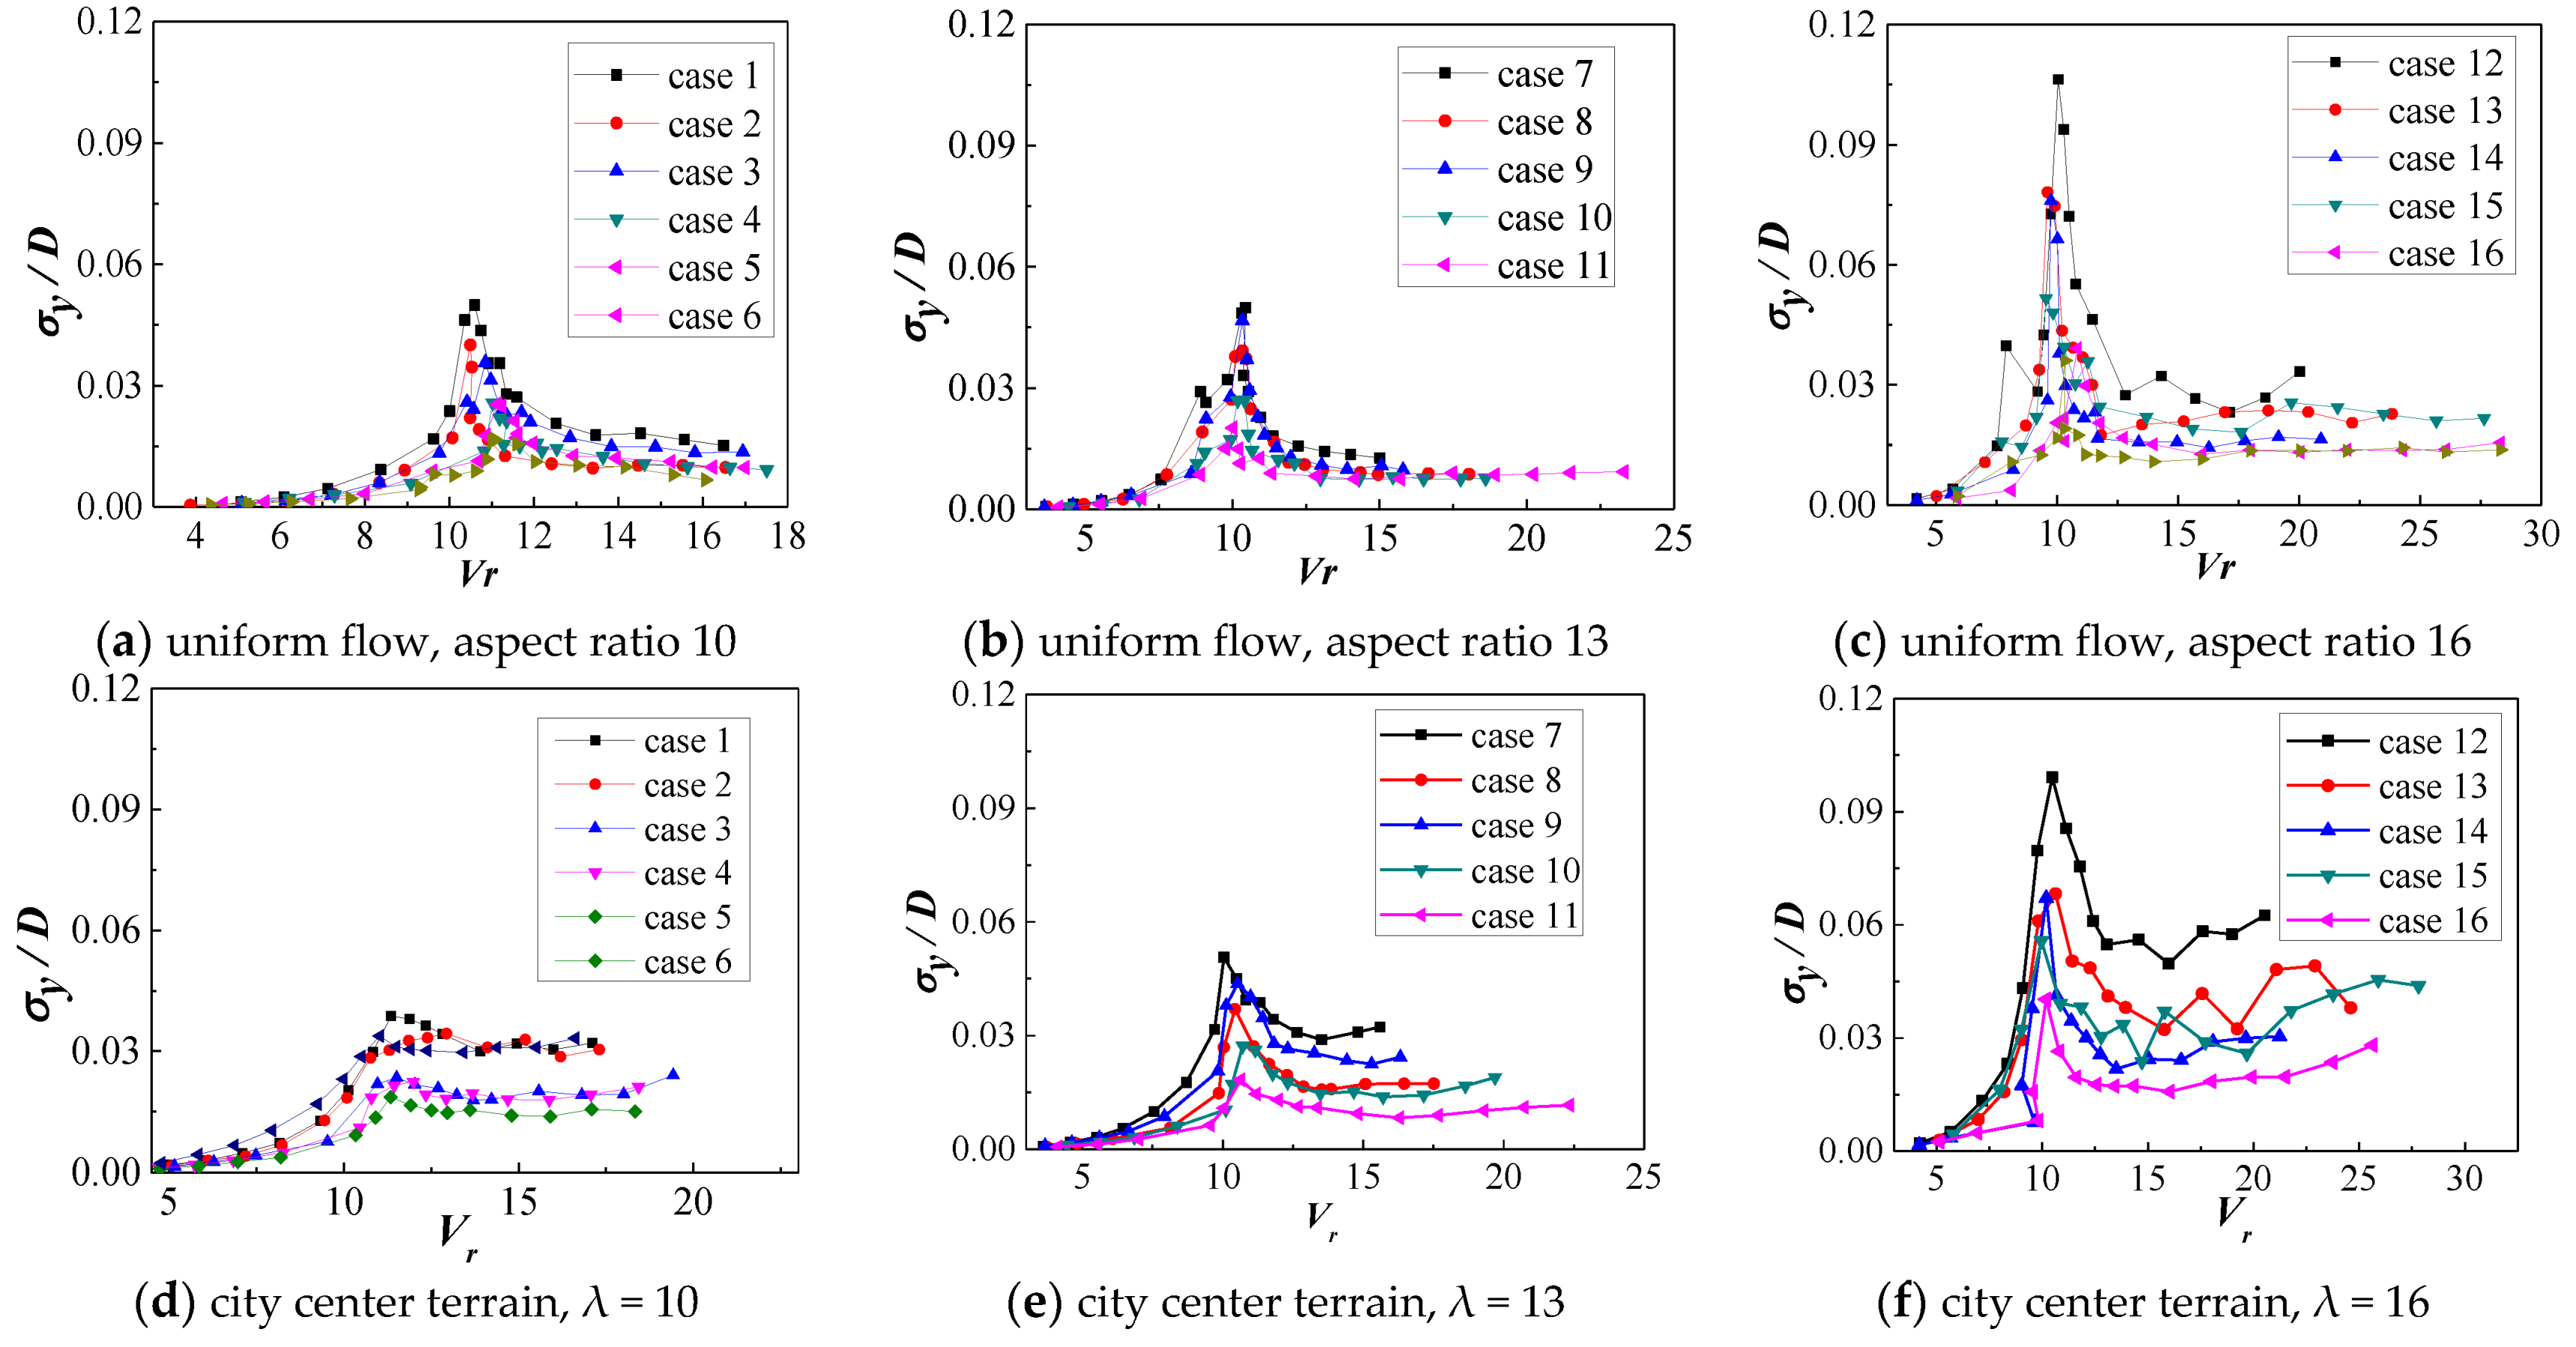
3. Wind-Induced Response of the Aero-Elastic Model

The root-mean-square (RMS) cross-wind responses of the aero-elastic model are shown in Figure 5. The reduced wind velocity Vr in Figure 5 is defined as follows:
V r = V n 1 D
where V, n1, and D denote mean wind speed, system vibration frequency of the first mode, and width of the model’s windward side, respectively.
Vortex-induced vibration has been found to be sensitive to the aspect ratio, mass density, and damping ratio of the structure. As seen from Figure 5, the wind-induced response of this study is consistent with the existing results. Figure 5 shows that the max displacement responses in both uniform smooth flow and shear turbulent flow occur at approximately the same reduced wind speed of VIV. Furthermore, the peak in uniform smooth flow is much sharper than that in turbulent flow. The smaller the Scruton number, the greater the VIV responses will be.
Taking the model with an aspect ratio of 10 in city center terrain as an example, Figure 6 shows the time history of cross-wind displacement at some wind speeds. As seen from Figure 6, the fluctuation characteristics of cross-wind response are quite different under different wind speeds. For example, the amplitude of the cross-wind response fluctuates significantly under small wind speed (Vr = 5.0), while the cross-wind response is relatively stable and presents harmonic characteristics to some extent when the incoming wind speed is close to the VIV wind speed (Vr = 10.76). Obviously, the above different fluctuation characteristics of response time history will lead to different peak factors, which will be studied below.

4. Calculation Method of the Peak Factor

4.1. Overview of the Calculation Method

In this paper, the classical extreme value theory and the improved peak factor method are used to calculate the peak factor of wind-induced response. These two methods are briefly introduced as follows.
(1)
Peak factor method
Peak factor method was established by Davenport based on the Gaussian hypothesis. According to this method, the extreme value can be expressed as follows:
X max = m x + g σ x
where mx and σx are the mean and standard deviation of a random sample, respectively, and g is the peak factor; its calculation formula is as follows:
g = 2 ln v T + γ ( 2 ln v T ) 2
where γ = 0.5772 is Euler’s constant, T is the observation time interval, and v is the crossing rate of zero value.
(2)
Improved peak factor method
Kareem et al. [6,7] expressed non-Gaussian random variables as Hermite polynomials of Gaussian variables and proposed a method for calculating the peak factors of non-Gaussian distribution.
According to the research result of Kareem, when the kurtosis coefficient is greater than 3, the calculation formula of peak factor g is as follows:
g = k [ g G + h 3 ( g G 2 1 ) + h 4 ( g G 3 3 g G ) ]
When the kurtosis coefficient is smaller than 3, the calculation formula of peak factor g is as follows:
g = 1 3 a 2 + 2 p 3 sinh ( 1 3 sinh 1 C )
where g G is the gauss peak factor and k, h3, h4, a2, P, and C in Equations (6) and (7) are the calculation coefficients dependent on skewness, kurtosis, and Hermite moment of the non-Gauss process. The meanings of these parameters can be found in the corresponding references for details [6,7].
(3)
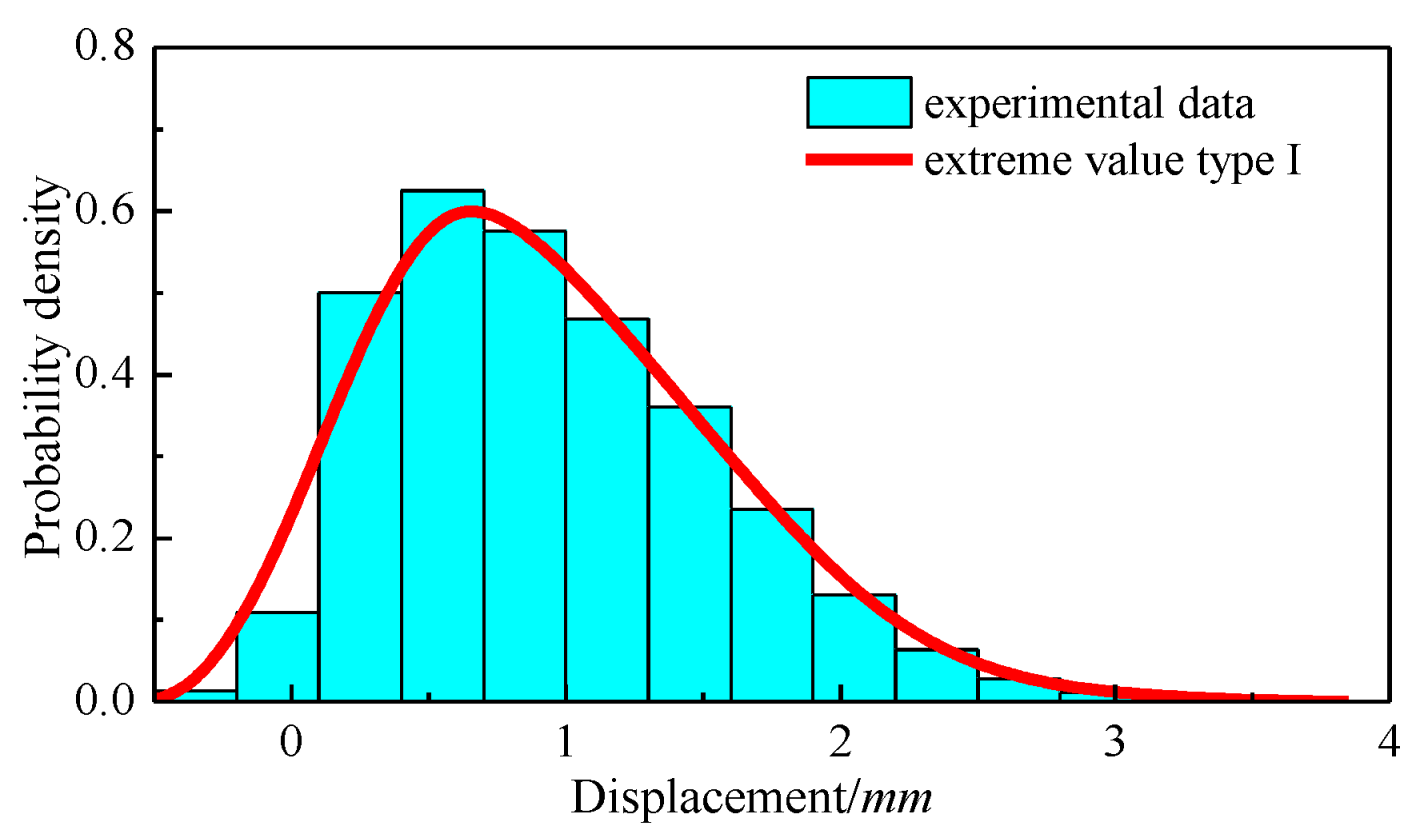
Classical extreme value theory and method
According to the classical extreme value theory, as long as there are enough independent extreme value samples, these samples must obey the extreme value distribution (including extreme values I, II, and III), no matter how the original random samples are distributed. According to this theory, the calculation steps of the peak factor are as follows: (1) obtaining the maximum or minimum value from original random samples to form the extreme value series; (2) fitting the extreme value series and establishing a corresponding probability distribution model; and (3) determining the extreme value with a certain guarantee probability, and calculating the peak factor according to the obtained extreme value.
The disadvantage of this method is that it requires too many data samples, which results in a very long test time in the wind tunnel. The expression of extreme value type I distribution probability density is as follows:
F ( x e ) = exp [ exp ( y ) ]
where y is a simplified variable, and its expression is as follows:
y = a ( x e u )
where the parameter u is the modulus, a is divergence, and xe is the expected value. y is usually written as follows:
y = ln { ln ( F ( x e ) ) }
x e = u + 1 a y
Thereby obtaining the expected value xe and standard deviation σe of the extreme value as follows:
x e = γ a + u
σ e = π 6 1 a

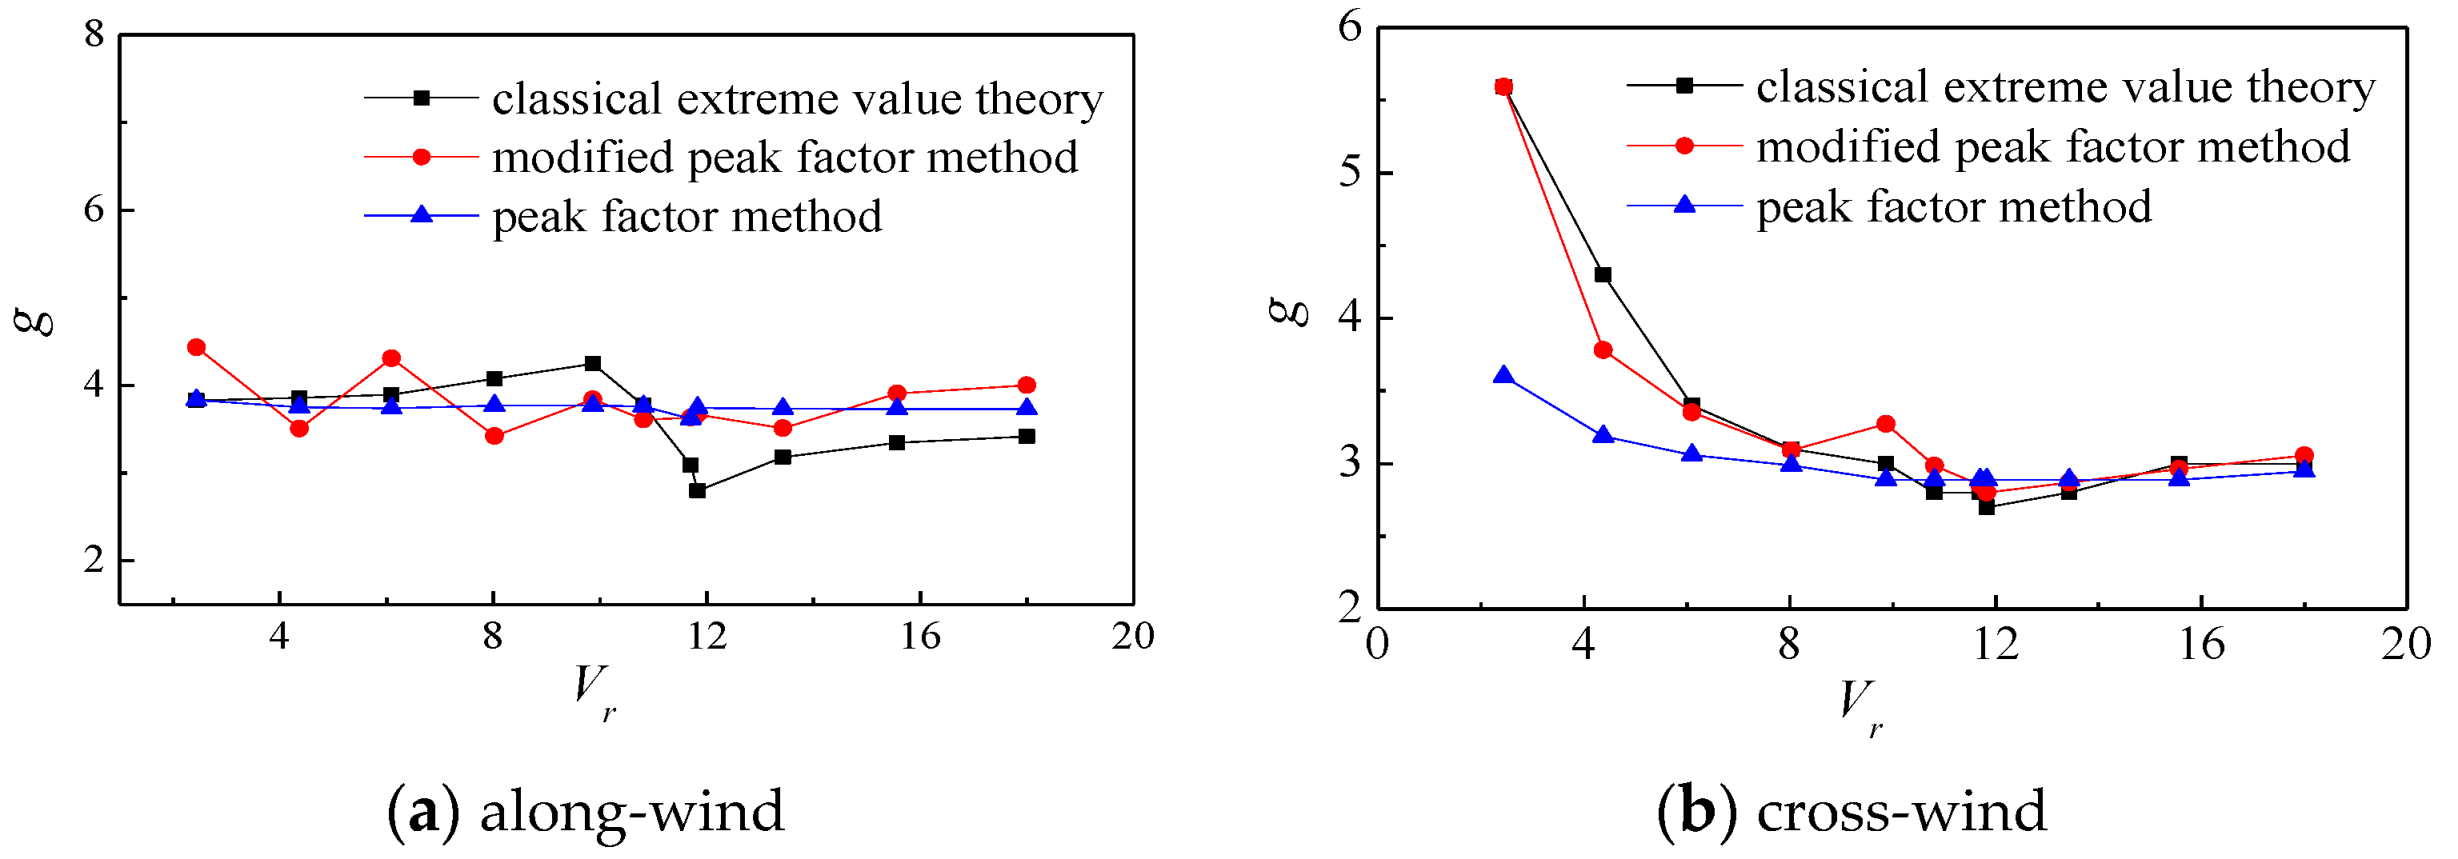
4.2. Comparison of the Calculation Results of the Two Methods

In order to verify the applicability of the improved peak factor method, it is necessary to compare the calculation results of the improved peak factor method and the classical extreme value theory. According to the classical extreme value theory, if the number of samples is large enough, the peak factor calculated by the classical extreme value theory is close to the real value. In this paper, the sampling time of each wind speed in each test case 0 is 2000 s, which is equivalent to an actual time of about 56 h. Its purpose is to obtain enough samples and then calculate the peak factor of each wind speed with the classical extreme value theory.
According to the classical extreme value theory, it is necessary to first verify whether the observed extreme value satisfies the extreme value distribution. Figure 7 shows the relationship between the observed extreme values and simplified variables of the test data, and Figure 8 shows the comparison between the probability density of extreme value type I and the probability density of displacement extreme value in the wind tunnel test. As seen from Figure 7 and Figure 8, the extreme value of wind-induced response is very consistent with the extreme value type I distribution. Therefore, the peak factor calculated by classical extreme value theory can be used to verify the applicability of other calculation methods.
Figure 9 shows the peak factors obtained by the above three calculation methods. It can be seen from Figure 9 that the cross-wind peak factor calculated by the peak factor method is much smaller than that calculated by classical extreme value theory, because the time history of wind-induced response is a non-Gaussian process, while the result of the improved peak factor method is close to that obtained by the classical extreme value theory.
Based on the above analysis, the improved peak factor method can be used to calculate the peak factor of the wind-induced response of tall buildings. The advantage of the improved method is that it does not need too long experiment time history, which greatly saves the experiment time in wind tunnel. This conclusion is helpful for the selection of the peak factor calculation method of wind-induced response.

5. Peak Factor Analysis of the Wind-Induced Response

5.1. Preliminary Analysis

In this chapter, the peak factor of each test case was calculated by the improved peak factor method, the calculated results are shown in Figure 10.
It can be seen from Figure 10 that the along-wind peak factor varies little with the wind speed. This is because the along-wind vibration is mainly determined by the random characteristics of the incoming flow. As the random characteristics of the incoming flow at different wind speeds are the same, the along-wind response peak factor is approximately a constant under the different wind speeds.
Figure 11 shows the peak factors of the cross-wind response calculated by the improved peak factor method. As seen from Figure 11, the peak factor of the cross-wind response changes significantly with the reduced wind speed, varying from about 2.5 to 5.5. The cross-wind peak factor shows a ‘V’-shaped change trend with the increase in the reduced wind speed, reaching the minimum value around the reduced wind speed of 10.5. The reason for this phenomenon is that the cross-wind vibration is significantly affected by the aero-elastic effect. The randomness of the response time history is significant when the wind speed is far from the VIV wind speed (see Figure 6a), which makes the peak factor at these wind speeds relatively large, and the wind-induced response shows some simple harmonic vibration characteristics when the wind speed is close to the VIV wind speed (see Figure 6b), which makes the peak factor in this wind speed range relatively small.
It is worth noting that, if a harmonic resonance occurs at the VIV wind speed, the peak factor must be close to 1.414. However, from the results of Figure 6 above, when the incoming wind speed is close to the VIV wind speed, the vibration time history is far from the harmonic curve, so it is an inevitable result that the peak factor at this time is significantly greater than 1.414. This non-ideal resonance phenomenon has been preliminarily studied in the related reference [20,25].

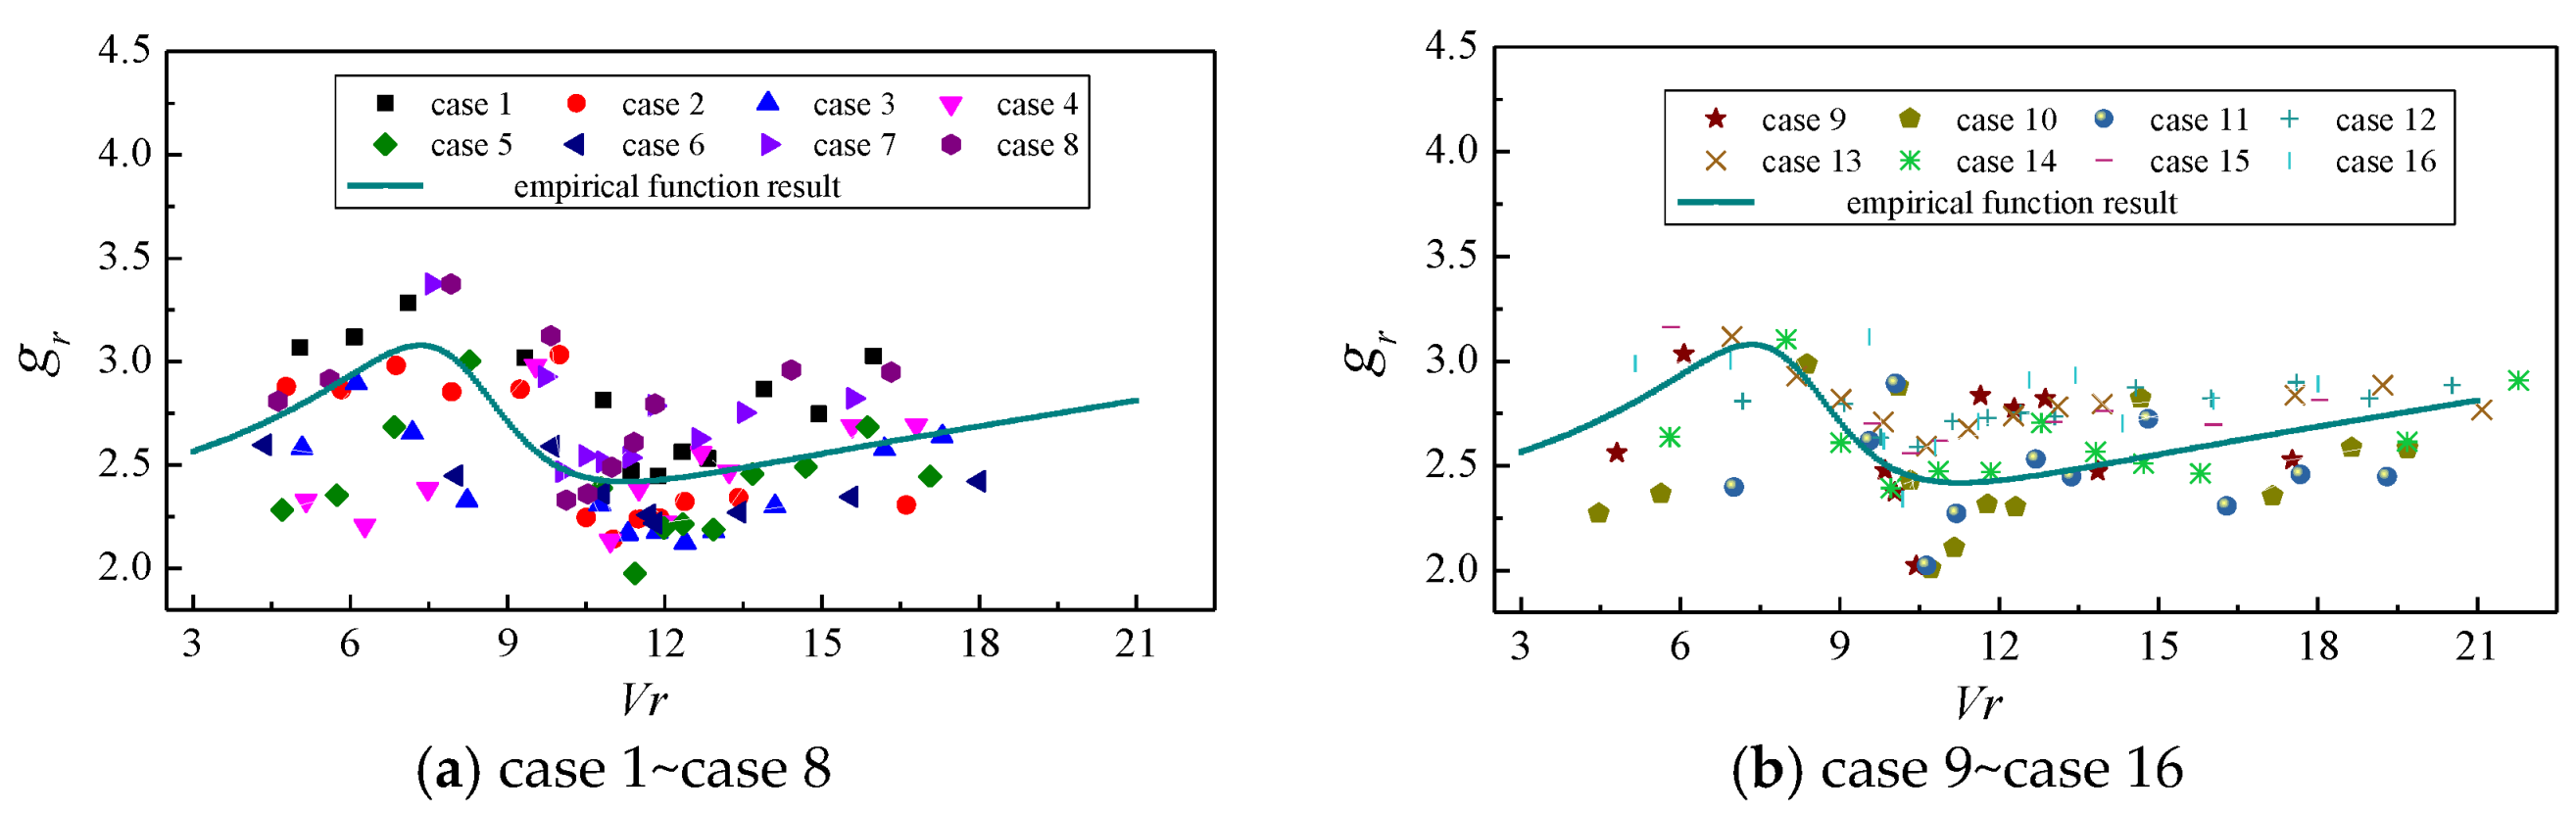
5.2. Empirical Formula

In Figure 12a, the structural parameters are the same for the three test cases, except for the structural damping ratio, so the difference in peak factors in these three test cases can be attributed to the influence of the damping ratio. It can be seen from Figure 12a that the peak factor of cross-wind response increases with the increase in the damping ratio. For example, when the damping ratio is 3.6% (test case 4), the peak factor is larger than the damping ratio of 0.75% (case 1) and 1.8% (case 3). In Figure 12b, the structural parameters are approximately the same, except for the aspect ratio of the structure, so the difference in peak factors in these test cases can be attributed to the influence of the aspect ratio. From the results of Figure 12b, when the aspect ratio is small, the peak factor of cross-wind response is relatively large.
Based on the above analysis, this paper puts forward an approximate empirical formula for the peak factor of cross-wind response considering the reduced wind speed, aspect ratio, and damping ratio of the structure, as follows:
g = a 1 V r 3 + a 2 V r 2 + a 3 V r + a 4 V r 2 + b 1 V r + b 2 × ξ K 1 ( 1 + 0.1 λ ) K 2
or written as follows:
g r = g × ( 1 + 0.1 λ ) K 2 ξ K 1 = a 1 V r 3 + a 2 V r 2 + a 3 V r + a 4 V r 2 + b 1 V r + b 2
In Formula (14), λ is the aspect ratio; ξ is the structural damping ratio; and K1, K2, a1, a2, a3, a4, b1, and b2 are used to control the shape of the curve and are the parameters to be fitted. In Formula (15), gr means the reduced peak factor, which is only a function of the reduced wind speed, because it already considers the influence of the aspect ratio and damping ratio of the structure. According to the regression analysis, a1, a2, a3, a4, b1, b2, K1, and K2 are 0.16, 7.2, −155, 760, −16.5, 72.2, 0.20, and 0.67, respectively. From the fitting result of Figure 13, the result obtained by Formula (14) is approximately in agreement with the experimental data.
It should be point out that the empirical formula in this paper is not precise enough, thus more follow-up wind tunnel test and studies are necessary; the test date and the empirical formula of this study can provide a reference for the follow-up research in the future.

6. Conclusions

Based on the wind tunnel test of the MDOF aero-elastic model, the calculation method and variation characteristics of peak factors of the wind-induced response of super-high-rise buildings were studied in this paper. The main conclusions are as follows:
(1)
For the wind-induced response of super-high-rise buildings, the peak factor calculated by the improved peak factor method is consistent with that calculated by the classical extreme value theory, and the difference between the two calculation methods is approximately within 15%, indicating that the improved peak factor method is applicable to calculate the peak factor of the wind-induced response of high-rise buildings.
(2)
The peak factor of the along-wind response of super-high-rise buildings changes little with the reduced wind speed; therefore, the along-wind response peak factor at different wind speeds can be approximately taken as a constant in the wind-resistant design of actual tall buildings.
(3)
The peak factor of the cross-wind response of super-high-rise buildings varies greatly with wind speeds, varying from 2.5 to 5.5, and reaches the minimum near the critical wind speed of VIV. In the wind-resistant design of actual super tall buildings, the cross-wind peak factor should be taken as a relatively large value when the wind speed is far from the VIV wind speed, and as a relatively small value when the wind speed is close to the VIV wind speed.
(4)
The empirical formula proposed in this paper takes into account the effects of aspect ratio, structural damping, and reduced wind speed on the peak factor, which is an improvement of existing research work. The empirical formula can approximately reflect the variation characteristic of the cross-wind response peak factor. Although the accuracy of the formula is not good enough, it can provide a reference for the evaluation of the peak factor of the wind-induced response of super-high-rise buildings without wind tunnel test data, and the test data of this study can provide a reference for further research.

Author Contributions

Conceptualization, L.W. and S.-G.L.; Writing original draft, J.-B.W. and Y.W. All authors have read and agreed to the published version of the manuscript.

Funding

This research was funded by National Natural Science Foundation of China: 51708186.

Institutional Review Board Statement

Not applicable.

Informed Consent Statement

Not applicable.

Data Availability Statement

All necessary data have been given in the text, and there is no additional data to provide links.

Conflicts of Interest

The authors declare no conflict of interest.

References

  1. Davenport, A.G. Note on the distribution of the largest value of a random function with application to gust loading. Proc. Inst. Civ. Eng. 1964, 28, 187–196. [Google Scholar] [CrossRef]
  2. Yasushi, U.; Nicholas, I. Wind pressures acting on low-rise buildings. J. Wind. Eng. Ind. Aerodyn. J. Int. Assoc. Wind. Eng. 1999, 82, 1–25. [Google Scholar]
  3. Kumar, K.S.; Stathopoulos, T. Wind Loads on Low Building Roofs: A Stochastic Perspective. J. Struct. Eng. 2000, 126, 944–956. [Google Scholar] [CrossRef]
  4. Yang, L.; Gurley, K.R.; Prevatt, D.O. Probabilistic modeling of wind pressure on low-rise buildings. J. Wind. Eng. Ind. Aerodyn. 2013, 114, 18–26. [Google Scholar] [CrossRef]
  5. Yang, Q.; Tian, Y. A model of probability density function of non-Gaussian wind pressure with multiple samples. J. Wind. Eng. Ind. Aerodyn. 2015, 140, 67–78. [Google Scholar] [CrossRef]
  6. Kareem, A.; Zhao, J. Analysis of Non-Gaussian surge response of tension leg platforms under wind loads. J. Offshore Mech. Arct. Eng. 1991, 116, 137–144. [Google Scholar] [CrossRef]
  7. Kwon, D.K.; Kareem, A. Peak Factors for Non-Gaussian Load Effects Revisited. J. Struct. Eng. 2011, 137, 1611–1619. [Google Scholar] [CrossRef]
  8. Winerstein, S.R. Nonlinear Vibration Models for Extremes and Fatigue. J. Eng. Mech. 1988, 114, 1772–1790. [Google Scholar] [CrossRef]
  9. Tognarelli, M.A.; Zhao, J.; Kareem, A. Equivalent Statistical Cubicization for System and Forcing Nonlinearities. J. Eng. Mech. 1997, 123, 890–893. [Google Scholar] [CrossRef]
  10. Winterstein, S.R.; Kleiven, G. Springing and slow-drift responses: Predicted extremes and fatigue vs. simulation. Processes 1994, 94, 1–15. [Google Scholar]
  11. Peng, L.; Liu, M.; Yang, Q.; Huang, G.; Chen, B. An analytical formula for Gaussian to non-Gaussian correlation relationship by moment-based piecewise Hermite polynomial model with application in wind engineering. J. Wind. Eng. Ind. Aerodyn. 2020, 198, 104094. [Google Scholar] [CrossRef]
  12. Huang, M.; Lou, W.; Chan, C.-M.; Bao, S. Peak factors of non-Gaussian wind forces on a complex-shaped tall building. Struct. Des. Tall Spec. Build. 2014, 22, 1105–1118. [Google Scholar] [CrossRef]
  13. Huang, M.F.; Lou, W.; Chan, C.M.; Lin, N.; Pan, X. Peak Distributions and Peak Factors of Wind-Induced Pressure Processes on Tall Buildings. J. Eng. Mech. 2013, 139, 1744–1756. [Google Scholar] [CrossRef]
  14. Sadek, F.; Simiu, E. Peak Non-Gaussing wind effects for database-assisted low-rise building design. J. Eng. Mech. 2002, 128, 530–539. [Google Scholar]
  15. Quan, Y.; Wang, F.; Gu, M. An Extreme-value Estimating Method of Non-Gaussian Wind Pressure Based on Generalized Extreme Value Theory. In Proceedings of the 13rd International Conference on Wind Engineering (ICWE13), Amsterdam, The Netherlands, 10–15 July 2011. [Google Scholar]
  16. Huang, G.; Luo, Y.; Yang, Q.; Tian, Y. A semi-analytical formula for estimating peak wind load effects based on Hermite polynomial model. Eng. Struct. 2017, 152, 856–864. [Google Scholar] [CrossRef]
  17. Melbourne, W.H. Predicting the cross-wind response of masts and structural members. J. Wind. Eng. Ind. Aerodyn. 1997, 69, 91–103. [Google Scholar] [CrossRef]
  18. Cheng, C.M.; Lu, P.C.; Tsaia, M.S. Acrosswind aerodynamic damping of isolated square-shaped buildings. J. Wind. Eng. Ind. Aerodyn. 2002, 90, 1743–1756. [Google Scholar] [CrossRef]
  19. Vickery, B.J.; Steckley, A. Aerodynamic Damping and Vortex Excitation on an Oscillating Prism in Turbulent Shear Flow. J. Wind. Eng. Ind. Aerodyn. 1993, 49, 121–140. [Google Scholar] [CrossRef]
  20. Wang, L.; Liang, S.; Huang, G.; Song, J.; Zou, L. Investigation on the unstability of vortex induced resonance of high-rise buildings. J. Wind. Eng. Ind. Aerodyn. 2018, 175, 17–31. [Google Scholar] [CrossRef]
  21. Li, Q.; Jia, H.; Qiu, Q.; Lu, Y.; Zhang, J.; Mao, J.; Fan, W.; Huang, M. Typhoon-Induced Fragility Analysis of Transmission Towers in Ningbo Area Considering the Effects of Long-Term Corrosion. Appl. Sci. 2022, 12, 4774. [Google Scholar] [CrossRef]
  22. Wang, L.; Zhu, Y.-J.; Wang, Z.-K.; Fan, Y.-H. A design method for multi-degree-of-freedom aeroelastic model of super tall buildings. Wind. Struct. 2021, 32, 219–225. [Google Scholar]
  23. Bearman, P.M. Vortex shedding from oscillating bluff bodies. Annu. Rev. Fluid Mech. 1984, 16, 195–222. [Google Scholar] [CrossRef]
  24. GB50009-2012; Load Code for the Design of Building Structures. China Architecture and Building Press: Beijing, China, 2012.
  25. Wang, L.; Liang, S.; Song, J.; Wang, S. Analysis of vortex induced vibration frequency of super tall building based on wind tunnel tests of mdof aero-elastic model. Wind. Struct. Int. J. 2015, 21, 523–536. [Google Scholar] [CrossRef]
Figure 1. Design and photos of the MDOF skeleton (unit: mm).
Atmosphere 14 00379 g001
Figure 2. The photos of the wind tunnel.
Atmosphere 14 00379 g002
Figure 3. Mean wind velocity and turbulence intensity profiles.
Atmosphere 14 00379 g003
Figure 4. Photos of the laser displacement meter. (a) signal acquisition instrument, (b) laser transmitter.
Atmosphere 14 00379 g004
Figure 5. Cross-wind displacement of each MDOF model.
Atmosphere 14 00379 g005
Figure 6. Cross-wind displacement time history (case 3).
Atmosphere 14 00379 g006
Figure 7. Relationship between simplified variables and the observed extreme value.
Atmosphere 14 00379 g007
Figure 8. Probability distribution of extreme value type I.
Atmosphere 14 00379 g008
Figure 9. Comparison of peak factor calculation methods (test case 0).
Atmosphere 14 00379 g009
Figure 10. Peak factor of the along-wind response (city center terrain).
Atmosphere 14 00379 g010
Figure 11. Peak factors of cross-wind response under different wind fields.
Atmosphere 14 00379 g011
Figure 12. Peak factor of cross-wind response of some test cases (city center terrain).
Atmosphere 14 00379 g012
Figure 13. Fitting results of the empirical formula.
Atmosphere 14 00379 g013
Table 1. Scale ratio of model parameters.
PropertyModel Parameters Scale Ratio
Lengthlm/lp1:600
Time and frequencynm/np100:1
VelocityVm/Vp1:6
Densityρmp1:1
Note: The subscripts m and p denote the model and prototype building, respectively.
Table 2. Dynamic parameters of the MDOF aero-elastic models.
Test CaseGeometric SizeAspect Ratio (λ) 1st Natural Frequency (n1)Equivalent Mass (m)Damping Ratio (ζ)Scruton Number (Sc)
01.0 × 0.1 m107.00 Hz3.07 kg/m4.20%20.64
11.0 × 0.1 m109.89 Hz2.27 kg/m0.75%2.5
21.0 × 0.1 m1010.18 Hz1.85 kg/m1.10%3.25
31.0 × 0.1 m109.64 Hz2.27 kg/m1.80%6.34
41.0 × 0.1 m109.27 Hz2.27 kg/m3.60%13.05
51.0 × 0.1 m109.40 Hz2.50 kg/m3.60%14.4
61.0 × 0.1 m107.01 Hz3.07 kg/m4.20%20.65
71.3 × 0.1 m1310.83 Hz1.31 kg/m1.02%2.14
81.3 × 0.1 m139.02 Hz1.31 kg/m2.89%6.05
91.3 × 0.1 m1310.6 Hz1.31 kg/m1.43%2.99
101.3 × 0.1 m138.70 Hz2.17 kg/m3.72%12.91
111.3 × 0.1 m137.17 Hz2.38 kg/m4.50%17.06
121.6 × 0.1 m167.14 Hz1.25 kg/m0.82%1.64
131.6 × 0.1 m165.98 Hz1.81 kg/m0.82%2.38
141.6 × 0.1 m167.02 Hz1.25 kg/m1.33%2.6
151.6 × 0.1 m165.19 Hz2.38 kg/m1.11%4.25
161.6 × 0.1 m165.68 Hz2.38 kg/m1.71%6.31
Note: The equivalent mass (M) and Scruton number (Sc) can be expressed by Equations (1) and (2), respectively.
Disclaimer/Publisher’s Note: The statements, opinions and data contained in all publications are solely those of the individual author(s) and contributor(s) and not of MDPI and/or the editor(s). MDPI and/or the editor(s) disclaim responsibility for any injury to people or property resulting from any ideas, methods, instructions or products referred to in the content.

