
Impact Analysis of Super Typhoon 2114 ‘Chanthu’ on the Air Quality of Coastal Cities in Southeast China Based on Multi-Source Measurements
 ,
,
Abstract
:1. Introduction
2. Data and Method
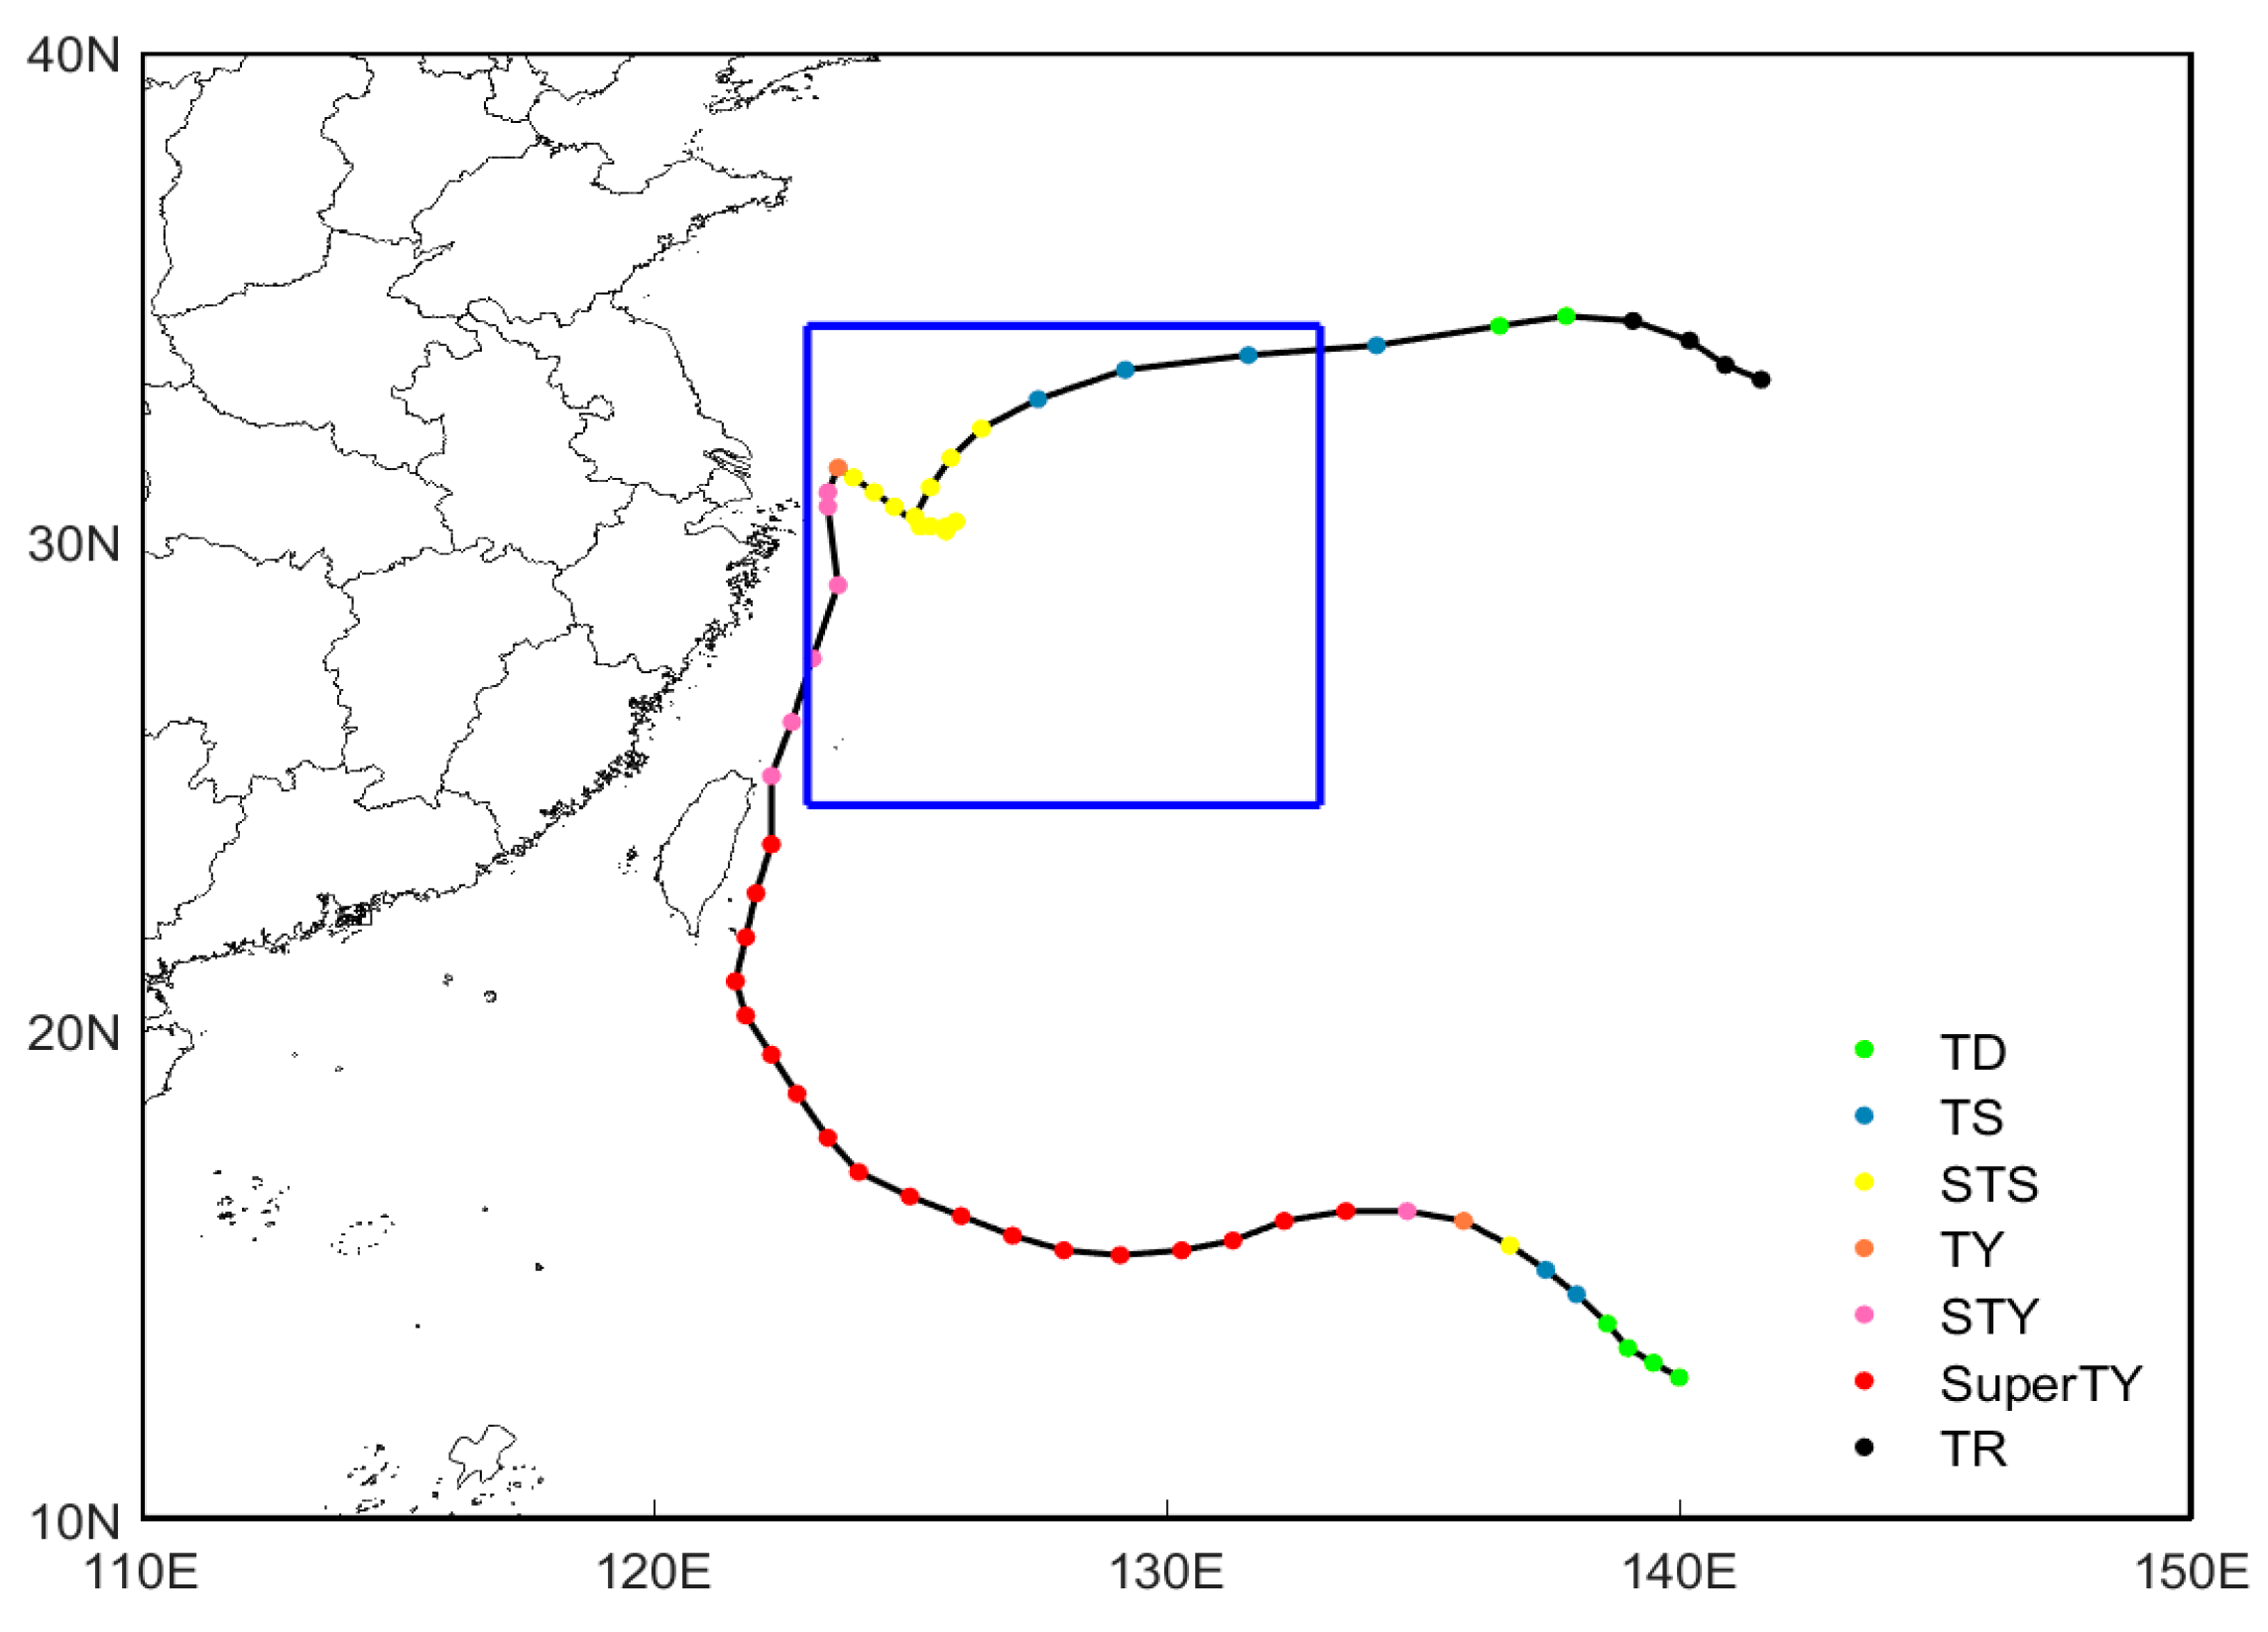
2.1. Tyhoon Data
2.2. Observation of Atmospheric Components
2.3. Meteorological Data
3. Results
3.1. Air Quality in CCSE Affected by the Typhoon
3.2. Overview of the Impact of Super Typhoon 2114 ‘Chanthu’on Air Quality in CCSE
3.3. Comprehensive Analysis of Influencing Factors
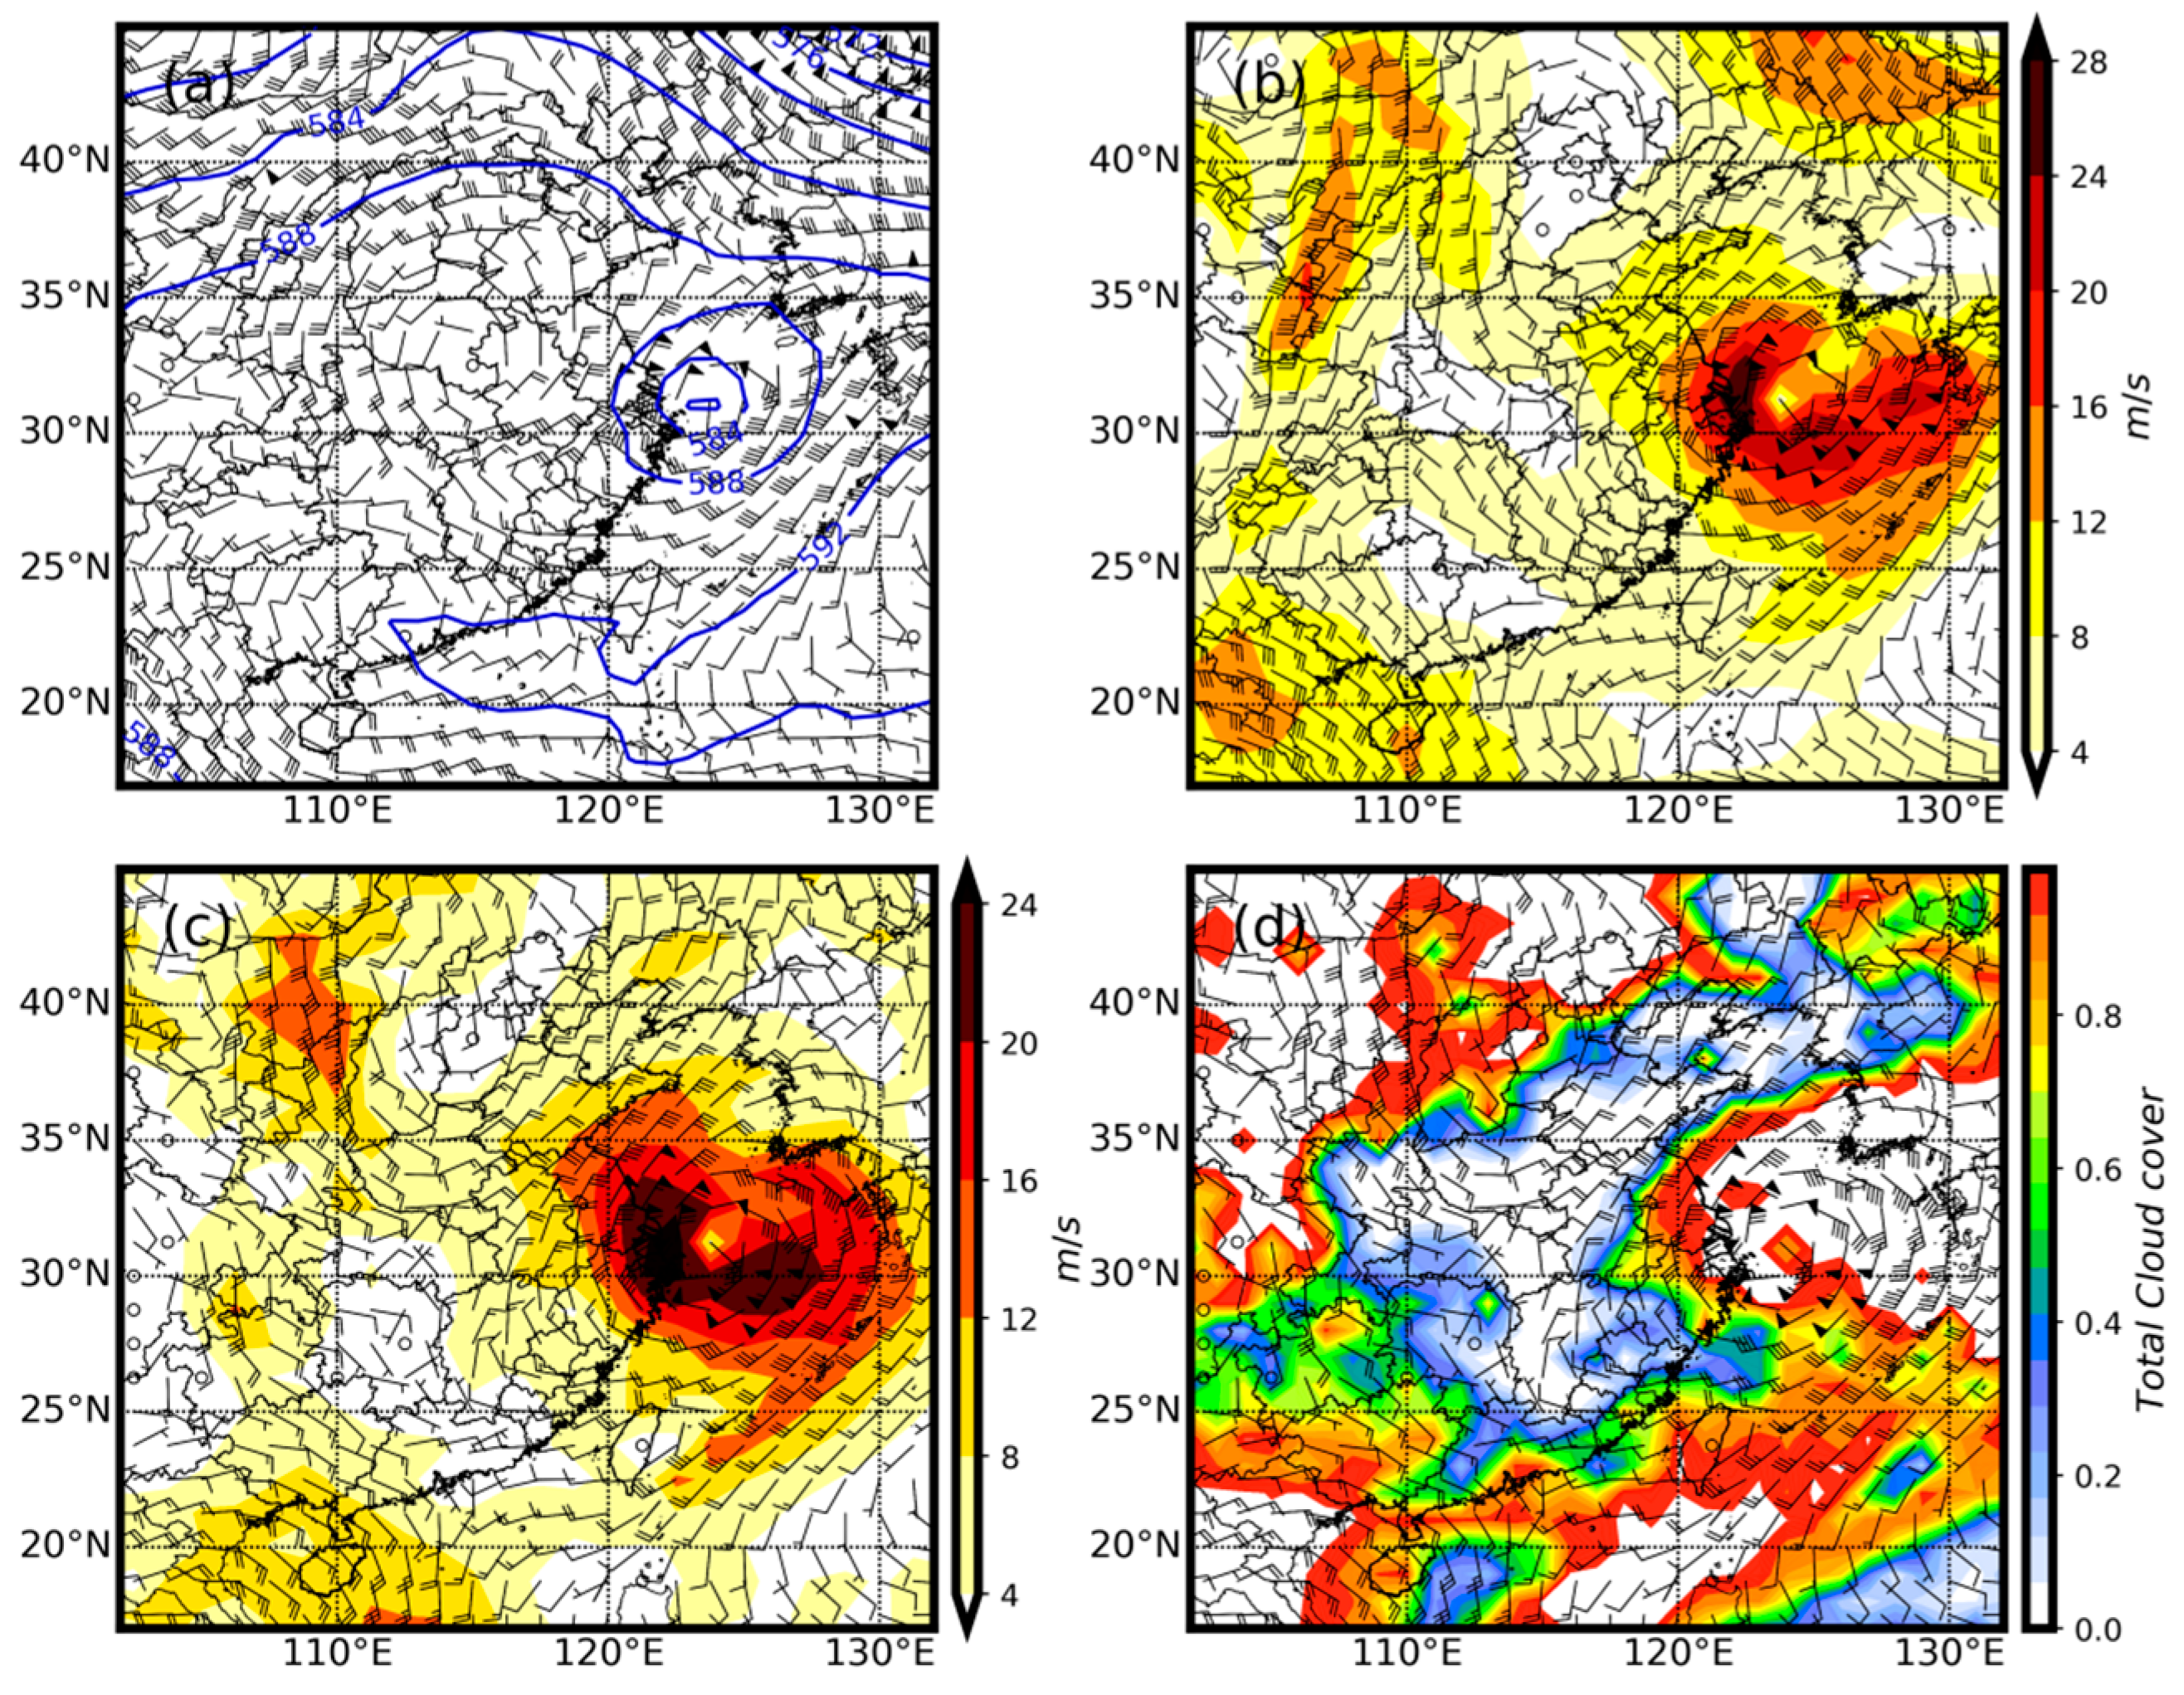
3.3.1. Weather Situation
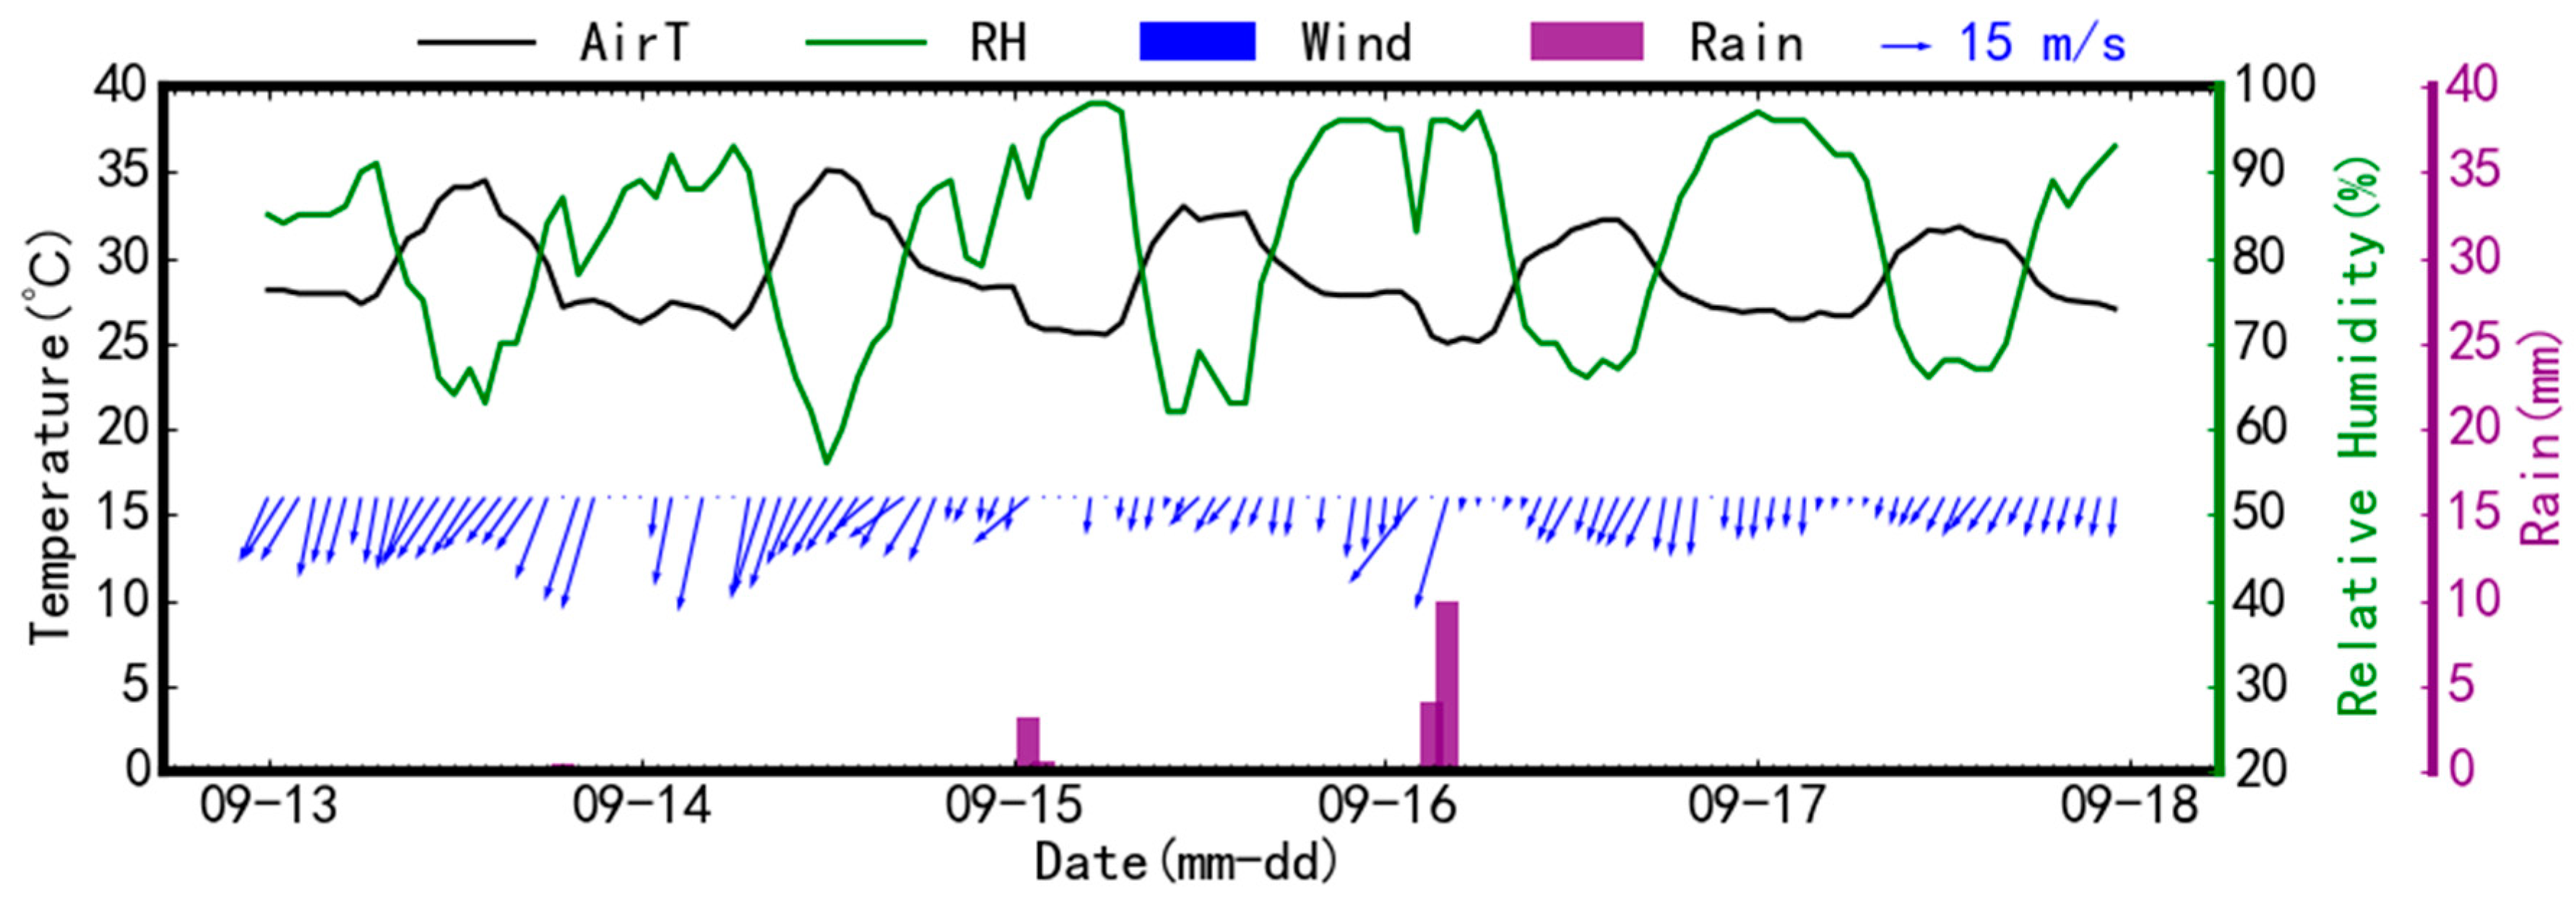
3.3.2. Horizontal Diffusion Condition
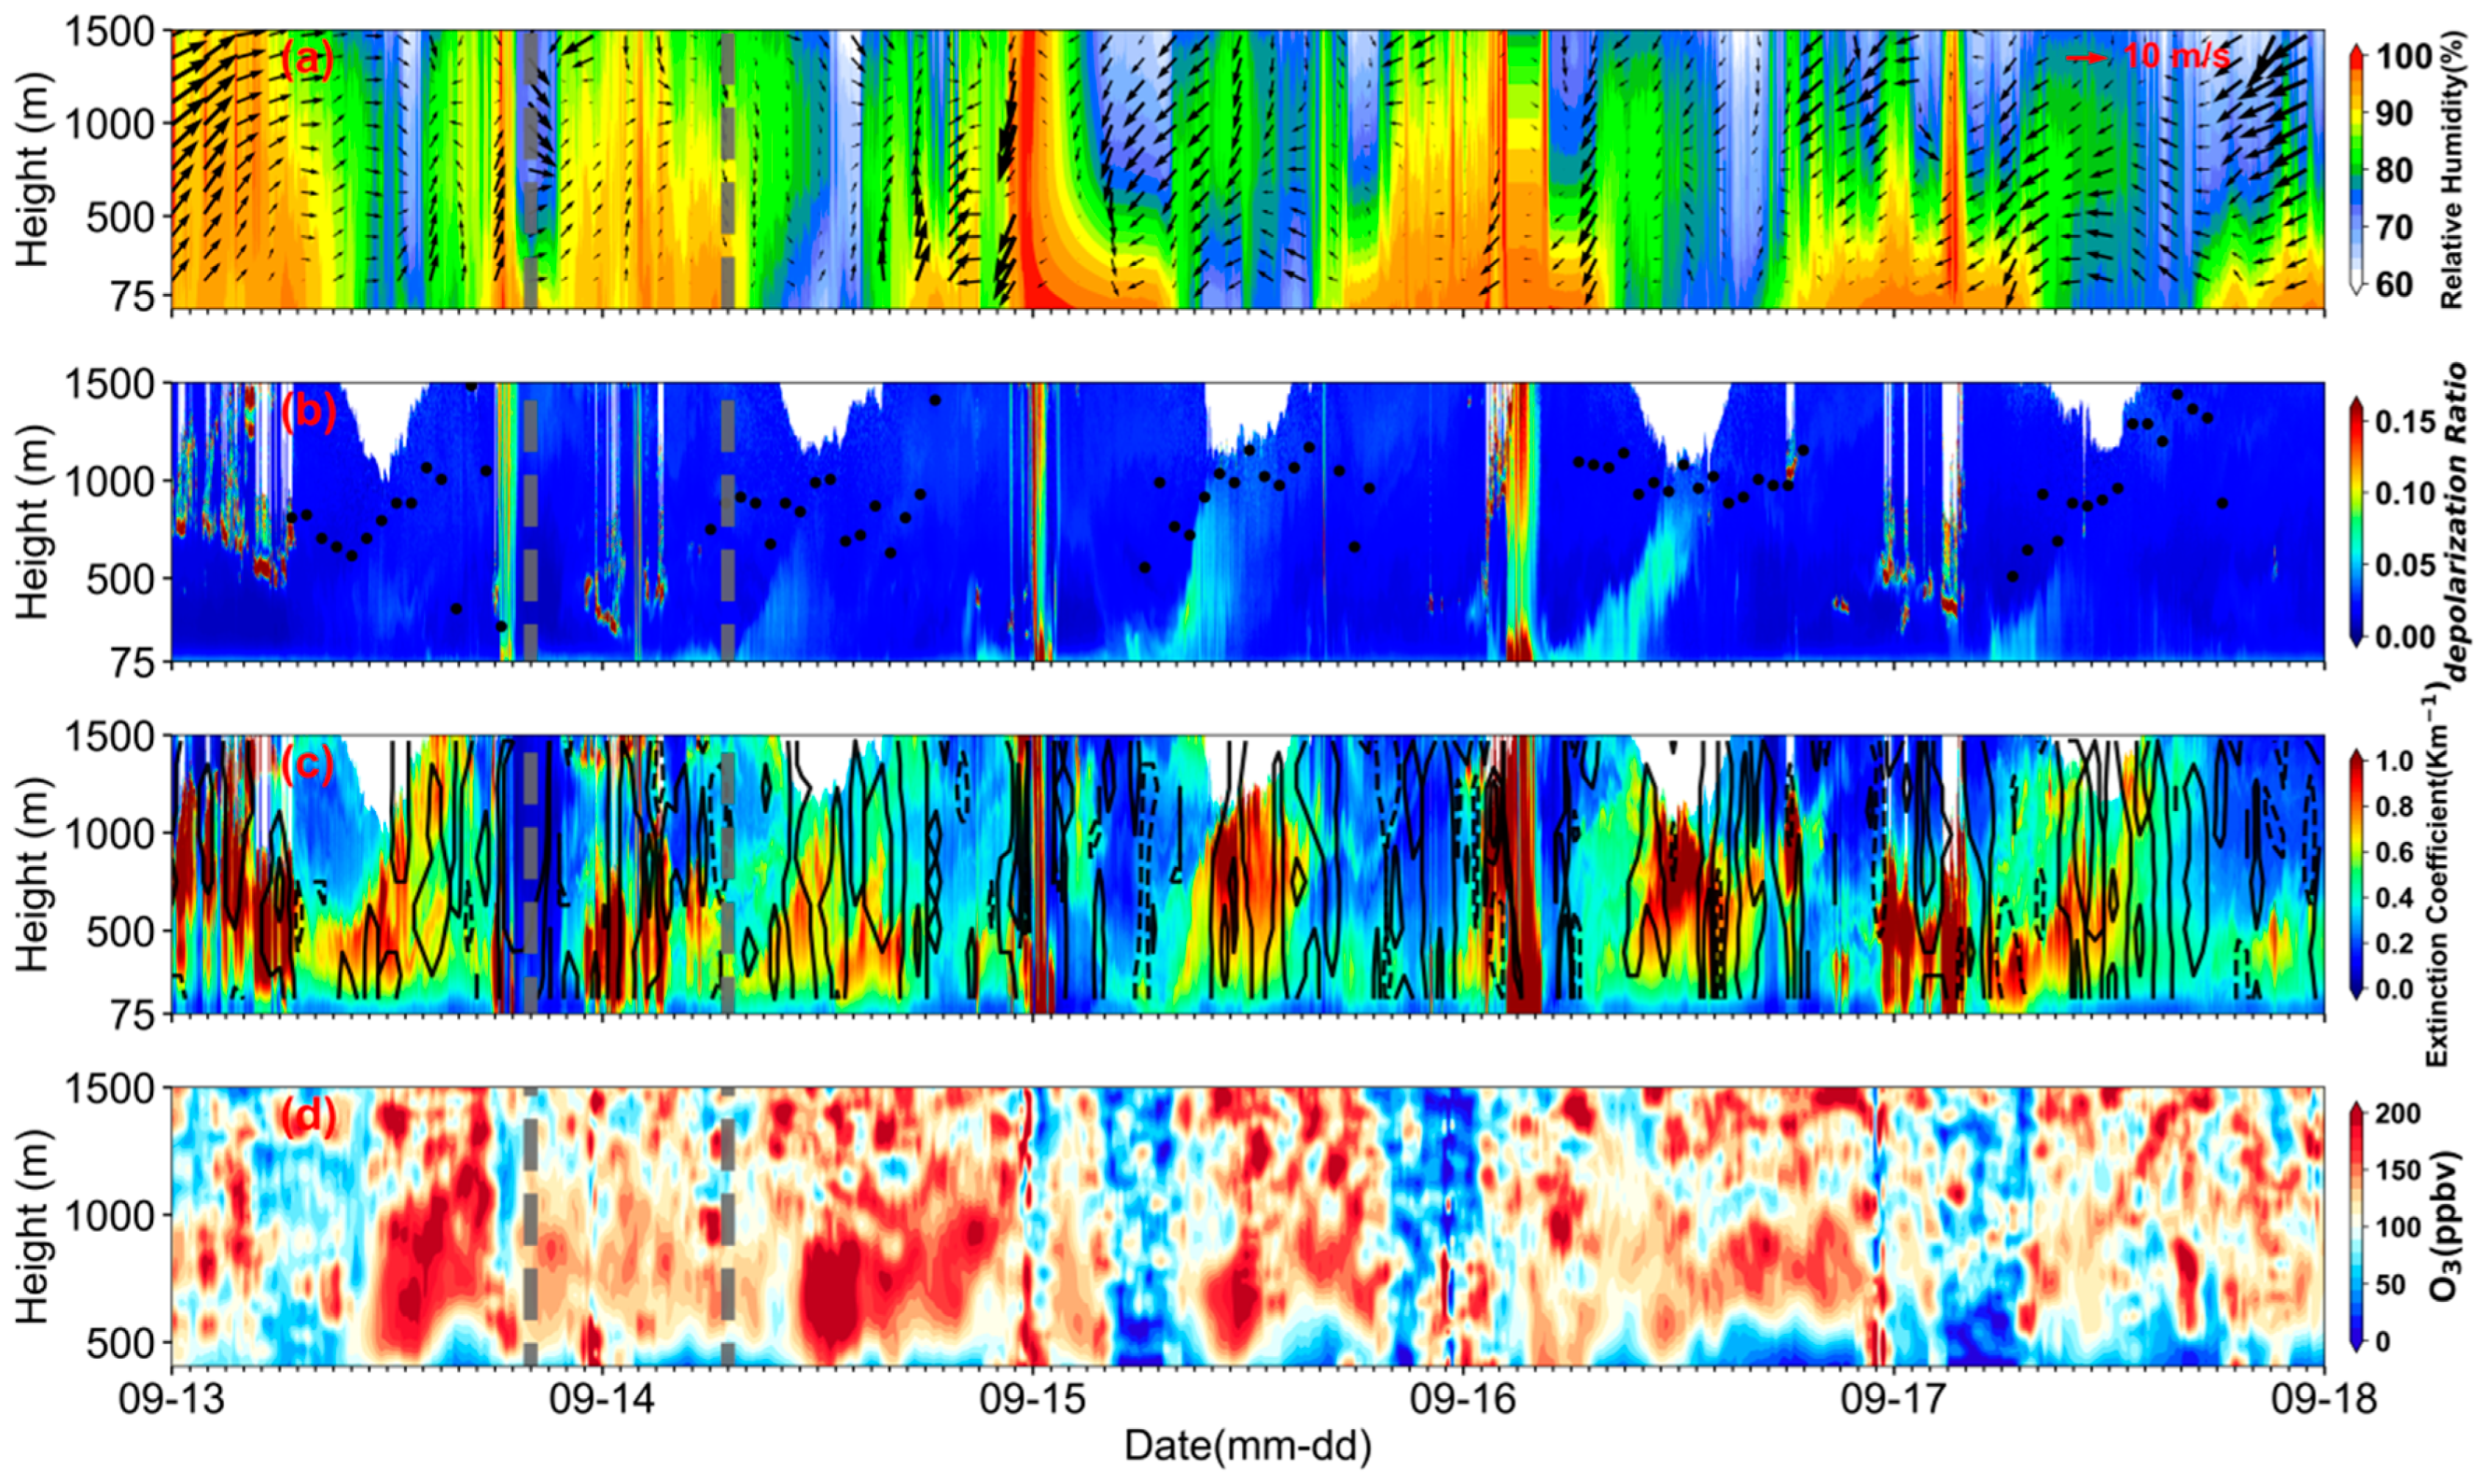
3.3.3. Vertical Diffusion Conditions
4. Conclusions
- (1)
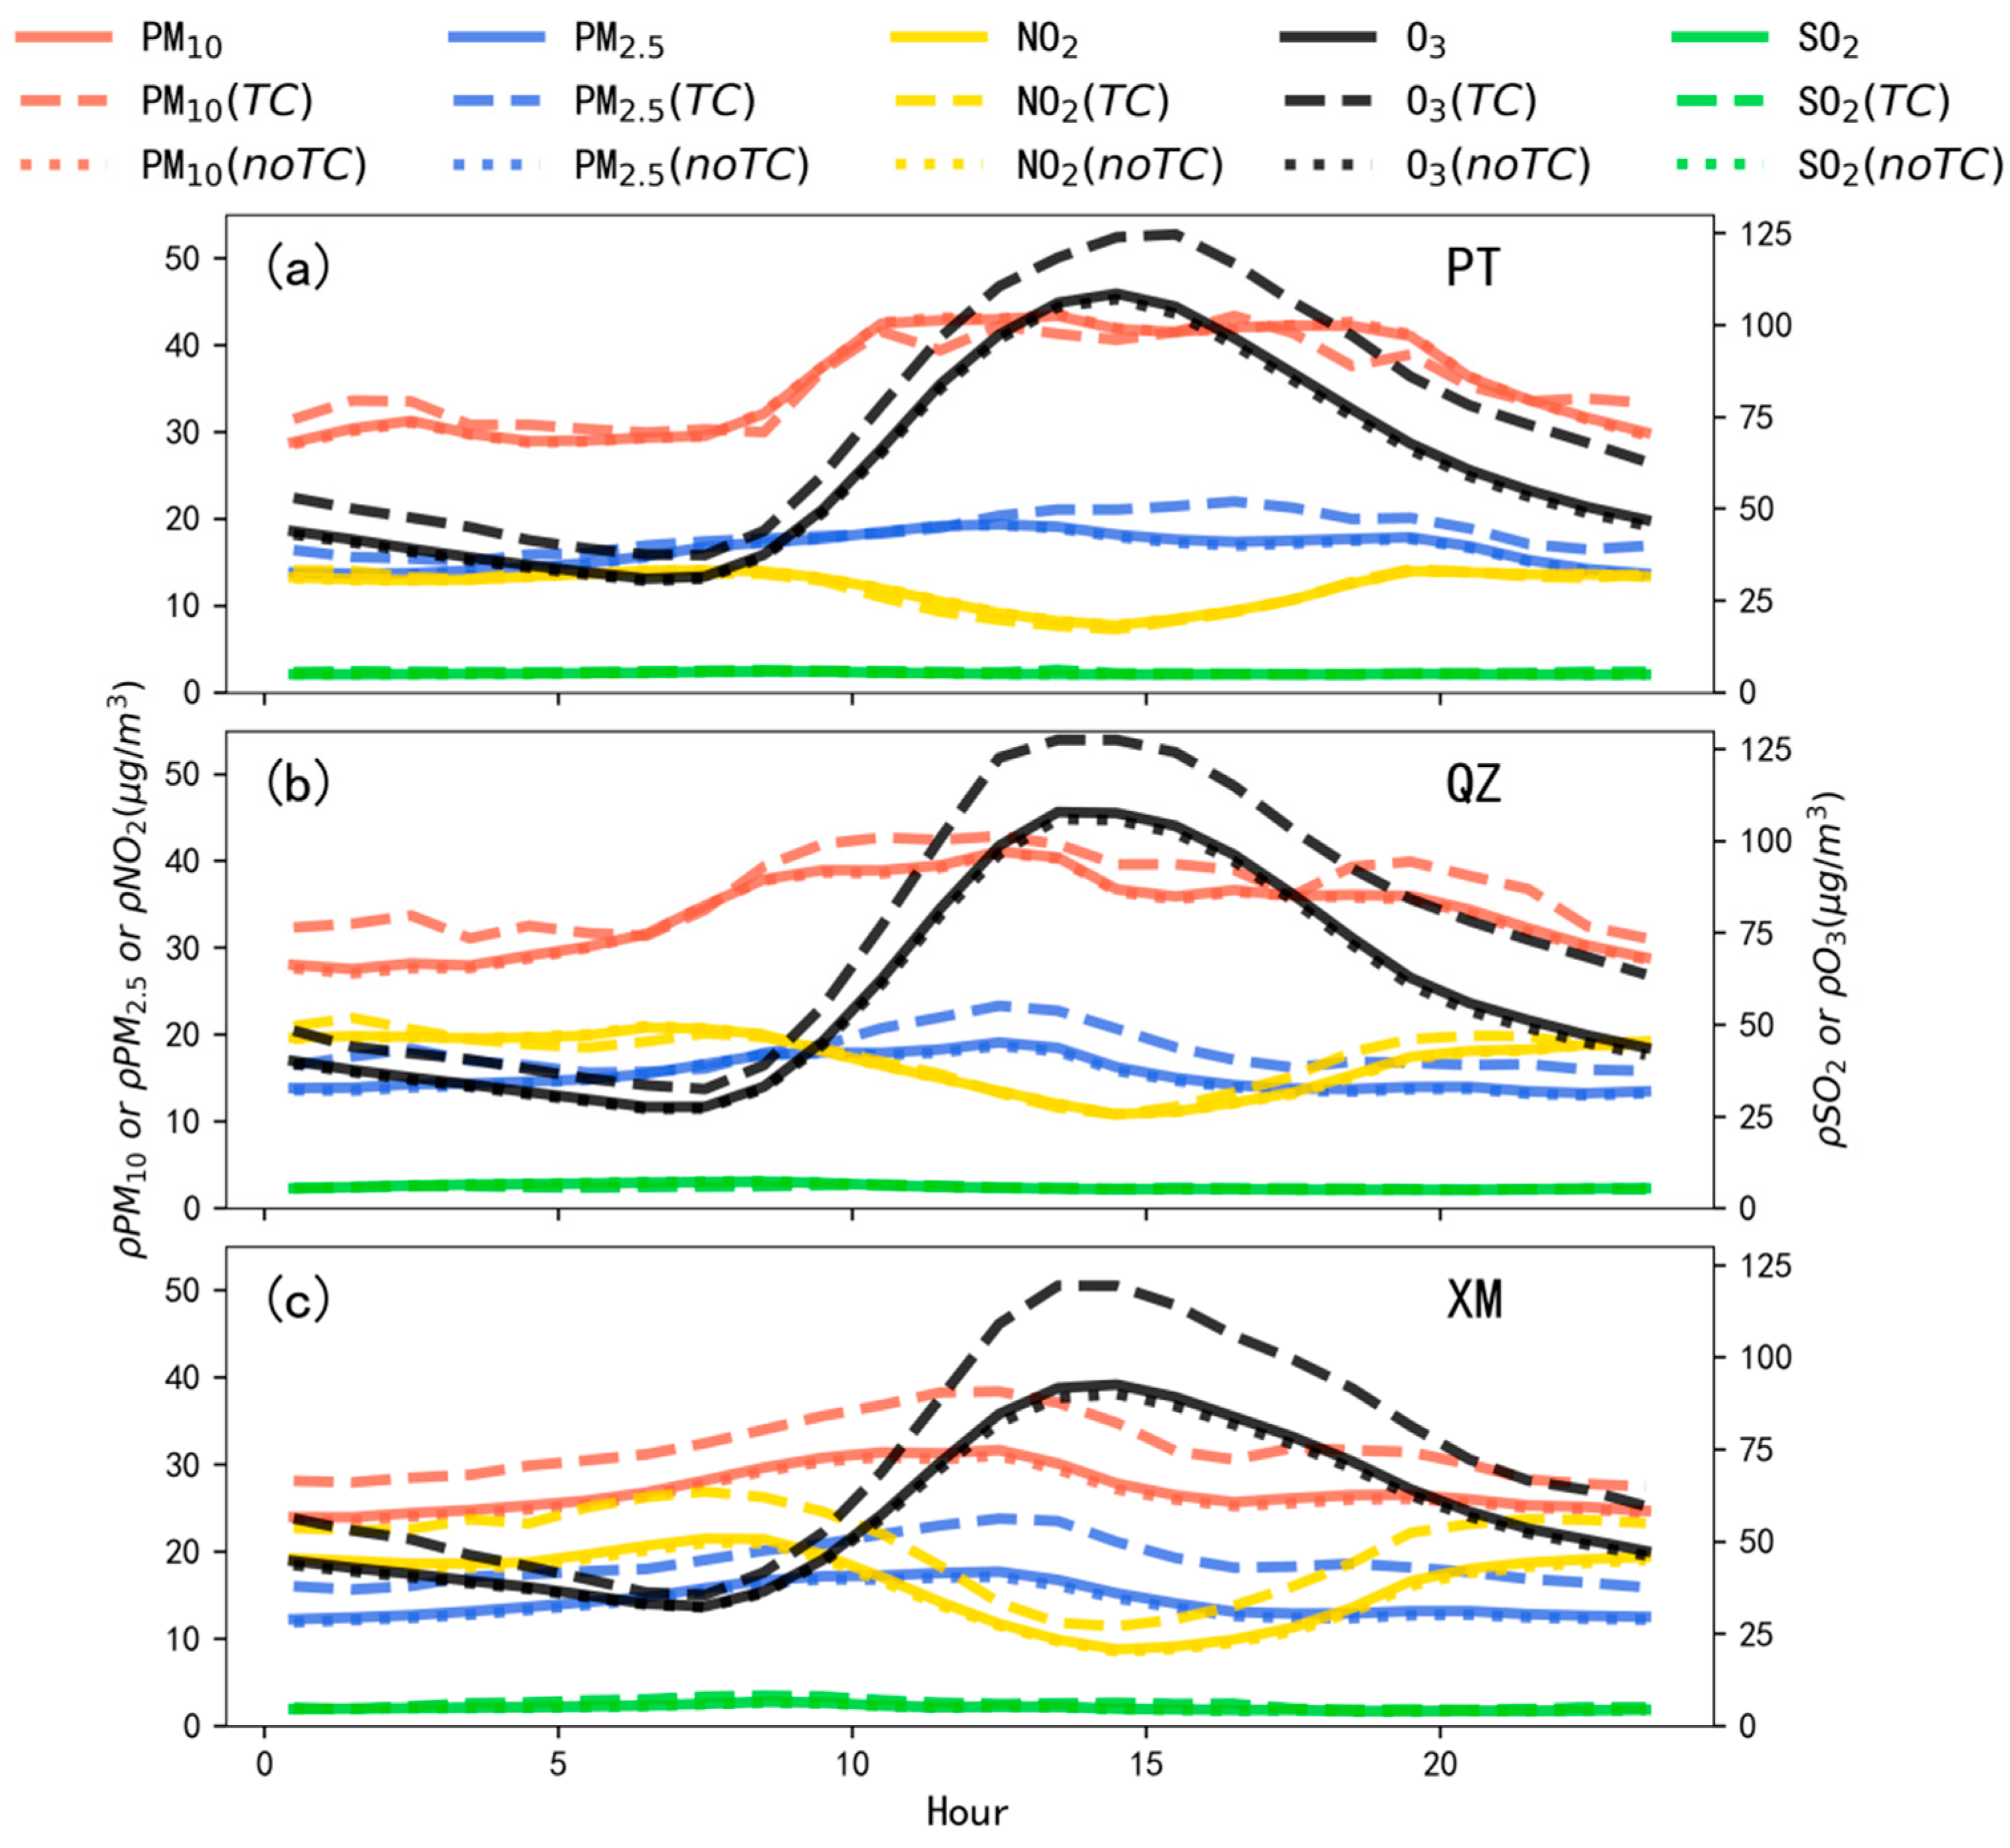
- According to the comprehensive analysis of the air quality in CCSE during the typhoon prone period (June to September) from 2019 to 2021, the TCN-SEC and its surrounding weather situation had a favorable impact on the increase in the pollutant concentrations in CCSE, especially on the increase in O3 concentration. The TCN-SEC and its surrounding weather situation had an increasing influence on the hourly concentrations of O3 of CCSE, as well as a comprehensive impact on the diurnal variation in PM10, PM2.5, SO2, and NO2 of CCSE.
- (2)
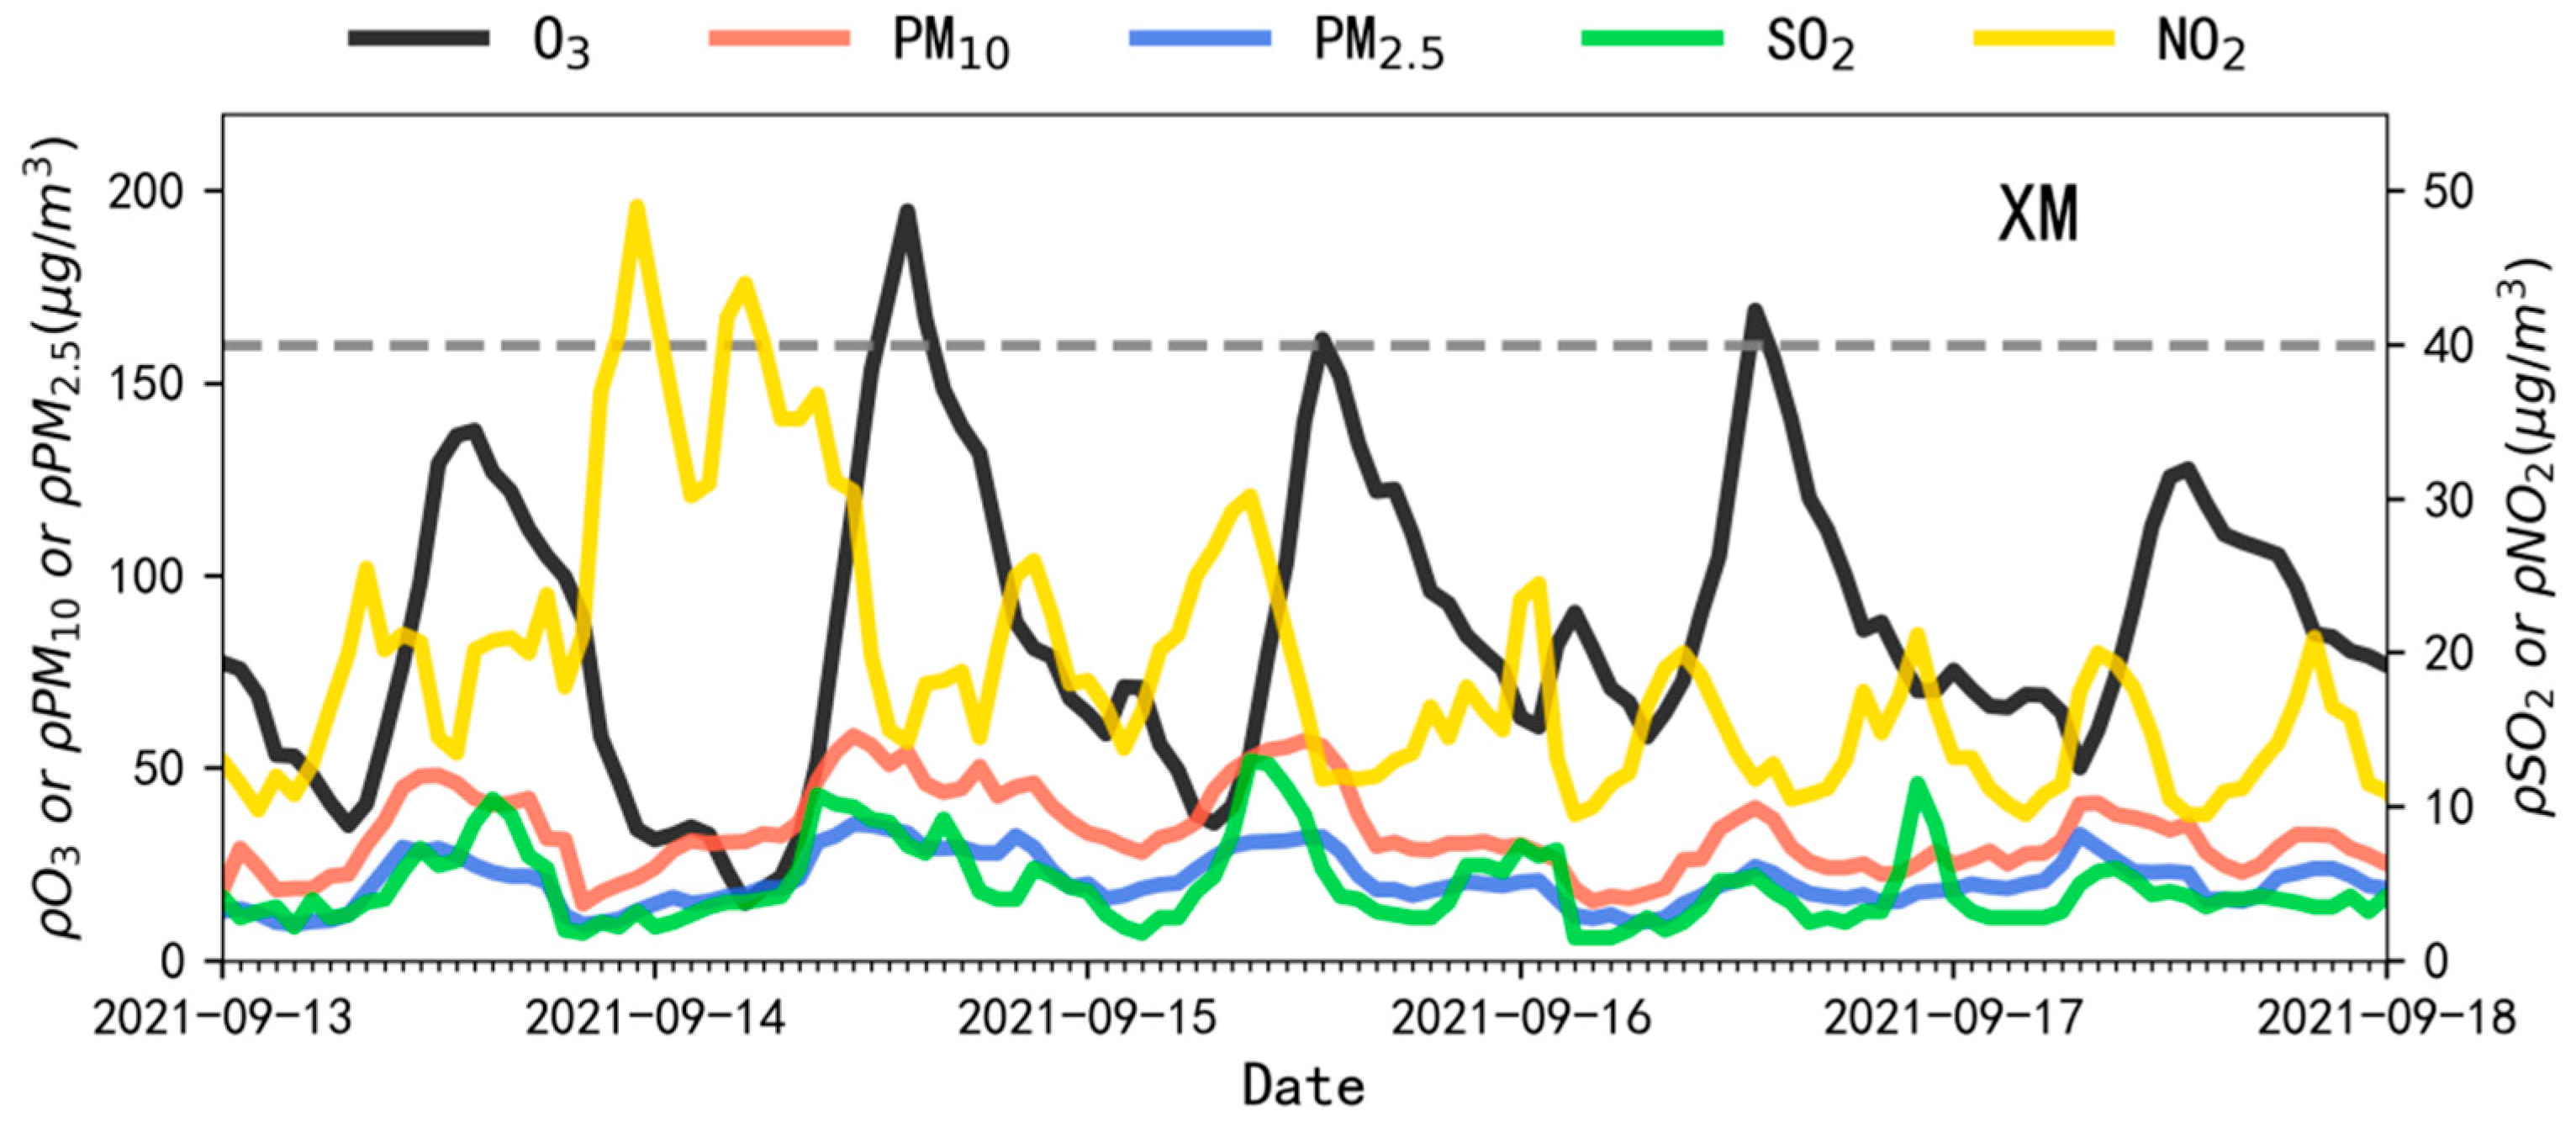
- Based on the analysis of air quality, weather situation, and surface meteorology parameters from 13 to 17 September 2021, it was shown that, affected by the cyclonic shear in the south of super typhoon 2114 ‘Chanthu’, the horizontal transmission of the upwind atmospheric compositions brought by the moderate gale near the ground may have positively contributed to the significant increase in PM10, PM2.5, SO2, and NO2. However, the mild diurnal variation in RH, the relatively strong precipitation, and the significantly reduced wind speed had a comprehensive weakening effect on the relatively low PM10, PM2.5, SO2, and NO2 levels. Calm conditions near the ground, weak precipitation, high humidity in the early morning and at night, high daily maximum AirT, and low RH could provide favorable meteorological conditions for the accumulation of precursors of O3 and photochemical reaction during the day, playing a positive role in regards to the O3 peak on 14 September to 16 September. It was also suggested that the horizontal stable conditions may also play a significant role in the local accumulation of ozone.
- (3)
- Using a suite of air quality data and multi-source observations, the impact of vertical atmospheric structure on air quality was analyzed. It was suggested that the large daily shift in wind direction and speed from night to early morning provided favorable conditions for the external transmission and local accumulation of atmospheric compositions. The evolution of RH below 1500 m during the process may contribute to the increase in the hygroscopicity of aerosol particles and the nocturnal chemical reaction of SO2 and NO2. The evolution of the pollution boundary layer can have a positive impact on the local retention, accumulation, or diffusion of PM10 and PM2.5, as well as the daily differences in PM10 and PM2.5 near the ground. The atmospheric movement below 1500 m played a notable role in the vertical mixing and diffusion of O3. The entrainment and sinking motion of O3 in the residual layer may play a complementary role in increasing and maintaining the O3 concentration below 1000 m, or even near the ground.
Supplementary Materials
Author Contributions
Funding
Institutional Review Board Statement
Informed Consent Statement
Data Availability Statement
Conflicts of Interest
References
- Asante, A.H.; Zhou, L.L.; Xu, X.L.; Tehzeeb, M. Progressing towards Environmental Health Targets in China: An Integrative Review of Achievements in Air and Water Pollution under the ‘Ecological Civilisation and the Beautiful China’ Dream. Sustainability 2021, 137, 3664. [Google Scholar]
- Tang, M.; Ding, J.; Kong, H.; Bethel, B.J.; Tang, D. Influence of Green Finance on Ecological Environment Quality in Yangtze River Delta. Int. J. Environ. Res. Public Health 2022, 19, 10692. [Google Scholar] [CrossRef]
- Global Burden of Disease (GBD). Global age-sex-specific fertility, mortality, healthy life expectancy (HALE), and population estimates in 204 countries and territories, 1950–2019: A comprehensive demographic analysis for the Global Burden of Disease Study 2019. Lancet 2020, 396, 1135–1159. [Google Scholar]
- U.S. Environmental Protection Agency (USEPA). Integrated Science Assessment (ISA) for Particulate Matter; Report No. EPA/600/R-19/188; Center for Public Health and Environmental Assessment Office of Research and Development U.S. Environmental Protection Agency: Durham, NC, USA, 2019.
- Donaldson, K.; Li, X.; MacNee, W. Ultrafine (nanometre) particle mediated lung injury. J. Aerosol Sci. 1998, 29, 553–560. [Google Scholar] [CrossRef]
- Schwartz, J. The Distributed Lag between Air Pollution and Daily Deaths. Epidemiology 2000, 11, 320–326. [Google Scholar] [CrossRef] [PubMed]
- Chen, R.; Zhao, Z.; Kan, H. Heavy smog and hospital visits in Beijing, China. Am. J. Respir. Crit. Care Med. 2013, 188, 1170–1171. [Google Scholar] [CrossRef]
- Silva, R.A.; Adelman, Z.; Fry, M.; West, J.J. The Impact of Individual Anthropogenic Emissions Sectors on the Global Burden of Human Mortality due to Ambient Air Pollution. Environ. Health Perspect. 2016, 124, 1776–1784. [Google Scholar] [CrossRef] [Green Version]
- Shah, A.S.V.; Langrish, J.P.; Nair, H.; McAllister, D.A.; Hunter, A.L.; Donaldson, K.; Newby, D.E.; Mills, N.L. Global association of air pollution and heart failure: A systematic review and meta-analysis. Lancet 2013, 382, 1039–1048. [Google Scholar] [CrossRef] [PubMed] [Green Version]
- Lelieveld, J.; Evans, J.S.; Fnais, M.; Giannadaki, D.; Pozzer, A. The Contribution of Outdoor Air Pollution Sources to Premature Mortality on a Global Scale. Nature 2015, 525, 367–371. [Google Scholar] [CrossRef]
- Shindell, D.; Faluvegi, G.; Seltzer, K.; Shindell, C. Quantified, localized health benefits of accelerated carbon dioxide emissions reductions. Nat. Clim. Chang. 2018, 8, 291–295. [Google Scholar] [CrossRef]
- Qu, Z.; Wang, X.; Li, F.; Li, Y.; Chen, X.; Chen, M. PM2.5-Related Health Economic Benefits Evaluation Based on Air Improvement Action Plan in Wuhan City, Middle China. Int. J. Environ. Res. Public Health 2020, 17, 620. [Google Scholar] [CrossRef] [PubMed] [Green Version]
- Qin, Y.; Li, J.; Gong, K.; Wu, Z.; Chen, M.; Qin, M.; Huang, L.; Hu, J. Double high pollution events in the Yangtze River Delta from 2015 to 2019: Characteristics, trends, and meteorological situations. Sci. Total Environ. 2021, 792, 148349. [Google Scholar] [CrossRef] [PubMed]
- Team, C.W.; Pachauri, R.K.; Reisinger, A. Climate change 2007: Synthesis report. In Contribution of Working Groups I, Ii and Iii to the Fourth Assessment Report of the Intergovernmental Panel on Climate Change; IPCC: Geneva, Switzerland, 2007. [Google Scholar]
- Cape, J.N. Surface ozone concentrations and ecosystem health: Past trends and a guide to future projections. Sci. Total Environ. 2008, 400, 257–269. [Google Scholar] [CrossRef] [PubMed] [Green Version]
- Carter, C.A.; Cui, X.; Ding, A.; Ghanem, D.; Jiang, F.; Yi, F.; Zhong, F. Stage-specific, nonlinear surface ozone damage to rice production in China. Sci. Rep. 2017, 7, 44224. [Google Scholar] [CrossRef] [PubMed] [Green Version]
- Li, G.; Wei, W.; Wei, F.; Cheng, S.; Wen, W.; Wang, G. Diurnal variations of ozone and its precursors and ozone formation potential of VOCs at the boundary of a coking plant during summer and autumn. Chin. J. Environ. Eng. 2014, 8, 1130–1138. [Google Scholar]
- Fishman, J.; Creilson, J.K.; Parker, P.A.; Ainsworth, E.A.; Vining, G.G.; Szarka, J.; Booker, F.L.; Xu, X. An investigation of widespread ozone damage to the soybean crop in the upper Midwest determined from ground-based and satellite measurements. Atmos. Environ. 2010, 44, 2248–2256. [Google Scholar] [CrossRef]
- Geng, C.; Wang, Z.; Ren, L.; Wang, Y.; Wang, Q.; Yang, W.; Bai, Z. Study on the Impact of Elevated Atmospheric Ozone on Crop Yield. Res. Environ. Sci. 2014, 27, 239–245. [Google Scholar]
- Wang, T.; Cheung, V.T.; Lam, K.S.; Kok, G.L.; Harris, J.M. The characteristics of ozone and related compounds in the boundary layer of the South China coast: Temporal and vertical variations during autumn season. Atmos. Atmos. Environ. 2001, 35, 35–46. [Google Scholar] [CrossRef]
- Wang, T.; Kwok, J.Y. Measurement and analysis of a multiday photochemical smog episode in the Pearl River Delta of China. J. Appl. Meteorol. 2003, 42, 404–416. [Google Scholar] [CrossRef]
- Huang, J.P.; Fung, J.C.; Lau, A.K.; Qin, Y. Numerical simulation and process analysis of typhoon-related ozone episodes in Hong Kong. J. Geophys. Res. Atmos. 2005, 110, D05301. [Google Scholar] [CrossRef]
- Jiang, F.; Wang, T.; Wang, T.; Xie, M.; Zhao, H. Numerical modeling of a continuous photochemical pollution episode in Hong Kong using WRF chem. Atmos. Environ. 2008, 42, 8717–8727. [Google Scholar] [CrossRef]
- Wu, M.; Fan, S.; Wu, D. The characteristics of atmospheric boundary layer during tropical cyclone process and its influence on air quality over Pearl River Delta region. China Environ. Sci. 2013, 33, 1569–1576. [Google Scholar]
- Yan, R.E.; Ye, H.; Lin, X.; He, X.; Chen, C.; Shen, J.D.; Xu, K.E.; Zheng, X.; Wang, L. Characteristics and influence factors of ozone pollution in Hangzhou. Acta Sci. Circumstantiae 2018, 38, 1128–1136. [Google Scholar]
- Shen, J.; Yang, T.S.; Yan, P.Z. Characteristics and causes of ozone pollution in guangdong province. Environ. Sci. Technol. 2020, 43, 90–95. [Google Scholar]
- Wei, X.; Liu, Q.; Lam, K.S.; Wang, T. Impact of Precursor Levels and Global Warming on Peak Ozone Concentration in the Pearl River Delta Region of China. Adv. Atmos. Sci. 2012, 29, 635–645. [Google Scholar] [CrossRef]
- Zhang, Y.; Shao, K.; Tang, X. The Study of Urban Photochemical Smog Pollution in China. Acta Sci. Nat. Univ. Pekin. 1998, 34, 392–400. [Google Scholar]
- Wei, X.; He, J.; Wang, A. Regulation mechanism of high ozone pollution under the influence of tropical cyclones. Guangdong Meteorol. 2010, 32, 32–34. [Google Scholar]
- Wang, H.; Lyu, X.; Guo, H.; Wang, Y.; Zou, S.; Ling, Z.; Wang, X.; Jiang, F.; Zeren, Y.; Pan, W.; et al. Ozone pollution around a coastal region of South China Sea: Interaction between marine and continental air. Atmos. Meas. Tech. 2018, 18, 4277–4295. [Google Scholar] [CrossRef] [Green Version]
- Zhao, D.; Xin, J.; Wang, W.; Jia, D.; Wang, Z.; Xiao, H.; Liu, C.; Zhou, J.; Tong, L.; Ma, Y.; et al. Effects of the sea-land breeze on coastal ozone pollution in the Yangtze River Delta, China. Sci. Total Environ. 2022, 807, 150306. [Google Scholar] [CrossRef]
- Jiang, Z.; Li, J.; Lu, X.; Gong, C.; Zhang, L.; Liao, H. Impact of western Pacific subtropical high on ozone pollution over eastern China. Atmos. Meas. Tech. 2021, 21, 2601–2613. [Google Scholar] [CrossRef]
- Deng, T.; Wang, T.; Wang, S.; Zou, Y.; Yin, C.; Li, F.; Liu, L.; Wang, N.; Song, L.; Wu, C.; et al. Impact of typhoon periphery on high ozone and high aerosol pollution in the Pearl River Delta region. Sci. Total Environ. 2019, 668, 617–630. [Google Scholar] [CrossRef] [PubMed]
- Wang, H.; Lin, C.; Chen, X. Effects of weather condition on surface ozone distribution in FuZhou. Ecol. Environ. Sci. 2011, 20, 1320–1325. [Google Scholar]
- Wang, Y.; Wang, Z.; Chen, X.; Wang, Z.; Fan, S.; Chen, D.; Wu, Q. Impact of typical meteorological conditions on air pollution over Pearl River Delta in autumn. Acta Sci. Circumstantiae 2017, 37, 3229–3239. [Google Scholar]
- Zhan, C.; Xie, M.; Huang, C.; Liu, J.; Wang, T.; Xu, M.; Ma, C.; Yu, J.; Jiao, Y.; Li, M.; et al. Ozone affected by a succession of four landfall typhoons in the Yangtze River Delta, China: Major processes and health impacts. Atmos. Meas. Tech. 2020, 20, 13781–13799. [Google Scholar] [CrossRef]
- Wang, T.; Xue, L.; Brimblecombe, P.; Lam, Y.F.; Li, L.; Zhang, L. Ozone pollution in China: A review of concentrations, meteorological influences, chemical precursors, and effects. Sci. Total Environ. 2017, 575, 1582–1596. [Google Scholar] [CrossRef]
- Chen, Z.; Liu, J.; Cheng, X.; Yang, M.; Wang, H. Positive and negative influences of landfalling typhoons on tropospheric ozone over southern China. Atmos. Chem. Phys. 2021, 21, 16911–16923. [Google Scholar] [CrossRef]
- Jiang, Y.C.; Zhao, T.L.; Liu, J.; Xu, X.D.; Tan, C.H.; Cheng, X.H.; Bi, X.Y.; Gan, J.B.; You, J.F.; Zhao, S.Z. Why does surface ozone peak before a typhoon landing in southeast China. Atmos. Chem. Phys. 2015, 15, 13331–13338. [Google Scholar] [CrossRef] [Green Version]
- Yue, H.; Gu, T.; Wang, C.; Wu, D.; Deng, X.; Huang, J.; Wang, Y. Influence of typhoon Nida process on ozone concentration in Guangzhou. Acta Sci. Circumstantiae 2018, 38, 4565–4572. [Google Scholar]
- Chen, L.; Guo, S.; Hu, T.; Gao, Y. Analyse on the ozone distribution pattern and the relationship with typhoon process in the Pacific Northwest. J. Yunnan Univ. Nat. Sci. Ed. 2017, 39, 810–819. [Google Scholar]
- Yu, W.; Luo, X.; Fan, S.; Liu, J.; Feng, Y.; Fan, Q. Characteristics analysis and numerical simulation of a heavy pollution process in the pearl river delta. Environ. Sci. Res. 2011, 24, 645–653. [Google Scholar]
- Wei, X.; Lin, J.; Wang, T. Numerical simulation and mechanism study of high ozone pollution in the Pearl River Delta caused by typhoon Begonia. In Proceedings of the Branch Venue of Urban Meteorological Fine Forecast and Service of the 28th Annual Meeting of the Chinese Meteorological Society, Xiamen, China, 2 November 2011; pp. 1–15. [Google Scholar]
- Chen, D.; Su, T. Analysis on distribution characteristics of substances in TTL region during typhoon Matsa. J. Meteorol. Sci. 2016, 36, 760–769. [Google Scholar]
- Huang, B.; Bai, J.; Liu, J.; Zhong, Z. Retrieval of clear sky atmospheric souding profile around typhoon Rananim using infrared hyperspectral measurements airs. J. Trop. Meteorol. 2007, 23, 401–408. [Google Scholar]
- Liu, Y.; Zou, X. Quality Control of FY-3A Total Column Ozone and Its Application in Typhoons Tembin (2012) and Isaac (2012). Chin. J. Atmos. Sci. 2014, 38, 1066–1078. [Google Scholar]
- Tang, L.; Wei, M.; Sun, X.; Li, H. Analysis on cloud phase state of the typhoon saomai with MODIS data. J. Trop. Meteorol. 2010, 26, 790–794. [Google Scholar]
- Li, L.; Hu, J.; Li, J.; Gong, K.; Wang, X.; Ying, Q.; Qin, M.; Liao, H.; Guo, S.; Hu, M. Modelling air quality during the EXPLORE-YRD campaign–Part II. Regional source apportionment of ozone and PM2.5. Atmos. Environ. 2021, 247, 118063. [Google Scholar] [CrossRef]
- Ozone Pollution Control Committee of Chinese Academy of Environmental Sciences. China’s Blue Book on the Prevention and Control of Atmospheric Ozone Pollution, 2020 ed.; Science Press: Beijing, China, 2020. [Google Scholar]
- Lang, S.; Tao, D.; Zhen-Ning, L.; Chen, W.; Guo-Wen, H.; Fei, L.; Meng, W.; Dui, W. Retrieval of Boundary Layer Height and Its Influence on PM 2.5 Concentration Based on Lidar Observation over Guangzhou. J. Trop. Meteorol. 2021, 27, 303–318. [Google Scholar] [CrossRef]
- Li, L.; He, Y.; Lan, Z.; Li, Y.; Yang, H.; Fang, S. Environmental meteorological characteristics of ozone pollution in Shenzhen. Acta Sci. Circumstantiae 2023, 43, 109–118. [Google Scholar]
- Ying, M.; Zhang, W.; Yu, H.; Lu, X.; Feng, J.; Fan, Y.; Zhu, Y.; Chen, D. An Overview of the China Meteorological Administration Tropical Cyclone Database. J. Atmos. Ocean Technol. 2014, 31, 287–301. [Google Scholar] [CrossRef] [Green Version]
- Lu, X.; Yu, H.; Ying, M.; Zhao, B.; Zhang, S.; Lin, L.; Bai, L.; Wan, R. Western North Pacific Tropical Cyclone Database Created by the China Meteorological Administration. Adv. Atmos. Sci. 2021, 38, 690–699. [Google Scholar] [CrossRef]
- Papayannis, A.; Ancellet, G.; Pelon, J.; Mégie, G. Multi-wavelength lidar for ozone measurements in the troposphere and the lower stratosphere. Appl. Opt. 1990, 29, 467–476. [Google Scholar] [CrossRef]
- Cao, K.F.; Huang, J.; Hu, S.X. Investigation of stimulated Raman scattering characteristics in D2, H2 and D2/H2mixtures. Acta Opt. Sin. 2015, 35, 0319001. [Google Scholar]
- Li, Y.T.; Sun, T.L.; He, L. Vertical distribution characteristics of ozone pollution in Shenzhen in autumn. China Environ. Sci. 2020, 40, 1975–1981. [Google Scholar]
- Jiang, Y.C.; Zhang, H.Y.; Zhang, W. Analysis of urban boundary layer characteristics based on ground-based remote sensing data in Xiamen. Acta Sci. Circumstantiae 2020, 40, 450–458. [Google Scholar]
- Wang, Y.; Zhang, W.; Zhao, Y. Analysis of Wind Characteristics of Wind-Profiler Radars and Their Quality Control Methods for Data Assimilation. Chin. J. Atmos. Sci. 2021, 45, 123–147. (In Chinese) [Google Scholar] [CrossRef]
- Jiang, Y.C.; Zheng, H.; Jiang, Z.X.; Jiang, Y.; Zheng, H.; Jiang, Z.; Chen, S.; Chen, D.; Zhao, T.; Wang, H.; et al. Study on spring particle matter pollution in coastal cities over West Bank of Taiwan Strait based on multi-source observations. Acta Sci. Circumstantiae 2018, 38, 1739–1750. [Google Scholar]
- Xu, D.; Cao, P.; Wang, Y. Study of the Vertical Distribution of Aerosol Optical Properties During a Heavy Pollution Event in Chengdu. Meteorol. Mon. 2020, 46, 948–958. [Google Scholar] [CrossRef]
- Hersbach, H.; Bell, B.; Berrisford, P.; Hirahara, S.; Horanyi, A.; Muñoz-Sabater, J.; Nicolas, J.; Peubey, C.; Radu, R.; Schepers, D.; et al. The ERA5 global reanalysis. Q. J. R. Meteorol. Soc. 2020, 146, 1999–2049. [Google Scholar] [CrossRef]
- Hoffmann, L.; Günther, G.; Li, D.; Stein, O.; Wu, X.; Griessbach, S.; Heng, Y.; Konopka, P.; Müller, R.; Vogel, B.; et al. From ERA-Interim to ERA5: The considerable impact of ECMWF’s next-generation reanalysis on Lagrangian transport simulations. Atmos. Chem. Phys. 2019, 19, 3097–3124. [Google Scholar] [CrossRef] [Green Version]
- Gobbi, G.P. Polarization Lidar return from aerosols and thin clouds: A framework for the analysis. Appl. Opt. 1998, 37, 5505–5508. [Google Scholar] [CrossRef]
- Bian, Y.X.; Zhao, C.S.; Ma, N.; Chen, J.; Xu, W.Y. A study of aerosol liquid water content based on hygroscopicity measurements at high relative humidity in the North China Plain. Atmos. Chem. Phys. 2014, 14, 6417–6426. [Google Scholar] [CrossRef]


| Year | Month | Day | Longitude (E, Degree) | Latitude (N, Degree) |
|---|---|---|---|---|
| 2019 | 6 | 27 | 130.4 | 28.5 |
| 2019 | 7 | 19 | 124.1 | 29 |
| 2019 | 7 | 20 | 125.6 | 34.2 |
| 2019 | 8 | 6 | 130.6 | 33 |
| 2019 | 8 | 9 | 123.4 | 26.5 |
| 2019 | 8 | 15 | 132.5 | 32.7 |
| 2019 | 9 | 6 | 125 | 28.1 |
| 2019 | 9 | 8 | 125 | 28.3 |
| 2019 | 9 | 9 | 123.9 | 31.8 |
| 2019 | 9 | 21 | 125.7 | 26.1 |
| 2019 | 9 | 22 | 126.8 | 30.8 |
| 2019 | 10 | 2 | 123.9 | 31.9 |
| 2019 | 11 | 23 | 125.7 | 25.2 |
| 2019 | 11 | 24 | 126.5 | 30 |
| 2020 | 8 | 3 | 123.4 | 25 |
| 2020 | 8 | 10 | 127.6 | 32.1 |
| 2020 | 8 | 23 | 123.9 | 26.3 |
| 2020 | 8 | 24 | 126.2 | 27.3 |
| 2020 | 8 | 25 | 125.8 | 29.1 |
| 2020 | 8 | 26 | 124.5 | 32.4 |
| 2020 | 9 | 1 | 126.1 | 26.9 |
| 2020 | 9 | 2 | 126.9 | 30.5 |
| 2020 | 9 | 6 | 130.4 | 27.7 |
| 2020 | 10 | 8 | 132.8 | 27.9 |
| 2021 | 6 | 5 | 124 | 24.9 |
| 2021 | 7 | 24 | 124.6 | 26.4 |
| 2021 | 8 | 8 | 126.5 | 29.1 |
| 2021 | 8 | 4 | 124.6 | 24.8 |
| 2021 | 8 | 5 | 127.2 | 26.2 |
| 2021 | 8 | 6 | 131.7 | 26.8 |
| 2021 | 8 | 23 | 125.2 | 29.1 |
| 2021 | 9 | 13 | 123.6 | 29.1 |
| 2021 | 9 | 14 | 123.9 | 31.3 |
| 2021 | 9 | 15 | 125.7 | 30.3 |
| 2021 | 9 | 16 | 125.1 | 30.5 |
| 2021 | 9 | 17 | 127.5 | 32.9 |
| Category | Parameter | Units | Time | Periods |
|---|---|---|---|---|
| Observational data of atmospheric components | O3, PM10, PM2.5, NO2, SO2 | µg/m3 | LCT | 2019–2021 |
| Ozone profile | ppbv | LCT | 14–17 September 2021 | |
| Measurements of meteorology | Air temperature (AirT), relative humidity (RH), wind and rain data | AirT: °C RH: % Wind speed: m/s Rain: mm | UTC convert to LCT | 14–17 September 2021 |
| Wind profile | Horizontal wind speed: m/s Horizontal wind direction: ° Vertical velocity: m/s (+: upward, −: downward) | UTC convert to LCT | 14–17 September 2021 | |
| Relative humidity profile | % | UTC convert to LCT | 14–17 September 2021 | |
| Profiles of depolarization ratio, extinction coefficient, and the height of pollution boundary layer | Extinction coefficient: Km−1 Height of pollution boundary layer: m | LCT | 14–17 September 2021 |
Disclaimer/Publisher’s Note: The statements, opinions and data contained in all publications are solely those of the individual author(s) and contributor(s) and not of MDPI and/or the editor(s). MDPI and/or the editor(s) disclaim responsibility for any injury to people or property resulting from any ideas, methods, instructions or products referred to in the content. |
© 2023 by the authors. Licensee MDPI, Basel, Switzerland. This article is an open access article distributed under the terms and conditions of the Creative Commons Attribution (CC BY) license (https://creativecommons.org/licenses/by/4.0/).
Share and Cite
Li, F.; Zheng, Q.; Jiang, Y.; Xun, A.; Zhang, J.; Zheng, H.; Wang, H. Impact Analysis of Super Typhoon 2114 ‘Chanthu’ on the Air Quality of Coastal Cities in Southeast China Based on Multi-Source Measurements. Atmosphere 2023, 14, 380. https://doi.org/10.3390/atmos14020380
Li F, Zheng Q, Jiang Y, Xun A, Zhang J, Zheng H, Wang H. Impact Analysis of Super Typhoon 2114 ‘Chanthu’ on the Air Quality of Coastal Cities in Southeast China Based on Multi-Source Measurements. Atmosphere. 2023; 14(2):380. https://doi.org/10.3390/atmos14020380
Chicago/Turabian StyleLi, Fei, Qiuping Zheng, Yongcheng Jiang, Aiping Xun, Jieru Zhang, Hui Zheng, and Hong Wang. 2023. "Impact Analysis of Super Typhoon 2114 ‘Chanthu’ on the Air Quality of Coastal Cities in Southeast China Based on Multi-Source Measurements" Atmosphere 14, no. 2: 380. https://doi.org/10.3390/atmos14020380