Article

Physical Explanation for Paradoxical Climate Change in Semi-Arid Inland Eurasia Based on a Remodeled Precipitation Recycling Ratio and Clausius–Clapeyron Equation

1
College of Physical Science and Technology, Yangzhou University, Yangzhou 225002, China
2
College of Atmospheric Sciences, Nanjing University of Information Science and Technology, Nanjing 210044, China
3
Laboratory for Climate Studies, National Climate Center, China Meteorological Administration, Beijing 100081, China
4
Guangdong Provincial Laboratory of Marine Science and Engineering, Zhuhai 519000, China
5
Department of Mathematics, North University of China, Taiyuan 030051, China
*
Authors to whom correspondence should be addressed.
Atmosphere 2023, 14(2), 376; https://doi.org/10.3390/atmos14020376
Submission received: 24 November 2022 / Revised: 7 February 2023 / Accepted: 11 February 2023 / Published: 14 February 2023

Abstract

:
Under global warming, the climate in semi-arid inland Eurasia (SAIE) has changed in an opposite manner, thereby seriously impacting the local ecological environment. However, the key influencing factors and physical mechanism remain inconclusive. In this paper, we remodel the precipitation recycling ratio (PRR) model to assess the contributions of moisture from different water vapor sources to local precipitation, analyze the characteristics of the PRR and precipitation in SAIE, and provide possible physical reasons based on the Clausius–Clapeyron equation. It is found that the PRR increased from 1970 to 2017 as the result of linear trend analysis, with obvious seasonality. Moreover, the component of precipitation contributed by locally evaporated moisture (Pl), and that contributed by advected moisture (Pa) as well as the total precipitation (P), increased during the past 48 years. In particular, the Pa, Pl, and P in autumn and winter all increased obviously during the past 20 years from the interdecadal change trend, as well as the PRR (Pl/P), which was opposite to the decrease in the total water vapor input I(Ω) in the horizontal direction. According to the Clausius–Clapeyron equation, one of the causes might be that global warming has accelerated the local water cycle and driven the increase in Pa, and the increase in atmospheric water holding capacity caused by global warming provides the power source. We suggest that the climate’s transformation from dry to wet in SAIE can only be temporary since SAIE is an inland area and the adjustment of atmospheric circulation did not lead to the increase in external water vapor.

1. Introduction

Changes in the intensity and location of precipitation caused by climate warming are potentially one of the most severe impacts on humans and ecosystems [1,2]. In recent years, global warming has continued to intensify, leading to changes in carbon and water cycles in some parts of the world [3,4,5,6,7], such as semi-arid inland Eurasia (SAIE). These areas are far from the ocean and the climate in these areas, moving towards one characterized by drought, is causing their ecosystems to be highly sensitive to global warming [8]. Local changes of precipitation play an important role in their agriculture, ecology, environment, and water resources [9,10]. For these reasons, scientists have in recent years studied the characteristics of the climate, ecological environment, and water resources in SAIE from different perspectives. At the beginning of the 21st century, Shi et al. [11] put forward the hypothesis that the climate in eastern Northwest China—part of SAIE—has been moving from one that is characterized by warm and dry conditions to one of warm and humid conditions. However, Zhang et al. [12] revealed that western Northwest China has become gradually wetter since the 1980s, mainly because of the influence of westerlies, while SAIE has shown a tendency to dry out from the end of 1970s to the beginning of the 21st century, largely as a result of the weakening of the Asian monsoon [13]. Thus, it remains unclear as to whether this area is becoming drier or wetter and, either way, what factors are causing these changes and how long the transition will last. These issues have unsurprisingly captured the attention of meteorologists. For example, recently, Ma et al. [14] systematically analyzed the annual precipitation in SAIE and concluded that it has shown a decreasing trend in the past 58 years but a significant increase from the beginning of 21st century to 2017, especially during the last 8 years. In other words, a turning point of precipitation in SAIE has occurred, changing from a decreasing to increasing trend.
The water vapor that forms regional precipitation can generally be divided into two sources—the advective component and the local evaporation component [15]—supported by the external water cycle and the internal water cycle, which refers to the process that water vapor evaporates from the local surface and enters the atmosphere, then part condenses to form the local precipitation. Therefore, the regional total precipitation P also can be divided into the advective component Pa and the local evaporation component Pl (Figure 1) according to the evaluation model for the precipitation recycling ratio (PRR), which is a diagnostic indicator of the interaction between the surface hydrology and regional climate and usually provides useful information for studying the interaction between the hydrology and climate [16,17]. The PRR is defined as the contribution of locally evaporated water to precipitation in the area. It can be expressed as [16]
r = S P l ( x , y ) d S S P ( x , y ) d S
where S is the area of the region. For one grid point in the region, the PRR can be expressed as
ρ ( x , y ) = P l ( x , y ) / P ( x , y ) .
Scientists have been evaluating the PRR since its emergence in the 1950s. For example, Budyko and Drozdov [18] developed for the first time a one-dimensional linear model for estimating large-scale regional precipitation recirculation. Salati et al. [19] analyzed the O18 isotope data of precipitation at different sites in the Amazon Basin and found that re-evaporated water has an important effect on regional precipitation and one which varies seasonally and with the location. However, they did not estimate the PRR numerically. Brubaker et al. [20] established a two-dimensional precipitation recycling model and estimated the PRR in large-scale regions including Eurasia, North America, South America, and Africa. Later, Eltahir et al. [21] defined the PRR as the contribution ratio of the moisture from the mother area Ω to the whole moisture for the subregion,
ρ = I Ω + e I + e ,
where e, I, and IΩ are the evaporation from the subregion, the total moisture transported into the subregion from outside, and the part of the total moisture input into the subregion from area Ω, respectively. In the late 1990s, Schär et al. [22] used the IMB model (model based on integral moisture budget) to apply the water vapor balance equation for each part of precipitation to the entire area as the whole integral and ignored the IΩ in the Eltahir model to obtain
ρ = e I + e .
Van der Ent [23] proposed a numerical implementation plan and used gridded data to calculate the regional PRR. Wu et al. [24] evaluated the PRR in CE and found that the annual PRR fluctuated between 4% and 10% and increased at a rate of 0.3%/10 yr. In recent years, Kang et al. [25], Fu et al. [26], and Li et al. [27] also used different data and methods to evaluate or predict the PRR over many different regions.
The analysis of precipitation recycling requires a clear representation of the change characteristics of both the advective and evaporation components; the latter reflects whether the regional hydrological cycle is active. Therefore, assessing the PRR over a region is essential to describe its water balance and, in the present context, to help better understand the different trends between “dry–get drier” and “dry–get wetter” in inland Eurasia, especially in SAIE. Therefore, in combination with the turning point of precipitation in CE under global warming, we quantitatively evaluate the atmospheric PRR over SAIE based on the complete physical process of regional moisture feedback, taking the central arid and semi-arid region (95°–110° E, 33°–43° N) as the test case (Figure 2). Specifically, by analyzing the temporal evolution of atmospheric moisture circulation, we aim to answer the following questions: (1) What are the spatial–temporal evolution characteristics of the PRR and its every component of Pa and Pl in SAIE? (2) How have they responded to climate warming? (3) Will the climate in SAIE become drier or wetter in the future?

2. Data and Model Restructuring

2.1. Data

We used meteorological data from the National Centers for Environmental Prediction–National Center for Atmospheric Research (NCEP/NCAR) reanalysis datasets, including the daily specific humidity and the zonal and meridional wind speeds at the eight lowest pressure levels (300–1000 hPa) and surface pressure (https://psl.noaa.gov/data/gridded/data.ncep.reanalysis.html, accessed on 23 November 2022). The precipitation in this study is the gridded daily scale dataset of CN05.1. As with Xu et al. (2009), the CN05.1 dataset is constructed by the “anomaly approach” during the interpolation but with more station observations (~2400) in China (Wu and Gao, 2013). In the “anomaly approach”, a gridded climatology is first calculated, and then a gridded daily anomaly is added to the climatology to obtain the final dataset [28,29]. The evaporation data were integrated from six datasets, including the NCEP/NCAR Reanalysis1 dataset, the NCEP–Department of Energy Reanalysis2 dataset, the 40-year European Centre for Medium-Range Weather Forecasts (ECMWF) Reanalysis (ERA-40) and Interim Reanalysis (ERA-Interim) datasets, the Modern-Era Retrospective Analysis for Research and Applications (MERRA) dataset, and the Climate Forecast System Reanalysis (CFSR) dataset [30]. All the reanalysis data were available on a 2.5° × 2.5° grid and covered the period 1970–2017.
In this paper, spring is from March to May, summer is from June to August, autumn is from September to November, and winter is from December to February of the next year. Further, the trends of all variables are calculated by linear trend and are carried out by a significance test at the 95% confidence level.

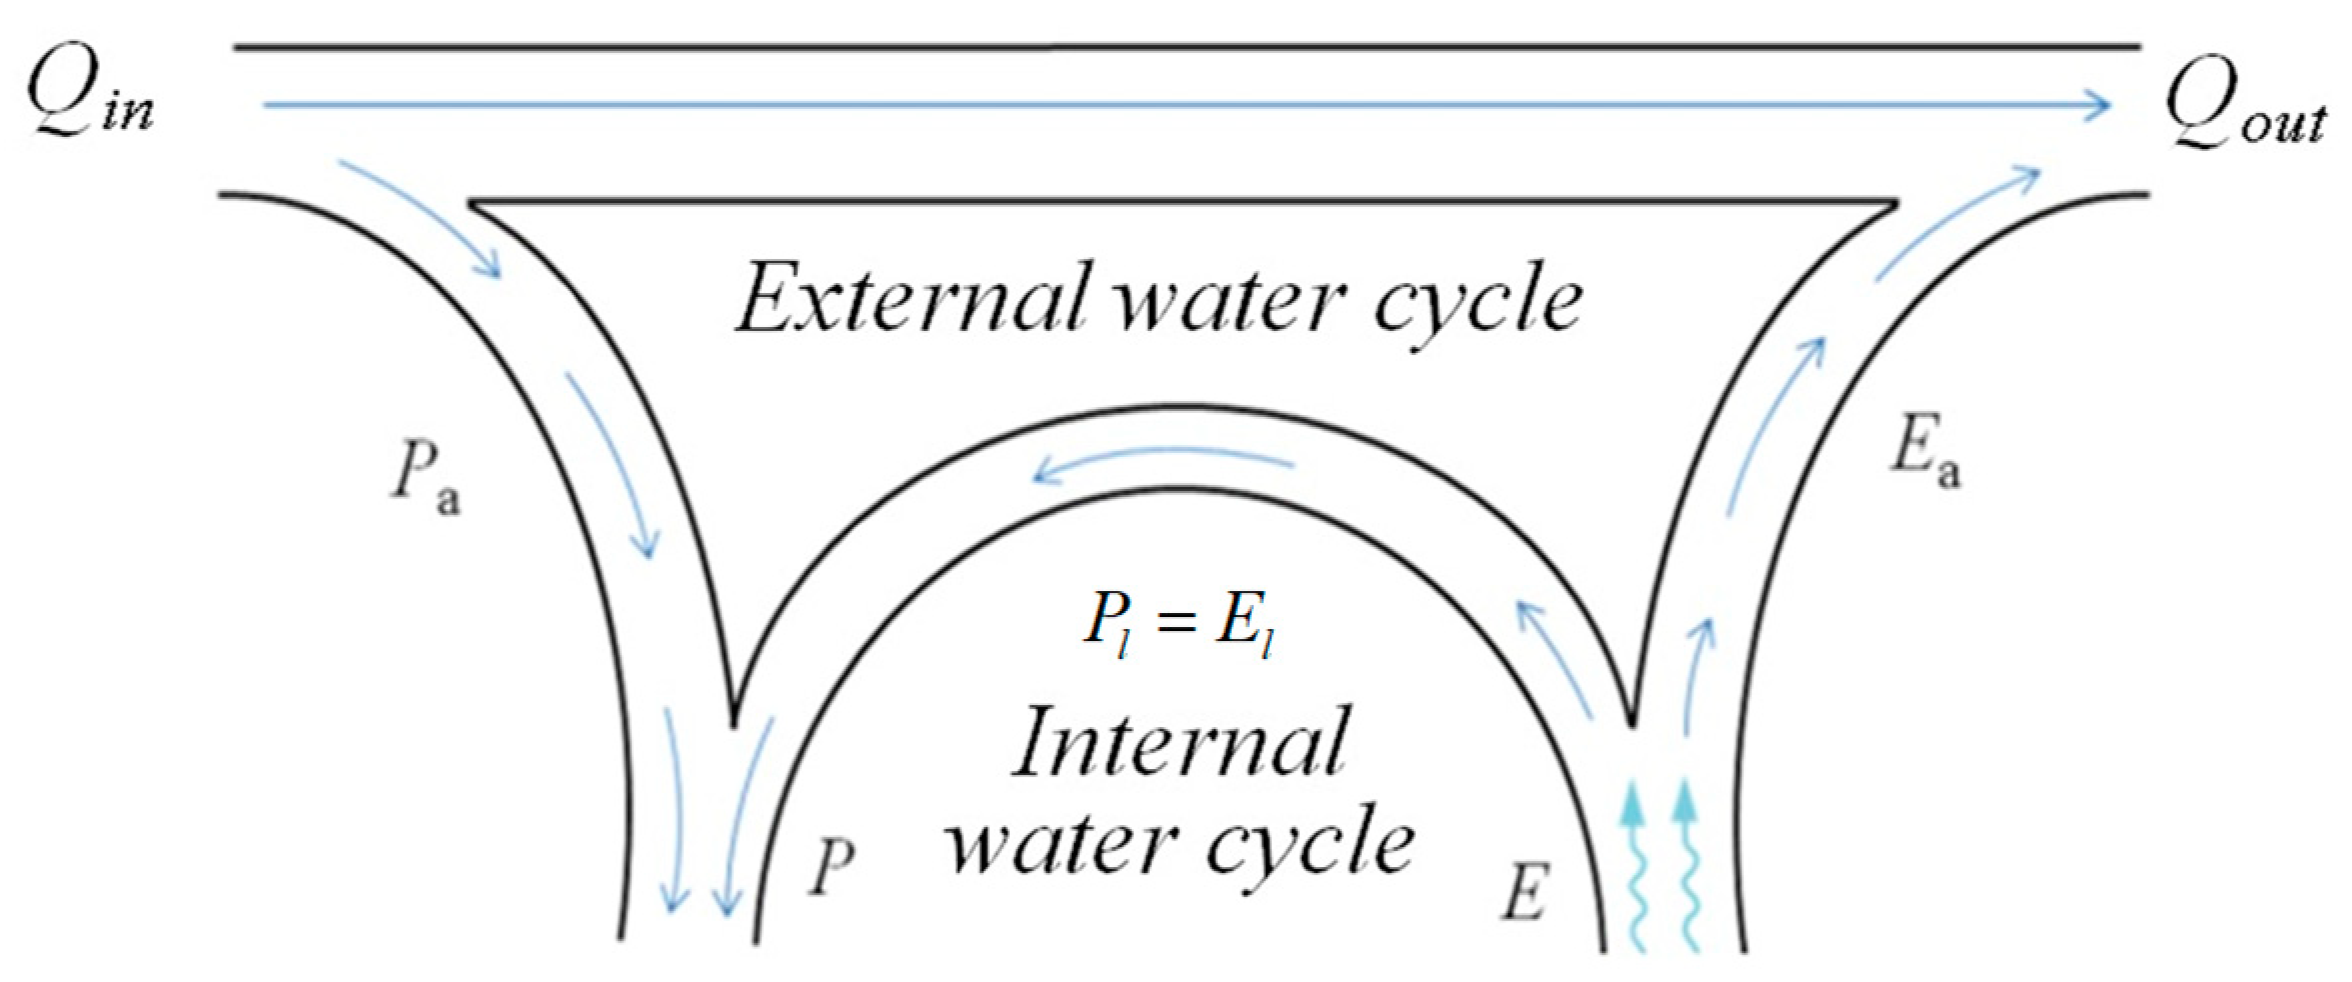
2.2. Restructuring of the PRR Model

The establishment of the recycling model is based on two assumptions: (1) that the water vapor in the atmosphere (whether from local evaporation or advected moisture) is fully mixed; and (2) that the atmospheric water vapor in the air core remains stable [16]. That is, the increment of atmospheric precipitable water Δw during the period ΔT = t2t1 can be ignored in the atmospheric water vapor balance equation for a certain region:
Δ w + t 1 t 2 ( q u ) x d t + t 1 t 2 ( q v ) y d t = t 1 t 2 e ( t ) d t t 1 t 2 p ( t ) d t ,
where q is relative humidity; u and v are the zonal and meridional winds, respectively; x and y represent longitude and latitude, respectively; and e(t) and p(t) are evaporation and precipitation at time t.
Whether the atmospheric water vapor is in balance depends on the degree of match between the temporal and regional spatial scales. We defined a water vapor balance index λ to judge the balance, defined as
λ = Δ w t 1 t 2 e ( t ) d t ,
where Δ w = w t 2 w t 1 represents the difference in atmospheric water vapor content between t1 and t2, and t 1 t 2 e ( t ) d t represents the amount of water vapor evaporated into the region during the period from t1 to t2. For a certain region, if λ ≤ 0.05, it is determined that the atmospheric water vapor content remains stable. The critical value, ΔT = t2t1, of stable atmospheric water vapor content can be obtained via the above method. The time scale of the subsequent calculation in the recycling model must be greater than or equal to ΔT.
Based on theory and assumptions, Eltahir [21] proposed a calculation model in which the recycling ratio of water vapor provided by region Ω to the precipitation of subregion ΔA is ρ = (IΩ + e)/(I + e). In this formula, I is the total amount of water vapor flowing into subregion ΔA through the advection term, IΩ is the part of I from the parent region (Ω), and e is the evaporation in the subregion. If it is assumed that (x, y) is a grid point in Ω, the recycling ratio of water vapor provided by Ω to its subregion (x, y) to form precipitation is
ρ Ω ( x , y ) = I Ω ( x , y ) + e ( x , y ) I ( x , y ) + e ( x , y ) .
The recycling ratio ρΩ(x, y) provided by the emphasized Ω to the subregion (x, y) is used in the above formula. Because e(x, y) here only calculates the evaporation from the subregion (x, y) but does not include the evaporation from the other subregion in Ω, we remodeled it as
ρ Ω ( x , y ) = I ( x , y ) e ( Ω ) e ( x , y ) e ( Ω ) e ( x , y ) + I ( Ω ) + e ( x , y ) I ( x , y ) + e ( x , y ) ,
where e(Ω) is the evaporation from the parent region Ω, and the data are the integrating results of five sets of reanalysis data according to the Budyko equation [30]
E = p × E 0 ( p n + E 0 n ) 1 / n ,
where p and E0 are precipitation and potential evaporation, respectively.
I(Ω) and I(x, y) in Equation (8) and Qin in Figure 1 and part one of the results in this paper refer to the total water vapor input into the region from four boundaries of the region in the horizontal direction, without deducting the water vapor output from the boundary. The part of which from each boundary can be calculated as the following equation based on the method for water vapor flux [31]:
F l u x = 1 g | v | q Δ l Δ p .
In this equation, g is gravitational acceleration, q is specific humidity, Δl is the length of boundary, Δp is the pressure difference between the ground and the top of the atmosphere, and | v | is u wind or v wind—it should be replaced by u wind for east and west boundaries and by v wind for south and north boundaries.
If the stable condition of the atmospheric water vapor content in Ω is ΔT, then the PRRrΩt) in Δtt ≥ ΔT) can be expressed by the relevant data of the regional grid points as follows [23]:
r Ω ( Δ t ) = t = t b e g i n t = t e n d [ ( x , y ) Ω P ( t , x , y ) ρ Ω ( x , y , t ) ] t = t b e g i n t = t e n d [ ( x , y ) Ω P ( t , x , y ) ] ,
where tend = tbegin + Δt and P(x, y, t) represents the precipitation of grid point (x, y). Substituting the improved ρΩ (x, y, t) into the above formula enables the PRR rΩt) to be calculated.

3. Results

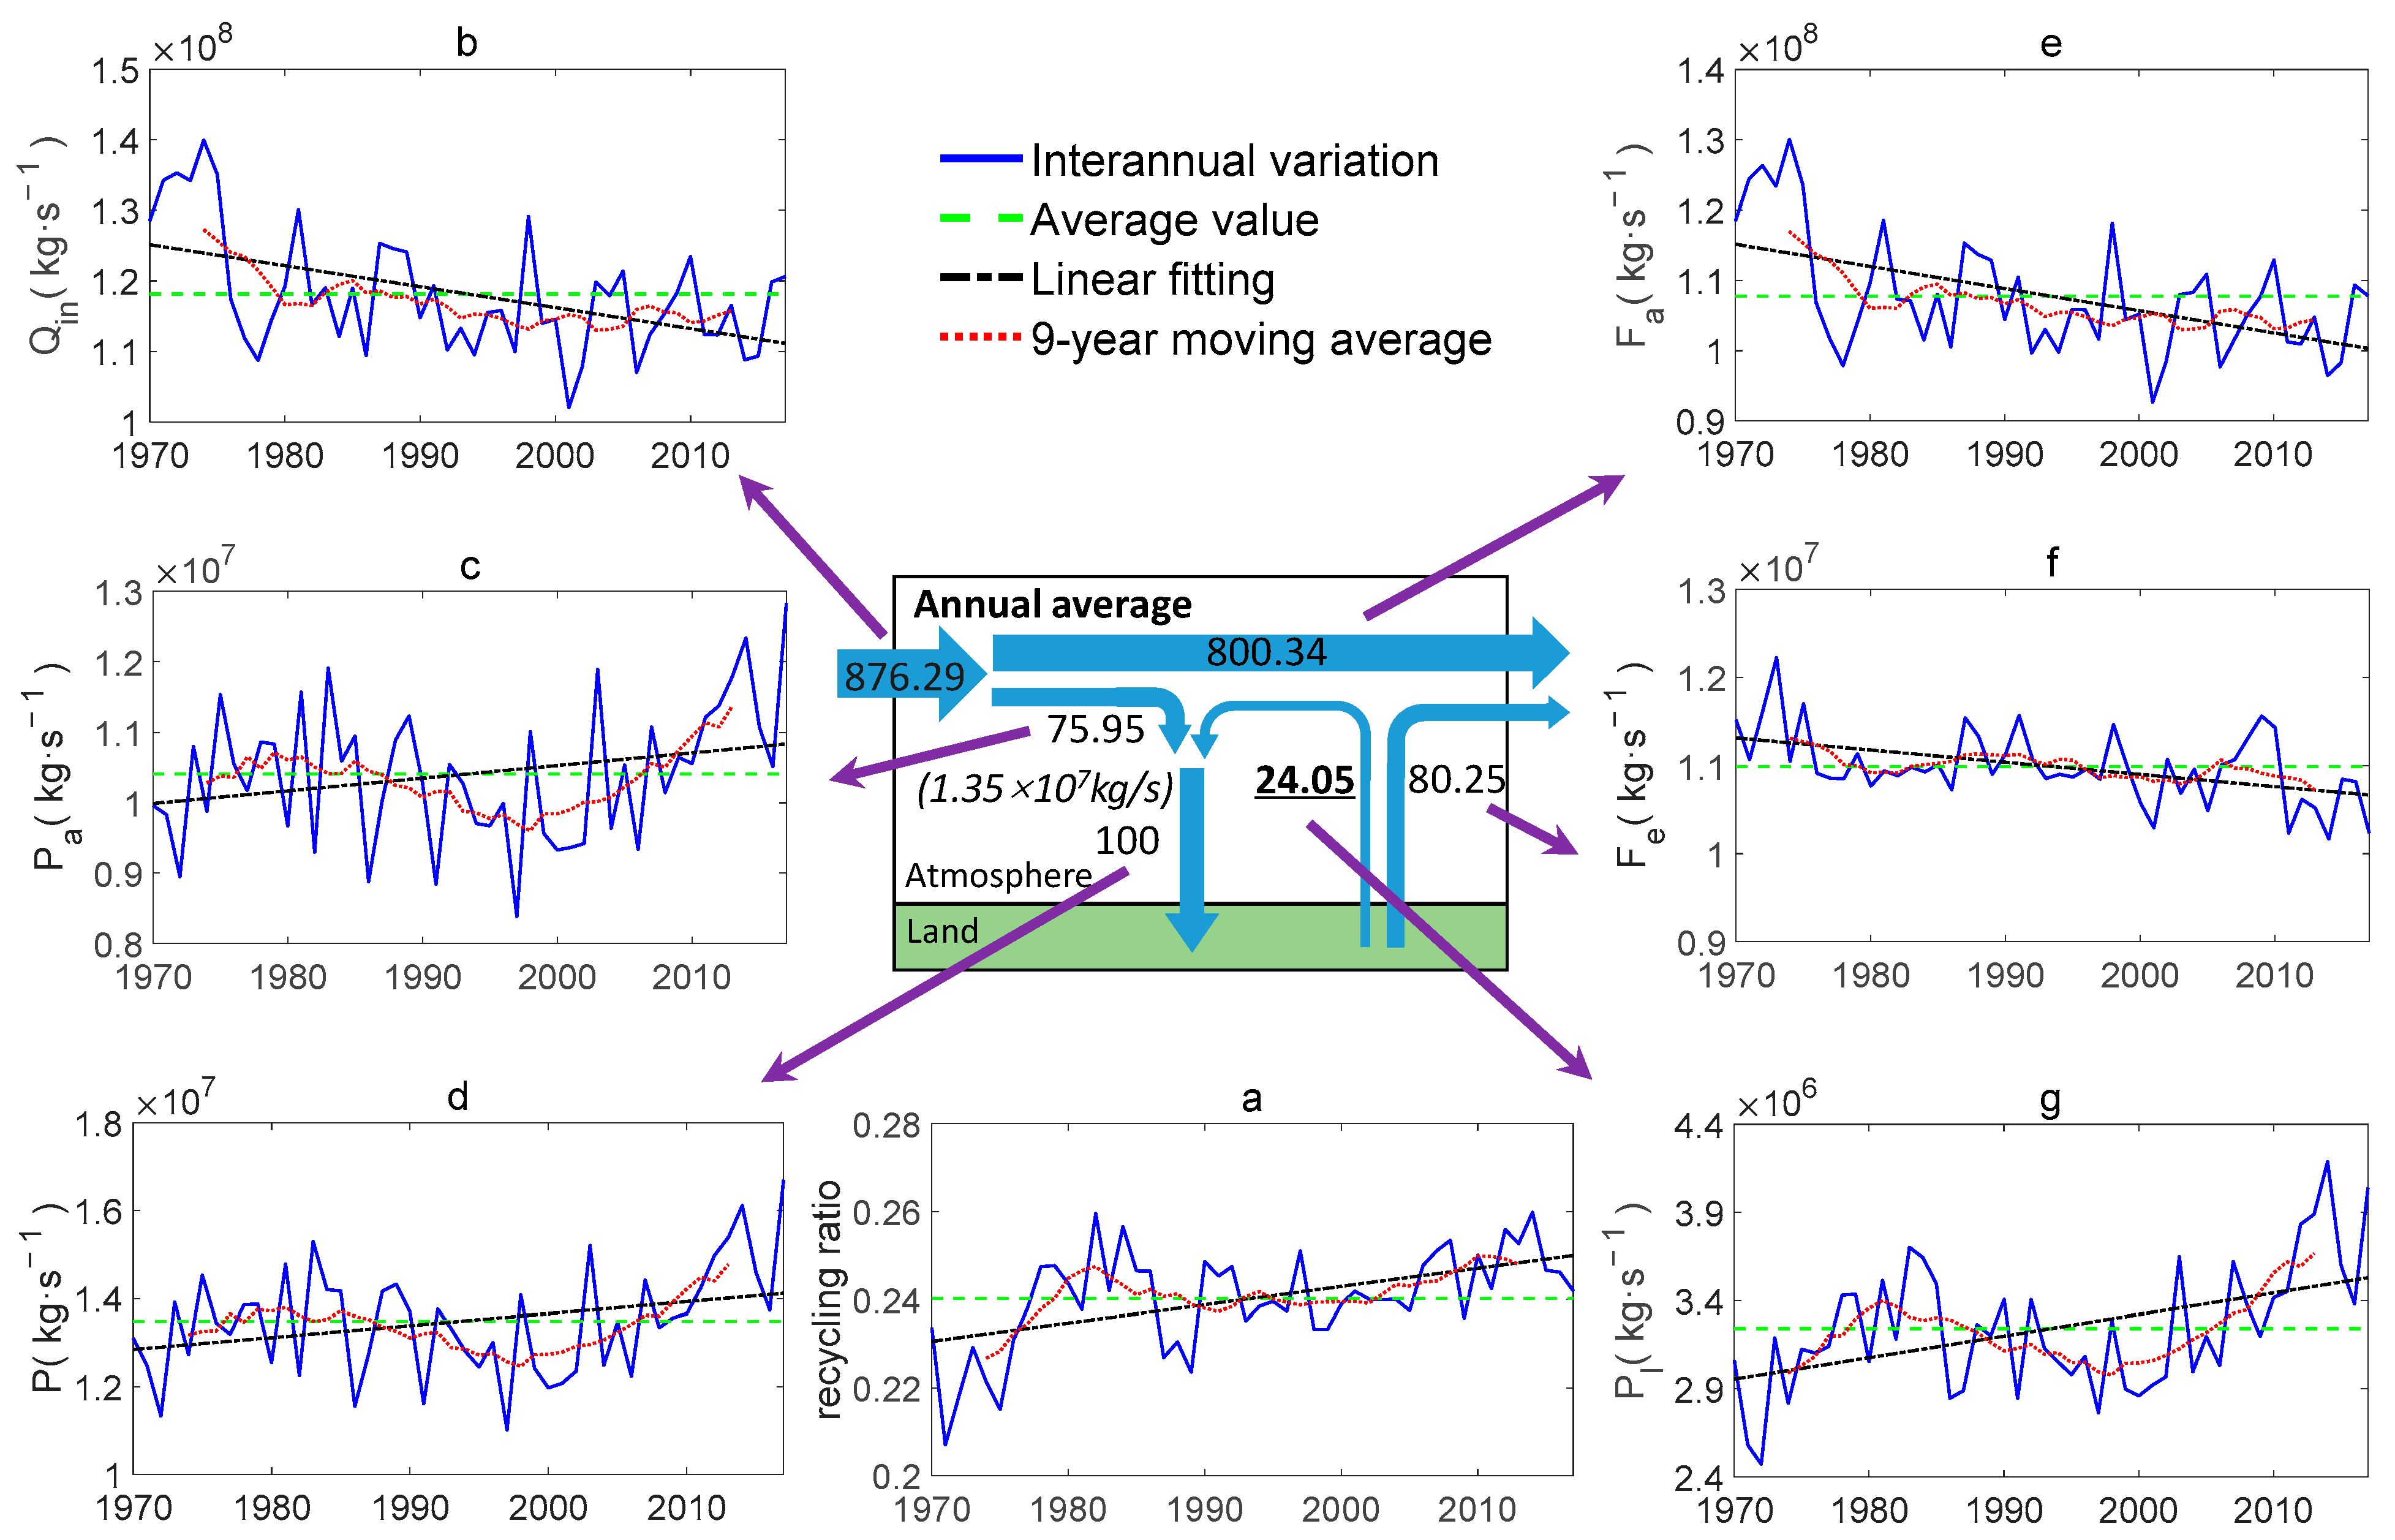
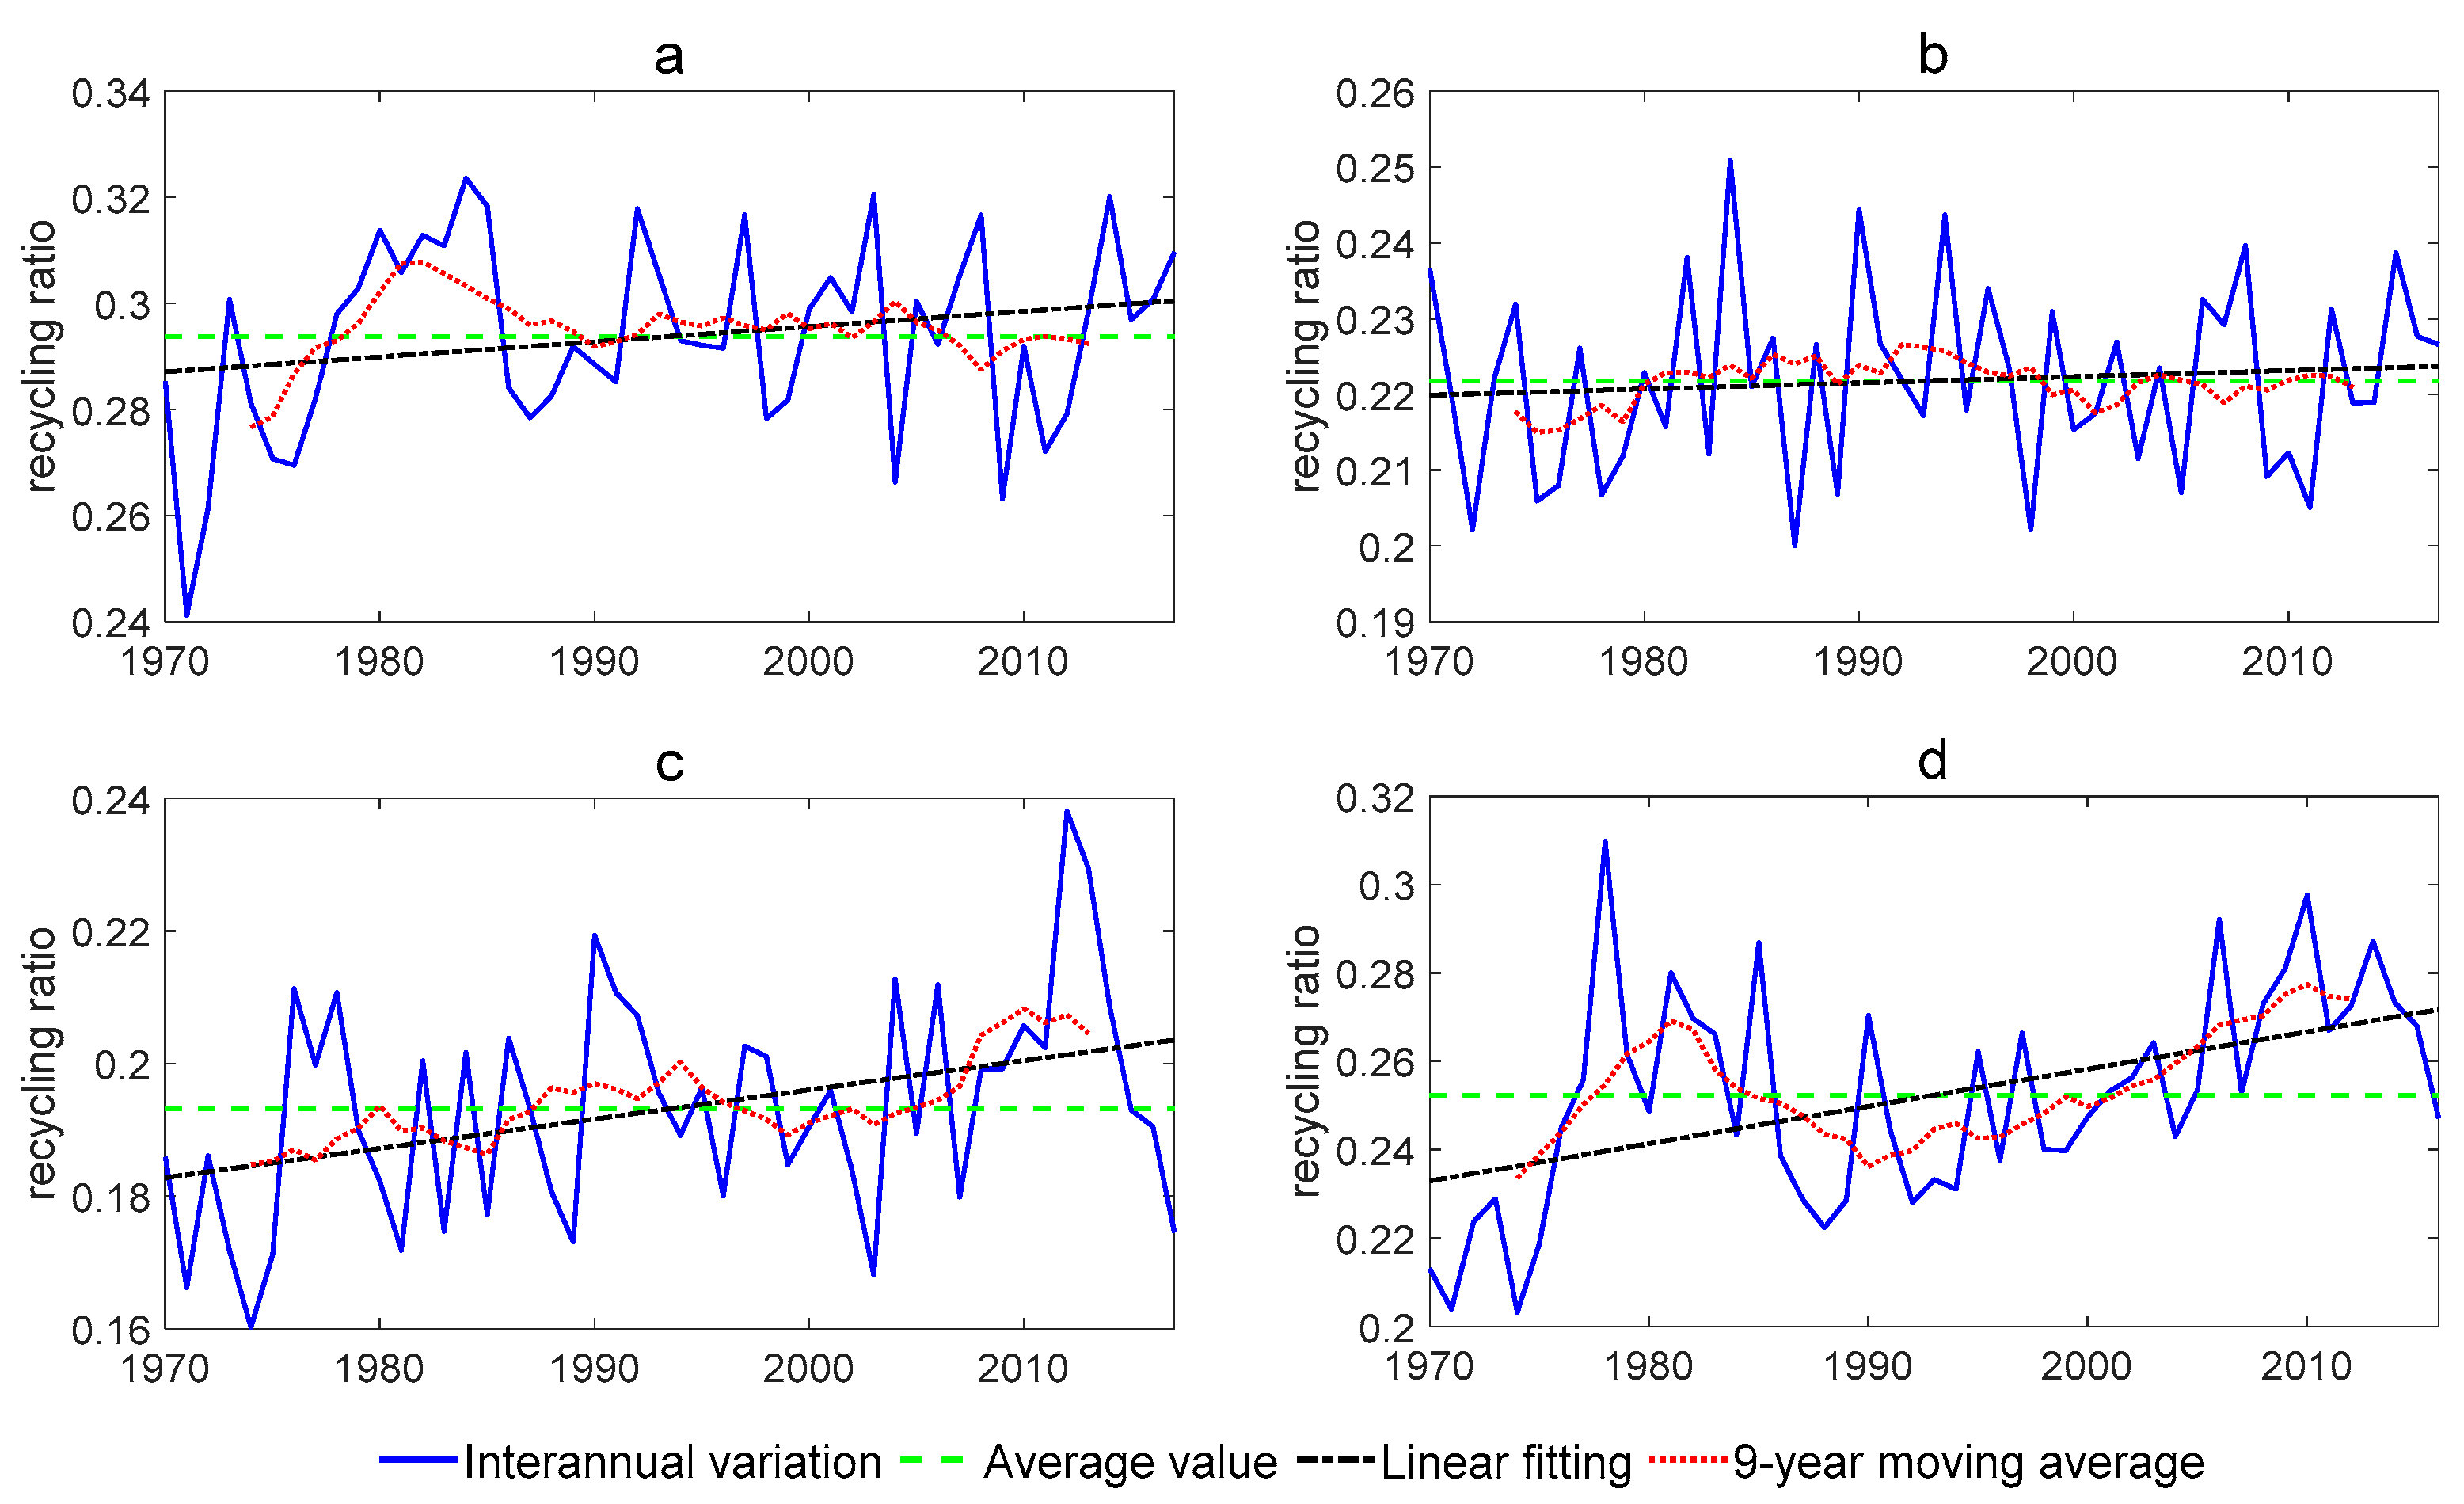
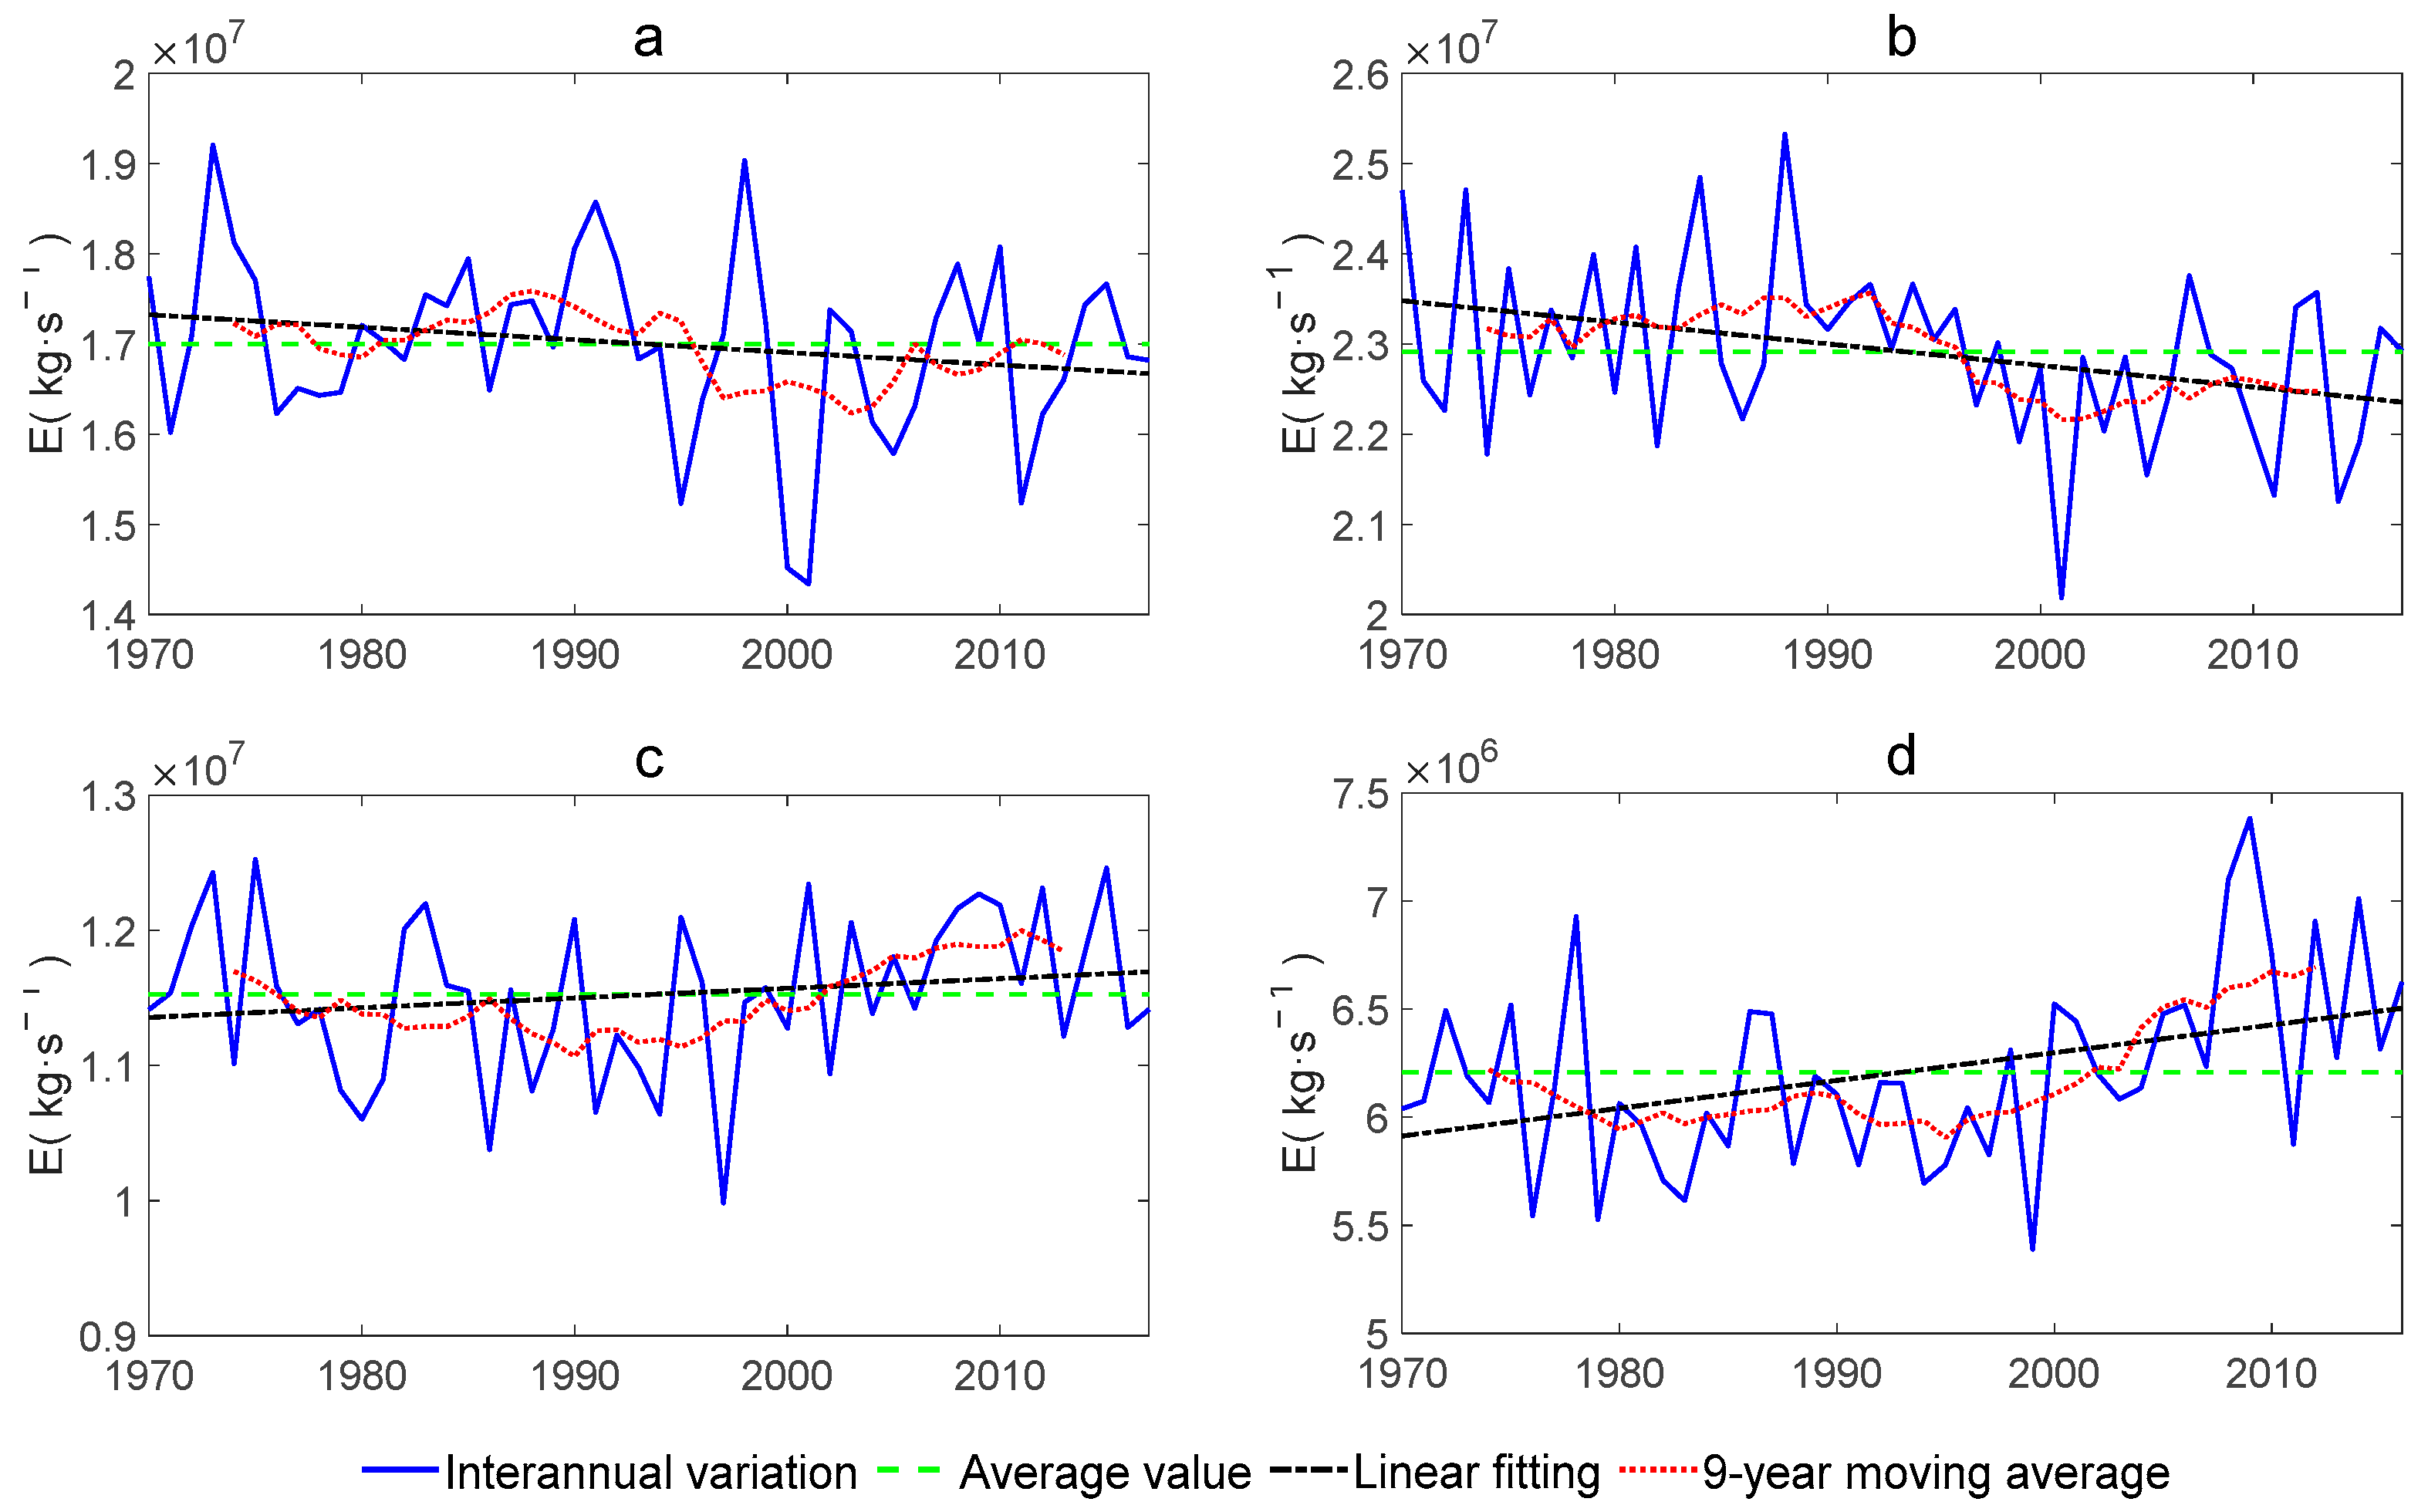
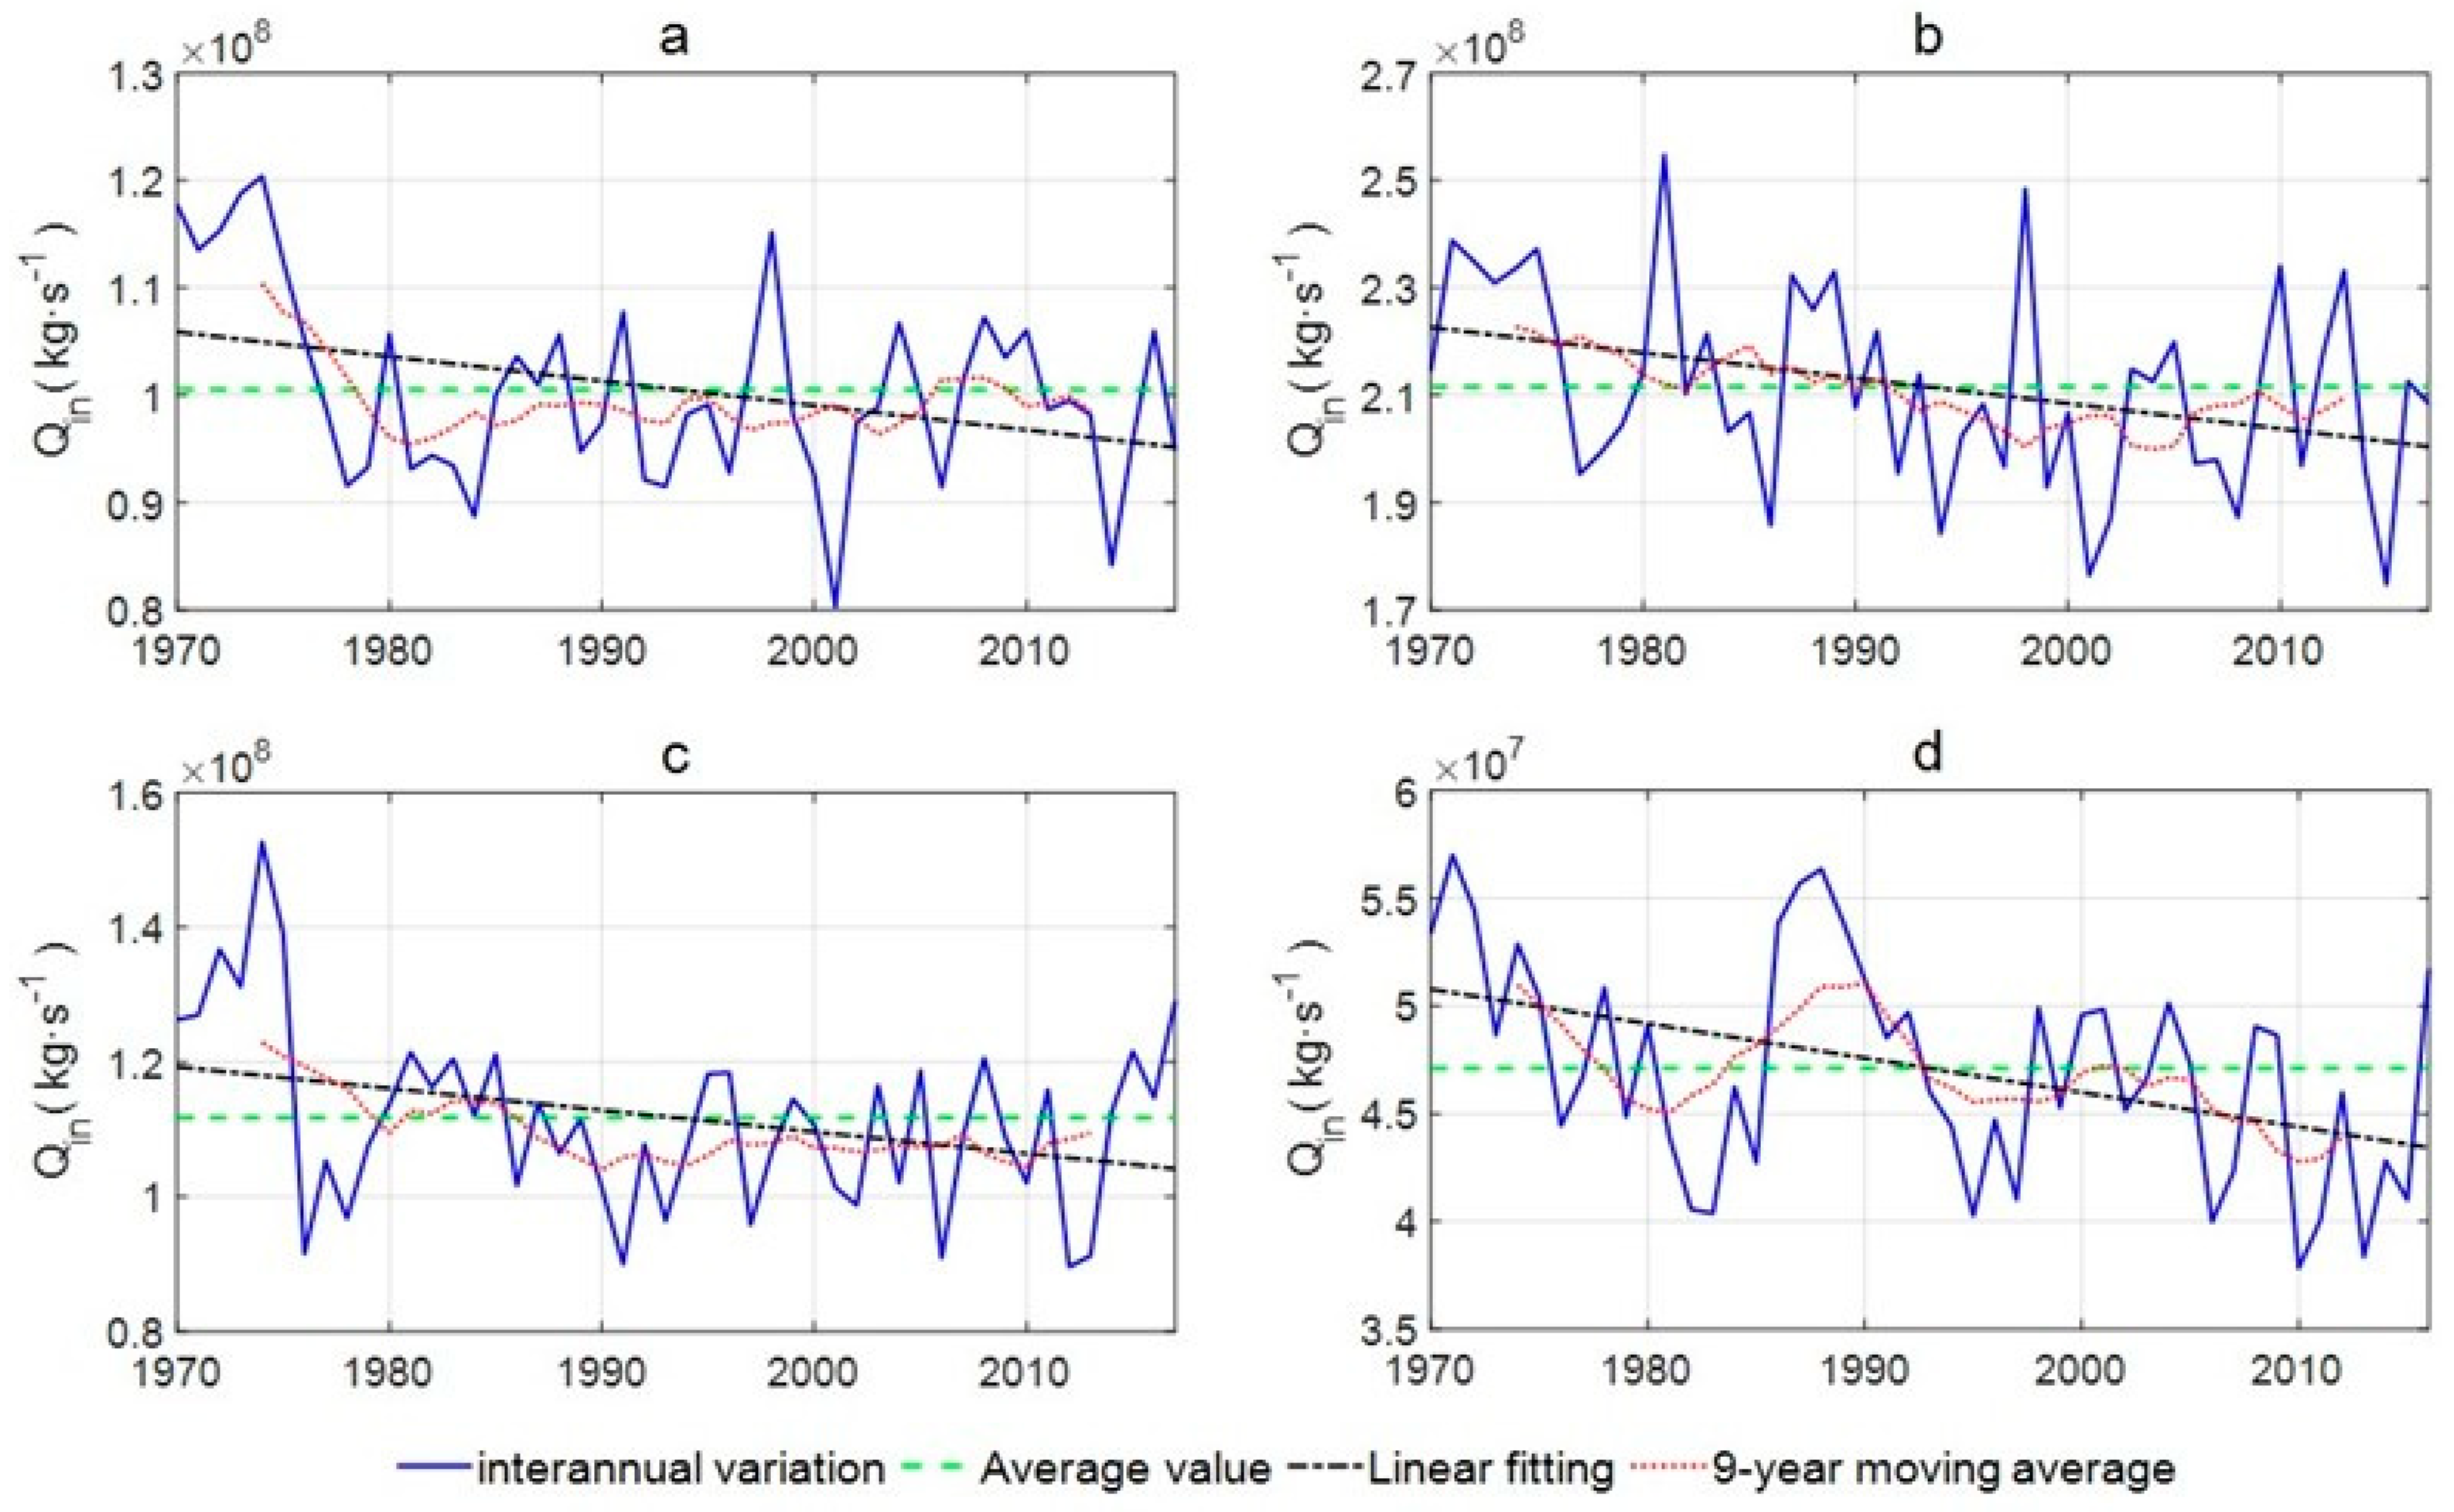
3.1. Paradoxical Changes among Different Branches of the Water Cycle in SAIE

Figure 3 shows the interannual and interdecadal changes in water vapor components in SAIE in the past 48 years. In the middle panel of Figure 3, the components are standardized by having been divided by the annual mean area-integrated precipitation and then multiplied by 100. The standardized values of the components can reflect the importance of the hydrological components in the area. On average, the contribution of the advected moisture to precipitation (P) is about 76%, which is the main source of local precipitation. The annual mean PRR (ρ) over SAIE from 1970 to 2017 shows large interannual oscillations, with an average value of about 24% (Figure 3a). The PRR increased at a rate of 0.41% per 10 years (p < 0.05) during 1970–2017. In addition, precipitation (p < 0.05) (Figure 3d), the component of precipitation arising from advected moisture (Pa) (p < 0.05) (Figure 3c), and the part of regional precipitation contributed by local evaporation (Pl) (p < 0.05) (Figure 3g) all increased obviously, especially in the past two decades. However, the total moisture flux into the region (Qin) (p < 0.05), the part of horizontal flux that flowed out of the region (Fa) (Figure 3e), and the part of the locally evaporated moisture that translated out of the region (Fe) (Figure 3f) generally decreased (Figure 3b).
In terms of long-term trends, Qin in SAIE is gradually decreasing, while P and Pl are gradually increasing. Especially, in the past 48 years, PRR, P, Pl, and Pa have shown a significant upward trend, although Qin has decreased. This paradox between precipitation and the import of total water vapor seems inconceivable.

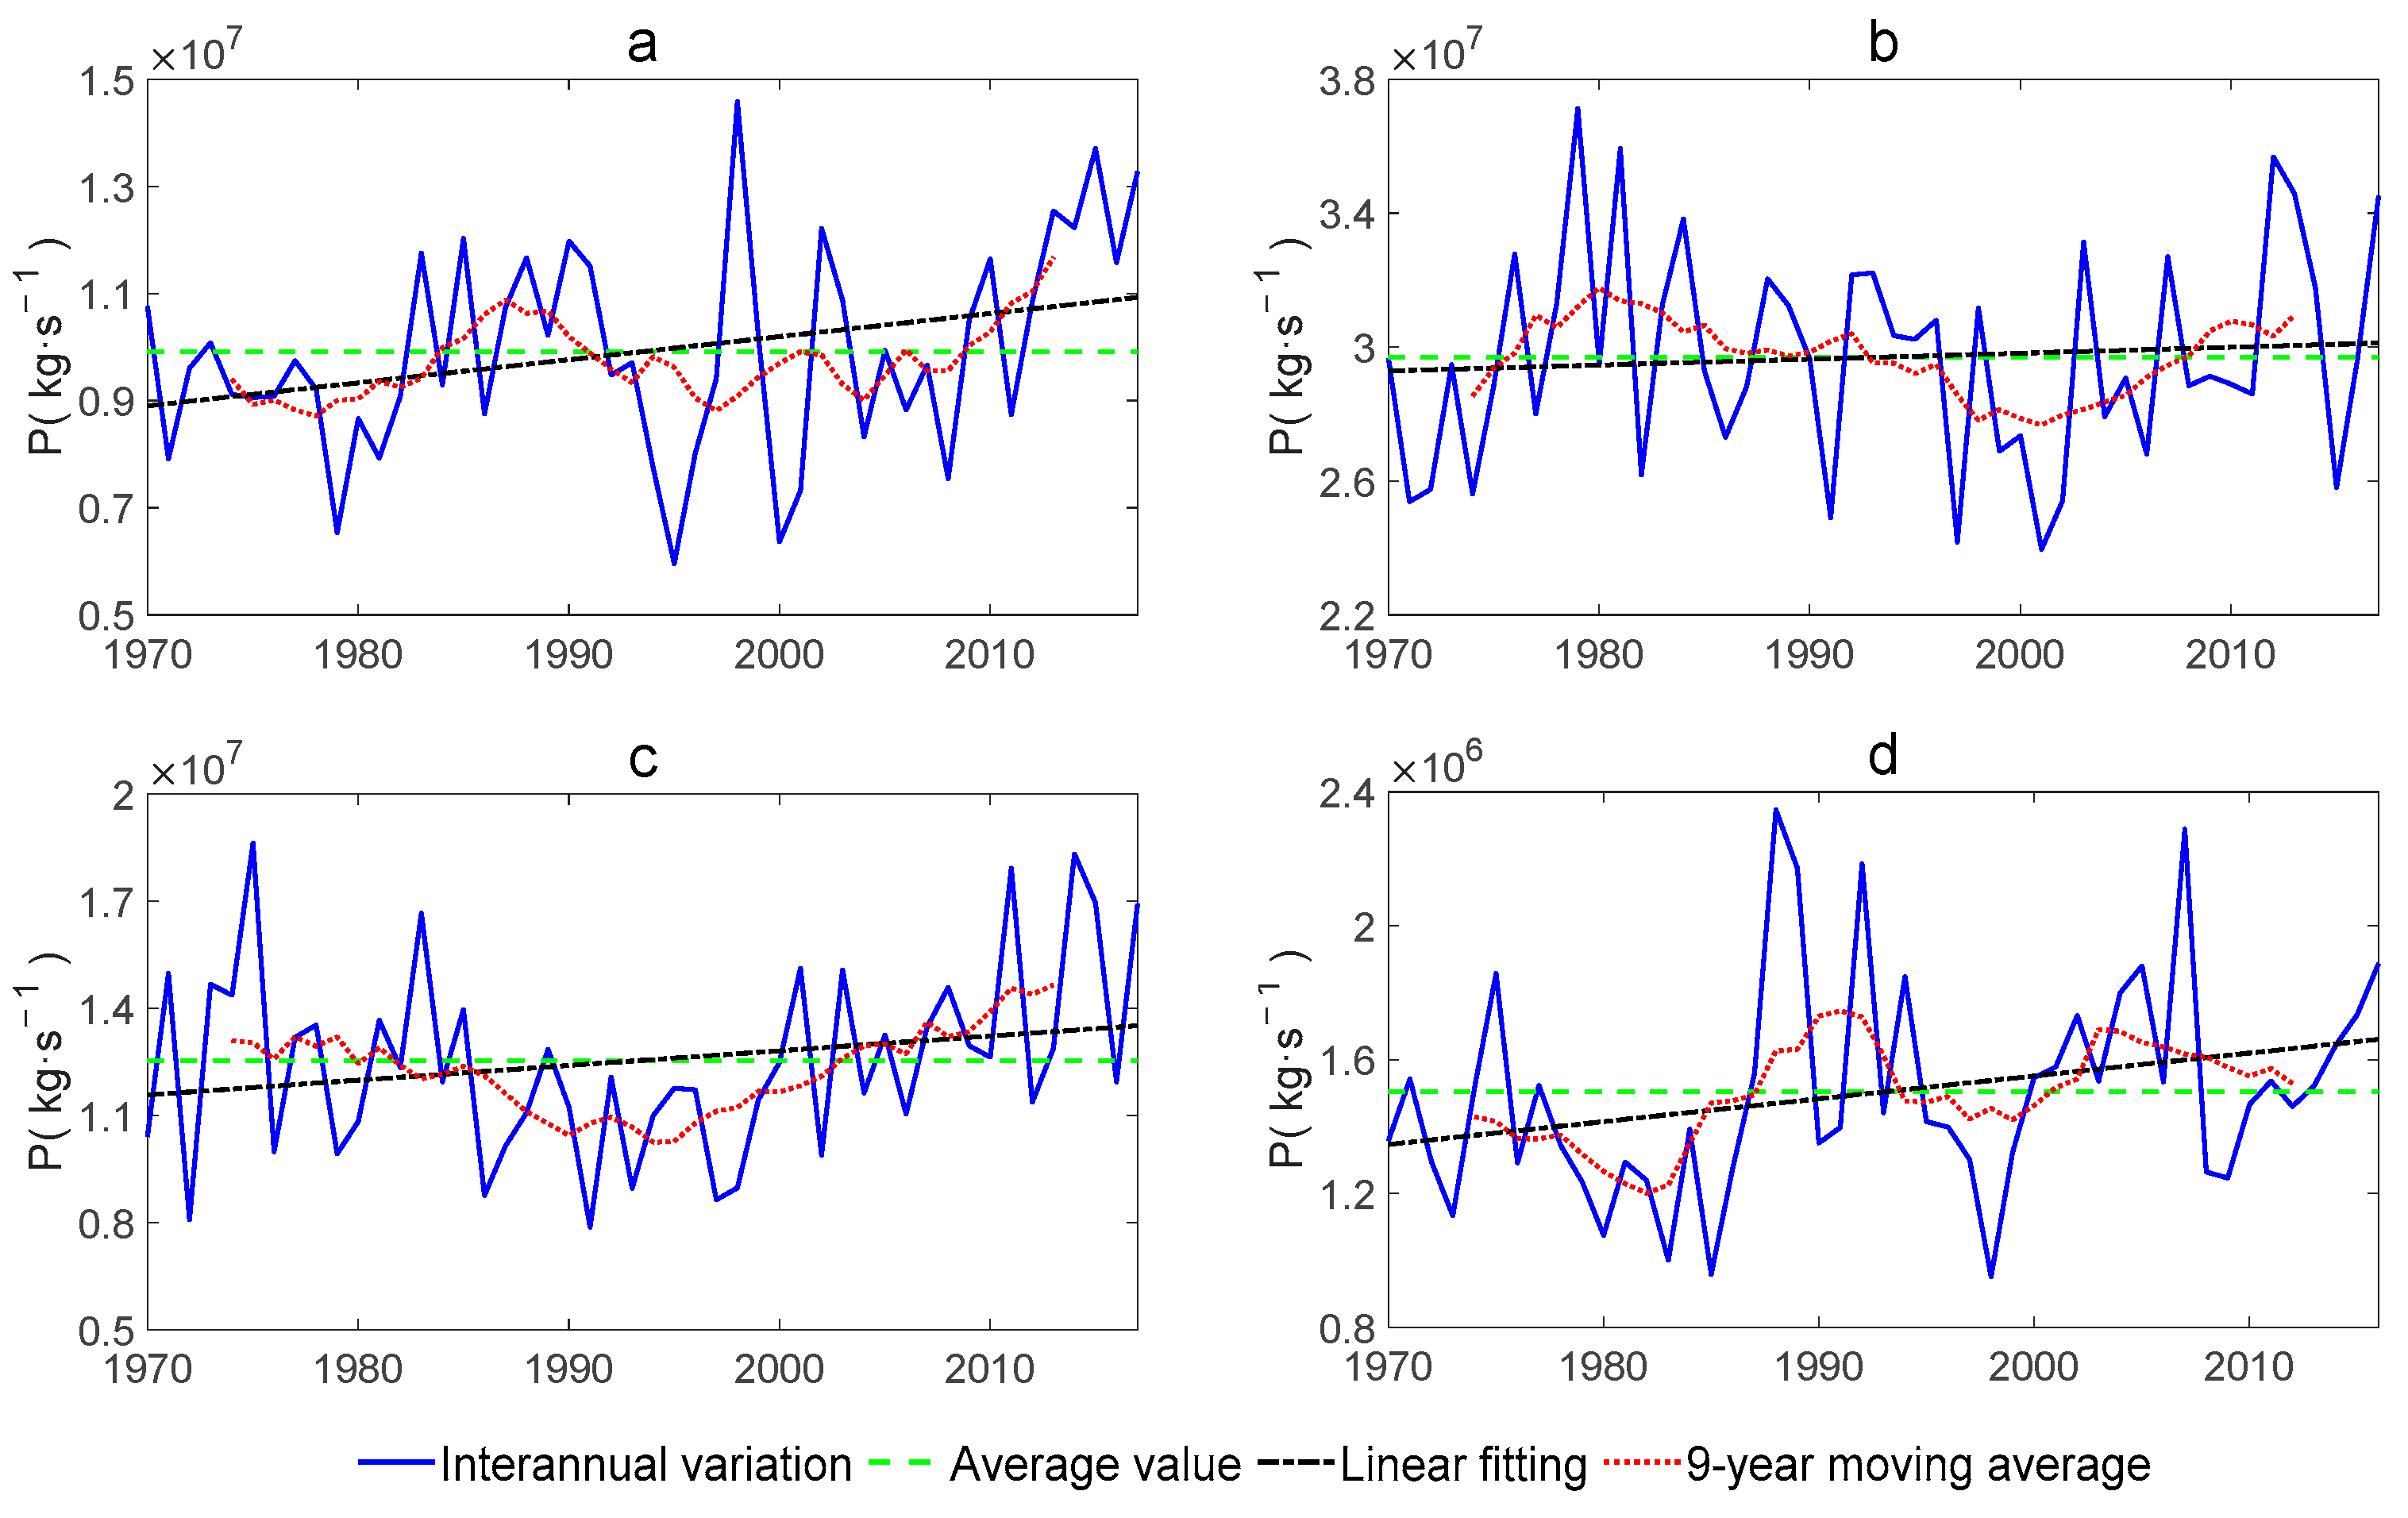
3.2. Seasonal Contributions to the Paradox in SAIE

The climate in some parts of SAIE is becoming warmer and wetter under global warming, while some other arid and semi-arid regions are getting warmer and drier. Moreover, there is a paradox between the increase in precipitation and decrease in external water vapor. To provide a reasonable explanation for this phenomenon, we studied the differences in precipitation, the PRR, evaporation, and water vapor transport in different seasons.
From the linear trend from 1970 to 2017, the precipitation in spring and winter increased significantly (p < 0.05), with a slight increase in summer and autumn remaining almost stable. However, the precipitation in spring, summer, and autumn, especially in spring and autumn, increased in the past 20 years, while it showed obvious interdecadal fluctuation in winter during 1970–2017 (Figure 4).
Figure 5 shows the interannual variation of the PRR for the four seasons in SAIE. As we can see, the PRR was higher in spring and winter compared with that in summer and autumn. Moreover, the average PRR in spring, summer, autumn, and winter was 29%, 22%, 19%, and 25%, respectively. In spring, the PRR increased rapidly from 1970 to 1980 and then remained steady (Figure 5a). In summer, the PRR increased slowly during 1970 to 2017, with significant interdecadal variation. (Figure 5b). In autumn, the PRR increased from 1970 to 2017 at a rate of 0.44% per 10 years, with an increasing interannual oscillation of amplitude. (Figure 5c). In winter, the PRR increased rapidly from 1970 to 2017 at a rate of 0.84% per 10 years (p < 0.05) (Figure 5d). It can be concluded that the PRR in SAIE in all four seasons increased to a different extent in the past 48 years. Moreover, after the 1990s, it increased obviously in autumn and winter. This indicates that the main contributor to the annual increase in the PRR (Figure 3a) in the past 20 years is the increased PRR in spring, autumn, and winter (Figure 5a–d), whereas the increasing precipitation of the past two decades is mainly attributable to the acceleration of the internal cycle in autumn and winter, as well as the increase in local surface evaporation.
In fact, the evaporation from 1970 to 2017 in spring, autumn, and winter was characterized by linear growth with a decline in summer. Especially in winter, the evaporation increased significantly in the past 48 years (p < 0.05), and the evaporation for all seasons has been increasing rapidly since the end of the 2000s (Figure 6). Generally speaking, an increase in evaporation will increase the PRR to some extent [32]. This indicates that an increase in the internal water cycle might be the cause of the increasing precipitation in SAIE.
Combined with the varied water vapor input (Qin) in SAIE in different seasons, the significant linear decrease in Qin in all seasons further proves that the strengthening of precipitation in SAIE depends mainly on the local increase in evaporation and related internal water cycle (Figure 7). Its physical power, however, requires further exploration.

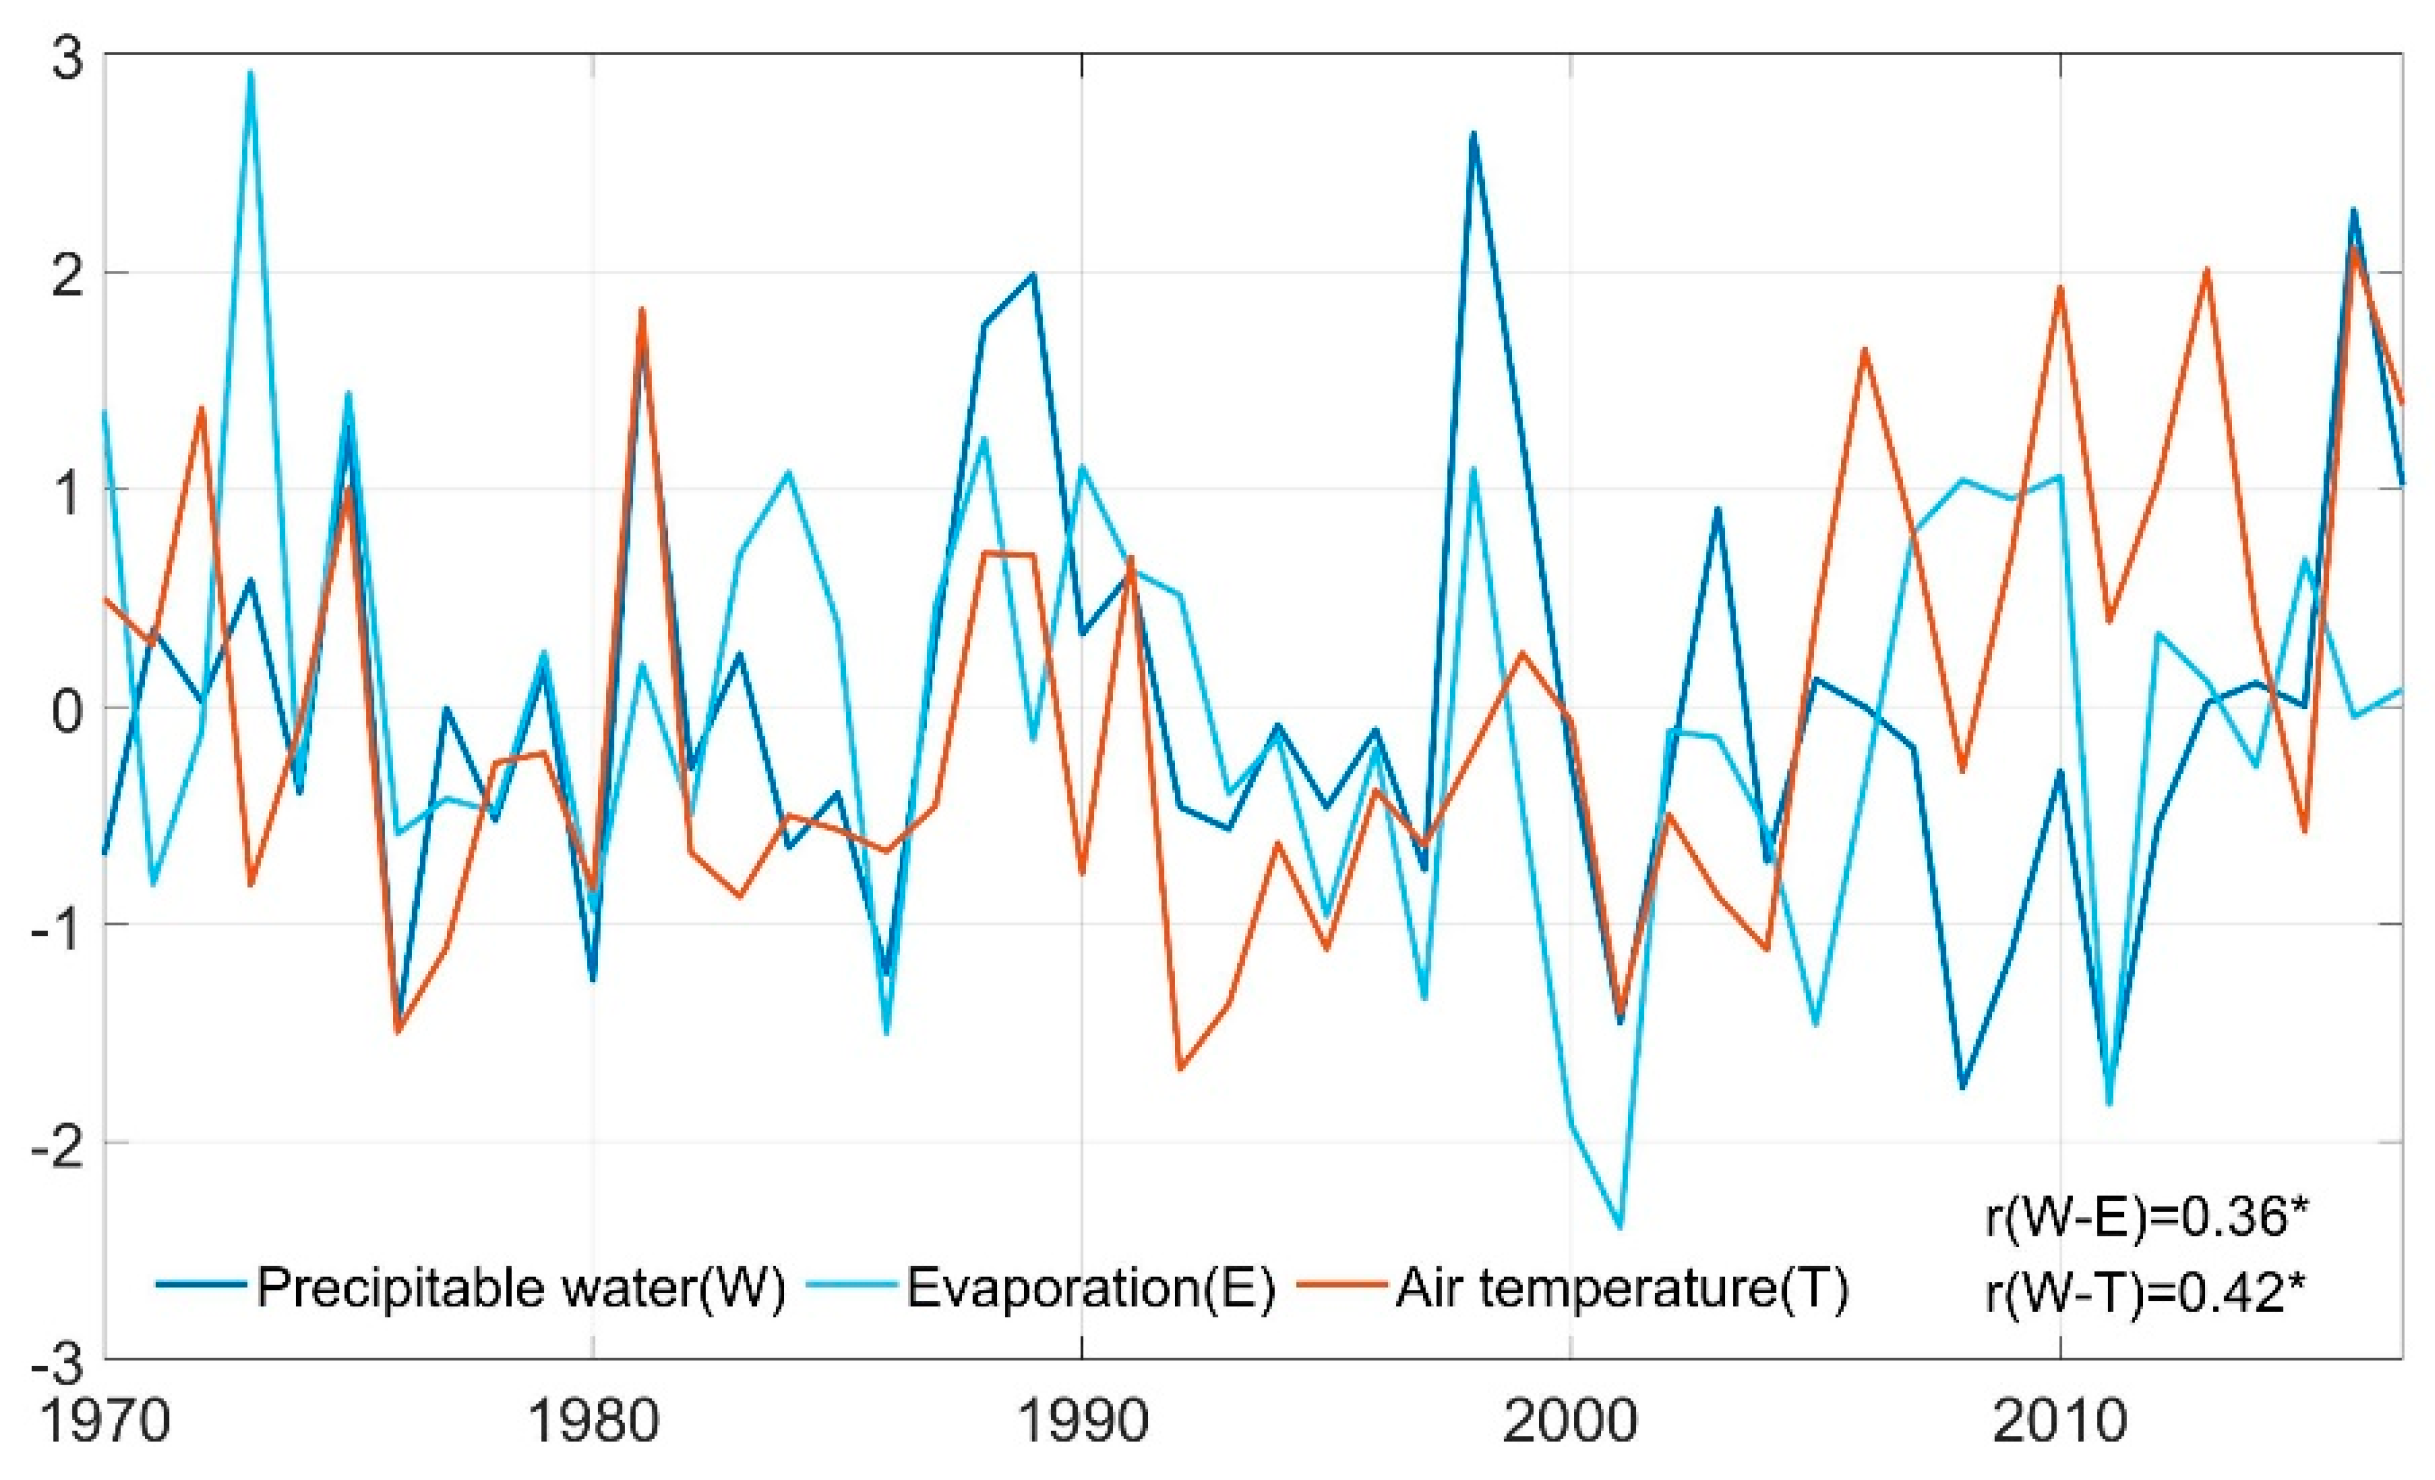
3.3. Physical Explanation for the Paradoxical Climate Change

The impact of climate change on the water cycle is multifaceted, but the total amount of water maintains a balance. If the troposphere of the global atmosphere is divided into N regions, the air column of each region satisfies the water balance relationship. According to the principle of mass conservation, the following water vapor balance equation can be established for the air column:
( W j i + E j ) ( W j o + P j ) = Δ W j ,
where Wji and Wjo are the water vapor flowing into and out of the air column in a certain period, respectively; and Ej, Pj, and ΔWj are the evaporation, precipitation, and increment of water vapor in the air column during the same period, respectively. Moreover, Equation (12) can be rewritten as
P j = ( W j i W j o ) + E j Δ W j ,
which indicates that the precipitation of an area is mainly affected by three factors: (1) the net water vapor input into the air column from the outside (WjiWjo), which is mainly affected by the atmospheric circulation; (2) the local actual evaporation (Ej), which to a large extent depends on the local evaporation conditions (mainly including surface water resources and distribution, vegetation distribution, atmospheric boundary layer humidity, etc.) and mainly affects the internal water cycle; and (3) the increment of the water vapor content (ΔWj) in the air column, which mainly depends on the atmospheric temperature and its variation.
The standardized anomaly of precipitation water, evaporation, and air temperature in SAIE from 1970 to 2017 shows that the interdecadal variation trend of the three is consistent (Figure 8). Air temperature and evaporation increased after the 2000s. The correlation coefficient of precipitation water with evaporation is 0.36 at the 95% confidence level. Further, precipitation water also shows significant correlation with air temperature at the 95% confidence level. The results indicate that precipitation water increased along with temperature and evaporation rising in the region.
The quantitative relationship between atmospheric temperature and water vapor content follows the Clausius–Clapeyron equation; that is, when the temperature increases (decreases) by 1 °C, the water holding capacity of the atmosphere will increase (decrease) by about 7%. This means that global warming will increase the water vapor content (Figure 9) and intensify the global water cycle due to the increase in evapotranspiration and precipitation [33,34]. Therefore, when the atmospheric temperature decreases the same, the reduction in water vapor content in an atmosphere with a higher temperature is more than that with a lower temperature, given that other weather and climatic conditions are the same.
For example, let us assume there are two identical atmospheric systems: I with temperature Tcold and II with temperature Twarm (Tcold < Twarm). Except for their different temperatures, the other states of the two systems are the same, as well as the underlying surface conditions. Assuming that their water vapor content and air temperature are (Wcold, Tcold) and (Wwarm, Twarm), respectively, and Twarm > Tcold, then Wwarm > Wcold. According to the Clausius–Clapeyron equation (Figure 9), when the temperature of the two systems decreases at the same time, ΔTTcoldTwarmT), the reduction in precipitable water in the two systems is ΔWcold and ΔWwarmWcoldWwarm), respectively. Combined with the water vapor balance Equation (12), when the temperature drops at the same temperature, the higher the background temperature is and the greater the precipitation is. Karl and Trenberth [35,36,37] also confirmed that the higher the local ambient temperature, the greater the proportion of heavy rainfall.
Therefore, for the paradoxical climate change in SAIE, the possible physical interpretation is that global warming has improved the water holding capacity of the atmosphere, thereby promoting the acceleration of local water vaper cycling (that is, internal water vaper cycling or precipitation recycling) and increasing the quantity of precipitable water. The linear trend and inter-decadal variability of precipitation, evaporation, and the PRR in spring, summer, and autumn are consistent, supporting this view strongly.

4. Conclusions and Discussion

In recent decades and in most parts of the world, climate change has been manifesting as regions getting drier or wetter under global warming; however, the climate in SAIE has changed in an opposite manner from drying to wetting. In this respect, there are two important questions: How long can this warming and humidification last? Moreover, can it promote ecosystem restoration? To find answers, we divided the regional total precipitation into two components: the contribution of local evaporation and external water vapor advection. Then, using the PRR model, we analyzed the linear variation trend and interdecadal characteristics of precipitation and its two components, evaporation and external water vapor input, and attempted to provide a reasonable explanation for the paradoxical climate change. The main findings of our study can be summarized as follows:
(1) The climate in SAIE is becoming warmer and wetter under global warming, with a paradox between increasing precipitation and decreasing external water vapor input.
(2) The linear trend of precipitation in all seasons increased significantly from 1970 to 2017. Moreover, in the past 20 years, the precipitation has increased obviously in spring, summer, and autumn (Figure 4). The indication is that the warming and humidification can be mainly attributed to the increasing precipitation from 1970 to 2017 and the rapid growth of precipitation in spring, summer, and autumn in recent decades.
(3) The evaporation from SAIE in autumn and winter is characterized by linear growth but a decrease in spring and summer during 1970 to 2017, followed by an increase since the end of the 1990s for all seasons (Figure 6). Combined with the significant linear decrease in water vapor input (Qin) in all seasons, we consider that an increase in the internal water cycle might have led to the increased precipitation in SAIE.
According to the Clausius–Clapeyron equation, the water holding capacity of the atmosphere will increase by about 7% when the temperature increases by 1℃. Coupled with the increase in potential evaporation caused by the rise in temperature, the precipitable water in the atmosphere increases and then promotes an increase in precipitation. Since the water vapor input (Qin) in all seasons decreased during 1970–2017, this is not conducive to a continuous increase in precipitation in inland areas. We suggest that the climate’s transformation from dry to wet in SAIE can only be temporary, unless there is a continuous supplement of surface water that can promote the internal water cycle to continue to increase.
This study investigated the time trend of the precipitation recycling ratio in semi-arid inland Eurasia (SAIE) and explains it with the Clausius–Clapeyron equation. The explanation of the physical mechanism for the change in recycling ratio is our further work. In addition, we only explain the mechanism of the dry to wet transition in semi-arid inland Eurasia (SAIE) from the perspective of internal circulation. This region is also greatly affected by monsoon and westerly circulation. Therefore, the study on the impact of external circulation needs to be supplemented, and regional climate change should be comprehensively considered.

Author Contributions

Conceptualization, X.-Y.W. and Y.-P.W.; Methodology, X.-Y.W. and J.-H.Y.; Software, X.-Y.W. and Z.-W.L.; Formal analysis, X.-Y.W.; Data curation, X.-Y.B. and Y.H.; Writing–original draft, X.-Y.W.; Writing—review & editing, Y.-P.W.; Supervision, Y.-P.W., G.-Q.S. and G.-L.F. All authors have read and agreed to the published version of the manuscript.

Funding

This research was funded by the National Key Research and the National Natural Science Foundation of China (grant numbers 42130610, 41875097, 42275034 and 42275029).

Data Availability Statement

The original contributions presented in the study are included in the article. Further enquiries can be directed to the corresponding authors.

Acknowledgments

This work was supported by the National Key Research and the National Natural Science Foundation of China (grant numbers 42130610, 41875097, 42275034 and 42275029), the ‘High-level Talent Support Program’ funding of the Selective Support for Scientific and Technological Activities of Overseas Scholars of Shanxi Province, the Outstanding Young Talents Support Plan of Shanxi Province.

Conflicts of Interest

The authors declare no conflict of interest.

References

  1. Igel, M.R.; Biello, J.A. A reconstructed total precipitation framework. npj Clim. Atmos. Sci. 2019, 2, 32. [Google Scholar] [CrossRef]
  2. Sun, G.-Q.; Wang, C.-H.; Chang, L.-L.; Wu, Y.-P.; Li, L.; Jin, Z. Effects of feedback regulation on vegetation patterns in semi-arid environments. Appl. Math. Model. 2018, 61, 200–215. [Google Scholar] [CrossRef]
  3. New, M.; Todd, M.; Hulme, M.; Jones, P. Precipitation measurements and trends in the twentieth century. Int. J. Climatol. 2001, 21, 1889–1922. [Google Scholar] [CrossRef]
  4. Zou, M.; Qiao, S.; Feng, T.; Wu, Y.; Feng, G. The inter-decadal change in anomalous summertime water vapour transport modes over the tropical Indian Ocean-western Pacific in the mid-1980s. Int. J. Clim. 2018, 38, 2672–2685. [Google Scholar] [CrossRef]
  5. Li, C.; Li, Z.; Zhang, F.; Lu, Y.; Duan, C.; Xu, Y. Seasonal dynamics of carbon dioxide and water fluxes in a rice-wheat rotation system in the Yangtze-Huaihe region of China. Agric. Water Manag. 2023, 275, 107992. [Google Scholar] [CrossRef]
  6. Li, Z.; Wu, Y.; Wang, R.; Liu, B.; Qian, Z.; Li, C. Assessment of climatic impact on vegetation spring phenology in northern China. Atmosphere 2023, 14, 117. [Google Scholar] [CrossRef]
  7. Feng, G.L.; Yang, J.; Zhi, R.; Zhao, J.H.; Gong, Z.Q.; Zheng, Z.H.; Xiong, K.G.; Qiao, S.B.; Yan, Z.; Wu, Y.P.; et al. Improved prediction model for flood-season rainfall based on a nonlinear dynamics-statistic combined method. Chaos Solitons Fractals 2020, 140, 110160. [Google Scholar] [CrossRef]
  8. Deng, H.; Chen, Y.; Shi, X.; Li, W.; Wang, H.; Zhang, S.; Fang, G. Dynamics of temperature and precipitation extremes and their spatial variation in the arid region of northwest China. Atmos. Res. 2013, 138, 346–355. [Google Scholar] [CrossRef]
  9. Shi, Y.; Shen, Y.; Kang, E.; Li, D.; Ding, Y.; Zhang, G.; Hu, R. Recent and Future Climate Change in Northwest China. Clim. Chang. 2006, 80, 379–393. [Google Scholar] [CrossRef]
  10. Han, X.; Xue, H.; Zhao, C.; Lu, D. The roles of convective and stratiform precipitation in the observed precipitation trends in Northwest China during 1961–2000. Atmos. Res. 2016, 169, 139–146. [Google Scholar] [CrossRef]
  11. Shi, Y.; Shen, Y.; Hu, R. Preliminary study on signal, impact and foreground of climatic shift from warm-dry to warm-humid in northwest China. J. Glaciol. Geocryol. 2002, 24, 219–226. (In Chinese) [Google Scholar]
  12. Zhang, Y.; Chen, F.; Gou, X. The temporal and spatial distribution of seasonal dry-wet changes over the northwestern China: Based on PDSI. Acta Geogr. Sin. 2007, 62, 1142–1152. (In Chinese) [Google Scholar]
  13. Wang, H.J. The weakening of the Asian monsoon circulation after the end of 1970’s. Adv. Atmos. Sci. 2001, 18, 376–386. [Google Scholar]
  14. Ma, P.L.; Yang, J.H.; Lu, G.Y.; Zhu, B.; Liu, W. The transitional change of climate in the east of Northwest China. Plateau Meteorol. 2020, 39, 840–850. (In Chinese) [Google Scholar]
  15. Trenberth, K.E. Atmospheric moisture recycling: Role of advection and local evaporation. J. Clim. 1999, 12, 1368–1381. [Google Scholar] [CrossRef]
  16. Burde, G.I.; Zangvil, A. The estimation of regional precipitation recycling. Part I: Review of recycling models. J. Clim. 2001, 14, 2497–2508. [Google Scholar] [CrossRef]
  17. Hai, H.E.; Guihua, L.U. Precipitation Recycling in Tarim River Basin. J. Hydrol. Eng. 2013, 18, 1549–1556. [Google Scholar] [CrossRef]
  18. Budyko, M.I.; Drozdov, O.A. Zakonomernosti vlagooborota v atmosfere (Regularities of the hydrologic cycle in the atmosphere). Izv. Akad. Nauk SSSR Ser. Geogr. 1953, 4, 5–14. [Google Scholar]
  19. Salati, E.; Dall’Olio, A.; Matsui, E.; Gat, J.R. Recycling of water in the Amazon Basin: An isotopic study. Water Resour. Res. 1979, 15, 1250–1258. [Google Scholar] [CrossRef]
  20. Brubaker, K.L.; Entekahabi, D.; Eagleson, P.S. Estimation of continental precipitation recycling. J. Clim. 1993, 6, 1077–1089. [Google Scholar] [CrossRef]
  21. Eltahir, E.A.B.; Bras, R.L. Precipitation recycling. Rev. Geophys. 1996, 34, 367–378. [Google Scholar] [CrossRef]
  22. Schär, C.; Lüthi, D.; Beyerle, U.; Heise, E. The Soil–Precipitation Feedback: A Process Study with a Regional Climate Model. J. Clim. 1999, 12, 722–741. [Google Scholar] [CrossRef]
  23. van der Ent, R.J.; Savenije, H.H.G.; Schaefli, B.; Steele-Dunne, S.C. Origin and fate of atmospheric moisture over continents. Water Resour. Res. 2010, 46, W09525. [Google Scholar] [CrossRef]
  24. Wu, P.; Ding, Y.; Liu, Y.; Li, X. The characteristics of moisture recycling and its impact on regional precipitation against the background of climate warming over Northwest China. Int. J. Clim. 2019, 39, 5241–5255. [Google Scholar] [CrossRef]
  25. Kang, H.W.; Gu, X.Q.; Fu, X.; Xu, X. Precipitation recycling over the Northern China. J. Appl. Meteorol. Sci. 2005, 16, 139–147. (In Chinese) [Google Scholar]
  26. Fu, X.; Xu, X.D.; Kang, H.W. Research on precipitation recycling during Meiyu season over Middle-Lower Reaches of Changjiang River in 1998. Meteorol. Sci. Technol. 2006, 34, 394–399. (In Chinese) [Google Scholar]
  27. Li, R.; Wang, C.; Wu, D. Changes in precipitation recycling over arid regions in the Northern Hemisphere. Theor. Appl. Clim. 2016, 131, 489–502. [Google Scholar] [CrossRef] [Green Version]
  28. Xu, Y.; Gao, X.; Shen, Y.; Xu, C.; Shi, Y.; Giorgi, F.S. A daily temperature dataset over China and its application in validating a RCM simulation. Adv. Atmos. Sci. 2009, 26, 763–772. [Google Scholar] [CrossRef]
  29. Wu, J.; Gao, X.J. A gridded daily observation dataset over China region and comparison with the other datasets. Chin. J. Geophys. 2013, 56, 1102–1111. [Google Scholar] [CrossRef]
  30. Su, T.; Feng, T.; Feng, G. Evaporation variability under climate warming in five reanalyses and its association with pan evaporation over China. J. Geophys. Res. Atmos. 2015, 120, 8080–8098. [Google Scholar] [CrossRef]
  31. Wu, Y.-P.; Shen, Y.-P.; Li, B.L. Possible physical mechanism of water vapor transport over Tarim River Basin. Ecol. Complex. 2012, 9, 63–70. [Google Scholar] [CrossRef]
  32. Huang, B.; Su, T.; Wu, Y.; Feng, G. The Interdecadal Reverse of the Relationship and Feedback Mechanism between Sea Surface Temperature and Evaporation over the Indian Ocean during Boreal Autumn. J. Clim. 2020, 33, 10205–10219. [Google Scholar] [CrossRef]
  33. Wang, C.; Zhang, S.; Zhang, F.; Li, K.; Yang, K. On the increase of precipitation in the Northwestern China under the global warming. Adv. Earth Sci. 2021, 36, 980–989. [Google Scholar] [CrossRef]
  34. Huntington, T.G. Evidence for intensification of the global water cycle: Review and synthesis. J. Hydrol. 2006, 319, 83–95. [Google Scholar] [CrossRef]
  35. Karl, T.R.; Trenberth, K.E. Modern Global Climate Change. Science 2003, 302, 1719–1723. [Google Scholar] [CrossRef] [PubMed]
  36. Kalnay, E.; Kanamitsu, M.; Kistler, R.; Collins, W.; Deaven, D.; Gandin, L. The NCEP/NCAR 40-year reanalysis project. Bull. Am. Meteorol. Soc. 1996, 77, 437–472. [Google Scholar] [CrossRef]
  37. Zhao, J.; Zhang, H.; Zuo, J.; Yang, L.; Yang, J.; Xiong, K.; Feng, G.; Dong, W. Oceanic drivers and empirical prediction of interannual rainfall variability in late summer over Northeast China. Clim. Dyn. 2021, 58, 861–878. [Google Scholar] [CrossRef]
Figure 1. Schematic diagram of atmospheric moisture recycling in a region, consisting of the internal water cycle and external water cycle. E is the evaporation from the region, and El is the component of E that becomes the local precipitation Pl through the internal moisture cycle. Qin is the total water vapor input into the region, and Qout is the total water vapor output.
Atmosphere 14 00376 g001
Figure 2. Location of one part (red box) of the semiarid inland Eurasia (SAIE) region, which is situated in the transition zone between semiarid and semi-humid and has experienced paradoxical climate change.
Atmosphere 14 00376 g002
Figure 3. Characteristics of the atmospheric moisture cycle in SAIE from 1970 to 2017. The middle figure schematically illustrates the mean annual water cycle over the region. Panel (a) shows the interannual variation of the PRR (precipitation recycling ratio) over SAIE, and (bg) show the interannual changes of the water cycle components in the region, including the (b) Qin (the total water vapor input into the region in the horizontal direction, (c) Pa (the component of precipitation arising from advected moisture), (d) P (the precipitation in the region), (e) Fa (the part of horizontal flux flowing out of the region), (f) Fe (the part of the locally evaporated moisture that translates out of the region), and (g) Pl (the part of the regional precipitation contributed by local evaporation). All variables have been standardized by dividing by the annual mean area-integrated precipitation and then multiplying by 100.
Atmosphere 14 00376 g003
Figure 4. Interannual variation of precipitation in SAIE from 1970 to 2017 in spring (a), summer (b), autumn (c), and winter (d).
Atmosphere 14 00376 g004
Figure 5. Interannual variation of PRR in SAIE from 1970 to 2017 in spring (a), summer (b), autumn (c), and winter (d).
Atmosphere 14 00376 g005
Figure 6. Interannual variation of evaporation in SAIE (semi-arid inland Eurasia) from 1970 to 2017 in (a) spring, (b) summer, (c) autumn, and (d) winter.
Atmosphere 14 00376 g006
Figure 7. Interannual variation of water vapor input (Qin) in SAIE (semi-arid inland Eurasia) from 1970 to 2017 in (a) spring, (b) summer, (c) autumn, and (d) winter.
Atmosphere 14 00376 g007
Figure 8. The standardized anomaly of precipitation water, evaporation, and air temperature in SAIE from 1970 to 2017.
Atmosphere 14 00376 g008
Figure 9. Sketch map of Clausius–Clapeyron relation between precipitation water and air temperature.
Atmosphere 14 00376 g009
Disclaimer/Publisher’s Note: The statements, opinions and data contained in all publications are solely those of the individual author(s) and contributor(s) and not of MDPI and/or the editor(s). MDPI and/or the editor(s) disclaim responsibility for any injury to people or property resulting from any ideas, methods, instructions or products referred to in the content.

