Article

Dissolved Organic Carbon Dynamics Variability from Ponds Draining Different Landscapes in a Typical Agricultural Watershed

1
Climate Centre of Hunan Province, China Meteorological Administration, Changsha 410118, China
2
Collaborative Innovation Center on Forecast and Evaluation of Meteorological Disasters (CIC-FEMD), Nanjing University of Information Science and Technology, Nanjing 210044, China
3
Dongting Lake National Climatic Observatory, China Meteorological Administration, Yueyang 414000, China
4
Hunan Key Laboratory for Meteorological Disaster Prevention and Reduction, Changsha 410118, China
5
Jiangsu Sanshan Environmental Science and Technology Research Co., Ltd., Yangzhou 225000, China
6
Key Laboratory of Watershed Geographic Sciences, Nanjing Institute of Geography and Limnology, Chinese Academy of Sciences, Nanjing 210008, China
*
Authors to whom correspondence should be addressed.
Atmosphere 2023, 14(2), 363; https://doi.org/10.3390/atmos14020363
Submission received: 3 January 2023 / Revised: 3 February 2023 / Accepted: 9 February 2023 / Published: 12 February 2023

Abstract

:
Dissolved organic carbon (DOC) in inland waters (rivers, reservoirs, lakes, and small ponds) plays a significant role in the global carbon cycle and affects global climate change. In addition, DOC is also a vital indicator of the water environment due to its multiple physical, chemical, and ecological roles. Lakes and ponds of small sizes are abundant on a global and regional scale, and a large increase in ponds is expected with global agricultural land expansion. However, the DOC characteristics of ponds in agricultural watersheds are still unclear, posing a challenge to better understanding the carbon cycle of inland waters. In this study, we explored the DOC variability and their influencing factors in ponds draining different landscapes in a typical agricultural watershed to address the issue. The field measurements over a year showed the DOC concentration varied among ponds draining different landscapes. Specifically, the mean DOC concentrations in the natural pond, sewage pond, aquaculture pond, and irrigation pond were (6.17 ± 1.49) mg/L, (12.08 ± 2.92) mg/L, (9.36 ± 2.92) mg/L, and (8.91 ± 2.71) mg/L, respectively. Meanwhile, monthly measurements found the DOC varied across sampling dates. The DOC variability was positively correlated with nutrients, primary production, and precipitation, suggesting anthropogenic loadings, an internal production rate, and hydrological regime that regulated the substantial variability of DOC in these ponds at the watershed scale. Further, large pollutant discharge and high primary production led to peak DOC occurring in the sewage pond. Our results implied that more attention should be paid to ponds in agricultural watersheds to better understand the roles of inland waters in the global carbon cycle.

1. Introduction

Dissolved organic carbon (DOC) affects the function and structure of lakes and plays an integral role in the biogeochemistry and ecology of surface water [1,2,3]. First, high DOC can reduce the physical properties of lakes, such as light attenuation, and subsequently reduce productivity [4,5]. Second, DOC affects the thermal structure and mixing depth of lakes via altering transparency [6,7]. Third, DOC serves as a substrate for heterotrophic bacteria, which will increase oxygen depletion, leading to hypoxia [8]. Rising DOC also poses a potential threat to the water quality of drinking water lakes [5]. Considering DOC plays multiple physical, chemical, and ecological roles and is thus an important indicator of water quality [9,10,11], substantial research attention is needed for the DOC of lakes.
The DOC in lakes plays an essential role in the global carbon cycle and significantly affects global climate change [3,12,13]. The DOC in inland waters will be converted to greenhouse gases (e.g., CO2 and CH4) by biotic and abiotic processes such as mineralization [14,15,16]. It should be noted that the DOC varies across time and space [17,18]. These patterns in DOC concentration are difficult to extrapolate from one region to another due to significant differences in environmental conditions [19,20]. Additionally, small lakes and ponds are abundant on global and regional scales [21,22]. These ponds often possess physical and biogeochemical characteristics that differ from larger lakes [23,24]. For instance, small ponds are often more heavily subsidized with large internal loading inputs [25]. Small ponds are hot spots for biogeochemical cycling, and likely play a disproportionately large role in the global carbon cycle [24]. It is worth noting that small ponds are more common landscape features in China, covering approximately 1.8% of the land area [26]. Small ponds in China are generally constructed or used for aquaculture, irrigation, and sewage discharge [26,27]. The study of DOC in water bodies in China has mainly focused on lakes and rivers [8,17]. However, the DOC variability in ponds remains largely unknown. A previous study has shown that the surrounding landscape plays an essential role in the pond DOC in Northeast China [28], and a study demonstrated the complex dynamics and environmental risk of DOC in subtropical ponds [29]. Therefore, the DOC variability of ponds in China is a key issue that needs to be addressed.
In addition, land use type and land cover play a significant role in regulating aquatic DOC concentration [5,19,30]. Agricultural land accounts for approximately 40% of the Earth’s ice-free land surface cover and significantly affects the hydrological, biogeochemical, and ecological characteristics of aquatic ecosystems [31,32,33]. Meanwhile, global agricultural land expansion is accompanied by a large number of small ponds [34,35,36]. The DOC characteristics of ponds in the agricultural watershed are still unclear. The pond has multiple functions, such as water storage, sewage reception, and aquaculture [37,38], but how these functions influence the DOC characteristics remains unknown. Thus, more field measurements are needed to understand the linkages between the variations of DOC and its dominant factor in the ponds of the agricultural watershed.
China is a large agricultural country, and the construction of a substantial number of ponds has made great contributions to the rural development of China [39,40]. Meanwhile, agricultural ponds play an irreplaceable role in agricultural development. The lower reaches of the Yangtze River, located in eastern China, have long been one of the most densely populated agricultural regions and have a long history of productive rice-based agriculture. There are numerous small ponds for a variety of purposes in the watershed. Depending on exogenous load levels, ponds draining different landscapes in the same agricultural basin may have different biochemical cycle processes and DOC variability. However, the change in DOC concentration in ponds in this agricultural watershed with intense human activities is poorly understood. We explored the DOC variability and their influencing factors in ponds draining different landscapes in a typical agricultural watershed (the Tongyang River watershed), which is located in the lower region of the Yangtze River Basin in eastern China with a long history of agricultural practice. The purpose of this study was (1) to investigate the temporal-spatial variability of DOC, (2) to elucidate the factors influencing the variability, and (3) to compare the magnitude of the DOC in the ponds. We anticipate that the results from the study could further supplement the information on DOC in inland waters with different landscape ponds. More significantly, this study is expected to assist in exploring the main influencing factors of DOC variability in ponds and provide a valuable data source for the carbon cycle in such heavily agricultural regions.

2. Materials and Methods

2.1. Study Area and Sampling Ponds

The Tongyang River watershed is a small rural watershed on the north shore of Lake Chaohu, with a total area of 89.3 km2, situated in a humid subtropical climate zone (Figure 1). The annual mean temperature and precipitation are 16 °C and 1030 mm, respectively. The types of land use in the watershed are mainly agricultural, such as planting rice, cotton, and rapeseed. The agriculture-related non-point pollution in the watershed is severe, primarily due to the application of fertilizers and domestic sewage discharge. There are various ponds for a variety of purposes distributed in the watershed. Four different landscape ponds are selected according to the land use type. The natural pond is far away from the village and is surrounded by forest (area: 0.004 km2; depth: 2–3 m). The sewage pond is discharged with a large amount of sewage due to the high human population density (area: 0.007 km2; depth: 0.5–1 m). The aquaculture pond is shallow, and shrimp and crabs are mainly raised in the pond (area: 0.003 km2; depth: 0.3–0.5 m). Agricultural practices are the dominant local source of anthropogenic N discharging into the irrigation pond (area: 0.01 km2; depth: 1–2 m).

2.2. Water Sample Collection and DOC Concentration Measurement

Four different landscape ponds in the basin were sampled monthly from 2020 to 2021 except in December 2020 and February 2021.Each pond was set up with sampling points according to its area and depth, and the sampling frequency was once a month. Each field survey throughout the ponds was generally completed between 8:00 and 18:00 in two consecutive days. Bubble-free surface water was taken using an organic glass hydrophore at each sampling site, and water samples for dissolved DOC measurements were transferred to 500 mL brown plastic bottles via tubing. Both of the hydrophore and brown plastic bottles were washed with local water before sampling. Within 24 h, all samples were filtered (0.45 μm) and kept refrigerated at 4 °C before analysis. DOC analysis consisted of acidification of the sample, followed by combustion using a Total Organic Carbon Instrument (Shimadzu TOC-VCPH, Kyoto, Japan). The analysis was repeated at least three times per sample, resulting in a DOC concentration in mg/L and a percent standard deviation. The detection limit for DOC was 0.4 μg L−1.

2.3. Auxiliary Variables Measurement

The variables considered in this study included water temperature (Tw), pH, dissolved oxygen concentration (DO), total nitrogen concentration (TN), dissolved total nitrogen concentration (DTN), ammonium nitrogen concentration (NH4+-N), nitrate nitrogen concentration (NO3-N), total phosphorus concentration (TP), dissolved total phosphorus concentration (DTP), chlorophyll a concentration (Chl-a), and water depth. The measurements of Tw, pH, and DO were conducted in situ using a multi-parameter probe (YSI 6600, YSI Inc., Yellow Springs, OH, USA), which was calibrated before measurement. TN and DTN concentrations were measured by the alkaline potassium persulfate digestion UV spectrophotometric method. TP and DTP concentrations were measured by the ammonium molybdate spectrophotometric method. The concentrations of NO3-N and NH4+-N were determined by a flow injection analyzer (Skalar SAN++, Breda, The Netherlands) with high precision after filtration with Whatman GF/F filters. The detection limit for NO3-N and NH4+-N concentrations was 0.6 μg L−1. Chl-a concentration was determined spectrophotometrically (Shimadzu UV 2600, Kyoto, Japan), and chemical oxygen demand concentration (COD) was determined by the dichromate method. The precipitation came from the local automatic meteorological observation station in the Tongyang River watershed.

2.4. Statistical Analysis

The experimental and statistical analysis data were analyzed by land use type (natural pond, sewage pond, aquaculture pond, and irrigation pond). The differences in DOC concentrations were summarized as means for spring (from March to May), summer (from June to August), autumn (from September to November), and winter (January). A least significant difference post-hoc test was used to determine the differences among measured variables using SPSS (version 22.0), and differences at the p < 0.05 level were deemed statistically significant. The drivers influencing DOC concentrations in ponds were analyzed using a stepwise multiple regression method, and the data were plotted using Origin 2021.

3. Results

3.1. Environmental Variability

There was an insignificant difference in water temperature between four different landscape ponds (p > 0.05), but their biochemical parameters varied significantly (Table 1). Among them, the DO concentration in the irrigation pond was the lowest, and in the natural pond was the highest. The highest COD, Chl-a, and nutrient concentrations occurred in the sewage pond and the lowest in the natural pond. The variables of NH4+-N, TN, DTN, TP, DP, and Chl-a concentrations showed insignificant differences between the aquaculture pond and the irrigation pond (p > 0.05). Overall, the sewage pond had the highest COD, Chl-a, and nutrient concentrations, followed by the irrigation pond and the aquaculture pond, and the natural pond had the lowest.

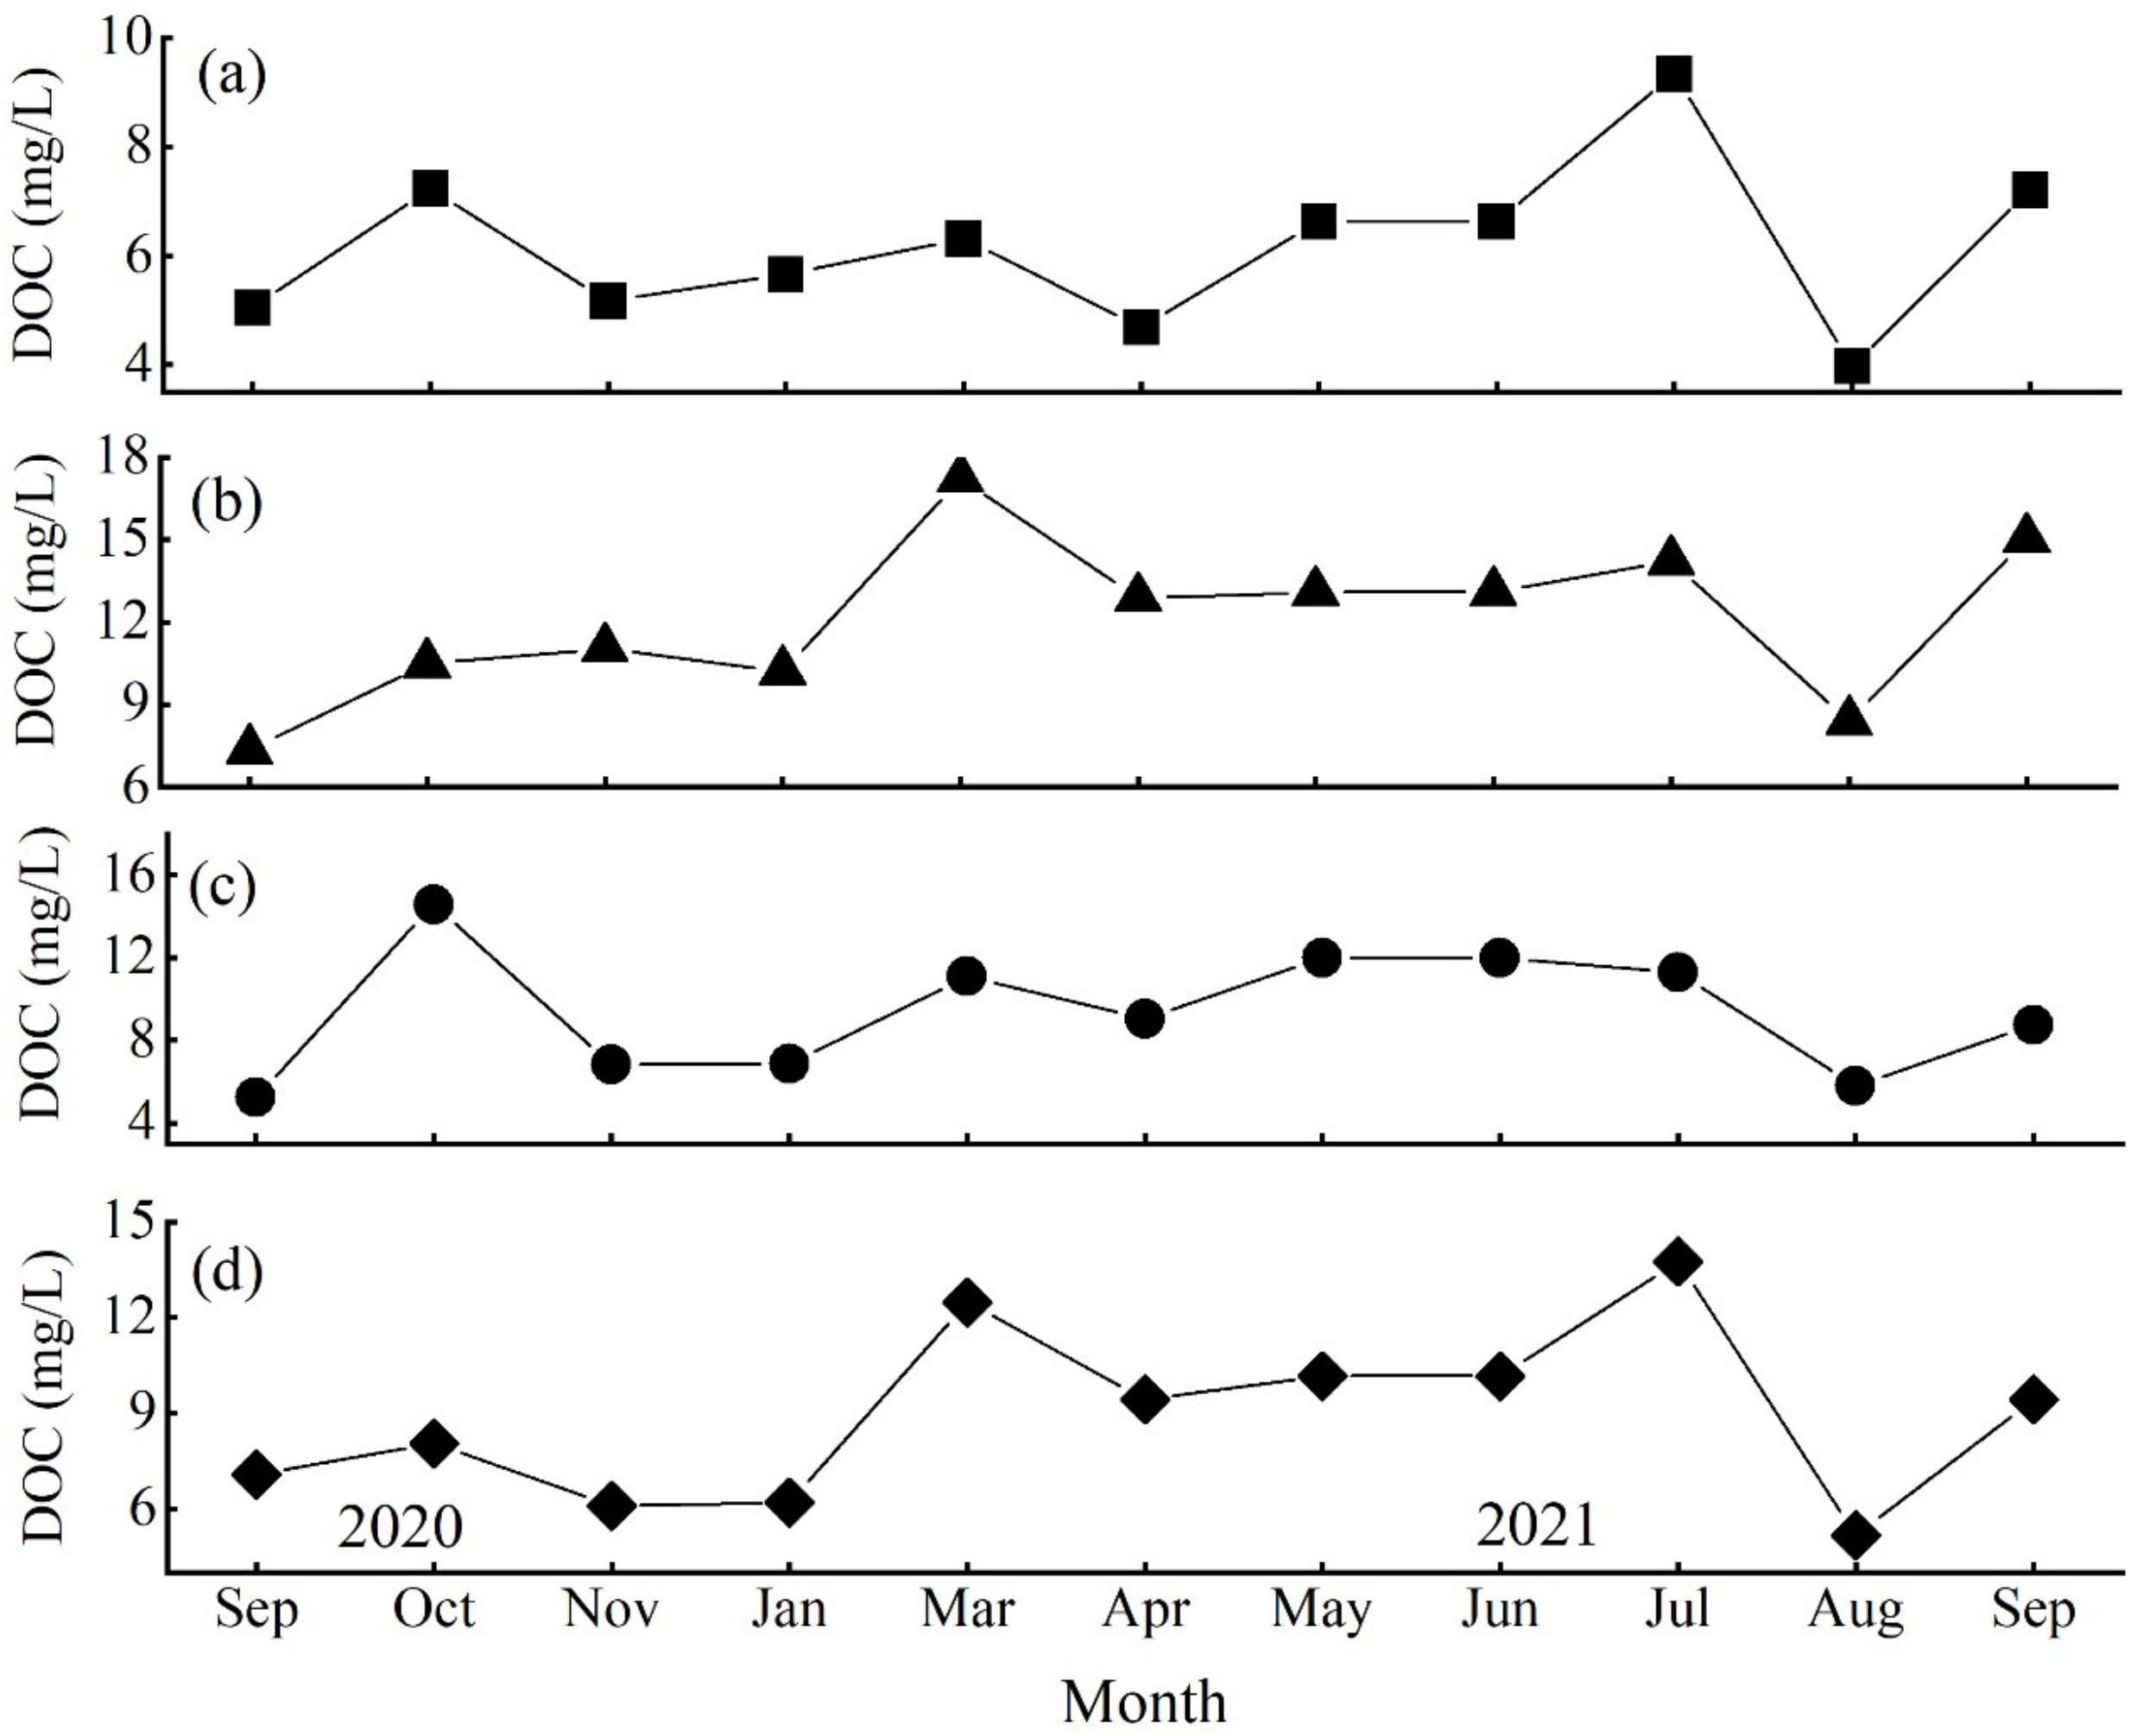
3.2. Temporal Variability of DOC

The monthly field measurements from September 2020 to September 2021 showed that DOC concentrations fluctuated over time (Figure 2). In addition, the DOC concentration in the natural pond was 3.97–9.35 mg/L, and the average DOC concentration in spring, summer, autumn, and winter was 5.88, 6.65, 6.17, and 5.66 mg/L, respectively, indicating that the DOC concentration in the warm season was higher than in the cold season. The DOC concentration in the sewage pond ranged from 7.35–17.21 mg/L, which was high in spring (14.38 mg/L), higher than in summer (11.89 mg/L), autumn (10.97 mg/L), and winter (10.19 mg/L). The DOC concentration in the aquaculture pond ranged from 5.81 to 14.59 mg/L, and in spring it was 10.71 mg/L, which was higher than in summer (9.70 mg/L), autumn (8.84 mg/L), and winter (6.85 mg/L). The DOC concentration in the irrigation pond ranged from 5.17 to 13.76 mg/L, which showed that the DOC concentration in spring (10.69 mg/L) > summer (9.70 mg/L) > autumn (7.66 mg/L) > winter (6.19 mg/L).

3.3. Spatial Variations of DOC Concentration

Figure 3 showed the spatial variations of DOC concentration in the natural pond, sewage pond, aquaculture pond, and irrigation pond, and the mean DOC concentration was (6.17 ± 1.49), (12.08 ± 2.92), (9.36 ± 2.92), and (8.91 ± 2.71) mg/L, respectively (Figure 3). The DOC concentration in the natural pond had the lowest value, and was significantly (p < 0.05) lower than that of the sewage pond, aquaculture pond, and irrigation pond. The DOC concentration in the sewage pond had the highest value and was significantly (p < 0.05) higher than in the natural pond, aquaculture pond, and irrigation pond. The DOC concentration showed a nonsignificant (p > 0.05) difference between the aquaculture pond and the irrigation pond.

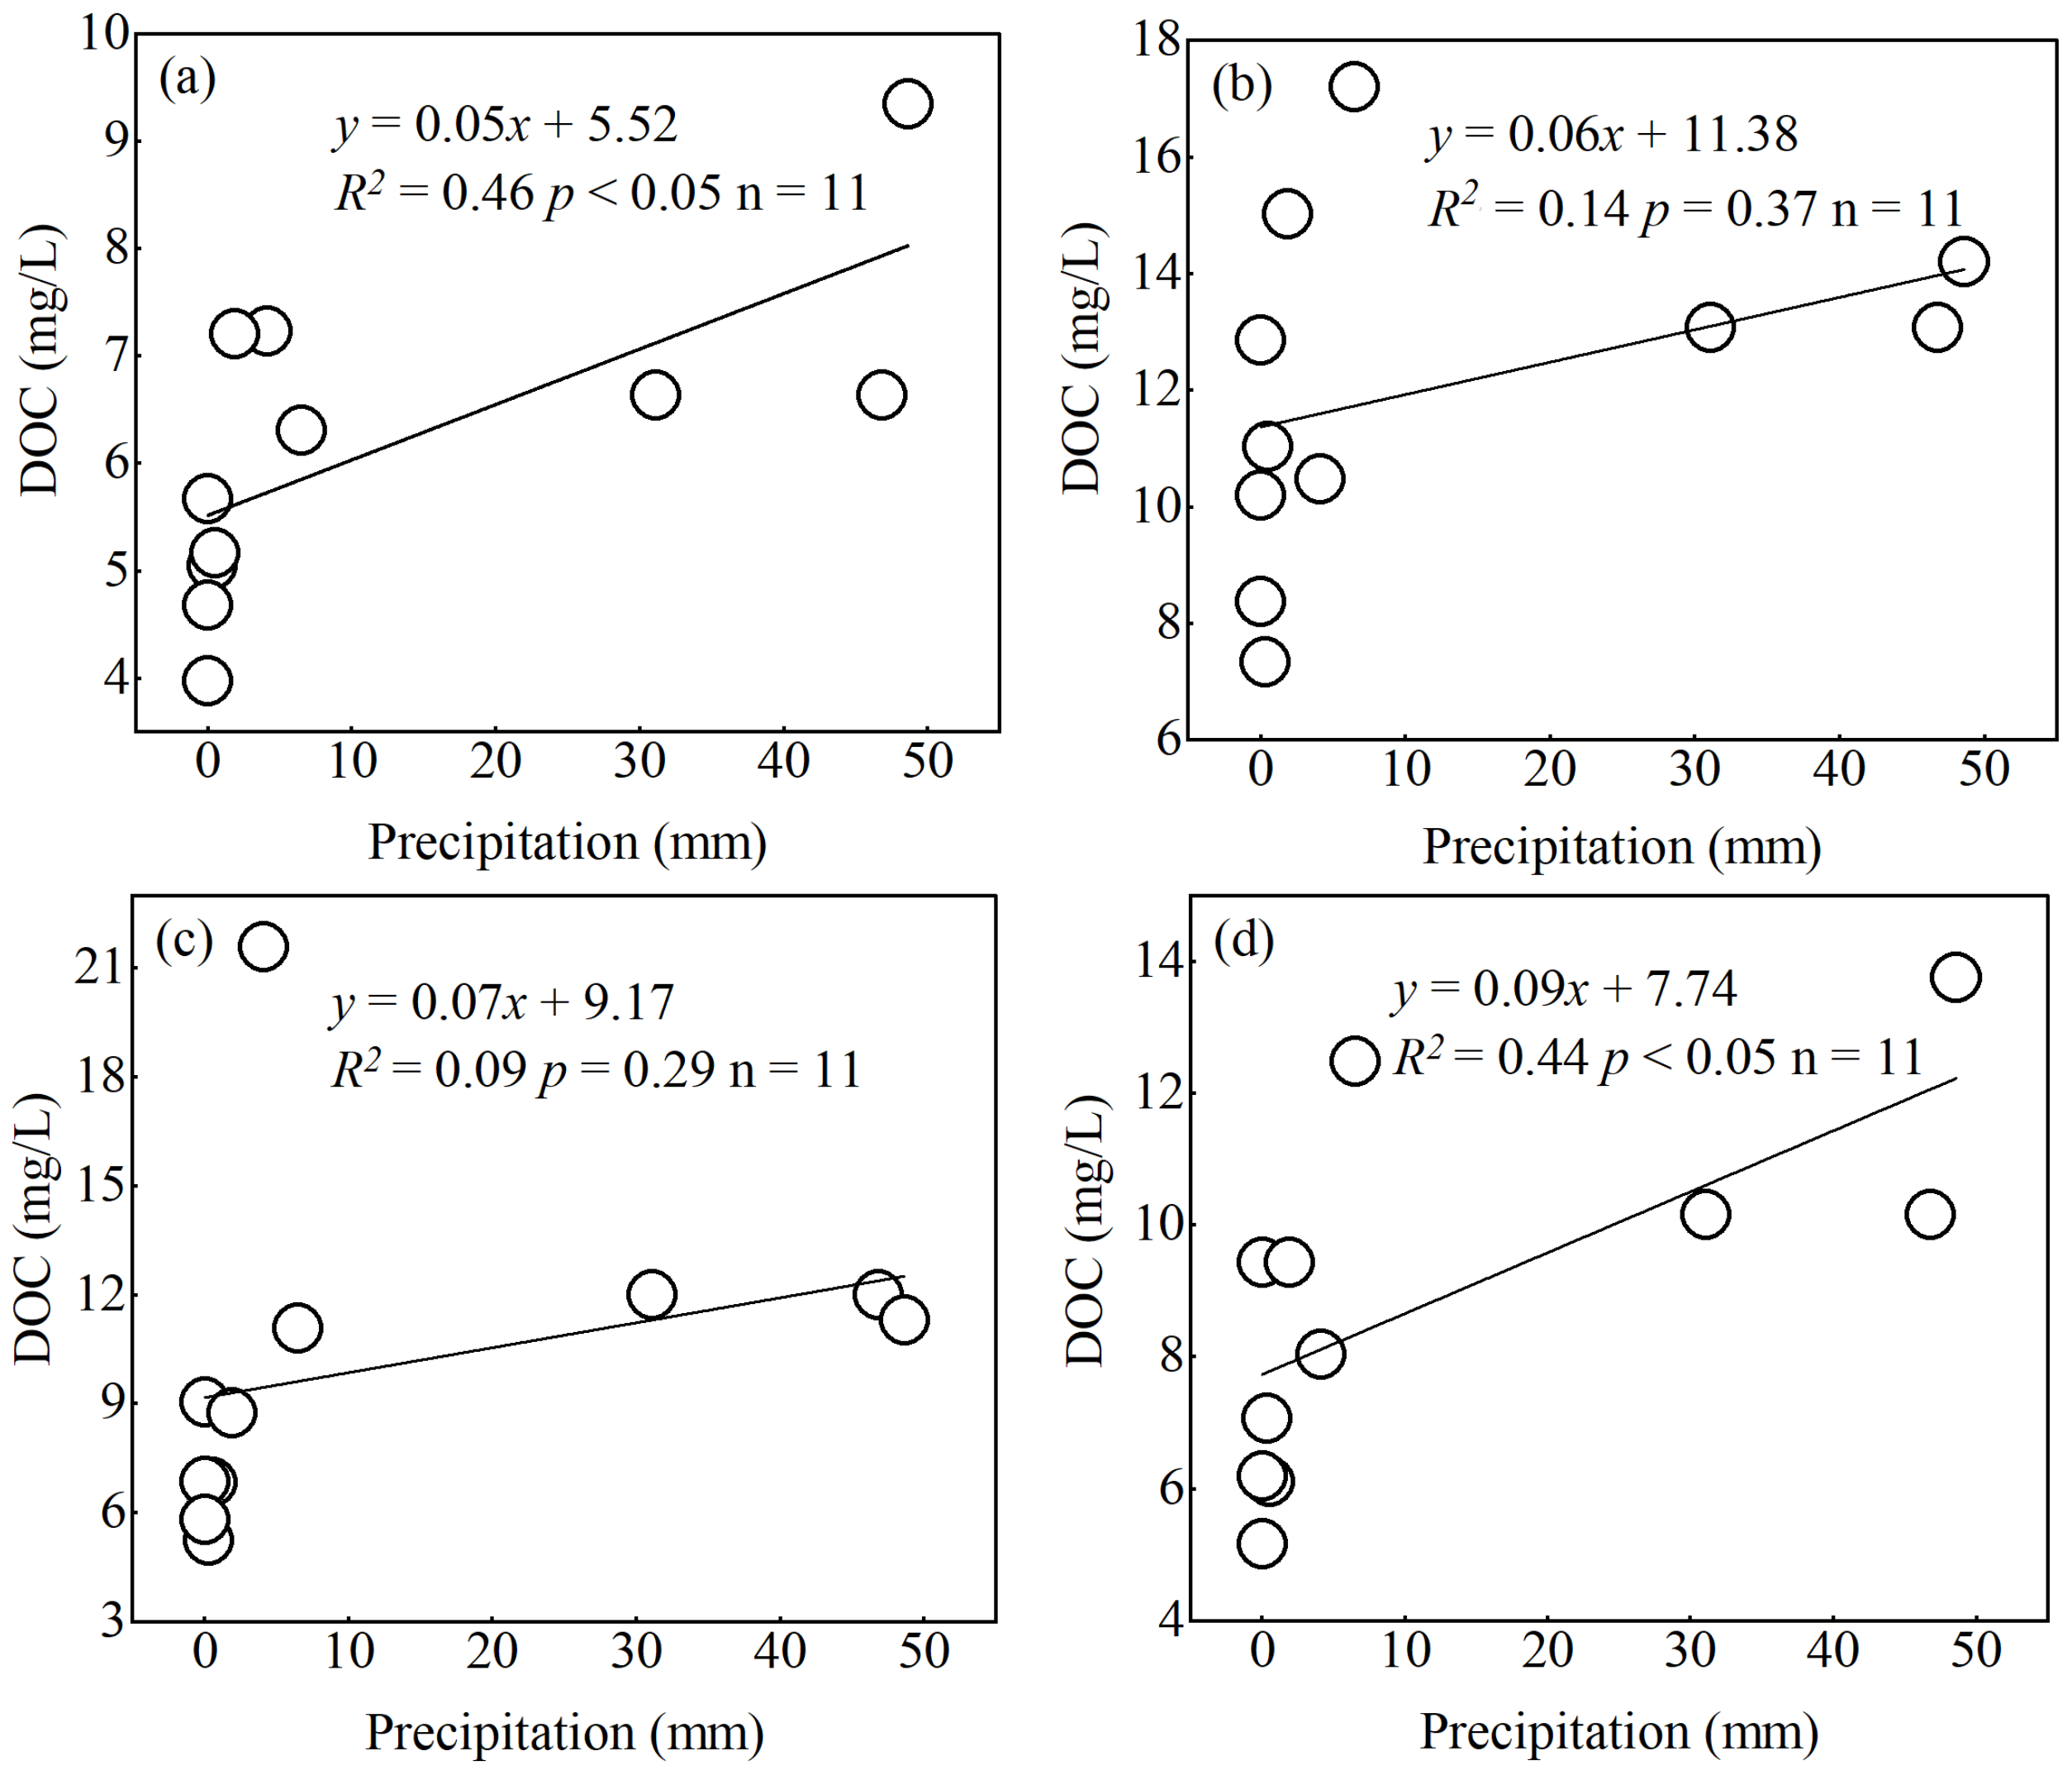
3.4. Factors Influencing DOC Variability

Significant correlations between DOC concentration and precipitation were found in four different landscape ponds (Figure 4). In the natural pond and irrigation pond, the seasonal fluctuation of DOC concentration was driven by precipitation in the watershed, and the precipitation explained 46% of the observed temporal variability in the natural pond (R2 = 0.46, p < 0.05, Figure 4a) and 44% of the variability in the irrigation pond (R2 = 0.44, p < 0.05, Figure 4d). However, the correlations between precipitation and DOC concentration in the sewage pond and aquaculture pond were not statistically significant (R2 = 0.14, p = 0.37, Figure 4b; R2 = 0.09, p = 0.29, Figure 4c).
Another characteristic of agricultural watersheds is nutrient enrichment. The correlation analysis showed that the DOC concentration variability in ponds was also closely related to N loadings at the watershed scale (Figure 5). Specifically, the NH4+-N, TN, and NO3-N concentrations explained 25%, 32%, and 21% of the observed variability of DOC, respectively. Here, the Chl-a concentration, an index of primary production, was also positively correlated with DOC at the watershed scale (Figure 5d). It should be noted that the Chl-a concentration only explained 15% of the DOC variability, suggesting other factors such as external loadings discharge influence the variability.
Additionally, for individual ponds, these environmental variables also influenced the DOC variability (Table 2). DOC concentration in the natural pond was significantly positively correlated with COD, TN, and TP concentrations. The DOC concentration in the sewage pond was significantly positively correlated with NO3-N, NH4+-N, TN, TP, and Chl-a concentrations. The DOC concentration in the irrigation pond was significantly positively correlated with NO3-N and NH4+-N concentrations. The DOC concentration was significantly positively correlated with the NH4+-N concentration in the aquaculture pond.

4. Discussion

4.1. Effects of Human Activities on DOC

The inland waters of the agricultural watershed can be highly polluted due to rural activities with high fertilizer N application and domestic sewage discharge from local residents [37,41,42]. The fertilizer N application rates in Eastern China are approximately 600 kg N ha−1 yr−1 [36,41], which is significantly higher than the agricultural fertilizer application rates (less than 150 kg N ha−1 yr−1) in Sweden [43], France [44], and the US [45]. The nutrient loadings in natural water bodies are generally very low, which was also evidenced from our field measurement in the natural pond. However, human activities can increase the nutrient loadings of water bodies [14]. The measured nutrient concentrations in the ponds (Table 1) were similar to those in anthropogenic aquatic ecosystems such as eutrophic lakes/ponds and artificial waterbodies [35,37], suggesting that human activities (input of fertilizer N and domestic sewage discharge) could affect the biogeochemical cycle processes of the ponds. It should be noted that previous studies have found high nutrient loadings stimulate the degradation of DOC, leading to the nutrient being negatively correlated with DOC [46,47]. However, our results found the nutrient loadings (NH4+-N, NO3-N, and TN concentrations; Figure 5a–c) were positively correlated with DOC on the watershed scale, implying that human activities may influence the DOC variability.
The effects of human activities could be explained by external loading input and internal DOC production. Substantial external DOC inputs have been found widely, which significantly affect the carbon cycle of aquatic ecosystems [48,49,50]. Generally, the DOC and nutrients co-vary [14,51]. A large number of external loads enter the ponds to supplement DOC and nutrient loadings due to farmland drainage, leaching, runoff, and soil erosion [37,52], eventually leading to the nutrient and DOC being correlated with each other. The sewage pond is easily affected by human activities, and the discharge of domestic sewage into the pond directly affects the DOC and nitrogen cycles [53,54], likely making the changes in DOC more sensitive to the enrichment of nutrients. The direct DOC input from domestic sewage discharge could increase DOC concentration. Meanwhile, the water exchange capacity of the sewage pond is poor. The nutrients, such as organic matter, nitrogen, and phosphorus, in the pond stimulate the biological metabolic activities, leading to a higher DOC concentration. Large feed applications in aquaculture ponds may increase the DOC and nutrients synchronously [55], which can also explain why high DOC occurred with nutrient enrichment. It is reasonable to assume that surface runoff can contribute to the DOC’s variability. In the study region, the surface runoff was mainly driven by precipitation, and significant correlations between DOC and precipitation were only found in the natural pond and irrigation pond (Figure 4). These suggested that other sources may not be the controlling factor determining the DOC variability.
Nutrient enrichment can indirectly increase DOC by stimulating primary production. Generally, phytoplankton can release a large amount of DOC in the process of growth and death, providing endogenous DOC [56,57,58]. Thus, some previous studies have found that primary production influences the DOC variability of lakes [17,59]. It is well established that nutrient enrichment can significantly improve the primary production of inland waters [14,60,61], which is also evidenced by our measured data showing peak Chl-a concentration (an index of primary production) occurred in the sewage pond with high nutrient loadings. In the natural pond, the Chl-a and nutrient concentrations were the lowest (Table 1). Importantly, the Chl-a concentration was positively correlated with DOC (Figure 5d). Both of these suggested an indirect role for human activities in determining DOC variability. For comparison, peak DOC concentration occurred in the sewage pond, and it is important to note that the Chl-a concentration in the sewage pond (50.16 μg L−1) was significantly higher than that in the natural pond (2.37 μg L−1), aquaculture pond (5.78 μg L−1), and irrigation pond (6.22 μg L−1). Higher Chl-a concentration probably contributes to the large DOC, suggesting the indirect role of human activities in determining DOC variability.

4.2. Causes of the Temporal Variation and the Role of Precipitation

Notably, field measurements showed the DOC varied temporally (Figure 2). This finding was expected considering the endogenous DOC production rate was influenced by primary production, which generally depended on temperature [57,62]. This is well illustrated by the seasonal variability of DOC at the natural pond, showing peak DOC in warm seasons and the lowest in cold seasons. Meanwhile, the temporal variability of farm practices was likely associated with DOC variability. For instance, in the irrigation pond, peak DOC occurred in the spring (Figure 2d), which could be attributed to the centralized fertilization by farmers at that time. Thus, the temporal variability of DOC and its influencing factors should be considered to better understand the carbon cycle, especially for agricultural watersheds with intense human activities [63,64].
Previous studies have demonstrated that hydrological regimes controlled the DOC variability by regulating the DOC input from watersheds [5,20,65]. In the region we studied, precipitation was the main hydrological event (Figure 4). A previous study has shown that precipitation is negatively correlated with lake DOC [20], but some published studies found that DOC increases with heavy precipitation [66,67]. Even previous field measurements have found that the effect of precipitation varied seasonally [64]. Here, our results showed that heavy precipitation generally increased the DOC concentration, suggesting hydrology regulated DOC input from the watershed [62]. The DOC concentration-precipitation relationships also implied the agricultural watershed contained considerable amounts of DOC, which would be transported to the ponds via runoff. Meanwhile, it should be noted that DOC was unrelated to precipitation in the aquaculture pond (Figure 4c), due to the fact that the aquaculture pond was sealed off with fences, which were likely to prevent the precipitation-driven DOC input.

4.3. Comparison with Other Studies

Field measurements over a year showed the DOC varied among ponds draining different landscapes (Figure 3). Notably, the DOC concentration of the sewage pond ((12.08 ± 2.92) mg/L) was twice that of the natural pond ((6.17 ± 1.49) mg/L). The pollutant loadings may contribute to the large difference in DOC between two ponds [33,54]. The concentrations of Chl-a, COD, and NH4+-N in the natural pond, which were the mainly human-dominated/induced pollutant, were relatively low (Table 1), with less human activities, suggesting minor external DOC input from the watershed [14,51]. Meanwhile, the concentration of Chl-a was also lower than that in the other three landscape ponds (Table 1), suggesting a lower DOC production rate in the natural pond [17,59]. The sewage pond was significantly affected by human activities with substantial domestic sewage discharge, which contained a large amount of DOC and contributed considerably to the high DOC concentration [54]. Large pollutant input resulted in high Chl-a concentration in the sewage pond (Table 1). In this study, the Chl-a concentrations in the sewage pond were 21, 9, and 8 times higher than in the natural pond, aquaculture pond, and irrigation pond, respectively, suggesting a significant DOC production rate [58,59]. Previous studies have found aquatic DOC to vary regionally [17,20]. Our results found that DOC varied significantly within a single watershed due to intense human activities.
The measured DOC concentration was significantly higher than the mean value (3.88 mg L−1) of global lakes [65], generally higher than in eutrophic lakes with high primary production [14,59], and slightly higher than the median of 7500 lakes across diverse geographical regions [20]. Meanwhile, the DOC concentration in this study was lower than the value of Canadian ponds [68] but similar in German ponds [69]. Small ponds are abundant on global and regional scales [21,22], and global agricultural land expansion would be accompanied by a large number of small ponds [34,35,37]. To accurately estimate the carbon budget of inland waters and better understand their influence factors, much attention should be paid to the DOC variability of ponds with intense human activity, such as in agricultural watersheds.
DOC is one of the largest organic pools on the earth’s surface [12,17], which also provides substances for CO2 and CH4 production. A previous study has shown that a large contribution to inland water carbon gas emissions from small ponds is primarily due to the enhanced microbial respiration, which is a result of increased carbon loadings such as DOC [24]. Positive correlations between CO2/CH4 and DOC have been found in small waterbodies such as ponds [35], suggesting DOC concentration can be considered a proxy of greenhouse gas production potential. The biological and photochemical degradation of DOC has been suggested as an important factor underlying this positive relationship between DOC and CO2 concentrations [70]. Photochemical oxidation can directly transform allochthonous DOC to CO2 as well as produce lower molecular weight fractions of DOC available for bacterial mineralization [71]. Allochthonous DOC may also be directly degraded by biological processes and subsequently converted to CO2 in freshwater [72,73]. Thus, the DOC variability and its influencing factors should be considered in the carbon cycle and greenhouse gas predictions.
The DOC variability and their influencing factors in ponds draining different landscapes from a typical agricultural watershed were investigated based on field measurements. However, some limitations may cause uncertainties in this study. First, temporal variation of DOC was observed, suggesting high-frequency observation was needed, especially during rainfall periods and farming seasons. For instance, the DOC concentration in our study was associated with precipitation and nutrient loadings. The heavy precipitation and farmland N fertilizer application affect the DOC variability [66,67]. Second, inter-annual climate patterns (e.g., wet-dry periods) have been found to influence aquatic DOC variability [74,75]. The data in this study is limited to just one year (from September 2020 to September 2021). Long-term field measurements may be critical to understanding controls on pond DOC variability and predicting future change. Meanwhile, the lack of field measurement in December 2020 and February 2021 may hamper our understanding of the temporal variability of DOC. Supplementary measurements are needed in the future to identify the influencing factors of DOC. Third, the DOC concentration in aquatic ecosystems such as lakes and ponds can be affected by interconnected physical, chemical, and biological processes [17,45,56], and watershed landscape characteristics also modulate the DOC dynamics [5]. This study focused on the effects of external pollutant loads and algae blooms on DOC variability. Human activities and other biogeochemical processes should be paid attention in such a highly agricultural-dominated watershed.

5. Conclusions

The field measurements over a year showed the DOC concentration varied among ponds across different pond types. Specifically, the mean DOC concentrations in the natural pond, sewage pond, aquaculture pond, and irrigation pond were (6.17 ± 1.49) mg/L, (12.08 ± 2.92) mg/L, (9.36 ± 2.92) mg/L, and (8.91 ± 2.71) mg/L, respectively. In addition, the Peak DOC concentrations occurred in the aquatic ecosystem with higher nutrient concentrations, suggesting the role of watershed land use and human activities (input of fertilizer N and domestic sewage discharge). Meanwhile, monthly measurements found that DOC varied across sampling dates, implying that temporal variability of DOC should be considered in agricultural watersheds with intense human activities. The DOC variability was positively correlated with nutrients, primary production indicated by chlorophyll-a, and precipitation, suggesting anthropogenic loading input, an internal production rate, and a hydrological regime that regulated the substantial variability of DOC in these ponds at the watershed scale. More attention should be paid to ponds in agricultural watersheds to better understand the roles of inland waters in the global carbon cycle.

Author Contributions

Z.L. conceptualization, methodology, investigation, formal analysis, writing—original draft, writing—review & editing. Q.X. methodology, writing—review & editing, supervision, funding acquisition. L.D. formal analysis, writing—review & editing. L.S. formal analysis, writing—review & editing. X.Z. investigation, formal analysis. Y.J. conceptualization. All authors have read and agreed to the published version of the manuscript.

Funding

This research was funded by National Natural Science Foundation of China: 42271114; National Natural Science Foundation of China: 41801093; National Natural Science Foundation of China: 42005058; Provincial Science and Technology Innovative Program for Carbon Peak and Carbon Neutrality of Jiangsu of China: BK20220018; The Open Research Fund of National Engineering Research Center for Agro-Ecological Big Data Analysis & Application, Anhui University: AE202205; The Innovative Development Project of Hunan Meteorological Administration: CXFZ2022-QNZX14.

Institutional Review Board Statement

Not applicable.

Informed Consent Statement

Not applicable.

Data Availability Statement

Not applicable.

Conflicts of Interest

The authors declare no conflict of interest.

References

  1. Read, J.S.; Rose, K.C. Physical responses of small temperate lakes to variation in dissolved organic carbon concentrations. Limnol. Oceanogr. 2013, 58, 921–931. [Google Scholar] [CrossRef]
  2. Morris, D.P.; Zagarese, H.; Williamson, C.E.; Balseiro, E.G.; Hargreaves, B.R.; Modenutti, B.; Moeller, R.; Queimalinos, C. The Attentuation of Solar Uv Radiation in Lakes and the Role of Dissolved Organic Carbon. Limnol. Oceanogr. 1995, 40, 1381–1391. [Google Scholar] [CrossRef]
  3. Tranvik, L.J.; Downing, J.A.; Cotner, J.B.; Loiselle, S.A.; Striegl, R.G.; Ballatore, T.J.; Dillon, P.; Finlay, K.; Fortino, K.; Knoll, L.B.; et al. Lakes and Reservoirs as Regulators of Carbon Cycling and Climate. Limnol. Oceanogr. 2009, 54, 2298–2314. [Google Scholar] [CrossRef]
  4. Seekell, D.A.; Lapierre, J.; Karlsson, J. Trade-Offs between Light and Nutrient Availability across Gradients of Dissolved Organic Carbon Concentration in Swedish Lakes: Implications for Patterns in Primary Production. Can. J. Fish. Aquat. Sci. 2015, 72, 1663–1671. [Google Scholar] [CrossRef]
  5. Zhu, X.; Chen, L.; Pumpanen, J.; Ojala, A.; Zobitz, J.; Zhou, X.; Laudon, H.; Palviainen, M.; Neitola, K.; Berninger, F. The Role of Terrestrial Productivity and Hydrology in Regulating Aquatic Dissolved Organic Carbon Concentrations in Boreal Catchments. Glob. Chang. Biol. 2022, 28, 2764–2778. [Google Scholar] [CrossRef]
  6. Persson, I.; Jones, I.D. The Effect of Water Colour on Lake Hydrodynamics: A Modelling Study. Freshw. Biol. 2008, 53, 2345–2355. [Google Scholar] [CrossRef]
  7. Fee, E.J.; Hecky, R.E.; Kasian, S.E.M.; Cruikshank, D.R. Effects of Lake Size, Water Clarity, and Climatic Variability on Mixing Depths in Canadian Shield Lakes. Limnol. Oceanogr. 1996, 41, 912–920. [Google Scholar] [CrossRef]
  8. Zhou, Y.; Zhang, Y.; Jeppesen, E.; Murphy, K.R.; Shi, K.; Liu, M.; Liu, X.; Zhu, G. Inflow Rate-Driven Changes in the Composition and Dynamics of Chromophoric Dissolved Organic Matter in a Large Drinking Water Lake. Water Res. 2016, 100, 211–221. [Google Scholar] [CrossRef]
  9. Creed, I.F.; Bergstrom, A.; Trick, C.G.; Grimm, N.B.; Hessen, D.O.; Karlsson, J.; Kidd, K.A.; Kritzberg, E.; McKnight, D.M.; Freeman, E.C.; et al. Global Change-Driven Effects on Dissolved Organic Matter Composition: Implications for Food Webs of Northern Lakes. Glob. Chang. Biol. 2018, 24, 3692–3714. [Google Scholar] [CrossRef]
  10. Karlsson, J.; Bystrom, P.; Ask, J.; Ask, P.; Persson, L.; Jansson, M. Light Limitation of Nutrient-Poor Lake Ecosystems. Nature 2009, 460, 506–509. [Google Scholar] [CrossRef]
  11. Tiwari, T.; Sponseller, R.A.; Laudon, H. The Emerging Role of Drought as a Regulator of Dissolved Organic Carbon in Boreal Landscapes. Nat. Commun. 2022, 13, 5125. [Google Scholar] [CrossRef]
  12. Cole, J.J.; Prairie, Y.T.; Caraco, N.F.; McDowell, W.H.; Tranvik, L.J.; Striegl, R.G.; Duarte, C.M.; Kortelainen, P.; Downing, J.A.; Middelburg, J.J.; et al. Plumbing the Global Carbon Cycle: Integrating Inland Waters into the Terrestrial Carbon Budget. Ecosystems 2007, 10, 172–185. [Google Scholar] [CrossRef]
  13. Raymond, P.A.; Hartmann, J.; Lauerwald, R.; Sobek, S.; McDonald, C.; Hoover, M.; Butman, D.; Striegl, R.; Mayorga, E.; Humborg, C.; et al. Global Carbon Dioxide Emissions from Inland Waters. Nature 2013, 503, 355–359. [Google Scholar] [CrossRef]
  14. Xiao, Q.; Xu, X.; Duan, H.; Qi, T.; Qin, B.; Lee, X.; Hu, Z.; Wang, W.; Xiao, W.; Zhang, M. Eutrophic Lake Taihu as a Significant CO2 Source During 2000–2015. Water Res. 2020, 170, 115331. [Google Scholar] [CrossRef]
  15. Zhang, L.; Xia, X.; Liu, S.; Zhang, S.; Li, S.; Wang, J.; Wang, G.; Gao, H.; Zhang, Z.; Wang, Q.; et al. Significant Methane Ebullition from Alpine Permafrost Rivers on the East Qinghai–Tibet Plateau. Nat. Geosci. 2020, 13, 349–354. [Google Scholar] [CrossRef]
  16. Stanley, E.H.; Casson, N.J.; Christel, S.T.; Crawford, J.T.; Loken, L.C.; Oliver, S.K. The Ecology of Methane in Streams and Rivers: Patterns, Controls, and Global Significance. Ecol. Monogr. 2016, 86, 146–171. [Google Scholar] [CrossRef]
  17. Song, K.; Wen, Z.; Shang, Y.; Yang, H.; Lyu, L.; Liu, G.; Fang, C.; Du, J.; Zhao, Y. Quantification of Dissolved Organic Carbon (DOC) Storage in Lakes and Reservoirs of Mainland China. Environ. Manag. 2018, 217, 391–402. [Google Scholar] [CrossRef]
  18. Blaurock, K.; Beudert, B.; Gilfedder, B.S.; Fleckenstein, J.H.; Peiffer, S.; Hopp, L. Low Hydrological Connectivity after Summer Drought Inhibits DOC Export in a Forested Headwater Catchment. Hydrol. Earth Syst. Sci. 2021, 25, 5133–5151. [Google Scholar] [CrossRef]
  19. Oni, S.K.; Futter, M.N.; Dillon, P.J. Landscape-Scale Control of Carbon Budget of Lake Simcoe: A Process-Based Modelling Approach. J. Great Lakes Res. 2011, 37, 160–165. [Google Scholar] [CrossRef]
  20. Sobek, S.; Tranvik, L.J.; Prairie, Y.T.; Kortelainen, P.; Cole, J.J. Patterns and Regulation of Dissolved Organic Carbon: An Analysis of 7500 Widely Distributed Lakes. Limnol. Oceanogr. 2007, 52, 1208–1219. [Google Scholar] [CrossRef]
  21. Downing, J.A.; Prairie, Y.T.; Cole, J.J.; Duarte, C.M.; Tranvik, L.J.; Striegl, R.G.; McDowell, W.H.; Kortelainen, P.; Caraco, N.F.; Melack, J.M.; et al. The Global Abundance and Size Distribution of Lakes, Ponds, and Impoundments. Limnol. Oceanogr. 2006, 51, 2388–2397. [Google Scholar] [CrossRef]
  22. Cael, B.B.; Heathcote, A.J.; Seekell, D.A. The Volume and Mean Depth of Earth’s Lakes. Geophys. Res. Lett. 2017, 44, 209–218. [Google Scholar] [CrossRef]
  23. Read, J.S.; Hamilton, D.P.; Desai, A.R.; Rose, K.C.; MacIntyre, S.; Lenters, J.D.; Smyth, R.L.; Hanson, P.C.; Cole, J.J.; Staehr, P.A.; et al. Lake-Size Dependency of Wind Shear and Convection as Controls on Gas Exchange. Geophys. Res. Lett. 2012, 39, L09405. [Google Scholar] [CrossRef]
  24. Holgerson, M.A.; Raymond, P.A. Large Contribution to Inland Water CO2 and CH4 Emissions from Very Small Ponds. Nat. Geosci. 2016, 9, 222–226. [Google Scholar] [CrossRef]
  25. Cole, J.J.; Carpenter, S.R.; Kitchell, J.; Pace, M.L.; Solomon, C.T.; Weidel, B. Strong Evidence for Terrestrial Support of Zooplankton in Small Lakes Based on Stable Isotopes of Carbon, Nitrogen, and Hydrogen. Proc. Natl. Acad. Sci. USA 2011, 108, 1975–1980. [Google Scholar] [CrossRef]
  26. Lv, M.; Wu, S.; Ma, M.; Huang, P.; Wen, Z.; Chen, J. Small water bodies in China: Spatial distribution and influencing factors. Sci. China Earth Sci. 2022, 65, 1431–1448. [Google Scholar] [CrossRef]
  27. Yang, P.; Huang, J.; Tan, L.; Tong, C.; Jin, B.; Hu, B.; Gao, C.; Yuan, J.; Lai, D.Y.F.; Yang, H. Large variations in indirect N2O emission factors (EF5) from coastal aquaculture systems in China from plot to regional scales. Water Res. 2021, 200, 117208. [Google Scholar] [CrossRef]
  28. Wang, L.L.; Song, C.C.; Yang, G.S. Dissolved organic carbon characteristics in surface ponds from contrasting wetland ecosystems: A case study in the Sanjiang Plain, Northeast China. Hydrol. Earth Syst. Sci. 2013, 17, 371–378. [Google Scholar] [CrossRef]
  29. Yang, P.; Yang, H.; Lai, D.Y.F. Production and uptake of dissolved carbon, nitrogen, and phosphorus in overlying water of aquaculture shrimp ponds in subtropical estuaries, China. Environ. Sci. Pollut. Res. 2019, 26, 21565–21578. [Google Scholar] [CrossRef]
  30. Puts, I.C.; Ask, J.; Siewert, M.B.; Sponseller, R.A.; Hessen, D.O.; Bergstrom, A.K. Landscape Determinants of Pelagic and Benthic Primary Production in Northern Lakes. Glob. Chang. Biol. 2022, 28, 7063–7077. [Google Scholar] [CrossRef]
  31. Borges, A.V.; Darchambeau, F.; Lambert, T.; Bouillon, S.; Morana, C.; Brouyere, S.; Hakoun, V.; Jurado, A.; Tseng, H.C.; Descy, J.P.; et al. Effects of Agricultural Land Use on Fluvial Carbon Dioxide, Methane and Nitrous Oxide Concentrations in a Large European River, the Meuse (Belgium). Sci. Total Environ. 2018, 610–611, 342–355. [Google Scholar] [CrossRef]
  32. Curra-Sanchez, E.D.; Lara, C.; Cornejo-D’Ottone, M.; Nimptsch, J.; Aguayo, M.; Broitman, B.R.; Saldias, G.S.; Vargas, C.A. Contrasting Land-Uses in Two Small River Basins Impact the Colored Dissolved Organic Matter Concentration and Carbonate System Along a River-Coastal Ocean Continuum. Sci. Total Environ. 2021, 806, 150435. [Google Scholar] [CrossRef]
  33. Wilson, H.F.; Xenopoulos, M.A. Effects of Agricultural Land Use on the Composition of Fluvial Dissolved Organic Matter. Nat. Geosci. 2009, 2, 37–41. [Google Scholar] [CrossRef]
  34. Ollivier, Q.R.; Maher, D.T.; Pitfield, C.; Macreadie, P.I. Punching above Their Weight: Large Release of Greenhouse Gases from Small Agricultural Dams. Glob. Chang. Biol. 2019, 25, 721–732. [Google Scholar] [CrossRef]
  35. Peacock, M.; Audet, J.; Bastviken, D.; Cook, S.; Evans, C.D.; Grinham, A.; Holgerson, M.A.; Hogbom, L.; Pickard, A.E.; Zieliński, P.; et al. Small Artificial Waterbodies Are Widespread and Persistent Emitters of Methane and Carbon Dioxide. Glob. Chang. Biol. 2021, 27, 5109–5123. [Google Scholar] [CrossRef]
  36. Xiao, Q.; Hu, Z.; Fu, C.; Bian, H.; Lee, X.; Chen, S.; Shang, D. Surface Nitrous Oxide Concentrations and Fluxes from Water Bodies of the Agricultural Watershed in Eastern China. Environ. Pollut. 2019, 251, 185–192. [Google Scholar] [CrossRef]
  37. Xiao, Q.; Hu, Z.; Hu, C.; Towfiqul Islam, A.R.M.; Bian, H.; Chen, S.; Liu, C.; Lee, X. A Highly Agricultural River Network in Jurong Reservoir Watershed as Significant CO2 and CH4 Sources. Sci. Total Environ. 2021, 769, 144558. [Google Scholar] [CrossRef]
  38. Zhao, J.; Zhang, M.; Xiao, W.; Jia, L.; Zhang, X.; Wang, J.; Zhang, Z.; Xie, Y.; Pu, Y.; Liu, S.; et al. Large Methane Emission from Freshwater Aquaculture Ponds Revealed by Long-Term Eddy Covariance Observation. Agric. For. Meteorol. 2021, 308–309, 108600. [Google Scholar] [CrossRef]
  39. Li, C.; Li, Z.Z.; Zhang, F.M.; Lu, Y.Y.; Duan, C.F.; Xu, Y. Seasonal dynamics of carbon dioxide and water fluxes in a rice-wheat rotation system in the Yangtze-Huaihe region of China. Agric. Water Manag. 2023, 275, 107992. [Google Scholar] [CrossRef]
  40. Li, Z.; Wu, Y.; Wang, R.; Liu, B.; Qian, Z.; Li, C. Assessment of climatic impact on vegetation spring phenology in northern China. Atmosphere 2023, 14, 117. [Google Scholar] [CrossRef]
  41. Yan, X.; Cai, Z.; Yang, R.; Ti, C.; Xia, Y.; Li, F.; Wang, J.; Ma, A. Nitrogen Budget and Riverine Nitrogen Output in a Rice Paddy Dominated Agricultural Watershed in Eastern China. Biogeochemistry 2011, 106, 489–501. [Google Scholar] [CrossRef]
  42. Qin, B.; Xu, P.; Wu, Q.; Luo, L.; Zhang, Y. Environmental Issues of Lake Taihu, China. Hydrobiologia 2007, 581, 3–14. [Google Scholar] [CrossRef]
  43. Audet, J.; Wallin, M.B.; Kyllmar, K.; Andersson, S.; Bishop, K. Nitrous Oxide Emissions from Streams in a Swedish Agricultural Catchment. Agric. Ecosyst. Environ. 2017, 236, 295–303. [Google Scholar] [CrossRef]
  44. Garnier, J.; Vilain, G.; Silvestre, M.; Billen, G.; Jehanno, S.; Poirier, D.; Martinez, A.; Decuq, C.; Cellier, P.; Abril, G. Budget of Methane Emissions from Soils, Livestock and the River Network at the Regional Scale of the Seine Basin (France). Biogeochemistry 2013, 116, 199–214. [Google Scholar] [CrossRef]
  45. Griffis, T.J.; Chen, Z.; Baker, J.M.; Wood, J.D.; Millet, D.B.; Lee, X.; Venterea, R.T.; Turner, P.A. Nitrous Oxide Emissions Are Enhanced in a Warmer and Wetter World. Proc. Natl. Acad. Sci. USA 2017, 114, 12081–12085. [Google Scholar] [CrossRef]
  46. Taylor, P.G.; Townsend, A.R. Stoichiometric Control of Organic Carbon-Nitrate Relationships from Soils to the Sea. Nature 2010, 464, 1178–1181. [Google Scholar] [CrossRef]
  47. Mao, R.; Chen, H.; Li, S. Phosphorus Availability as a Primary Control of Dissolved Organic Carbon Biodegradation in the Tributaries of the Yangtze River in the Three Gorges Reservoir Region. Sci. Total Environ. 2017, 574, 1472–1476. [Google Scholar] [CrossRef]
  48. Sobek, S.; Tranvik, L.J.; Cole, J.J. Temperature Independence of Carbon Dioxide Supersaturation in Global Lakes. Glob. Biogeochem. Cycles 2005, 19, GB2003. [Google Scholar] [CrossRef]
  49. Vachon, D.; Prairie, Y.T.; Guillemette, F.; del Giorgio, P.A. Modeling Allochthonous Dissolved Organic Carbon Mineralization under Variable Hydrologic Regimes in Boreal Lakes. Ecosystems 2017, 20, 781–795. [Google Scholar] [CrossRef]
  50. Kiuru, P.; Ojala, A.; Mammarella, I.; Heiskanen, J.; Kamarainen, M.; Vesala, T.; Huttula, T. Effects of Climate Change on CO2 Concentration and Efflux in a Humic Boreal Lake: A Modeling Study. J. Geophys. Res. Biogeosci. 2018, 123, 2212–2233. [Google Scholar] [CrossRef]
  51. Perga, M.; Maberly, S.C.; Jenny, J.; Alric, B.; Pignol, C.; Naffrechoux, E. A Century of Human-Driven Changes in the Carbon Dioxide Concentration of Lakes. Glob. Biogeochem. Cycles 2016, 30, 93–104. [Google Scholar] [CrossRef]
  52. Gücker, B.; Silva, R.C.S.; Graeber, D.; Monteiro, J.A.F.; Boëchat, I.G. Urbanization and Agriculture Increase Exports and Differentially Alter Elemental Stoichiometry of Dissolved Organic Matter (DOM) from Tropical Catchments. Sci. Total Environ. 2016, 550, 785–792. [Google Scholar] [CrossRef]
  53. Yang, H.; Xing, Y.; Xie, P.; Ni, L.; Rong, K. Carbon Source/Sink Function of a Subtropical, Eutrophic Lake Determined from an Overall Mass Balance and a Gas Exchange and Carbon Burial Balance. Environ. Pollut. 2008, 151, 559–568. [Google Scholar] [CrossRef]
  54. Teurlincx, S.; Kuiper, J.J.; Hoevenaar, E.C.M.; Lurling, M.; Brederveld, R.J.; Veraart, A.J.; Janssen, A.B.G.; Mooij, W.M.; Domis, L.N.D. Towards Restoring Urban Waters: Understanding the Main Pressures. Curr. Opin. Environ. Sustain. 2019, 36, 49–58. [Google Scholar] [CrossRef]
  55. Yang, P.; Zhang, Y.; Yang, H.; Zhang, Y.; Xu, J.; Tan, L.; Tong, C.; Lai, D.Y.F. Large Fine-Scale Spatiotemporal Variations of Ch4 Diffusive Fluxes from Shrimp Aquaculture Ponds Affected by Organic Matter Supply and Aeration in Southeast China. J. Geophys. Res. Biogeosci. 2019, 124, 1290–1307. [Google Scholar] [CrossRef]
  56. Ye, L.; Shi, X.; Wu, X.; Zhang, M.; Yu, Y.; Li, D.; Kong, F. Dynamics of Dissolved Organic Carbon after a Cyanobacterial Bloom in Hypereutrophic Lake Taihu (China). Limnologica 2011, 41, 382–388. [Google Scholar] [CrossRef]
  57. Xiao, Q.; Duan, H.; Qi, T.; Hu, Z.; Liu, S.; Zhang, M.; Lee, X. Environmental Investments Decreased Partial Pressure of CO2 in a Small Eutrophic Urban Lake: Evidence from Long-Term Measurements. Environ. Pollut. 2020, 263, 114433. [Google Scholar] [CrossRef]
  58. Baines, S.B.; Pace, M.L. The Production of Dissolved Organic Matter by Phytoplankton and Its Importance to Bacteria: Patterns across Marine and Freshwater Systems. Limnol. Oceanogr. 1991, 36, 1078–1090. [Google Scholar] [CrossRef]
  59. Pacheco, F.S.; Roland, F.; Downing, J.A. Eutrophication Reverses Whole-Lake Carbon Budgets. Inland Waters 2014, 4, 41–48. [Google Scholar] [CrossRef]
  60. Paerl, H.W.; Xu, H.; McCarthy, M.J.; Zhu, G.; Qin, B.; Li, Y.; Gardner, W.S. Controlling Harmful Cyanobacterial Blooms in a Hyper-Eutrophic Lake (Lake Taihu, China): The Need for a Dual Nutrient (N & P) Management Strategy. Water Res. 2011, 45, 1973–1983. [Google Scholar] [CrossRef]
  61. Beaulieu, J.J.; DelSontro, T.; Downing, J.A. Eutrophication Will Increase Methane Emissions from Lakes and Impoundments During the 21st Century. Nat. Commun. 2019, 10, 1375. [Google Scholar] [CrossRef] [PubMed]
  62. Wen, H.; Perdrial, J.; Abbott, B.W.; Bernal, S.; Dupas, R.; Godsey, S.E.; Harpold, A.; Rizzo, D.; Underwood, K.; Adler, T.; et al. Temperature Controls Production but Hydrology Regulates Export of Dissolved Organic Carbon at the Catchment Scale. Hydrol. Earth Syst. Sci. 2020, 24, 945–966. [Google Scholar] [CrossRef]
  63. Royer, T.V.; David, M.B. Export of Dissolved Organic Carbon from Agricultural Streams in Illinois, USA. Aquat. Sci. 2005, 67, 465–471. [Google Scholar] [CrossRef]
  64. Eimers, M.C.; Buttle, J.; Watmough, S.A. Influence of Seasonal Changes in Runoff and Extreme Events on Dissolved Organic Carbon Trends in Wetland-and Upland-Draining Streams. Can. J. Fish. Aquat. 2008, 65, 796–808. [Google Scholar] [CrossRef]
  65. Toming, K.; Kotta, J.; Uuemaa, E.; Sobek, S.; Kutser, T.; Tranvik, L.J. Predicting Lake Dissolved Organic Carbon at a Global Scale. Sci. Rep. 2020, 10, 8471. [Google Scholar] [CrossRef]
  66. Heslop, J.K.; Hung, J.K.Y.; Tong, H.; Simpson, M.J.; Chapman, F.M.; Roulet, N.; Lafreniere, M.J.; Lamoureux, S.F. Diverging Pond Dissolved Organic Matter Characteristics Yield Similar CO2 Flux Potentials in a Disturbed High Arctic Landscape. Environ. Res. Lett. 2021, 16, 044016. [Google Scholar] [CrossRef]
  67. Raymond, P.A.; Saiers, J.E.; Sobczak, W.V. Hydrological and Biogeochemical Controls on Watershed Dissolved Organic Matter Transport: Pulse-Shunt Concept. Ecology 2016, 97, 5–16. [Google Scholar] [CrossRef]
  68. Linh, N.; Vu, T.H.; Hall, B.D. Photosensitizing properties of dissolved organic carbon in Canadian prairie pothole wetland ponds change in response to sunlight. Can. Water Resour. J. 2022, 47, 184–201. [Google Scholar] [CrossRef]
  69. Risse-Buhl, U.; Hagedorn, F.; Dümig, A.; Gessner, M.O.; Schaaf, W.; Nii-Annang, S.; Gerull, L.; Mutz, M. Dynamics, chemical properties and bioavailability of DOC in an early successional catchment. Biogeosciences 2013, 10, 4751–4765. [Google Scholar] [CrossRef]
  70. Lapierre, J.F.; Guillemette, F.; Berggren, M.; del Giorgio, P.A. Increases in terrestrially derived carbon stimulate organic carbon processing and CO2 emissions in boreal aquatic ecosystems. Nat. Commun. 2013, 4, 2972. [Google Scholar] [CrossRef]
  71. Tranvik, L.J.; Bertilsson, S. Contrasting effects of solar UV radiation on dissolved organic sources for bacterial growth. Ecol. Lett. 2001, 4, 458–463. [Google Scholar] [CrossRef]
  72. Guillemette, F.; McCallister, S.L.; del Giorgio, P.A. Differentiating the degradation dynamics of algal and terrestrial carbon within complex natural dissolved organic carbon in temperate lakes. J. Geophys. Res. Biogeosci. 2013, 118, 963–973. [Google Scholar] [CrossRef]
  73. McCallister, S.L.; del Giorgio, P.A. Evidence for the respiration of ancient terrestrial organic C in northern temperate lakes and streams. Proc. Natl. Acad. Sci. USA 2012, 109, 16963–16968. [Google Scholar] [CrossRef]
  74. Kothawala, D.N.; Stedmon, C.A.; Müller, R.A.; Weyhenmeyer, G.A.; Köhler, S.J.; Tranvik, L.J. Controls of dissolved organic matter quality: Evidence from a large-scale boreal lake survey. Glob. Chang. Biol. 2014, 20, 1101–1114. [Google Scholar] [CrossRef]
  75. Pugh, E.A.; Olefeldt, D.; Leader, S.N.; Hokanson, K.J.; Devito, K.J. Characteristics of Dissolved Organic Carbon in Boreal Lakes: High Spatial and Inter-Annual Variability Controlled by Landscape Attributes and Wet-Dry Periods. Water Resour. Res. 2021, 57, e2021WR030021. [Google Scholar] [CrossRef]
Figure 1. Map showing the geographical location of the Tongyang River watershed and sampling ponds. The blue area indicates Lake Chaohu; The blue lines indicate inflow and outflow rivers; The gray area indicates the study area; The blue diamonds denote different sampling ponds, and the yellow triangle denotes a local automatic meteorological observation station in the watershed.
Atmosphere 14 00363 g001
Figure 2. Monthly variations of DOC concentration in the natural pond (a), sewage pond (b), aquaculture pond (c), and irrigation pond (d).
Atmosphere 14 00363 g002
Figure 3. Spatial variations of DOC concentration in different ponds during sampling period. Error bars indicate standard deviation. Different letters indicate significant differences at p < 0.05 across pond types.
Atmosphere 14 00363 g003
Figure 4. Temporal correlations between DOC concentration and precipitation in the natural pond (a), sewage pond (b), aquaculture pond (c), and irrigation pond (d). The 5-day accumulated precipitation (mm) before each sampling was used.
Atmosphere 14 00363 g004
Figure 5. Correlations between DOC concentration and NH4+-N concentration (a), between DOC concentration and TN concentration (b), between DOC concentration and NO3-N concentration (c), and between DOC concentration and Chl-a concentration (d) of ponds at watershed scale.
Atmosphere 14 00363 g005
Table 1. Key aquatic environment variables at different ponds of the Tongyang River watershed during pond-survey period. The presented values are the mean ± standard deviation. Different letters indicate significant differences at p < 0.05 across pond types.
Pond TypeDepthAreaTemperatureDOCODNO3-NNH4+-NTNDTNTPDTPChl-a
(m)(km2)(°C)(mg/L)(mg/L)(mg/L)(mg/L)(mg/L)(mg/L)(mg/L)(mg/L)(μg/L)
Natural pond2–30.00422.62 ± 8.279.86 ± 3.043.36 ± 0.78 c0.46 ± 0.190.29 ± 0.09 b1.35 ± 0.25 b1.23 ± 0.25 b0.07 ± 0.04 b0.06 ± 0.03 b2.37 ± 1.03 b
Sewage pond0.5–10.00722.43 ± 9.998.94 ± 3.806.84 ± 1.07 a0.67 ± 0.210.68 ± 0.48 a2.89 ± 1.13 a1.93 ± 0.63 a0.35 ± 0.25 a0.12 ± 0.08 a50.16 ± 43.15 a
Aquaculture pond0.3–0.50.00322.03 ± 8.729.29 ± 4.254.64 ± 0.93 b0.48 ± 0.150.39 ± 0.12 b1.41 ± 0.12 b1.28 ± 0.11 b0.07 ± 0.04 b0.05 ± 0.04 b5.78 ± 3.59 b
Irrigation pond1–20.0122.90 ± 9.517.73 ± 2.774.65 ± 1.05 b0.56 ± 0.330.41 ± 0.15 b1.45 ± 0.35 b1.32 ± 0.31 b0.08 ± 0.03 b0.06 ± 0.03 b6.22 ± 4.10 b
Table 2. Correlations between monthly DOC concentration and environment variables.
Pond TypeTemperatureDOChl-aCODNO3-NNH4+-NTNTP
(°C)(mg/L)(μg/L)(mg/L)(mg/L)(mg/L)(mg/L)(mg/L)
Natural pond0.230.29−0.470.53 *0.340.30.55 *0.88 **
Sewage pond−0.150.240.61 *0.290.61 *0.55 *0.71 *0.72 *
Aquaculture pond−0.020.37−0.460.250.120.55 *0.30.4
Irrigation pond0.22−0.12−0.210.120.54 *0.59 *−0.260.39
** Correlation is significant at the 0.01 level. * Correlation is significant at the 0.05 level
Disclaimer/Publisher’s Note: The statements, opinions and data contained in all publications are solely those of the individual author(s) and contributor(s) and not of MDPI and/or the editor(s). MDPI and/or the editor(s) disclaim responsibility for any injury to people or property resulting from any ideas, methods, instructions or products referred to in the content.

