Article

The Impacts of Assimilating Fengyun-4A Atmospheric Motion Vectors on Typhoon Forecasts

School of Atmospheric Sciences, Chengdu University of Information Technology, Chengdu 610225, China
*
Author to whom correspondence should be addressed.
Atmosphere 2023, 14(2), 375; https://doi.org/10.3390/atmos14020375
Submission received: 25 December 2022 / Revised: 10 February 2023 / Accepted: 11 February 2023 / Published: 14 February 2023

Abstract

:
Atmospheric motion vectors (AMVs), known as cloud track winds, have positive impacts on global numerical weather forecasts (NWP). In this study, AMVs that were retrieved from Fengyun-2G and Fengyun-4A were compared in their data quality and impacts on the typhoon forecasts in order to investigate the differences between the first and second generation of the geostationary meteorological satellites of China. This report conducted data evaluation and assimilation-forecasting experiments on FY-2G and FY-4A atmospheric motion vectors (AMVs), respectively. The results showed that the AMVs data of FY-4A are of better quality than those of FY-2G and assimilating the AMVs of FY-2G and FY-4A have a neutral to slightly positive impacts on typhoon forecasts, which is quite encouraging for their operational use in the future.

1. Introduction

As early as the 1970s, China began to research and develop meteorological satellites. By the end of 2021, China has successfully launched 19 meteorological satellites in total, 7 of which are in orbit, including three polar-orbiting satellites and four geostationary satellites operationally. Fengyun-4A (known as FY-4A) is the first of China’s second-generation geostationary meteorological satellites, which was successfully launched from Xichang Satellite Launch Base on 11 December 2016. On 17 December, it was fixed in a geostationary orbit at 99.5° E over the equator. Since 25 May 2017, FY-4A drifted to the current position at 105° E for operational use and its data and products were officially delivered to the users globally from 25 September 2017.
Compared with its predecessor (Fengyun-2 series) and other internationally geostationary satellites, the Geostationary Interferometric Infrared Sounder (GIIRS) onboard FY-4A was the first infrared hyperspectral sounder in geostationary orbit for detecting atmospheric temperature, water vapor, gases, clouds, earth surface radiations and so on. The advanced Geostationary Radiation Imager (AGRI) with 15 channels provides multi-purpose imagery and wind derivation by tracking clouds and water vapor features. FY-4A is also the first meteorological satellite in the world to achieve comprehensive observation of geostationary orbit imaging and infrared hyperspectral atmospheric vertical detection [1].
As a new member of Fengyun satellite series, FY-4A has attracted great research interest globally. Zhang et al. [2] compared FY-4A with Japanese Himawari-8/9 satellites from four aspects of comprehensive detection, instrument observing ability, quantitative application, and data service, and found that the two satellites had their own advantages and disadvantages, respectively. Through the study of AGRI/FY-4A, Lu et al. [3] showed that the observing spectrum settings and spatio-temporal resolutions of the imagers are significantly improved compared with the first generation of Fengyun satellites. Hansen et al. [4] noticed that the newly added observation channel of AGRI provides a brand new observation support for monitoring atmospheric aerosol, dust/ash, cloud phase, and fire point.
Atmospheric motion vectors (AMVs) are one of the retrieved products of geostationary Fengyun satellite series. It is able to retrieve the horizontal wind vectors of the different height levels by tracking the features on the successive multiple satellite images mainly from the infrared and water vapor channels [5]. This retrieved product provides supplement data for the lack of wind measuring instruments, especially over the open ocean. Previously, meteorologists have studied the AMVs of Fengyun satellite series operationally and scientifically. Mecikalski et al. [6], Bedka et al. [7], and Mecikalski et al. [8] evaluated meso-scale atmospheric motion wind vectors (MAMVs) and proposed that MAMVs could be used to study the convective mechanism. Height assignment was noted as the dominant factor for the main AMVs uncertainty, as suggested by Velden et al. [9], when comparing the AMVs with the conventional wind profiles. Aiming to provide detailed uncertainty estimates for the assigned pressure, Salonen et al. [10] proposed that best-fit pressure statistics enable reliable information about the AMV uncertainties in the height assignment, which was an effective method independent of different data assimilation systems that were used by the Met Office and European Centre for Medium-Range Weather Forecasts (ECMWF). Liu et al. [11] used the Weather Research and Forecasting Model Data Assimilation (WRFDA) system to assimilate the AMVs data that were retrieved from FY-2C infrared and water vapor channels and showed that the reasonable selection of AMVs data added to the numerical weather prediction (NWP) model was beneficial to supply the meso-scale information that was not included in the initial fields, as well as improving the prediction ability of the model. In order to assess the qualities and assimilating impacts of the AMVs that were retrieved from the first generation of the Chinese Fengyun geostationary satellite, the AMVs data of FY-2G and Himawari-8 were evaluated by Liang et al. [12] in typhoon forecasts with the conclusions that both AMVs data showed comparably positive forecasting impacts even though the AMVs quality of Himawari-8 were better overall.
As a type of indirect satellite observation data product, the AMVs can be applied in the assimilation system in order to provide important wind information at different height levels, but few studies have used the AMVs of FY-4A in the NWP. Therefore, this paper will focus the assimilating and forecasting impacts of the AMVs of FY-4A. The AMVs dataset of Fengyun satellite series and the NWP model for research and methodology that were used in this study are described in the following section. Basic pre-processing before AMVs data assimilation and dataset assessment will be conducted in Section 3. In Section 4, we selected Typhoon In-Fa to study the assimilation and forecasting impacts of assimilating the AMVs data of FY-2G and FY-4A on typhoon prediction and this study concludes in Section 5.

2. Data and Methodology

2.1. WRFDA-3DVAR Assimilation System

The Weather Research and Forecasting Model (WRF) model and Weather Research and Forecasting Model Data Assimilation (WRFDA) systems [13] (Version 3.9.1) (https://ncar.ucar.edu/what-we-offer/models/weather-research-and-forecasting-model-wrf, accessed on 30 January 2023) were applied for this study by using the 3DVAR component, which can assimilate most of the conventional observation data and part of the non-conventional observation data [13,14,15]. To obtain a statistically optimal analysis, an iterative minimization of a prescribed cost function is described by:
J(x) = 1/2[(x − xb)TB−1(x − xb) + (y − H[x])TR−1(y − H[x])]
where x represents the atmospheric state vector, xb represents the background state, H represents the nonlinear observation operator which maps the model variables to the observation space, and y represents the observation vector. B and R represent the background and observation error covariance matrices, respectively.

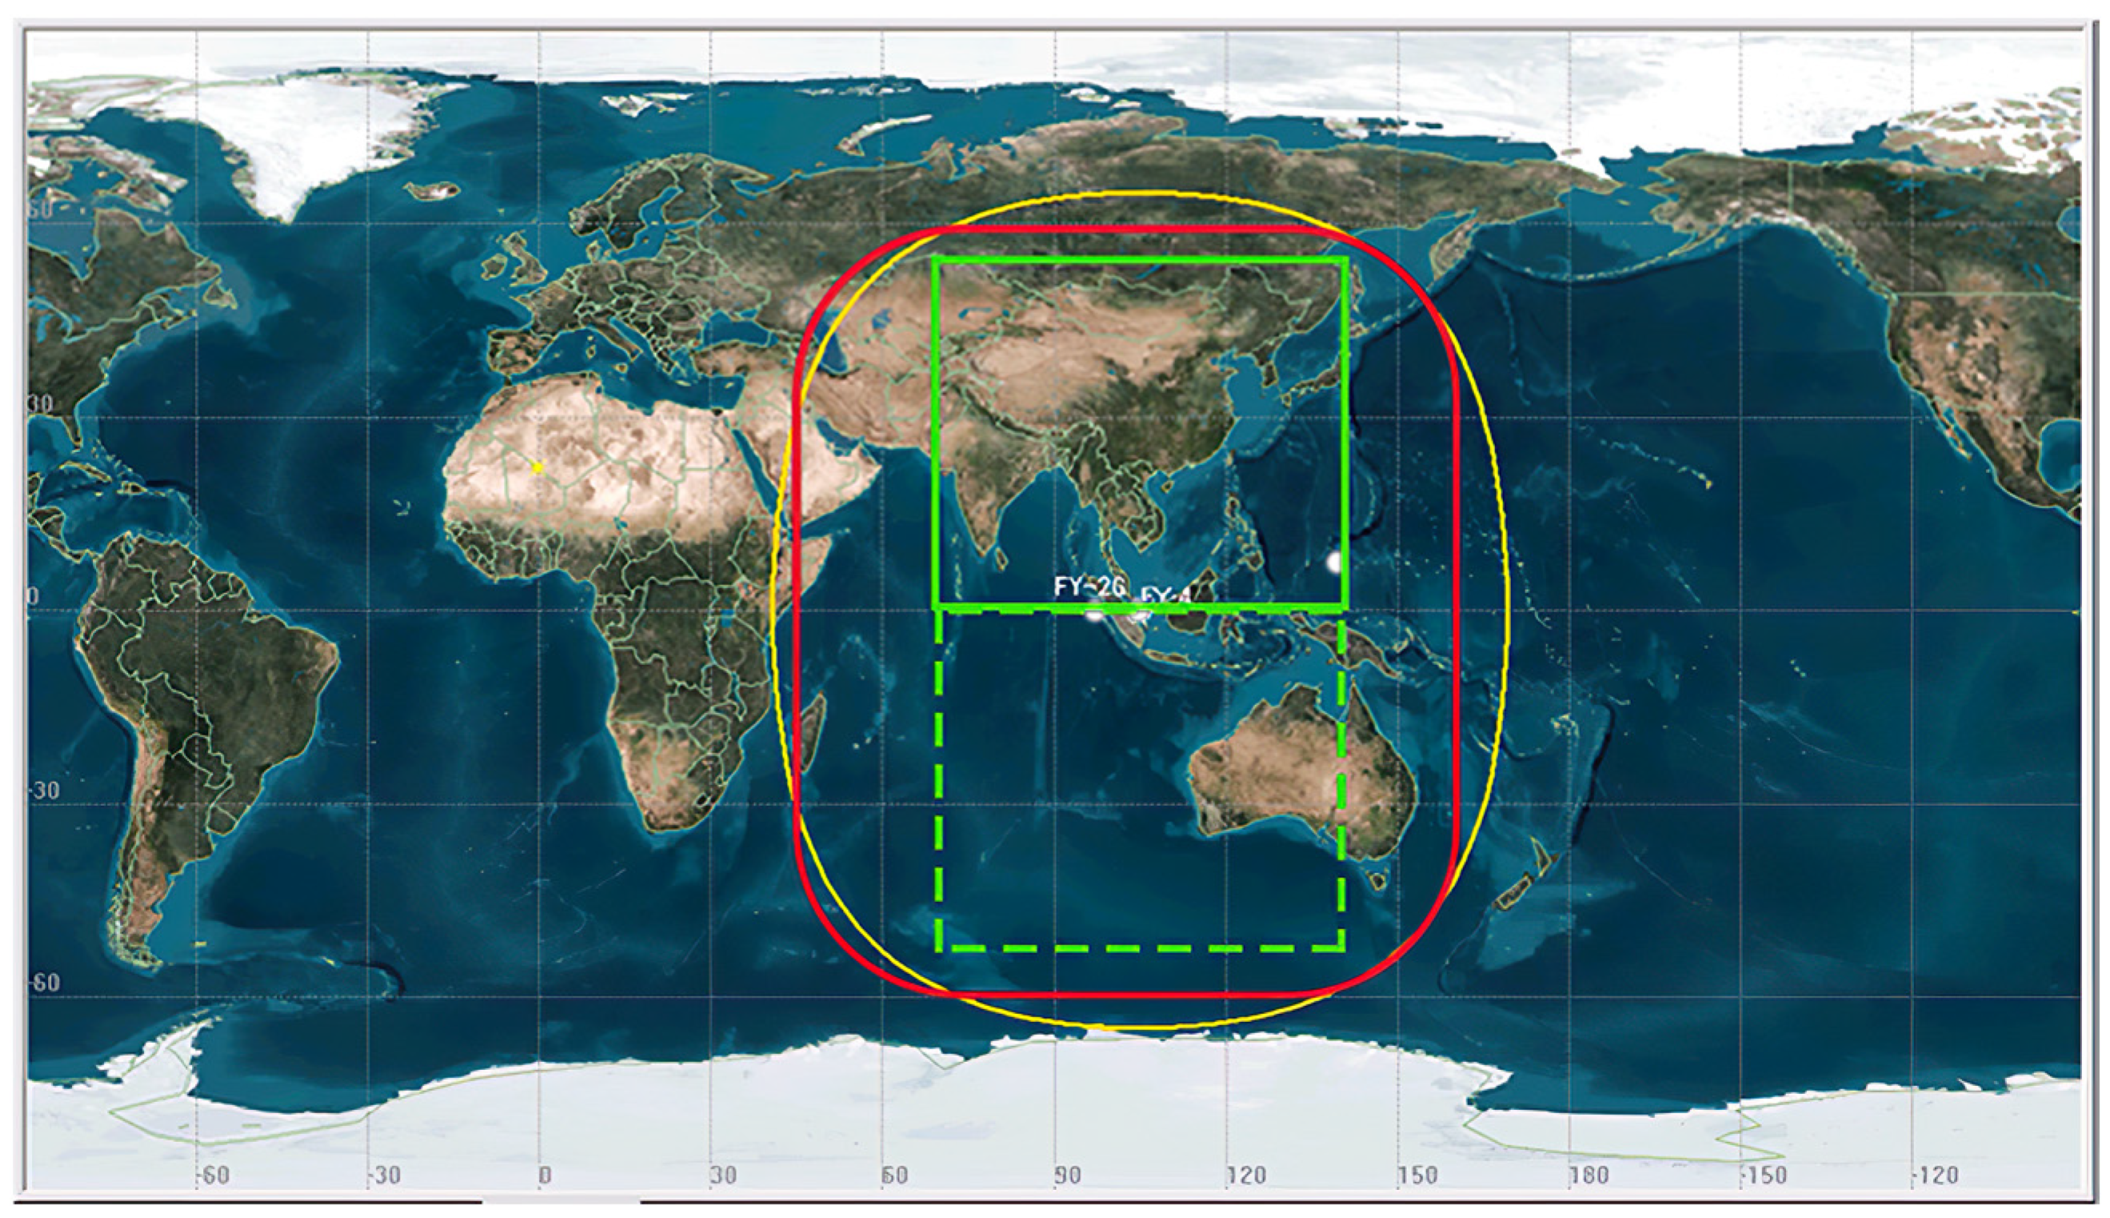
2.2. AMVs Datasets from Fengyun Satellite Series

The AMVs data of FY-2G and FY-4A, both retrieved from infrared and water vapor channels provided by The National Satellite Meteorological Center of China (NSMC), were studied in this report with the aim to compare the assimilating impacts from the first and second generation of geostationary satellites on typhoon prediction. The AMVs data of FY-2G were retrieved from images of one infrared channel (10.3–11.3 μm) and one water vapor channel (6.3–7.6 μm) with a time resolution of 6h (0000 UTC, 0600 UTC, 1200 UTC, 1800 UTC) and a horizontal resolution of 110 KM; while the AMVs of FY-4A were retrieved from images of one infrared channel (10.3–11.3 μm) and two vapor channels (6.9–7.3 μm, 5.8–6.7 μm) with a higher time resolution of 3h (0000 UTC, 0300 UTC, 0600 UTC, 0900 UTC, 1200 UTC, 1500 UTC, 1800 UTC, 2100 UTC) and the horizontal resolution of 64 km. All the retrieved AMVs were divided into three layers: 100–400 hPa for high-level, 400–700 hPa for middle level, and 700–950 hPa for lower levels and each AMVs data contained latitude, longitude, height, U component, V component, wind speed, wind direction, and quality mark QI with a value range from 0 to 100. Basically, the larger QI value is, the smaller error of the wind vector will be and the AMVs with a QI larger than 80 are considered to be of good quality. The parameters of the two satellites are listed in Table 1 and the observing regions of the two satellites are shown in Figure 1. The red circle and the yellow one indicate the observation area of FY-2G and FY-4A, respectively, and the green rectangle domain is the overlapped observing area of the two satellites, as well as the studied regions in this report.

2.3. Reanalysis Data

The final (FNL) operational global analysis data that were provided by the National Center for Environmental Prediction (NCEP) were used to initialize the WRF model and update the lateral boundaries in this study and have a temporal resolution of 6h (0000 UTC, 0600 UTC, 1200 UTC, 1800 UTC), a spatial resolution of 0.25° × 0.25°, and 26 vertical levels from 1000 hPa to 10 hPa. This product is from the Global Data Assimilation System (GDAS), which continuously collects observational data from the Global Telecommunications System (GTS), and other sources (see more details at https://rda.ucar.edu/datasets/ds083.2/, accessed on 30 January 2023). Parameters in the analyses included surface pressure, sea level pressure, geopotential height, temperature, sea surface temperature, soil values, ice cover, relative humidity, U- and V- winds, vertical motion, vorticity and ozone, and no AMVs information of Fengyun geostationary satellite series was included (https://www.emc.ncep.noaa.gov/gmb/STATS/html/model_changes.html, accessed on 30 January 2023).
The ERA5 (1950-present) global reanalysis data from the European Centre for Medium-Range Weather Forecasts (ECMWF) are used as independent reference data for verifying the AMVs data quality of the two Fengyun geostationary satellites. The selected time resolution for this study was 6h (0000 UTC, 0600 UTC, 1200 UTC, 1800 UTC), spatial resolution is 0.25° × 0.25°, and vertical levels from 1000 hPa to 1 hPa as mentioned above (https://confluence.ecmwf.int/pages/viewpage.action?pageId=74764925, accessed on 30 January 2023).

2.4. Typhoon Track and Intensity Data

The best track data of typhoons provided by the China Meteorological Administration Tropical Cyclone Database (“CMA best track” is used thereafter for simplicity) with 6-h intervals used to evaluate the prediction results of the track and intensity of the typhoons.

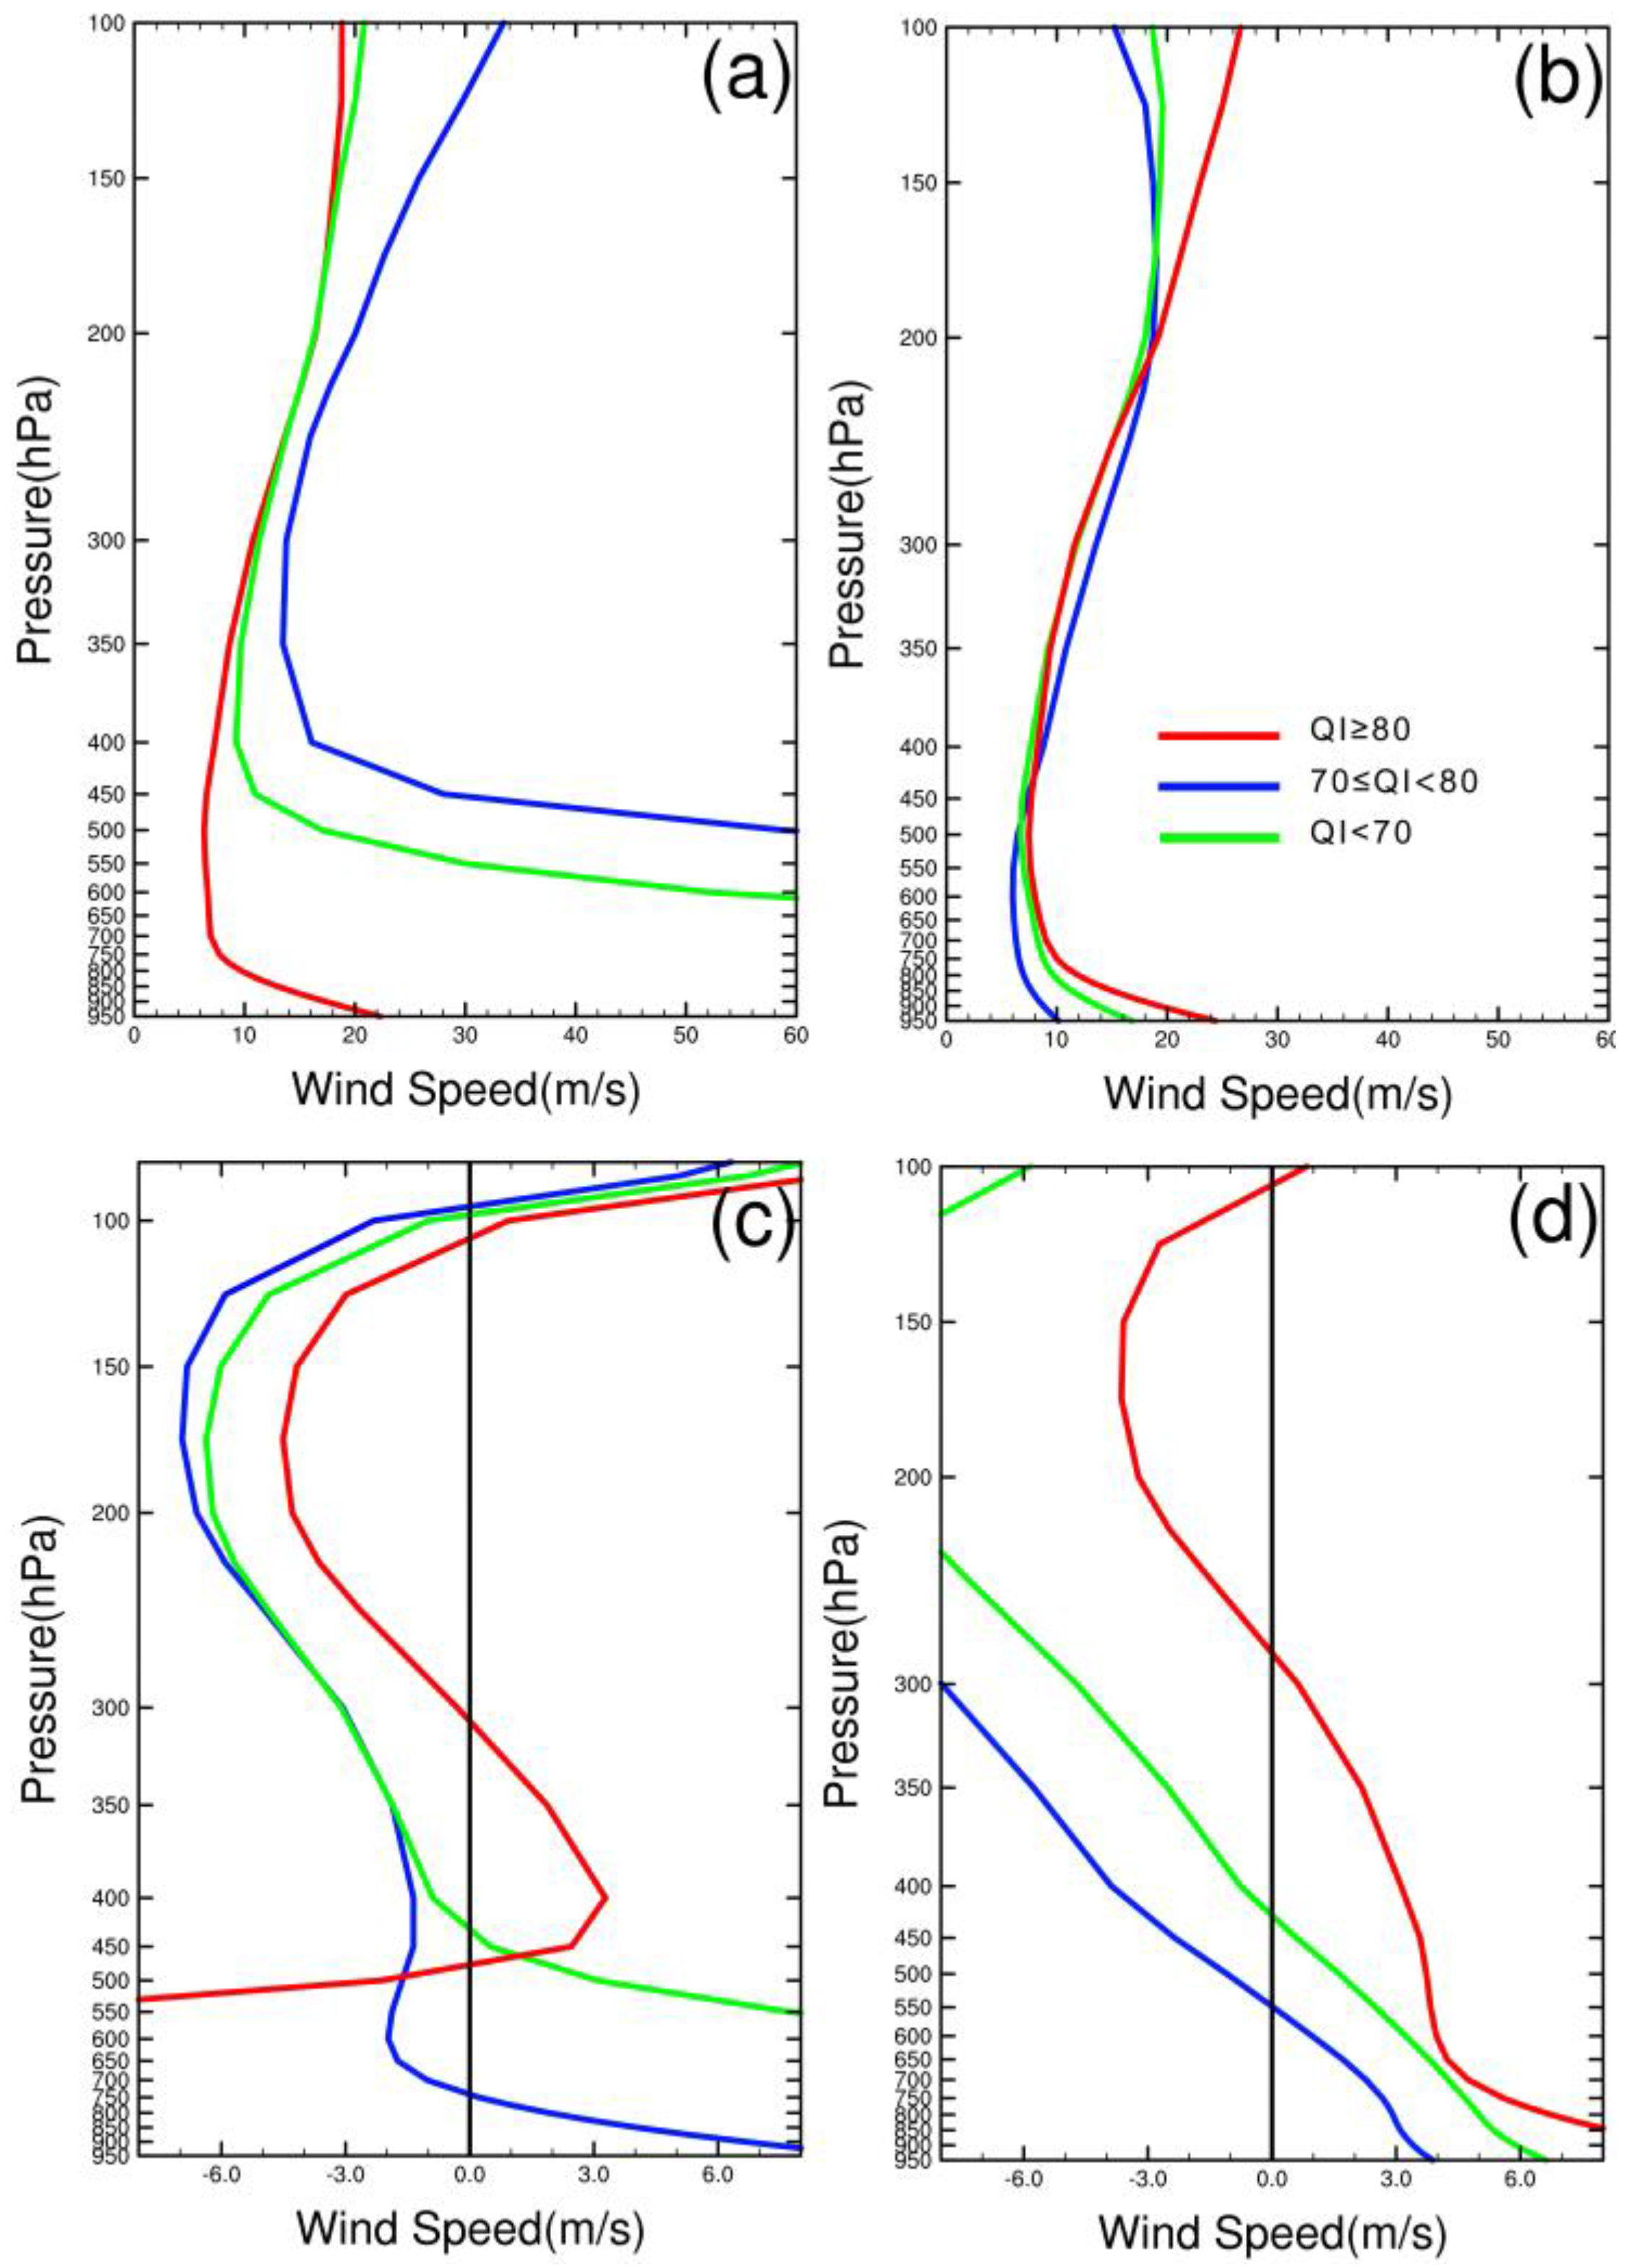
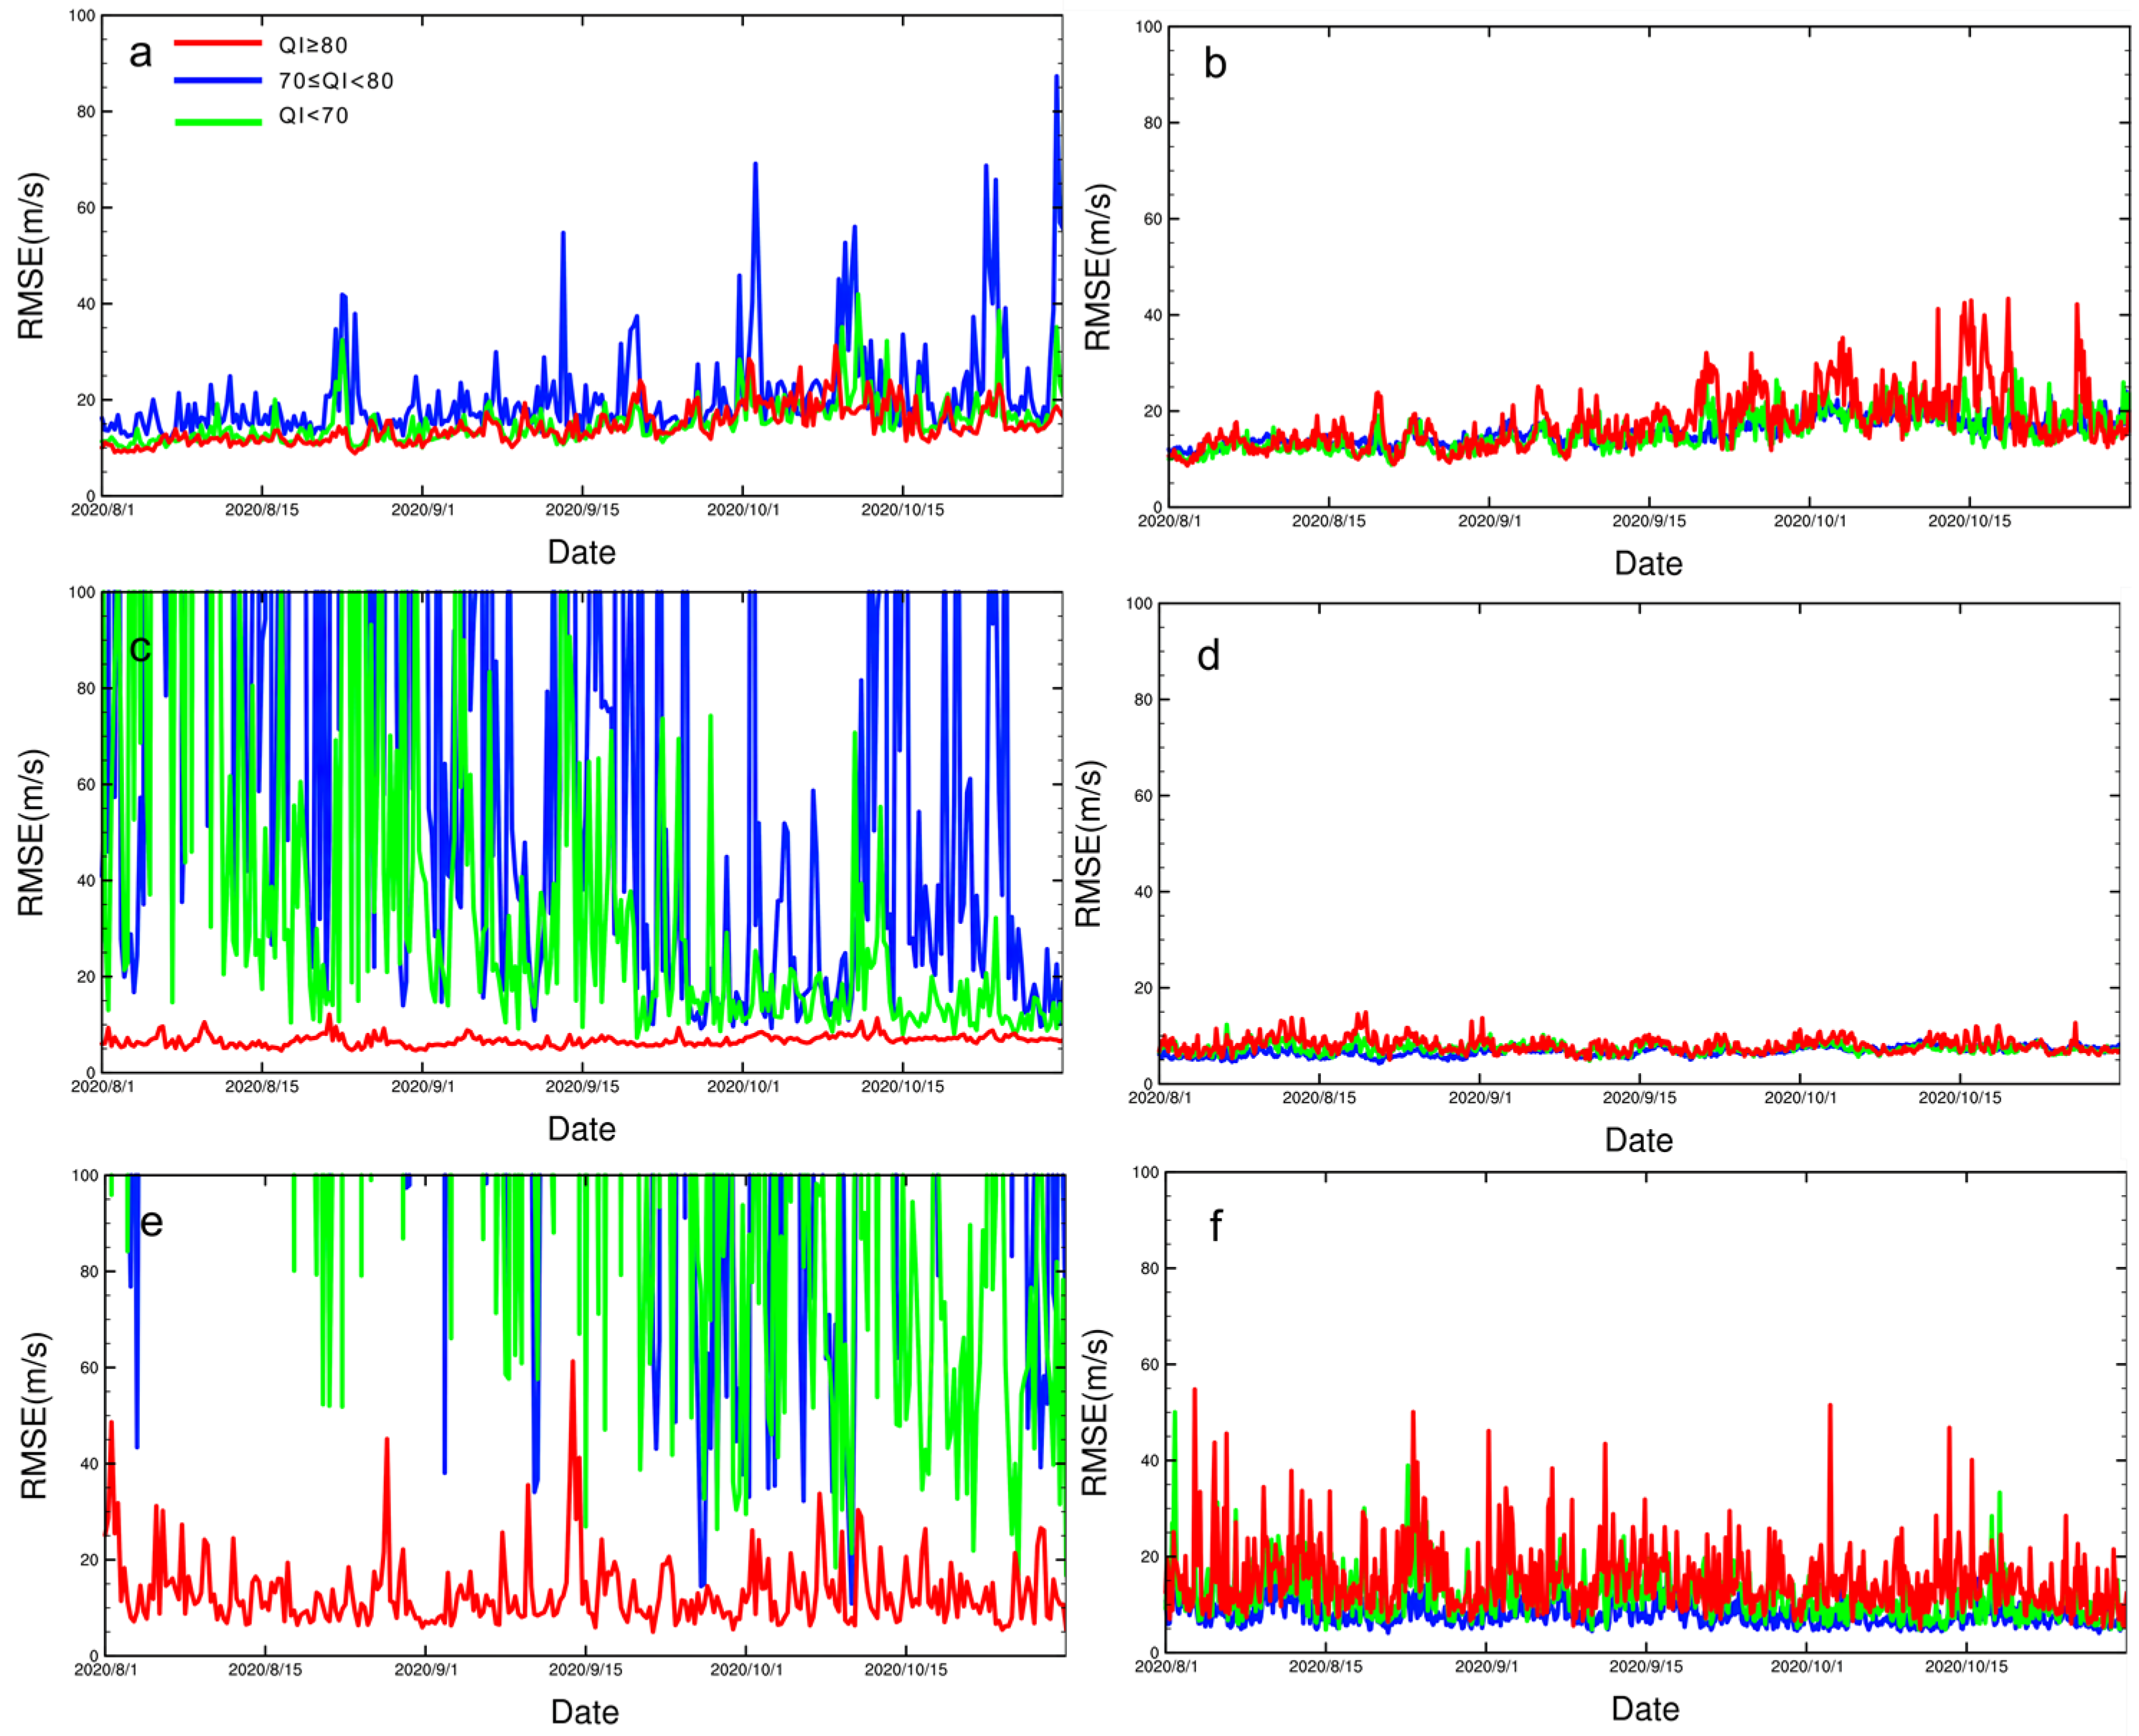
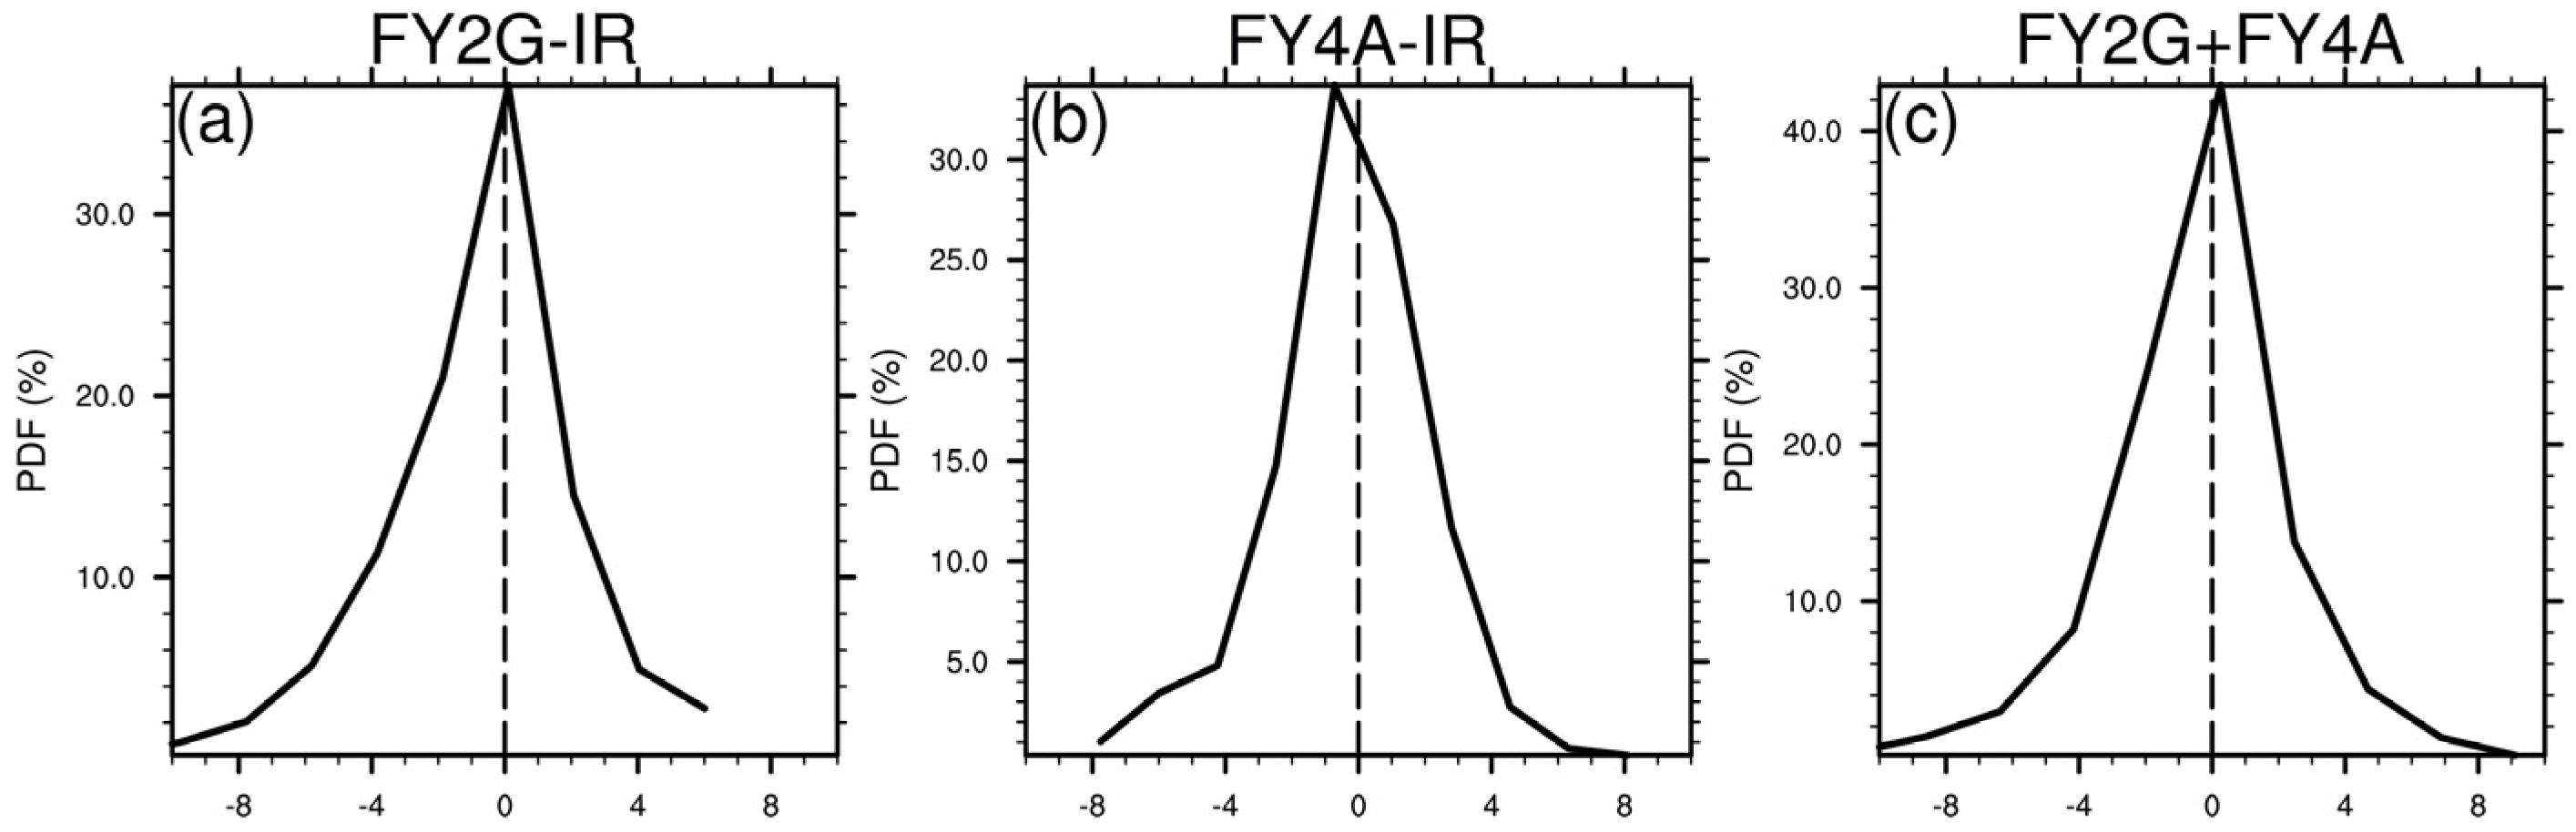
3. The Assessment of the AMVs Data

Similar to previous studies (Liang et al., 2021), the AMVs data that were retrieved from both Fengyun geostationary satellites have the largest number at the upper level (100–400 hPa), as well as the AMVs with QI > 80 from both satellites, regardless of the retrieving channels (figures not shown). The wind speed bias and root mean square error (RMSE) distribution of the AMVs data from the two satellites (using the AMVs retrieved from the infrared channels as an example) in the studied green rectangle area of Figure 1 are displayed in Figure 2, referring to the ERA5 global reanalysis data. In order to avoid the seasonal differences of the northern and southern hemisphere, the wind speed bias and RMSE of the two satellites are compared within the same hemisphere, respectively.
Apparently, the FY-2G AMVs data with QI > 80 have dominantly better quality by showing smaller and more stable RMSE vertically than those with smaller QI (Figure 2a), while FY-4A AMVs data with different QI are generally comparable from the lower levels to the upper ones (Figure 2b). Though the RMSE of FY-4A AMVs data with lower QI values are slightly smaller than those with QI > 80 above 200 hPa and below 475 hPa, the biases of the former above 400 hPa are much smaller than the latter (Figure 2d). The biases of FY-4A AMVs data with QI > 80 are also smaller than those of FY-2G from 400 hPa to 100 hPa. Similar results were found for the AMVs data that were retrieved from the water vapor channels of the two geostationary satellites and for the studied southern hemisphere area. This indicates that the overall quality of the AMVs data from FY-4A as the second generation meteorological satellite of China is improved from the first generation satellite FY-2G.
The RMSE time series of the AMVs data that were retrieved from the infrared channels of the two satellites at different height levels from 1 August 2020 to 31 October 2020 are described in Figure 3. Similar to the previous results, the RMSE and its variations with time of the AMVs data from FY-4A at different levels are quite comparable regardless of their QI values. Compared to those from FY-2G, the RMSE values of FY-4A AMVs data are much smaller with a smaller time variation. For FY-2G AMVs data, only those with QI > 80 show reliable data quality. This further demonstrates that the AMVs data of FY-4A have better and more reliable quality than those of the first generation of Fengyun geostationary satellites.
Considering the AMVs data characteristics, a series of data preprocessing, including height assignment, quality control, background check, observation error assignment, channel merging, and thinning, are conducted referring to Liang et al. [12]. The QC schemes that were applied in this study are as follows:
  • AMVs from infrared channels above 100 hPa and below 900 hPa were excluded;
  • AMVs from water vapor channels above 100 hPa and below 550 hPa were excluded;
  • AMVs with full wind speed <5 m/s and full wind speed >55 m/s were excluded;
  • AMVs outside the assimilation window were excluded;
  • AMVs with QI < 80 were excluded.
The WRFDA-3DVAR assimilation system that was applied in this paper requires that the assimilated AMVs data are unbiased (Gaussian distribution). Figure 4 shows the probability density distribution (PDF) of the first guess departures (O-B) of the AMVs data that were retrieved from the infrared channels of FY-2G and FY-4A after data preprocessing at 12:00 UTC on 22 July 2020 (similar results for water vapor channels not shown). Undoubtedly, the PDF of FY-4A is more unbiased with a much narrower normal shape than that of FY-2G and also the first guess departures of the combined AMVs data of the two satellites meet the unbiased requirements of the 3DVAR method, which ensures that the assimilating experiments can be carried out.

4. AMVs Data Assimilation Experiments Studies

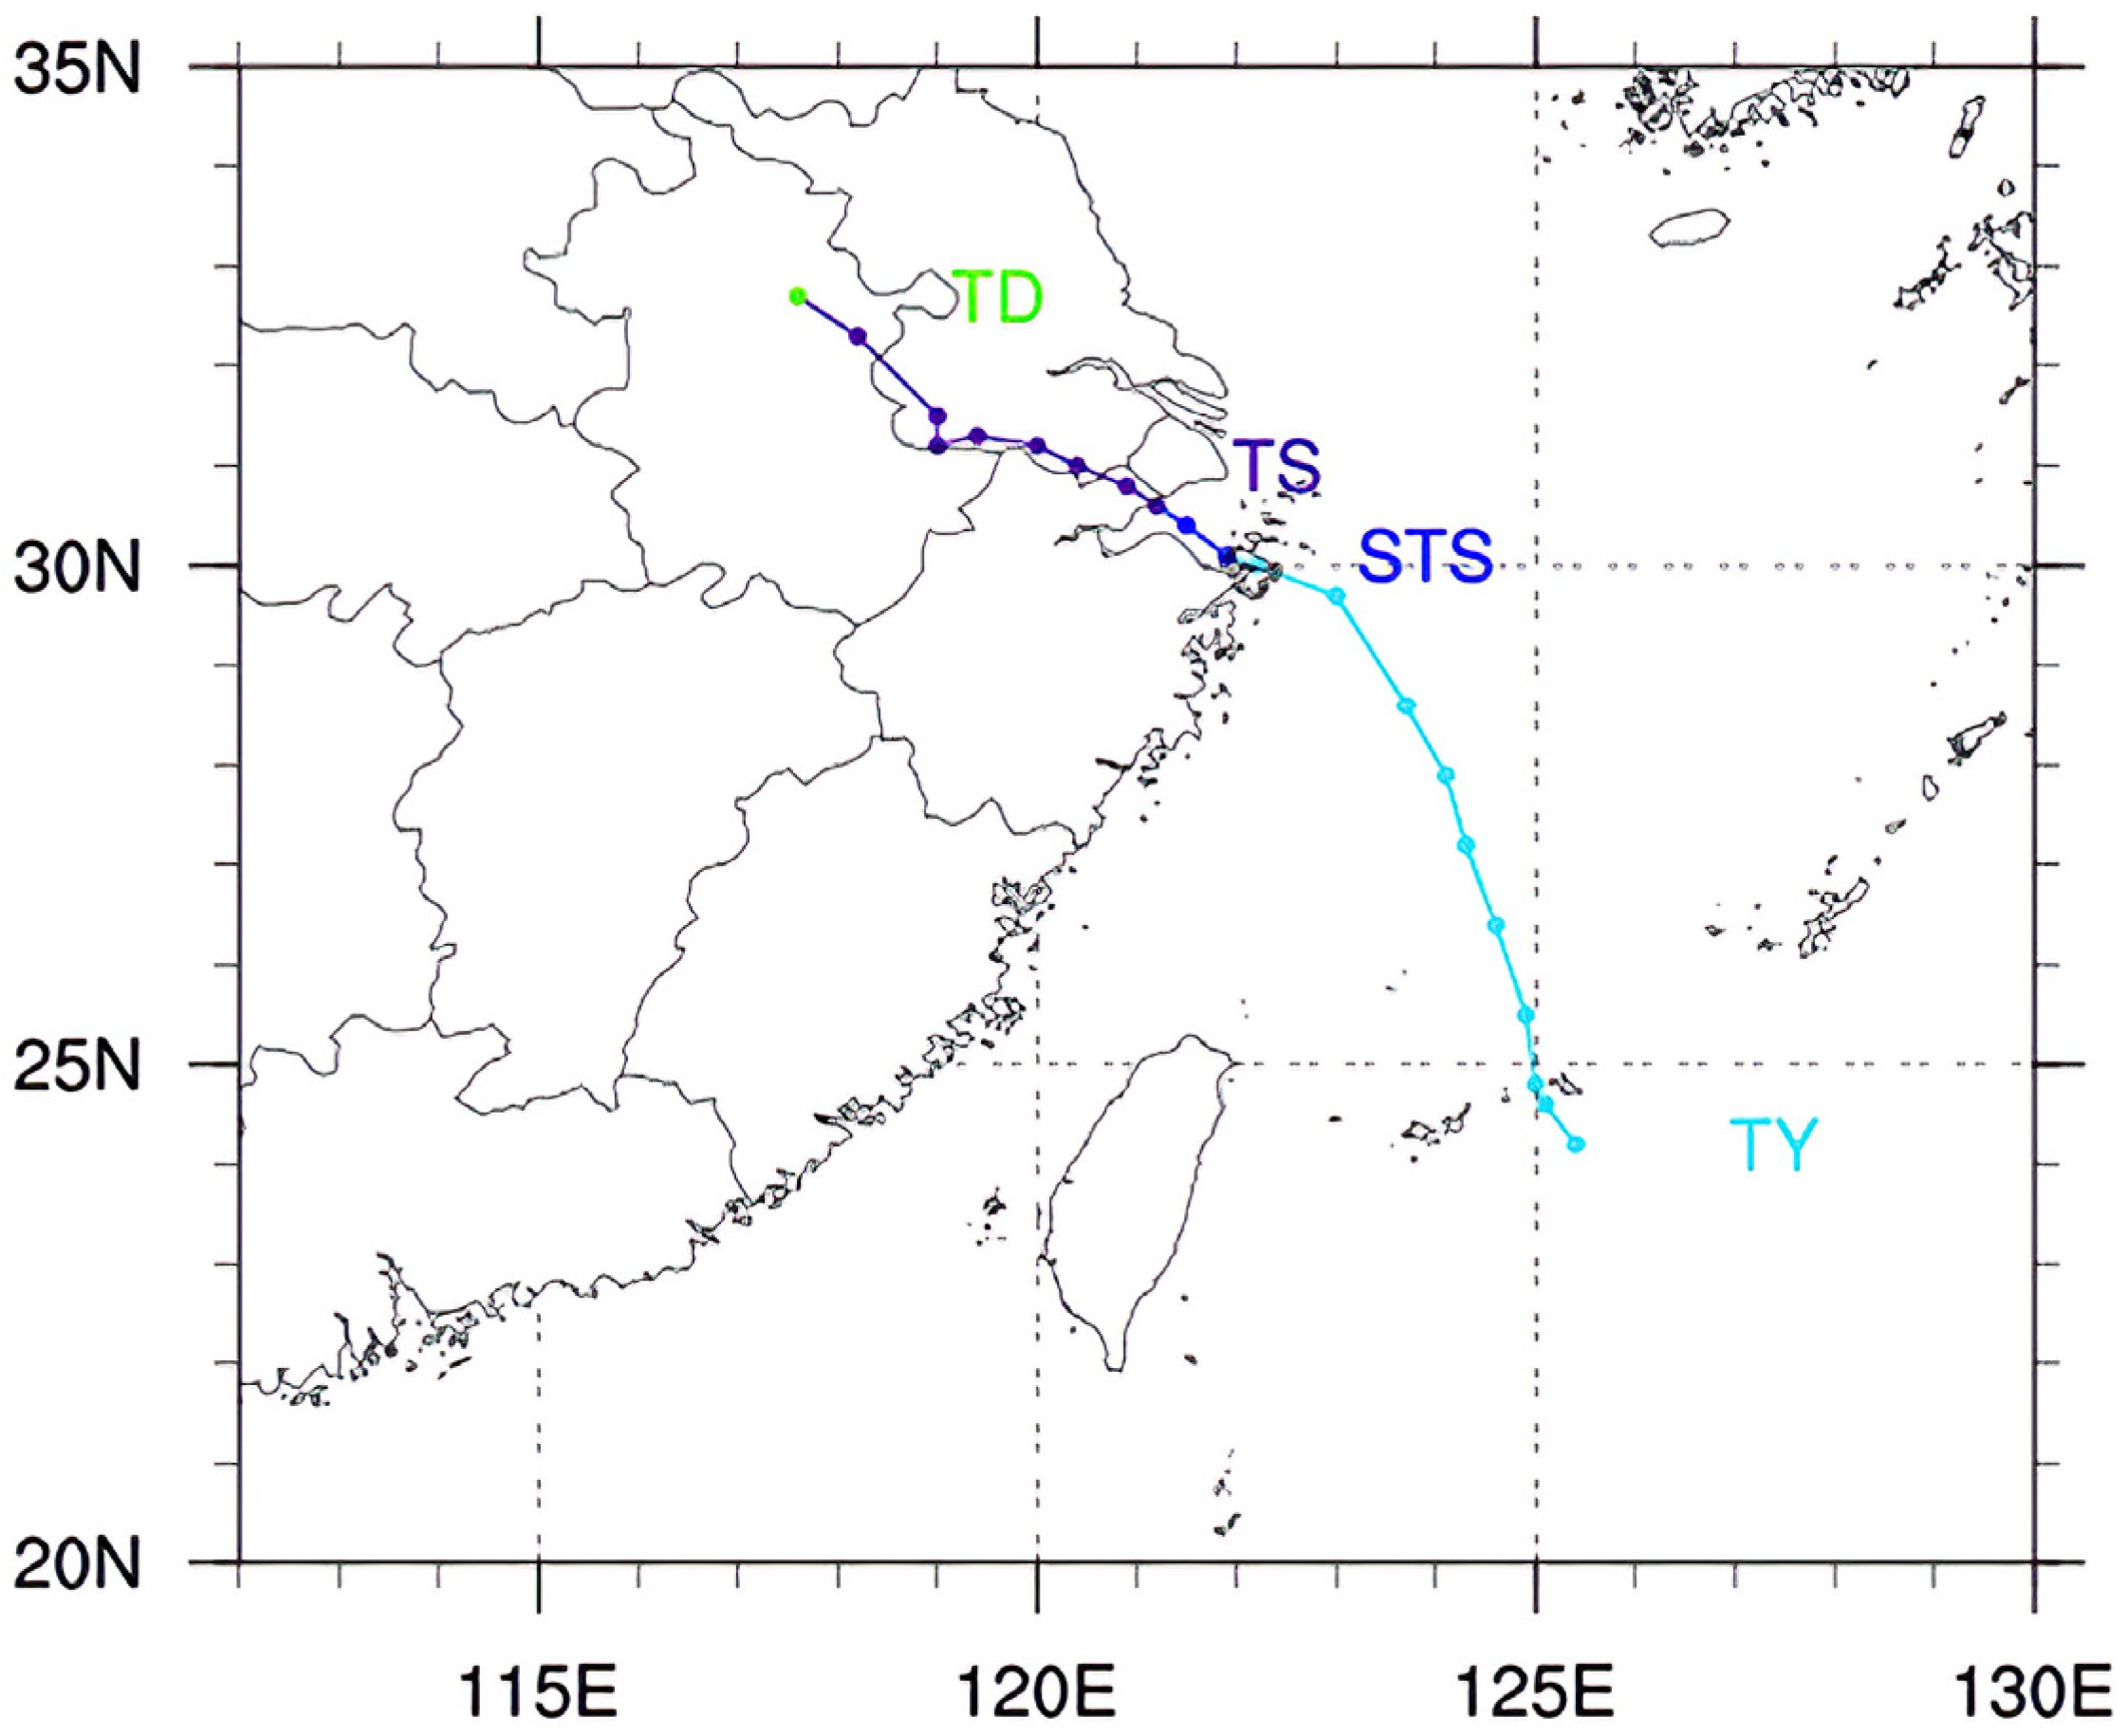
4.1. Overview of Severe Typhoon In-Fa

Typhoon In-Fa, the sixth typhoon forming in the western Pacific Ocean in 2021 had a predominantly northwestward path (Figure 5), which was selected to study the assimilating and forecasting impacts of AMVs from the two Fengyun geostationary satellites. At 0200 UTC on 18 July, the Central Meteorological Agency (CMA) upgraded it to a tropical storm based on the observations and then upgraded it to a strong typhoon at 1100 UTC on 21 July. Typhoon In-Fa made its landfall on the coastal of Zhejiang Province at 1200 UTC on 25 July, and made landfall again on the coastal area of Pinghu county, Zhejiang Province at 0900 UTC on 26 July. In-Fa weakened in Anhui province on 28 July and then gradually moved northwestward. The main characteristics of Typhoon “In-Fa” include slow moving speed, long retention time over land, and large cumulative rainfall. A total of 4.82 million people in Zhejiang, Shanghai, and Jiangsu provinces were affected by Typhoon In-Fa, with a direct economic loss of 13.2 billion RMB.

4.2. Experimental Settings

To compare the assimilating and forecasting impacts of the retrieved AMVs data from different channels of the two Fengyun geostationary satellites on the forecasts of Severe Typhoon In-Fa, 9 experiments are set up, including one control experiment and eight cycling assimilation experiments assimilating the AMVs data that were retrieved from infrared and water vapor imaging channels of FY-2G and FY-4A, respectively (Table 2). FY2G-IR, FY2G-IR+WV and FY2G+FY4A were used to illustrate the assimilating experiment settings. FY2G-IR indicates that the AMVs data that were retrieved from the infrared images of FY-2G satellite were assimilated in the cycling experiment, while the AMVs data that were retrieved from the infrared and water vapor images of FY-2G were assimilated in the FY2G-IR+WV experiment and all the AMVs data from both FY-2G and FY-4A satellites were assimilated in FY2G+FY4A experiment regardless the retrieved channels.
The model integration time is from 0000 UTC on 22 July 2021, after the tropical storm was strengthened to Typhoon In-Fa, to 0000 UTC on 28 July 2021, after its landfall and weakening, for the all nine experiments, with the model configuration including 300 × 300 grids centering at (28° N, 120° E), the horizontal resolution of 15km, the time step 60 s, the 40 eta layers in the vertical direction and the model top at 10 hPa.
The cycling analysis-forecast experiments starting from 1200 UTC on 22 July 2021 with the AMVs data assimilated every 12h were carried out with different settings. Except for the first 12 h for the spin-up time, nine DA cycles were performed in total with a 6h assimilating window. The National Meteorological Center Method (NMC; Parrish & Derber, 1992) was applied to assign the background error covariance by calculating the forecast differences between the 24-h and 12-h forecasts. The background for the first analysis was the forecast initiated from the FNL analysis at 1200UTC on 22 July 2021 and the backgrounds for the following cycles are the 12 h model forecasts initialized from the previous analyses of the last cycles. In addition, Table 3 lists the physical parameterization schemes that were adopted in all nine assimilating experiments.

4.3. Forecasting Impacts on Typhoon In-Fa

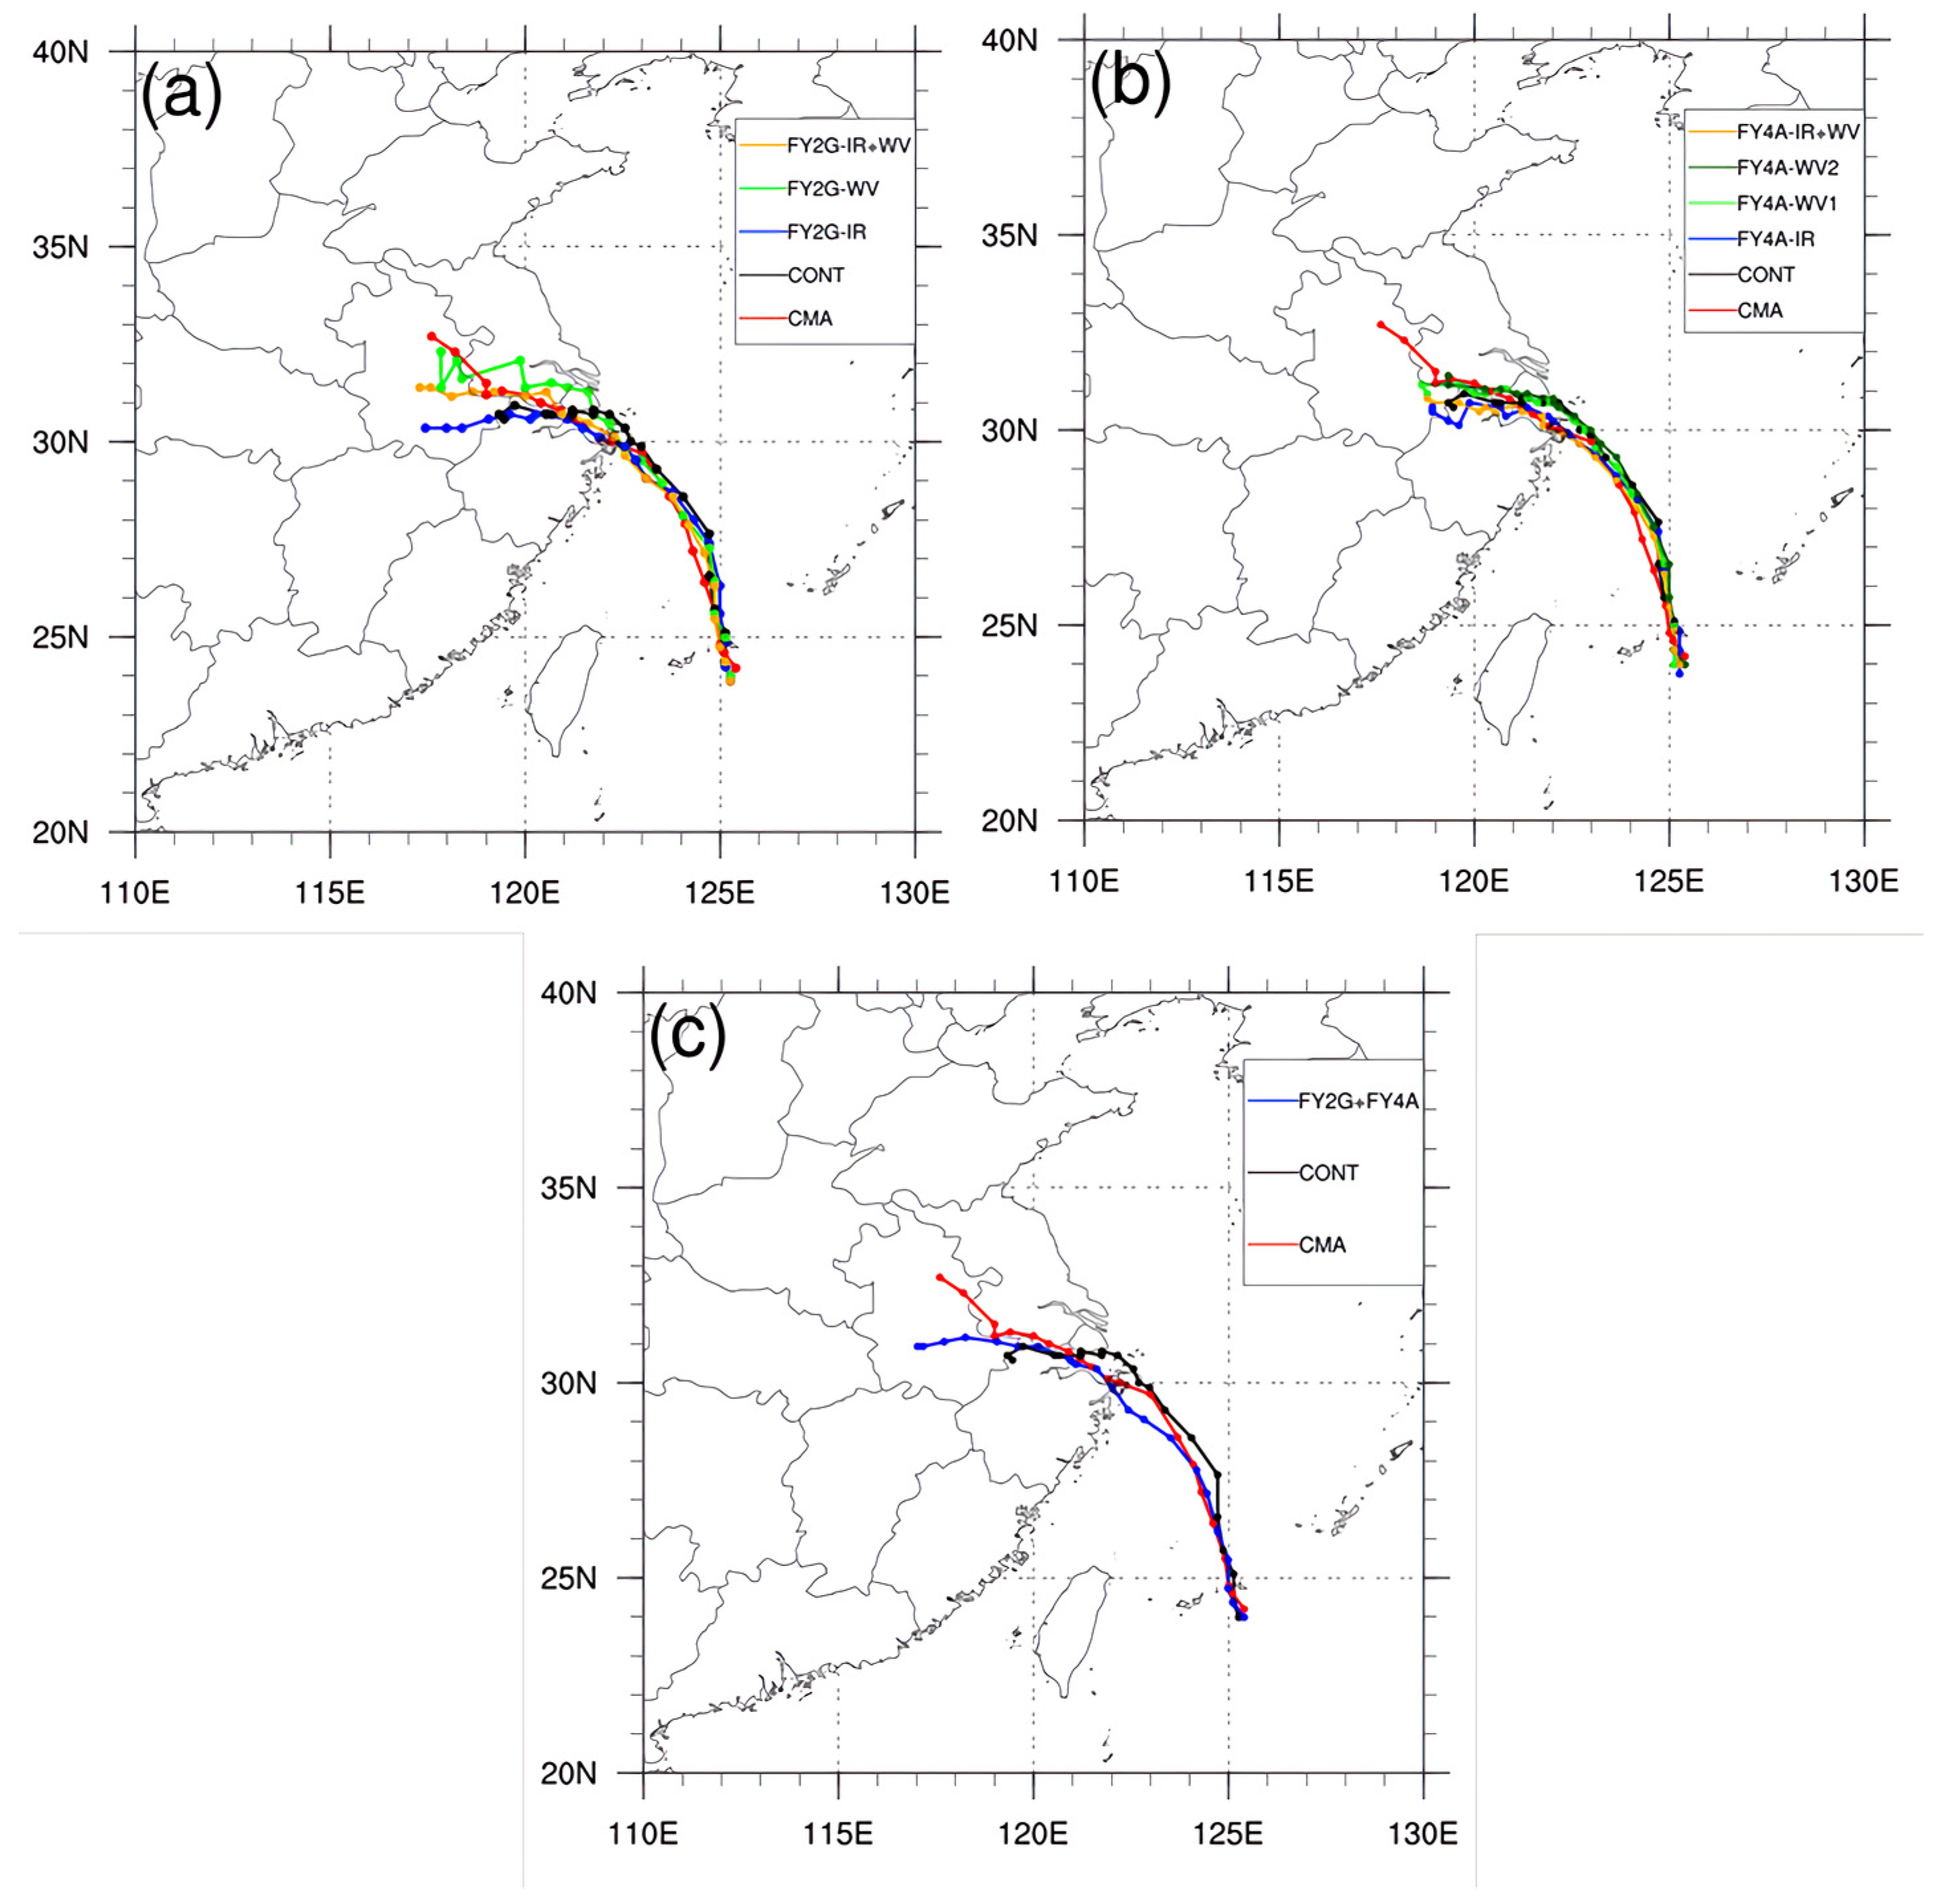
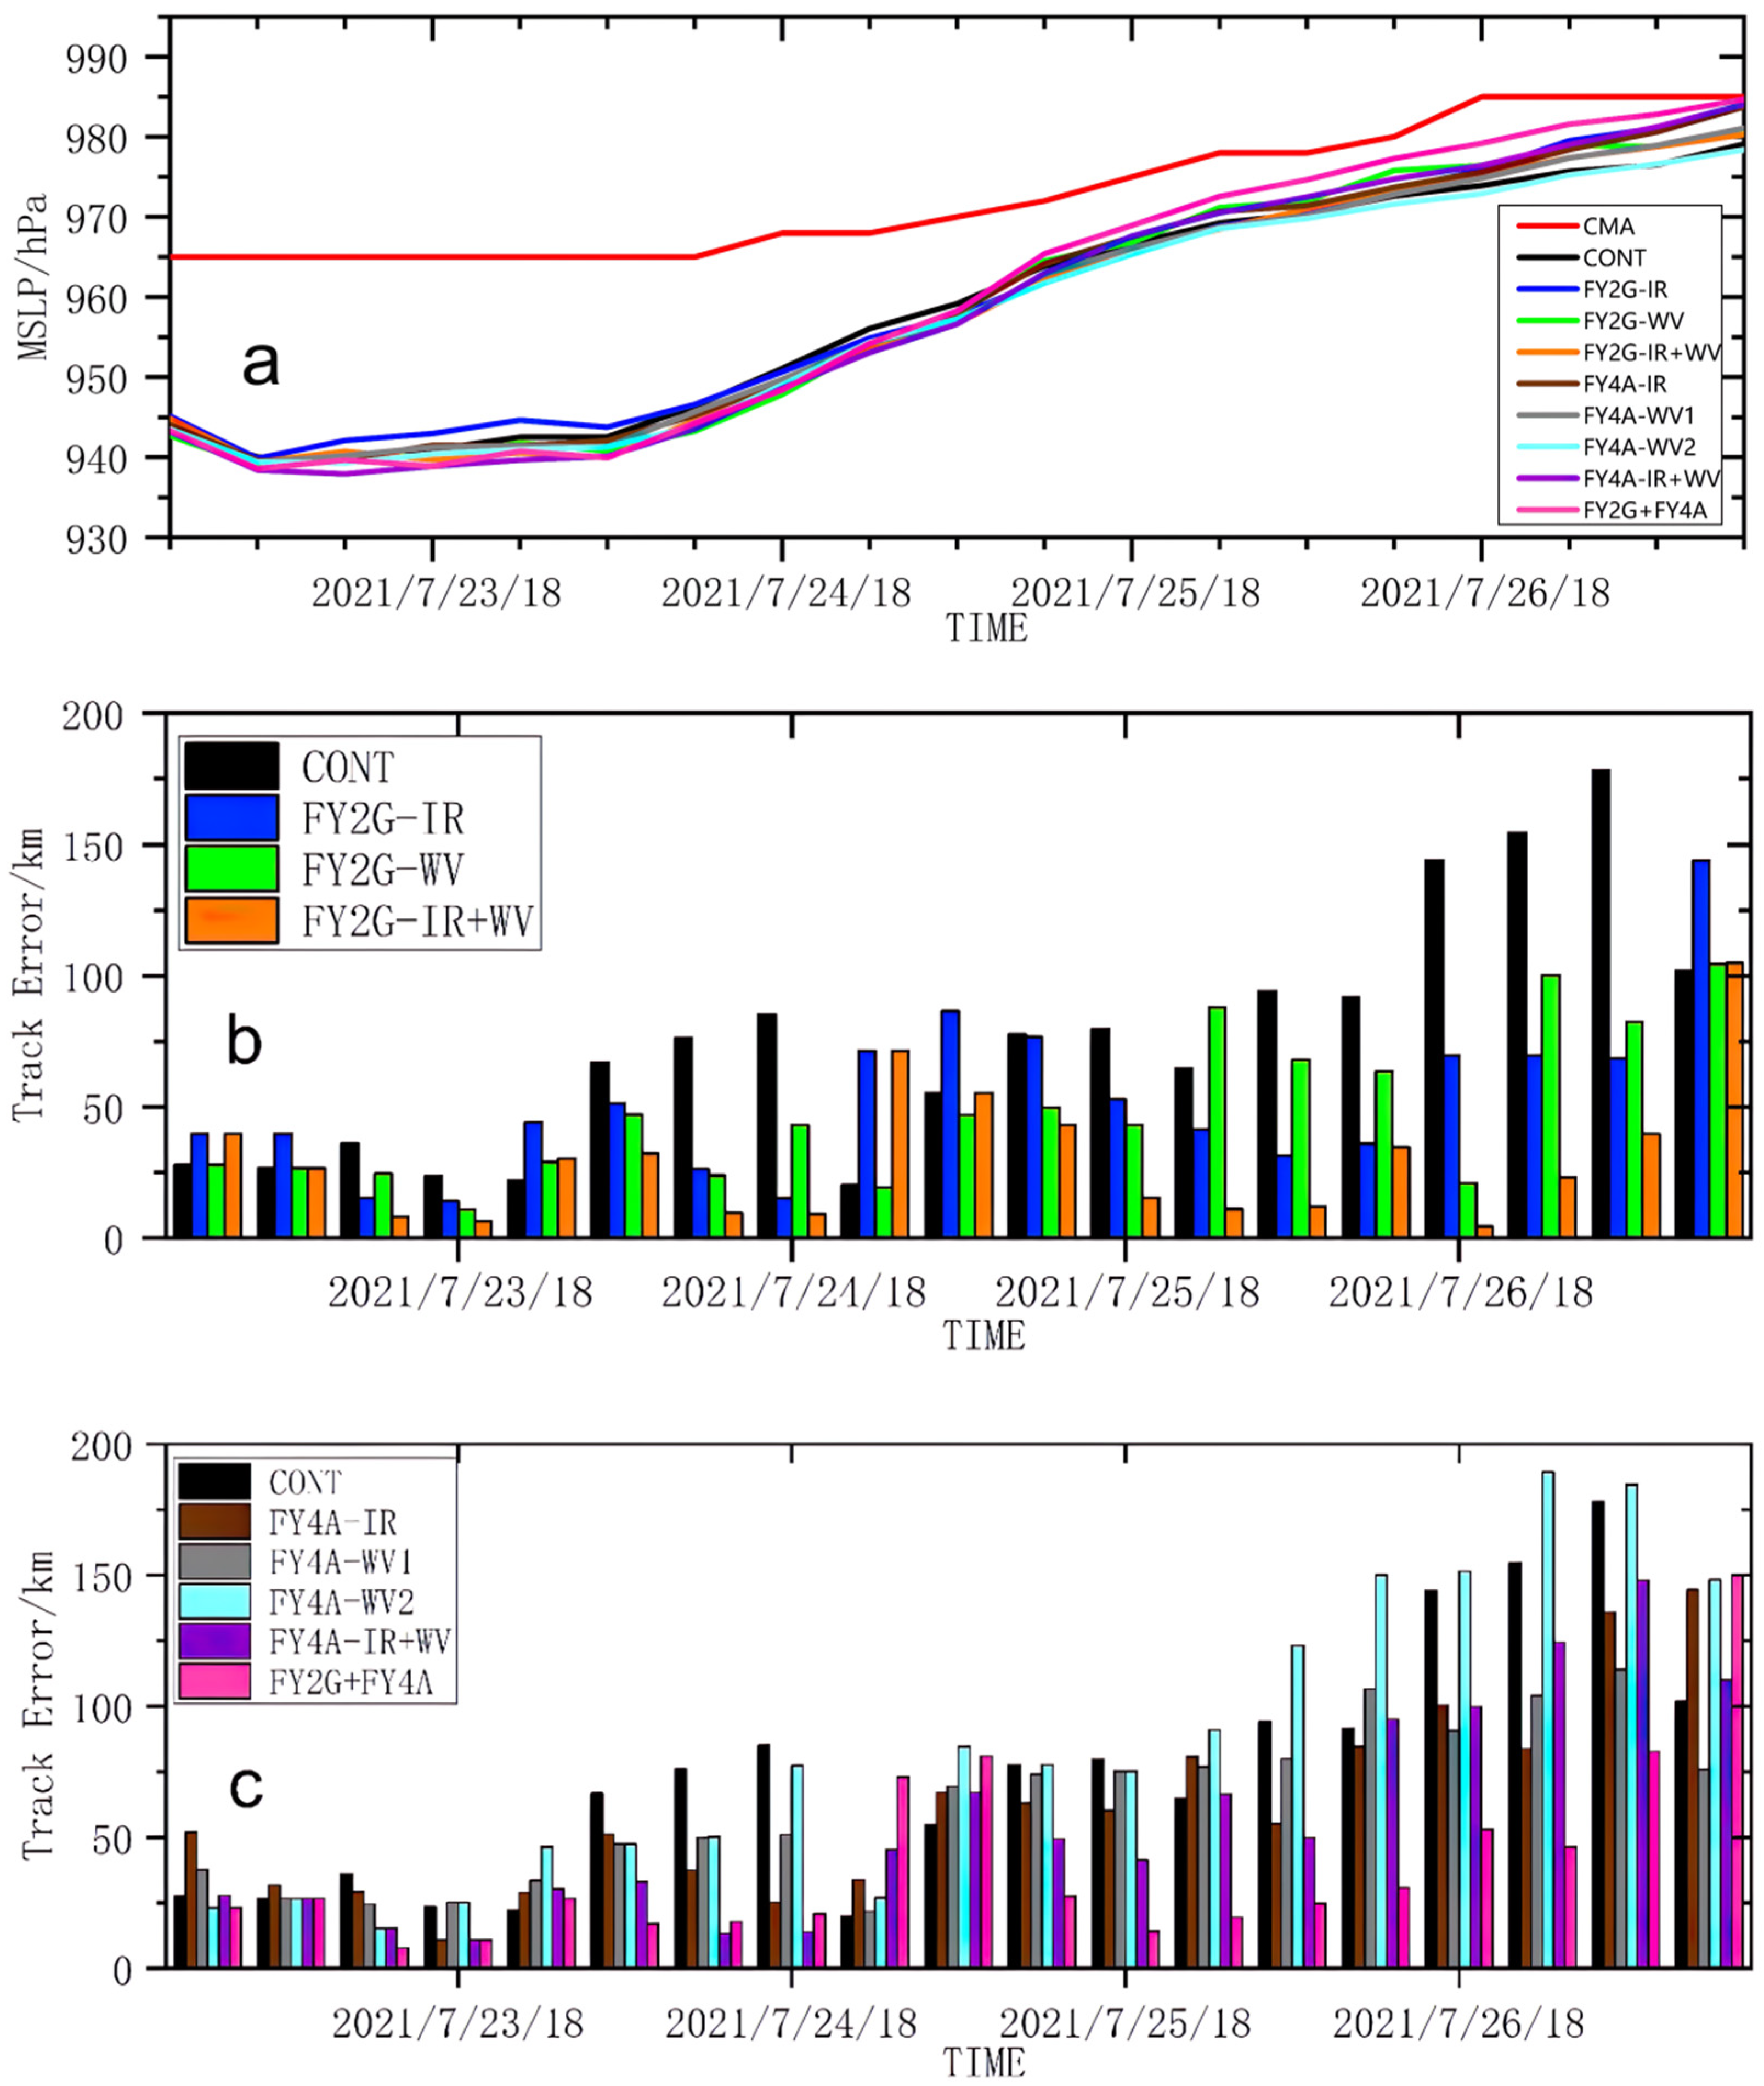
4.3.1. Impacts on the Typhoon Track and Intensity Forecasts

Figure 6 displays the forecasting tracks of Typhoon In-Fa in all nine experiments verified by the CMA best track data since In-Fa made its landfall in East China. Basically, the results of the eight cycling assimilation experiments are slightly better compared to the control run by showing tracks closer to the CMA data (Figure 6a,b). Before the landfall, those eight forecasting tracks in the assimilation runs are quite comparable and track differences are clearer after the landfall which might be due to the impacts of the surfaces. Undoubtedly, the forecasting typhoon paths in FY2G-IR+WV and FY4A-IR+WV perform the best in their group and experiment FY2G+FY4A shows the best typhoon track overall with the most AMVs assimilated for the best fitting in this study. Comparing Figure 6a,b, the forecasted typhoon moving speeds in FY-4A assimilating experiments (Figure 6b) are slower than those in FY-2G assimilating experiments (Figure 6a) after the typhoon makes landfall. From the perspective of typhoon track forecasts, assimilating the AMVs of FY-2G and FY-4A can significantly improve the deviation of typhoon track simulation than the control experiment, effectively improve the typhoon path, and make the forecast path closer to the real situation of the typhoon movement, but the slower moving speeds in the assimilating experiments which contain FY-4A AMVs need to be further investigated to know the reason.
At present, forecasts of typhoon intensity are still a difficult problem for operational centers. As shown in Figure 7a, the control and the assimilation experiments have similar intensity variation trends of Typhoon In-Fa by overestimating the typhoon intensity at the early stage and approaching to the best track provided by the China Meteorological Agency (CMA) since 1800 UTC on 24 July 2021. From the perspective of typhoon intensity forecasts, assimilating the AMVs of FY-2G and FY-4A have neutral impacts.
In order to accurately compare the differences of typhoon track forecasts between all the experiments, Figure 7b,c show the track error (unit: km) of each experiment. Assimilating the AMVs from the merged channels (i.e., FY2G-IR+WV, FY4A-IR+WV, FY2G+FY4A) does indicate some benefits by showing generally smaller track errors, which also grow more slowly, than CONT, especially from 1800 UTC on July 25. Interestingly, 1800 UTC on July 25 is essentially a pitch point, before which the variations of the track errors in the eight cycled assimilating experiments are quite comparable regardless of the satellites and channels. While afterwards, the experiments with FY-2G AMVs assimilated data achieve better results than those with FY-4A AMVs, which may be because the forecasted typhoon moving speeds in FY-4A assimilating experiments are slower than those in FY-2G runs after the simulated landfall of typhoon.

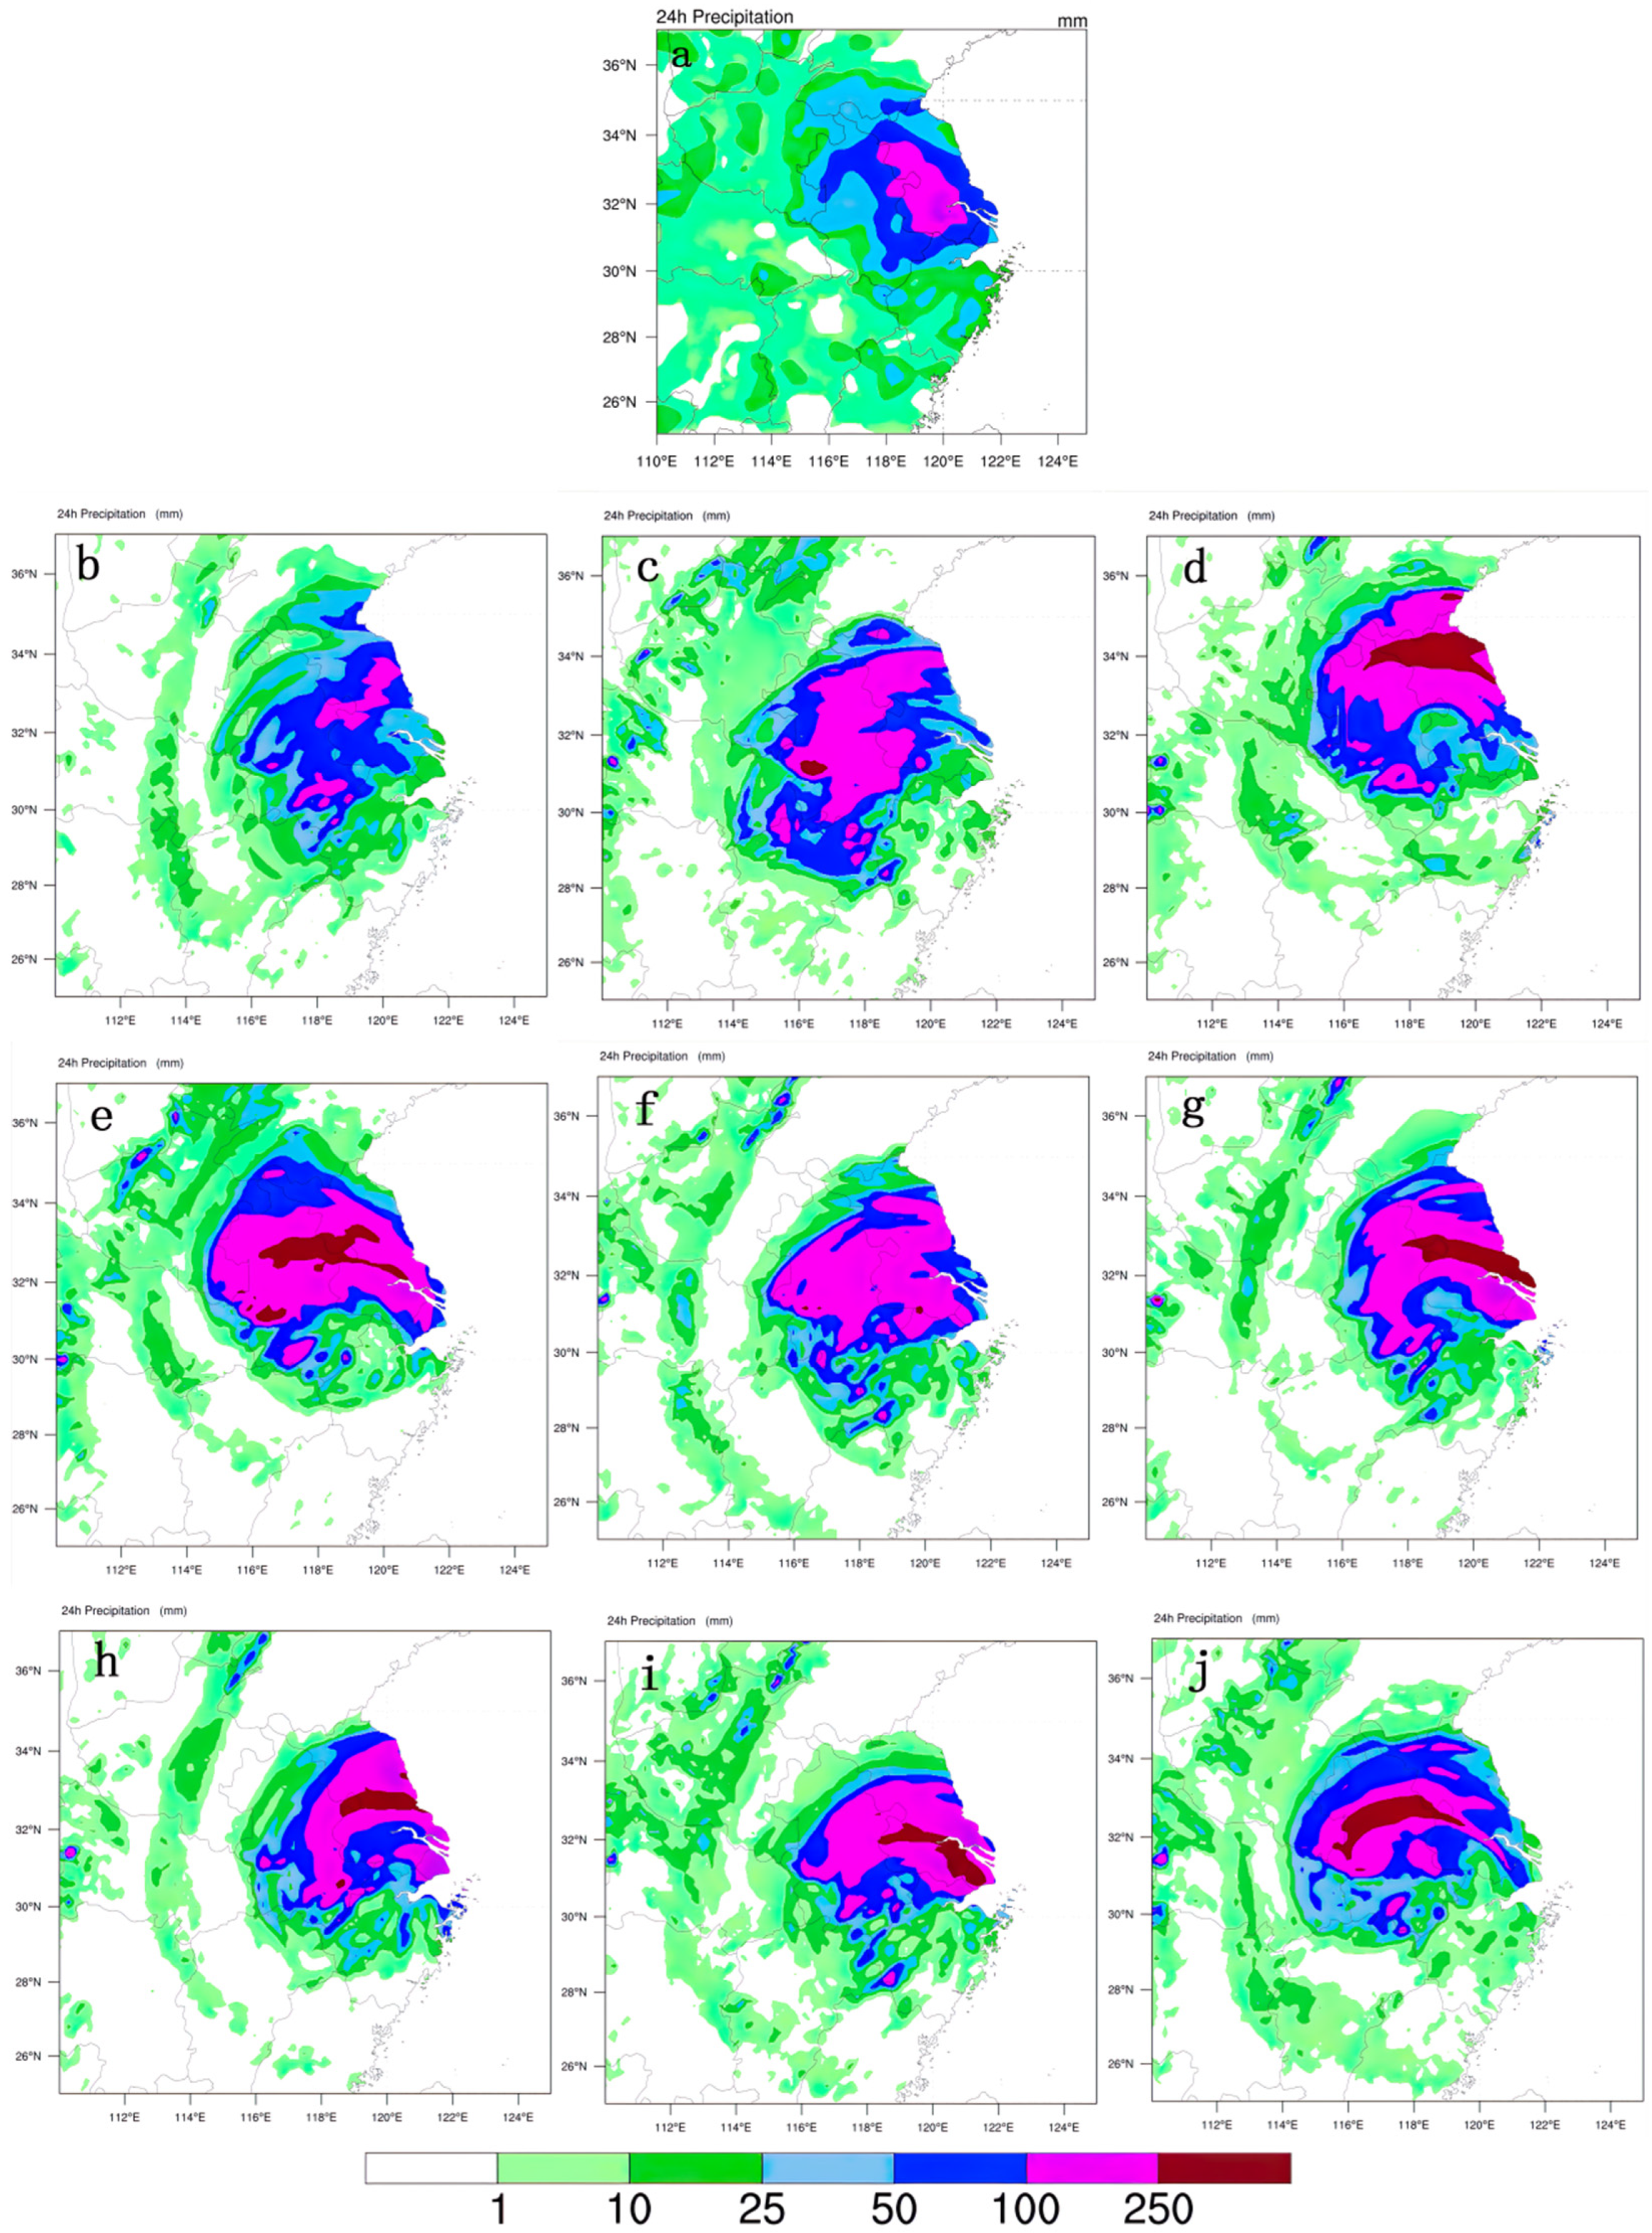
4.3.2. Impacts on the Typhoon Precipitation Forecasts

As indicated by the observations of the hourly intensive automatic rainfall stations of the CMA (China Meteorological Administration) (Figure 8a), heavy precipitation over 100 mm mainly occurred in the east coast of China with the precipitation region located in Jiangsu and Anhui provinces. However, the precipitation in CONT is underestimated compared with the observations (Figure 8b). While all the assimilating experiments overestimate the rainfall amount, the experiment FY2G+FY4A corrects this kind of precipitation overestimation to some extent. Comparing the results with assimilating the AMVs from different channels, the experiments with those from water vapor channels (Figure 8d,g,h) are more likely to cause excessive precipitation forecasts than those from infrared channels (Figure 8c,f), which may be due to that the AMVs of the water vapor channel lack of the wind field information in the middle and lower levels of the atmosphere. The overestimation of the precipitation requires more investigation in the future work.

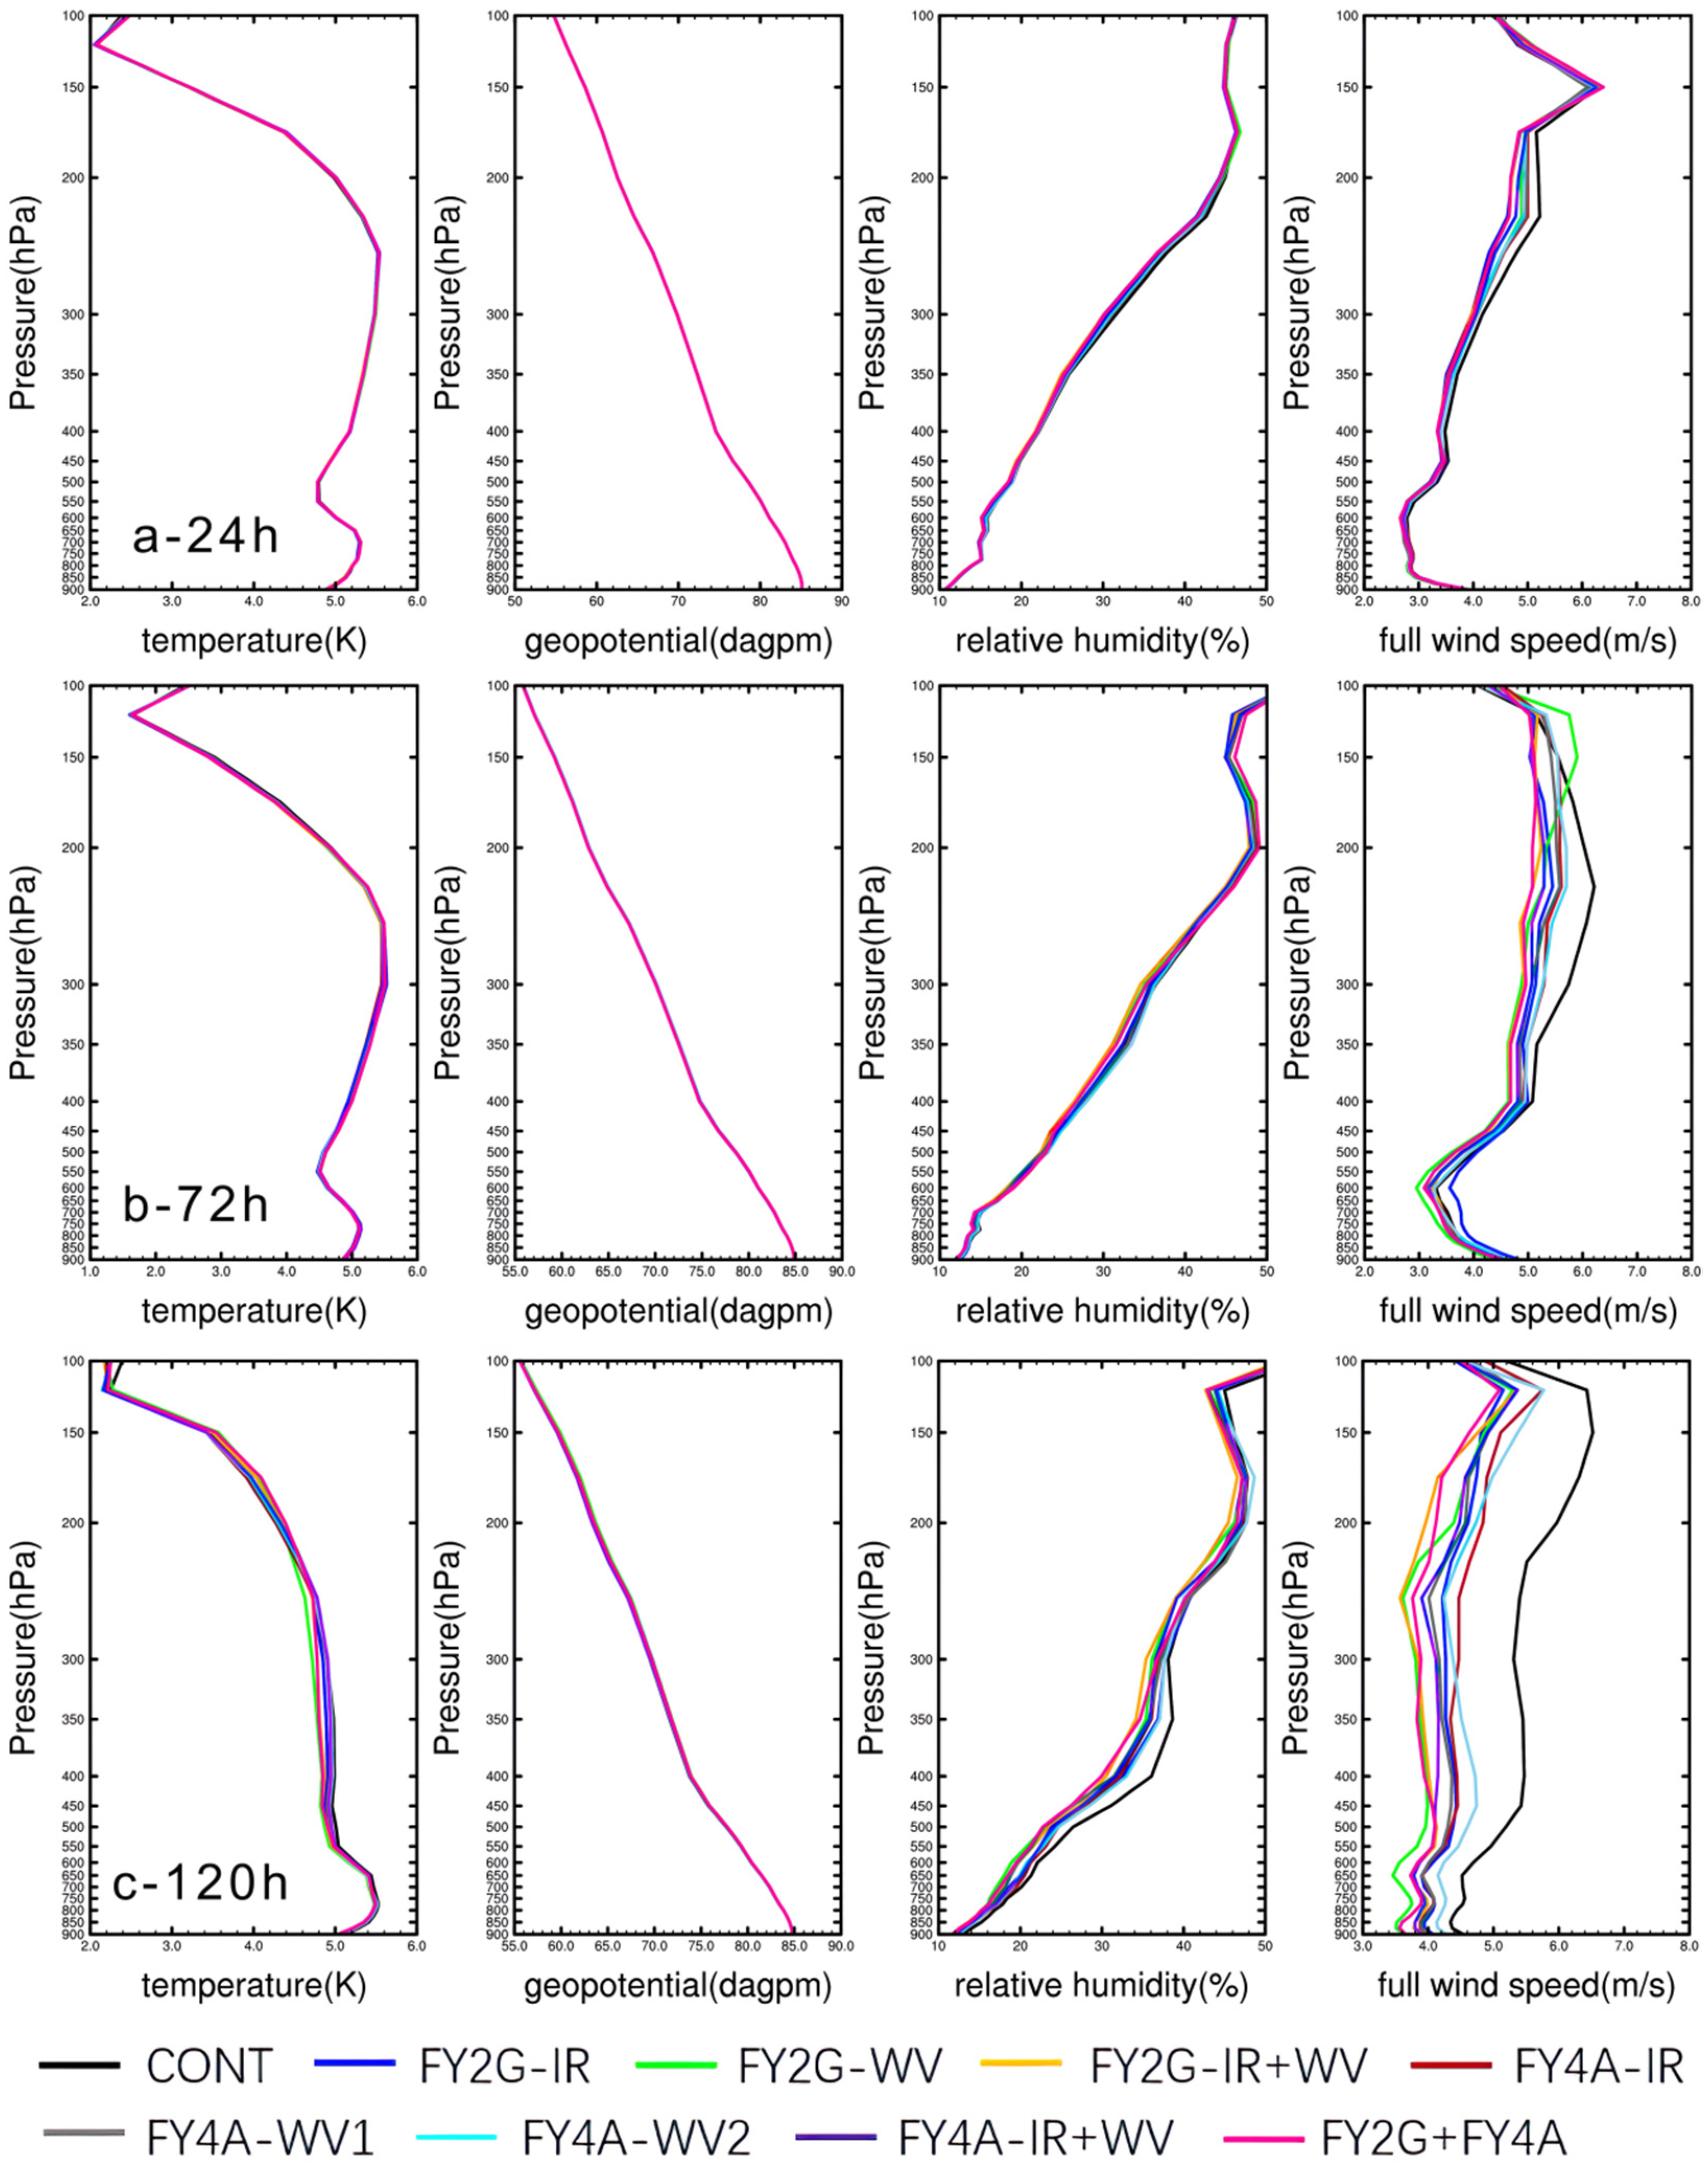
4.3.3. Forecasting Impacts on the Physical Variables Fields

The vertical profiles of the root mean square error (RMSE) at 24-h, 72-h, and 120-h forecasts of temperature, geopotential height, relative humidity, and full wind speed started from 0000 UTC on 23 July 2021 referring to the ECMWF ERA-5 reanalysis data in the control run and eight assimilating experiments were calculated in order to quantitatively evaluate the assimilating and forecasting impacts on the longer-period forecasts and the values smaller than those of CONT indicate the positive impacts (Figure 9). Basically, the impacts on the geopotential height and temperature are neutral from the lower level to the upper level with the time evolution. For the relative humidity field, positive impacts are shown above 500 hPa at 120-h forecast. More dominantly positive impacts on the full wind speed occur above 450 hPa at 24-h forecast and extend to all levels at 72-h forecast, then become much more dramatic at 120-h forecast. Apparently, assimilating the AMVs data from the two Fengyun geostationary satellites in all experiments improves the most of the full wind speed forecasts than the forecasts of other physical variable fields vertically and the impacts extend from the upper level down to the lower level with the forecasting time evolution, for that there are the largest AMVs data amounts at the upper level. The FY2G+FY4A experiment shows generally better positive impacts overall than others, which may be because most observations assimilated provide a better fit for the analysis.
The assimilation impacts on the single typhoon case can be casual and not representative, therefore, these kinds of assimilating experiments are repeated in quite a few typhoon cases (not shown). Unsurprisingly, similar conclusions can be drawn and it is clear that assimilation of the AMVs from the Fengyun-4 satellites would be beneficial for the NWP.

5. Conclusions and Discussion

In order to evaluate the quality, we assessed the assimilating and forecasting impacts of the AMVs data that were retrieved from the Chinese second generation geostationary meteorological satellite FY-4A in the typhoon forecasts within a limited domain by applying the WRFDA system with the 3D-VAR component. The AMVs from the first generation geostationary meteorological satellite FY-2G were used as an assessing reference in the overlapping observing region of the two. This study indicates that the retrieved AMVs from the infrared and water vapor channels of the two Fengyun satellites are mainly located at the middle and upper levels (100 hPa to 700 hPa) and only a few at the low level (700 hPa to 950 hPa), which is consistent with previous AMVs studies. For full wind speeds, FY-4A AMVs show generally better data quality with smaller and stable RMSEs and biases than those of FY-2G.
Typhoon In-Fa was selected and eight cycling assimilation experiments and one control run were carried out to study the impacts of assimilation and forecasting by assimilating the two AMVs data on the typhoon forecasts, which were comparable for the forecasted typhoon tracks. Convincingly, assimilating the AMVs of both FY-2G and FY-4A can slightly reduce the track errors compared with CONT. In addition, the track errors of the experiments with assimilating FY-4A AMVs are actually larger than those with FY-2G AMVs, even though FY-2G AMVs data have a bit larger RMSE. The possible reason for this might be due to more AMVs data from FY-2G that were assimilated in this study to do a better fitting. However, there are no significant positive impacts for the typhoon intensity prediction and only neutral impacts are founded, which indicates that the typhoon intensity prediction is still a hard question for the NWP.
It is noticed that the experiments with the AMVs that were retrieved from water vapor channels are more likely to cause excessive rainfall in the typhoon precipitation prediction over land than those from infrared channels. Moreover, the physical variables field forecasts illustrate that assimilating the AMVs data from Fengyun geostationary satellites has neutral to positive impacts on the full wind speed more evidently than other physical variables fields vertically and the impacts extend from the upper level down to the lower level with time evolution since there are the largest number of the AMVs data at the upper level. We also did many verification experiments for other typhoons (not shown), which also confirmed the conclusions above by showing the similar assimilating and forecasting results.
As the new generation of Chinese geostationary satellite in meteorology, FY-4A has not only upgraded its instruments, but also provides data with better quality than its predecessor FY-2G. The results in the studies here are quite encouraging for the NWP application. Although the forecasting and assimilating impacts are basically neutral to slightly positive, the retrieved AMVs data are still worthy of being further investigated in order to be applied operationally. Lately, more FY-4 satellite series are about to be launched, and subsequently more AMVs data can be retrieved from multiple channels and applied not only for the NWP, but also for various research purposes.

Author Contributions

Conceptualization, K.C.; methodology, P.G.; software, P.G.; validation, K.C.; formal analysis, P.G.; investigation, K.C.; resources, K.C.; data curation, P.G.; writing—original draft preparation, P.G.; writing—review and editing, K.C.; visualization, P.G.; supervision, K.C.; project administration, K.C.; funding acquisition, K.C. All authors have read and agreed to the published version of the manuscript.

Funding

The authors appreciate the National Natural Science Funds of China support of this research through Grant No. 41875039 and also thank the National Key Scientific and Technological Infrastructure project “Earth System Science Numerical Simulator Facility” (EarthLab) for its support (Grant No.:2022-EL-PT-00052).

Data Availability Statement

The FY2G and FY4A AMVs data were obtained freely from (http://satellite.nsmc.org.cn/portalsite/Data/DataView.aspx/, accessed on 30 January 2023). The ECMWF analysis and the NCEP data can be downloaded from (https://cds.climate.copernicus.eu/cdsapp#!/dataset/reanalysis-era5-pressure-levels, accessed on 30 January 2023) and (https://rda.ucar.edu/datasets/ds083.3/, accessed on 30 January 2023), respectively. The precipitation observations can be obtained from (http://data.cma.cn/data/cdcindex/cid/f0fb4b55508804ca.html/, accessed on 30 January 2023).

Conflicts of Interest

The authors declare that there is no conflict of interest regarding the publication of this paper.

References

  1. Yang, J. Meteorological Satellites and their Applications; China Meteorological Press: Beijing, China, 2012. (In Chinese) [Google Scholar]
  2. Zhang, P.; Guo, Q.; Chen, B.; Feng, X. Comparative analysis of Chinese Fy-4 meteorological satellite and Japanese Himawari-8/9 satellite. Prog. Meteorol. Sci. Technol. 2016, 6, 72–75. (In Chinese) [Google Scholar]
  3. Lu, F.; Zhang, X.H.; Chen, B.Y.; Liu, H.; Wu, R.; Han, Q.; Feng, X.; Li, Y.; Zhang, Z. FY-4 geostationary meteorological satellite imaging characteristics and its application prospects. J. Mar. Meteor. 2017, 37, 1–12. (In Chinese) [Google Scholar] [CrossRef]
  4. Hansen, M.C.; Reed, B. A comparison of the IGBP DIS Cover and University of Maryland 1 km global land cover products. Int. J. Remote Sens. 2000, 21, 1365–1373. [Google Scholar] [CrossRef]
  5. Xue, J. The scientific problems and prospects of meteorological satellite data assimilation. Acta Meteorol. Sin. 2009, 67, 903–911. (In Chinese) [Google Scholar] [CrossRef]
  6. Mecikalski, J.R.; Bedka, K.M. Forecasting convective initiation by monitoring the evolution of moving cumulus in daytime GOES imagery. Mon. Weather Rev. 2006, 134, 49–78. [Google Scholar] [CrossRef]
  7. Bedka, K.M.; Velden, C.S.; Petersen, R.A.; Feltz, W.F.; Mecikalski, J.R. Comparisons of satellite-derived atmospheric motion vectors, rawinsondes, and NOAA wind profiler observations. J. Appl. Meteorol. Climatol. 2009, 48, 1542–1561. [Google Scholar] [CrossRef]
  8. Mecikalski, J.R.; Bedka, K.M.; Paech, S.J.; Litten, L.A. A statistical evaluation of GOES cloud-top properties for nowcasting convective initiation. Mon. Weather Rev. 2008, 136, 4899–4914. [Google Scholar] [CrossRef]
  9. Velden, C.S.; Bedka, K.M. Identifying the Uncertainty in Determining Satellite-Derived Atmospheric Motion Vector Height Attribution. J. Appl. Meteorol. Climatol. 2009, 48, 450–463. [Google Scholar] [CrossRef]
  10. Salonen, K.; Cotton, J.; Bormann, N.; Forsythe, M. Characterizing AMV Height-Assignment Error by Comparing Best-Fit Pressure Statistics from the Met Office and ECMWF Data Assimilation Systems. J. Appl. Meteor. Climatol. 2014, 54, 5647–5653. [Google Scholar] [CrossRef]
  11. Liu, R.; Zhai, G.; Wang, Z.; Zhu, Y.; Shen, H.; Xu, Y. Experimental study on the influence of FY-2C Cloud Track Wind Data Assimilation on typhoon forecast. Chin. J. Atmos. Sci. 2012, 36, 350–360. (In Chinese) [Google Scholar]
  12. Liang, J.; Chen, K.; Xian, Z. Assessment of FY-2G Atmospheric Motion Vector Data and Assimilating Impacts on Typhoon Forecasts. Earth Space Sci. 2021, 8, e2020EA001628. [Google Scholar] [CrossRef]
  13. Barker, D.; Huang, X.Y.; Liu, Z.; Auligné, T.; Zhang, X.; Rugg, S.; Ajjaji, R.; Bourgeois, A.; Bray, J.; Chen, Y.; et al. The weather research and forecasting model’s community variational/ensemble data assimilation system: WRFDA. Bull. Am. Meteorol. Soc. 2012, 93, 831–843. [Google Scholar] [CrossRef] [Green Version]
  14. Barker, D.; Huang, W.; Guo, Y.-R.; Bourgeois, A. A three-dimensional variational (3DVAR) data assimilation system for use with MM5. NCAR Tech. Note 2003, 68, 897–914. [Google Scholar] [CrossRef]
  15. Huang, X.Y.; Xiao, Q.; Barker, D.; Zhang, X.; Michalakes, J.; Huang, W.; Henderson, T.; Bray, J.; Chen, Y.; Ma, Z.; et al. Four-Dimensional Variational Data Assimilation for WRF: Formulation and Preliminary Results. Mon. Weather Rev. 2009, 137, 299–314. [Google Scholar] [CrossRef]
  16. Lin, Y.; Farley, R.; Orville, H. Bulk parameterization of the snow field in a cloud model. J. Clim. Appl. Meteorol. 1983, 22, 1065–1092. [Google Scholar] [CrossRef]
  17. Tiedtke, M. A comprehensive mass flux scheme for cumulus parameterization in large–scale models. Mon. Weather Rev. 1989, 117, 1779–1800. [Google Scholar] [CrossRef]
  18. Mlawer, E.J.; Taubman, S.J.; Brown, P.D.; Iacono, M.J.; Clough, S.A. Radiative transfer for inhomogeneous atmospheres:RRTM, a validated correlated-k model for the longwave. J. Geophys. Res. 1997, 102, 16663–16682. [Google Scholar] [CrossRef]
  19. Janjic, Z.I. The Step-Mountain Eta Coordinate Model: Further developments of the convection, viscous sublayer, and turbulence closure schemes. Mon. Weather Rev. 1994, 122, 927–945. [Google Scholar] [CrossRef]
  20. Niu, G.-Y.; Yang, Z.-L.; Mitchell, K.; Chen, F.; Ek, M.; Barlage, M.; Kumar, A.; Manning, K.; Niyogi, D.; Rosero, E.; et al. The community Noah land surface model with multiparameterization options (Noah–MP): 1. Model description and evaluation with local-scale measurements. J. Geophys. Res. 2011, 116, D12109. [Google Scholar] [CrossRef] [Green Version]
Figure 1. The observation area of geostationary satellites FY-2G and FY-4A (the red circle is for FY-2G; the yellow circle is for FY-4A; the green box is the studied area here; the solid line is for the northern hemisphere; the dotted line is for the southern hemisphere).
Atmosphere 14 00375 g001
Figure 2. The vertical distributions of the RMSE (upper row) and the bias (lower row) of the full wind speed of the AMVs data that were retrieved from the infrared channels for the northern hemisphere referring to the ERA5 global reanalysis data. (a,c) are for FY-2G, and (b,d) are for FY-4A. The red line represents the AMVs with QI larger than 80, the blue line represents the AMVs with QI between 70 and 80, and the green line represents the AMVs with QI smaller than 70.
Atmosphere 14 00375 g002
Figure 3. The RMSE time series of the AMVs data that were retrieved from the infrared channels at different height levels from 1 August 2020 to 31 October 2020. The red line represents the AMVs data with QI larger than 80; the blue line represents the AMVs data with QI between 70 and 80; and the green line represents the AMVs data with QI smaller than 70. (a,c,e) are for FY-2G and (b,d,f) are for FY-4A. The upper row is for 100~400 hPa; the middle row is for 400~700 hPa; and the lower row is for 700~950 hPa.
Atmosphere 14 00375 g003
Figure 4. The probability density distribution of the first guess departures (O-B) of the AMVs data that were retrieved from the infrared channels of FY-2G and FY-4A after quality control processes at 12:00 UTC on 22 July 2020 ((a) for FY-2G, (b) for FY-4A, and (c) for the combined FY-2G and FY-4A).
Atmosphere 14 00375 g004
Figure 5. The CMA best track of In-Fa from 0000 UTC on 23 July 2021 to 2100 UTC on 27 July 2021 (interval: 6 h; TD: Tropical Depression TS: Tropical Storm; STS: Severe Tropical Storm; TY: Typhoon).
Atmosphere 14 00375 g005
Figure 6. The evolution of track (ac) referring to the CMA best track of Typhoon In-Fa from 0000 UTC on 23 July 2021 to 0000 UTC on 28 July 2021 (interval: 6 h; red: CMA best track; black: CONT; for (ac)). For (a), the yellow line represents experiment FY2G-IR+WV; the green line represents experiment FY2G-WV; and the blue line represents experiment FY2G-IR. For (b), the yellow line represents experiment FY4A-IR+WV; the light blue line represents experiment FY4A-WV2; the green line represents experiment FY4A-WV1; and the blue line represents experiment FY4A-IR. For (c), the blue line represents experiment FY2G+FY4A.
Atmosphere 14 00375 g006
Figure 7. The evolution of intensity (MSLP, unit: hPa) and track errors ((b,c) unit: km) referring to the CMA best track data of Typhoon In-Fa from 0000 UTC on July 23 2021 to 0000 UTC on 28 July 2021, the time interval is 6 h. (black line and bar: CONT; the blue line and bar: FY2G-IR; the green line and bar: FY2G-WV; the orange line and bar: FY2G-IR+WV; the brown line and bar: FY4A-IR; the grey line and bar: FY4A-WV1; the light blue line and bar: FY4A-WV2; the purple line and bar: FY4A-IR+WV;the pink line and bar: FY2G+FY4A; for (ac)). For (a), the red line represents the CMA best track.
Atmosphere 14 00375 g007
Figure 8. The 24-h accumulated precipitation (unit: mm) over land from 0000 UTC on 27 July 2021 to 0000 UTC on 28 July 2021 from CMA observations of the hourly intensive automatic rainfall stations (a), CONT (b), FY2G-IR (c), FY2G-WV (d), FY2G-(IR+WV) (e), FY4A-IR (f), FY4A-WV1 (g), FY4A-WV2 (h), FY4A-(IR+WV) (i), and FY2G+FY4A (j) experiments.
Atmosphere 14 00375 g008
Figure 9. Vertical profiles of the 24-h (a), 72-h (b), and 120-h (c) forecast RMSEs referring to the ECMWF ERA5 reanalysis data of temperature (unit: K), geopotential height (unit: dagpm), relative humidity (unit: %), and the full wind speed (unit: m s−1) fields started from 0000 UTC on 23 July 2021 from the control experiment (CONT) (black), FY2G-IR (blue), FY2G-WV (green), FY2G-IR+WV (yellow), FY4A-IR (dark purple), FY4A-WV1 (gray), FY4A-WV2 (light blue), FY4A-IR+WV (purple), and FY2G+FY4A (purple red).
Atmosphere 14 00375 g009
Table 1. The channels that were used for retrieving the AMVs of geostationary satellite FY-2G and FY-4A.
SatelliteIR Channel/(μm)WV Channel/(μm)Observing AreaNadir
FY-2G10.3–11.36.3–7.655° E–155° E
50° S–50° N
99.5° E
FY-4A10.3–11.36.9–7.340° E–170° E
65° S–65° N
105° E
5.8–6.7
Table 2. The list of the assimilating experiment settings.
ExperimentsIDSettings
Control experimentCONTWithout data assimilated
Cycling assimilation experimentsFY2G-IRFY-2G AMVs data from the infrared channel assimilated
FY2G-WVFY-2G AMVs data from the water vapor channel assimilated
FY2G-IR+WVFY-2G AMVs data from the combined channels assimilated
FY4A-IRFY-4A AMVs data from the infrared channel assimilated
FY4A-WV1FY-4A AMVs data from the lower water vapor channel assimilated
FY4A-WV2FY-4A AMVs data from the higher water vapor channel assimilated
FY4A-IR+WVFY-4A AMVs data from the combined channels assimilated
FY2G+FY4AFY-2G+FY-4A AMVs data from all the five retrieved channels assimilated
Table 3. The List of the Parameterization Schemes Used for All the Nine Experiments for Typhoon In-Fa.
Parameterization SchemesSettings
Microphysics schemeLin [16]
Cumulus convection schemeTiedtke [17]
Radiation schemeRRTMG/RRTMG [18]
Planetary boundary layer schemeMYJ [19]
Land-surface schemeNoah [20]
Disclaimer/Publisher’s Note: The statements, opinions and data contained in all publications are solely those of the individual author(s) and contributor(s) and not of MDPI and/or the editor(s). MDPI and/or the editor(s) disclaim responsibility for any injury to people or property resulting from any ideas, methods, instructions or products referred to in the content.

