Article

Geostationary Precipitation Estimates by PDF Matching Technique over the Asia-Pacific and Its Improvement by Incorporating with Surface Data

1
Central Weather Bureau, Taipei 100006, Taiwan
2
Climate Prediction Center, NOAA, College Park, MD 20740, USA
*
Author to whom correspondence should be addressed.
Atmosphere 2023, 14(2), 342; https://doi.org/10.3390/atmos14020342
Submission received: 13 January 2023 / Revised: 3 February 2023 / Accepted: 3 February 2023 / Published: 8 February 2023

Abstract

:
An Infrared (IR)-passive microwave (PMW) blended technique is developed to derive precipitation estimates over the Asia-Pacific domain through calibrating the temperature of brightness blackbody from the Japanese Himawari-8 satellite to precipitation derived from the combined PMW retrievals (currently MWCOMB2x) based on the probability density function (PDF)-matching concept. Called IRQPE, the technique is modified and fine-tuned to better represent the spatially rapidly changing cloud–precipitation relationship over the target region with PDF-matching tables established over a refined spatial resolution of 0.5° lat/lon grid. The evaluation of the IRQPE shows broadly comparable performance to that of the CMORPH2 in detecting rainfall systems of large and medium-scales at a resolution of 1.0° degree. Rainfall variations from the two datasets over El Niño-Southern Oscillation and the Madden Julian Oscillation active convective centers show well consistency of each other, suggesting usefulness of the IRQPE in climate applications. Two approaches for regional improvements are explored by establishing the PDF tables for a further refined spatial resolution and by replacing the PMW-based precipitation ‘truth’ fields with the surface gauge data to overcome the shortcoming of PMW-based retrievals in capturing orographic rainfall over the Taiwan area. The results show significant improvements. The rainfall patterns of revised the IRQPE at a resolution of 0.1° degree on above the 5-day timescale correlate well with the Taiwan official surface ground truth called the QPESUMS, which is a gridded set of gauge-corrected Radar quantitative precipitation estimations. The root mean square error of the revised IRQPE on estimating the Taiwan overall land rainfall is close to Radar-derived rainfall accumulations on a 30-day time-scale.

1. Introduction

Precipitation is one of the most vital weather elements influencing daily life. Rainfall measurements are highly needed for all weather agencies not only for their local monitoring and forecast, but also for tracking the global weather systems and the large-scale climate variabilities. Along with surface rain gauge observations and the radar network, satellite observations provide crucial information on precipitation over regions of poor or even no ground-based observations, especially for the global spacious marine area. With the Geostationary (GEO) satellite broadcast data services and the associated estimation techniques, a real-time satellite estimated precipitation producing process can be established in a weather agency to routinely generate gridded rainfall data over a broad spatial domain to satisfy the aforementioned user needs.
IR-based precipitation estimation techniques have been explored and developed for decades based on the assumption that the relationship between precipitation and cloud top temperature as measured from the GEO IR channels is monotonic. Although it is an indirect approach, the high correlation between deep convection and rainfall makes GEO IR-based precipitation estimation technically possible and practically useable, especially for the climate monitoring applications which require data covering over a large spatial domain, expanding over an extensive time period, and capable of capturing tropical convective systems over both land and ocean [1,2,3]. Earlier techniques start from the index concept [4,5], which studied the temperature of brightness blackbody (TBB) threshold values for guiding the rainfall estimates. Early efforts utilized radar observations and/or gauge measurements over selected regions as the ground truth to establish the cloud–precipitation relationship for the estimation of precipitation over a much wide region (even the entire tropical/sub-tropical areas in some cases). Inaccuracy occurs in the estimated precipitation due to the different cloud–precipitation relations over the training and the application areas and seasons. This problem is mitigated by using the passive microwave (PMW) retrievals from the low earth orbit (LEO) satellites as the ‘truth’ of precipitation to train the GEO IR data [6,7,8]. While this PMW-calibrated IR estimation strategy becomes the standard practice for GEO IR-based techniques, the technical approaches to establish the cloud and rainfall relationship differ among researchers. Broadly categorizing, there are mainly three kinds of the approaches to calibrate the IR data against the PMW retrievals: artificial intelligence (AI) techniques, regression modeling, and probability density function (PDF)-matching technique. For example, Hsu et al. [9] employed AI techniques to develop PERSIANN (Remotely Sensed Information using Artificial Neural Networks) [9,10], which is one of the current popular IR-based precipitation estimates. Kuligowski [11] used linear regression to connect GEO multi-band data with PMW and produce SCaMPR (Self-Calibrating Multivariate Precipitation Retrieval), which is one of the NOAA’s official GEO IR precipitation estimation products. Turk et al. [12] proposed probability density function (PDF)-matching to set up look-up tables for transferring cloud brightness measurements to precipitation. The concept of the PDF-matching technique is very straightforward and broadly adopted by many related applications [13,14,15,16].
Compared to the indirect rainfall estimations from GEO observed IR and radiance data from other channels, the PMW-based rainfall estimations from LEO platforms are based on a more direct physical relationship between precipitation and cloud features and therefore yield more accurate estimation of precipitation than those derived from the IR-based approaches [17,18,19,20,21,22,23,24]. The PMW retrieval algorithm, such as the Microwave Integrated Retrieval System (MiRS) [18] and Goddard Profiling Algorithm (GPROF) [19], are used to produce PMW level 2 retrieval at the field of view (FOV) of the LEO observations. LEO satellite observations, however, are restricted by their limited time/space coverage. Even with data from more than 10 LEO satellites, PMW retrievals can cover only about one fourth of the global domain at any moment. An assortment of techniques is developed to integrate these level 2 retrievals into a grid analysis of precipitation (level 3 products) covering the entire target domain. NOAA’s Climate Prediction Center (CPC) morphing technique (CMORPH) is the first global product of this kind for the PMW-based rainfall estimations [20,21]. The Tropical Rainfall Measurement Mission (TRMM) Merged Precipitation Analysis (TMPA) [22] and its successor Integrated Multi-Satellite Retrievals (IMERG) [23], both developed by NASA’s Precipitation Measurement Mission (PMM), are also PMW-based satellite precipitation estimates. They are all the main current satellite estimated precipitation products and widely used in the worldwide operation agencies and research. Including the Global Satellite Mapping of Precipitation (GSMaP) provided by the Japan Aerospace Exploration Agency (JAXA) [24], all these PMW-based satellite precipitation estimates basically used a similar morphing technique, but their PMW retrieval algorithms and detailed design are different. These groups are dedicated to continuous improvement, for example, NOAA CPC has upgraded their CMORPH to the second generation (CMOPRH2), covering the entire globe from the pole to the pole, with substantially improved performance especially for cold season precipitation (snowfall) [25].
Although an indirect estimation in nature, GEO IR-based precipitation estimates have their unique advantages. In particular, its near global coverage of high temporal and spatial resolution makes it irreplaceable. Even the aforementioned level 3 techniques use GEO IR-based estimates to derive motion vectors to interpolate the level 2 retrievals and to fill in the gaps where/when no PMW-based retrievals are available nearby. Another advantage of the GEO IR-based precipitation products is their extended data period. PMW-based satellite precipitation estimates usually do not cover periods before 1998 due to the limited availability of LEO PMW measurements. The main ingredient for the GEO precipitation product is the IR data, which is available at least from 1982. This extended data period is one of the reasons why IR-based GEO precipitation products are chosen instead of seemly better PMW-based satellite precipitation estimates in some climate applications. Additionally, the next generation GEO satellites, such as Himawari-8(H8) and NOAA GOES 16, have higher observation resolution and more bands, further making researchers draw new interests on the GEO precipitation estimate techniques and its improvements.
In this study, our first goal is to evaluate a GEO IR-based precipitation product generated by a PDF-matching technique for an operational purpose. NOAA CPC has applied the PDF-matching, called the IRRAIN algorithm, to supplement the PMW-based CMORPH estimates in an operational way. We employ this mature technique and use H8 IR data to produce GEO precipitation estimates over the Asia-Pacific area; the product name is currently called IRQPE. The PDF-matching approach is computationally efficient and operational friendly; our evaluation intends to check the performance of the IRQPE and see how it can support the applications in weather and climate monitoring.
The second goal of this study is to make regional improvements of the IRQPE. Good GEO precipitation estimates depend on the ability to simulate the reasonable IR and rainfall relationship, which usually varies season by season, location to location, and even changes under different weather systems. Thus, the way to group the collocated samples for establishing the relationship might also affect the quality of the IRQPE. Another direction to make a regional improvement is to incorporate the local surface observations to replace the reference rainfall truth from LEO PMW. PMW retrievals are known to perform better over ocean than land area; by replacing it with local surface observations, the improvement of the cloud–precipitation relationship over land area is expected.
This article is arranged as following: the IRQPE algorithm and study data are described in Section 2. The performance of the IRQPE and the results of the improvements will be presented in Section 3. Study conclusions and discussions will be given in the last section.

2. Data and Methods

2.1. Study Data

In this study, we intend to develop GEO IR-based 30-min precipitation estimates on a 0.05° lat/lon grid over the spatial domain [60° S–60° N, 75° E–155° W] for a 4-year period from 2018 to 2021.
Two categories of satellite data are utilized in this study to produce the IRQPE, i.e., the TBB data from the IR measurements aboard a geostationary satellite and the precipitation retrievals derived from the PMW measurements from LEO platforms. Specifically, the GEO TBB data used in this study are those measured by the Japanese Hiwamari-8 (H8) satellite and processed by the Japan Meteorological Agency (JMA) and shared with the Central Weather Bureau (CWB). The H8 TBB used in this study is preprocessed at CWB by linear interpolation from a spatial resolution of a roughly 2 km grid into a 0.05° lat/lon grid and covering a spatial domain [60° S–60° N, 70° E–150° W]. The temporal interval of the H8 TBB data is 10 min.
PMW-based precipitation retrievals are utilized in this study as the ‘truth’ to calibrate the GEO TBB data. Instead of using PMW level 2 precipitation retrievals from individual satellites, a composite PMW precipitation retrievals, the MWCOMB2x of NOAA CPC, are taken. The MWCOMB2x is constructed by combining level 2 retrievals from more than ten LEO satellites with a PMW sensor [25]. Level 2 precipitation retrievals from individual satellites are first calibrated against a common reference standard, the level 2 retrievals derived from the GPM Microwave Imager (GMI) using the GPROF algorithm [19]. These inter-calibrated level 2 retrievals are then composited into a global field of 30-min precipitation at a spatial resolution of 0.05° latitude/longitude. When/where level 2 retrievals are available from multiple satellites, only the one with the highest quality is used. The quality of the precipitation retrievals from various satellites is ranked based on evaluations against independent observations and subjective experiences.
Later in this study in improving the IRQPE over the Taiwan area, the grid analysis of local surface observations over the island is taken to replace the MWCOMB2x as the ‘truth’ to calibrate the GEO TBB data. The grid analysis of the 30-min rain rate is prepared through interpolation of gauge observations from about 800 stations.
For verifying the performance of the IRQPE, CMORPH2 is used as a comparison benchmark. When the studied domain comes to the Taiwan area, gauge-corrected radar precipitation estimates, called QPESUMS [26], cover the island of Taiwan and its adjacent oceanic regions, and is employed as the ground truth of precipitation.

2.2. IRQPE Algorithm

There are two main assumptions for the IR-based precipitation estimation technique, i.e.,
  • Precipitation comes from tall clouds with cold cloud top temperature (TBB); and
  • The taller the cloud, the colder the cloud top temperature, and the heavier the precipitation.
This leads to the backbone estimation strategy: to establish an empirical relationship between precipitation and cloud top temperature. IRQPE adopts the PDF-matching concept of Turk [12] and the CPC IRRAIN algorithms. In such an effort, the relationship between the precipitation and the GEO TBB is established through locally matching the PDF of TBB with that of the precipitation using co-located data pairs.
A step-by-step procedure taking the MWCOMB2x as the ground truth to calibrate the GEO TBB is described below:
  • Time/space collocated TBB/MWCOMB2x data pairs collected.
  • Histograms for TBB and MWCOMB2x assembled for each 0.5° lat/lon and for each hour.
  • PDF tables (cumulated histogram) constructed for each hour and for each 0.5° lat/lon using histograms for a 7-h duration centering at the target hour, for a 31-day period centering at the target date, and over a spatial domain of 1.5° lat/lon centering at the target grid box.
  • The data (histogram) collecting domain is expanded until at least a certain number of pairs (2000 is set in this study) of raining cases are included.
  • The established PDF tables are then converted to a TBB–precipitation relationship, assuming TBB at a certain percentile is associated with precipitation at the same percentile.
From the above procedure, one would see that the TBB–precipitation relationship of the IRQPE is established locally and evolves with time through matching the PDF of TBB against that of the MWCOMB2x. The relationship is monotonic, non-linear, and regionally, seasonally, diurnally dependent.
To demonstrate the outcome of the IRQPE, a sample case was draw in Figure 1 by comparing the IRQPE with MWCOMB2x and CMORPH2 on their original resolution of 0.05° lat/lon grid for a 30-min period starting from 00:00 UTC, 24 July 2021. As expected, combined PMW level 2 retrievals (MWCOMB2x) exhibit large areas of non-coverage over the 30-min, despite the fact that PMW from 10 satellites is included in the construction of the MWCOMB2x for the period. The second generation CMORPH (CMORPH2) fills in the gaps of the MWCOMB2x through interpolation of the PMW retrievals over a combined time/space domain, taking advantage of the motion vectors of the precipitating systems derived from the GEO-based precipitation estimates at consecutive time steps. Our IRQPE, defined through local calibration against the MWCOMB2x, reproduces the large-scale precipitation patterns very well, with differences against the COMRPH2 observed in smaller scales features and in local maxima. In particular, the IRQPE tends to generate wider areas of light rain compared to the CMORPH2.

2.3. Three Sets of IRQPE Experimented in This Study

Three sets of the IRQPE were produced in this study. The IRQPE_V0 is the original version with the same design as the CPC IRRAIN, shown by the procedure listed in Section 2.2. The IRQPE_V0 is produced the same for the Asia-Pacific domain as the H8 TBB and will be mainly used for climate applications. Two regional improvements of the IRQPE are called the IRQPE_EA and IRQPE_TWN for East Asia and Taiwan, respectively. The IRQPE_EA is designed for testing the effect of the changing sampling domain for constructing the PDF tables. The IRQPE_V0 was produced by constructing the PDF table for each 0.5° lat/lon gridbox, the IRQPE_EA was tested by changing to 0.2° lat/lon gridbox. The IRQPE_TWN is the one designed for incorporating the local surface observations to calibrate the GEO TBB data. The PDF tables in the IRQPE_TWN were established on an even finer resolution of 0.1° lat/lon gridbox to better resolve the rapid changes in cloud–precipitation relationship caused by complex topography there.

3. Results

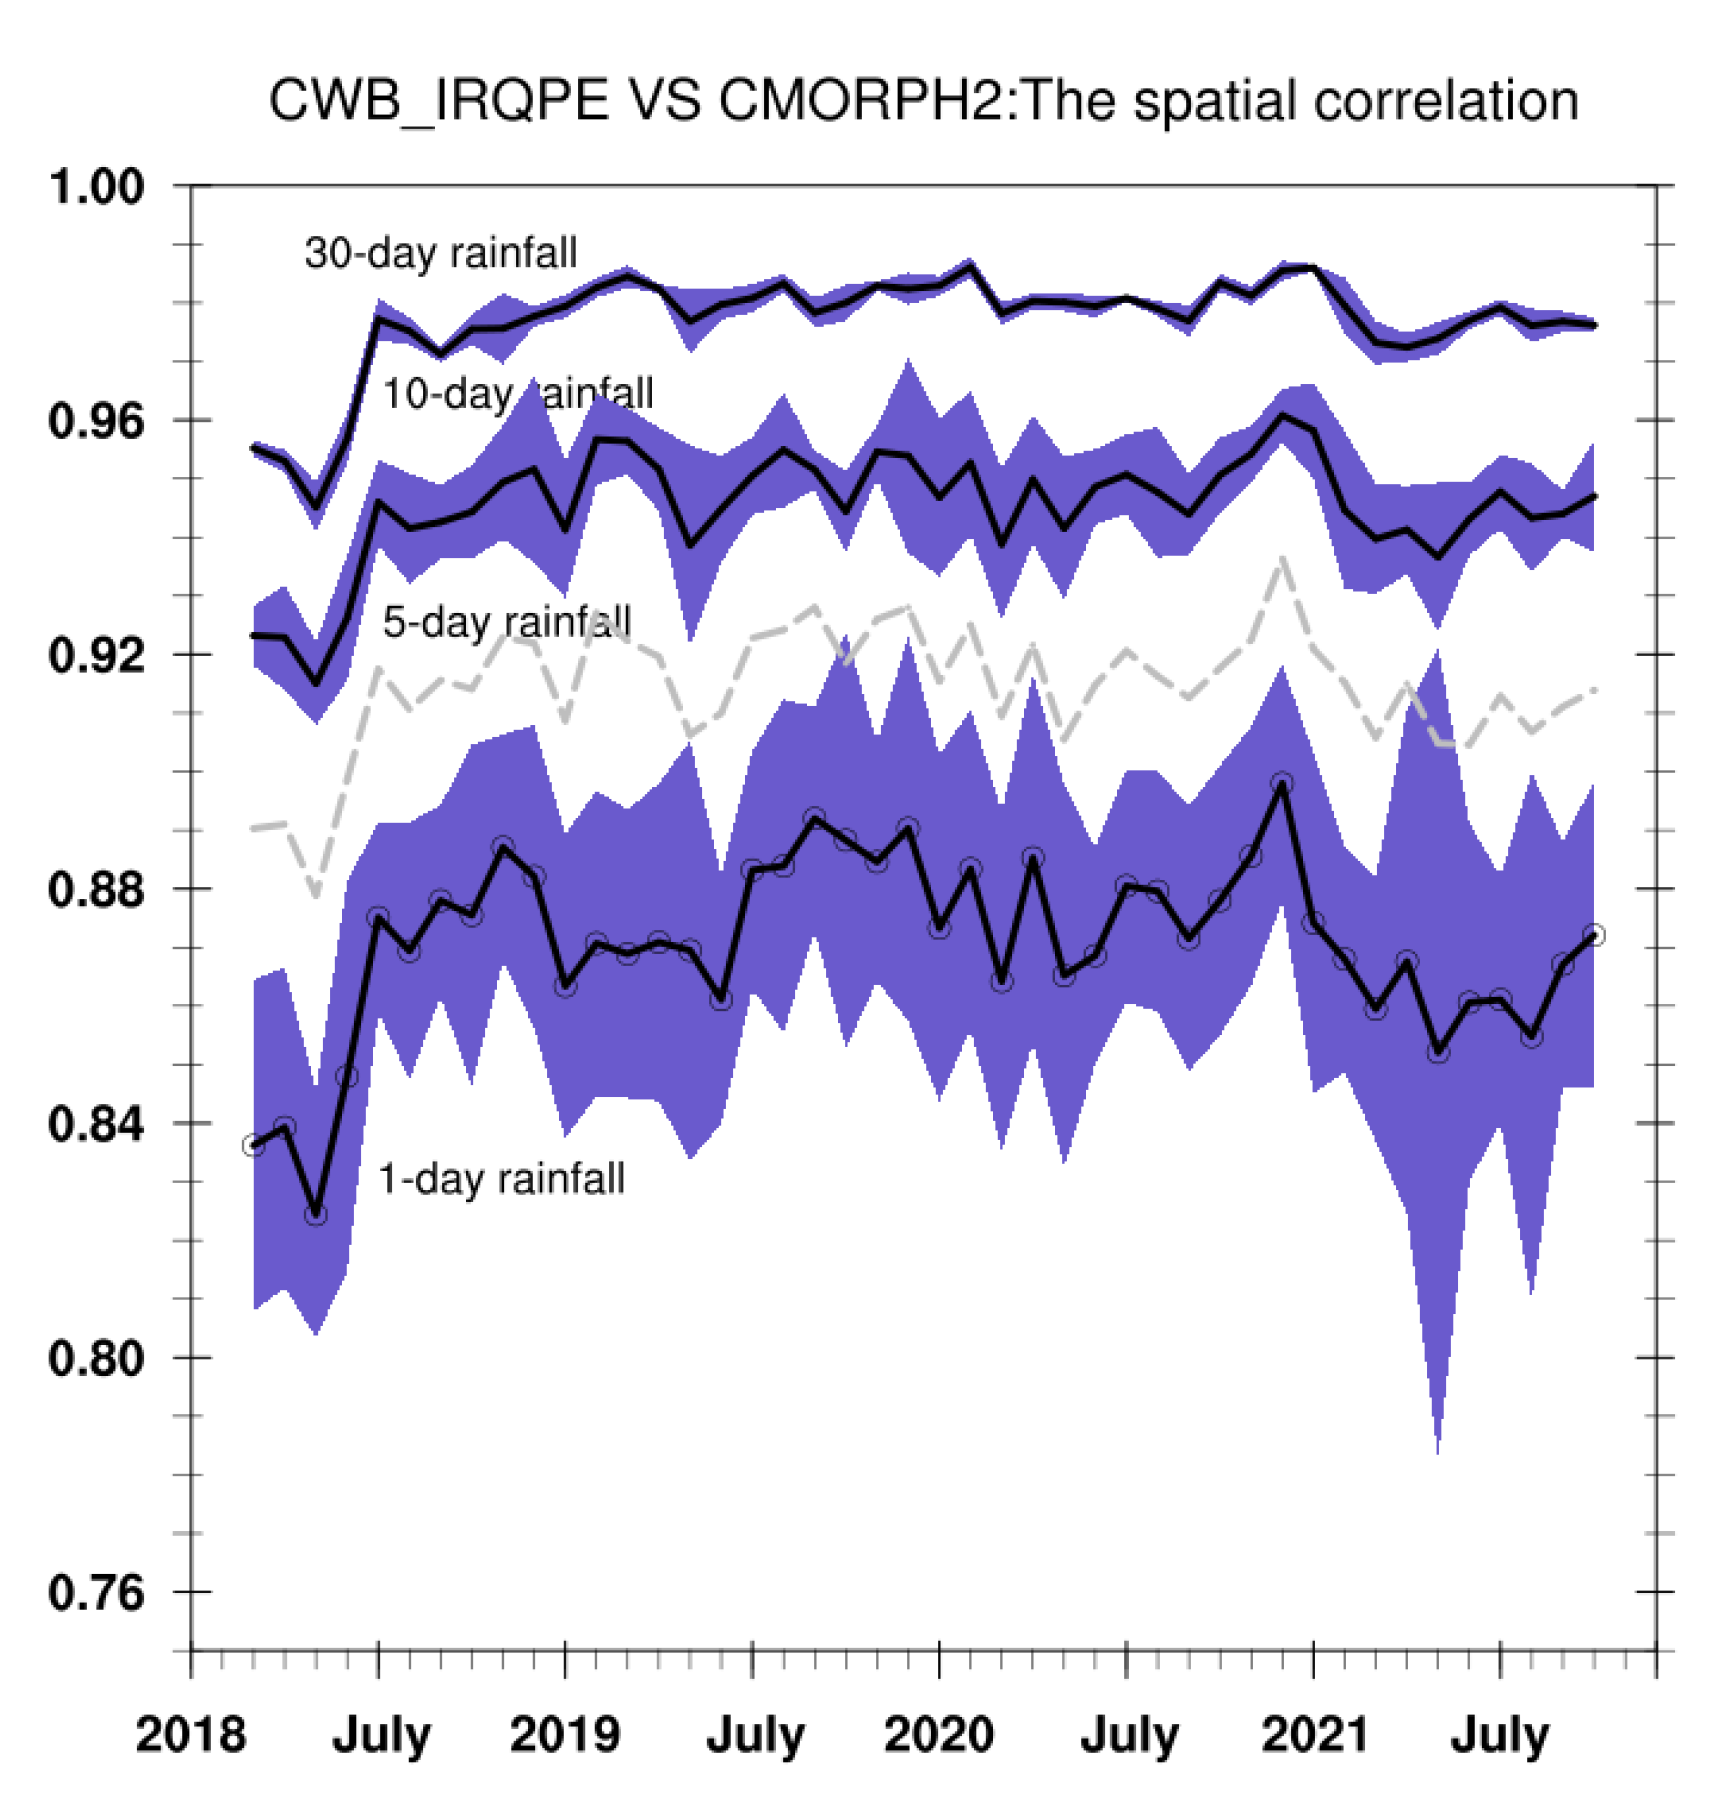
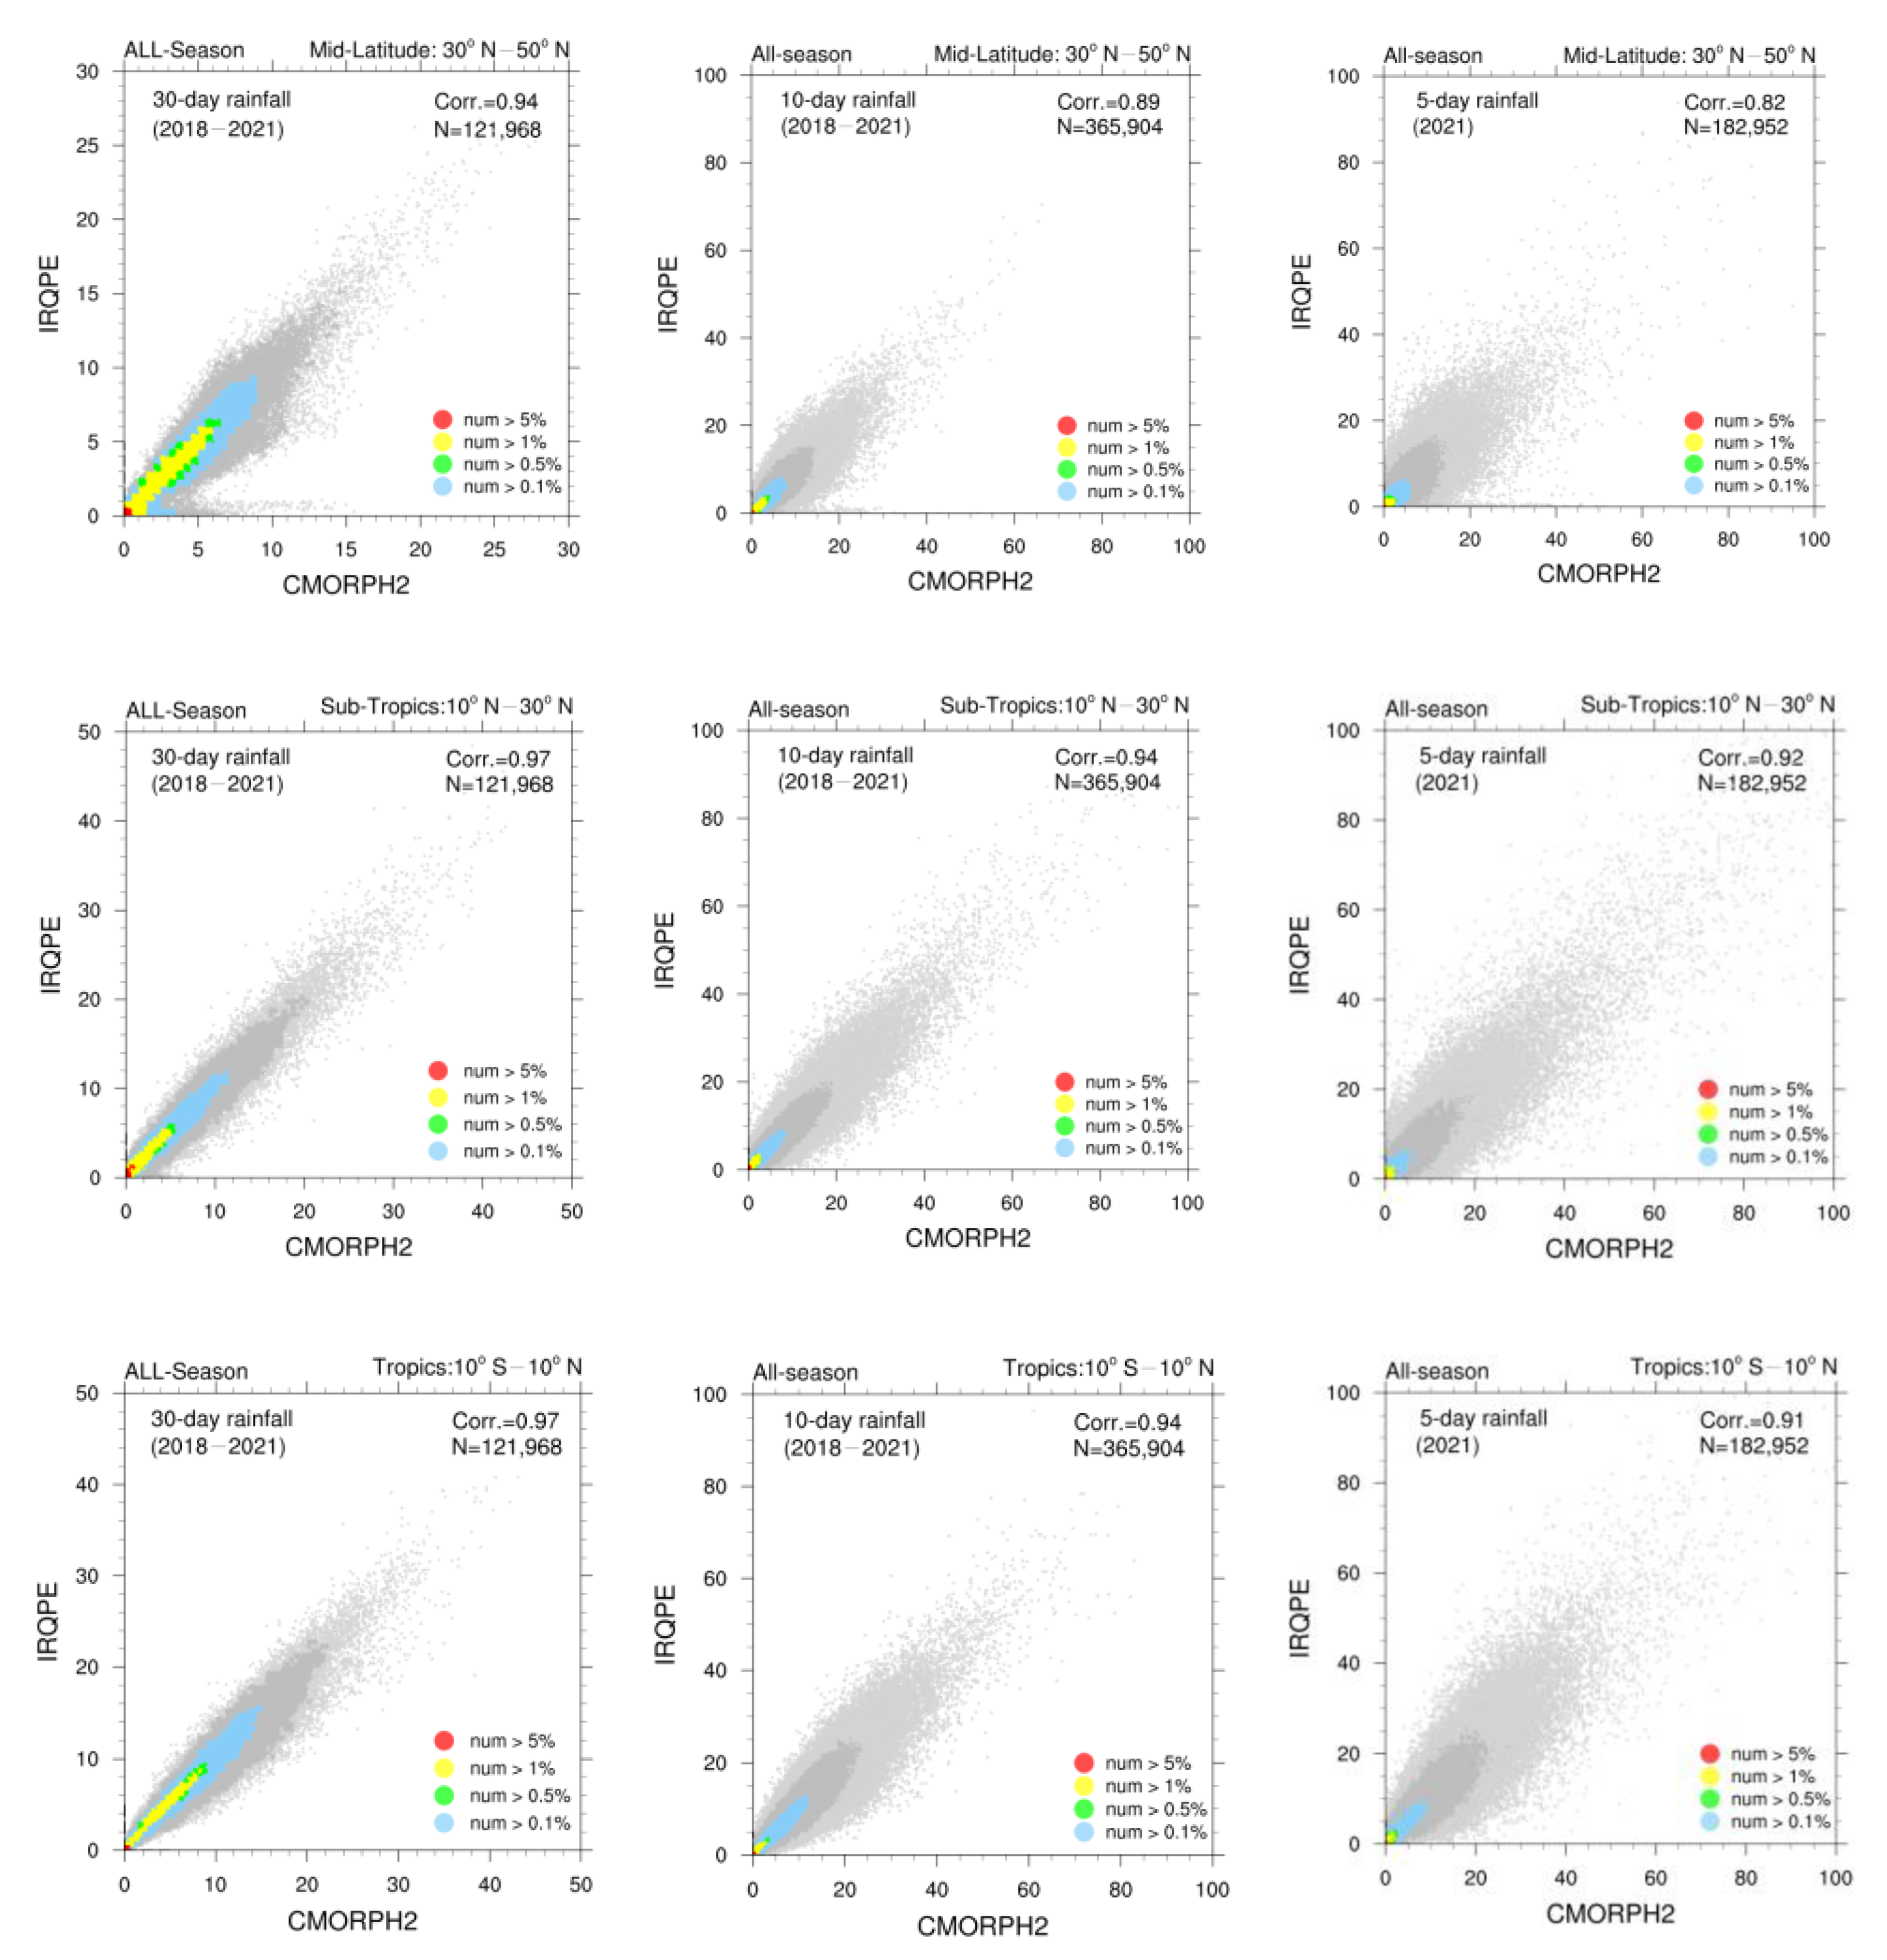
3.1. The Verification and Climate Applications of IRQPE

The verification of the IRQPE_V0, which was established and produced with the same design as the CPC IRRAIN, is presented in this section. The CPC CMORPH2 is used for the comparison. Since our goals start from verifying the large-scale performance of the IRQPE, the data is upscaled to 1° lat/lon grid from the original 0.05° lat/lon grid.
A thorough examination is conducted for a 4-year period from 2018 to 2021. Firstly, 4-year climatological seasonal mean derived from the IRQPE was compared with that from the CMORPH2 (Figure 2). The large-scale rainfall pattern of the IRQPE highly resembles the CMORPH2 for both winter and summer seasons, including the seasonal migration of the rainfall systems, such as the Intra-Tropical Convergence Zone (ITCZ) and the Southwestern Pacific Convergence Zone (SPCZ), as well as the mid-latitude/tropical storm track over the North Pacific. The IRQPE also performs a reasonable topographic effect, which can be seen over the Philippines, North Australia, and Indochina. Quantitatively, the difference between the climatological mean from the two datasets (Figure 2c,f) are minor, but some systematic spatial patterns might reflect the important characteristics of the IRQPE, such as less summer monsoon rainfall in DJF over the coastal area of North Australia was produced in the IRQPE than in the CMORPH2. These differences may be attributable to the underestimates of the IRQPE for rainfall related to the topographic effect. On marine areas, places over the edge of the tropical rain belt were shown wetter in the IRQPE than in the CMORPH2; the difference might imply the overestimates of the IRQPE for the non-precipitating circus anvil cloud.
The IRQPE also performs well in terms of day-to-day variation of the large-scale rainfall pattern. The spatial correlation between the IRQPE and CMORPH2 rainfall accumulation in four different time scales from daily to monthly for a broad area over Asia-Pacific (40° S–50° N, 80° E–160° W) is displayed in Figure 3. The correlation coefficients increase with the rainfall accumulation time scale. The number reaches higher than 0.95 for 30-day precipitation and over 0.9 both for 10-day and 5-day, showing the IRQPE can do as well as the CMORPH2 in climate monitoring applications. Down to the daily scale, the correlation coefficients still have values higher than 0.8, indicating the IRQPE is also able to capture the large-scale spatial patterns well in the weather time scale. To provide more detailed comparisons in seasonality and different climate zones, Table 1 lists the mean correlation coefficients separately in four seasons and three latitudinal bands for tropical, sub-tropical, and mid-latitude areas. It shows that the correlations are higher in the tropics and sub-tropics than in the mid-latitude. The difference among seasons is not significant, only that the correlation in the spring season shows lower than others. Overall speaking, the correlation coefficients can be seen over 0.9 for tropics and sub-tropics in all seasons in term of the time scale above 5-day. Point-to-point scatter plots (Figure 4) also support the above finding that higher correlation and smaller deviations are seen at low-latitude climate zones and longer time-scale accumulation rainfall. From these analyses, we infer that the IRQPE is able to do as good as the CMORPH2 in terms of climate applications, which usually focus more on lower latitude and use data with the time scale above 5-day.
El Niño-Southern Oscillation (ENSO) and the Madden Julian Oscillation (MJO) are the two most important climate variabilities in the intra-seasonal to interannual time scale. IRQPE can be used to track the precipitation variations associated with these climate variabilities. Figure 5 demonstrates the ENSO monitoring applications of the IRQPE. Time evolution of the equatorial wet/dry anomalies derived from the IRQPE for 2018–2021 is presented in Figure 5a. It shows tropical wet anomalies dominate more over Central Pacific before 2020 summer, but the pattern changes in the later years with wet anomalies dominate over the Indian Ocean and Maritime Continent, reflecting that the ENSO state changed from a warm event to a cold event in 2020 (NINO3.4 index and two representative late extended boreal winter season rainfall anomalies in 2019 and 2021 are shown in Figure 5b–d). The tropical rainfall monitoring information is supported by the consistent results from the OLR anomalies (dashed contoured in Figure 5a), which is a common proxy for tropical convection. A further verification of the IRQPE with CMORPH2 based on 10-day rainfall data is shown in Figure 6. The highly correlated rainfall fluctuations from the two datasets support the consistency between the IRQPE and CMORPH2 on monitoring ENSO-associated tropical rainfall variations.
The MJO is the dominant tropical wave and the major source of weather predictability in the intra-seasonal time scale, thus a key component in climate monitoring. Based on EOF analysis, MJO indices consisting of two leading principal components have been widely used for tracking MJO activities. To examine the climate applications of the IRQPE on the MJO phenomena, 5-day precipitation anomalies are computed and regressed against the time series of the MJO second leading mode defined by Chen [27] (Figure 7a). The outcome shows, as expected, the MJO tropical dipole pattern with active (suppressed) convection over the Indian Ocean and suppressed (active) convection over the Maritime Continent, as well as the associated rain band over East Asia, which are all classic MJO-associated rainfall patterns and have been identified with previous MJO studies [27,28]. Replacing the IRQPE by CMORPH2, the regression map (not shown) looks almost the same as Figure 7a. The point-to-point scatter plot from the MJO case days over the tropical area and sub-tropical area (Figure 7b,c) also shows highly consistency between the IRQPE and CMORPH2. These results all support the qualified performance of the IRQPE on MJO applications.
The examinations described in this section demonstrated that despite a simple technique using only the GEO IR data, the IRQPE is capable of generating precipitation estimates with a reasonably high quality for key applications in large-scale weather and climate fields.

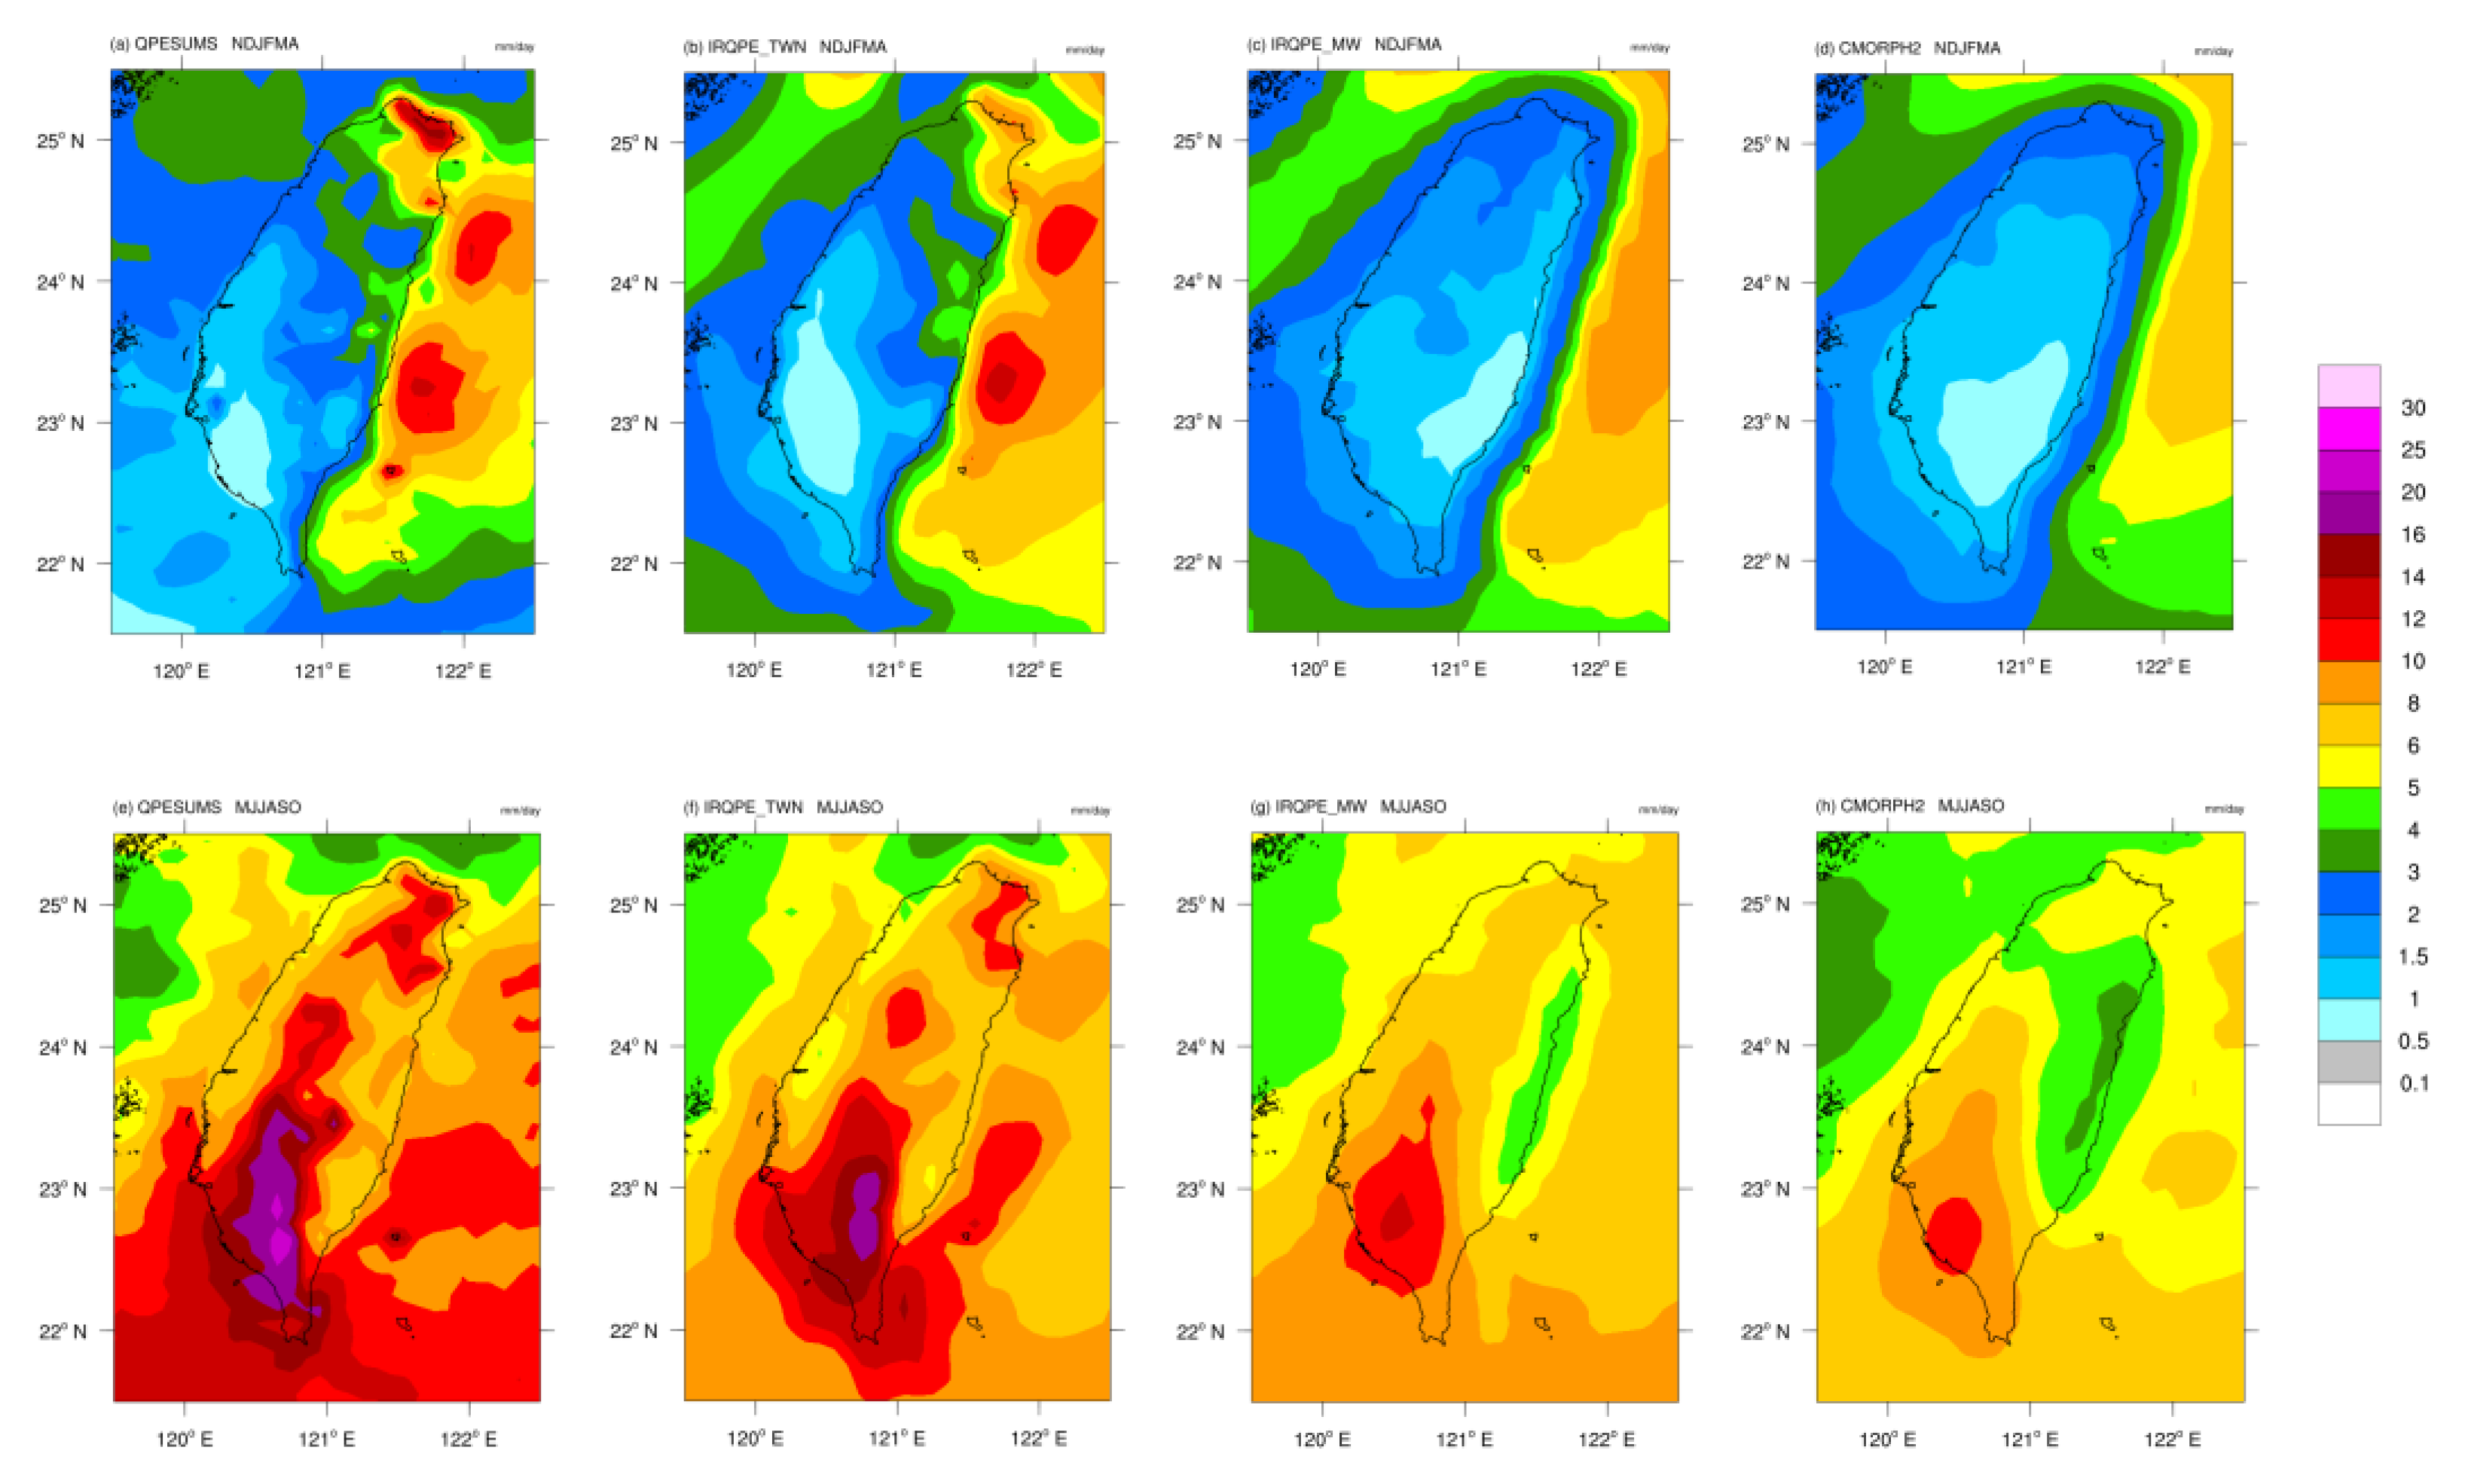
3.2. Regional Improvement of IRQPE

The verification in Section 3.1 is based on the 1 × 1 degree lat/lon grid for examining the climate large-scale application of the IRQPE, but the high-resolution performance of the IRQPE also needs to be examined. A case in the first 10-day on August 2021 is selected as an example for the comparison of data on a 0.1° lat/lon resolution. A quick look shows that the 10-day mean rainfall pattern of the CMORPH2 and IRQPE_V0 is quite similar (Figure 8a,b), showing that the IRQPE_V0 is also able to reflect the regional high-resolution features. However, when it comes to the regional scale, users will have higher expectations on the accuracy for local detailed structures. A regional improvement of the IRQPE focusing on the East Asia region, called the IRQPE_EA, is therefore designed to try the fine-tune. In this regional version, the collocated IR and precipitation data pairs were collected in a smaller spatial domain (change from 0.5° lat/lon gridbox to 0.2° lat/lon gridbox) for constructing the look-up table to increase its ability on resolving inhomogeneous local features, such as those affected by topography or local circulations. The outcome of the IRQPE_EA (Figure 8c) presents a better resemblance to the CMORPH2 than the original IRQPE_V0. This can be further confirmed by the scatter plot comparison between the IRQPE_V0 and the IRQPE_EA against the CMORPH2 (Figure 9), which shows much closer point-to-point agreements for the new regional version. The above results demonstrate that the quality of the IRQPE for high-resolution can be improved by adjusting the sample grouping approach. Another way to improve the IRQPE is to incorporate local surface observations, which is also performed in this study with just focusing on Taiwan area. The IRQPE_TWN will be described in the next section, but here it was also computed and shown in Figure 8d by inserting onto the IRQPE_EA. Figure 8d highlights the abundant torrential rainfall over south Taiwan in the mountain area, which is obviously underestimated by the CMORPH2. This shows that the CMORPH2 (fundamentally the MWCOMB2x, or the level 2 PMW retrievals infused into them) is not necessary a “truth” over places with very complicated topography, such as the Taiwan area. The comparison here is on a product-to-product basis, a further step will next verify the improvement of the IRQPE_EA.
Comparing the IRQPE with CMORPH2 is on a product-to-product basis. It does have a shortcoming when the truth is not necessary on the CMORPH2 side. To verify the improvement of the IRQPE_EA, we can compare the IRQPE directly with the MWCOMB2x, which was defined as “truth” when producing the IRQPE. Figure 10a,b shows the point-to-point correlation between the MWCOMB2x and the two versions of the IRQPE from data during August 2019–2021. The comparison now is based on a fitting concept. The higher correlation means the IRQPE more closely fits the truth. Comparing the two correlation maps in Figure 10a,b, as well as the frequency distribution of their difference in Figure 10c, supports the effective improvement of the IRQPE_EA by adopting a smaller sampling unit.

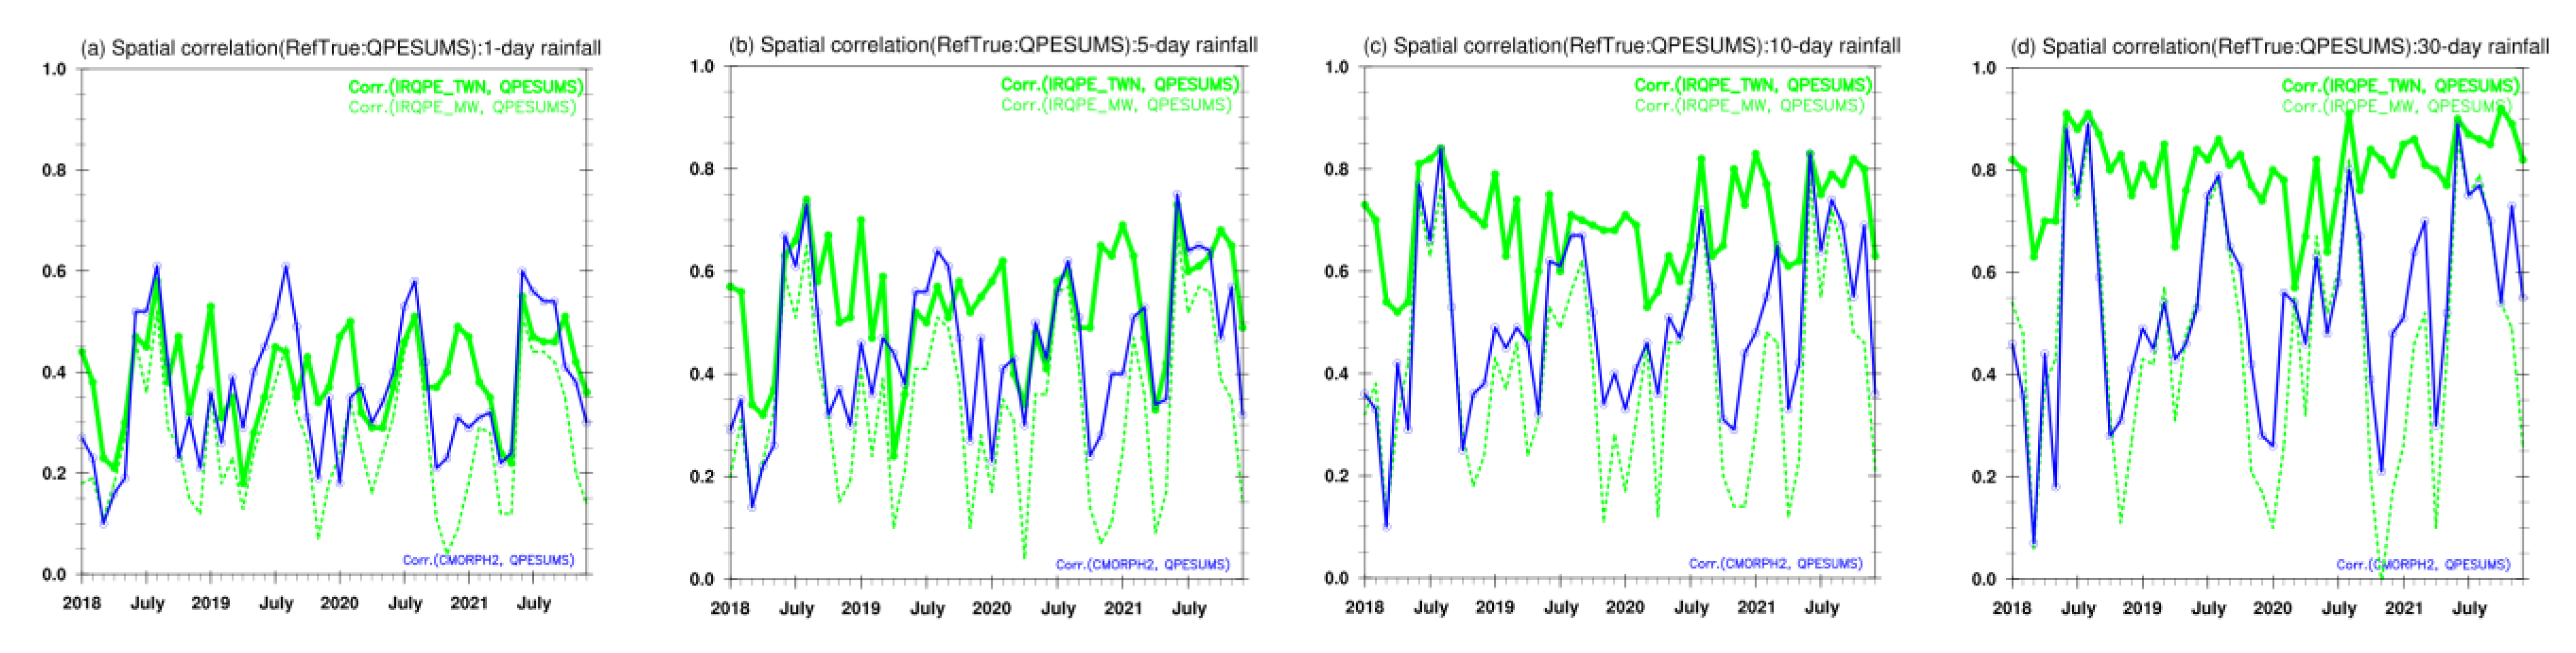
3.3. Improvements of IRQPE over Taiwan Region by Incorporating Local Surface Data

This section introduces another regional improvement of the IRQPE by incorporating local surface data as the calibrators. PMW retrievals have been recognized to perform much less well over land area than ocean, especially for the areas with complex topography. We take advantage of the high quality and high density of Taiwan surface observations to replace the MWCOMB2x as the reference truth in building the look-up tables for transferring the IR TBB measurements to precipitation. The local surface observations provide rainfall measurements of much higher quality than the MWCOMB2x. Moreover, the surface observations have more data samples for building the cloud–precipitation relationship using data over a narrower time/space domain. This local version IRQPE_TWN was designed by grouping the look-up table in 0.1 × 0.1 lat/lon gridbox, higher than the IRQPE_V0 (in 0.5° lat/lon gridbox) and IRQPE_EA (in 0.2° lat/lon gridbox). As shown in Section 3.2, a finer resolution in the look-up table can help better reveal the fine local rain pattern structure. The performance of the IRQPE_TWN will be verified with QPESUMS, the gauge-corrected radar precipitation estimates. In order to show the improvement by incorporating local surface data, a version named the IRQPE_MW was also performed with the same design as the IRQPE_TWN, but using the MWCOMB2x as the reference truth in building the look-up tables. The CMORPH2, the integrated PMW product, is also compared.
We start the comparison with an inspection on the 4-year mean precipitation derived from the various products. The 4-year mean rain maps in the cold season (NDJFMA) and warm season (MJJASO) for the QPESUMS, IRQPE_TWN, IRQPE_MW, CMORPH2 are shown in Figure 11. The maps show that only the IRQPE_TWN (Figure 11b,f) can resemble the detailed rainfall pattern as the QPESUMS (Figure 11a,e). The IRPQE_TWN is able to highlight the winter significant torrential rainfall caused by the northern monsoon over northern Taiwan and the dry leeside part over the southwest, as well as the summer torrential extremes. The IRQPE_MW (Figure 11c,g) more resembles the CMORPH2(Figure 11d,h), both have better performance in summer than in winter. The comparison of monthly mean rainfall for all Taiwan land areas is shown in Figure 12, again showing the IRQPE_TWN is closer to the QPESUMS and is improved compared to the IRQPE_MW for each month in terms of quantity measurements.
Performance of the IRQPE_TWN on data variation from a daily to monthly time scale is further checked. Spatial correlation was computed over the Taiwan land area with reference to the ground truth QPESUMS. For daily variation (Figure 13a), the IRQPE_TWN shows comparable performance with the CMORPH2 in the summer wet season, while outperforming the CMORPH2 in the winter cold season. When the rainfall accumulation time scale is over 5 days (Figure 13b–d), the IRQPE_TWN shows higher correlation than the IRQPE_MW and CMORPH2 for all seasons. Notice the outperformance is clearer in the longer time scale. Another evaluation was performed by examining the root mean square error (RMSE) for the Taiwan land rainfall as the whole (Figure 14). Radar QPE is also included in the comparison for serving as a benchmark reference for the satellite estimates. Again, the comparison shows the IRQPE_TWN performs better in the longer time scale. For daily rainfall (Figure 14a), the IRQPE_TWN has larger RMSE than the IRQPE_MW and CMORPH2. For 5-day accumulation rainfall (Figure 14b), the IRQPE_TWN has shown comparable RMSE with another two satellite estimates. When it comes to 10-day accumulation rainfall (Figure 14c), the IRQPE_TWN clearly outperforms the other two satellite estimates and is closer to the performance of Radar QPE. For monthly mean, the RMSE of the IRQPE_TWN is almost the same as Radar QPE.

4. Conclusions and Discussion

Precipitation observed from space is changing from estimating to measurement when entering the GPM era. MW-based estimates such as the IMERG, CMORPH, and GSMaP are the current main satellite precipitation estimates products. Nevertheless, the regional data quality is still questioned for these state-of-the-art high-resolution global gridded rainfall datasets. In this study, we have shown that the IRQPE has the comparable quality with the CMORPH2 in describing the large-scale climate rainfall variabilities. The PDF-matching approach for establishing the cloud–precipitation relationship is simple but quite effective for producing reasonable IR-based precipitation estimates for an operational need. With the regional improvement of the IRQPE by incorporating local surface rainfall observations, the IR-based GEO precipitation estimates can better capture local orographic rainfall. These all suggest the potential applicability of the IRQPE in the large-scale climate monitoring, as well as the regional applications.
To refine the calibration using data over a smaller domain to better reflect regional variations in the cloud–precipitation relationship will be our continuous work. However, realization of such a calibration requires that the calibrator needs to present reasonable quality in representing the regional precipitation variations and at a fine time/space resolution [29]. Over the island of Taiwan and its adjacent oceans, radar estimation of precipitation serves this purpose very well, as shown in our experiments, as a calibrator. However, over other portions of the broad H8 domain, no such high-quality and high-resolution precipitation data, other than satellite-based PMW retrievals such as the MWCOMB, are available. In our future work, we will explore how we may take advantage of the MWCOMB to calibrate the GEO IR data to better reflect the temporal/spatial variations of the cloud–precipitation relationship.
The primary purpose of this paper is to describe the development, verification, and applications of the IRQPE precipitation estimation products. In this paper, comparison was conducted against the CMORPH2 products because our IRQPE is calibrated against the MWCOMB2x which is the backbone of CMORPH2. A comparison against the MWCOMB2x and CMORPH2 provides us with insight on to what extent a technique using GEO IR data only may achieve and to what extent the degraded performance may be attributable to the limited information content from the IR and the imperfect calibrator (MWCOMB2x), respectively. Inter-comparison of our products to other satellite-based precipitation estimates, such as the integrated satellite products (e.g., IMERG, GSMaP) and other GEO IR-based data sets (e.g., Hydro-Estimator, PERSIANN), provides an insight into how we may benefit from each other’s work. We will perform the inter-comparison as a follow-up work.
Our work described in this paper demonstrated the usefulness of an IR-based precipitation estimation product for operational applications of weather and climate. Weaknesses, however, exist. First, the IRQPE is based on an empirical local relationship between the cloud and the precipitation. Results achieved in this study, and from other published work, have shown that empirical approximation of the relationship will result in compromised performance for the IR-based technique to detect and quantify extreme precipitation over regions with a rapidly changing cloud–precipitation relationship, such as over the mountainous regions. Secondly, in this study, only cloud top temperature (TBB) is used to reflect the characteristics of precipitating clouds. While this is a reasonable assumption on the first order, the intensity of precipitation is a result of complicated dynamic, thermodynamic, and physical processes that are even a big challenge to be simulated with a modern-era numerical model. In the future, we will explore a strategy to better represent the precipitating clouds by infusing other satellites observed (e.g., water vapor) and models simulated (e.g., moisture flux, atmospheric instability). Thirdly, a calibrator used to establish the cloud–precipitation relationship also needs to be re-examined. In this study, we have already demonstrated the benefits of using surface observations to replace the satellite PMW-based MWCOMB. We will continue the work in this front to work out a better mixture of gauge data, radar estimates, and the MWCOMB as the calibrator over the entire target domain.

Author Contributions

Conceptualization, P.X.; Formal analysis, Y.-L.C.; Methodology, P.X. and Y.-L.C.; Project administration, C.-R.C.; Resources, C.-R.C.; Software, P.X.; Visualization, Y.-L.C.; Writing—original draft, Y.-L.C.; Writing—review and editing, C.-R.C. and P.X. All authors have read and agreed to the published version of the manuscript.

Funding

This research received no external funding.

Data Availability Statement

The CMORPH2 and MWCOMB2x data used in this study are provided by NOAA CPC through bi-lateral collaborations, the H8 TBB data is from JMA and Taiwan local surface rainfall observations are from the CWB operational system.

Acknowledgments

The authors wish to thank Yu-Ching Liu and Guan-Bo Wu for helping with the data preparation for producing IRQPE.

Conflicts of Interest

The authors declare no conflict of interest.

References

  1. Arkin, P.A.; Meisner, B.N. The Relationship between Large Scale Convective Rainfall and Cold Cloud over the Western Hemisphere during1982–1984. Mon. Weather Rev. 1979, 106, 1153–1171. [Google Scholar]
  2. Arkin, P.A.; Ardanuy, P.E. Estimating climatic-scale precipitation from space: A review. J. Clim. 1989, 2, 1229–1238. [Google Scholar] [CrossRef]
  3. Huffman, G.J.; Adler, R.F.; Arkin, P.A.; Chang, A.; Ferraro, R.; Gruber, A.; Janowiak, J.; McNab, A.; Rudolf, B.; Schneider, U. The global precipitation climatology project (GPCP) combined precipitation dataset. Bull. Am. Meteorol. Soc. 1997, 78, 5–20. [Google Scholar] [CrossRef]
  4. Arkin, P.A. The relationship between fractional coverage of high cloud and rainfall accumulations during GATE over the B-scale array. Mon. Weather Rev. 1987, 115, 51–74. [Google Scholar] [CrossRef]
  5. Adler, R.F.; Negri, A.J. A satellite infrared technique to estimate tropical convective and stratiform rainfall. J. Appl. Meteorol. 1988, 27, 30–51. [Google Scholar] [CrossRef]
  6. Vicente, G.A. Hourly Retrieval of Precipitation Rate from the Combination of Passive Microwave and Infrared Satellite Radiometric Measurements. Ph.D. Thesis, Department of Atmospheric and Oceanic Sciences, University of Wisconsin, Madison, WI, USA, 1994. [Google Scholar]
  7. Liu, G.; Curry, J.A.; Sheu, R.S. Classification of clouds over the western equatorial Pacific Ocean using combined infrared and microwave satellite data. J. Geophys. Res. 1995, 100D, 13811–13826. [Google Scholar] [CrossRef]
  8. Kuligowski, R.J.; Li, Y.; Hao, Y.; Zhang, Y. Improvements to the GOES-R rainfall rate algorithm. J. Hydrometeorol. 2016, 17, 1693–1704. [Google Scholar] [CrossRef]
  9. Hsu, K.; Gao, X.; Sorooshian, S.; Gupta, H.V. Precipitation estimation from remotely sensed information using artificial neural networks. J. Appl. Meteorol. Clim. 1997, 36, 1176–1190. [Google Scholar] [CrossRef]
  10. Nguyen, P.; Ombadi, M.; Sorooshian, S.; Hsu, K.; Agha Kouchak, A.; Brathwaite, D.; Ashouri, H.; Thorstensen, A.R. The PERSIANN family of global satellite precipitation data: A review and evaluation of products. Hydrol. Earth Syst. Sci. 2018, 22, 5801–5816. [Google Scholar] [CrossRef]
  11. Kuligowski, R.J. A self-calibrating real-time GOES rainfall algorithm for short-term rainfall estimates. J. Hydrometeorol. 2002, 3, 112–130. [Google Scholar] [CrossRef]
  12. Turk, J.T.; Mostovoy, G.V.; Anantharaj, V. The NRL-Blend High Resolution Precipitation Product and Its Application to Land Surface Hydrology. In Satellite Rainfall Applications for Surface Hydrology; Springer: Dordrecht, The Netherlands, 2010; pp. 85–104. [Google Scholar]
  13. Todd, M.C.; Kidd, C.; Kniveton, D.; Bellerby, T.J. A combined satellite infrared and passive microwave technique for estimation of small-scale rainfall. J. Atmos. Oceanic Technol. 2001, 18, 742–755. [Google Scholar] [CrossRef]
  14. Kirstetter, P.E.; Karbalaee, N.; Hsu, K.; Hong, Y. Probabilistic precipitation rate estimates with space-based infrared sensors. Q. J. R. Meteorol. Soc. 2018, 144, 191–205. [Google Scholar] [CrossRef]
  15. D’Adderio, L.P.; Puca, S.; Vulpiani, G.; Petracca, M.; Sanò, P.; Dietrich, S. RAINBOW: An Operational Oriented Combined IR-Algorithm. Remote Sens. 2020, 12, 2444. [Google Scholar] [CrossRef]
  16. Hsu, K.-L.; Karbalee, N.; Braithwaite, D. Improving PERSIANN-CCS Using Passive Microwave Rainfall Estimation. In Satellite Precipitation Measurement; Levizzani, V., Kidd, C., Kirschbaum, D.B., Kummerow, C.D., Nakamura, K., Turk, F.J., Eds.; Advances in Global Change Research; Springer International Publishing: Cham, Switzerland, 2020; Volume 67, pp. 375–391. [Google Scholar]
  17. Ferraro, R.R. SSM/I derived global rainfall estimates for climatological applications. J. Geophys. Res. 1997, 102, 16715–16735. [Google Scholar] [CrossRef]
  18. Boukabara, S.A.; Garrett, K.; Chen, W.C.; Iturbide-Sanchez, F.; Grassotti, C.; Kongoli, C.; Chen, R.Y.; Liu, Q.H.; Yan, B.; Weng, F.Z.; et al. MiRS: An All-Weather 1DVAR Satellite Data Assimilation and Retrieval System. IEEE Trans. Geosci. Rem. Sens. 2011, 49, 3249–3272. [Google Scholar] [CrossRef]
  19. Kummerow, C.D.; Randel, D.L.; Kulie, M.; Wang, N.; Ferraro, R.; Joseph Munchak, S.; Petković, V. The evolution of the Goddard profiling algorithm to a fully parametric scheme. J. Atmos. Ocean. Technol. 2015, 32, 2265–2280. [Google Scholar] [CrossRef]
  20. Joyce, R.J.; Janowiak, J.E.; Phillip, A.A.; Xie, P. CMORPH: A Method that Produces Global Precipitation Estimates from Passive Microwave and Infrared Data at High Spatial and Temporal Resolution. J. Hydrometeorol. 2004, 5, 487–503. [Google Scholar] [CrossRef]
  21. Xie, P.; Joyce, R.J.; Wu, S.; Yoo, S.H.; Yarosh, Y.; Sun, F.; Lin, R. Reprocessed, bias-corrected CMORPH global high-resolution precipitation estimates from 1998. J. Hydrometeorol. 2017, 18, 1617–1641. [Google Scholar] [CrossRef]
  22. Huffman, G.J.; Bolvin, D.T.; Nelkin, E.J.; Wolff, D.B.; Adler, R.F.; Gu, G.; Hong, Y.; Bowman, K.P.; Stocker, E.F. The TRMM Multisatellite Precipitation Analysis (TMPA): Quasi-global, multiyear, combined-sensor precipitation estimates at fine scales. J. Hydrometeorol. 2007, 8, 38–55. [Google Scholar] [CrossRef]
  23. Huffman, G.J.; Bolvin, D.T.; Braithwaite, D.; Hsu, K.; Joyce, R.; Kidd, C.; Nelkin, E.J.; Xie, P. NASA Global Precipitation Measurement (GPM) Integrated Multi-SatellitE Retrievals for GPM (IMERG); Algorithm Theoretical Basis Document (ATBD); NASA/GSFC: Greenbelt, MD, USA, 2014. [Google Scholar]
  24. Kubota, T.; Aonashi, K.; Kachi, M.; Ushio, T.; Shige, S.; Takayaby, Y.N.; Oki, R. Global satellite mapping of precipitation (GSMaP). In Satellite Precipitation Measurement; Springer: Cham, Switzerland, 2020. [Google Scholar]
  25. Xie, P.; Joyce, R.; Wu, S. Second Generation CMORPH: Real-time production. In Proceedings of the 2018 AGU Fall Meetings, Washington, DC, USA, 10–14 December 2018. [Google Scholar]
  26. Chang, P.-L.; Zhang, J.; Tang, Y.-S.; Tang, L.; Lin, P.-F.; Langston, C.; Kaney, B.; Chen, C.-R.; Howard, K. An Operational Multi-Radar Multi-Sensor QPE System in Taiwan. Bull. Am. Meteorol. Soc. 2021, 102, E555–E577. [Google Scholar] [CrossRef]
  27. Chen, Y.L.; Sui, C.H.; Chang, C.P.; Tseng, K.C. Effect of the MJO on East Asian winter rainfall as revealed by an SVD analysis. J. Clim. 2021, 34, 9729–9746. [Google Scholar] [CrossRef]
  28. He, J.; Lin, H.; Wu, Z. Another look at influences of the Madden-Julian Oscillation on the wintertime East Asian weather. J. Geophys. Res. Atmos. 2011, 116, D03109. [Google Scholar] [CrossRef]
  29. Upadhyaya, S.A.; Kirstetter, P.E.; Gourley, J.J.; Kuligowski, R.J. On the Propagation of Satellite Precipitation Estimation Errors: From Passive Microwave to Infrared Estimates. Estimates. J. Hydrometeorol. 2020, 21, 1367–1381. [Google Scholar] [CrossRef] [PubMed]
Figure 1. A rain map comparison by a selected case on 24 July 2021 0000Z. (a) MWCOMB2x, (b) CMORPH2, (c) IRQPE. The area with missing value (no data) was colored in deep gray.
Atmosphere 14 00342 g001
Figure 2. Four-year (top) DJF and (bottom) JJA seasonal mean: IRQPE (a,d), CMORPH2 (b,e), and the difference of the two datasets (c,f).
Atmosphere 14 00342 g002
Figure 3. The spatial correlation (monthly mean: curve, standard deviation: shaded) for 4-time scales (1-day, 5-day, 10-day, 30-day) rainfall accumulation between IRQPE and CMORPH2 over Asia-Pacific (40° S–50° N, 80° E–160° W) on a spatial resolution of 1° lat/lon.
Atmosphere 14 00342 g003
Figure 4. The point-to-point scatter plot for IRQPE and CMORPH2 over 80° E–160° W in 3 latitudinal bands: From left to right: 30-day rainfall, 10-day rainfall, 5-day rainfall. From top to bottom: mid-latitude (30° N–50° N), sub-tropic (10° N–30° N), tropics (10° S–10° N).
Atmosphere 14 00342 g004
Figure 5. IRQPE application for ENSO. (a) Time-longitude cross sections of IRQPE anomaly (colored, unit: mm/day) and OLR anomaly (dash contoured, only for negative value below −5 W/m2) over 15° S–15° N (b) Monthly NINO3.4 ENSO index. (c,d) Seasonal anomaly of IRQPE for late extended boreal winter season (January~March) in 2019 and 2021, respectively.
Atmosphere 14 00342 g005
Figure 6. The consistency of IRQPE (solid lines) and CMORPH2 (dashed lines) on monitoring ENSO tropical rainfall anomalies. The red curve presents the mean rainfall value over 90° E–140° E. The blue curve presents the mean rainfall value over 150° E–160° W. The black curve presents the correlation between the two datasets over the whole tropical band from 80° E–160° W.
Atmosphere 14 00342 g006
Figure 7. IRQPE application for MJO. (a) IRQPE regresses on MJO PC2 for DJFM season on a 5-day basis. (b,c) The point-to-point scatter plot from IRQPE and CMORPH2 for MJO days over Tropics and EA region (shown in (a)).
Atmosphere 14 00342 g007
Figure 8. Ten-day mean rainfall for 1–10 AUG 2021 from (a) CMORPH2, (b) IRQPE_V0, the original version, (c) IRQPE_EA, the version changes the look-up table in 0.2° lat/lon gridbox. (d) IRQPE_EATWN, merging IRQPE_EA with IRQPE_TWN.
Atmosphere 14 00342 g008
Figure 9. The point-to-point scatter plot for IRQPE and CMORPH2 over 20° N–30° N, 115° E–125° E on a spatial resolution of 0.1° lat/lon. (a,b) IRQPE_V0. (c,d) IRQPE_EA. Notice that (a,c) are on a 5-day basis data comparison. (b,d) are on a 1-day basis data comparison.
Atmosphere 14 00342 g009aAtmosphere 14 00342 g009b
Figure 10. Point-to-point correlation between IRQPE and MWCOMB2x from data during August 2019–2021 on a spatial resolution of 0.05° lat/lon. (a) IRQPE_V0. (b) IRQPE_EA. (c) Frequency distribution of the grid points from the difference of the 2 correlation maps in (a,b).
Atmosphere 14 00342 g010
Figure 11. The 4-year mean rain map over Taiwan area for (top) cold season (NDJFMA) and (bottom) warm season (MJJASO). (a,e) QPESUMS, (b,f) IRQPE_TWN, (c,g) IRQPE_MW, (d,h) CMORPH2.
Atmosphere 14 00342 g011
Figure 12. The monthly mean rainfall for Taiwan land area from 3 satellite precipitation estimates (solid green: IRQPE_TWN, dashed green: IRQPE_MW, blue: CMORPH2) and the reference ground truth (black: QPESUMS).
Atmosphere 14 00342 g012
Figure 13. The spatial correlation with the ground truth (QPESUMS) from IRQPE (solid green: IRQPE_TWN, dashed green: IRQPE_MW) and CMORPH2 (blue) for 4-time scale data: (a) 1-day, (b) 5-day, (c) 10-day, (d) 30-day.
Atmosphere 14 00342 g013
Figure 14. The RMSE derived from comparing with QPESUMS for IRQPE (solid green: IRQPE_TWN, dashed green: IRQPE_MW) and CMORPH2 (blue) for 4-time scale data: (a) 1-day, (b) 5-day, (c) 10-day, (d) 30-day. Radar rainfall estimates is also compared (dashed black).
Atmosphere 14 00342 g014
Table 1. The mean correlation coefficients between IRQPE and CMORPH2 for 3 latitudinal bands and 4-time scales in 4 seasons based on the period of 2018–2021. The 3 latitudinal bands are Tropics (10° S–10° N), Sub-Tropics (10° N–30° N), and Mid-Latitude (30° N–50° N).
30-Day RainfallTropicsSub-TropicsMid-Latitude
JFM0.9620.9280.929
AMJ0.9620.9700.925
JAS0.9750.9700.969
OND0.9740.9720.937
10-day rainfallTropicsSub-TropicsMid-Latitude
JFM0.9360.8910.851
AMJ0.9390.9390.872
JAS0.9430.9450.929
OND0.9440.9480.874
5-day rainfallTropicsSub-TropicsMid-Latitude
JFM0.9040.8530.762
AMJ0.9190.9130.819
JAS0.9160.9210.890
OND0.9200.9250.809
1-day rainfallTropicsSub-TropicsMid-Latitude
JFM0.8710.7920.711
AMJ0.8880.8610.758
JAS0.8860.8810.837
OND0.8890.8930.754
Disclaimer/Publisher’s Note: The statements, opinions and data contained in all publications are solely those of the individual author(s) and contributor(s) and not of MDPI and/or the editor(s). MDPI and/or the editor(s) disclaim responsibility for any injury to people or property resulting from any ideas, methods, instructions or products referred to in the content.

