1. Introduction
Precipitation from the Meiyu (monsoon) season in Taiwan represents one of the plentiful natural water resources on the island. Each year, an average of four to five cold fronts that constitute the Meiyu rainband affect Taiwan, producing intense rainfall with occasional flooding and landslide events. Being able to predict the arrival (onset), duration, and intensity of each Meiyu season accurately is valuable for water resource planning and disaster prevention. Furthermore, subseasonal prediction of the Meiyu onset can provide a tangible decision plan between water release and retention, further contributing to agricultural and industrial water management.
The Meiyu onset, or the arrival of the East Asian summer monsoon (EASM), has been studied extensively based on a variety of meteorological variables, including low-level circulation (Chen [
1]; Kueh and Lin [
2]; Hsu et al. [
3]; Hung and Hsu [
4]) or wind fields (Yan [
5]; Wang et al. [
6,
7]), cumulus convection activity (Tanaka [
8]; Lau and Yang [
9]), and a combination of wind and convective features (Chang and Chen [
10]; Wang and Wu [
11]; Lu [
12]; Xie et al. [
13]; Chen et al. [
14]). However, studies focusing on the interplay between the broad-scale EASM and Taiwan’s Meiyu onset are few and inconsistent. For example, Lu [
12] found that Taiwan’s Meiyu season tends to be drier (wetter) if the South China Sea monsoon onset starts earlier (later), but this tendency only exists in May. Wang and Chen [
15] found that the activity of traveling mesoscale convective systems in the South China Sea can be a precursor for the active Meiyu rainfall in Taiwan. A later study by Chen [
1] redefined the Meiyu precipitation onset based on the South China Sea’s monsoon circulation and development. Yet that definition does not reveal the flow characteristics that are associated with the transition from the winter monsoon regime to the summer monsoon regime. A later modification made by the Central Weather Bureau (CWB) forecasters incorporates vertical and horizontal wind shears near Taiwan to help depict the large-scale circulation features that are associated with the Meiyu onset. The rationale for using wind shear is that as the vertical shear changes and the change coexists with the horizontal shear reversal at the lower levels (i.e., from being anticyclonic to cyclonic), the environment in the vicinity of Taiwan becomes dynamically unstable due to increased cyclonic vorticity. By coupling this shear-based consideration with the convection-based Meiyu onset index, forecasting heavy rainfall in and near Taiwan became more accurate.
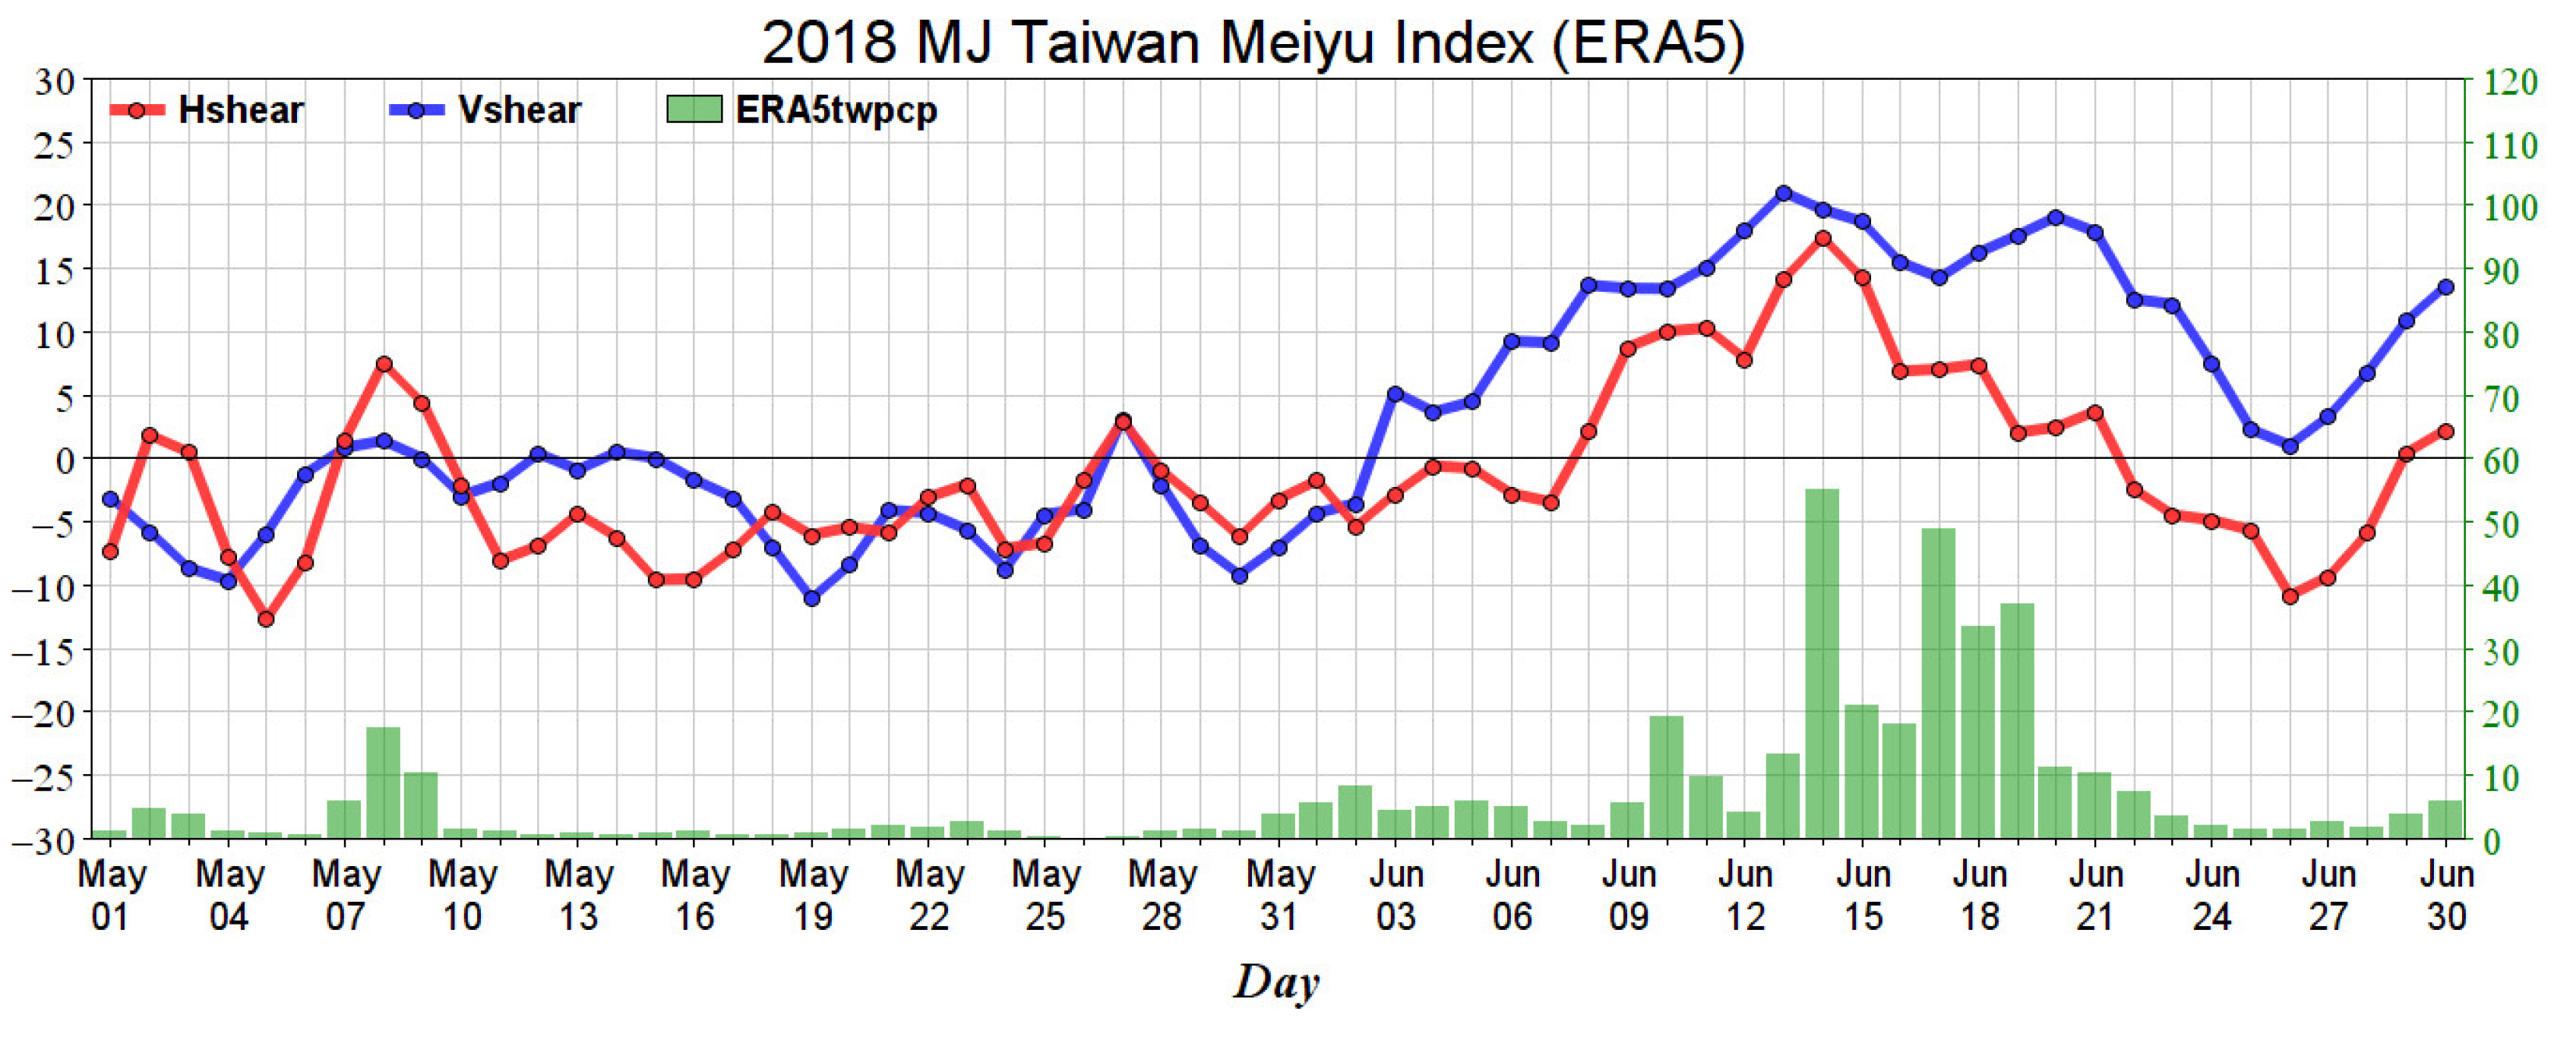
The CWB has adopted this modified Meiyu onset index for several years and discovered that, despite its noticeable improvement, the index tends to predict too early of a Meiyu onset. For example, as shown in
Figure 1 for the Meiyu season of 2018, the modified index indicates 7 May as the onset. Still, precipitation data in Taiwan and two other wind-shear indexes suggest that the actual Meiyu onset should be 9 June, a month later. Therefore, in this study, we further examined and modified this meteorological index to improve its depiction of the Meiyu onset and report the results herein.
2. Data and the Source of Precipitation
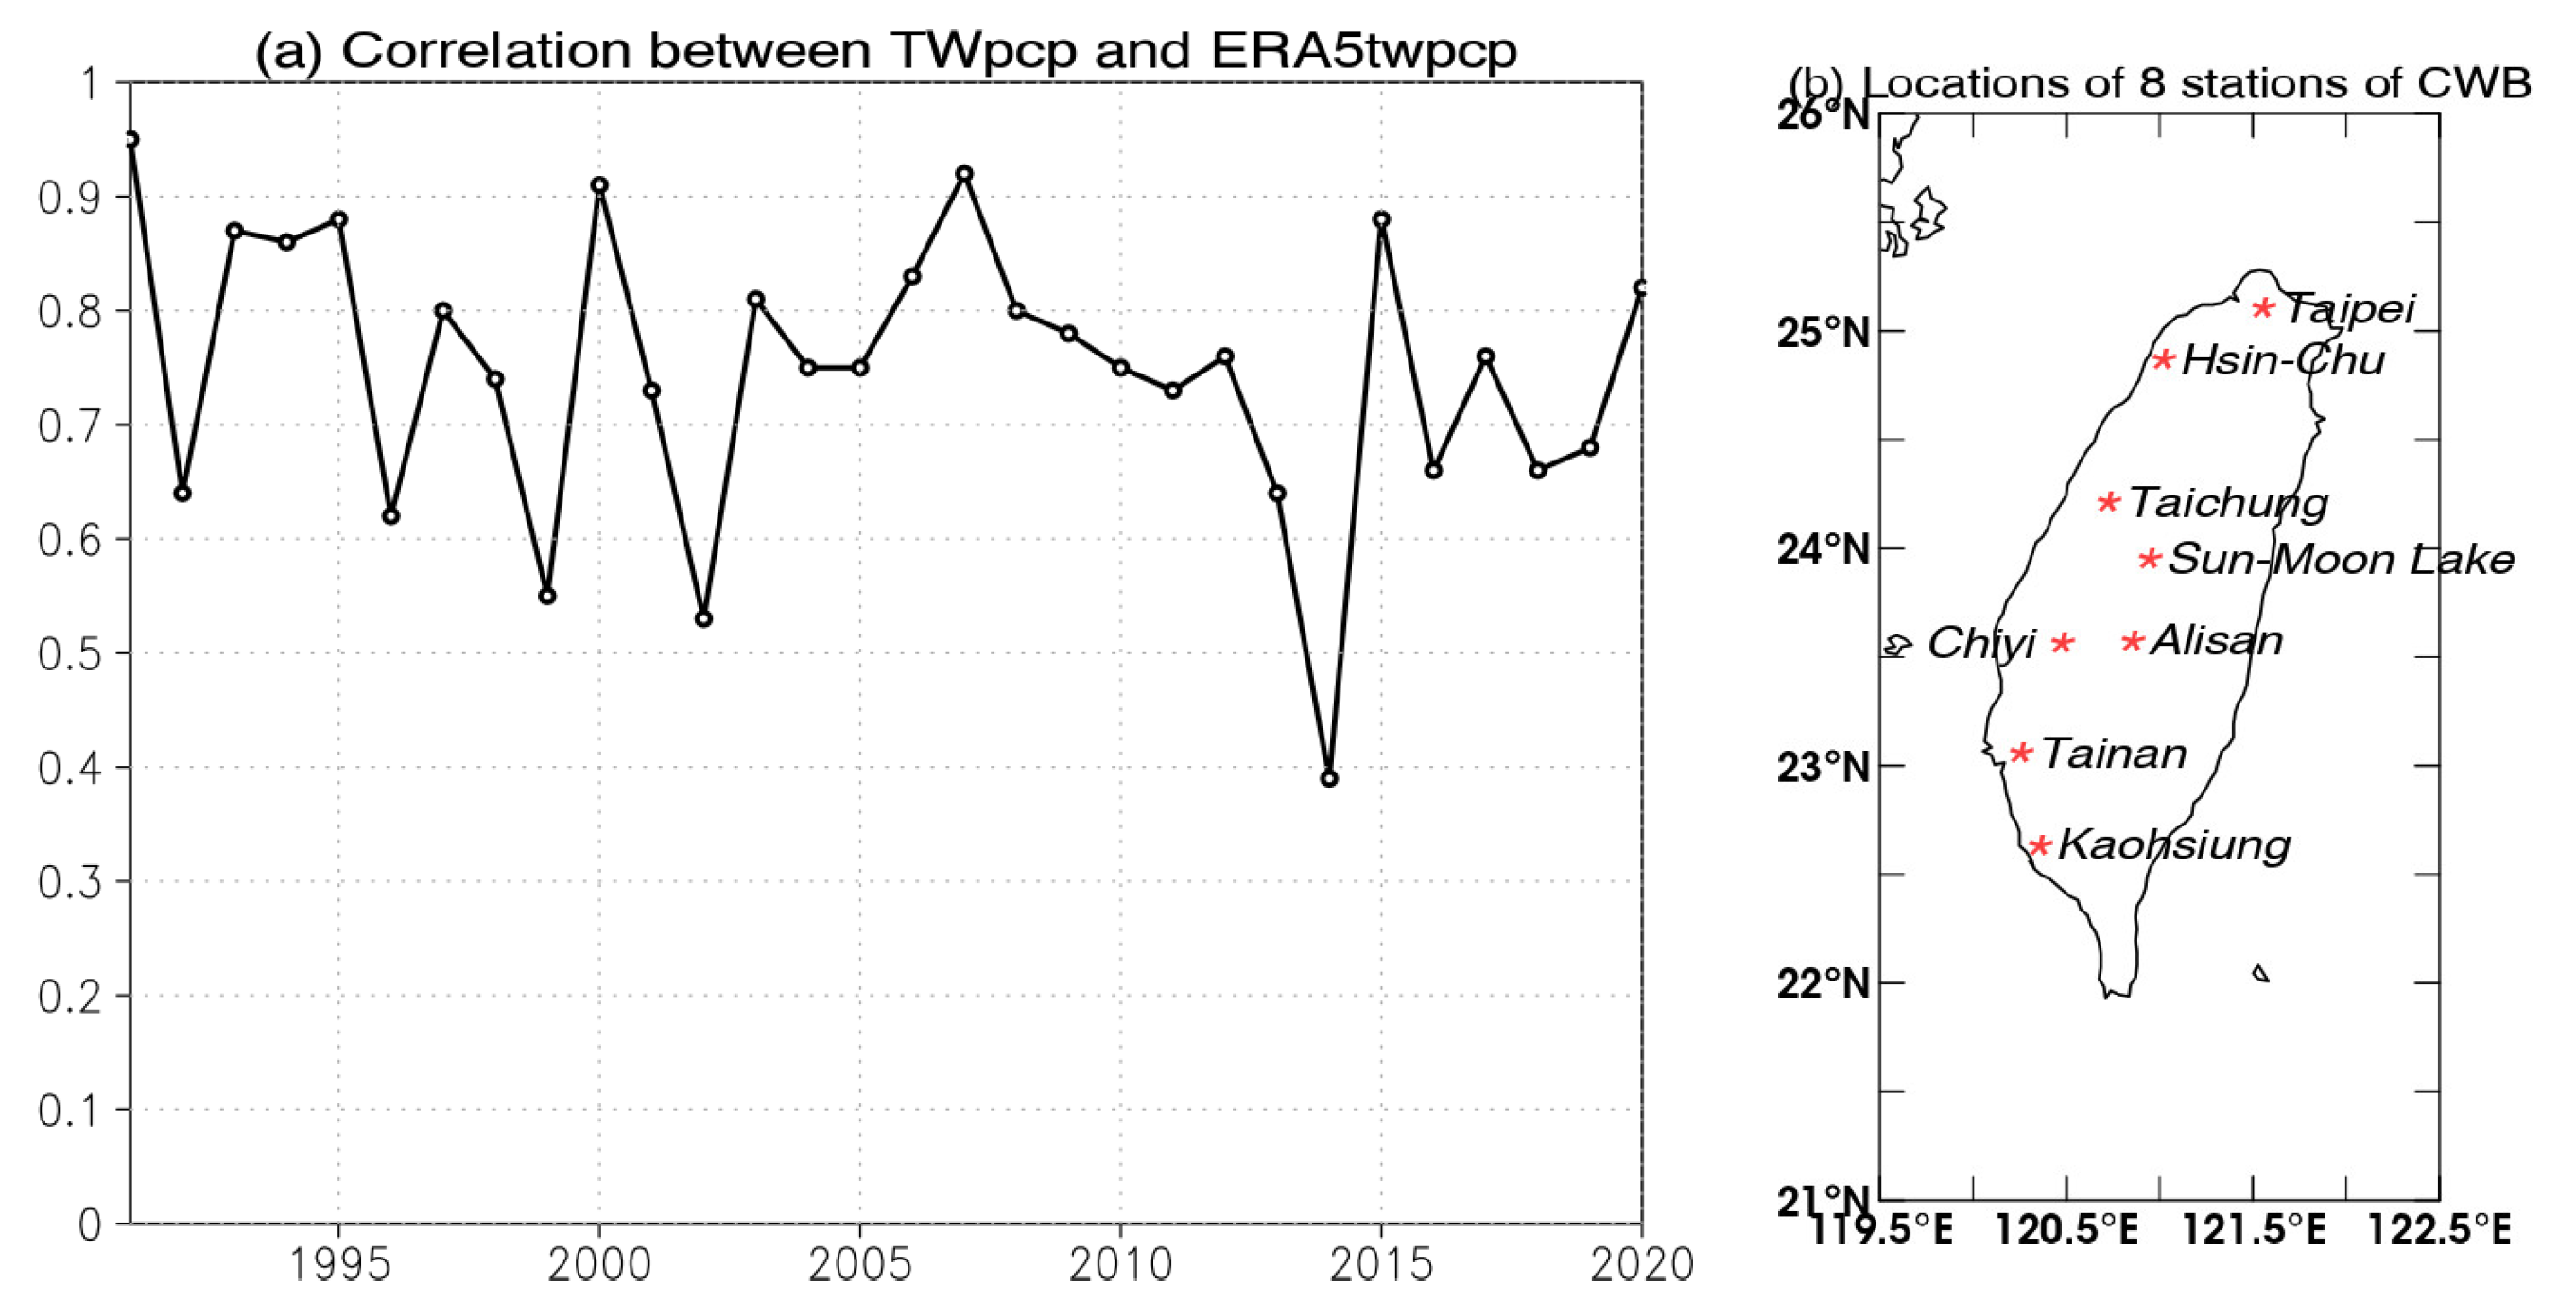
This study utilizes eight conventional stations of CWB with their daily precipitation data, the locations of which are: Taipei, Hsin-Chu, Taichung, Sun-Moon Lake, Chiyi, Alisan, Tainan, and Kaoshiung (
Figure 2b). We also used daily data for the ECMWF Reanalysis V5 (ERA5; Hersbach et al. [
16]) to depict the large-scale circulation. Using ERA5 also represents an improvement over Chen [
1]’s use of NCEP/NCAR reanalysis data. For the regional precipitation, we also included the Global Precipitation Climatology Project (GPCP) daily precipitation data (Huffman et al. [
17]).
We note that using ERA5 precipitation data can enhance the depiction of the whole-Taiwan rainfall, even better than using the few stations alone. Here is why:
Figure 2a shows the yearly correlation coefficients between the ERA5 precipitation over Taiwan (120° E–122° E, 21.5° N–26° N; ERA5twpcp) vs. the eight-station rain average (TWpcp) from 1 May to 30 June year by year from 1991 to 2020. The correlation coefficients vary, with a maximum of 0.95 in 1991 and a minimum of 0.4 in 2014, but overall are stable—with a mean of ~0.75. As shown in
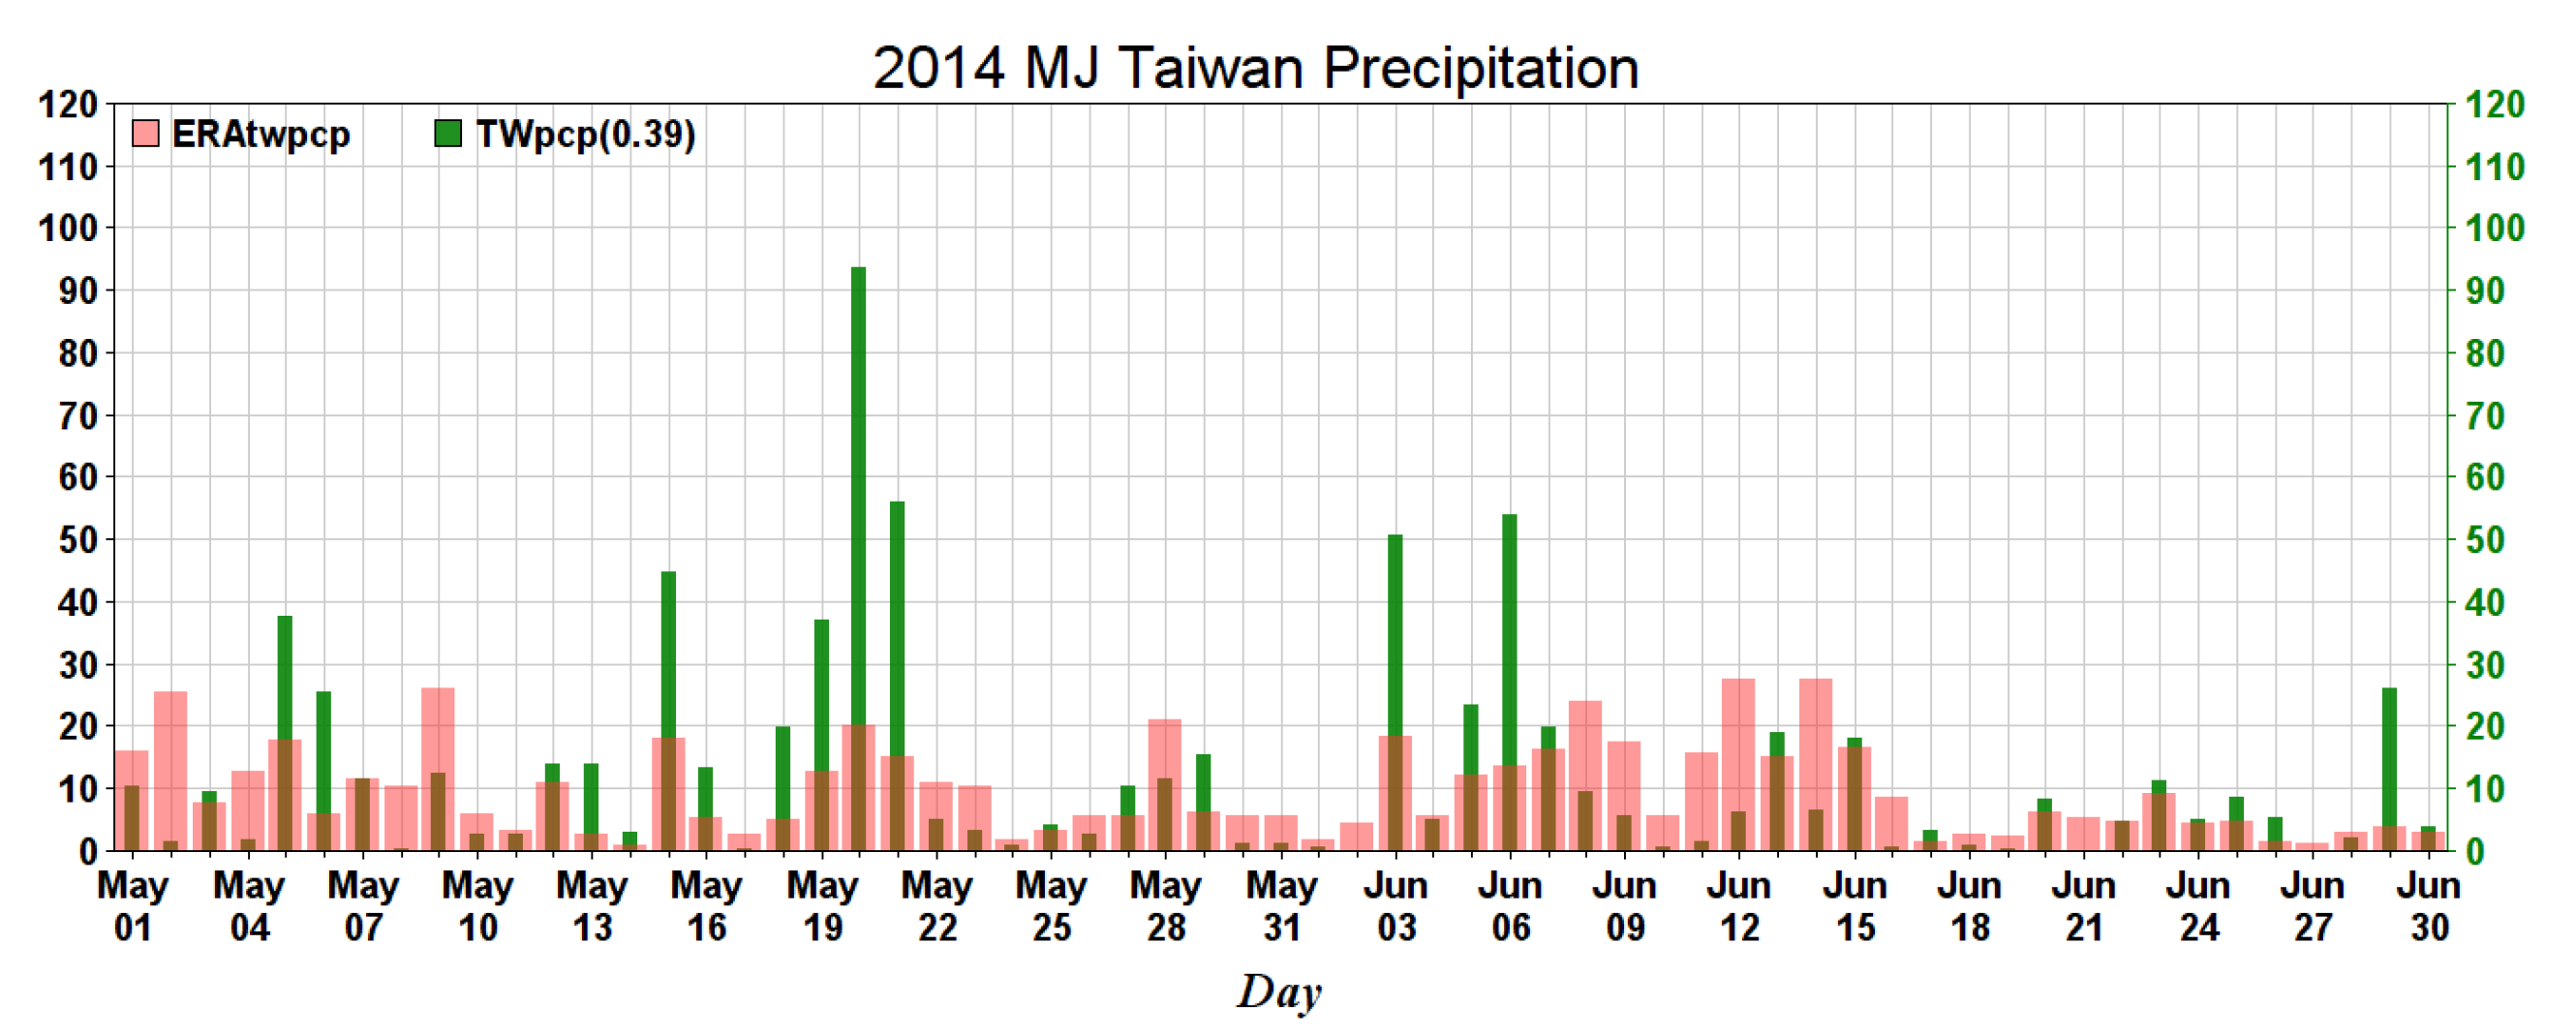
Figure 3, the ERA5 and station precipitation series are very different, with ERA5 showing the maximum precipitation from 3 to 15 June while the stations show the maximum precipitation on 20 May. Based on the spatial precipitation pattern (
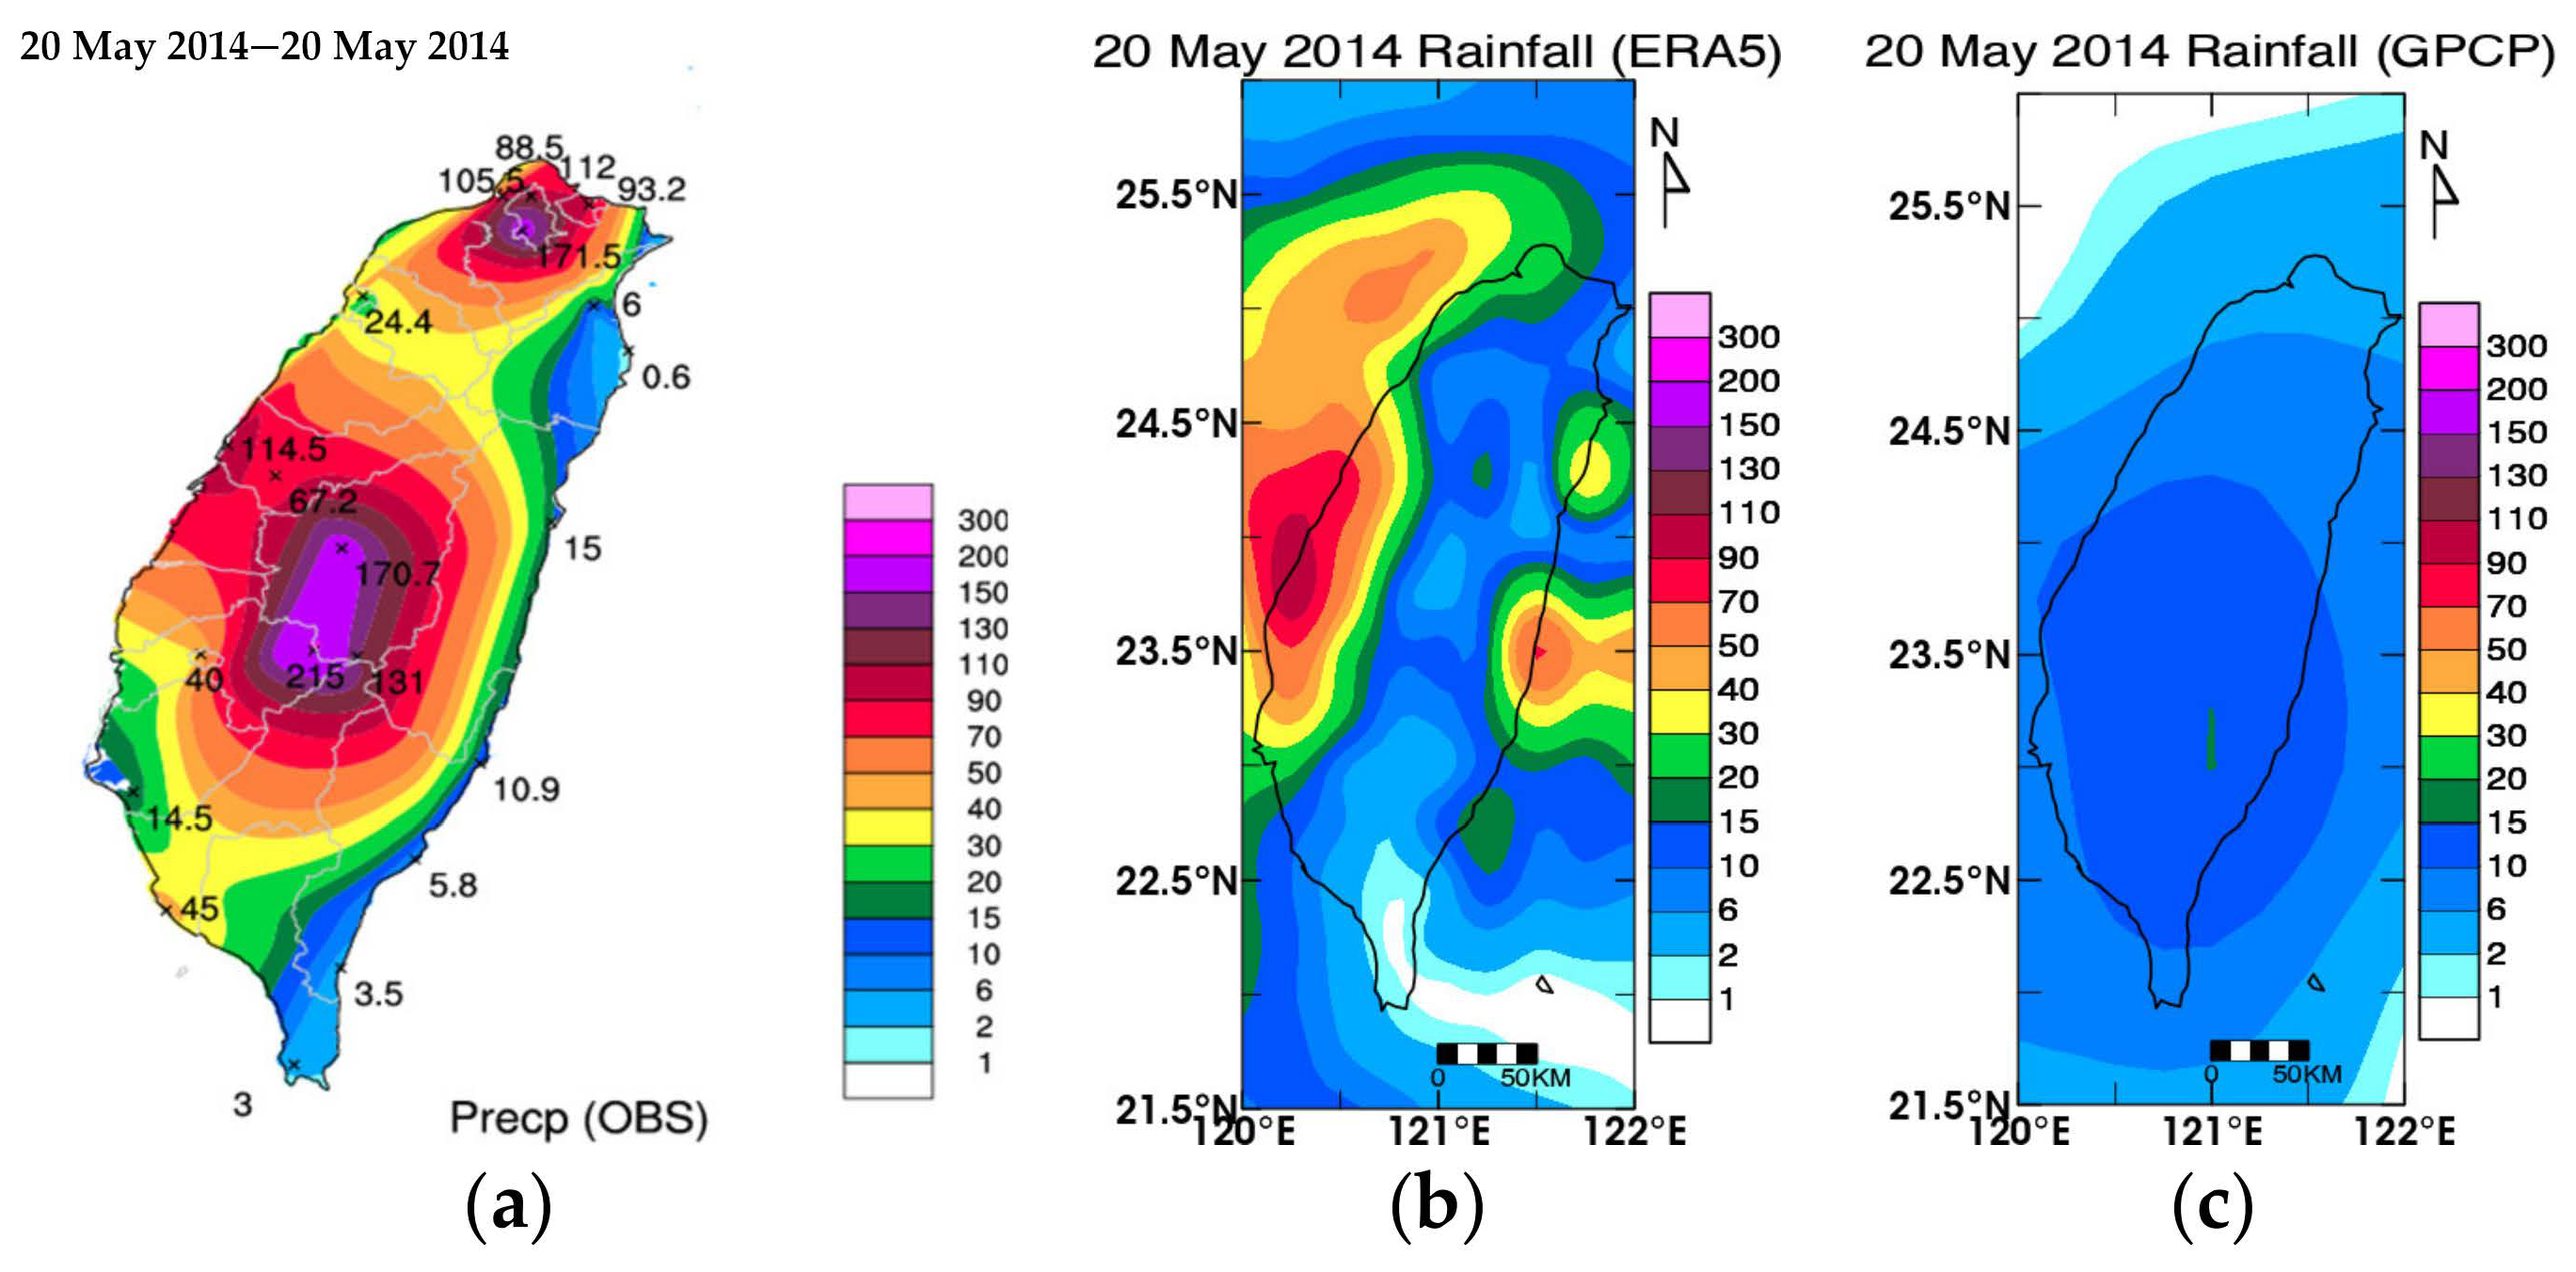
Figure 4), most stations recorded intense rainfall in the mountain areas and the central and northern parts of Taiwan, yet other stations recorded much less rain. ERA5 data indicate considerable precipitation in the central region, while GPCP underestimated the rainfall. Based on the synoptic analysis over Taiwan during that period (results not shown), the significant rainfall was caused by the mesoscale convective systems interacting with Taiwan’s terrain leading to the marked difference in the precipitation amount between the mountainous area and flat lands. While the surface stations of CWB present the only ground truth, their sparse distribution and predominantly coastal locations make it difficult to depict the terrain-flow interaction and resultant rainfall during the Meiyu season. In this regard and given the focus of this paper on the connection between rainfall and large-scale circulation, we use the ERA5 data to depict Taiwan’s precipitation that better represents the topographically-induced maximum precipitation.
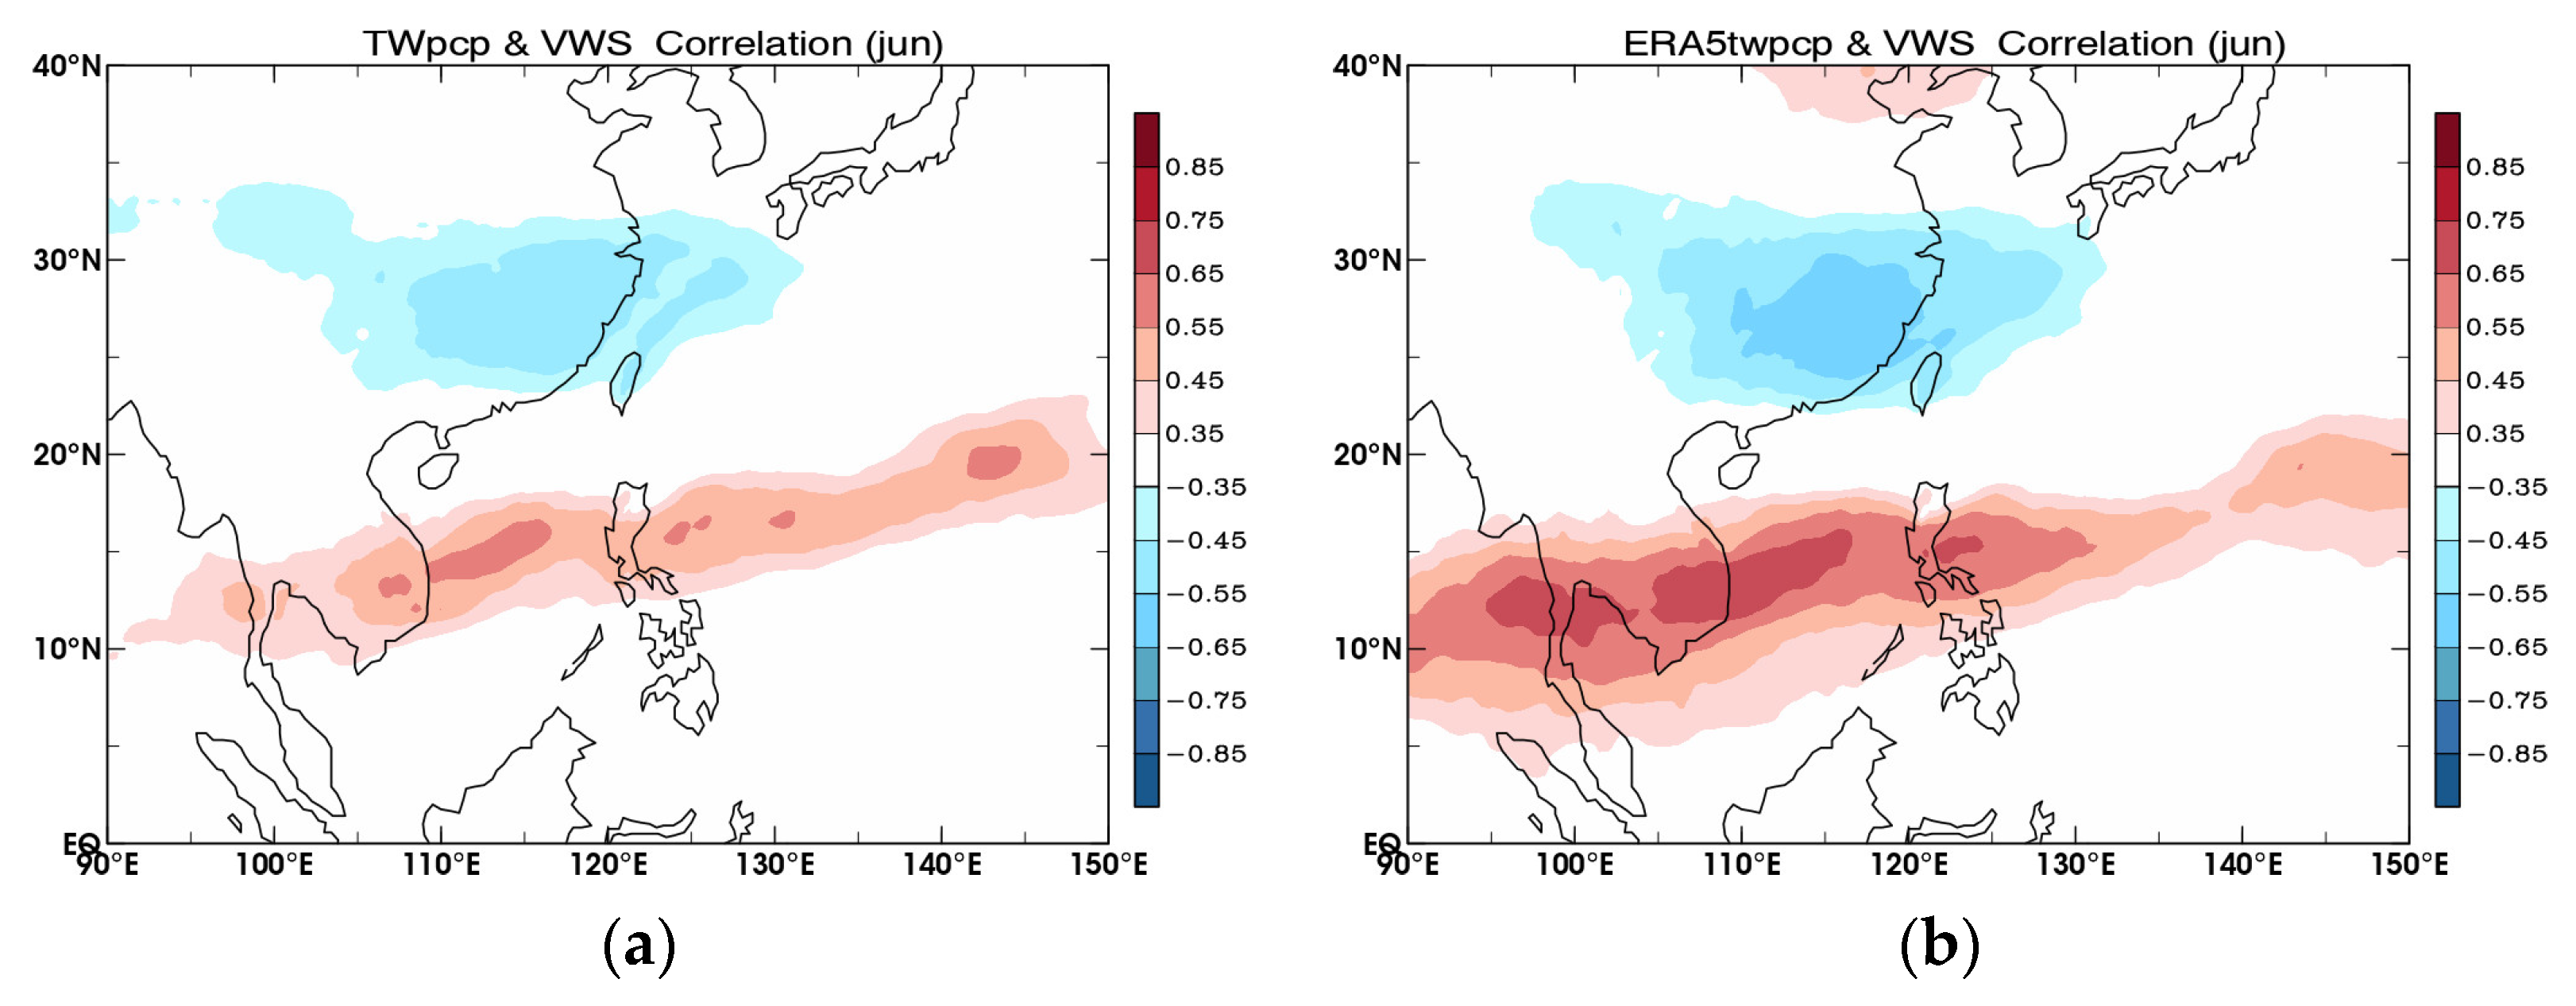
To further test the relationship between the choices of precipitation data and the low-level circulation features, we show in
Figure 5 the correlation maps of the vertical wind shear (VWS) with the station rainfall, following Chen [
1]. A similar figure was made by using the ERA5 rainfall for comparison.
Figure 5 shows that both precipitation datasets depict a similar pattern of high-correlation regions, i.e., positive over southern Taiwan and negative in northern Taiwan. This feature agrees with that of Chen [
1], that used the NCEP/NCAR R1 data. However, the correlation coefficients and spatial patterns are more pronounced using the ERA5 rainfall data. A similarly more robust 850 hPa meridional wind pattern that was correlated with the ERA5 rainfall was also found (results not shown).
3. Redefining the Meiyu Onset index
Based on Chen [
1], we applied the ERA5 data to calculate the vertical wind shear over Taiwan between the 850 hPa and 200 hPa levels (Vshear Index):
where U is the zonal wind. We also calculated the horizontal wind shear at 850 hPa as:
Based on the past decade’s operational experience in defining the Meiyu onset, we further modified the indices by adding the following conditions:
Transition of Hshear from negative to positive must last 4 days or longer;
After Vshear turns positive, its value must be greater than 4 and lasts 4 days;
When both criteria are met, the onset date is the first day of both indices turning positive.
Specifically, the previous definition of the onset date is when H-shear and V-shear are both positive. The revised index has three conditions. First, transition of Hshear from negative to positive must last 4 days or longer. This is because most onsets occur when the index continues to be positive for 4 days. Second, after the Vshear turns positive, its value must be greater than 4 and last for 4 days. This is also because of what we found to be associated with the onset. When Vshear is greater than 4, the vertical shear depicts overturning and if it continues to be positive after 4 days, persistent precipitation is likely. Third, when both criteria are met, the onset date is defined as the first day of both indices turning positive. The criterion that the two indices transition from negative to positive means that the large-scale circulation starts to transition into a new regime.
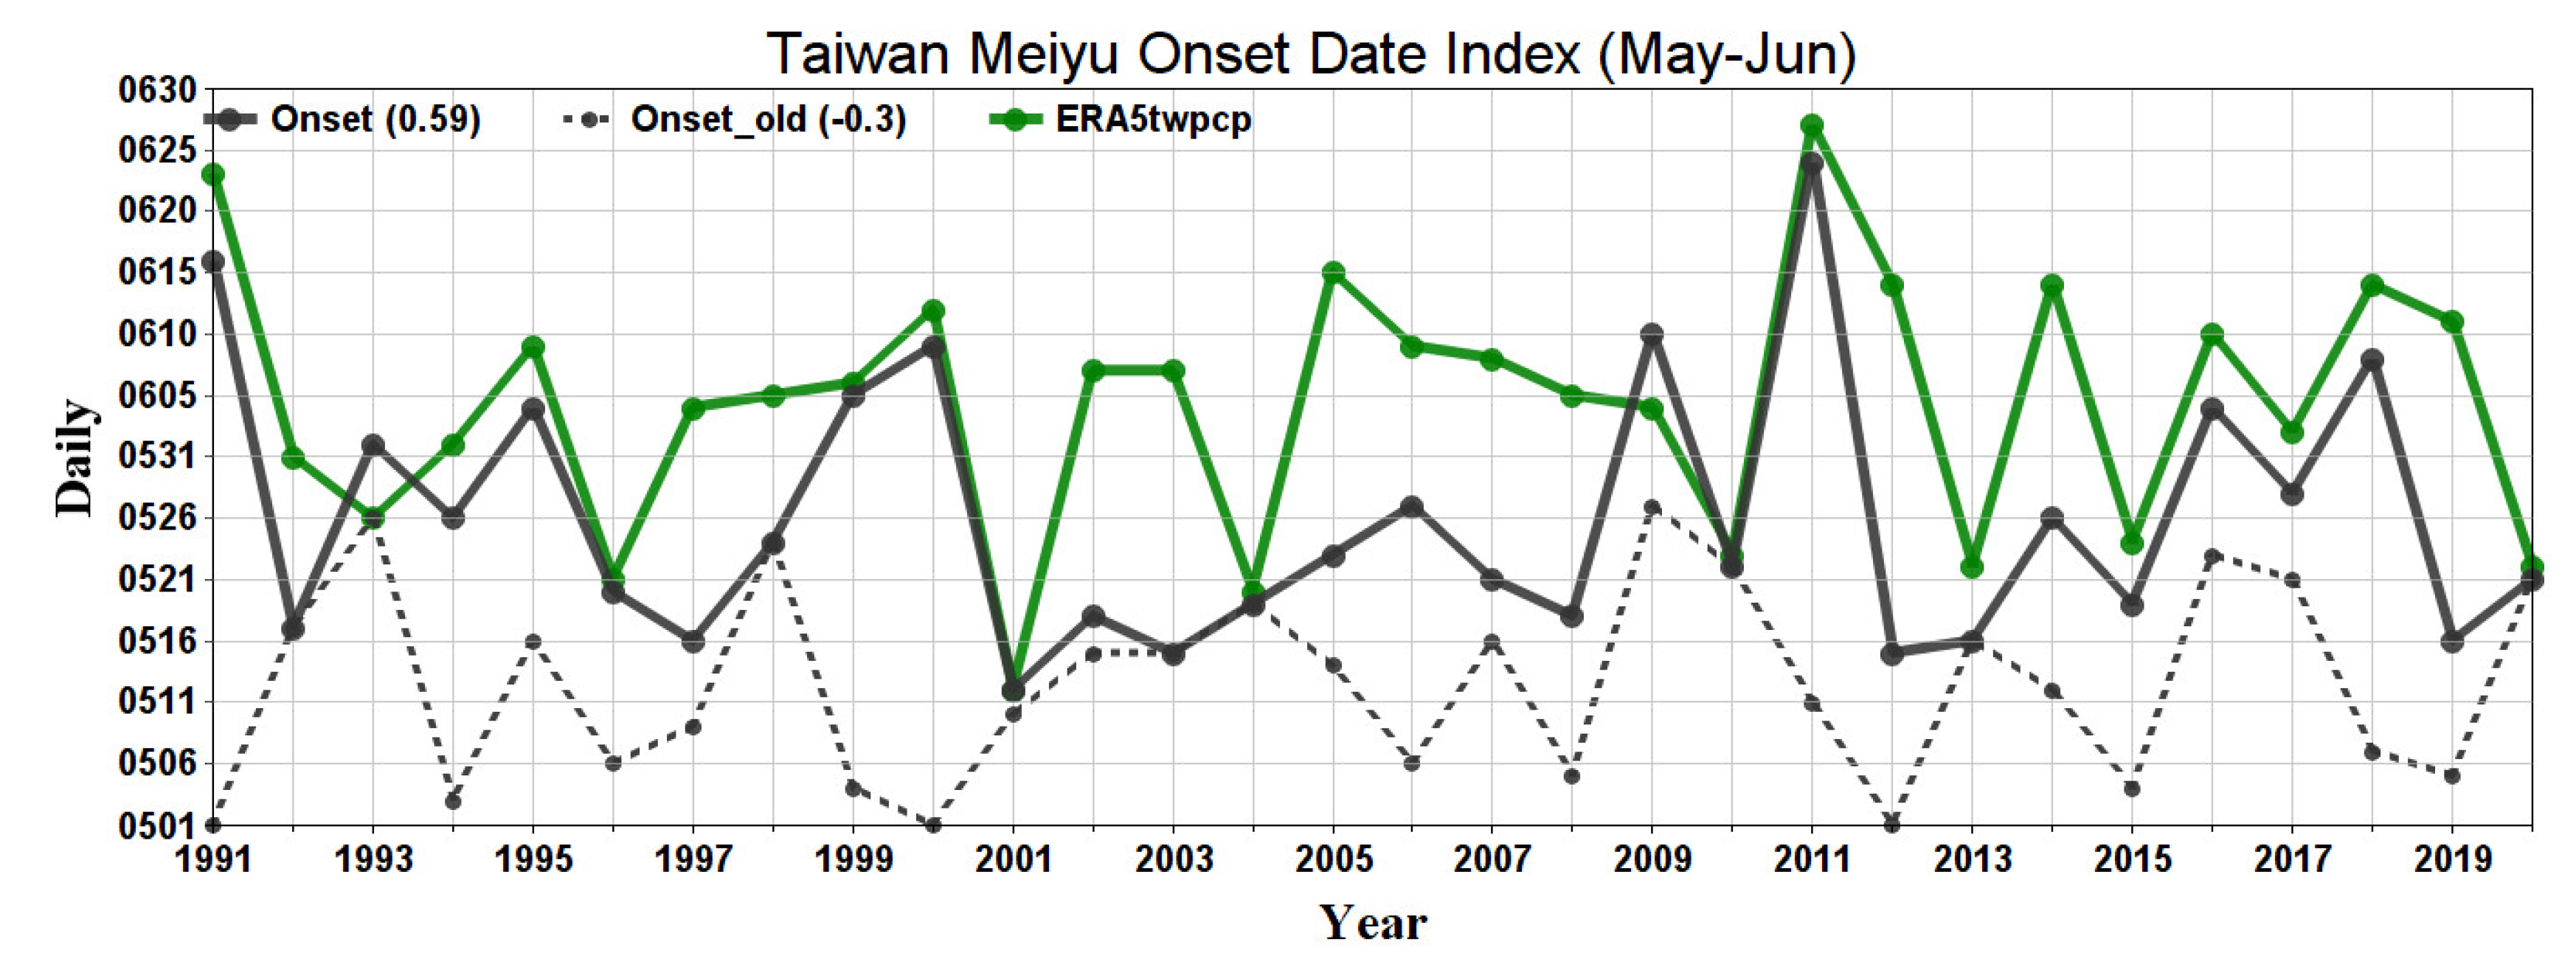
Figure 6 shows the onset dates defined by Chen [
1] and the newer criteria that are presented here against the precipitation maximum. The older (Chen [
1]) definition consistently put the onset dates too early, especially 2011 in which the actual precipitation maximum (26 June) occurred more than one month before the pre-defined Meiyu onset (11 May). The systematic error is apparent. However, through the additional criteria and using ERA5 data, the “newer” onset dates are more consistent with the observation, i.e., slightly leading the precipitation maximum date. We note only two exceptions, being 1993 and 2009, over the 30-year analysis period. These two years represent a deviation from the other good-performance years because the large-scale circulation was too weak to build up a sustaining Meiyu circulation system. The southwesterly wind was also weak due to the overly robust subtropical high in those two years.
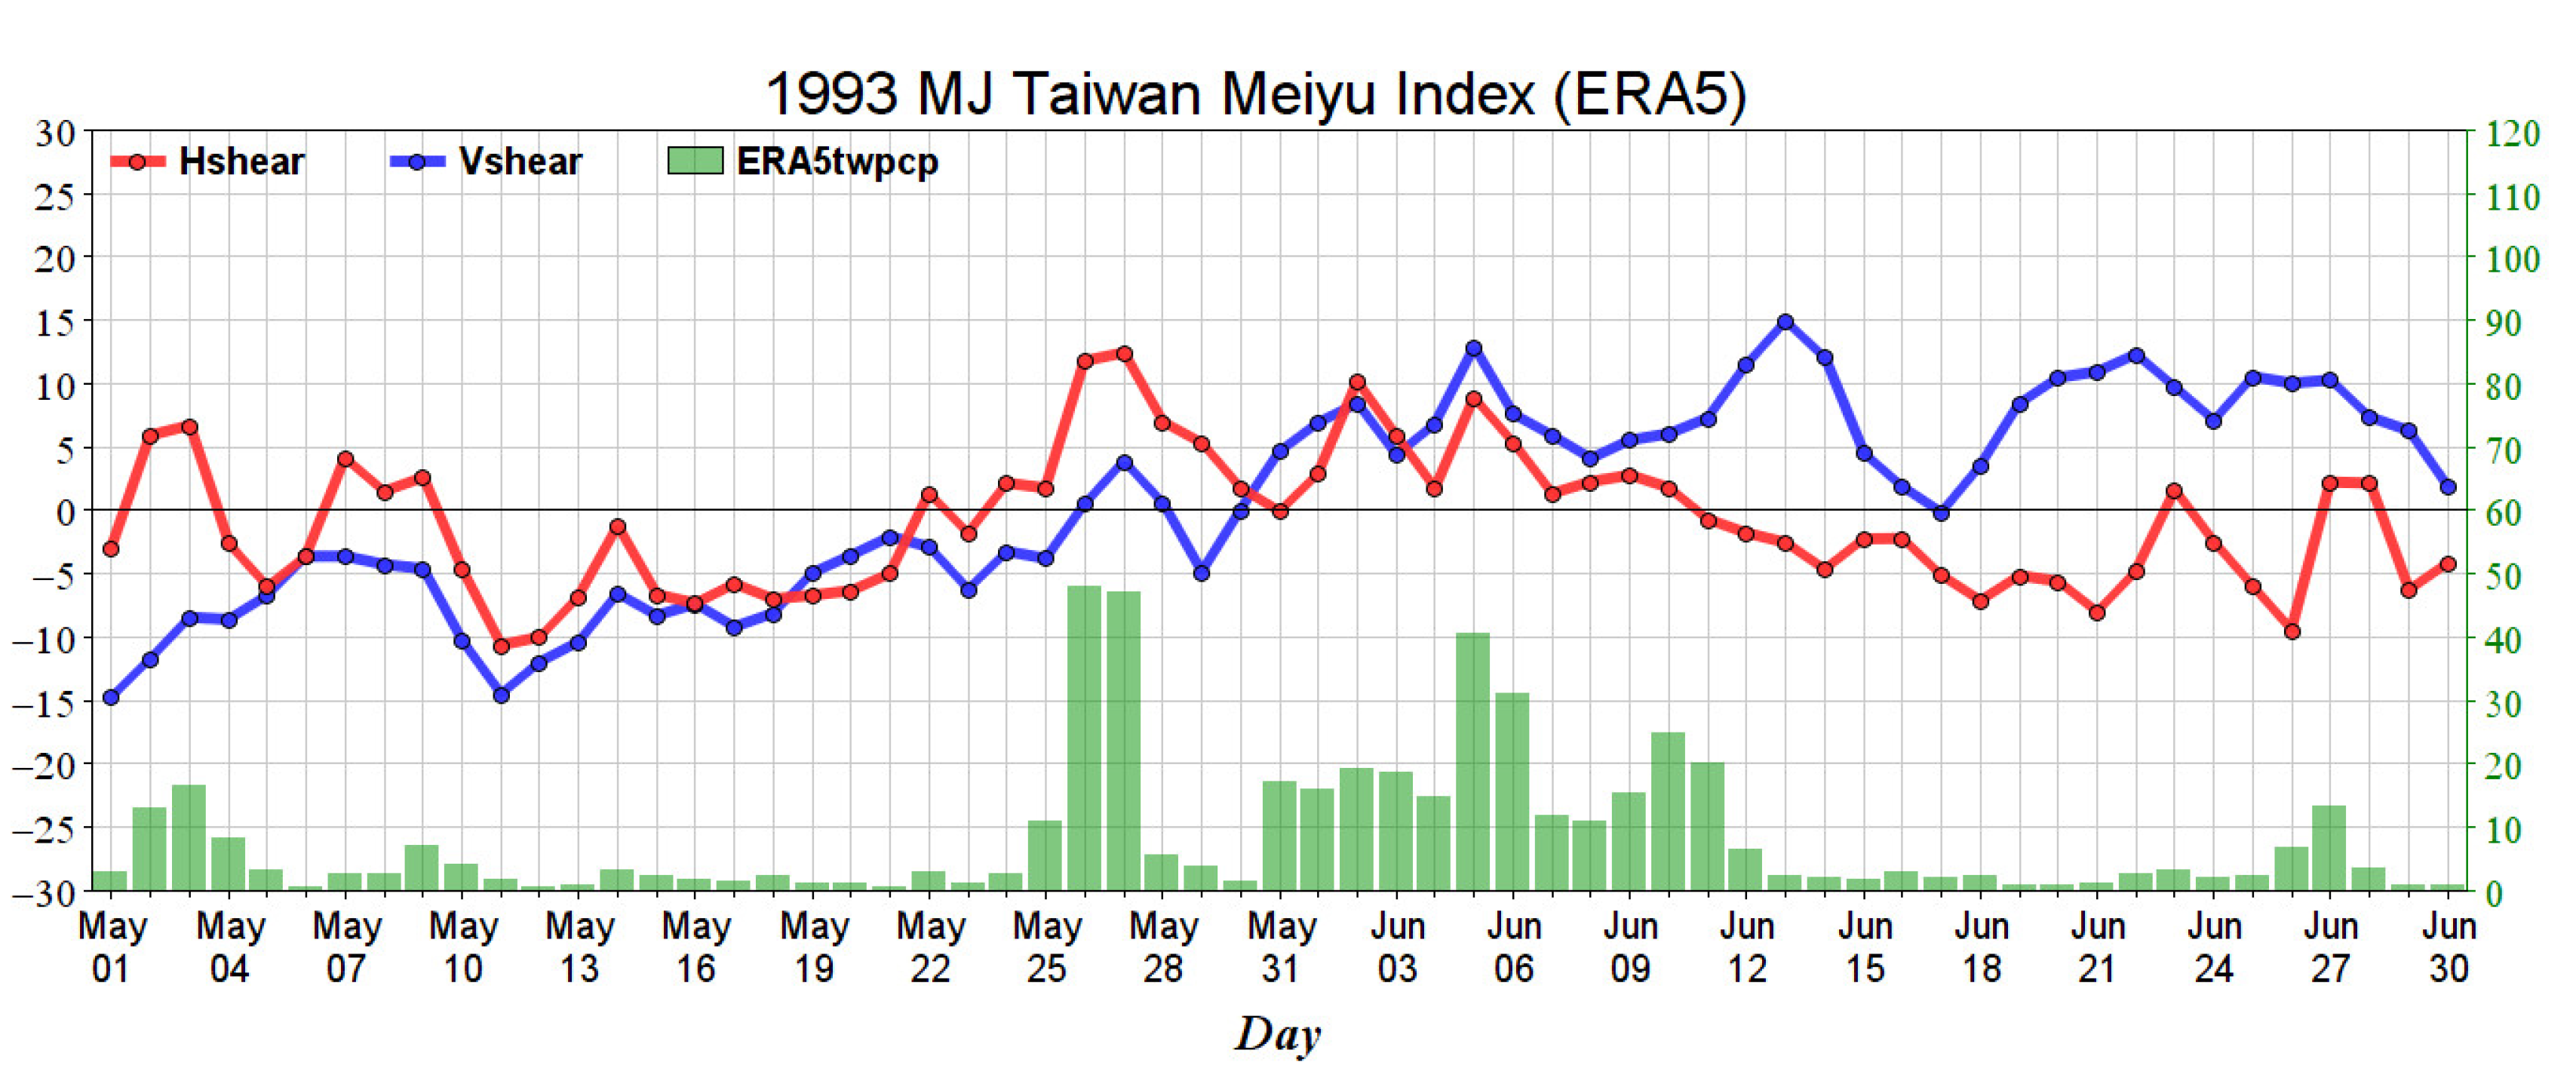
Next, we plot in
Figure 7 the time-series of Hshear and Vshear alongside the ERA5 precipitation during the Meiyu season of 1993. Even though large precipitation did occur on 26 May and 27 May, the Vshear index only turned positive for three days before returning to negative. When the Vshear became negative, the precipitation also decreased and remained low until 31 May, when the Vshear turned positive again and lasted for a longer time. This is the time when the ERA5 precipitation started to increase and persisted through 12 June. This result suggests that the persistent change in large-scale circulation is reflected by the prolonged reversal of Vshear, which can indicate the Meiyu onset.
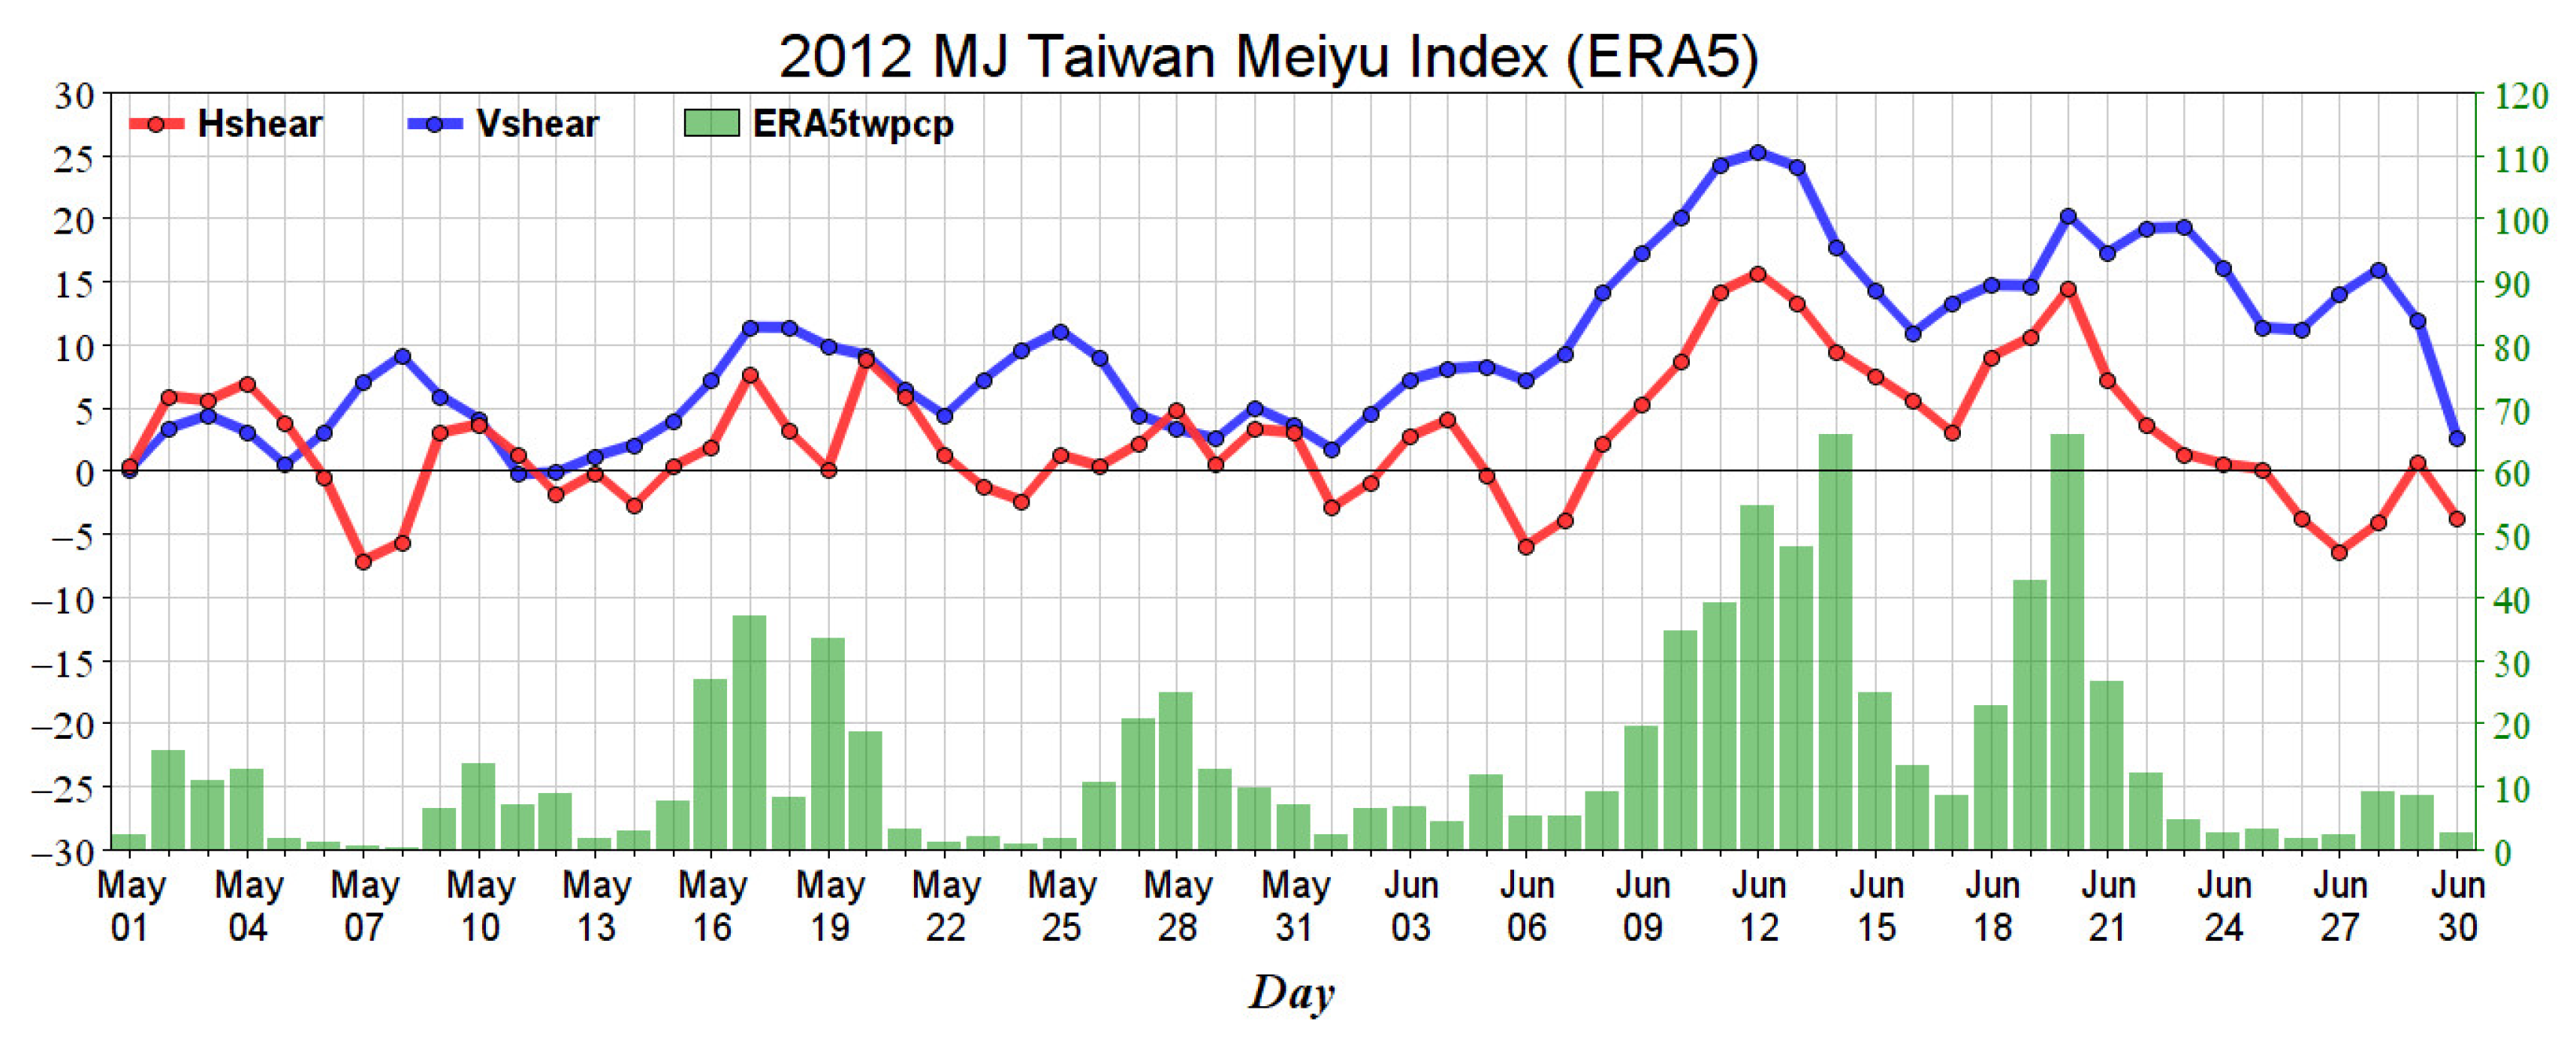
Likewise, we show in
Figure 8 another example from 2012. The onset date in 2012 was exceptionally early compared to other years. Using the newer index, the onset date is 15 May while the maximum rainfall date is 15 June. We note that the new index puts the onset date on 16 May, however the maximum precipitation occurred on 14 June. To examine what caused this deviation, the time-series of Hshear and Vshear indicate an apparent phase change during 16–20 May that was associated with large precipitation in Taiwan. The consistent changes in the wind and precipitation indices suggest that the 2012 Meiyu/monsoon season began on 16 May and lasted through 21 June, making it a unique case.
To further illustrate this difference, we examine composite map with penta (5-day mean) of the large-scale circulation (figures not shown). We found that the local circulation over Taiwan was not a typical Meiyu circulation, evidenced by the lack of cross-equator circulation in the Indian ocean (which signals a weak monsoon rather than a developing one). On the other hand, the composite circulation based on the Meiyu onset dates that were derived from the newer index, depicts a typical Meiyu rainband over Taiwan and the enhanced cross-equator low-level flow.
4. Conclusions
This study examined the circulation-based definition of Meiyu onset that was previously defined by Chen [
1] and evaluated its modified version using a newer (ERA5) reanalysis dataset. It was found that the ERA5 data can represent the broad precipitation features in Taiwan and capture the localized/orographic large precipitation that is caused by the flow-terrain interaction compared to rainfall averaged from the sparsely populated and coastal stations. Using the ERA5 data to define the Vshear and Hshear indices while adding three criteria for duration and occurrence of phase reversal, we found that the modified Meiyu onset index better aligns with the event of maximum precipitation during the Meiyu season. The adjusted Meiyu onset index consistently leads the maximum precipitation by only a few days. Since this Meiyu onset index is circulation-based and bypasses the use of the often-troublesome model precipitation, the result may provide operational forecasters with a way to anticipate the arrival of the Meiyu rainfall better than using model precipitation alone. This modified Meiyu onset index can also assist water resource managers in better controlling the release and allocation of reservoirs. Future work can apply this revised Meiyu onset definition to evaluate climate change impacts on the broad Meiyu circulation features and any alternation in precipitation over Taiwan.
Author Contributions
Conceptualization: C.-T.L.; Data curation: C.-T.L.; Formal analysis: C.-T.L.; Funding acquisition: T.-T.L.; Resources, T.-T.L.; Software, C.-T.L.; Supervision, S.-Y.S.W. and T.-T.L.; Validation, S.-Y.S.W.; Writing—original draft, C.-T.L.; Writing—review & editing, S.-Y.S.W. All authors have read and agreed to the published version of the manuscript.
Funding
This research received no external funding.
Institutional Review Board Statement
Not applicable.
Informed Consent Statement
Not applicable.
Data Availability Statement
Not applicable.
Conflicts of Interest
The authors declare no conflict of interest.
References
- Chen, M.-S. A Study of Heavy Rainfall Index during Taiwan Mei-Yu season. Meteorol. Bull. 2011, 48, 39–52, (In Chinese with English abstract). [Google Scholar]
- Kueh, M.-T.; Lin, S.-C. East Aisan Summer Monsoon-Onset Definition and Circulation Characteristics during Onset Period. Atmos. Sci. 2001, 29, 141–170, (In Chinese with English abstract). [Google Scholar]
- Hsu, H.H.; Terng, C.T.; Chen, C.T. Evolution of large-scale circulation and heating during the first transition of Asian summer monsoon. J. Clim. 1999, 12, 793–810. [Google Scholar] [CrossRef]
- Hung, C.W.; Hsu, H.H. The First Transition of the Asian Summer Monsoon, Intraseasonal Oscillation, and Taiwan Mei-yu. J. Clim. 2008, 21, 1552–1568. [Google Scholar] [CrossRef]
- Yan, J.Y. Observational study on the onset of the South China Sea southwest monsoon. Adv. Atmos. Sci. 1997, 14, 276–287. [Google Scholar] [CrossRef]
- Wang, B.; Zhang, Y.; Lu, M.M. Definition of South China Sea Monsoon Onset and Commencement of the East Asia Summer Monsoon. J. Clim. 2004, 17, 699–710. [Google Scholar] [CrossRef] [Green Version]
- Wang, B.; Wu, Z.W.; Li, J.P.; Liu, J.; Chang, C.P.; Ding, Y.H.; Wu, G.X. How to Measure the Strength of the East Asian Summer Monsoon. J. Clim. 2008, 21, 4449–4463. [Google Scholar] [CrossRef]
- Tanaka, M. Intraseasonal oscillation and the onset and retreat dates of the summer monsoon over East, Southeast Asia and the western Pacific region using GMS high cloud amount data. J. Meteor. Soc. Jpn. 1992, 70, 613–629. [Google Scholar] [CrossRef] [Green Version]
- Lau, K.M.; Yang, S. Climatology and interannual variability of the Southeast Asian summer monsoon. Adv. Atmos. Sci. 1997, 14, 141–161. [Google Scholar] [CrossRef]
- Chang, C.P.; Chen, G.T.J. Tropical circulation associated with southwest monsoon onset and westerly surges over the South China Sea. Mon. Weather Rev. 1995, 123, 3254–3267. [Google Scholar] [CrossRef]
- Wang, B.; Wu, R. Peculiar temporal structure of the South China Sea summer monsoon. Adv. Atmos. Sci. 1997, 14, 176–194. [Google Scholar] [CrossRef]
- Lu, M.-M. A Study on the Relationship of the Onset Dates of the South China Sea Summer Monsoon and Taiwan Precipitation in the Mei-yu Season. Atmos. Sci. 1998, 26, 205–225, (In Chinese with English abstract). [Google Scholar]
- Xie, A.; Chung, Y.S.; Liu, X.; Ye, Q. The interannual variations of summer monsoon onset over the South China Sea. Theor. Appl. Climatol. 1998, 59, 201–213. [Google Scholar] [CrossRef]
- Chen, T.-C.; Wang, S.-Y.; Huang, W.-R.; Yen, M.-C. Variation of the East Asian summer monsoon rainfall. J. Clim. 2004, 17, 744–762. [Google Scholar] [CrossRef]
- Wang, S.-Y.; Chen, T.-C. Measuring East Asian summer monsoon rainfall contributions by different weather systems over Taiwan. J. Appl. Meteor. Climatol. 2008, 47, 2068–2080. [Google Scholar] [CrossRef] [Green Version]
- Hersbach, H.; Bell, B.; Berrisford, P.; Hirahara, S.; Horányi, A.; Muñoz-Sabater, J.; Nicolas, J.; Peubey, C.; Radu, R.; Schepers, D.; et al. The ERA5 global reanalysis. Q. J. R. Meteorol. Soc. 2020, 146, 1999–2049. [Google Scholar] [CrossRef]
- Huffman, G.J.; Adler, R.F.; Morrissey, M.M.; Bolvin, D.T.; Curtis, S.; Joyce, R.; McGavock, B.; Susskind, J. Global Precipitation at One-Degree Daily Resolution from Multisatellite Observations. J. Hydrometeorol. 2001, 2, 36–50. [Google Scholar] [CrossRef]
| Publisher’s Note: MDPI stays neutral with regard to jurisdictional claims in published maps and institutional affiliations. |
© 2022 by the authors. Licensee MDPI, Basel, Switzerland. This article is an open access article distributed under the terms and conditions of the Creative Commons Attribution (CC BY) license (https://creativecommons.org/licenses/by/4.0/).


