Article

Analysis of Carbon Emission Characteristics and Influencing Factors of Herder Households: A County-Scale Investigation of the Sanjiangyuan Region on the Qinghai–Tibet Plateau

1
Department of Social & Ecological Studies, Chinese Academy of Governance, Beijing 100091, China
2
Department of Economics, Chinese Academy of Governance, Beijing 100091, China
3
State Key Laboratory of Urban and Regional Ecology, Research Center for Eco-Environmental Sciences, Chinese Academy of Sciences, Beijing 100085, China
4
School of Economics and Management, Nanjing University of Science and Technology, Nanjing 210094, China
*
Author to whom correspondence should be addressed.
These authors contributed equally to this work.
Atmosphere 2023, 14(12), 1800; https://doi.org/10.3390/atmos14121800
Submission received: 3 September 2023 / Revised: 28 November 2023 / Accepted: 6 December 2023 / Published: 8 December 2023
(This article belongs to the Special Issue Urban and Regional Nitrogen Cycle and Risk Management)

Abstract

:
With further urbanization, household consumption firmly plays a key role in China’s national carbon emissions. However, current research concerning carbon issues has mainly focused on urban household consumption, and few studies have paid attention to herder households, leading to a research gap in the field of low-carbon shifting related to nomadic economies. In this study, we interviewed more than one-thousand herder households in the Sanjiangyuan region of the Qinghai–Tibet Plateau in China. The household carbon emissions and their influencing factors were investigated across the herder households of 15 counties. Our findings revealed the following: (1) There exist differences in the amounts of household carbon emissions and their compositions in the Sanjiangyuan region. From the perspective of spatial distribution, the emission hotspots are mainly concentrated in the eastern part of the Sanjiangyuan region. (2) At the prefecture level, average personal emissions were larger in the Hainan Prefecture (3.26 t ce/year), while they were approximately 1.36 times that of the Huangnan Prefecture (2.4 t ce/year), though with smaller personal emissions. The indirect carbon emissions of the four prefectures all occupied larger percentages of household carbon emissions that were mainly contributed by food consumption and housing. (3) Family type was the main diver influencing personal carbon emissions in the Huangnan Prefecture, Guoluo Prefecture, and Yushu Prefecture. The more people living in the household, the lower the per capita carbon emissions. However, the effect size of potential carbon reductions was weakened when the number of family members rose to over three. (4) We propose that grazing prohibitions and low-carbon dietary shifts would contribute to low-carbon herder livelihoods, especially for small-sized households that should be peer-to-peer targeted by regional government propaganda, which may help to strengthen the implementation of in-depth low-carbon promotions across the Sanjiangyuan region and even the overall Qinghai–Tibet Plateau.

1. Introduction

The era of global warming is not yet over, while the era of global boiling has already arrived. With rapid global industrialization and modernization, the excessive consumption of energy by humans has led to a dramatic increase in greenhouse gas emissions [1], thereby exacerbating the global warming situation. Urban areas are the hotspots of human energy consumption, accounting for over 70% of global carbon emissions. For developing countries, residential energy consumption serves as a main engine for economic growth and a major source of regional carbon emissions [2,3]. For the rapidly urbanizing China, the direct and indirect carbon emissions caused by household consumption have driven the growth of carbon emissions over recent decades [4]. In view of China’s current international commitments to achieve carbon peaking by 2030 and carbon neutrality by 2060, it is necessary to investigate the dynamics of carbon emissions from different types of consumption in Chinese households from a multi-scale perspective.
Recently, research concerning the energy-related carbon emissions of Chinese households has emerged. Su et al. (2023) [5] conducted a dynamic assessment of residential energy consumption and related carbon emissions in Chinese households. It indicated that the annual carbon emissions caused by different types of Chinese households would decrease at different levels. Chen et al. (2023) [6] studied the drivers of urban–rural disparities in household carbon emissions in China, and they found that the temporal and spatial characteristics in household carbon emissions between urban and rural areas were influenced by sociometric factors such as economic development levels, household consumption patterns, and demographic effects. Jiang et al. (2021) [7] proposed that carbon emissions from households in rural areas may be much higher than those from urban households due to the different energy types used by urban and rural households. Yuan et al. (2019) [8] revealed that the household carbon emissions in most coastal provinces and subordinate cities were mostly influenced by residents’ income levels and their demographic effects, while the higher household carbon emissions were observed in some non-coastal industrial provinces were due to laggard carbon-control technologies. Concerning the regional carbon emissions from northern agricultural regions, Liang et al. (2013) [9] found that coal still was the main energy source resulting in the growth of greenhouse gas (GHG) emissions, and these results were based on an investigation of the structural changes in household energy use from 1980 to 2009 in Shandong Province, northern China. Most current research concerning household carbon emissions has focused on the carbon emission characteristics of urban household consumption and their influencing factors, and relevant studies related to rural household consumption, especially at the county scale, are fewer. Although the limited studies conducted by Jiang et al. (2021) [7] and Liang et al. (2013) [9] investigated the carbon emissions of rural households in typical agricultural regions, they focused on suburban regions within metropolitan areas. Compared with rural households, fewer researchers have paid attention to the carbon issues of herdsman livelihoods, which may present different stories about carbon issues due to the different cultures of these ethnic minorities and the special topographies of the plateau regions. Therefore, the mere selection of urban and rural households as case studies cannot provide a comprehensive mapping of carbon emissions from households’ consumption in China.
Currently, there is no doubt that fewer in-site studies have concerned herdsman livelihoods in plateau regions with low urbanization levels, which may also be potentially affected by rapid urbanization in the future. The ecosystems of forests, grasslands, wetlands, and permafrost in the Qinghai–Tibet Plateau are the important carbon sinks which will play a long-term, crucial role in achieving global carbon neutrality. As a natural barrier, the unique environment of the Qinghai–Tibet Plateau requires the development of corresponding sustainable development strategies to achieve the United Nations’ 17 Sustainable Development Goals (SDGs) [10]. However, it is not easy to develop such suitable and effective strategies for the Qinghai–Tibet Plateau due to its fragile environment as the “Third Pole” region in the world. The difference between this “Third Pole” and other polar regions on the earth is that this region is constantly threatened by urbanization [11]. The population of the Tibet Plateau is rapid rising along with the development of regional economies, and the related increasing exhaust gases emissions resulting from household energy combustion (such as heating, cooking, electricity, etc.) in this region not only threaten local air quality and human health, but also hinder progress in achieving the goal of carbon-peaking by 2030 and carbon neutrality by 2060 in Qinghai–Tibet. However, neither governance nor academia have paid long-term attention to this carbon issue for plateau regions, resulting in less relevant research to date [10].
Rising carbon emissions have already threatened sustainable development in the Qinghai–Tibet Plateau. A household investigation in the Qinghai Province concluded that there is significant population aggregation and economic development within the Qinghai–Tibet Plateau. Previous studies found that household-related carbon emissions have increased at an average annual rate of 23% for the period 2002 to 2012. However, these studies only acquired an insights into carbon emissions related to urban households at the provincial level [12], and they failed to provide further information about herdsman livelihoods in typical plateau regions. The pastoral communities, especially those living in the higher altitude of Asia, are increasingly exposed to threats brought about by the aforementioned climactic and anthropogenic factors, and thus their livelihoods are more vulnerable to climate change compared with those in the urban and rural areas in lower altitudes. These herder households making up pastoral communities have largely been dependent on their local knowledge in managing their daily livelihoods [13]. In terms of energy consumption, over the past thousand years, local herders have preferred livestock manure (e.g., yak, sheep, etc.) and crop residues as their main energy sources [
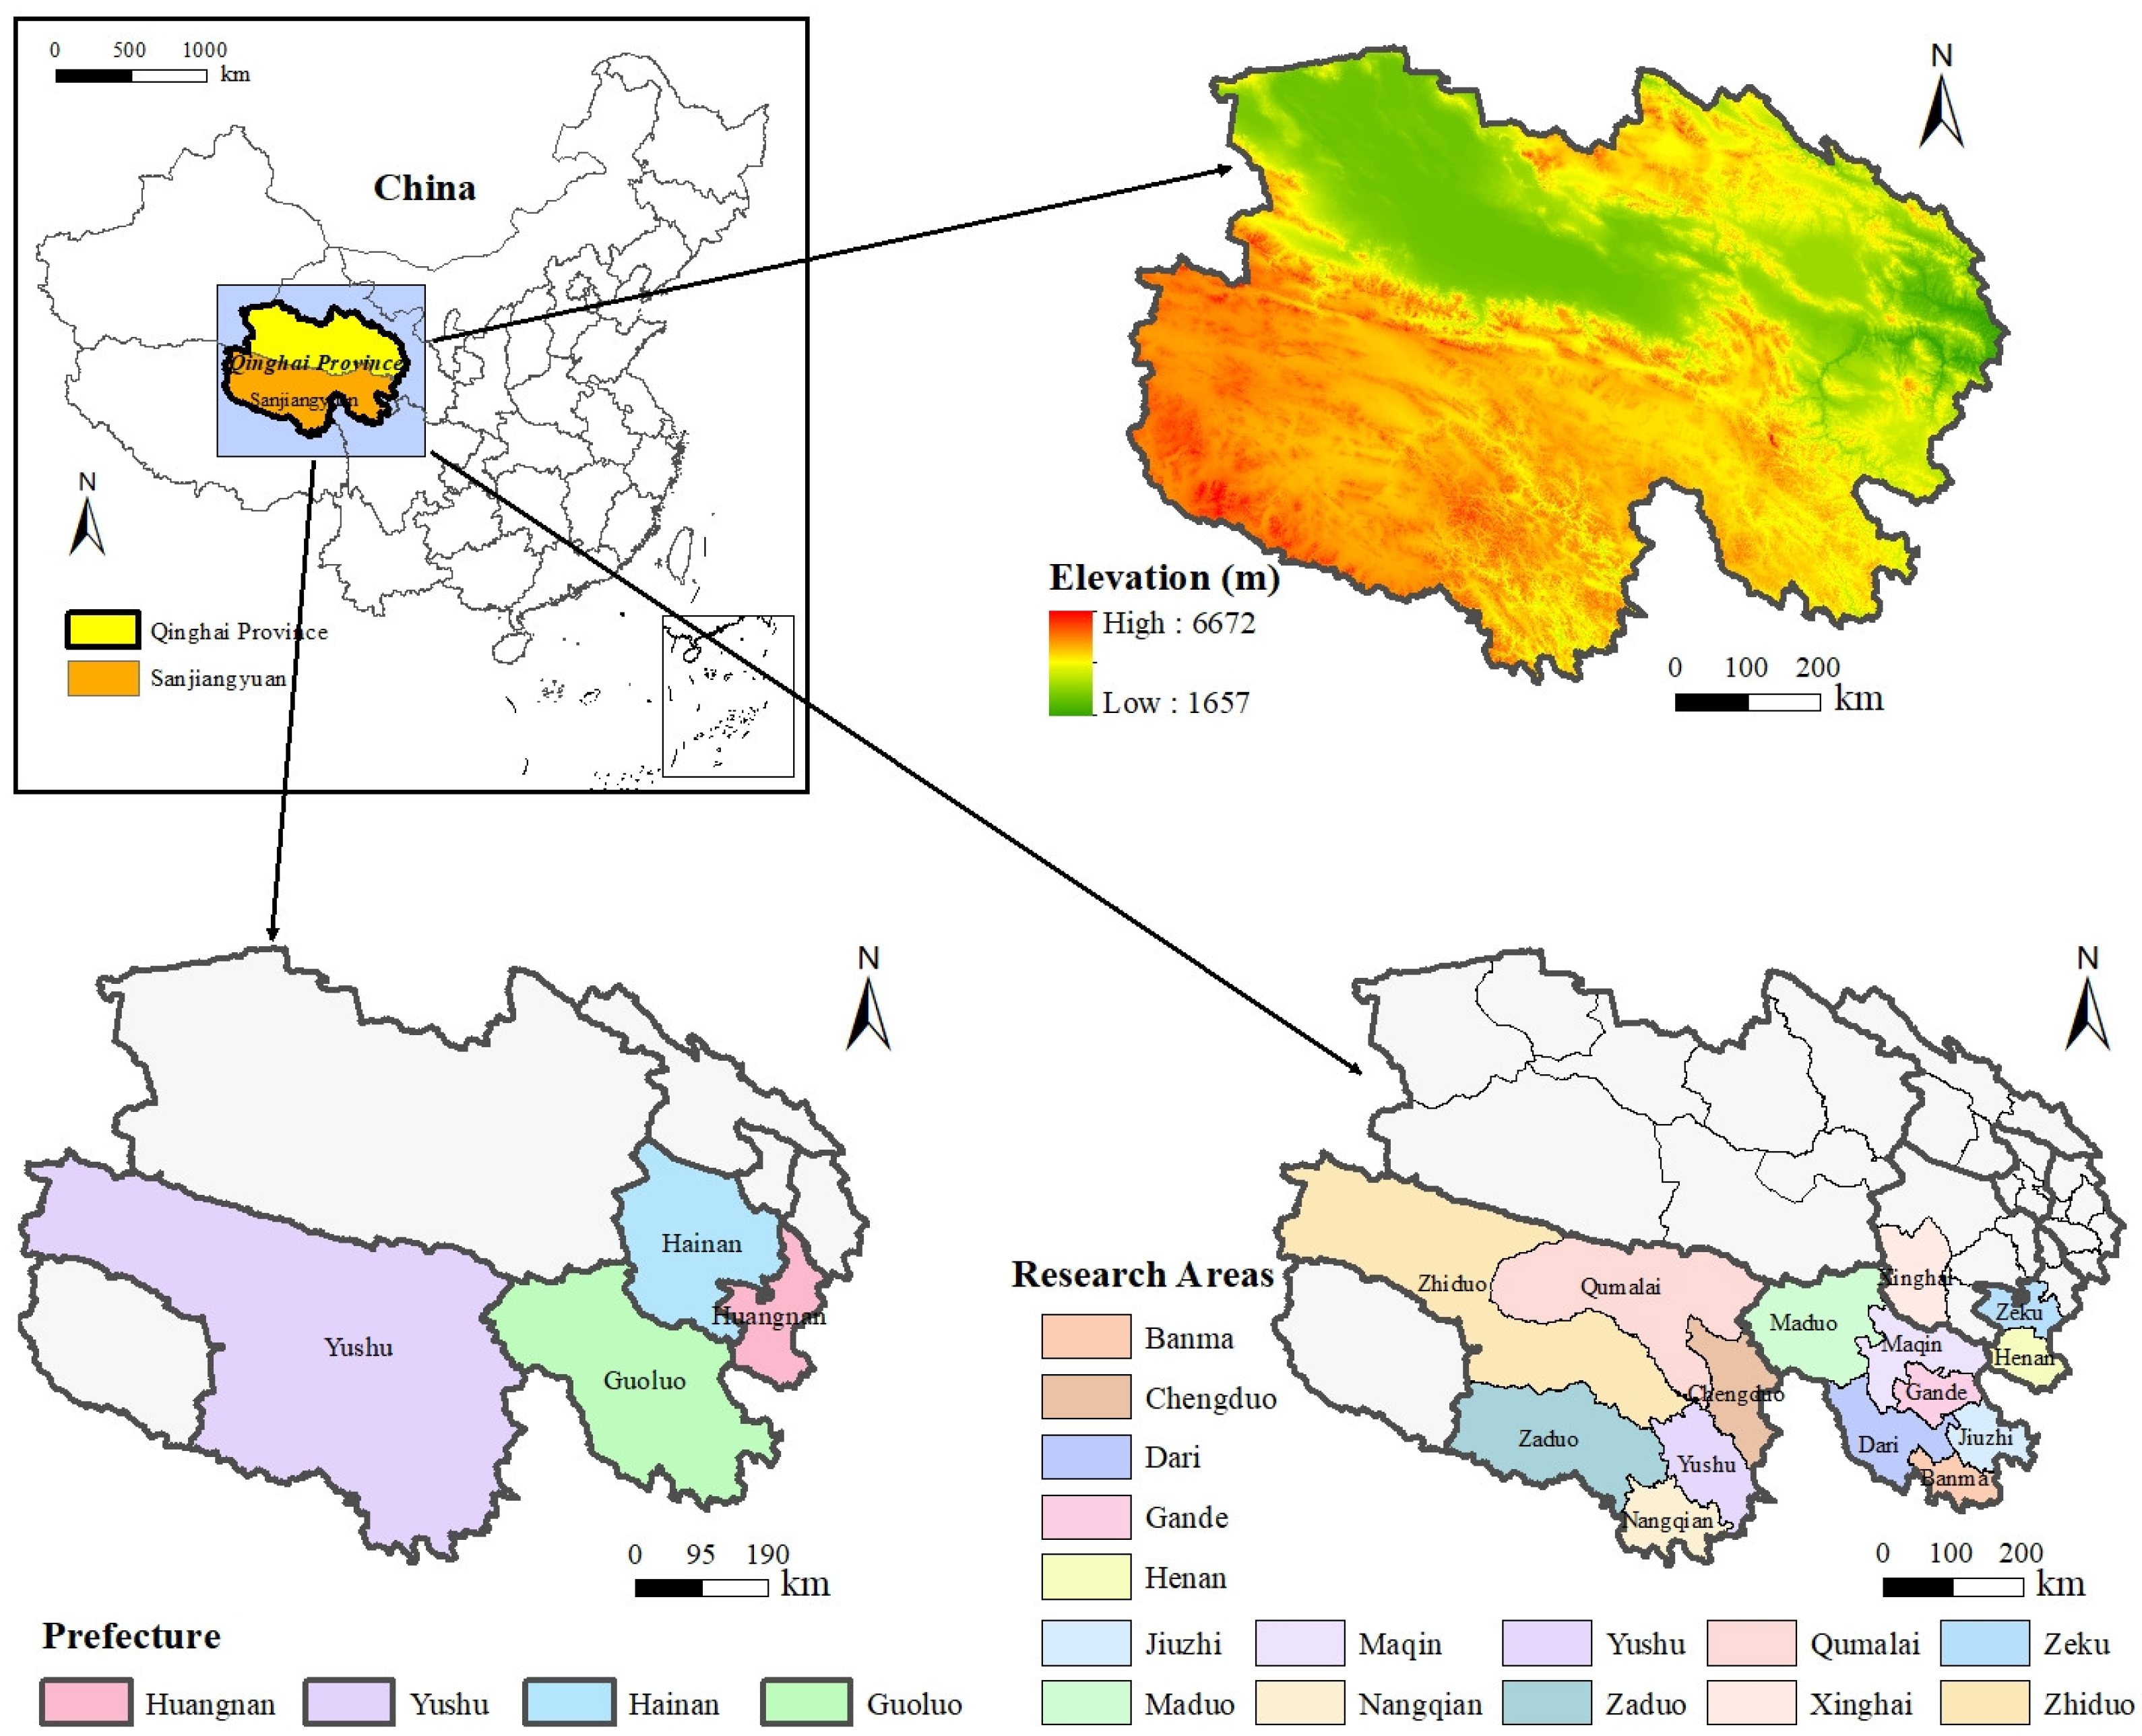
14], and they usually lack the means for adopting clean energy to reduce household carbon emissions. As for energy saving for climate change mitigation, their external dependency has been increased due to recent climatic anomalies and economic development, which should be addressed and guided by practitioners and policy makers to better reduce household carbon emissions for the adaptation of regional climate change. However, there exists a significant gap between the energy consumption per capita of herders and that of non-herders within Qinghai Province. The aforementioned factors might lead to different situations for the dynamic carbon emissions and their driving factors in herder households. To address this emerging question—whether the carbon emissions of herder households are high enough to form a significant carbon source that has a negative impact on the low-carbon development of the plateau—this study took the Sanjiangyuan region of the Qinghai Province as an example, and analyzed the characteristics of the carbon emissions of herder households though a door-to-door household survey across different counties, aiming to provide scientific support for the overall Qinghai–Tibet Plateau to achieve the relevant carbon goals and sustainable development goals.

2. Literature Review

In recent years, the research topic of household carbon emissions has gradually attracted more academic attention. The existing research has mainly focused on the accounting of household carbon emissions in urban and rural communities and analyzing the relevant factors impacting these carbon emissions. Most studies have highlighted the importance of families as the basic units of society in carbon emission reductions; however, in the plateau regions, the role of herder households in carbon emission reductions remains unclear. It is essential to investigate this issue to gain further insights, since there exist differences between the family lifestyles of herder households and those of urban and rural residents. Previously, Jiang et al. (2020) [3] studied the characteristics of household energy consumption levels in the agricultural and pastoral areas of the Qinghai Province, and they proposed that the limited data retrieved from official statistics were not enough to explain the regional differences [15] and that local surveys were needed to address this issue. Zhang et al. (2020) [16] studied the internal changes in household consumption levels and related carbon emissions based on a field survey, but they neglected herder families in the plateau regions. Further, the factors of household characteristics usually play an important role in explaining the dynamics of household carbon emissions. Zhang et al. (2023) [17] found that household sizes in China have significant negative impacts on per capita household carbon emissions, and the negative impact on indirect carbon emissions is much greater than that on direct carbon emissions. Zhou et al. (2023) [18] found that the impact of national population aging on carbon emissions presented an inverted U-shaped relationship, which showed that aging first increased and then decreased the related carbon emissions. Zhou et al. (2016) [19] found that the impact of changing age structures on energy use was not statistically significant, but it led to an increase in emissions across the country, especially in eastern China. Xu et al. (2016) [20] found that food consumption was the second largest source of carbon emissions in China. Peng et al. (2023) [4] found that household income and consumption played important roles in promoting China’s carbon emissions, and the proportion of income-based household emissions in the total emissions was higher than that of consumption-based emissions. Golley et al. (2012) [21] mentioned that rich households generated more emissions per capita than those emitted by poor households. Akrofi et al. (2023) [22] mentioned that the promotion of renewable energy technologies such as solar home systems (SHS) had great potential to reduce greenhouse gas emissions. The environmental satisfaction levels of households have also been proposed to have positive impacts on reducing carbon emissions [23,24,25].
In terms of a driving force analysis of household carbon emissions, statistical analysis techniques have been adopted to target this issue, including regression analysis and decomposition analysis [26]. However, these methods have been mainly used for variable analyses [27,28], predictions [29], and decompositions [8] and they performed weakly in addressing the multicollinearity problems that arise while handling non-normally distributed data, and so optimal scale regression analysis has been proposed to be more practical for analyzing questionnaire data. It can be used to perform integrated analyses for multiple types of questionnaire data sources, and it has the advantage of being able to gradually remove variables that fail the significance test with high collinearity [30,31,32]. As the “Third Pole” region in the world, the Qinghai–Tibet Plateau’s ecosystems are relatively fragile and more sensitive to climate change. As mentioned, studies concerning carbon emission reductions in herder households in the Qinghai–Tibet Plateau are meaningful to this research field [3,33]. Currently, relevant research based on first-hand data retrieved from local surveys is limited, and therefore, an investigation based on large-scale household surveys would, indeed, help to further outline the carbon emissions related to herder livelihoods compared with previous work based on a limited number of questionnaires in the Qinghai–Tibet Plateau [7]. Further, through the acquisition of household scale micro-data, we could estimate regional household carbon emissions using the scaling-up method, and provide scientific support for the launch of regional low-carbon strategies, which could not be achieved by previous large-scale studies that relied on national and provincial statistics.

3. Research Methods

3.1. Region Selection

The Sanjiangyuan region (31°39′ N 89°45′ E–36°12′ N 102°23′ E) is located in the southern part of the Qinghai Province in China. It is the origin of the Yangtze River, Yellow River, and Lancang River. The average elevations in the Sanjiangyuan region range from 3500 to 4800 m. Autonomous prefectures for ethnic minorities are the prefecture-level administrative units in this plateau area, and they include several subordinate county-level administrative regions. The study area included sixteen counties in four Tibetan autonomous prefectures, including Yushu, Guoluo, Hainan, and Huangnan, which accounted for approximately 43% of the total area of the Qinghai Province and a total area of 302,500 square kilometers (Figure 1). The existing population was 556,000, with over 90% being Tibetans and other ethnic groups, including Hans, Huis, Salas, and Mongolians. The Sanjiangyuan region is a typical less-developed region. In 2021, its GDP was CNY 19,954,000,000 [34,35], accounting for only 5.96% of the Qinghai Province’s GDP [13,36]. Due to the characteristics of the ground cover, as a frigid zone meadow vegetation area plateau, the primary economic industry in the Sanjiangyuan region is dominated by animal husbandry, causing it to be a typical area for herder households.

3.2. Data Resources

Based on the relevant literature and suggestions from experts [35,36,37,38], we designed a questionnaire named “Questionnaire on Households’ Livelihoods and Ecological Compensation in Qinghai Province”, which consisted of the following four sections: family member information, livelihood activities, livelihood capital, and ecological policies and perceptions. Considering the cultural issues induced by language barriers during the face-to-face surveys, each questionnaire was conducted with the help of local volunteers familiar with the local languages. Subsequently, the questionnaire contents were transferred to the form of a spreadsheet, and cross-validation was subsequently carried out among the sampled spreadsheet data to ensure the accuracy of the first-hand data for the statistical analysis. A total of 1100 questionnaires across 15 counties within 4 prefectures were conducted, with a final collection of 1027 questionnaires (the effective questionnaires occupied 93.36%).

3.3. Variable Settings

Taking the individual carbon emissions from the different counties as the dependent variable, the related socioeconomic factors are thereby regarded as the independent variables (Table A1). According to existing research [17,21,33,39,40,41], the socioeconomic factors influencing the individual carbon emissions (Y) included family type, age structure, education level, annual income, solar utilization, environmental satisfaction, and grazing prohibition. The definitions of each variable are shown in Table 1.

3.4. Carbon Emissions Accounting

3.4.1. Direct Carbon Emissions Accounting

Direct energy consumption by pastoral communities mainly consists of cooking and transportation, and it is divided into fossil energy and non-fossil energy [13]. Based on the survey, we calculated the main fossil energy used by the respondents including coal, natural gas, and related electricity, as well as the non-fossil energy referring to biofuels such as firewood, straw, and livestock manure [17,42] (Table A2). It is acknowledged that the quantification of carbon emissions generated by the use of electricity is usually complicated, especially residential electricity. Relevant processes do not burn fossil fuels directly, but their upstream production will consume numerous fossil fuels. Therefore, it has been recognized as one of the main energy sources. Except the electricity consumption, the downstream carbon emissions generated by other energies were considered. This study converted various energy consumptions into a unified unit of standard coal (kg ce) as follows:
Q i = q i r i
E i = Q i c e ,
and
M E i = E i n .
In the above equation, Q i represents the original consumption of the i energy source, q i represents the original consumption of the i energy source, and r i is the conversion coefficient of the i energy source to standard coal. E i represents the direct carbon emissions of households, c e represents the carbon emission coefficient of coal, M E i is the personal direct carbon emissions, and n is the number of household members. The energy conversion coefficient to standard coal was based on the coefficient published in the China Energy Statistical Yearbook [43]. The conversion coefficient [3,44] for livestock manure (per kilogram) was 0.5, and it was 0.7143 for coal (per kilogram), 1.214 for natural gas (per cubic meter), and 0.1229 for electricity (per kilowatt hour).

3.4.2. Indirect Carbon Emissions Accounting

The consumption expenditure for households was divided into eight categories, including food, clothing, household equipment, supplies and services, healthcare, transportation and communication, and cultural, educational, and recreational supplies, as well as services, living, and other goods and services [36]. Each category of consumption expenditure corresponded to one or more relevant industries. The industry sectors corresponding to the different consumption categories and their corresponding embedded emissions intensities are shown in Table 2. These embedded carbon emissions of residents’ consumption could be therefore calculated based on the input–output analyses (IOA) method. IOA is an economic quantitative method to explore delineate the carbon emissions embedded in the interdependence of supply and consumption among different flows of goods and services across sectors within economic activities [12]. Typically, the input–output table is published every five years, and the recent input–output table for the Qinghai Province was available for 2017. This study investigated the indirect carbon emissions resulting from daily household consumption, which could be calculated through multiplying the survey data for household consumption levels (Table A2) by the cumulative carbon emissions intensities of the corresponding sectors. The relationships between consumption expenditure types and industry types in the input–output table were based on the classification suggested by Dong and Geng [45]. The calculation formulas used for the consumer lifestyle method are as follows:
C = F Y = F ( I A ) 1 Y
and
M C = C n .
In the above equations, C represents the indirect carbon emissions from household consumption, F is a 1 × 8 row vector representing the embedded carbon intensities of sectors 1~8, F’ is a 1 × 8 row vector representing the direct carbon intensities of sectors 1~8, A is the 8 × 8 matrix of the direct consumption coefficients from an input–output table, I represents an identity matrix of the same order as A, Y denotes a column vector representing the household expenditures based on eight consumption categories, ( I A ) 1 is the Leontiv inverse matrix (which shows the impacts of production technologies changing in one sector of the national economy on all the other sectors), and MC represents the per capita indirect carbon emissions.

3.4.3. Household Carbon Emissions Accounting

Based on the results of the direct and indirect carbon emissions accounting, the regional carbon emissions of the prefectures, as well as their per capita carbon emissions, could be estimated as follows:
M D = E i + C n
and
P M D t = M D t N .
In the above equations, MD represents the overall personal carbon emissions of specific household, P M D t is the total per capita emissions of the households in each prefecture t, and the maximum value of t is four. M D t represents the per capita emissions of each subordinate household within each prefecture t, and N represents the number of subordinate households in each prefecture t.

3.5. Factors Influencing Household Carbon Emissions

3.5.1. Optimal Scale Regression Analysis

We set the personal carbon emissions in the different counties as the dependent variable and the aforementioned influencing factors as the independent variables. As many variables as possible in the influencing factors were classified into variables (such as family type) rather than being used as numerical variables, which would cause significant uncertainty in the analysis by linear regression. Optimal scale regression analysis could quantify the different values of the categorical variables and convert them into numerical types for the statistical analysis. Previous studies have shown that some subjective factors such as consumer preferences [46] and the impact of land expansion on rural revitalization [47] can be set as categorical variables and then converted into numerical analyses. Therefore, the optimal scale regression analysis could be adopted to reveal the influencing factors of the household carbon emissions. This method firstly involved the calculation of the correlation coefficient R of the independent variable and the correction of the judgment coefficient R2 to determine the fitting effect of the regression equation, and then the correlation parameter (the sum of the squares, degrees of freedom, F-values, etc.) of the regression residual was summarized to determine the significance level of the regression. Finally, we calculated the standardization coefficient of the independent variable and gradually removed variables with high collinearity that had not passed the significance test by determining the optimal solution after repeated iterations. In order to deeply analyze the main influencing factors of the personal carbon emissions in each county, the software suite Statistical Product and Service Solutions (SPSS 21.0) was used for the optimal scale regression analyses. The definition formula of the regression model is as follows:
Y ^ = b 1 x 1 ^ + b 2 x 2 ^ + + b n x n ^ + ε .
In the above formula, Y ^ represents the standardized dependent variable, while x 1 ^ , x 2 ^ , and ⋯ x n ^ represent the transformed independent variables and b 1 , b 2 , and ⋯ b n represents the standardized regression coefficients of the independent variables; n represents the number of independent variables, and ε represents the error term.

3.5.2. Multiple Comparative Analysis

We selected the significant influencing factor with the highest importance among the independent variables, and we used the multiple comparison analysis with an LSD test (Fisher’s least significant difference) in SPSS21.0 to further determine the degree of influence of the explanatory variable on the dependent variable at the different levels. We used t-tests to complete the paired comparisons between the mean values of each group. The minimum significant difference was the critical value at which the mean difference reached the level of a significant difference. When the mean difference was greater than or equal to this critical value, the difference was significant; When the mean deviation was less than the critical value, the difference was not significant. The higher sensitivity of this test, as well as the small differences in the mean values between the different levels, could also be detected. This was conducive to analyzing the differences in the independent variables at the different levels and their corresponding dependent variables, which could be used to compare the differences in the main influencing factors of the household carbon emissions in the different counties, aiming to identify the targeted groups with higher personal carbon emissions.

4. Results and Analysis

4.1. Characteristics of the Herdsman Households

Based on our large-scale household survey, the basic information about the herdsman households across 15 counties within 4 prefectures and the whole Sanjiangyuan region is shown in Table 3 and Table 4. Overall, the average family size in the Sanjiangyuan region was over four members, with a mean age that ranged from 25 to 30 years old. The average educational level was mainly primary and middle school. The Hainan Prefecture had the largest average household size of approximately around 4.77 people, which was slightly higher than those of other three prefectures, and it had the lowest average age and the lowest average education level. In this region, the average annual income of the households was the second highest (CNY 6679.20) among the four prefectures, with the highest levels of environmental satisfaction and the strictest grazing prohibitions. The average age in the Huangnan Prefecture was 30.375, which was the oldest among the four prefectures in the Sanjiangyuan region. Although its average household size was smaller than that of Hainan Prefecture, its average annual income was the highest compared to other three prefectures, and its average education level was relatively high, though it was inferior to that of the Guoluo Prefecture (1.83). Overall, the per capita education level and average income level in the Huangnan Prefecture performed well. Although the average family size in the Guoluo Prefecture was only second to the Hainan Prefecture, the average family size level (4.87) of the subordinated Gande County within this prefecture was the highest among all counties in this study. The grazing prohibition situation of the Guoluo Prefecture was roughly the same as that of the Huangnan Prefecture, since the policies for grazing prohibition for these two areas were stricter. The Yushu Prefecture had the smallest average household size among the four prefectures in the Sanjiangyuan region, along with the lowest average annual income. It had the lowest environmental satisfaction and the most liberalizing policy of grazing prohibition policy compared to the other three prefectures. Overall, our study found that there existed significant differences among the herdsman households across the different prefectures of the Sanjiangyuan region in terms of their daily livelihoods, which provided valuable first-hand data for the calculation of carbon emissions and the analysis of driving forces.

4.2. Household Carbon Emission Characteristics

In terms of direct regional carbon emissions, the Guoluo Prefecture had the highest direct carbon emissions, followed by the Yushu Prefecture and the Huangnan Prefecture, while the Hainan Prefecture had the lowest emissions. Further, the indirect regional carbon emissions also presented similar spatial distribution characteristics. In terms of counties, the highest direct carbon emissions were found in Zeku County, while the lowest emissions were found in Zhiduo County. In addition, the indirect carbon emissions were higher in Maqin County and lower in Zhiduo County. The overall household carbon emissions of the different regions are shown in Figure 2. The regional emissions were found to be the highest in Nangqian County and the lowest in Zhiduo County, and the hotspots with higher carbon emissions were concentrated in the eastern part of the Qinghai Province. In terms of the per capita household carbon emissions, the average direct personal carbon emissions in the Yushu Prefecture were higher than those of the Hainan Prefecture, and the average direct carbon emissions of individuals in the Guoluo Prefecture were the lowest (Figure 3), which was mainly due to the differences in the structures of domestic energy supplies. The indirect personal carbon emissions of the different prefectures are shown in Figure 4. The indirect personal carbon emissions of the Hainan Prefecture were 2.27 t ce CO2/year, which was similar to those of the Yushu Prefecture. The lowest personal indirect carbon emissions (1.55 t ce CO2/year) were observed in the Huangnan Prefecture.

4.3. Personal Carbon Emissions and Their Influencing Factors

To explore the main influencing factors of personal carbon emissions (Y), the optimal scale regression was conducted by adopting X1, X2, X3, X4, X5, X6 and X7 as the independent variables. The significance levels of the regression equations were mainly p values of less than 0.05, indicating that the model was statistically significant after the tests for autocorrelation and heteroscedasticity (Table 5). The tolerance values of each variable in the model were greater than 0.1 before and after transformation, indicating that the model did not have collinearity issues. Based on the parameter estimation results of the coefficient table (Table 6) retrieved from the optimal scale regression model, the independent variables with strong importance levels (p = 0.05) were selected for analysis. The impact of family type on personal carbon emissions in the four prefectures all passed the significance test at the 0.05 level, but the degrees of the impacts were different. The importance values for family type in the Huangnan Prefecture, the Guoluo Prefecture, and the Yushu Prefecture all exceeded 0.5. The use of solar energy was not significant in any of the prefectures. Annual income had significant impacts on personal carbon emissions in the Huangnan Prefecture, the Guoluo Prefecture, and the Yushu Prefecture. Individuals with different levels of environmental satisfaction in the Huangnan Prefecture, the Guoluo Prefecture, and the Yushu Prefecture showed significant differences for their personal carbon emissions. Although their contributions were not high, they still indicated that environmental satisfaction had an impact on their personal carbon emissions to some extent. According to relevant research [48], residents’ perceptions of heat and air quality affected their behaviors in relation to energy consumption. Meanwhile, the grazing prohibitions in the Huangnan Prefecture, the Guoluo Prefecture, and the Yushu Prefecture Prefecture had significant impacts on their carbon emissions.
Based on the above parameter estimations of the main influencing factors, household type was the key factor that influenced the personal carbon emissions in the Huangnan Prefecture, the Guoluo Prefecture, and the Yushu Prefecture. In order to further explore the impact of household types on personal carbon emissions, we conducted an LSD test (Table 7) and found the average personal carbon emissions of single households with three family members in the Hainan Prefecture were 1.14 t ce higher than those of households with four family members. Further, individuals in a four-member family emitted 0.53 t ce more CO2 annually than individuals in households with over four members. This indicated that when the household population exceeded three members, the effect size of the potential carbon reduction would be weakened when the number of family members rose. There existed significant differences among the different family types in the Guoluo Prefecture. The personal carbon emissions were 6.1 t ce CO2/(per household) for two-member families, 3.76 t ce CO2/(per household) for three-member families, 3.11 t ce CO2/(per household) for four-member families, and 2.31 t ce CO2/(per household) for the families with more than four members, respectively. Therefore, with increasing numbers of family members, the average personal carbon emissions of herder households could be reduced in the Huangnan Prefecture. Such impacts of demographic effects on household carbon reductions were also observed in the Guoluo Prefecture and partly in the Yushu Prefecture, where there were no significant differences in the personal carbon emissions between two-member and three-member families.

5. Discussion

Compared with other studies that relied on modeling, this study carried out a widespread analysis of household carbon emissions based on local widespread surveys, which could provide further insight into the relationships between carbon emissions and herder households. After all, official statistics for herder households have not been developed as well as those for urban and rural households outside of the Qinghai–Tibet Plateau. Further, the carbon issues of herder households have attracted less attention from researchers. Zhang et al. (2023) [49] found that with improvements in living standards, the per capita carbon emissions of non-urban households nearly exceeded those of urban households, based on the differences between the carbon emissions of urban and rural households in thirty provinces in China. Qu et al. (2013) [50] investigated the household carbon emissions in the cold and arid regions of northwestern China, and their results indicated that herder households in high-altitude highlands potentially exhibited the higher personal carbon emissions. Further, Xian et al. (2019) [51] revealed that with advancements in the China Western Development Strategy policy, energy consumption in the Western plateau region was producing a more severe problem of high-intensity exhaust emissions than the Eastern coastal areas. Zhang et al. (2023) [16] found that the per capita carbon emissions of pastoral households in Tibetan areas still were lower than those of the whole country; however, they would be continuously increased with improvements in living standards, which could not be neglected. The aforementioned studies all proposed that the individual carbon emissions of urban and rural households were not consistently greater than those of herder households in some cases. The contributions of carbon emissions from herder households to regional carbon emissions cannot be ignored. This study substantially supported the abovementioned viewpoints based on wide-spread field investigations, and it provides a new perspective for understanding the impacts of herder households on climate change.
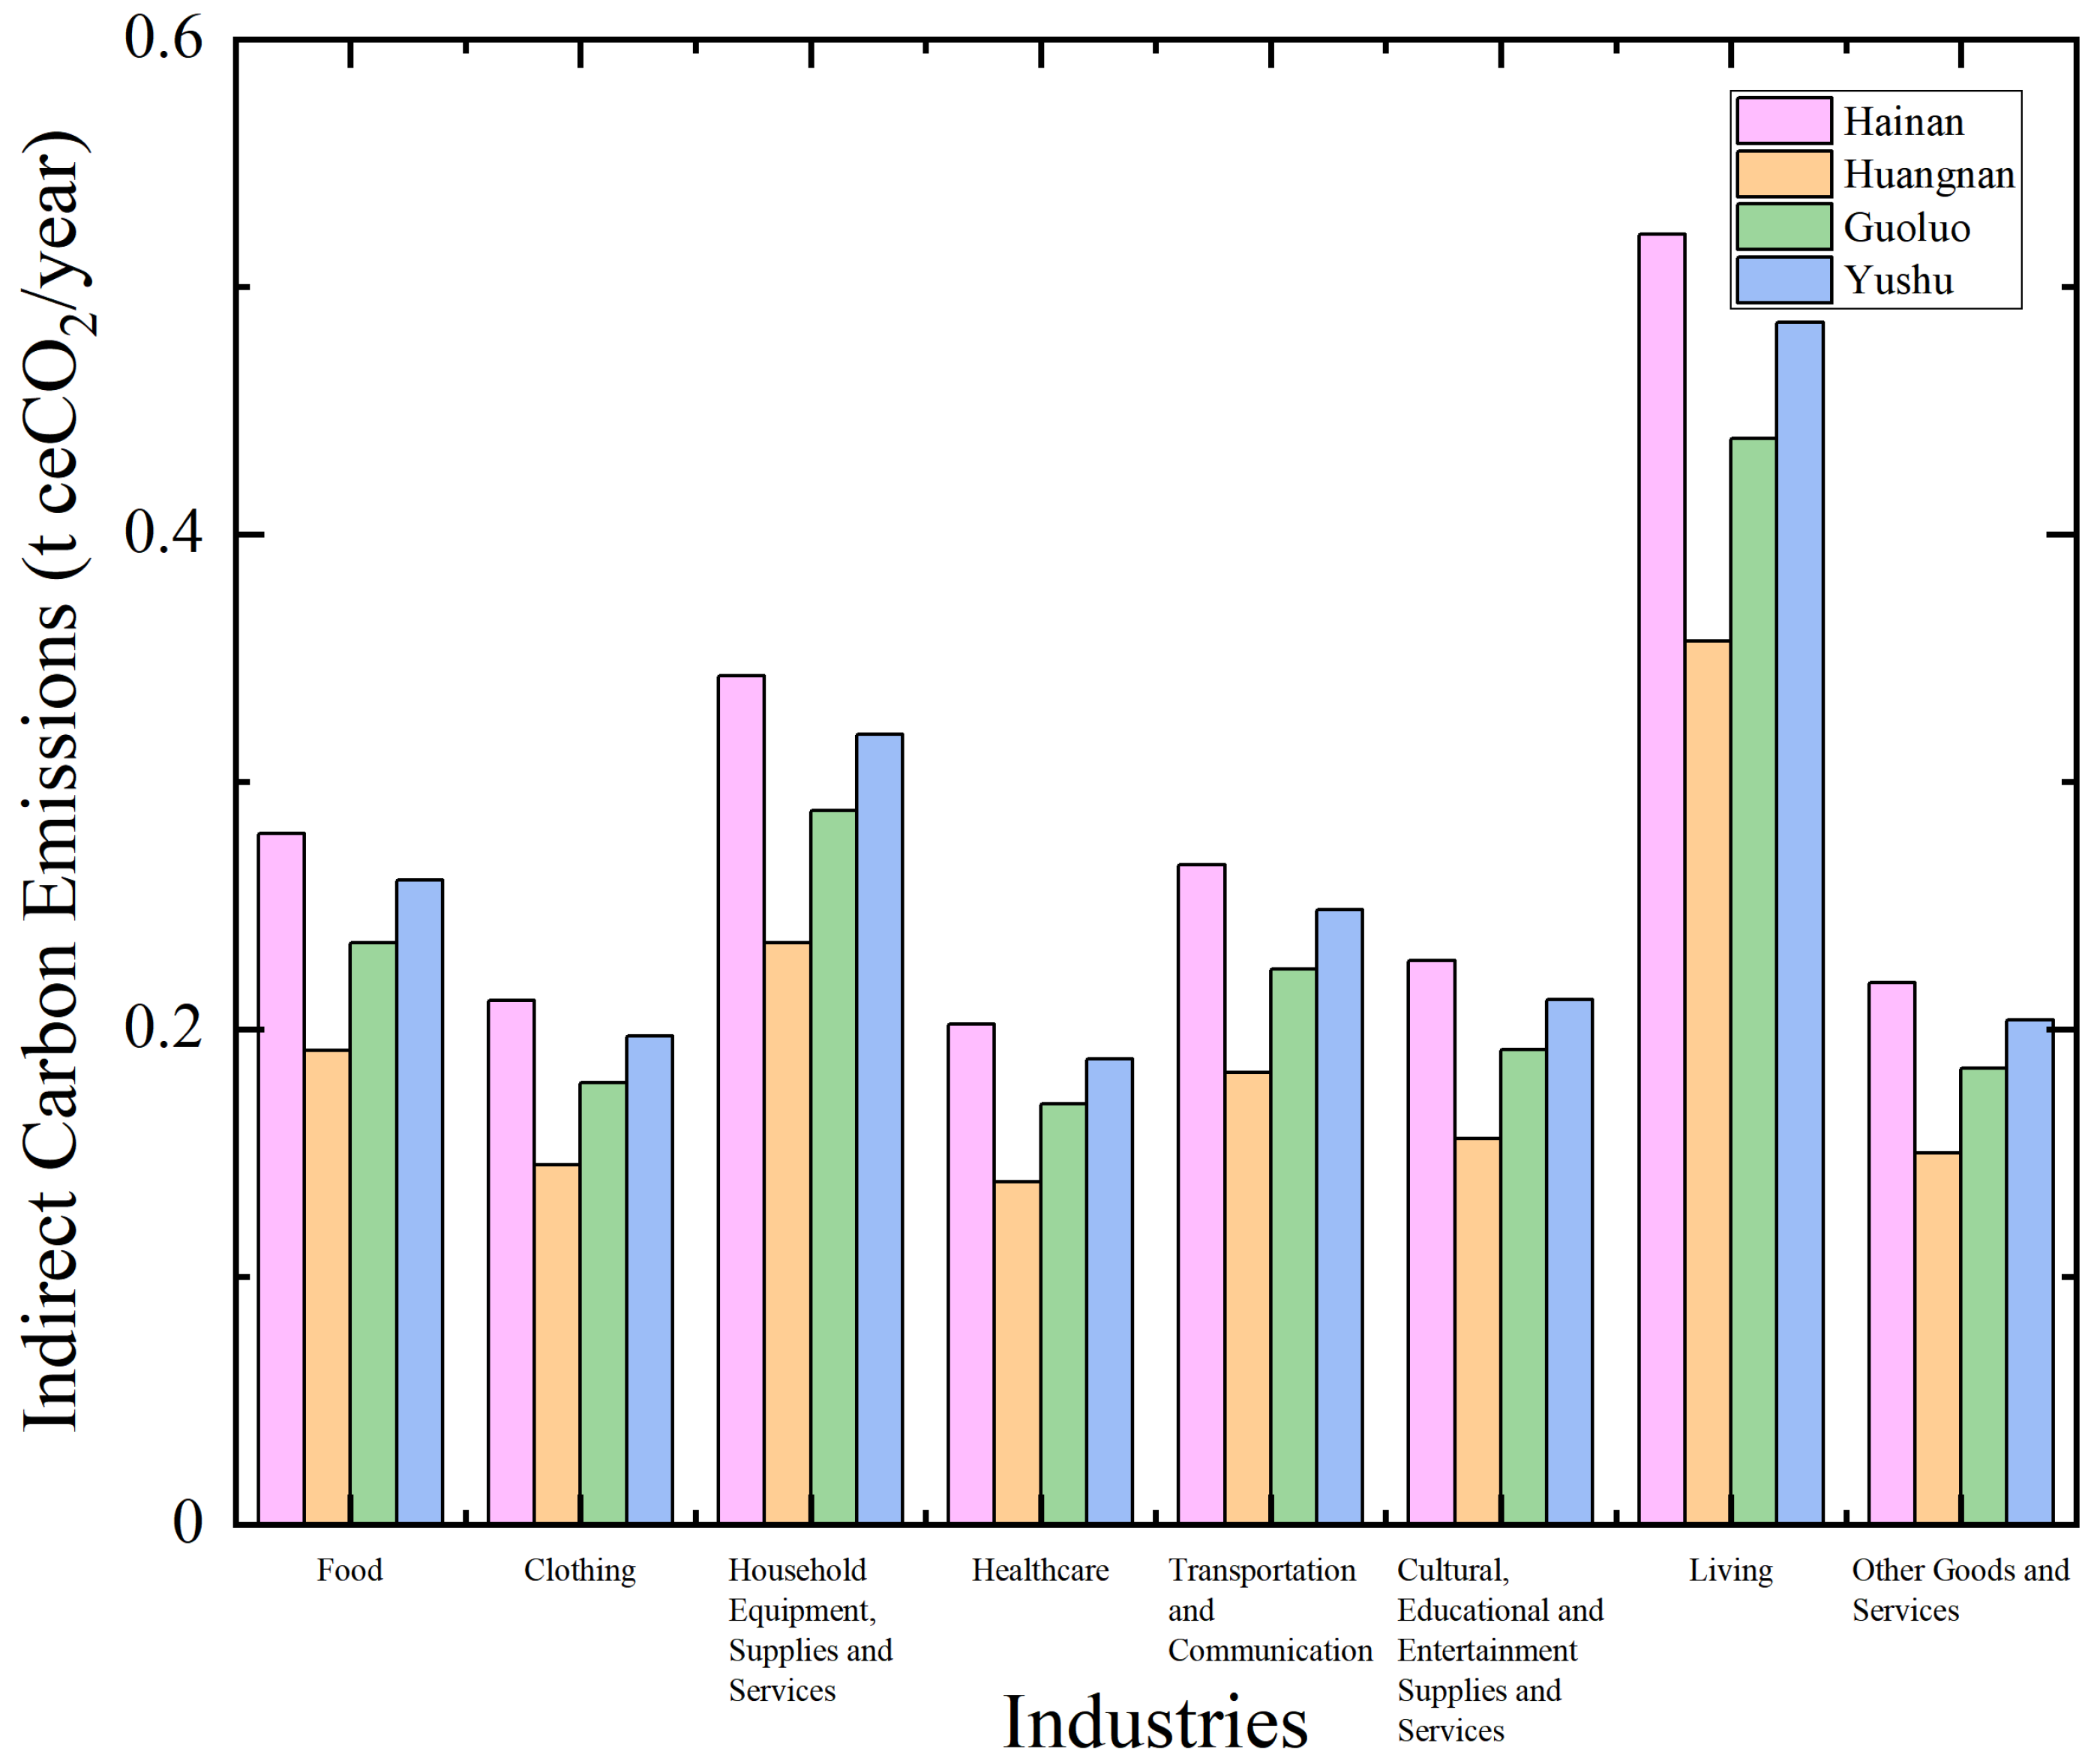
Concerning the differences between direct and indirect carbon emissions, we suggested that household carbon reductions should not merely focus on household energy savings, but also addresses the importance of shifting to low-carbon behaviors for herder households. For example, the carbon emissions generated by the life-cycles of food consumption accounted for the largest proportion of household emissions, and therefore, moderate reductions in meat consumption could reduce carbon footprints during household dining [52,53]. Despite this, may be difficult for the ethnic minorities of herder households to adopt lighter diets without the meat of yak and sheep, since the diets of Tibetans and other ethnic groups, including Huis, Salas, and Mongolians, have long relied on meat consumption. However, the waste production during meat consumption could be reduced, which, to some extent, would contribute to both direct and indirect carbon reductions. Our findings further confirmed that larger household sizes contributed to reductions in personal carbon emissions, which may be attributable to the positive impacts of larger families on food waste reductions. The relevant studies conducted by Song et al. [54], Song et al. [55], and Zhang et al. [56] directly or indirectly support this viewpoint. Meanwhile, this study found a negative correlation between grazing prohibitions and personal household emissions. On the one hand, the governmental promotions of grazing prohibitions have raised awareness about environmental protections, which have guided the herdsmen to embrace more greener lifestyles with less consumption of fertilizers, pesticides, and fossil energies during their residential livelihoods, therefore resulting in lower household carbon emissions. On the other hand, the scale and range of livestock grazing are limited by official grazing prohibitions, and the fossil and non-fossil energy consumption levels related to animal husbandry have been reduced.
It is undeniable that this study had limitations, and they limited our ability to further understand household carbon emissions in the Qinghai–Tibet Plateau. In future, the number of questionnaires during the on-site surveys could be increased to cover more counties located in other plateau regions within the Qinghai–Tibet Plateau. In addition, the frequency of the surveys could be appropriately increased to two or more times in one year, aiming to reveal the seasonal responses of household consumption to climate change. These elements would strengthen the objectivity of the statistical results and improve the ability of the relevant analyses to elucidate the roles of herder households in climate change mitigation.

6. Conclusions

Based on on-site questionnaire surveys, this study estimated direct and indirect household carbon emissions and explored their influencing factors by using an optimal scale regression analysis and multiple comparative analysis methods. Our findings indicated the following: (1) Spatial differences exist in the amounts of household carbon emissions and their compositions in the Sanjiangyuan region. The regional carbon emissions were found to be the highest in Nangqian County and the lowest in Zhiduo County, and the hotspots with higher regional carbon emissions were concentrated in the eastern part of the Sanjiangyuan region. (2) The direct personal carbon emissions were higher for the Yushu Prefecture, and those of the Guoluo Prefecture were the lowest. Indirect carbon emissions were higher than direct carbon emissions in all four prefectures, and the industry sectors of food and housing were the two main indirect emission sources. The Hainan Prefecture exhibited the highest per capita indirect carbon emissions. (3) Household type was the main factor influencing personal carbon emissions across the prefectures. The larger the household population, the lower the personal carbon emissions. However, the effect size of the potential carbon reduction was weakened when the number of family members rose to more than three. (4) We propose that proper grazing prohibitions and low-carbon dietary shifting would contribute to lower-carbon herder livelihoods, especially for small-sized households that should be peer-to-peer targeted by regional government propaganda. Given the limited financial resources in these less-developed regions, this may help to strengthen the implementation of in-depth low-carbon promotions from door-to-door campaigns across the Sanjiangyuan region and even the overall Qinghai–Tibet Plateau.

Author Contributions

Conceptualization, C.S., L.L., C.X. and Z.O.; methodology, C.S., L.L. and C.X.; software, L.L. and F.F.; validation, C.S., L.L. and C.X.; formal analysis, C.S., L.L. and F.F.; investigation, C.S., L.L. and F.F.; data curation, C.S., L.L. and C.X.; writing—original draft preparation, C.S., L.L. and C.X.; writing—review and editing, C.S., C.X. and Z.O.; visualization, C.S. and L.L. All authors have read and agreed to the published version of the manuscript.

Funding

This research was funded by the Second Tibetan Plateau Scientific Expedition and Report, grant number 2019QZKK0308, the National Key Research and Development Program of China (2022YFB3903701), and the National Natural Science Foundation of China (No. 42101290).

Institutional Review Board Statement

Not applicable.

Informed Consent Statement

Not applicable.

Data Availability Statement

The data presented in this study are available from the corresponding author upon reasonable request. The data are not publicly available due to restrictions or privacy.

Conflicts of Interest

The authors declare no conflict of interest.

Appendix A

Table A1. The definitions of variables for household characteristics and their corresponding questions in the questionnaire.
Variable NameVariable DefinitionCorresponding Questionnaire Question
Family TypeSingle family = 1, A family of two = 2, A family of three = 3, A family of four = 4, Family with many members = 5How many people are there in the family? (Fill in the blanks)
Age structureUnder 18 = 0, 18-65 = 1, Over 65 = 2In the first part of the questionnaire, the age of the family members was counted. (Fill in the blanks)
Education LevelIlliteracy = 1, Primary school = 2, Junior high school = 3, High school/Technical secondary school = 4, Junior college = 5, Bachelor’s degree or above = 6, (Monastic education: less than 6 years as primary school = 2, 7 years and above as junior high school = 3)In the first part of the questionnaire, the information table of family members is used to calculate the educational level. (Multiple choice) Options: Illiterate, primary school, junior high school, senior high school/technical secondary school, junior college, undergraduate and above, monastic education
Annual IncomeAnnual personal income (Yuan)In the second part of the questionnaire, annual net income was measured for subsistence activities. (Fill in the blanks)
Solar UtilizationYes = 1, No = 2The third part of the questionnaire, living capital, counted the amount of solar energy. (Fill in the blanks)
Environmental SatisfactionGets better = 1, Stays the same = 2, Gets worse = 3In the fourth part of the questionnaire, ecological policy and perception: do you think the surrounding grassland has become better in the past ten years? (multiple choice) Choice: Better, unchanged, worse
Grazing ProhibitionTighter = 1, Unchanged = 2, Looser = 3In the fourth part of the questionnaire, ecological policy and perception: do you think there has been any change in the prohibition of grazing in the surrounding pastures in the past ten years? (multiple choice) Choice: strict, unchanged, loose
Table A2. The definitions of variables for household carbon estimation and their corresponding questions in the questionnaire.
Variable NameVariable DefinitionInclusion VariableCorresponding Questionnaire Question
Individual Direct Carbon EmissionsDirect carbon emissions from personal energy consumption (t ce/year)Animal ManureIn the third part of the questionnaire, the amount of cow manure and sheep manure used was counted. (Fill in the blanks)
CoalThe third section of the questionnaire, livelihood capital, measured coal use. (Fill in the blanks)
Natural GasThe third part of the questionnaire, livelihood capital, counted natural gas or liquefied gas. (Fill in the blanks)
ElectricityThe third part of the questionnaire, living capital, calculates electricity consumption. (Fill in the blanks)
Individual Indirect Carbon EmissionsDirect and indirect emissions from personal energy consumption (t ce/year)FoodIn the third part of the questionnaire, the living capital is counted the monthly living expenses (food, oil, meat, vegetables, etc.). (Fill in the blanks)
ClothingThe third part of the questionnaire, living capital, calculates the cost of buying clothes. (Fill in the blanks)
Household Equipment, Supplies and ServicesThe third part of the questionnaire, living capital, statistics furniture, appliances, and other durable goods consumer spending. (Fill in the blanks)
HealthcareIn the third section of the questionnaire, living capital, medical expenses were counted. (Fill in the blanks)
Transportation and CommunicationIn the third part of the questionnaire, transportation cost and communication cost are counted, respectively. (Fill in the blanks)
Cultural, Educational and Entertainment Supplies and ServicesIn the third part of the questionnaire, living capital, the expenditure on children’s schooling was calculated. (Fill in the blanks)
LivingIn the third part of the questionnaire, living capital, the consumption of housing construction is counted. (Fill in the blanks)
Other Goods and ServicesIn the third part of the questionnaire, living capital, counted the cost of human favors and gifts, weddings, and funerals, respectively. (Fill in the blanks)

References

  1. Shen, Y.; Sun, X.; Fu, Y. The spatial network and its driving factors for sustainable total-factor ecology efficiency: The case of China. Environ. Sci. Pollut. Res. Int. 2021, 28, 68930–68945. [Google Scholar] [CrossRef] [PubMed]
  2. Pang, Q.; Xiang, M.; Zhang, L.; Chiu, Y.-H. Indirect carbon emissions from household consumption of middle-income groups: Evidence from Yangtze River Economic Belt in China. Energy Sustain. Dev. 2023, 76, 101280. [Google Scholar] [CrossRef]
  3. Jiang, L.; Xue, B.; Xing, R.; Chen, X.; Song, L.; Wang, Y.; Coffman, D.M.; Mi, Z. Rural household energy consumption of farmers and herders in the Qinghai-Tibet Plateau. Energy 2020, 192, 116649. [Google Scholar] [CrossRef]
  4. Peng, S.; Wang, X.; Du, Q.; Wu, K.; Lv, T.; Tang, Z.; Wei, L.; Xue, J.; Wang, Z. Evolution of household carbon emissions and their drivers from both income and consumption perspectives in China during 2010–2017. J. Environ. Manag. 2023, 326, 116624. [Google Scholar] [CrossRef] [PubMed]
  5. Su, S.; Ding, Y.; Li, G.; Li, X.; Li, H.; Skitmore, M.; Menadue, V. Temporal dynamic assessment of household energy consumption and carbon emissions in China: From the perspective of occupants. Sustain. Prod. Consum. 2023, 37, 142–155. [Google Scholar] [CrossRef]
  6. Chen, Z.; Zhang, Z.; Feng, T.; Liu, D. What drives the temporal dynamics and spatial differences of urban and rural household emissions in China? Energy Econ. 2023, 125, 106849. [Google Scholar] [CrossRef]
  7. Jiang, L.; Xing, R.; Chen, X.; Xue, B. A survey-based investigation of greenhouse gas and pollutant emissions from household energy consumption in the Qinghai—Tibet Plateau of China. Energy Build. 2021, 235, 110753. [Google Scholar] [CrossRef]
  8. Yuan, R.; Rodrigues, J.F.D.; Behrens, P. Driving forces of household carbon emissions in China: A spatial decomposition analysis. J. Clean. Prod. 2019, 233, 932–945. [Google Scholar] [CrossRef]
  9. Liang, L.; Wu, W.; Lal, R.; Guo, Y. Structural change and carbon emission of rural household energy consumption in Huantai, northern China. Renew. Sustain. Energy Rev. 2013, 28, 767–776. [Google Scholar] [CrossRef]
  10. Zhou, Y.; Yuan, G.; Cong, Z.; Wang, X. Priorities for the sustainable development of the ecological environment on the Tibetan Plateau. Fundam. Res. 2021, 1, 329–333. [Google Scholar] [CrossRef]
  11. Zhang, J.; Shi, Y.; Xian, C.; Zhang, L.; Zou, Z. How urbanization affect the ecosystem health of Tibet based on terrain gradients: A case study of Shannan, China. Ecosyst. Health Sustain. 2022, 8, 2097449. [Google Scholar] [CrossRef]
  12. Fan, Y.; Fang, C. Insight into carbon emissions related to residential consumption in Tibetan Plateau—Case study of Qinghai. Sustain. Cities Soc. 2020, 61, 102310. [Google Scholar] [CrossRef]
  13. Li, T.; Cai, S.; Singh, R.K.; Cui, L.; Fava, F.; Tang, L.; Xu, Z.; Li, C.; Cui, X.; Du, J.; et al. Livelihood resilience in pastoral communities: Methodological and field insights from Qinghai—Tibetan Plateau. Sci. Total Environ. 2022, 838, 155960. [Google Scholar] [CrossRef] [PubMed]
  14. Ping, X.; Li, C.; Jiang, Z. Household energy consumption patterns in agricultural zone, pastoral zone and agro-pastoral transitional zone in eastern part of Qinghai—Tibet Plateau. Biomass Bioenergy 2013, 58, 1–9. [Google Scholar] [CrossRef]
  15. Wei, Y.-M.; Liu, L.-C.; Fan, Y.; Wu, G. The impact of lifestyle on energy use and CO2 emission: An empirical analysis of China’s residents. Energy Policy 2007, 35, 247–257. [Google Scholar] [CrossRef]
  16. Zhang, H.; Shi, X.; Wang, K.; Xue, J.; Song, L.; Sun, Y. Intertemporal lifestyle changes and carbon emissions: Evidence from a China household survey. Energy Econ. 2020, 86, 104655. [Google Scholar] [CrossRef]
  17. Zhang, Y.; Wang, F.; Zhang, B. The impacts of household structure transitions on household carbon emissions in China. Ecol. Econ. 2023, 206, 107734. [Google Scholar] [CrossRef]
  18. Zhou, Y.; Wang, H.; Qiu, H. Population aging reduces carbon emissions: Evidence from China’s latest three censuses. Appl. Energy 2023, 351, 121799. [Google Scholar] [CrossRef]
  19. Zhou, Y.; Liu, Y. Does population have a larger impact on carbon dioxide emissions than income? Evidence from a cross-regional panel analysis in China. Appl. Energy 2016, 180, 800–809. [Google Scholar] [CrossRef]
  20. Xu, X.; Han, L.; Lv, X. Household carbon inequality in urban China, its sources and determinants. Ecol. Econ. 2016, 128, 77–86. [Google Scholar] [CrossRef]
  21. Golley, J.; Meng, X. Income inequality and carbon dioxide emissions: The case of Chinese urban households. Energy Econ. 2012, 34, 1864–1872. [Google Scholar] [CrossRef]
  22. Akrofi, M.M.; Okitasari, M.; Qudrat-Ullah, H. Are households willing to adopt solar home systems also likely to use electricity more efficiently? Empirical insights from Accra, Ghana. Energy Rep. 2023, 10, 4170–4182. [Google Scholar] [CrossRef]
  23. Zhang, J.; Li, F.; Sun, M.; Sun, S.; Wang, H.; Zheng, P.; Wang, R. Household consumption characteristics and energy-related carbon emissions estimation at the community scale: A study of Zengcheng, China. Clean. Responsible Consum. 2021, 2, 100016. [Google Scholar] [CrossRef]
  24. Zeng, M. Relationship between awareness and behavior of carbon emission reduction in household consumption and its influence path. Bus. Econ. 2023, 7, 5–13. [Google Scholar]
  25. Li, Z.; Li, G.P.; Hu, Z. Xi’an household carbon emission characteristics. Resour. Sci. 2017, 39, 1394–1405. [Google Scholar]
  26. Zhao, M.; Yuan, Z.; Chan, H.S. Housing wealth and household carbon emissions: The role of homeownership in China. Ecol. Econ. 2023, 212, 107908. [Google Scholar] [CrossRef]
  27. Arachchi, J.I.; Managi, S. Social capital, household income and carbon dioxide emissions: A multicountry analysis. Environ. Impact Assess. Rev. 2022, 96, 106838. [Google Scholar]
  28. Adua, L. Super polluters and carbon emissions: Spotlighting how higher-income and wealthier households disproportionately despoil our atmospheric commons. Energy Policy 2022, 162, 112768. [Google Scholar] [CrossRef]
  29. Xia, Y.; Wang, H.; Liu, W. The indirect carbon emission from household consumption in China between 1995–2009 and 2010–2030: A decomposition and prediction analysis. Comput. Ind. Eng. 2019, 128, 264–276. [Google Scholar] [CrossRef]
  30. Ruiping Wang, B.L. Application of optimal scale analysis and implementation of SPSS software. Shanghai Pharm. 2022, 43, 46–49. [Google Scholar]
  31. Xun Xiao, X.Y.; Xin, X. Investigation and analysis for mathematical ability of middle school students with optimal scale regression analysis method. Theory Pract. Contemp. Educ. 2020, 12, 29–35. [Google Scholar]
  32. Li Luo, F.L.; Haiqi, K.; Zhongwei, H. Analysis of factors affecting livestock and poultry disease control act of Beijing: Based on the optimal scaling regression. Mark. Perspect. 2016, 52, 8–13. [Google Scholar]
  33. Büchs, M.; Schnepf, S.V. Who emits most? Associations between socio-economic factors and UK households’ home energy, transport, indirect and total CO2 emissions. Ecol. Econ. 2013, 90, 114–123. [Google Scholar] [CrossRef]
  34. China National Bureau of Statistics. China Statistical Year Book (County-Level) 2022; China Statistics Press: Beijing, China, 2022. [Google Scholar]
  35. China National Bureau of Statistics. China Statistical Year Book 2022; China Statistics Press: Beijing, China, 2022. [Google Scholar]
  36. Liu, M.; Rao, D.; Yang, L.; Min, Q. Subsidy, training or material supply? The impact path of eco-compensation method on farmers’ livelihood assets. J. Environ. Manag. 2021, 287, 112339. [Google Scholar] [CrossRef] [PubMed]
  37. Zhu, D.; Niu, Q.; Wang, Y.; Peng, S.; Lu, X.; Zhou, H.; Zhang, F. The influence of psychological cognition and policy environment on the basin residents’ behavior of ecological compensation under the background of carbon neutrality: A case study in upper Yellow River basin, China. Ecol. Indic. 2023, 148, 110031. [Google Scholar] [CrossRef]
  38. Yang, Q.; Nan, Z.; Tang, Z. Influencing factors of the grassland ecological compensation policy to herdsmen’s behavioral response: An empirical study in Hexi corridor. Acta Ecol. Sin. 2022, 42, 74–79. [Google Scholar] [CrossRef]
  39. Li, Y.; Zhao, R.; Liu, T.; Zhao, J. Does urbanization lead to more direct and indirect household carbon dioxide emissions? Evidence from China during 1996–2012. J. Clean. Prod. 2015, 102, 103–114. [Google Scholar] [CrossRef]
  40. Han, H.; Wu, S.; Zhang, Z. Factors underlying rural household energy transition: A case study of China. Energy Policy 2018, 114, 234–244. [Google Scholar] [CrossRef]
  41. Liu, Y.; Xie, X.; Wang, M. Energy structure and carbon emission: Analysis against the background of the current energy crisis in the EU. Energy 2023, 280, 128129. [Google Scholar] [CrossRef]
  42. Yu, M.; Meng, B.; Li, R. Analysis of China’s urban household indirect carbon emissions drivers under the background of population aging. Struct. Change Econ. Dyn. 2022, 60, 114–125. [Google Scholar] [CrossRef]
  43. China National Bureau of Statistics. China Energy Statistical Year Book 2022; China Statistics Press: Beijing, China, 2022. [Google Scholar]
  44. The Intergovernmental Panel on Climate Change (IPCC). IPCC Guidelines for National Greenhouse Gas Inventories; IPCC WGI Technical Support Unit: Bracknell, UK, 2006. [Google Scholar]
  45. Dong, H.; Geng, Y. Study on Carbon Footprint of the household consumption in Beijing based on Input-Output analysis. Resour. Sci. 2012, 34, 494–501. [Google Scholar]
  46. Yang, Y.Z.; Dan, W.; Fei, X. Construction of cigarette consumer brand preference prediction model based on optional scale regression. China J. Commer. 2022, 80–85. [Google Scholar]
  47. Zheng Wang, W.Z. Relationship between land elements promotion mode and rural revitalization level in Shandong Province based on optional scaling analysis. J. Hebei Agric. Sci. 2021, 25, 20–24. [Google Scholar]
  48. Chen, Y.; Liu, H.; Shi, L. Operation strategy of public building: Implications from trade-off between carbon emission and occupant satisfaction. J. Clean. Prod. 2018, 205, 629–644. [Google Scholar] [CrossRef]
  49. Zhang, S.; Shi, B.; Ji, H. How to decouple income growth from household carbon emissions: A perspective based on urban-rural differences in China. Energy Econ. 2023, 125, 106816. [Google Scholar] [CrossRef]
  50. Qu, J.; Zeng, J.; Li, Y.; Wang, Q.; Maraseni, T.; Zhang, L.; Zhang, Z.; Clarke-Sather, A. Household carbon dioxide emissions from peasants and herdsmen in northwestern arid-alpine regions, China. Energy Policy 2013, 57, 133–140. [Google Scholar] [CrossRef]
  51. Xian, C.; Zhang, X.; Zhang, J.; Fan, Y.; Zheng, H.; Salzman, J.; Ouyang, Z. Recent patterns of anthropogenic reactive nitrogen emissions with urbanization in China: Dynamics, major problems, and potential solutions. Sci. Total Environ. 2018, 656, 1071–1081. [Google Scholar] [CrossRef]
  52. González-García, S.; Esteve-Llorens, X.; Moreira, M.T.; Feijoo, G. Carbon footprint and nutritional quality of different human dietary choices. Sci. Total Environ. 2018, 644, 77–94. [Google Scholar] [CrossRef]
  53. Xian, C.; Gong, C.; Lu, F.; Zhang, L.; Ouyang, Z. Linking dietary patterns to environmental degradation: The spatiotemporal analysis of rural food nitrogen footprints in China. Front. Nutr. 2021, 8, 717640. [Google Scholar] [CrossRef]
  54. Song, G.; Li, M.; Semakula, H.M.; Zhang, S. Food consumption and waste and the embedded carbon, water and ecological footprints of households in China. Sci. Total Environ. 2015, 529, 191–197. [Google Scholar] [CrossRef]
  55. Song, G.; Semakula, H.M.; Fullana-I-Palmer, P. Chinese household food waste and its’ climatic burden driven by urbanization: A Bayesian Belief Network modelling for reduction possibilities in the context of global efforts. J. Clean. Prod. 2018, 202, 916–924. [Google Scholar] [CrossRef]
  56. Zhang, H.; Duan, H.; Andric, J.M.; Song, M.; Yang, B. Characterization of household food waste and strategies for its reduction: A Shenzhen City case study. Waste Manag. 2018, 78, 426–433. [Google Scholar] [CrossRef] [PubMed]
Figure 1. The location of the research area.
Atmosphere 14 01800 g001
Figure 2. Household carbon emissions of different counties and prefectures.
Atmosphere 14 01800 g002
Figure 3. Direct personal carbon emissions among four prefectures in the Sanjiangyuan region.
Atmosphere 14 01800 g003
Figure 4. Indirect personal carbon emission embedded in eight industry sectors among four prefectures in the Sanjiangyuan region.
Atmosphere 14 01800 g004
Table 1. The settings of the independent and dependent variables.
Variable NameVariable SymbolVariable AttributeVariable Definition
Individual Carbon EmissionsYNumerical VariableCarbon emissions from personal energy consumption (t ce/year)
Family TypeX1Ordinal VariableSingle family = 1, a family of two = 2, a family of three = 3, a family of four = 4, and a family with many members = 5
Age StructureX2Ordinal VariableUnder 18 = 0, 18–65 = 1, and over 65 = 2
Education LevelX3Ordinal VariableIlliteracy = 1, primary school = 2, junior high school = 3, high school/technical secondary school = 4, junior college = 5, bachelor’s degree or above = 6, (monastic education: less than 6 years as primary school = 2 and 7 years and above as junior high school = 3)
Annual IncomeX4Numerical VariableAnnual personal income (Yuan)
Solar UtilizationX5Nominal VariableYes = 1 and no = 2
Environmental SatisfactionX6Ordinal VariableGets better = 1, stays the same = 2 and gets worse = 3
Grazing ProhibitionX7Ordinal VariableTighter = 1, unchanged = 2 and looser = 3
Table 2. Industry sectors and the embedded carbon emission intensities corresponding to consumption category.
Consumption CategoryCorresponding IndustryEmbedded Emission Intensity
(t ce/Ten Thousand Yuan *)
FoodFood and tobacco2.3030
ClothingTextiles, Clothing, Shoes, Hats, Leather, Down and associated products1.7465
Household Equipment, Supplies and ServicesWood processing products and furniture + Electrical machinery and equipment2.8267
HealthcareHealth and Social work + Public administration, Social security and social organization1.6650
Transportation and CommunicationTransportation equipment + Communication equipment, Computers and other electronic equipment + Transportation, warehousing and postal services + Information transmission, Software and information technology services2.1963
Cultural, Educational and Entertainment Supplies and ServicesPaper printing and cultural and educational sporting goods + Education + Culture, sports and entertainment1.8771
LivingBuilding + Non-metallic mineral products + Metal products + Rental and business services4.2978
Other Goods and ServicesWholesale and retail + Accommodation and catering + resident services, repairs and other services1.8041
* Purchasing power in 2019 (1 USD = 6.8985 yuan).
Table 3. Basic information of herdsman households across Sanjiangyuan region.
PrefectureCountySample SizeAverage Family SizeAverage AgeAverage LiteracyAverage Annual Income/Yuan *Environmental SatisfactionGrazing Prohibition
Hai nanXing hai1791794.774.7725.6225.621.691.696678.206678.201.561.561.301.3
Huang nanZe ku5577854.564.6129.0630.381.771.835071.737985.551.881.661.971.86
He nan2284.6631.691.8910,899.361.441.75
GuoluoMa qin42714264.434.6629.9026.672.071.887848.066153.101.761.831.791.86
Gan de1804.8725.811.773711.662.081.88
Jiu zhi2564.6828.431.995215.312.361.97
Ban ma2344.8026.131.885074.731.591.97
Da ri1634.8323.821.797559.821.901.86
Ma duo1664.3625.921.787509.041.271.69
Yu shuCheng duo1038194.444.5029.2627.881.831.734520.925883.372.022.211.981.93
Yu shu1694.4626.501.774513.282.051.90
Nang qian2344.8527.101.695373.642.121.85
Za duo1624.7928.811.759348.452.261.77
Zhi duo144.1425.861.503496.002.432.21
Qu malai1374.3029.741.828047.922.381.88
* Purchasing power in 2019 (1 USD = 6.8985 yuan).
Table 4. Descriptive statistics of herdsman households in the Sanjiangyuan region.
Variable NameMinMaxMeanStandard Deviation
Family Size154.580.732
Age0.029829.9420.02
Literacy161.941.25
Annual Income0300,0007226.32816,451.80647
Environmental Satisfaction131.870.934
Grazing Prohibition131.820.934
Table 5. Variance analysis for each model.
PrefectureR2Adjusted R2FP
Hainan0.2230.0871.6450.108
Huangnan0.2940.27012.2850.000
Guoluo0.2080.19313.7000.000
Yushu0.1920.1708.6090.000
Table 6. Parameter estimation results of the main influencing factors of personal emissions.
PrefectureVariableStandardized
Coefficient
(Sig)CorrelationImportanceTolerance
BetaCoefficient Standard ErrorZero-OrderPartial CorrelationPartial CorrelationAfter ConversionBefore Conversion
HainanNumber of people in a family−0.2510.2130.258−0.244−0.255−0.2330.2750.860.85
Age structure0.0220.0690.7490.1350.0240.0210.0130.8980.902
Education level−0.3350.2290.1050.025−0.226−0.205−0.0370.3750.739
Annual total income0.4680.2340.050.2130.2980.2760.4480.3460.685
Environmental satisfaction−0.1750.1250.15−0.23−0.179−0.1610.1810.840.843
Grazing prohibition−0.20.1360.122−0.133−0.204−0.1830.120.8370.92
HuangnanNumber of people in a family−0.460.0470−0.432−0.476−0.4540.6760.9750.977
Age structure0.020.0440.640.0230.0240.020.0020.9960.995
Education level0.2070.04700.1620.2330.2020.1140.9510.968
Annual total income0.1820.0500.140.2090.180.0870.9750.97
Solar energy usage0.0560.040.1660.0850.0650.0550.0160.9570.978
Environmental satisfaction−0.1040.0520.019−0.066−0.118−0.10.0230.9190.957
Grazing prohibition0.1870.04400.1280.2050.1760.0810.8890.945
GuoluoNumber of people in a family−0.3460.0390−0.353−0.359−0.3420.5880.9760.971
Age structure−0.0920.0420.027−0.084−0.102−0.0920.0370.9840.984
Education level−0.0480.0750.522−0.064−0.054−0.0480.0150.9930.993
Annual total income0.1470.03400.1790.160.1440.1260.9720.977
Solar energy usage0.0450.0340.1850.0820.050.0450.0180.9760.976
Environmental satisfaction−0.1240.0410−0.163−0.136−0.1220.0970.9750.979
Grazing prohibition−0.1460.0510.005−0.171−0.158−0.1430.120.9560.961
YushuNumber of people in a family−0.4050.0460−0.399−0.402−0.3940.8420.9480.979
Age structure0.0520.0430.2230.0560.0550.050.0150.9010.887
Education level0.1150.0550.0040.1090.1230.1110.0650.9370.912
Annual total income0.1050.0490.030.0420.110.10.0230.8980.876
Solar energy usage0.0410.0410.3120.0080.0450.040.0020.9520.958
Environmental satisfaction−0.0890.0420.013−0.114−0.094−0.0850.0530.9210.934
Grazing prohibition−0.0860.0470.0390−0.092−0.08300.9430.98
Table 7. LSD test results for household type.
PrefectureHousehold Type
(Number of Family Members)
Mean Difference(I-J)Standard ErrorSignificance95% Confidence Interval
Lower BoundUpper Bound
Hainantwothree−2.057 *0.6730.003−3.386−0.729
four−0.9160.6470.158−2.1920.360
five or more−0.3810.5670.503−1.5010.738
threetwo2.057 *0.6730.0030.7293.386
four1.141 *0.4940.0220.1662.116
five or more1.676 *0.3840.0000.9182.434
fourtwo0.9160.6470.158−0.3602.192
three−1.141 *0.4940.022−2.116−0.166
five or more0.5350.3360.113−0.1281.197
five or moretwo0.3810.5670.503−0.7381.501
three−1.676 *0.3840.000−2.434−0.918
four−0.5350.3360.113−1.1970.128
Huangnantwothree−0.6100.6500.348−1.8850.666
four0.2710.6420.673−0.9891.530
five or more1.0330.6360.105−0.2162.281
threetwo0.6100.6500.348−0.6661.885
four0.880 *0.1760.0000.5351.225
five or more1.643 *0.1530.0001.3411.944
fourtwo−0.2710.6420.673−1.5300.989
three−0.880 *0.1760.000−1.225−0.535
five or more0.762 *0.1150.0000.5360.988
five or moretwo−1.0330.6360.105−2.2810.216
three−1.643 *0.1530.000−1.944−1.341
four−0.762 *0.1150.000−0.988−0.536
Guoluotwothree2.335 *0.3150.0001.7172.953
four2.986 *0.3000.0002.3983.574
five or more3.782 *0.2930.0003.2074.357
threetwo−2.335 *0.3150.000−2.953−1.717
four0.651 *0.1430.0000.3700.932
five or more1.447 *0.1280.0001.1961.698
fourtwo−2.986 *0.3000.000−3.574−2.398
three−0.651 *0.1430.000−0.932−0.370
five or more0.796 *0.0840.0000.6310.961
five or moretwo−3.782 *0.2930.000−4.357−3.207
three−1.447 *0.1280.000−1.698−1.196
four−0.796 *0.0840.000−0.961−0.631
Yushuonetwo−1.1971.0940.274−3.3450.951
three−1.2701.0610.231−3.3520.812
four−0.0251.0590.981−2.1042.054
five or more0.9691.0500.356−1.0913.030
twoone1.1971.0940.274−0.9513.345
three−0.0730.3560.837−0.7730.626
four1.172 *0.3520.0010.4821.863
five or more2.167 *0.3210.0001.5352.798
threefamily1.2701.0610.231−0.8123.352
two0.0730.3560.837−0.6260.773
four1.246 *0.2260.0000.8031.689
five or more2.240 *0.1750.0001.8962.583
fourone0.0251.0590.981−2.0542.104
two−1.172 *0.3520.001−1.863−0.482
three−1.246*0.2260.000−1.689−0.803
five or more0.994 *0.1660.0000.6691.319
five or moreone−0.9691.0500.356−3.0301.091
two−2.167 *0.3210.000−2.798−1.535
three−2.240 *0.1750.000−2.583−1.896
four−0.994 *0.1660.000−1.319−0.669
* indicates p < 0.05.
Disclaimer/Publisher’s Note: The statements, opinions and data contained in all publications are solely those of the individual author(s) and contributor(s) and not of MDPI and/or the editor(s). MDPI and/or the editor(s) disclaim responsibility for any injury to people or property resulting from any ideas, methods, instructions or products referred to in the content.

