Article

Ecological and Risk Assessment of Heavy Metals in a Diverse Industrial Area of Al-Akrasha, Egypt

by
Atef M. F. Mohammed
1,*,
Inas A. Saleh
1,
Hend R. Zahran
2 and
Nasser M. Abdel-Latif
1
1
Air Pollution Research Department, Environment and Climate Change Research Institute, National Research Centre, Giza 12622, Egypt
2
Head of Laboratory of the Environmental Monitoring Center—Central Administration for Environmental Affairs (EMOHC), Egyptian Ministry of Health and Population, Cairo 71529, Egypt
*
Author to whom correspondence should be addressed.
Atmosphere 2023, 14(12), 1745; https://doi.org/10.3390/atmos14121745
Submission received: 10 October 2023 / Revised: 13 November 2023 / Accepted: 22 November 2023 / Published: 27 November 2023

Abstract

:
This study was conducted in one of a diverse industrial area in Al-Akrasha, Egypt. Concentrations of select metals (Cu, Pb, Cr, Ni, Zn, Mn, Cd, Al, Ag, As, B, and Fe) were evaluated in ambient PM10 and surface soils at nine sites. Random samples of fresh edible tilapia fish were collected from Ismailia Canal at two sites near the Al-Akrasha region. In addition, blood and hair samples were collected from workers and residents living in Al-Akrasha as biomarkers of contamination with these metals. The ecological and health risks of these metals to the workers and residents living in the Al-Akrasha region were assessed. The results showed that heavy metal levels in the ambient air (PM10) of the Al-Akrasha region were higher than the national and international guidelines. There was a very high degree of contamination (CD > 32) of the surface soil in the Al-Akrasha area, which can be attributed to industrial activities emissions, mostly from smelters and the subsequent deposition on the surface soil. Ingestion was the dominant pathway for metals to enter the human body in the Al-Akrasha region. Adults have a higher daily intake and exposure risk than infants and children.

1. Introduction

Environmental pollution is one of the most important challenges and obstacles facing Egypt owing to the significant impact of the rate of development in all fields [1,2]. The problem has emerged due to the progress in various industries and their associated emissions. Additionally, the huge increase in population has increased the number of vehicles operating with fossil fuels; despite their necessity for modern life, this has worsened the air pollution.
Environmental issues related to soil and air pollution are becoming more significant in daily life. Environmental pollution with heavy metals has aroused the interest of scientists since ancient times because of its serious effects. The common presence of metals in the environment occurs through their spread from natural sources or their widespread use in various industrial processes; metals play an important role in industrial development and technology [3]. Heavy metals are naturally occurring elements of the Earth’s crust, having a density greater than 5 g/cm3 in their standard state [4]. Because of human activity, there are now more heavy metals in the environment [5]. Heavy metals are produced in the environment from various sources, such as industry, agriculture, roads, and transportation. Moreover, fertilizers have the potential to release excessive amounts of heavy metals into the environment. Heavy metals are widely found in almost every industry, such as pharmaceuticals, hardware, steel, and chemicals, in addition to daily life products like detergents, shampoos, cosmetics, and batteries. In addition, emissions from the metallurgical sector in various chemical forms during the smelting of non-ferrous metals contribute to heavy metal pollution. Unique trace elements may be released by certain processes, such as copper from copper smelters, zinc from incineration, lead from lead smelters, nickel and vanadium from heavy oil combustion, and metal manufacturing and processing [6].
Heavy metals contamination has devastating effects on the ecological balance of the receiving environment. It is clear that the anthropogenic inputs of heavy metals into the environment are much higher than the natural inputs. For example, anthropogenic inputs are almost twice as high as the natural inputs of mercury, copper, lead, and zinc. Cigarette smoking is one of the main sources of cadmium exposure in humans, and eating certain foods contaminated with cadmium is another source that accounts for the majority of cadmium exposure in non-smokers [7,8,9].
Heavy metals pollution has a severe risk due to their bio-accumulation and toxic effects [10]. Heavy metals cannot be degraded or destroyed, and they accumulate in soil, food, drinking water, and suspended dust. Pb, Ni, Cd, As, Cr, Al, and Cu are some of the metals chosen to evaluate the environmental quality [3,11,12]. Heavy metals such as Mn, Zn, Mo, Ni, Cu, Fe, and Co are essential for lifecycles completion, but they become toxic when they are above the permissible values [13,14]. The pathways for many metals to enter the human body are respiration, ingestion, and skin adsorption [15].
To reduce the impact of metal smelters on the environment of Egypt, the government has developed a Lead Smelters Action Plan (LSAP). In order to create a comprehensive plan for lead abatement in Cairo, the Egyptian Environmental Policy Project (EEPP) and Cairo Air Improvement Project (CAIP) collaborated with the Egyptian Environmental Affairs Agency (EEAA) and one of Cairo’s major lead producers and lead dust emitters (Awadallah Family Company, Cairo, Egypt). The EEAA Lead Exposure Abatement Plan (LEAP) covers all lead pollution-related sources, exposure pathways, and corrective measures in the greater Cairo region. In this plan, secondary lead smelters that are situated in low-income and heavily inhabited areas have drawn more attention. Thus, the Egyptian government through LSAP, CAIP, and EEPP collaborated to organize operations and transfer the smelters to a new, more contemporary location in the Abu-Zaabal Industrial Zone in Qalyubia Governorate, Egypt. This move left heavily lead-dust-contaminated structures in its wake [16,17]. Industry is one of the basic economic activities in Qalyubia Governorate due to the existence of several industrial facilities dispersed throughout the governorate. Most of these activities are centered in the Abu Zaabal region, one of the villages where many factories are concentrated [18]. Al-Khanka is an industrial zone that was chosen for the Cairo Air Improvement Project based on the most recent technological advancements for foundries and has zero polluting emissions. In addition to the large industrial zones dispersed throughout Qalyubia Governorate, there are some diverse industrial areas that are plagued by numerous unregulated industrial activities and the consequences of pollution there. The most well-known of these areas is Al-Akrasha, which is regarded as one of the most significant and substantial industrial slums. Around 500 factories in the Al-Akrasha region employ roughly 15,000 people across a variety of industries, the most significant of which are plastics, chemicals, cartons, glass, and others [18]. Al-Akrasha is the largest diverse industrial and residential area in Al-Khanka. One of the most significant issues that the Al-Akrasha region faces is the absence of sanitation for these enterprises, which leads to the disposal of their waste in agricultural drainages. Living close to industrial complexes is linked to having worse health consequences according to a number of studies [19,20,21,22,23,24]. Epidemiological studies have demonstrated that prolonged exposure to air pollution (over a number of years) lowers life expectancy, primarily as a result of lung cancer and cardiovascular and respiratory disorders [25,26]. Short-term (over hours or days) exposure to high air pollution levels can also have a variety of detrimental impacts, such as changes to lung function, an aggravation of asthma, an increase in cardiovascular and respiratory hospital admissions, and an increase in mortality [26,27]. Biomarkers (such as plants, plankton, animals, and microbes) can be used to monitor the environment, so they are a useful way to measure the negative effects of industrial activity on the environment [28].
The main objective of this study was to assess the potential environmental risks as a result of exposure to heavy metals in ambient air, surface soil, and edible fish on the population and the environment of a diverse industrial area in Al-Akrasha, Qalyubia Governorate, Egypt. This study aimed to: (1) evaluate the concentration levels of select metals (Pb, Cu, Mn, Zn, Cr, Cd, Ni, Al, and Fe) in particulate matter (PM10) in the air and surface soils at industrial sites located in Al-Akrasha, Qalyubia, Egypt; (2) study the concentration levels of selected metals in edible tilapia fish, the hair and blood of workers, and populations living in the Al-Akrasha area as biomarkers of contamination with these metals; and (3) assess the ecological and health risks (non-carcinogenic and carcinogenic) of these metals to the workers and residents living in this area.

2. Materials and Methods

2.1. Description of the Study Area

This study was conducted in a diverse industrial area in Al-Akrasha, Egypt. The Al-Akrasha area is a village affiliated with the Abu-Zaabal industrial area (north of Cairo city), and it is one of the most important industrial areas in the Qalyubia Governorate. It has an area of 494.4 acres with the coordinates 30°14′41” N–31°22′35” E. More than 10,000 citizens and about 20,000 workers are living in Al-Akrasha in homes between the fumes of factories. The Al-Akrasha area contains diverse factories; there are about 480 workshops and factories, according to the governorate’s inventory: 80 foundries and metal-forming factories; 30 plastic factories; 15 iron-rolling factories; 10 factories for iron, copper, aluminum, and other metals wire drawing; 30 glass, wire, and nails manufacturing plants; 90 factories for plastic, cotton, and textiles; and 225 assorted small and micro workshops (Figure S1) [29]. The Awadallah lead smelter is considered one of the largest smelters in Egypt, and it was transferred to the Abu-Zaabal area in 2000 [30]. The Al-Akrasha area is located near the Awadallah Factory for Melting, Refining and Manufacturing of Lead; the waste incinerator of the Ministry of Health and Population; and Abu-Zaabal Fertilizers and Chemicals Company [29,31]. The Ismailia Canal is a canal in Egypt that starts from the Nile River north of Cairo and branches into two branches; one of them irrigates the governorate of Qalyubia and passes through the AL-Akrasha area, which supplies the area with water and fish [32].

2.2. Sampling at the Al-Akrasha Region

2.2.1. PM10 and Soil Samples

During the current study, the pump for our PM2.5 sampling device burned up and no longer worked. The financial support that we needed to buy a new pump was not available at that time.
Therefore, 9 sites were chosen for collecting samples of suspended particulate matter (PM10) and surface soil over one year (from March 2019 to March 2020). The chosen sites were in two areas: 4 sites in the Al-Akrasha industrial and residential area and 5 sites around the Awadallah Factory for Melting, Refining and Manufacturing of Lead; these sites are shown in Figure 1.

2.2.2. Edible Fish Samples

Edible fish samples were collected from Ismailia Canal at two sites (A and B) near the Al-Akrasha region.

2.2.3. Blood and Hair Samples

Blood and hair samples were collected from working staff at a health center branch of the Ministry of Health and Population of the Al-Akrasha region, residents living in the Al-Akrasha region, and workers at Awadallah Factory.

2.3. Determination of Heavy Metals in PM10 and Surface Soil

2.3.1. PM10

PM10 samples were collected on glass filters (Whatman-GF) according to a gravimetric method (Method IO-2.1) using a high-volume sampler [33]. Loaded filters were digested using a high-performance microwave digestion system. Concentrations of the selected metals (Cu, Pb, Cr, Ni, Zn, Mn, Cd, Al, Ag, As, B, and Fe) were determined using the EPA 3051 method and by spectroscopy (MP–AES microwave plasma—ICP—OES—Mercury analyzer).

2.3.2. Surface Soil

Soil samples were obtained with a hand auger from the surface soil only (to a maximum depth of 10 cm) [3]. These samples were suitably packaged and transported to the laboratory for sample preparation and analysis [34]. In the laboratory, the samples were air dried at room temperature, and the coarse impurities of the samples were removed using 1.0 mm mesh nylon. The rest was homogenized and sieved through six sieve sizes (less than 45 μm, 45–106 μm, 106–150 μm, 150–212 μm, 212–250 μm, more than 250 μm) and stored in small self-sealing plastic bags for analysis. Soils with different particle sizes were analyzed to determine their metal concentrations [35,36]. For determination of heavy metal concentrations, wet digestion of the dried samples was conducted using concentrated H2SO4 and a 30% H2O2 mixture. First, 0.5 g of the dry ground sample was placed in a 100 mL beaker, and then 3.5 mL of 30% H2O2 was added. The contents of the beaker were heated to 100 °C, and the temperature was gradually increased to 250 °C and left at this temperature for 30 min. The beaker was cooled, an additional 1 mL of 30% H2O2 was added to the digested mixture, and the contents were reheated again. The digestion process was repeated multiple times until a clear solution was obtained. The clear solution was transferred to a 50 mL volumetric flask and topped off with deionized water [3]. Then, the selected metals were determined by spectroscopy (MP–AES microwave plasma—ICP—OES—Mercury analyzer).

2.4. Determination of Heavy Metals in Biomarkers (Fish, Hair, and Blood)

2.4.1. Fish Samples

Random samples of fresh edible tilapia fish were collected from Ismailia Canal at two sites near the Al-Akrasha area in Qalyubia Governorate, Egypt. All collected samples were examined for determination of heavy metals (Pb, Cd, and Hg) levels on the basis of wet weight (mg/Kg). Fish heads, fins, and inner organs together with hard roe were removed. First, 0.1–0.2 kg of fresh fish was placed in a polyethylene bag and frozen to −20 °C for 4–6 h, followed by warming to −2 °C. A sample of 0.3–0.5 g was weighed in a plastic test tube, 2.5 mL of concentrated HNO3 was added, and the sample was stirred at room temperature for 30 min. Then, 5 mL of deionized H2O and 1 mL of a 30% H2O2 solution were added. Samples of fish were digested by high performance microwave digestion in the Toxicology Laboratory of the Central Administration of Environmental Affairs (EMOHC)—Ministry of Health and Population. Afterwards, the sample was combined with deionized H2O while stirring until a volume of 50 mL was reached [37]. Metals (Pb, Cd, and Hg) were determined using spectroscopy (MP–AES microwave plasma—ICP—OES—Mercury analyzer).

2.4.2. Hair Samples

Hair samples were collected from workers at Awadallah Factory. The hair samples were stored in polyethylene bags at room temperature until analysis. Hair samples were cut into pieces as small as possible and washed three times under continuous stirring with a mixture of ethyl ether/acetone (3:1 v/v), followed by soaking in a 5% EDTA solution for 30 min. Samples were then rinsed three times with deionized water, dried in an oven at 80 °C until a constant weight was achieved, and stored in polyethylene bags. A 0.5 g portion of the prepared sample was accurately weighed using an analytical balance and transferred to a digestion vessel. A mixture of 2 mL nitric acid and 1 mL of 30% hydrogen peroxide was added at room temperature and left to predigest for 12 h. The vessels were then placed in the oven at 160 °C for 4 h. Once the digestion was complete, the vessels were allowed to cool to room temperature. The sample was diluted to 10 mL using deionized water [38]. Metals (Pb, Ni, Cu, Pb, Cd, Zn, and Cr) were determined using graphite furnace atomic spectroscopy (AAS).

2.4.3. Lead in Blood Samples

Blood lead level (BLL) indicates if a person was exposed to lead [39,40]. Blood samples were collected from staff working at a health center of the Ministry of Health and Population, residents living in the Al-Akrasha region, and workers at Awadallah Factory. An anti-coagulant was added to the whole blood samples, which were placed in a refrigerator. Each sample was placed in a 100 mL volumetric flask followed by adding 10 mL of nitric acid. This was placed on a hot plate for about 2 h, and the temperature was increased to 160 °C; then, the samples were boiled for 2 h to reduce the volume. Samples were filtered by filter discs with a grade of 389 and allowed to cool. After completion of digestion, 10 mL of hydrogen peroxide was added. Finally, samples were diluted with deionized water until a volume of 50 mL was achieved [41]. Lead level was determined using graphite furnace atomic spectroscopy (AAS) at the Toxicology Laboratory of the Central Administration of Environmental Affairs (EMOHC)—Ministry of Health and Population.

2.5. Ecological Risk Assessment of Heavy Metals

Different factors were used to identify the soil contamination and pollution. Some of the factors used in the current study are described in the following sections.

2.5.1. Geo-Accumulation Index (Igeo)

The geo-accumulation index (Igeo) is generally used to quantify the anthropogenic contamination in surface soil as introduced by Muller (1981) [42] and corroborated by the prominent works of Forster et al., 1993 [43]; Loska et al., 2003 [44]; Lu et al., 2009; 2010 [45,46]; Gowd et al., 2010 [47]; and Manoj et al., 2012 [48]. This index evaluates the contamination levels by comparing present concentrations with background levels (Table 1) [31,34,49,50,51]. Igeo is expressed as Equation (1a):
(Igeo) = log2 [Cn/1.5 Bn]
where Cn and Bn are the measured and background concentrations, respectively, of the metal (n) (Table S1) and 1.5 is the correction factor used to account for possible variability in the background data due to lithological variation. Metal concentrations of average continental crust were used as the background concentrations for metals [52]. According to Table S2, Muller (1981) [42] classified Igeo values into 6 classes.

2.5.2. Contamination Factor (CF) and Contamination Degree (CD)

The CF and CD are used to assess the pollution load of surface soil dust with respect to heavy metals. The CF for each metal is calculated according to Equation (1b) [31,48,53]:
CF = Cmetal/Cbackground
where CF is the contamination factor and Cmetal is the concentration of metal in surface soil dust. Cbackground is the background value for the metal. CD is calculated as the sum of all contamination factors for each sample in Equation (1c), and n is the number of metals [54]. The CF and CD were classified into four groups according to Nasr et al., 2006; Rastmanesh et al., 2010; Mmolawa et al., 2011; and Sherif and Atwany, 2019 [31,53,55,56], as shown in Table S2.
CD = ∑(CF1 + CF2 + CF3 + CF4 … CFn)

2.5.3. Modified Contamination Degree (mCd)

The mCd is defined as the sum of all contamination factors as described by Abrahim (2005), which is calculated by Equation (1d), and its values were used in the classification of contamination degree (Table S2) [31].
mCd = ∑(CF1 + CF2 + CF3 + CF4 … CFn)/n
where n is the number of metals and CF is the contamination factor.

2.5.4. Pollution Load Index (PLI)

The PLI is used to estimate the metals contamination status and the necessary action that should be taken. It was developed by Thomilson et al. (1980) [57] as Equation (1e) [31]:
PLI = (CF1 × CF2 × CF3 × … × CFn) ½
where n is the number of metals and CF is the contamination factor. PLI values were classified into groups (as shown in Table S2).

2.6. Health Risk Assessment of Heavy Metals

2.6.1. Estimation of Exposure Dose (D) from PM10 and/or Surface Soil

Inhalation is an important pathway for human exposure to heavy metals from the atmosphere or surface soil. Exposure doses from inhalation (DInhalation) can be calculated by Equation (2a). The parameters are illustrated in Table S3.
DInhalation = (C × InhR × EF × ED)/(BW × AT × PEF)
Ingestion can occur by the inadvertent consumption of atmospheric dust or surface soil on the hands or food items, mouthing of objects, the ingestion of unusually high amounts of atmospheric dust or surface soil, or through intentional ingestion. Exposure doses from ingestion of atmospheric dust or surface soil (DIngestion) can be calculated by Equation (2b) [58]:
DIngestion (mg/kg/day) = (C × IngR × EF × ED × CF)/(BW × AT)
Dermal absorption of heavy metals from atmospheric dust or surface soil depends on the area of contact, the duration of contact, and the ability of heavy metals to penetrate the skin. Exposure doses from dermal contact with atmospheric dust or surface soil (DDermal contact) can be calculated by Equation (2c). The parameters are illustrated in Table S3.
DDermal contact = (C × SA × TS × AF × EF × ED × CF)/(BW × AT)
The average daily dose from atmospheric dust or surface soil (ADD) can be calculated by Equation (2d):
The Average Daily Dose (ADD) = Σ (Ding + Dinh + Ddermal)

2.6.2. Non-Carcinogenic Risk Calculation

The hazard quotient (HQ) is used to analyze the potential non-carcinogenic effect of metals in PM10 and surface soil. The HQ of each metal was related with the reference dose (RfD, mg/kg/day). If the HQ value is less than 1, this indicates that it does not reflect any obvious risks. The US EPA estimates the HQ by Equation (2e) [59,60]. All parameters are defined in Table S3.
HQ (mg/kg/day) = (DIngestion or DInhalation or DDermal contact)/(RfD)
The hazard index (HI) is defined as the sum of the HQs of the individual metal as described in Equation (2f) [59,60]. HI was used to describe the cumulative non-carcinogenic effects. When HI < 1, no health risk is expected to occur; if HI ≥ 1, there is moderate or high risk of adverse effects for humans [60].
HI = HQ(metal-1) + HQ(metal-2) + … + HQ (metal-n)

2.6.3. Carcinogenic Risk Calculation

The risk index (RI) represents the lifetime probability of developing any type of cancer. It is calculated by integrating the D with the respective cancer slope factor (CSF) for heavy metals. The cancer slope factor (CSF) is used to estimate the risk of cancer along with exposure to a substance that is or may be carcinogenic. RI is presented in Equation (2g) [60]:
RI = (DIngestion or DInhalation or DDermal contact) × CSF
The RI is considered nonsignificant if it is <10−6, the RI is considered allowable or tolerable if it is 10−6 < RI < 10−4, and the RI is considered significant if it is >10−4 [60]. All parameters are defined in Table S3.

2.7. Health Risk Assessment of Fish Consumption

2.7.1. Calculation of Bio-Accumulation Factors (BAF)

BAF was calculated from Equation (3a) [61]:
BAF = (Cfish/Csoil) × 100%
where Cfish and Csoil refer to heavy metal concentrations (mg/mg) in fish and surface soil. If BAF is higher than 100%, it indicates bio-accumulation of heavy metals in the fish sample.

2.7.2. The Exposure Daily Intake (EDI)

The risk assessment for infants, children, and adults was performed to estimate the possible hazard associated with the consumption of heavy metals contained in fish. The exposure daily intake (EDI) is based on the concentration of the element and the amount of fish ingested [60,62,63]. Therefore, the EDI of heavy metals was calculated by Equation (3b). All parameters are defined in Table S4.
EDI (mg/kg/day) = (C × FIR)/BW
where EDI is the exposure daily intake (mg/kg/day), FIR is the fish ingestion rate (kg/day), and C is the heavy metals concentrations (mg/mg) in edible fish.

2.7.3. Non-Carcinogenic Risk of Metals in the Edible Fish

The target hazard quotient (THQ) is used to analyze the potential non-carcinogenic effect of the metals in the edible fish. The EDI of each heavy metal was related to the oral reference dose (RfD, mg/kg/day). If the THQ value is less than 1, this indicates that it does not reflect any obvious risk. The US EPA estimates the THQ using Equation (3c) [59,60]. All parameters are defined in Table S3.
THQ (mg/kg/day) = (EF × ED × FIR × C)/(RfD × BW × AT)
The hazard index (HI) is defined as the sum of the THQs of the individual heavy metals as described in Equation (3d) [59,60]. The HI was used to describe the cumulative non-carcinogenic effects. When HI < 1, no health risk is expected to occur; if HI ≥ 1, there is a moderate or high risk of adverse effects for humans [60].
HI = THQ(metal-1) + THQ(metal-2) + … + THQ (metal-n)

2.7.4. Carcinogenic Risk Calculation

The risk index (RI) represents the probability of developing any type of cancer over a lifetime. It is calculated by integrating the EDI with the respective oral cancer slope factor (CSF) for heavy metals. The cancer slope factor (CSF) is used to estimate the risk of cancer along with exposure to a carcinogenic or probably carcinogenic substance. RI is presented in Equation (3e) [60]:
RI = EDI × CSF
The RI is considered nonsignificant if it is <10−6, the RI is considered allowable or tolerable if it is 10−6 < RI < 10−4, and the RI is considered significant if it is >10−4 [60].

2.8. Meteorological Parameters

The meteorological parameters (temperature, humidity, wind speed, wind direction, precipitation) were collected from the satellite weather station at Abu-Zaabal city representing the Al-Akrasha area over one year (from March 2019 to March 2020) [64].

3. Results and Discussion

3.1. Heavy Metals Concentrations in Particulate Matter (PM10)

Annual average concentrations (mg/kg) of heavy metals (Cu, Pb, Cr, Ni, Zn, Mn, Cd, Al, Ag, As, B, and Fe) that were analyzed in PM10 samples collected from the atmosphere at different sites in the Al-Akrasha region during the period of 2019–2020 are shown in Figure 2.
This figure shows higher concentration levels of most heavy metals at site 6 and site 2. These higher concentrations can be attributed to local emissions from industrial activities in the Al-Akrasha area, as site 6 is located close to the Awadallah Factory for Melting, Refining and Manufacturing of Lead, and site 2 is located in the Al-Akrasha industrial area close to foundries, metal forming, and various industrial activities such as workshops of plastic, iron rolling, glass, and textiles (as shown in Figure S1).
Figure 3 shows annual mean concentrations of heavy metals in the ambient air (PM10) of the Al-Akrasha region. The results showed that the heavy metal concentrations found were arranged in the following order: Fe (3.54 mg/m3) > Mn (0.837 mg/m3) > Pb (0.676 mg/m3) > Al (0.428 mg/m3) > Cu (0.257 mg/m3) > Cr (0.162 mg/m3) > B (0.156 mg/m3) > Ag (0.104 mg/m3) > Ni (0.068 mg/m3) > Zn (0.057 mg/m3) > As (0.008 mg/m3) > Cd (0.011 mg/m3). These results may be attributed to unpaved roads and different industrial activities in the Al-Akrasha region, including foundries; metal forming; plastic factories; iron-rolling factories; factories for iron, copper, aluminum, and other metals wire drawing; glass, wire, and nails manufacturing plants; and cotton and textiles factories.
Table S4 shows a comparison of the concentrations of heavy metals recorded in the current study with other findings in Egypt and other regions around the world. There were no guidelines indicating levels of heavy metals (Cu, Pb, Cr, Ni, Zn, Mn, Cd, Al, Ag, As, B, and Fe) in PM10 in Egypt, except for Pb (0.001 mg/m3). Therefore, the heavy metal contents in PM10 samples were evaluated through their comparison with worldwide guidelines (as shown in Table S4). The results indicated that the concentration levels of heavy metals in PM10 collected from the Al-Akrasha region were higher than the national and international guideline values, except for Fe, which was lower than guideline value set in Nigeria (Table S4). Table S4 also shows that most of the metals in the present results were higher compared with the concentration levels found in the Al-Akrasha region by Sherif and Atwany (2019) [31]. Furthermore, the concentration levels of some metals in the current study were in agreement with those recorded in many countries, except for Pb, the concentration of which was higher (Table S4).

3.2. Heavy Metals Contamination in Surface Soil

The most significant heavy metals in terms of potential risks and their presence in polluted surface soil were Cu, Pb, Cr, Ni, Zn, and Cd [31]. The annual average concentrations (mg/kg) of heavy metals (Cu, Pb, Cr, Ni, Zn, and Cd) that were analyzed in surface soil samples collected from different sites in the Al-Akrasha area during the period of 2019–2020 are presented in Figure 4. This figure shows that the highest concentration levels of most heavy metals were found in site 6 near Awadallah Factory.
This may be due to inputs of heavy metals from the atmosphere into agricultural systems, which can contribute significantly to metal loading in the surface soil. Surface soil acts as a significant sink for the ions of heavy metals that can then enter the food chain through plants or leaching into groundwater.
These metals may be concentrated in the surface soil due to different sources, such as anthropogenic contamination, metal deposits, and additional to natural agriculture sources. The most significant industrial sources of heavy metals in the Al-Akrasha region’s environment are thought to be the chemical and metallurgical sectors. Figure 5 shows the heavy metals average concentrations found in the Al-Akrasha surface soil. The results in this figure show that Pb had the highest concentration in the surface soil samples in the Al-Akrasha region, while Cd had the lowest. The results show that the heavy metals in the surface soil were arranged as follows: Pb > Cu > Cr > Ni > Zn > Cd (i.e., the same arrangement of heavy metals in the PM10 samples, as shown in Figure 5).
Table S4 shows a comparison of heavy metal concentrations found in the surface soils in the current study with other findings around the world. In Egypt, there are no guidelines regarding heavy metal levels in surface soil. Consequently, the heavy metal levels in the analyzed surface soil samples were assessed by comparing them to global guidelines (as shown in Table S4). The results indicated that the concentration levels of heavy metals (Pb, Cr, Cu, Ni, Cd, and Zn) in the surface soil collected from the Al-Akrasha region were lower than the guideline values according to the Chinese standard [65], Indian standard [66], NJDEP limits [67,68], EU standards [31], EPA limits [69], and WHO and FAO limits [70]. The current results were low compared with the average concentration levels found in the Al-Akrasha region by Sherif and Atwany (2019) [31] due to the fact that they collected samples from sites close to the industrial activity zone adjacent to the factories and foundries. Moreover, the concentration levels in the current study were in the same range reported for Cu in Ireland and the USA [71,72]; for Pb and Cr in Rampal, Bangladesh [73]; for Ni in Rondônia, Brazil [69]; for Zn in the western area of China [74]; and for Cd in China, Australia, and Rondônia, Brazil [69,70,71].
Figure 6 shows the average concentration levels of heavy metals in surface soil samples of different sizes (less than 45 μm, 45–106 μm, 106–150 μm, 150–212 μm, 212–250 μm, more than 250 μm) collected from the Al-Akrasha region. This figure shows that there is an inverse correlation between the concentrations of metals (Pb, Cu, Ni, Cr, Cd, and Zn) in the surface soils with the size of the soil particles; this was in agreement with a recent report by Giuliano et al. (2007) [75]. Increasing metal concentrations with decreased particle size is one of the main ways of controlling surface soil contamination with heavy metals [76,77,78,79,80]. In general, fine particles have a high capacity to carry heavy metals due to their high specific surface area in addition to the presence of clay minerals in the fine aggregate, which protects the heavy metals from removal attempts [81,82,83,84].

3.3. Heavy Metals in Biomarkers (Edible Fish, Worker Blood, and Worker Hair)

3.3.1. Heavy Metals in Edible Fish Samples

Figure 7A shows the average seasonal and annual concentrations (mg/kg) of heavy metals (Pb, Hg, and Cd) analyzed in the samples of edible tilapia fish obtained from the Ismailia Canal in two locations near the Al-Akrasha region during the period of 2019–2020. This Figure shows that the highest concentrations of mercury, lead, and cadmium were 0.151, 0.251, and 0.053 mg/kg, respectively, during the summer season. The lowest concentrations were 0.039, 0.181, and 0.030 mg/kg, respectively, during the winter; these findings are in agreement with that found by Abd El-kader et al. (2022) [85]. These seasonal variations in metal concentrations in the organs of fish can be attributed to physicochemical and biological factors of the ecosystems in which these fish live (Ismailia Canal in the Al-Akrasha region) and influence the bioavailability of metals.
The annual concentration levels of Pb, Hg, and Cd in fish were 0.227, 0.107, and 0.040, respectively (as shown in Figure 7B). This means that the fish were exposed to high levels of heavy metals, which may be due to the fact that the Ismailia Canal in the Al-Akrasha region receives huge amounts of sewage and industrial and agricultural waste that contain heavy metals. Fish can normally accumulate heavy metals from food, water, and sediments. According to several studies, fish that survive in heavily contaminated areas might accumulate higher heavy metal levels [86,87,88,89,90].
Concentrations of heavy metals (Hg, Pb, and Cd) in fish recorded in the current study did not exceed the permissible level recommended by the EOS (Egyptian Organization for Standardization and Quality), EC (European Commission), FAO (Food and Agriculture Organization), WHO (World Health Organization), FDA (U.S. Food and Drug Administration), NOAA (National Oceanic and Atmospheric Administration), ROPME (Regional Report of the State of the Marine Environment), and England’s limits [91,92,93,94,95,96,97,98,99,100] (as shown in Table S5).
The highest concentration of Pb metal was found to be in edible fish samples collected from the Ismailia Canal at the two sites near the Al-Akrasha region, as shown in Figure 7B. Pb is a neurotoxin that impairs behavior in vertebrates, stunts growth and survival, results in learning problems, and has a longer lasting impact on children [101]. Biological accumulation of Pb may be used as a biomarker for lead contamination in a polluted environment.
Table S5 shows a comparison of the concentration levels of heavy metals (Pb, Hg, and Cd) recorded in the tilapia fish samples obtained from Ismailia Canal with other results in Egypt and other areas around the world. The current results were low compared with the corresponding levels found in Manzala Lake, Egypt [85,88,102]; Durban Lake, South Africa [103]; rivers in China [104]; Pearl River, China [105]; Bangshi River, Bangladesh [106]; and the Meghna River, Bangladesh [107,108]. On the other hand, the current results were higher than those found for the Red Sea [109]; Hurghada, Red Sea [110]; and Lake Rd, Asafo market, Ghana [111]. Moreover, concentration levels in the current study were in agreement with those recorded for the Galas River, Malaysia [112]; rivers in India [113]; Meghna River, Bangladesh [114]; and Gorgan Bay, and Caspian Sea, Gorgan Bay, Iran [115]. Globally, a number of studies have been performed to evaluate the potential health risks linked to the consumption of fish containing heavy metals by humans. Some research has identified harmful health consequences, while others reported no adverse health effects.
Dermatitis, lung fibrosis, cardiovascular and kidney disorders, and lung cancer have all been linked to exposure to Hg, Cd, and Pb [116,117]. Global guidelines for the safe consumption of fish have been established to reduce any potential health risks that may be brought on by ingesting heavy metals from seafood, as shown in Table S5 [118].

3.3.2. Heavy Metals in Hair Samples

Average concentrations of metals (Cu, Pb, Cr, Ni, Zn, and Cd) in the hair of Awadallah Factory workers in Al-Akrasha region during 2019–2020 are shown in Figure 8A–C. The Figure shows that the concentration levels of heavy metals increased with factory work duration (years). These results confirm that hair is a good indicator of heavy metal accumulation in the human body. The results also showed that heavy metals found in hair samples were arranged as follows: Pb > Cu > Cr > Zn > Ni > Cd (as shown in Figure 8D).

3.3.3. Heavy Metals in Blood Samples

Blood lead level (BLL) is a good marker of Pb exposure [119], as there’s no safe exposure to lead [120]. Figure 9 shows average BLLs (µg/dL) detected in blood samples taken from working staff at a health center branch of the Ministry of Health and Population in Al-Akrasha, workers at Awadallah Factory, and residents living in the Al-Akrasha region. This figure shows that the concentration levels of lead in blood were increased with increasing duration of work or living in this region. All concentration levels found were lower than the OSHA reference dose of lead of 40 µg/dL [40,121,122,123] except for in those who had been living in Al-Akrasha for more than 30 years.
The results also showed that the lead concentration levels in the blood of females (7.81–22.71 μg/dL) were lower than in males (9.55–27.88 μg/dL). These results may be due to the accumulation of heavy metals in the male human body as a result of continuous exposure to metals during work. High concentration levels of lead were detected in the blood samples of workers at Awadallah Factory; they ranged from 17.3 to 30.0 μg/dL. In previous studies, Kao and Rusyniak (2016) [124] and Pincus et al. (2017) [125] mentioned that normal BLLs for adults are less than 10 μg/dL. Meanwhile, the CDCP (2019) [122] and Markowitz (2020) [123] mentioned that abnormal BLLs for adults are greater than 40 μg/dL. Table S6 shows a comparison of the blood lead levels (BLLs) in the current study with results previously reported in Egypt and around the world. Regulations versus recommendations related to adult lead exposure in the workplace are shown in Figure S2 [122,123]. The adverse health effects of lead exposure are shown in Figure S3 [126].

3.4. Risk Assessment of Heavy Metals

3.4.1. An Ecological Risk Assessment of Heavy Metals in Surface Soil

Surface soil contamination with metals pollution was evaluated using the ecological risk assessment. In the current study, some indices (geo-accumulation index (Igeo), pollution load index (PLI), modified contamination degree (mCd, contamination degree (CD), and contamination factor (CF)) were evaluated.

3.4.2. Geo-Accumulation Index (Igeo)

The geo-accumulation index (Igeo) was evaluated for surface soil samples collected from the Al-Akrasha region to determine the anthropogenic contamination. Igeo values were classified into six classes according to Muller (1981) [42] and Tang et al. (2010) [52] (Table 1). All sites were practically unpolluted with Cr, Ni, and Zn, while most sites were moderately polluted with Cu. On the other hand, all sites ranged from strongly to extremely pollute with Pb and Cd. These results could be attributed to local emissions of industrial activities, especially from smelters in the Al-Akrasha area and at Awadallah Factory.

3.4.3. Contamination Factor (CF) and Contamination Degree (CD)

Contamination factor (CF) and contamination degree (CD) were evaluated for the surface soil of the Al-Akrasha region to evaluate the pollution load relating to anthropogenic contamination. The results of CF values (Table 2) were classified into four classes according to Manoj et al. (2012) [48] and Sherif and Atwany (2019) [31]. All sites had low contamination with Cr, Ni, and Zn. While most sites were considerably contaminated with Cu, the soil was highly contaminated with Pb and Cd at all sites.
Contamination degree (CD) values were assessed as the sum of all contamination factors of the detected metals in surface soil and classified into four classes according to Sherif and Atwany (2019) [31] (Table 2). The results showed a very high degree of contamination (CD > 32) at all sites, which could be attributed to emissions from industrial activities from smelters in the Al-Akrasha region and metals deposition on the surface soil.

3.4.4. Modified Contamination Degree (mCd) and Pollution Load Index (PLI)

Modified contamination degree (mCd) and pollution load index (PLI) were evaluated for surface soil of the Al-Akrasha area to assess the pollution load due to anthropogenic contamination. According to Sherif and Atwany (2019) [31], mCd values were classified into six categories (Table 3). The results indicated that a third of the investigated sites were highly contaminated, while the other sites were very highly contaminated with metals.
Moreover, pollution load index (PLI) values estimated the metal contamination status of the detected metals in the surface soil and were classified into four categories according to Sherif and Atwany (2019) [31] (Table 3). The results of the PLI values shown in Table 3 indicate the deterioration of the environmental quality at all sites due to severe contamination with metals in the surface soil, which could be attributed to the contribution from industrial activities in the Al-Akrasha area.

3.5. Health Risk Assessment

3.5.1. Exposure Dose (D) of Heavy Metals in PM10 and Surface Soil

Exposure doses (D) of different pathways (D inhalation, D dermal contact, and D ingestion) for heavy metals (Pb, Cu, Ni, Cr, Cd, and Zn) in atmospheric PM10 and surface soil for infants, children, and adults in the Al-Akrasha region were estimated and are shown in Table S7. In addition, average daily doses (ADDs) of metals were assessed across all sites for infants, children, and adults during 2019–2020. The results in Table S7 showed that the lowest ADDs of all metals were found to be for Site 8, which is the farthest from Awadallah Factory, while the highest ADDs were for Site 6 and Site 7, which are the closest to and downwind of Awadallah Factory (as shown in Figure 1).
Figure 10 shows the contribution percentage of exposure doses pathways (inhalation, dermal contact, and ingestion) of heavy metals for infants, children, and adults in the Al-Akrasha region. It was found that ingestion is the dominant pathway for metals to enter the human body in the Al-Akrasha region. The exposure pathways for infants, children, and adults were arranged as follows: ingestion >>> dermal contact > inhalation. These results could relate to the main food consumed in the Al-Akrasha region, such as fish, vegetables, fruits, and bread, being contaminated with ambient dust, water, and soil that contain heavy metals. In addition, adults were exposed to the largest percentage of average daily doses of metals due to eating food during work and with hands contaminated with dust, which may contain large amounts of metals.

3.5.2. Non-Carcinogenic Risk

The hazard quotient (HQ) of different exposure pathways (HQinhalation, HQdermal contact, and HQingestion) for heavy metals (Pb, Cu, Ni, Cr, Cd, and Zn) in PM10 and surface soil in the Al-Akrasha region were assessed as shown in Table S8. The results show that the HQ values for each heavy metal in PM10 and surface soil samples were less than 1 for exposure through inhalation and dermal contact pathways, indicating no obvious risk according to Gu et al. (2017) [59] and Bat et al. (2020) [60]. However, the HQ values for ingestion exposure were higher than 1, which indicates a moderate or high risk of adverse effects in humans according to Bat et al. (2020) [60]. Moreover, Table S9 shows the hazard index (HI) values of heavy metals in PM10 and surface soil at the investigated sites. HI is used to describe the cumulative non-carcinogenic effect. HI values were ≥ 1, suggesting a moderate to high probability of having risk effects on humans [60].

3.5.3. Carcinogenic Risk

The carcinogenic risk (R) of different exposure pathways (Rinhalation, Rdermal contact, and Ringestion) for heavy metals (Pb, Cr, Ni, and Cd) in PM10 and surface soil samples in the Al-Akrasha region were assessed as shown in Table S10. R-values of heavy metals in PM10 and surface soil samples were less than 10−6 for exposure by inhalation and dermal contact pathways, indicating a nonsignificant effect [60], with the exception of Pb and Cr for dermal contact, which reported R-values of 10−6 < R < 10−4, which is considered an allowable or tolerable risk [60].
Furthermore, R-values for ingestion exposure were higher than 10−4, indicating significant human effects [60]. In addition, Table S11 shows the carcinogenic risk index (RI) of heavy metals in PM10 and surface soil at the investigated sites. The results in this table show that RI > 10−4, which indicates that there are significant human effects [60].

3.6. Health Risk Assessment of Fish Consumption

3.6.1. Bio-Accumulation Factors (BAFs)

The bio-accumulation factors (BAFs) of heavy metals (Pb and Cd) in edible tilapia fish collected from Ismailia Canal at two sites near the Al-Akrasha area during 2019–2020 were evaluated as shown in Figure 11. It was found that BAF values of Cd were 350% and 198% at sites A and B, respectively, which are higher than 100%, indicating bio-accumulation of Cd in the fish samples according to Kwoka et al. (2014) [61]. BAF values of Pb were lower than 100% (50% and 7%) at the same sites (A and B, respectively), indicating no bio-accumulation of Pb in the fish samples.
Estimated daily intake (EDI) of heavy metals (Pb and Cd) was evaluated in edible tilapia fish collected from Ismailia Canal at two sites near the Al-Akrasha region during 2019–2020 (Figure S4). The results showed that the estimated daily intake (EDI) values of Cd were 3.9 × 10⁻⁵–4.6 × 10⁻⁵ mg/kg/day for infants, 2.7 × 10⁻⁵–3.2 × 10⁻⁵ mg/kg/day for chilren, and 4.6 × 10⁻⁵–5.4 × 10⁻⁵ mg/kg/day for adults. Meanwhile, the estimated daily intake (EDI) values of Pb were 2.6 × 10⁻⁵–3.0 × 10⁻⁵ mg/kg/day for infants, 1.8 × 10⁻⁵–2.0 × 10⁻⁵ mg/kg/day for children, and 3.1 × 10⁻⁵–3.5 × 10⁻⁵ mg/kg/day for adults. Figure S4 shows that EDI values of Cd were higher than those of Pb, and the EDI values are arranged as EDIAdult > EDIInfant > EDIChildren. This means that adults had a higher daily intake of Pb and Cd due to the consumption of fish from Ismailia Canal near the Al-Akrasha region, and the risk of exposure for infants was greater than for children.

3.6.2. Non-Carcinogenic Risk

The hazard index (HI) and target hazard quotient (THQ) of heavy metals (Pb and Cd) in edible tilapia fish were assessed and shown in Figure S5. The results showed that THQ values were less than 1, indicating that they do not reflect any obvious risk according to Gu et al. (2017) [59] and Bat et al. (2020) [60]. In addition, HI < 1 indicates that no non-carcinogenic health risk is expected to occur [60].

3.6.3. Carcinogenic Risk

The risk index (RI) for heavy metals (Pb and Cd) in edible tilapia fish was assessed and is shown in Figure S6. While the risk index (RI) of Pb was <10−6, indicating that the carcinogenic risk was considered non significant, the RI of Cd was 10−6 < RI < 10−4, indicating that the carcinogenic risk was considered allowable or tolerable according to Bat et al. (2020) [60].

3.7. Meteorological Parameters

Meteorological data were used for the wind rose program to compute the relative frequencies of occurrence of seven wind speed classes and eight cardinal directions (Figure S7). The generation and distribution of air pollutants were significantly influenced by the meteorological conditions. Wind speed, wind direction, and rainfall had significant correlations with levels of pollutants in the Al-Akrasha area during 2020 (Figure S7). The figure shows that the most predominant wind speed direction corresponded with sites of higher concentration levels of pollutants.

4. Conclusions

Based on the current study, the following can be concluded:
The heavy metal concentration levels in PM10 of Al-Akrasha region were higher than the national and international guidelines and were arranged as follows: Fe > Mn > Pb > Al > Cu > Cr > B > Ag > Ni > Zn > As > Cd. However, the corresponding heavy metal concentrations in the surface soil of the region were lower than the guideline values and were arranged as follows: Pb > Cu > Cr > Ni > Zn > Cd (i.e., similar consequence of detected metals in PM10 samples).
The highest concentration levels of most heavy metals in PM10 and surface soil in this region were found near Awadallah Factory for Melting, Refining, and Manufacturing of Lead as well as within the industrial areas close to foundries, metal forming, and various industrial activities. Pb had the highest concentration in the surface soil samples in the Al-Akrasha region, while Cd had the lowest. Concentrations of heavy metals in surface soil samples of different sizes revealed that there was an inverse correlation between the concentrations of metals (Pb, Cu, Ni, Cr, Cd and Zn) in surface soils and the size of the soil particles. According to different factors that indicate soil contamination, it can be concluded that Al-Akrasha surface soils were highly to very highly contaminated with metals, especially Pb and Cd.
According to the biomarker results, heavy metal levels in edible tilapia fish collected from Ismailia Canal near the Al-Akrasha region indicated seasonal variations in metals in fish organs, which could be attributed to physicochemical and biological factors of the environmental ecosystems of the canal water. The highest concentrations of Pb, Hg, and Cd in tilapia fish occurred during the summer season, and the annual concentrations were 0.227, 0.107, and 0.040, respectively. These heavy metal levels in fish may be due to the Ismailia Canal receiving huge amounts of contaminated sewage and industrial and agricultural waste. Concentrations of heavy metals (Hg, Pb, and Cd) in fish recorded in the current study did not exceed the recommended guidelines.
Additionally, heavy metals found in hair samples collected from workers of Awadallah Factory in the Al-Akrasha region were arranged as follows: Pb > Cu > Cr > Zn > Ni > Cd. Their concentrations increased with the duration of work, which confirmed that hair is a good indicator of heavy metal accumulation in the human body. Lead levels in blood samples collected from workers and residents also increased with an increasing duration of working or living in the Al-Akrasha region. All lead concentration levels found in blood samples were lower than the OSHA reference dose of lead (40 µg/dL) except for in citizens who had been living in Al-Akrasha for more than 30 years. Lead concentration levels in the blood of females were lower than those found in males.
The ecological risk assessment of heavy metals in the Al-Akrasha region showed that all sites were practically unpolluted with Cr, Ni, and Zn, while most of sites were moderately polluted with Cu. On the other hand, all sites ranged from strongly to extremely pollute with Pb and Cd. These results could be attributed to local emissions of industrial activities, especially from smelters in the Al-Akrasha area and Awadallah Factory.
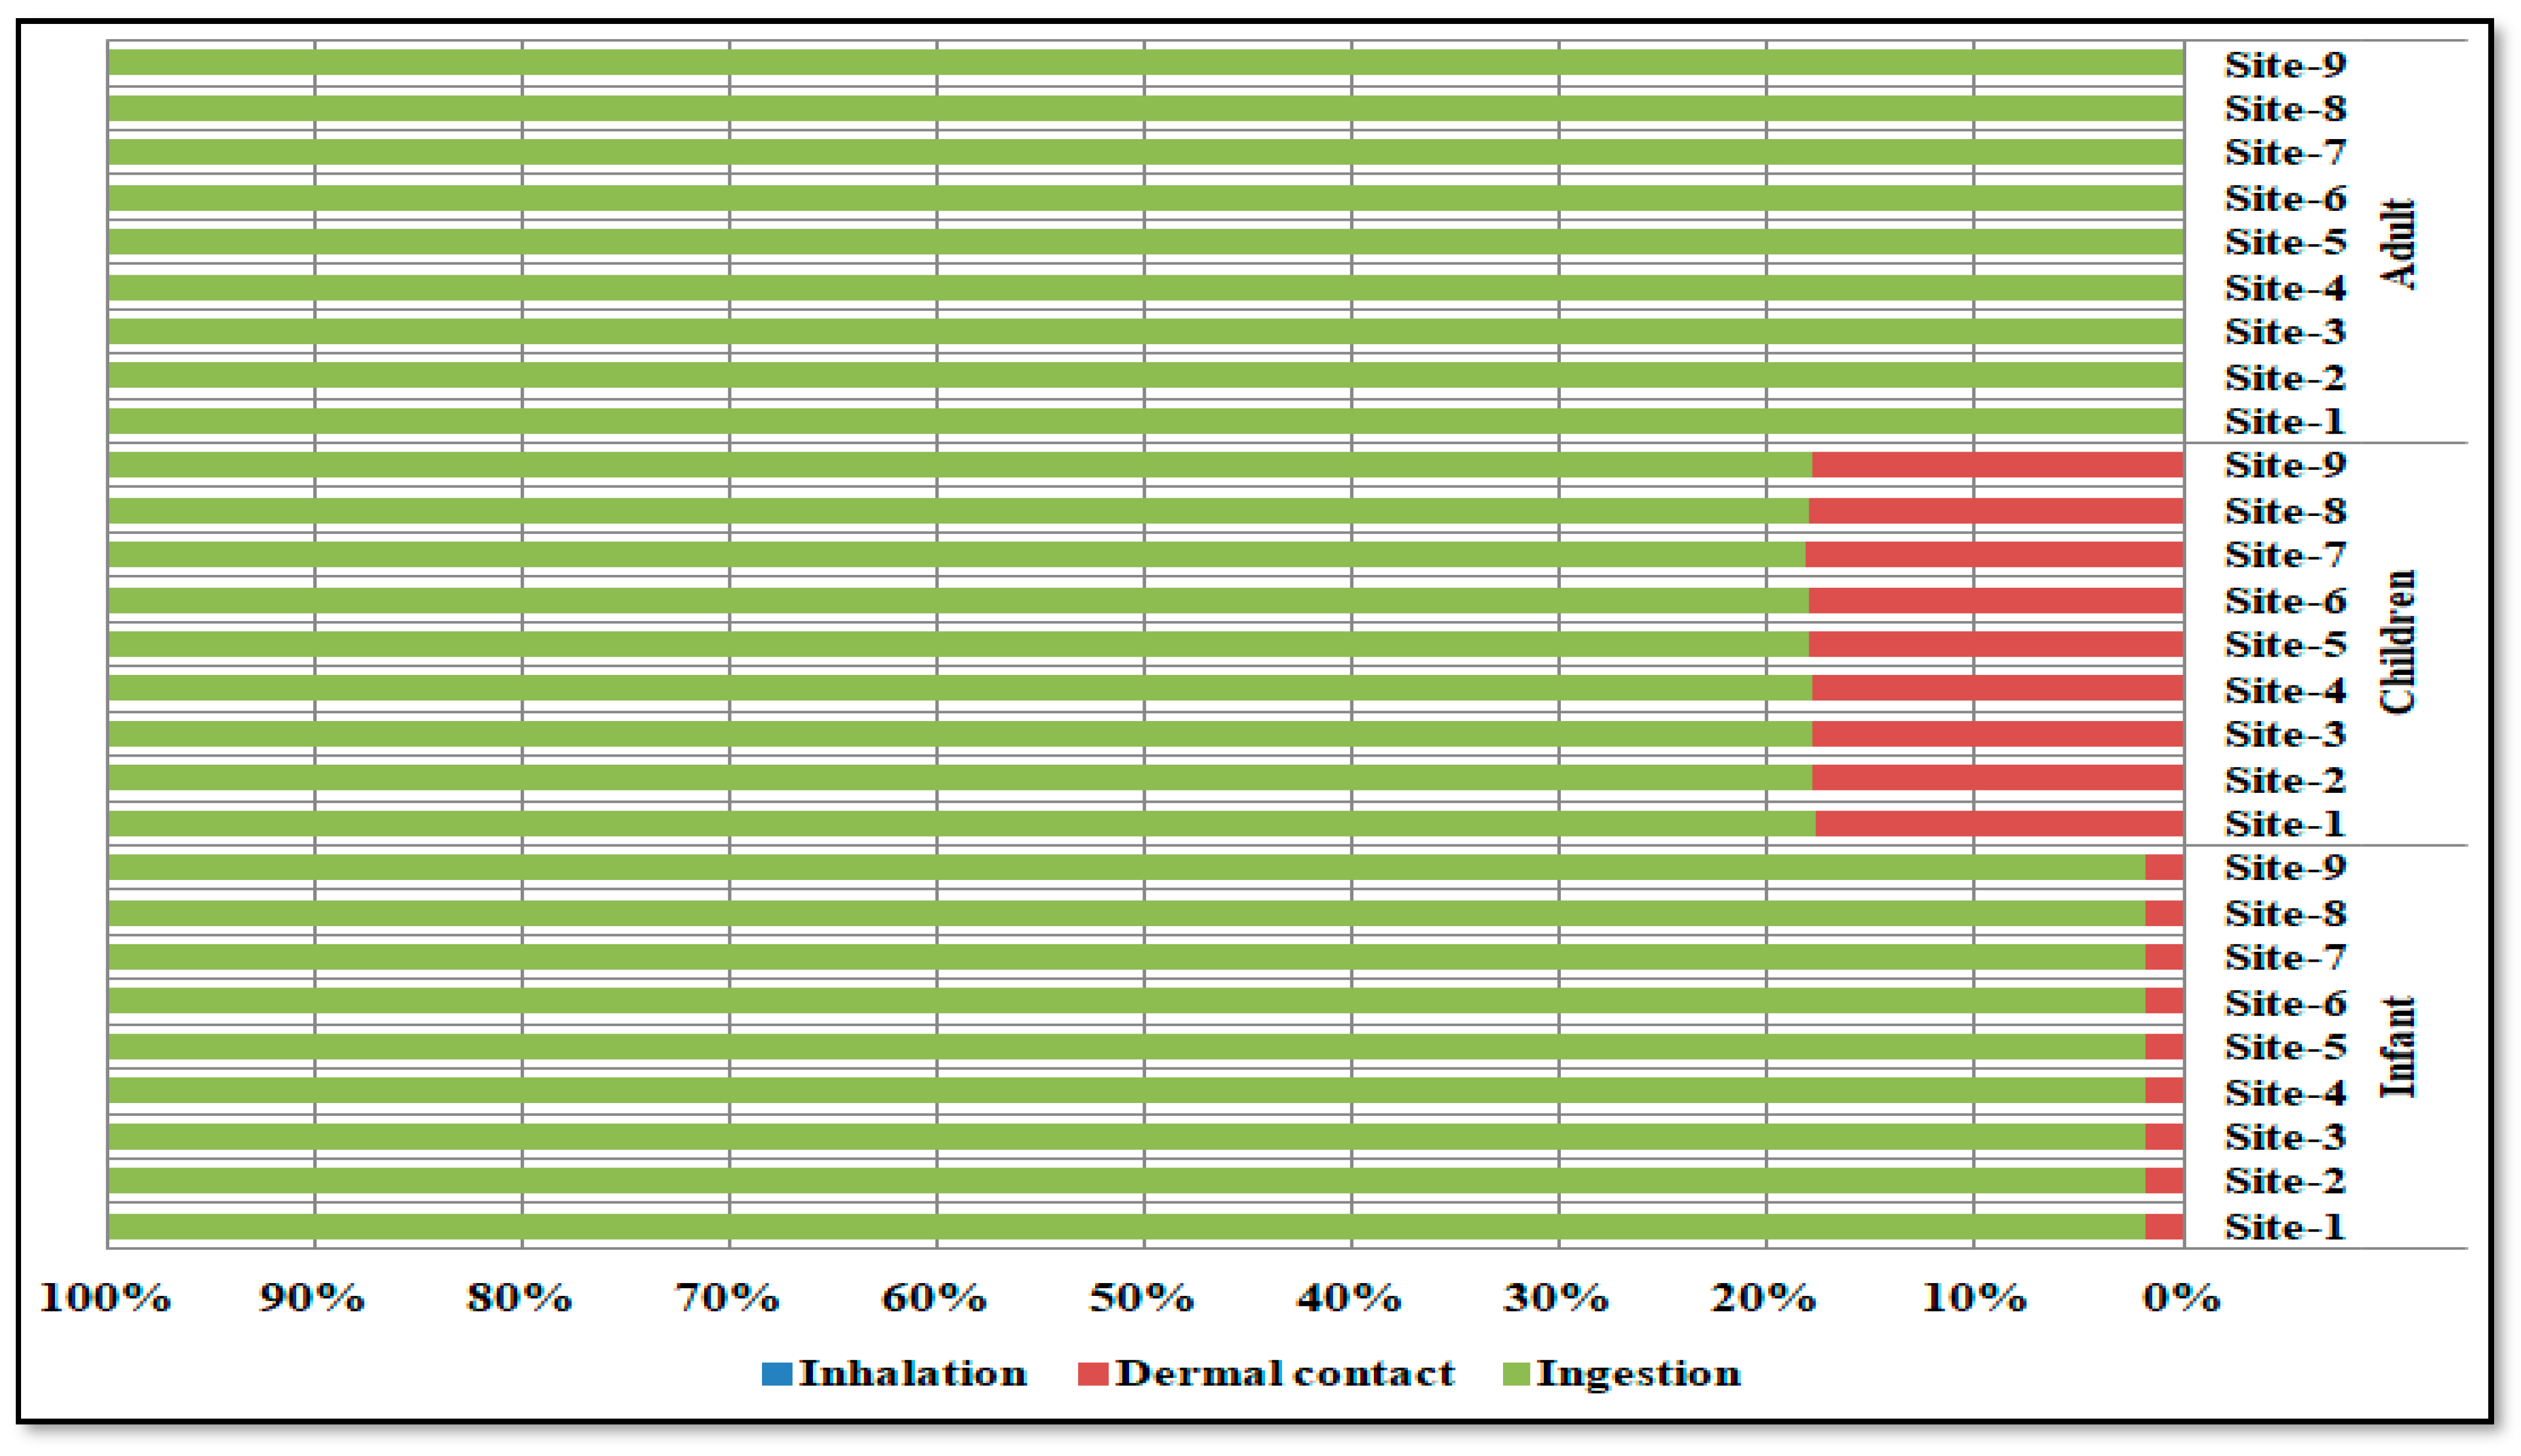
The health risk assessment due to the exposure to heavy metals in PM10 and surface soil concluded that ingestion is the dominant pathway for metals to enter the human body in the Al-Akrasha region. The exposure pathways for infants, children, and adults were arranged as ingestion >>> dermal contact > inhalation sequence. Adults were exposed to the largest average daily dose of metals due to eating food during work and with hands contaminated with dust. The carcinogenic risk (R values) was less than 10−6 for exposure by inhalation and dermal contact pathways, indicating a nonsignificant effect, except for Pb and Cr by dermal contact, with R values of 10−6 < R < 10−4, which is considered allowable or tolerable. The R values for exposure by ingestion were higher than 10−4, indicating that there are significant human health effects.
The results of the non-carcinogenic risk assessment concluded that the hazard quotient (HQ) values of each heavy metal in PM10 and surface soil samples reflected no obvious risk through inhalation and dermal contact pathways, whereas the HQ values for ingestion exposure indicated a moderate or high risk of adverse effects in humans according to Gu et al. (2017) and Bat et al. (2020) [60]. The cumulative non-carcinogenic effect (HI) was ≥ 1, indicating the presence of moderate or high adverse risks to human health. It can also be concluded that there was bio-accumulation of Cd in edible tilapia fish collected from Ismailia Canal, while there was no bio-accumulation of Pb in the fish. Adults had a higher daily intake of Pb and Cd due to the consumption of fish, and the risk of exposure was greater for infants than children. The risk index (RI) of Pb in edible tilapia fish samples was < 10−6, indicating that the carcinogenic risk was considered nonsignificant. The risk index (RI) of Cd was 10−6 < RI < 10−4, indicating that the carcinogenic risk was considered allowable or tolerable according to Bat et al. (2020) [60].

Highlight the Significance/Novelty of the Study

This study was the first to evaluate the ecological and health risk assessments of heavy metals in a diverse industrial area in Al-Akrasha, Egypt.
The results of this study indicate:
(1)
The concentration levels of select metals (Pb, Cu, Mn, Zn, Cr, Cd, Ni, Al, and Fe) in particulate matter (PM10) in the air and surface soils at industrial sites located in Al-Akrasha, Qalyubia, Egypt.
(2)
The concentration levels of select metals in edible tilapia fish, hair and blood of workers, and the population living in the Al-Akrasha area as biomarkers of contamination with these metals.
The results indicate the ecological and health risks (non-carcinogenic and carcinogenic risks) of these metals to the workers and residents living in this area.
Ingestion is the dominant pathway for metals to enter the human body in the Al-Akrasha region.
Adults had a higher daily intake and exposure risk than infants and children.

Supplementary Materials

The following supporting information can be downloaded at: https://www.mdpi.com/article/10.3390/atmos14121745/s1.

Author Contributions

A.M.F.M.: conceived and designed the paper; performed the experiments; analyzed and interpreted the data; wrote the paper; corresponding author. I.A.S.: conceived and designed the paper; analyzed and interpreted the data; wrote the paper. H.R.Z.: conceived and designed the experiments; performed the experiments; contributed reagents, materials, analysis tools. N.M.A.-L.: conceived and designed the paper; wrote the paper. All authors have read and agreed to the published version of the manuscript.

Funding

The Environmental Monitoring Center—Central Administration for Environmental Affairs (EMOHC), Ministry of Health and Population helped fund the monitoring and analyzing of the samples in this study. The EMOHC contributed reagents, materials, and analysis tools. The EMOHC had no role in the design, interpretation, or writing of the study.

Institutional Review Board Statement

The study was conducted according to the guidelines of the Declaration of Helsinki and approved by the Ethics Committee of the Ministry of Health and Population, Training & Research Sector (protocol code 5-2019/7 and date of approval 14 February 2019).

Informed Consent Statement

Informed consent was obtained from all subjects involved in the study. Written informed consent has been obtained from the patients to publish this paper.

Data Availability Statement

The data presented in this study are available on request from the corresponding author. The data are not publicly available due to privacy.

Acknowledgments

The authors thank the Environmental Monitoring Center—Central Administration for Environmental Affairs (EMOHC) of the Ministry of Health and Population for their help in monitoring and analyzing the samples for this study.

Conflicts of Interest

The authors declare no conflict of interest.

References

  1. EEAA (Egyptian Environmental Affair Agency). Environmental Protection Law No. 4 (1994). Amended by the Law No. 9; EEAA (Egyptian Environmental Affair Agency): Cairo, Egypt, 2009.
  2. EEAA (Egyptian Environmental Affairs Agency). Egypt State of Environment Report 2008; Ministry of State for Environmental Affairs: Cairo, Egypt, 2010.
  3. Ibrahim, Y.H.; Shakour, A.A.; Abdel-Latif, N.M.; El-Taieb, N.M. Assessment of heavy metal Levels in the Environment, Egypt. J. Am. Sci. 2011, 7, 148–153. Available online: http://www.americanscience.org (accessed on 11 November 2011).
  4. Aslam, B.; Javed, I.; Khan, H.F. Uptake of Heavy Metal Residues from Sewerage Sludge in the Milk of Goat and Cattle during Summer Season. Pak. Vet. J. 2010, 31, 75–77. Available online: http://www.pvj.com.pk (accessed on 1 January 2011).
  5. Nassef, M.; Hannigan, R.; Sayed, K.A.E.L.; Tahawy, M.S.E.L. Determination of some heavy metals in the environment of sadat industrial city. EPC-06: 2. In Proceedings of the Environmental Physics Conference, Alexandria, Egypt, 18–22 February 2006; Volume 39, pp. 18–22. [Google Scholar]
  6. Lowenthal, D.H.; Gertler, A.W.; Labib, M.W. Particulate matter source apportionment in Cairo: Recent measurements and comparison with previous studies. Int. J. Environ. Sci. Technol. 2014, 11, 657–670. [Google Scholar] [CrossRef]
  7. Kolone, L.N. Association of cadmium with renal cancer. Cancer 1976, 37, 1782–1787. [Google Scholar] [CrossRef]
  8. Nyarko, E.; Boateng, C.M.; Asamoah, O.; Edusei, M.O.; Mahu, E. Potential human health risks associated with ingestion of heavy metals through fish consumption in the Gulf of Guinea. Toxicol. Rep. 2023, 10, 117–123. [Google Scholar] [CrossRef]
  9. Swaleh, S.B.; Usmani, N. Impact of Heavy Metals in Environment: A Review. Int. J. Innov. Res. Sci. Eng. Technol. 2016, 5, 15968–15975. [Google Scholar]
  10. Demirezen, D.; Uruç, K. Comparative study of trace elements in certain fish, meat and meat products. Meat Sci. 2006, 74, 255–260. [Google Scholar] [CrossRef] [PubMed]
  11. Reynders, H.; Bervoets, L.; Gelders, M.; De Coen, W.; Blust, R. Accumulation and effects of metals in caged carp and resident roach along a metal pollution gradient. Sci. Total Environ. 2008, 391, 82–95. [Google Scholar] [CrossRef]
  12. Shah, K.; Nongkynrih, J.M. Metal hyperaccumulation and bioremediation. Biol. Plant. 2007, 51, 618–634. [Google Scholar] [CrossRef]
  13. Rehman, H.; Rehman, A.; Ullah, F.; Ullah, N.; Zeb, S.; Iqbal, T.; Ullah, R.; Azeem, T.; Rehman, N.U.; Farhan. Comparative Study of Heavy Metals in different Parts of Doestic and Broiler Chickens. Int. J. Pharm. Sci. Rev. Res. 2013, 23, 151–154. Available online: http://www.globalresearchonline.ne (accessed on 1 January 2013).
  14. Ahmad, I.; Zaman, A.; Samad, N.; Ayaz, M.M.; Rukh, S.; Akbar, A.; Ullah, N. Atomic Absorption Spectrophotometery Detection of Heavy Metals in Milk of Camel, Cattle, Buffalo and Goat from Various Areas of Khyber-Pakhtunkhwa (KPK), Pakistan. J. Anal. Bioanal. Tech. 2017, 8, 367. [Google Scholar] [CrossRef]
  15. Tripathi, R.; Raghunath, R.; Krishnamoorthy, T. Dietary intake of heavy metals in Bombay city, India. Sci. Total Environ. 1997, 208, 149–159. [Google Scholar] [CrossRef] [PubMed]
  16. Safar, Z.; Labib, M.W. Baseline Study of the Impact of Lead Smelters in Egypt from 1999 to 2009: Report. In Proceedings of the 15th International Union of Air Pollution Prevention and Environmental Protection Associations’ (International Union of Air Pollution Prevention and Environmental Protection Associations (IUAPPA)) World Clean Air Congress, Vancouver, BC, Canada, 12–16 September 2010; Volume 1, p. 1256. [Google Scholar]
  17. Safar, Z.S.; Labib, M.W. Assessment of particulate matter and lead levels in the Greater Cairo area for the period 1998–2007. J. Adv. Res. 2010, 1, 53–63. [Google Scholar] [CrossRef]
  18. WB (World Bank). Greater Cairo Air Pollution Management and Climate Change Project: Report; Environmental and Social Management Framework (ESMF), Project ID: P172548; World Bank Group: Wahington, DC, USA, 2020; Available online: http://documents.worldbank.org/curated/en/099092823111521075/P1725480835fbb0ce0ac4a0b7a1096f4b3c (accessed on 13 September 2020).
  19. Abdul-Wahab, S.A.; Yaghi, B. Total suspended dust and heavy metal levels emitted from a workplace compared with nearby residential houses. Atmos. Environ. 2004, 38, 745–750. [Google Scholar] [CrossRef]
  20. Yang, C.-Y.; Chang, C.-C.; Chuang, H.-Y.; Ho, C.-K.; Wu, T.-N.; Chang, P.-Y. Increased risk of preterm delivery among people living near the three oil refineries in Taiwan. Environ. Int. 2004, 30, 337–342. [Google Scholar] [CrossRef] [PubMed]
  21. Bentov, Y.; Kordysh, E.; Hershkovitz, R.; Belmaker, I.; Polyakov, M.; Bilenko, N.; Sarov, B. Major congenital malformations and residential proximity to a regional industrial park including a national toxic waste site: An ecological study. Environ. Health 2006, 5, 8. [Google Scholar] [CrossRef] [PubMed]
  22. Al-Shuely, W.M.; Ibrahim, Z.Z.; Sulaiman, W.N.; Yaziz, M.I. Characterization of Beach Sedimentary Environments in the Batinah Region, Oman. J. Environ. Sci. Technol. 2010, 3, 89–100. [Google Scholar] [CrossRef]
  23. Mudu, P.; Terracini, B.; Martuzzi, M. Human Health in Areas with Industrial Contamination (En); WHO Regional Office for Europe: Copenhagen, Denmark, 2014; pp. 1–380. Available online: https://iris.who.int/handle/10665/144490 (accessed on 1 February 2021).
  24. Al-Wahaibi, A.; Zeka, A. Health impacts from living near a major industrial park in Oman. BMC Public Health 2015, 15, 524. [Google Scholar] [CrossRef]
  25. WHO (World Health Organization). Air Quality Guidelines for Europe, 2nd ed.; WHO Regional Publications, European Series; WHO: Geneva, Switzerland, 2000.
  26. Bradley, N.; Dobney, A.; Exley, K.; Aldridge, J.S.S.; Craswell, A.; Dimitroulopoulou, S.; Hodgson, G.; Izon-Cooper, L.; Mitchem, L.; Mitsakou, C.; et al. Review of Interventions to Improve Outdoor Air Quality and Public Health; Public Health England (PHE) Wellington House, Department for Health and Social Care (DHSC): London, UK, 2019. Available online: https://www.gov.uk/phe (accessed on 1 March 2019).
  27. WHO (World Health Organization). Burden of Disease from Ambient Air Pollution for 2016.V5; Technical Report; WHO: Geneva, Switzerland, 2018.
  28. Holt, E.A.; Miller, S.W. Bioindicators: Using organisms to measure environmental impacts. Nat. Educ. Knowl. 2011, 3, 8. [Google Scholar]
  29. Mahmoud, N.E.D.; Bakr, A.F.; Fathi, A.A. Injecting residential industrial neighbourhoods and plotting built-up areas exposed to industrial air pollutants in the Arab Republic of Egypt. In Proceedings of the Sustainable City 2019, Valencia, Spain, 1–3 October 2019. [Google Scholar]
  30. Shakour, A.A.; El Taieb, N.M.; Hassan, A.M.A.; Ibrahim, Y.H.; Abd El Wahab, S.G. Heavy Metals Enrichment in Deposited Particulate Matter at Abu Zaabal Industrial Area—Egypt. J. Am. Sci. 2011, 7, 347–352. Available online: http://www.americanscience.org. (accessed on 21 July 2011).
  31. Sherif, A.E.A.; Atwany, A.M. Environmental Risk Assessment for Soil and Plants Pollution Resulting of Emitted Dust from Industrial Activities. Nat Sci. 2019, 17, 238–249. [Google Scholar] [CrossRef]
  32. Rappoport, S. The Water ways of Egypt. In History of Egypt; The Grolier Society: London, UK, 2016; Chapter V; Volume 12. [Google Scholar]
  33. Cheney, J.L.; Davis, M.F.; Elkins, J.B.; Lewis, R.G.; Manning, J.A.; McClenny, W.A.; McElroy, F.F.; William, T. Compendium of Methods for the Determination of Inorganic Compounds in Ambient Air Compendium; “Method IO-2.1”, Sampling of Ambient Air for Total Suspended Particulate Matter (SPM) and PM10 Using High Volume (HV) Sampler; Center for Environmental Research Information Office of Research and Development, U.S. Environmental Protection Agency: Cincinnati, OH, USA, 1999.
  34. Håkanson, L. An ecological risk index for aquatic pollution control. A sedimentological approach. Water Res. 1980, 14, 975–1001. [Google Scholar] [CrossRef]
  35. Dimari, G.A.; Hati, S.S.; Waziri, M.; Maitera, O.N. Pollution Synergy from Particulate Matter Sources: The Harmattan, Fugitive Dust and Combustion Emissions in Maiduguri Metropolis, Nigeria. Eur. J. Sci. Res. 2008, 23, 465–473. Available online: http://www.eurojournals.com/ejsr.htm (accessed on 17 October 2014).
  36. Shabbaj, I.I.; Alghamdi, M.A.; Shamy, M.; Hassan, S.K.; Alsharif, M.M.; Khoder, M.I. Risk Assessment and Implication of Human Exposure to Road Dust Heavy Metals in Jeddah, Saudi Arabia. Int. J. Environ. Res. Public Health 2017, 15, 36. [Google Scholar] [CrossRef] [PubMed]
  37. Staniskiene, B.; Matusevicius, P.; Budreckiene, R.; Skibniewska, K.A. Distribution of Heavy Metals in Tissues of Freshwater Fish in Lithuania. Pol. J. Environ. Stud. 2006, 15, 585–591. [Google Scholar]
  38. Liang, G.; Pan, L.; Liu, X. Assessment of Typical Heavy Metals in Human Hair of Different Age Groups and Foodstuffs in Beijing, China. Int. J. Environ. Res. Public Health 2017, 14, 914. [Google Scholar] [CrossRef] [PubMed]
  39. AOEC (Association of Occupational and Environmental Clinics). Medical Management Guidelines for Lead-Exposed Adults; Technical Report; AOEC: Washington, DC, USA, 2007. [Google Scholar]
  40. CDC (Centers for Disease Control and Prevention). Fourth National Report on Human Exposure to Environmental Chemicals, Updated Tables; National Center for Environmental Health (U.S.): Atlanta, GA, USA, 2015. Available online: https://stacks.cdc.gov/view/cdc/75822/cdc_75822_DS1.pdf (accessed on 1 February 2015).
  41. Madiha, B.; Khuram, S.A.; Zahidqureshi, M.N. Nimra. Determination of Heavy Metal Toxicity in Blood and Health Effect by AAS (Detection of Heavy Metals and its Toxicity in Human Blood). Arch. Nano Open Access J. 2018, 1, 22–28. [Google Scholar] [CrossRef]
  42. Muller, G. The heavy metal pollution of the sediments of Neckars and its tributary: An Inventory. Chem. Ztg. 1981, 105, 157–164. [Google Scholar]
  43. Förstner, U.; Ahlf, W.; Calmano, W. Sediment Quality Objectives and Criteria Development in Germany. Water Sci. Technol. 1993, 28, 307–316. [Google Scholar] [CrossRef]
  44. Loska, K.; Wiechuła, D.; Barska, B.; Cebula, E.; Chojnecka, A. Assessment of Arsenic Enrichment of Cultivated Soils in Southern Poland. Pol. J. Environ. Stud. 2003, 12, 187–192. [Google Scholar]
  45. Lu, X.; Wang, L.; Lei, K.; Huang, J.; Zhai, Y. Contamination assessment of copper, lead, zinc, manganese and nickel in street dust of Baoji, NW China. J. Hazard. Mater. 2009, 161, 1058–1062. [Google Scholar] [CrossRef] [PubMed]
  46. Lu, X.; Wang, L.; Li, L.Y.; Lei, K.; Huang, L.; Kang, D. Multivariate statistical analysis of heavy metals in street dust of Baoji, NW China. J. Hazard. Mater. 2010, 173, 744–749. [Google Scholar] [CrossRef]
  47. Gowd, S.S.; Reddy, M.R.; Govil, P. Assessment of heavy metal contamination in soils at Jajmau (Kanpur) and Unnao industrial areas of the Ganga Plain, Uttar Pradesh, India. J. Hazard. Mater. 2010, 174, 113–121. [Google Scholar] [CrossRef] [PubMed]
  48. Manoj, K.; Kumer, B.; Padhy, P.K. Characterization of materials in water and sediments of Subarnarekha River along the projects sites in Lower Basin, India. Univers. J. Environ. Res. Technol. 2012, 2, 402–410. Available online: http://www.environmentaljournal.org (accessed on 1 October 2012).
  49. Turekian, K.K.; Wedepohl, K.H. Distribution of the Elements in Some Major Units of the Earth’s Crust. Bull. Geol. Soc. Am. 1961, 72, 175–192. [Google Scholar] [CrossRef]
  50. Bradford, G.R.; Change, A.C.; Page, A.L.; Bakhtar, D.; Frapton, J.A.; Wright, H. Background Concentrations of Trace and Major Elements in California Soils; Chang, A.C., Ed.; Department of Environmental Sciences, University of California: Riverside, CA, USA, 1996; pp. 1–32. [Google Scholar]
  51. Tang, X.; Shen, C.; Shi, D.; Cheema, S.A.; Khan, M.I.; Zhang, C.; Chen, Y. Heavy metal and persistent organic compound contamination in soil from Wenling: An emerging e-waste recycling city in Taizhou area, China. J. Hazard. Mater. 2010, 173, 653–660. [Google Scholar] [CrossRef] [PubMed]
  52. Taylor, S.R.; McLennan, S.M. The Continental Crust: Its Composition and Evolution: An Examination of the Geochemical Record Preserved in Sedimentary Rocks; The Department of Energy (DOE), Office of Scientific and Technical Information (OSTI): Oak Ridge, TN, USA; Blackwell Scientific: Oxford, UK, 1985.
  53. Rastmanesh, F.; Moore, F.; Kopaei, M.K.; Keshavarzi, B.; Behrouz, M. Heavy metal enrichment of soil in Sarcheshmeh copper complex, Kerman, Iran. Environ. Earth Sci. 2010, 62, 329–336. [Google Scholar] [CrossRef]
  54. Ahdy, H.H.H.; Khaled, A. Heavy metals contamination in sediments of the Western Part of Egyptian Mediterranean Sea. Aust. J. Basic Appl. Sci. 2009, 3, 3330–3336. [Google Scholar]
  55. Nasr, S.M.; Okbah, M.A.; Kasem, S.M. Environmental Assessment of Heavy Metal Pollution in Bottom Sediment of Aden Port, Yemen. Int. J. Ocean. Oceanogr. 2006, 1, 99–109. [Google Scholar]
  56. Mmolawa, K.B.; Likuku, A.S.; Gaboutloeloe, G.K. Assessment of heavy metal pollution in soils along major roadside areas in otswana. Afr. J. Environ. Sci. Technol. 2011, 5, 186–196. Available online: http://www.academicjournals.org/AJEST (accessed on 10 November 2011).
  57. Abrahim, G.M.S. Holocene Sediments of Tamaki Estuary, Characterization and Impact of Recent Human Activity on an Urban Estuary in Auckland, New Zealand. Ph.D. Thesis, University of Auckland, Auckland, New Zealand, 2005. Available online: https://researchspace.auckland.ac.nz/docs/uoa-docs/rights.htm (accessed on 13 August 2007).
  58. Thomilson, D.C.; Wilson, D.J.; Harris, C.R.; Jeffrey, D.W. Problem in heavy metals in estuaries and the formation of pollution index. Helgol Wiss Meeresunlter 1980, 33, 566–575. [Google Scholar]
  59. Gu, Y.-G.; Lin, Q.; Huang, H.-H.; Wang, L.-G.; Ning, J.-J.; Du, F.-Y. Heavy metals in fish tissues/stomach contents in four marine wild commercially valuable fish species from the western continental shelf of South China Sea. Mar. Pollut. Bull. 2017, 114, 1125–1129. [Google Scholar] [CrossRef] [PubMed]
  60. Bat, L.; Öztekin, A.; Arici, E.; Şahin, F. Health risk assessment: Heavy metals in fish from the southern Black Sea. Food Raw Mater. 2020, 8, 115–124. [Google Scholar] [CrossRef]
  61. Kwok, C.; Liang, Y.; Wang, H.; Dong, Y.; Leung, S.; Wong, M. Bioaccumulation of heavy metals in fish and Ardeid at Pearl River Estuary, China. Ecotoxicol. Environ. Saf. 2014, 106, 62–67. [Google Scholar] [CrossRef]
  62. USEPA (U.S. Environmental Protection Agency). Risk Assessment Guidance for Superfund-Human (RAGS) Health Evaluation Manual Part A; Interim Final; USEPA: Washington, DC, USA, 1989.
  63. Yi, Y.; Tang, C.; Yi, T.; Yang, Z.; Zhang, S. Health risk assessment of heavy metals in fish and accumulation patterns in food web in the upper Yangtze River, China. Ecotoxicol. Environ. Saf. 2017, 145, 295–302. [Google Scholar] [CrossRef] [PubMed]
  64. Arabia Weather. 2022. Available online: https://www.arabiaweather.com/en/weather-forecast/abu-zaabal/1409/eg (accessed on 1 January 2023).
  65. Guo, H.; Yang, L.; Han, X.; Dai, J.; Pang, X.; Ren, M.; Zhang, W. Distribution characteristics of heavy metals in surface soils from the western area of Nansi Lake, China. Environ. Monit. Assess. 2019, 191, 262. [Google Scholar] [CrossRef]
  66. Hindarwati, Y.; Soeprobowati, T.R. Sudarno Heavy Metal Content in Terraced Rice Fields at Sruwen Tengaran Semarang—Indonesia. Web Conf. 2018, 31, 03009. [Google Scholar] [CrossRef]
  67. NJDEP (New Jersey Department of Environmental Protection). Appendix A: Soil Cleanup Criteria. In Proposed Cleanup Standards for Contaminated Sites; New Jersey Department of Environmental Protection: Trenton, NJ, USA, 1996. [Google Scholar]
  68. Wuana, R.A.; Okieimen, F.E. Heavy Metals in Contaminated Soils: A Review of Sources, Chemistry, Risks and Best Available Strategies for Remediation. ISRN Ecol. 2011, 2011, 402647. [Google Scholar] [CrossRef]
  69. Donaldson, D.L.; Jayaweera, D. Effective solar prosumer identification using net smart meter data. Int. J. Elect. Power Energy Syst. 2020, 118, 105823. [Google Scholar] [CrossRef]
  70. Chiroma, T.M.; Ebewele, R.O.; Hymore, F.K. Comparative assessment of heavy metal levels in soil, vegetables and urban grey waste water used for irrigation in Yola And Kano. Int. Ref. J. Eng. Sci. 2014, 3, 1–9. [Google Scholar]
  71. Chen, J.; Wei, F.; Zheng, C.; Wu, Y.; Adriano, D.C. Background concentrations of elements in soils of China. Water Air Soil Pollut. 1991, 57, 699–712. [Google Scholar] [CrossRef]
  72. Salonen, V.-P.; Korkka-Niemi, K. Influence of parent sediments on the concentration of heavy metals in urban and suburban soils in Turku, Finland. Appl. Geochem. 2007, 22, 906–918. [Google Scholar] [CrossRef]
  73. Parvez, S.; Nawshin, S.; Sultana, S.; Hossain, S.; Khan, H.R.; Habib, A.; Nijhum, Z.T.; Khan, R. Evaluation of Heavy Metal Contamination in Soil Samples around Rampal, Bangladesh. ACS Omega 2023, 8, 15990–15999. [Google Scholar] [CrossRef] [PubMed]
  74. Liu, H.; Zhang, Y.; Zhou, X.; You, X.; Shi, Y.; Xu, J. Source identification and spatial distribution of heavy metals in tobacco-growing soils in Shandong province of China with multivariate and geostatistical analysis. Environ. Sci. Pollut. Res. 2017, 24, 5964–5975. [Google Scholar] [CrossRef] [PubMed]
  75. Giuliano, V.; Pagnanelli, F.; Bornoroni, L.; Toro, L.; Abbruzzese, C. Toxic elements at a disused mine district: Particle size distribution and total concentration in stream sediments and mine tailings. J. Hazard. Mater. 2007, 148, 409–418. [Google Scholar] [CrossRef]
  76. Chen, Y.; Zhu, X.F.; Ji, H.B. Particle Size Distribution of Heavy Metals in Soils around the Gole Mine of Detiangou-Qifengcha, Beijing. Acta Sci. Circumstantiate 2014, 34, 219–228. [Google Scholar]
  77. Ma, Z.; Chen, K.; Li, Z.; Bi, J.; Huang, L. Heavy metals in soils and road dusts in the mining areas of Western Suzhou, China: A preliminary identification of contami-nated sites. J. Soils Sediments 2016, 16, 204–214. [Google Scholar] [CrossRef]
  78. Sayadi, M.H.; Rezaei, A.; Sayyed, M.R.G. Grain size fraction of heavy metals in soil and their relationship with land use. Proc. Inter. Acad. Ecol. Environ. Sci. 2017, 7, 1–11. Available online: https://www.iaees.org/publications/journals/piaees/online¬version.aspeg (accessed on 1 March 2017).
  79. Li, C.; Xu, J.-J.; He, Y.-C.; Chen, L.; Dennis, C.-L.; Huang, H.-F.; Wu, Y.-T. Effects of acute ambient pollution exposure on preterm prelabor rupture of membranes: A time-series analysis in Shanghai, China. Environ. Pollut. 2021, 276, 116756. [Google Scholar] [CrossRef]
  80. Rafiei, B.; Bakhtiari, N.M.; Hashemi, M.; Khodaei, A.S. Distribution of Heavy Metals around the Dashkasan Au Mine. Int. J. Environ. Res. 2010, 4, 647–654. [Google Scholar]
  81. Beamer, P.I.; Elish, C.A.; Roe, D.J.; Loh, M.M.; Layton, D.W. Differences in metal concentration by particle size in house dust and soil. J. Environ. Monit. 2012, 14, 839–844. [Google Scholar] [CrossRef]
  82. Maslennikova, S.; Larina, N.; Larin, S. The effect of sediment grain size on heavy metal content. Lakes Reserv. Ponds 2012, 6, 43–54. [Google Scholar]
  83. Zhang, H.; Luo, Y.; Makino, T.; Wu, L.; Nanzyo, M. The heavy metal partition in size-fractions of the fine particles in agricultural soils contaminated by waste water and smelter dust. J. Hazard. Mater. 2013, 248–249, 303–312. [Google Scholar] [CrossRef]
  84. El-kader, A. Assessment of heavy metal concentration in water and the Nile tilapia of Lake Manzala, EL-Kapoty, Egypt. Egypt. J. Aquat. Biol. Fish. 2022, 26, 137–147. [Google Scholar] [CrossRef]
  85. Khallaf, E.A.; Authman, M.M.; Galal, M.; Zaid, R.A. A comparative biological study on Oreochromis niloticus from two Nilotic Canals in the Delta of Egypt. Egypt. J. Aquat. Biol. Fish. 2018, 22, 39–63. [Google Scholar] [CrossRef]
  86. Abdel-Mohsien, H.S.; Mahmoud, M.A.M. Accumulation of Some Heavy Metals in Oreochromis niloticus from the Nile in Egypt: Potential Hazards to Fish and Consumers. J. Environ. Prot. 2015, 6, 1003–1013. [Google Scholar] [CrossRef]
  87. Bahnasawy, M.; Khidr, A.A.; Dheina, N. Seasonal variations of heavy metals concentrations in mullet, Mugil cephalus and Liza ramada (Mugilidae) from Lake Manzala, Egypt. J. Appl. Sci. Res. 2009, 5, 845–852. [Google Scholar] [CrossRef]
  88. Abdel-Satar, A.; Yacoub, A. Heavy Metals and Macronutrients Concentration In Oreochromis Njloticus And Tilapia Zilliifish Species Inhabiting Some Egyptian Lakes And El-Salam Canal. Egypt. J. Aquat. Biol. Fish. 2005, 9, 97–116. [Google Scholar] [CrossRef]
  89. Ravera, O. Monitoring of the aquatic environment by species accumulator of pollutants: A review. J. Limnol. 2001, 60, 63–78. [Google Scholar] [CrossRef]
  90. FAO (The Food and Agriculture Organization). Compilation of Legal Limits for Hazardous Substances in Fish and Fishery Products. 1983. FAO Fishery Circular No. 464, 01/01/1983: 5-100. Available online: http://www.fao.org/docrep/014/q5114e/q5114e.pdf (accessed on 1 January 1983).
  91. MAFF (Ministry of Agriculture, Fisheries and Food). Monitoring and Surveillance of Non-Radioactive Contaminants in the Aquatic Environment and Activities Regulating the Disposal of Wastes at Sea, 1995 and 1996; Center for Environment, Fisheries and Aquaculture Science (CEFAS), Aquatic Environment Monitoring: Lowestoft, UK, 1998. [Google Scholar]
  92. EC (European Community). Setting Maximum Levels for Certain Contaminants in Foodstuffs; European Commission: Brussels, Belgium, 2006.
  93. Mokhtar, M.B.; Aris, A.Z.; Munusamy, V.; Praveena, S.M. Assessment Level of Heavy Metals in Penaeus monodon and Oreochromis spp. in Selected Aquaculture Ponds of High Densities Development Area. Eur. J. Sci. Res. 2009, 30, 348–360. Available online: http://www.eurojournals.com/ejsr.htm (accessed on 1 May 2009).
  94. FAO/WHO (The Food and Agriculture Organization/World Health Organization). Evaluation of Certain Food Additives and Contaminants: Sixty-Ninth Report of the Joint FAO/WHO Expert Committee on Food Additives; WHO Technical Report Series; World Health Organization, Expert Committee on Food Additives: Geneva, Switzerland, 2009.
  95. NOAA (National Oceanic and Atmospheric Administration). Screening Quick Reference Tables (SQuiRT) in Sediment. Restoration. 2009. Available online: NOAA.gov/bookshelf/122New-SQuiRTS.Pdf (accessed on 22 February 2019).
  96. FDA (Food and Drug Administration). Fish and Fishery Products Hazards and Controls Guidance, 4th ed.; US Department of Health and Human Services, Food and Drug Administration: Silver Spring, MD, USA, 2011.
  97. EOS (Egyptian Organization for Standardization). Maximum Levels for Certain Contaminants in Foodstuffs; EOS: Cairo, Egypt, 2018. [Google Scholar]
  98. Helmy, N.A.; Maarouf, A.A.; Hassan, M.A.; Hassanien, F.S. Detection of Heavy Metals Residues in Fish and Shellfish. Benha Vet. Med. J. 2018, 34, 255–264. [Google Scholar] [CrossRef]
  99. ROPME (Regional Organization for the Protection of the Marine Environment). Regional Report of the State of the Marine Environment; ROPME: Kuwait City, Kuwait, 1999. [Google Scholar]
  100. Rajeshkumar, S.; Li, X. Bioaccumulation of heavy metals in fish species from the Meiliang Bay, Taihu Lake, China. Toxicol. Rep. 2018, 5, 288–295. [Google Scholar] [CrossRef] [PubMed]
  101. Abdelhamid, A.M.; Asmaa, A.; El-Kerdawy, A.A.M.; El-Mezaien, A.; Meshref, H.A. Study on pollution in the Western-North region of El-Manzalah Lake, Egypt. J. Agric. Sci. Mansoura Univ. 1997, 22, 1877–1885. [Google Scholar]
  102. GB (Google-Books). Marine Biological Quality; National Marine Standards and Metrology Center: Tianjin, China, 2001. [Google Scholar]
  103. Xie, W.; Chen, K.; Zhu, X.; Nie, X.; Zheng, G.; Pan, D.; Wang, S. Evaluation of heavy metal contents in water and fishes collected from the waterway in Pearl River Delta in south China. J. Agro-Environ. Sci. 2010, 29, 1917–1923. [Google Scholar]
  104. Rahman, M.S.; Molla, A.H.; Saha, N.; Rahman, A. Study on heavy metals levels and its risk assessment in some edible fishes from Bangshi River, Savar, Dhaka, Bangladesh. Food Chem. 2012, 134, 1847–1854. [Google Scholar] [CrossRef]
  105. Ahmed, A.S.S.; Rahman, M.; Sultana, S.; Babu, S.M.O.F.; Sarker, M.S.I. Bioaccumulation and heavy metal concentration in tissues of some commercial fishes from the Meghna River Estuary in Bangladesh and human health implications. Mar. Pollut. Bull. 2019, 145, 436–447. [Google Scholar] [CrossRef] [PubMed]
  106. Hossain, M.B.; Tanjin, F.; Rahman, M.S.; Yu, J.; Akhter, S.; Noman, A.; Sun, J. Metals Bioaccumulation in 15 Commonly Consumed Fishes from the Lower Meghna River and Adjacent Areas of Bangladesh and Associated Human Health Hazards. Toxics 2022, 10, 139. [Google Scholar] [CrossRef] [PubMed]
  107. Abdelmoneim, M.; Khaled, A.; Iskander, M. A Study on the Levels of Some Heavy Metals in EL-Mex, West of Alexandria, Egypt. In Proceedings of the 4th Conference of the Environment Protection, Osaka, Japan, 10–12 May 1994; pp. 155–174. [Google Scholar]
  108. El-Moselhy, K.M.; Othman, A.; El-Azem, H.A.; El-Metwally, M. Bioaccumulation of heavy metals in some tissues of fish in the Red Sea, Egypt. Egypt. J. Basic Appl. Sci. 2014, 1, 97–105. [Google Scholar] [CrossRef]
  109. Kwaansa-Ansah, E.E.; Nti, S.O.; Opoku, F. Heavy metals concentration and human health risk assessment in seven commercial fish species from Asafo Market, Ghana. Food Sci. Biotechnol. 2018, 28, 569–579. [Google Scholar] [CrossRef]
  110. MFA (Malaysian Food Act). Malaysian Food and Drug; MDC Publishers Printer Sdn. Bhd: Kuala Lumpur, Malaysia, 1983. [Google Scholar]
  111. FSS (Food Safety and Standards). Contaminants, Toxins and Residues; Regulations; FSS India: 2011. MOFL (Ministry of Fisheries and Livestock). Bangladesh Gazette; SRO No. 233/Ayen; Bangladesh Ministry of Fisheries and Livestock: Dhaka, Bangladesh, 2014.
  112. Alipour, H.; Banagar, G.R. Health risk assessment of selected heavy metals in some edible fishes from Gorgan Bay, Iran. Iran. J. Fish. Sci. 2018, 17, 21–34. [Google Scholar] [CrossRef]
  113. Ali, H.; Khan, E. Bioaccumulation of non-essential hazardous heavy metals and metalloids in freshwater fish. Risk to human health. Environ. Chem. Lett. 2018, 16, 903–917. [Google Scholar] [CrossRef]
  114. Renieri, E.A.; Safenkova, I.V.; Alegakis, A.K.; Slutskaya, E.S.; Kokaraki, V.; Kentouri, M.; Dzantiev, B.B.; Tsatsakis, A.M. Cadmium, lead and mercury in muscle tissue of gilthead seabream and seabass: Risk evaluation for consumers. Food Chem. Toxicol. 2019, 124, 439–449. [Google Scholar] [CrossRef] [PubMed]
  115. Nriagu, J.O. A History of Global Metal Pollution. Science 1996, 272, 223. [Google Scholar] [CrossRef]
  116. Abou-Arab, A.A.K.; Abou Donia, M.A.A.; Sharaf, N.E.; Mohamed, S.R. Lead Levels in Human Blood as Biological Test in Different Egyptian Environments. World J. Med. Sci. 2014, 10, 392–399. [Google Scholar]
  117. Sharaf, N.E.; Abdel-Shakour, A.; Amer, N.M.; Abou-Donia, M.A.; Khatab, N. Evaluation of Children’s Blood Lead Level in Cairo, Egypt. Am. Eurasian J. Agric. Environ. Sci. 2008, 3, 414–419. [Google Scholar]
  118. NIEHS (National Institute for Environmental Health Services). National Toxicology Program (NTP) Monograph: Health Effects of Low-Level Lead; NIEHS: Research Triangle Park, NC, USA, 2012.
  119. (California Department of Public Health). Health-Based Guidelines for Blood Lead Levels In Adults; CDPH: Richmond, CA, USA, 2019.
  120. NIOSH (National Institute for Occupational Safety and Health). Adult Blood Lead Epidemiology and Surveillance (ABLES). CDC (Centers for Disease Control and Prevention), National Institutes of Health. 2020; Lead: Adult Blood Lead Epidemiology and Surveillance (ABLES)|NIOSH|CDC. U.S. Department of Health & Human Services. Lead: Adult Blood Lead Epidemiology and Surveillance (ABLES)|NIOSH|CDC. Available online: https://www.cdc.gov/niosh/topics/lead/ables.html (accessed on 6 January 2023).
  121. Kao, L.W.; Rusyniak, D.E. Chronic poisoning: Trace metals and others. In Goldman-Cecil Medicine, 25th ed.; Goldman, L., Schafer, A.I., Eds.; Elsevier: Philadelphia, PA, USA, 2016; Chapter 22. [Google Scholar]
  122. Bianchi, V.; Felicetta, F.; Premaschi, S.; Redegalli, P. Valadation of a new and fast method fr the main molecular specie of the phosphatidylethanol (PETH 16:0-18:1) measurement in blood by liquid chromatography-tandem mass spectrometry. Toxicology—Therapeutic Drug Monitoring. Cclm 2017, 55, s1102–s1121. [Google Scholar] [CrossRef]
  123. Markowitz, M. Lead Poisoning. Pediatr. Rev. 2000, 21, 327–335. [Google Scholar] [CrossRef]
  124. The Adair County Health Department. Lead Contamination; Adair County Health Department: Kirksville, MO, USA, 2022. [Google Scholar]
  125. Lead Smart. Living with Lead in Broken Hill. Lead Smart is a Joint initiative between the NSW Environment Protection Authority (EPA), NSW (New South Wales, Australia) Health, the Broken Hill Environmental Lead Program, the Child and Family Health Centre and Maari Ma Health Aboriginal Corporation. 2022. Available online: https://leadsmart.nsw.gov.au/effects-of-lead/ (accessed on 1 January 2023).
  126. The Adair County Health Department. 2022. Lead Contamination. Lead Contamination|Adair County Health Department. Available online: https://lphamo.org (accessed on 1 January 2023).
Figure 1. Map of sampling site locations in the Al-Akrasha region.
Atmosphere 14 01745 g001
Figure 2. Annual average concentrations of heavy metals in samples (PM10) collected at different sites in the Al-Akrasha region.
Atmosphere 14 01745 g002
Figure 3. Annual mean concentrations of heavy metals in the ambient air (PM10) of the Al-Akrasha region.
Atmosphere 14 01745 g003
Figure 4. Average concentration levels of heavy metals in surface soil samples at the various sites in the Al-Akrasha region.
Atmosphere 14 01745 g004
Figure 5. Average concentrations of heavy metals in the surface soil collected from the Al-Akrasha region.
Atmosphere 14 01745 g005
Figure 6. Average concentrations of heavy metals in surface soil samples of different sizes collected from the Al-Akrasha region.
Atmosphere 14 01745 g006
Figure 7. Average seasonal and annual concentrations of heavy metals in edible fish samples collected from the Ismailia Canal at two sites near the Al-Akrasha region.
Atmosphere 14 01745 g007
Figure 8. Average concentration levels of heavy metals in hair samples collected from workers of Awadallah Factory in the Al-Akrasha region. (A) Pb; (B) Cd and Zn; (C) Ni, Cr, and Cu (D) Arrangement of heavy metals in hair samples.
Atmosphere 14 01745 g008
Figure 9. Average blood lead level (BLL) in blood samples taken from staff working at a health center of the Ministry of Health and Population in Al-Akrasha, workers at Awadallah Factory, and residents living in the Al-Akrasha region.
Atmosphere 14 01745 g009
Figure 10. Contribution percentage of exposure dose pathways (inhalation, dermal contact, and ingestion) of heavy metals for infants, children, and adults in the Al-Akrasha region.
Atmosphere 14 01745 g010
Figure 11. The bio-accumulation factors (BAFs) of heavy metals (Pb and Cd) in edible tilapia fish samples collected from Ismailia Canal at two sites (A and B) near the Al-Akrasha area during 2019–2020.
Atmosphere 14 01745 g011
Table 1. Geo-accumulation index (Igeo) classification.
SiteCuPbCrNiZnCd
Site 10.2 14.1 5−2.2 0−2.5 0−3.1 04.4 5
Site 21.1 23.5 4−2.3 0−2.1 0−2.2 03.5 4
Site 31.1 24.0 4−1.7 0−2.5 0−2.1 04.1 5
Site 41.3 23.5 4−1.6 0−2.3 0−2.6 03.1 4
Site 51.1 22.5 3−2.0 0−2.0 0−2.7 03.0 4
Site 61.6 24.3 5−1.9 0−2.1 0−3.2 04.2 5
Site 71.1 22.6 3−1.6 0−1.6 0−2.0 04.8 5
Site 81.0 12.5 3−2.6 0−1.6 0−2.1 04.8 5
Site 91.6 24.3 5−2.4 0−2.4 0−2.2 04.7 5
Where: (0): practically unpolluted (Igeo < 0); (1): unpolluted to moderated polluted (0 < Igeo < 1); (2): moderately polluted (1 < Igeo < 2); (3): moderately to strongly polluted (2 < Igeo < 3); (4): strongly polluted (3 < Igeo < 4); (5): strongly to extremely polluted (4 < Igeo< 5); and (6): extremely polluted (Igeo > 5).
Table 2. Contamination factor (CF) and contamination degree (CD).
SiteContamination Factor (CF)Contamination Degree (CD)
CuPbCrNiZnCd
Site 1 1.8 225.7 40.3 10.3 10.2 132.8 461.0 4*
Site 2 3.3 317.3 40.3 10.3 10.3 117.1 438.7 4*
Site 33.1 323.2 40.4 10.3 10.3 126.6 454.0 4*
Site 43.6 317.2 40.5 10.3 10.3 113.2 435.0 4*
Site 53.1 38.8 40.4 10.4 10.2 112.3 425.2 3*
Site 64.6 330.4 40.4 10.4 10.2 128.5 464.4 4*
Site 73.3 39.1 40.5 10.5 10.4 142.3 456.0 4*
Site 83.1 38.2 40.2 10.5 10.3 141.3 453.7 4*
Site 94.4 329.8 40.3 10.3 10.3 138.0 473.1 4*
Where: (1): low contamination (CF < 1); (2): moderate contamination (1 ≤ CF < 3); (3): considerable contamination (3 ≤ CF ≤ 6); (4): high contamination (CF > 6). (1*): low degree of contamination (CD < 8); (2*): moderate degree of contamination (8 ≤ CD < 16); (3*): considerable degree of contamination (16 ≤ CD < 32); and (4*): very high degree of contamination (CD > 32).
Table 3. Modified contamination degree (mCd) and pollution load index (PLI).
SitemCdPLI
Site 110.2 44.7 4*
Site 26.4 35.8 4*
Site 39.0 49.1 4*
Site 45.8 35.5 4*
Site 54.2 33.2 4*
Site 610.7 49.6 4*
Site 79.3 410.8 4*
Site 89.0 46.7 4*
Site 912.2 411.7 4*
Where: (0): nil to very low contamination (mCd < 1.5); (1): low contamination (1.5 ≤ mCd < 2); (2): moderate contamination (2 ≤ mCd < 4); (3): high contamination (4 ≤ mCd < 8); (4): very high contamination (8 ≤ mCd < 16); (5): extremely high contamination (16 ≤ mCd < 32); (6): ultra high contamination (mCd ≥ 32). (1*): background concentration (PLI = 0); (2*): perfection—unpolluted (PLI < 1); (3*): baseline pollution (PLI = 1); and (4*): highly polluted (PLI > 1) indicating deterioration of site quality.
Disclaimer/Publisher’s Note: The statements, opinions and data contained in all publications are solely those of the individual author(s) and contributor(s) and not of MDPI and/or the editor(s). MDPI and/or the editor(s) disclaim responsibility for any injury to people or property resulting from any ideas, methods, instructions or products referred to in the content.

