Article

Contrasting the Impacts of Intraseasonal Oscillations on Yangtze Precipitation during the Summer of 1998 and 2016

1
Laboratory for Coastal Ocean Variation and Disaster Prediction, South China Sea Institute of Marine Meteorology, College of Ocean and Meteorology, Guangdong Ocean University, Zhanjiang 524088, China
2
Shanwei Meteorological Service, Shanwei 516600, China
*
Author to whom correspondence should be addressed.
Atmosphere 2023, 14(11), 1695; https://doi.org/10.3390/atmos14111695
Submission received: 25 September 2023 / Revised: 6 November 2023 / Accepted: 15 November 2023 / Published: 17 November 2023
(This article belongs to the Special Issue Precipitation Observations and Prediction)

Abstract

:
In 1998 and 2016, boreal summer intraseasonal oscillation (BSISO) could reach the middle-lower reaches of the Yangtze River basin (YRB), leading to extreme precipitation. Based on multiple daily data, this study reveals the differences in BSISO events and mechanisms between 1998 and 2016. In June–July of 1998 (2016), YRB precipitation was impacted by 30–60-day oscillation, i.e., BSISO1 (10–30-day oscillation, i.e., BSISO2), with two strong (three) precipitation events occurring. In 1998, when BSISO1 was in phases 1–4 (phases 5–8), the YRB experienced a wet (dry) episode. In 2016, when BSISO2 was in phases 1–2 and 7–8 (phases 3–6), the YRB experienced a wet (dry) episode. In 1998, in event 1, the active convection of the YRB first originated in the South China Sea–western Pacific (SCS–WP) and then in the tropical Indian Ocean (IO). In 1998, in event 2, the active convection of the YRB originated in the SCS–WP. In 2016, in events 1 and 3, the active convection of the YRB originated from the SCS–WP. In 2016, in event 2, the active convection of the YRB originated from the tropical IO and the extratropical WP. Different SST and atmospheric circulations explain different BSISO modes that dominate in the YRB. In 1998 (2016), in summer, (no) strong easterly wind anomalies occurred in the SCS–WP, which are favorable (unfavorable) for the enhancement of BSISO1. Accompanying the suppressed BSISO1, BSISO2 was enhanced in 2016.

1. Introduction

The middle-lower reaches of the Yangtze River basin (YRB), located in eastern China, is a flood-prone area during the boreal summer. Over the past decades, heavy rainfall events occurred frequently, resulting in devastating floods and huge economic losses. Heavy rainfall events over the YRB are always associated with the seasonal march of the East Asian summer monsoon (EASM) [1,2,3,4,5]. The intraseasonal oscillation (ISO) is an important component of the EASM system [6,7,8].
ISO, also known as intraseasonal variation (ISV), exhibits pronounced seasonality [9,10,11]. During the boreal winter, ISO primarily propagates eastward along the equator [12,13,14,15,16,17,18], while the boreal summer ISO (BSISO) is more complicated and there are two dominant modes of BSISO with different quasi-oscillating periods. The 30–60-day oscillation is represented by the first mode of BSISO (BSISO1). The 10–30-day oscillation is represented by the second mode of BSISO (BSISO2). The active convection of BSISO1 could propagate northeastward from the tropical Indian Ocean [19,20,21,22,23,24]. In addition, the active convection of BSISO1 could also propagate northward from the South China Sea (SCS) [11] or northwestward from the western North Pacific (WNP) [25]. The active convection of BSISO2 mainly propagates westward or northwestward from the western North Pacific [26,27,28,29,30]. These two intraseasonal oscillations with different periods tend to display a relation of “as one falls, another rises”. For example, the 10–25-day oscillation is enhanced when the 30–60-day oscillation is suppressed in June, July, and September and vice versa [30].
To facilitate the detection and prediction of the BSISO with different quasi-oscillating periods, Lee et al. [31] proposed the real-time BSISO indices (BSISO1 and BSISO2). BSISO1 is identified by the first two principal components (PCs) of the multivariate empirical orthogonal function (MV-EOF) analysis, which together capture the canonical northward propagating variability with periods of 30–60 days that often occurs in conjunction with the eastward propagating Madden–Julian Oscillation (MJO). BSISO2 is identified by the third and fourth PCs, which together mainly represent the northward or northwestward propagating variability with periods of 10–30 days. These indices suggested by Lee et al. [31] can well represent the poleward-propagating ISO pattern [32,33,34] over the EASM region [8].
The BSISO can propagate poleward and highly impact the summer precipitation in eastern China, including the middle-lower reaches of the YRB [35,36,37,38,39]. Extreme rainfall events over the YRB are often related to the BSISO [40,41,42]. For example, the enhanced precipitation over the YRB during the summer of 1991 was influenced by the 15–35-day oscillation, leading to severe floods [40]. The extreme rainfall events over the YRB in June–July 1996 were associated with the cooperative modulation of the 10–25-day and 30–60-day oscillations [8]. In the summer of 2020, the East Asian monsoon circulation system exhibited obvious characteristics of the 10–20-day oscillation, and the YRB witnessed an extreme rainfall event [43]. Chen et al. [38] suggest that tropical 25–90-day ISO can propagate northward and influence precipitation in the YRB and northern China.
El Niño–Southern Oscillation (ENSO) can significantly impact the year-to-year variability of BSISO [44,45,46,47,48,49]. During both developing [50,51] and decaying summers [52,53], ENSO modulates the BSISO. Specifically, during El Niño decaying summers, the intensity of northward-propagating BSISO tends to be weakened and suppressed [53].
In the past three decades, two extreme El Niño events occurred in 1997/1998 and 2015/2016 [54,55,56]. During the decaying summer of the two strongest El Niños, extreme precipitation occurred over the YRB, and these extreme precipitations were impacted by the BSISO [25,41,57]. In 1998, extreme rainfall events that were influenced by 30–60-day oscillation occurred in the YRB [25,41]. Zhu et al. [25] suggested that the severe floods in eastern China during the summer of 1998 were shown to be consistent with the propagation and activity of the 30–60-day oscillation over the western North Pacific. Sun et al. [41] demonstrated that a 30–60-day oscillation maintained the shape and intensity of the extreme rain belt over the YRB during late June of 1998 and emphasized the effects of wave trains emanating from the northern Indian Ocean. Shao et al. [57] emphasized the role of MJO in causing the extreme rainfall in China in 2016. In June–July of 2016, the strengthened convection over the tropical Indian Ocean, along with the weakened convection over the SCS to the western Pacific, excited a northeastward-propagating Rossby wave train, which was conducive to the enhancement of rainfall over the YRB [57]. Shen et al. [58] found that on the sub-seasonal time scale, summer rainfall in 1998 and 2016 exhibited dramatic diversity, and rainfall anomalies were manifested as a dipole anomaly pattern over eastern China. Further analyses reveal that the sea ice area (SIA) anomaly over the Barents–Kara Seas (BKS) in these two years may have contributed to the reverse August precipitation anomaly in eastern China [58].
It is interesting to note that previous studies have shown that during the decaying summer of El Niño, the activity of the BSISO and associated active convection and precipitation was suppressed [52,53]. However, in 1998 and 2016, as the decaying years of two extreme El Niños, the BSISO activity arrived at the YRB latitude, causing extreme precipitation [25,41,57]. The causes and mechanisms for the far-reaching BSISO and the associated extreme precipitation in the decaying summer of the extreme El Niños 1998 and 2016 remain unclear.
Therefore, one main aim of this study is to explore the possible causes for the intensified precipitation influenced by BSISO during decaying summers of extreme El Niños. In addition, because there is more than one extreme rainfall process occurring in summer, multiple BSISO events are identified and selected in this study. We classify the BSISO events following the definition of Lee et al. [31] to distinguish the 30–60-day oscillation and 10–30-day oscillation. In this paper, a complete rainfall event includes the evolution and transition from a dry episode to a wet episode. Because the dry episode alternates with the wet episode, we analyze the dry and wet phases in each extreme rainfall event. Furthermore, considering different BSISOs may have different source regions, such as the Indian Ocean or the South China Sea–western Pacific, and the source regions are still unclear and controversial in each event, the propagation and origin of the active convection are carefully examined.
The remainder of this study is organized as follows. Section 2 describes the data and methods. Section 3.1 describes the intraseasonal characteristics of the summer precipitation in the YRB and identifies multiple rainfall events in 1998 and 2016. Section 3.2 investigates the evolution of BSISO and its impact on Yangtze rainfall in 1998. The evolution of BSISO and its impact on Yangtze rainfall in 2016 is explored in Section 3.3. Section 3.4 examines the SST and atmospheric circulation background, providing possible explanations for the far-reaching BSISO. A summary and discussion are presented in Section 4.

2. Data and Methods

2.1. Data

The daily and monthly three-dimensional wind datasets were provided by the National Center for Environmental Prediction/the National Center for Atmospheric Research (NCEP/NCAR) Reanalysis 1, which can be found at https://psl.noaa.gov/data/gridded/data.ncep.reanalysis.html, accessed on 19 October 2022, with a horizontal resolution of 2.5° × 2.5° [59]. We also used the daily outgoing longwave radiation (OLR) data from the National Oceanic and Atmospheric Administration (NOAA), which can be found at https://www.psl.noaa.gov/data/gridded/data.olrcdr.interp.html, accessed on 19 October 2022, with a horizontal resolution of 2.5° × 2.5° [60]. Daily precipitation data [61,62] were obtained from the NOAA Climate Prediction Center (CPC) and can be found at https://www.psl.noaa.gov/data/gridded/data.cpc.globalprecip.html, accessed on 19 October 2022, with a horizontal resolution of 0.5° × 0.5°. The BSISO1 and BSISO2 indices were downloaded from https://apcc21.org/ser/moni.do?lang=en, accessed on 19 October 2022. We also used the monthly Extended Reconstructed Sea Surface Temperature version 5 (ERSSTv5) [63] dataset, which can be found at https://psl.noaa.gov/data/gridded/data.noaa.ersst.v5.html, accessed on 19 October 2022.

2.2. Methods

To identify the dominant periods of ISO, in this study, we used wavelet analysis [64] to decompose the time series of precipitation anomalies over the middle-lower reaches of the YRB (27° N–32.5° N, 110° E–122° E) for the extended boreal summer (May–October) in 1998 and 2016, respectively.
The BSISO1 and BSISO2 indices follow the definition of Lee et al. [31], using the multivariate empirical orthogonal function (MV-EOF) on the daily 850 hPa zonal wind anomalies and OLR anomalies. PC1 and PC2 are the first and second principal components of MV-EOF, respectively. PC3 and PC4 are the third and fourth principal components of MV-EOF, respectively. Using the BSISO1 and BSISO2 indices [31], the phase evolution of BSISO1 or BSISO2 was illustrated for each rainfall event during the summer of 1998 and 2016. There were two strong rainfall events in 1998 and three rainfall events in 2016. In this paper, based on the wavelet analysis of the raw precipitation anomalies, we defined a complete rainfall event over the YRB including the evolution from a dry episode to a wet episode. Composite analyses for eight phases were performed to examine the spatio-temporal structure of YRB rainfall in relation to the BSISO activity and the related mechanisms. A 10-day running mean was applied to several associated variables (e.g., the OLR and winds) to remove the high-frequency variability. Anomalies of all variables (precipitation, SST, etc.) were defined as deviations of original values minus the climatological mean of the period 1981–2010.

3. Results

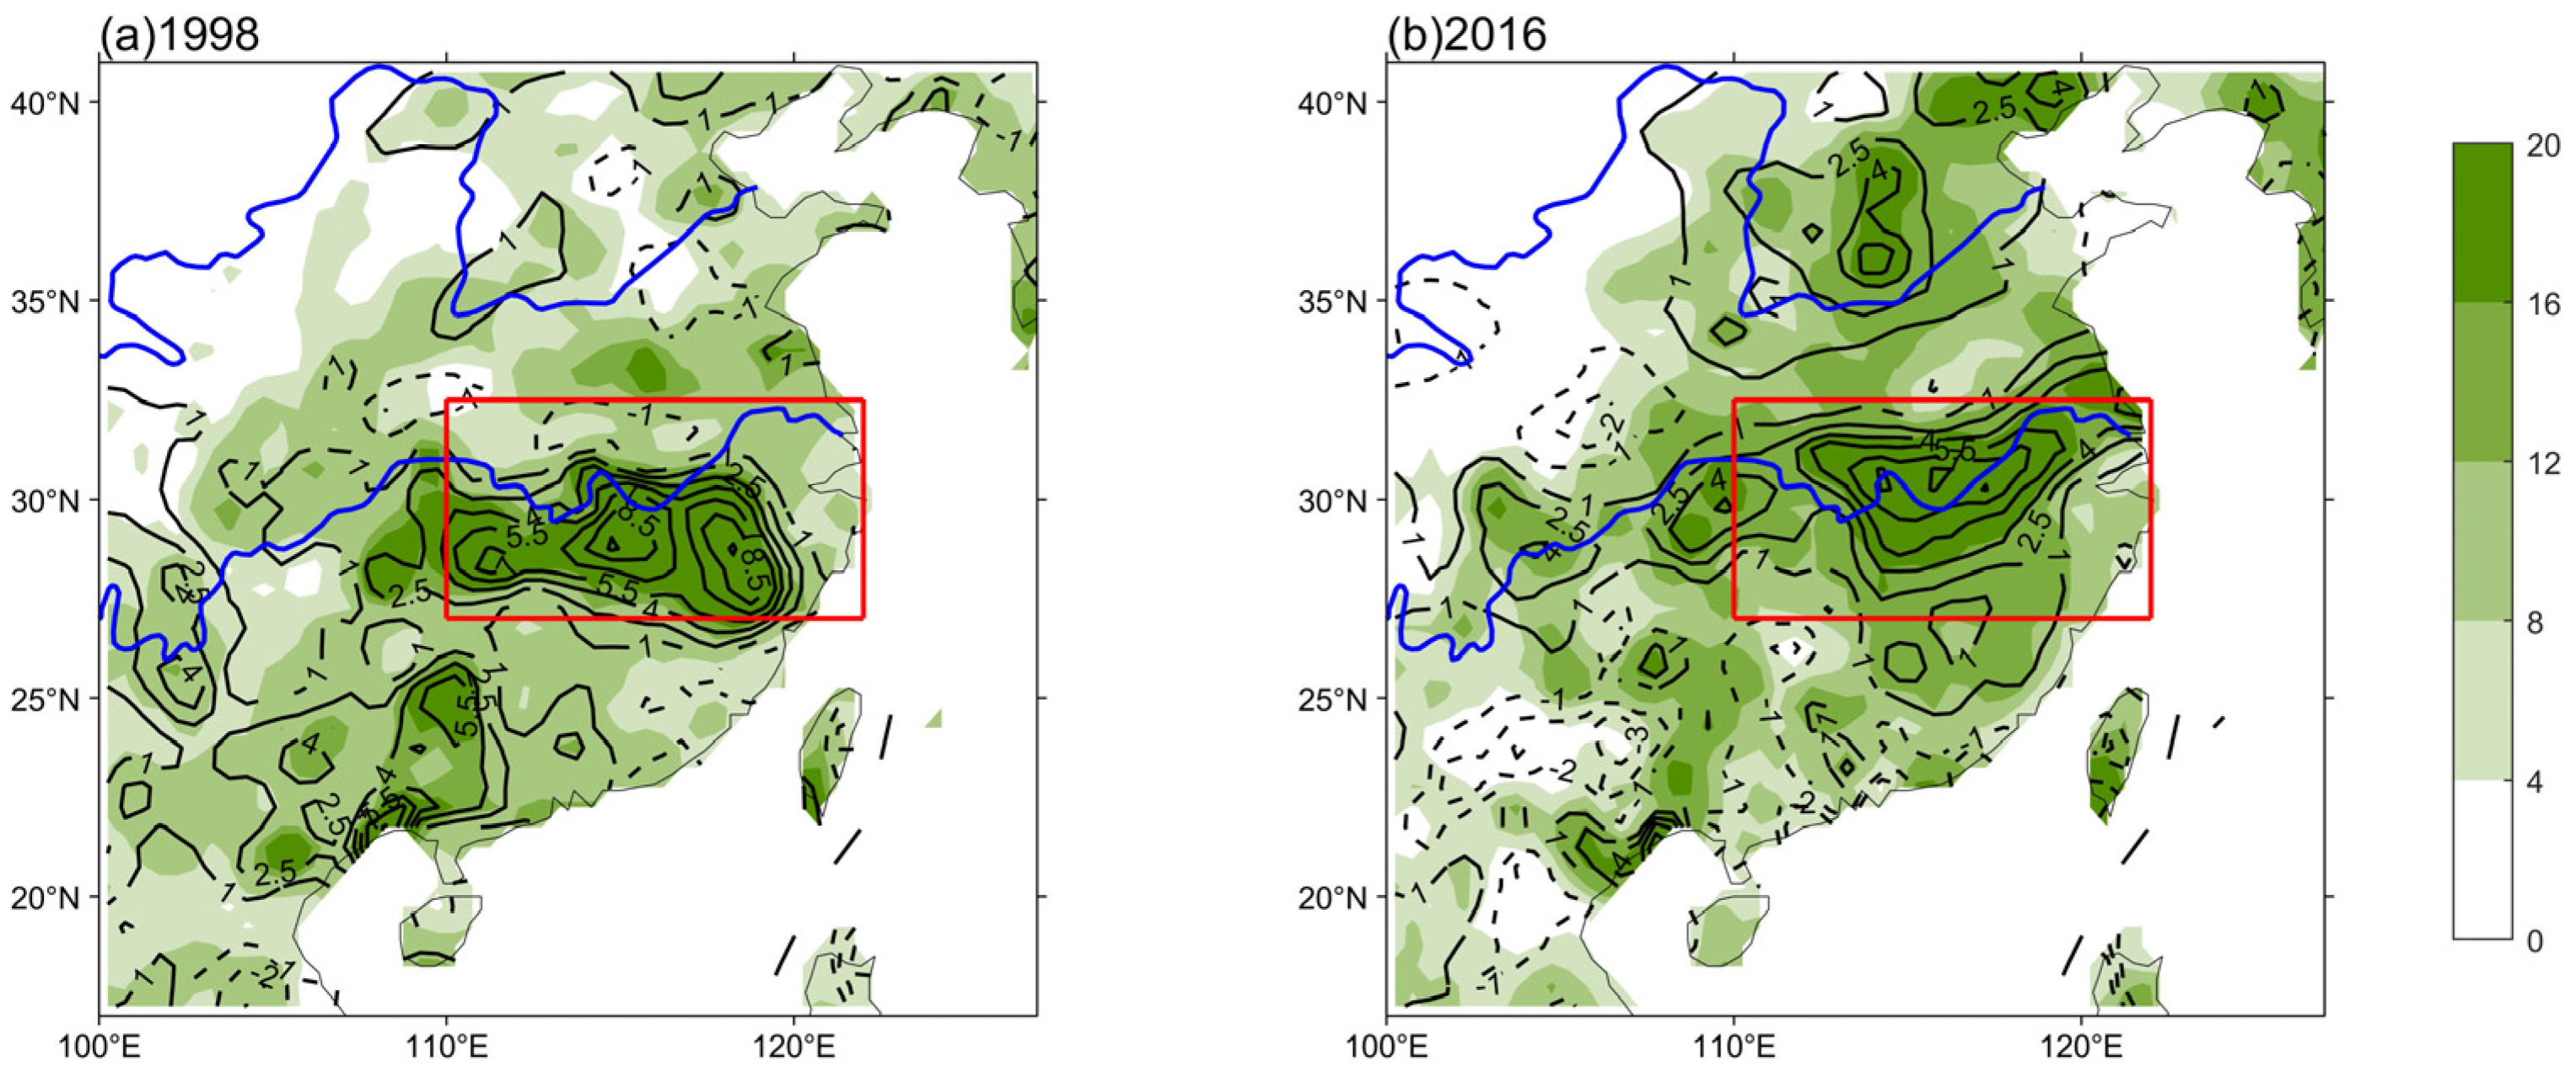
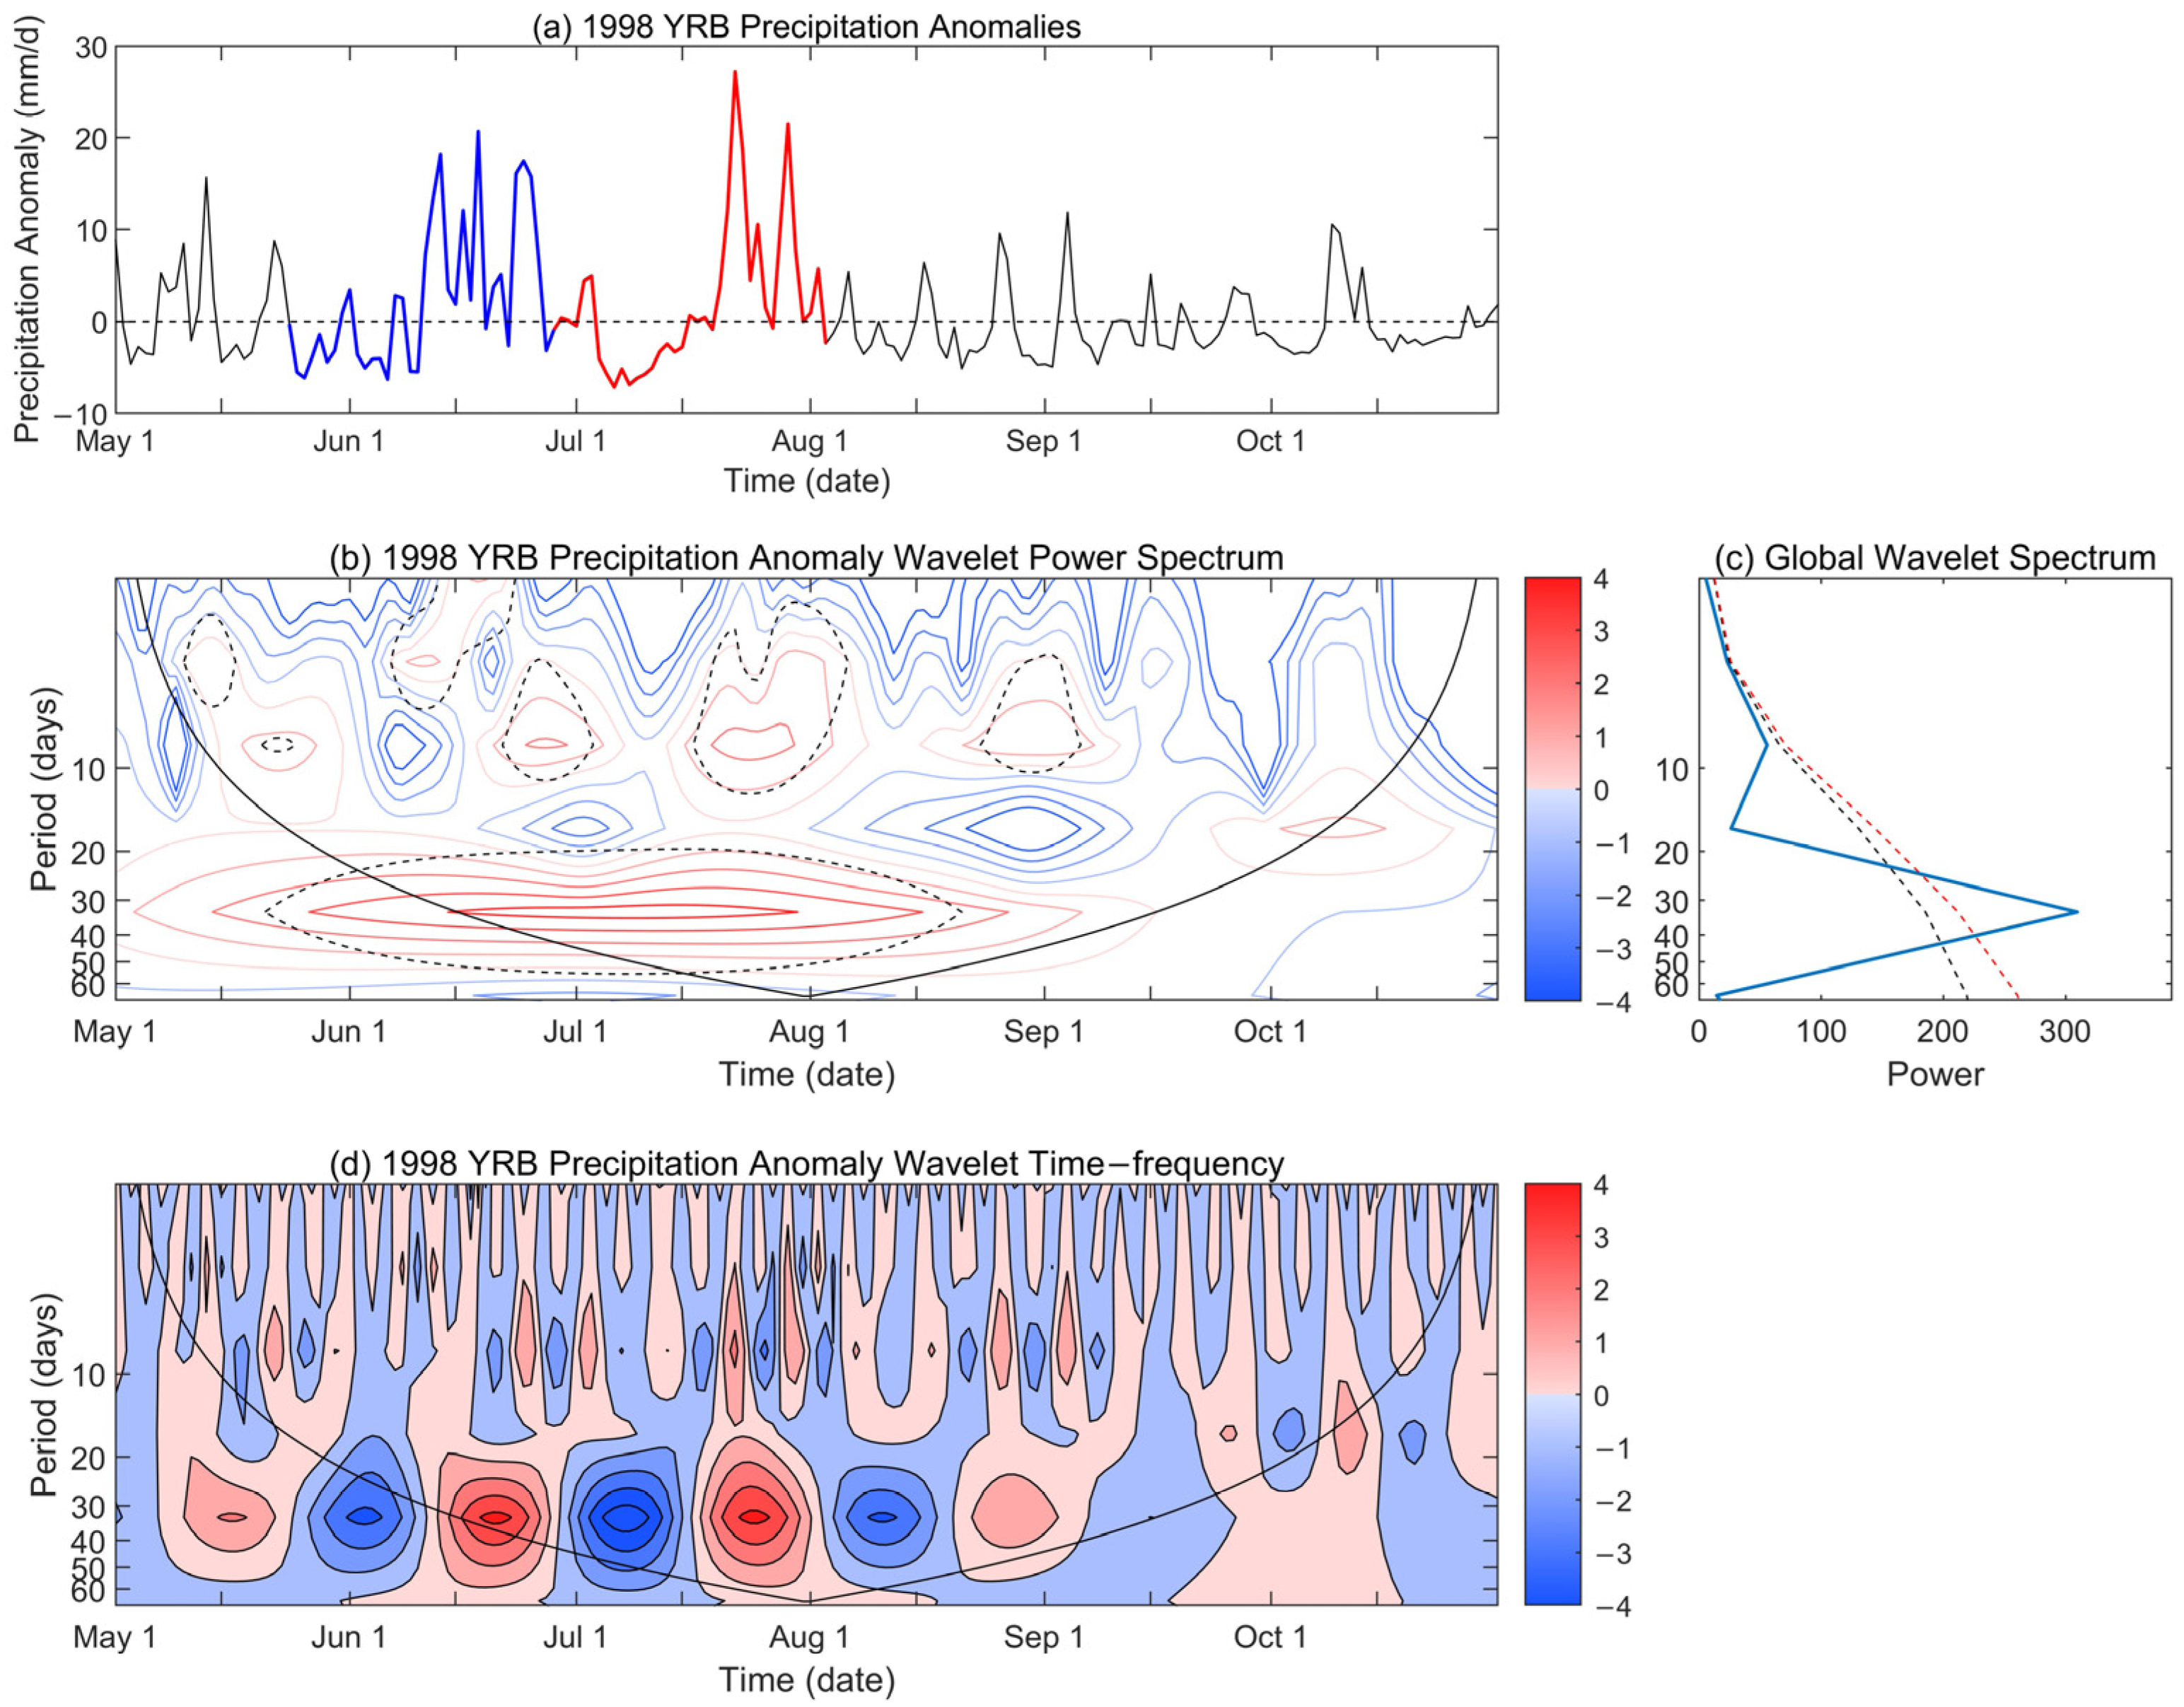
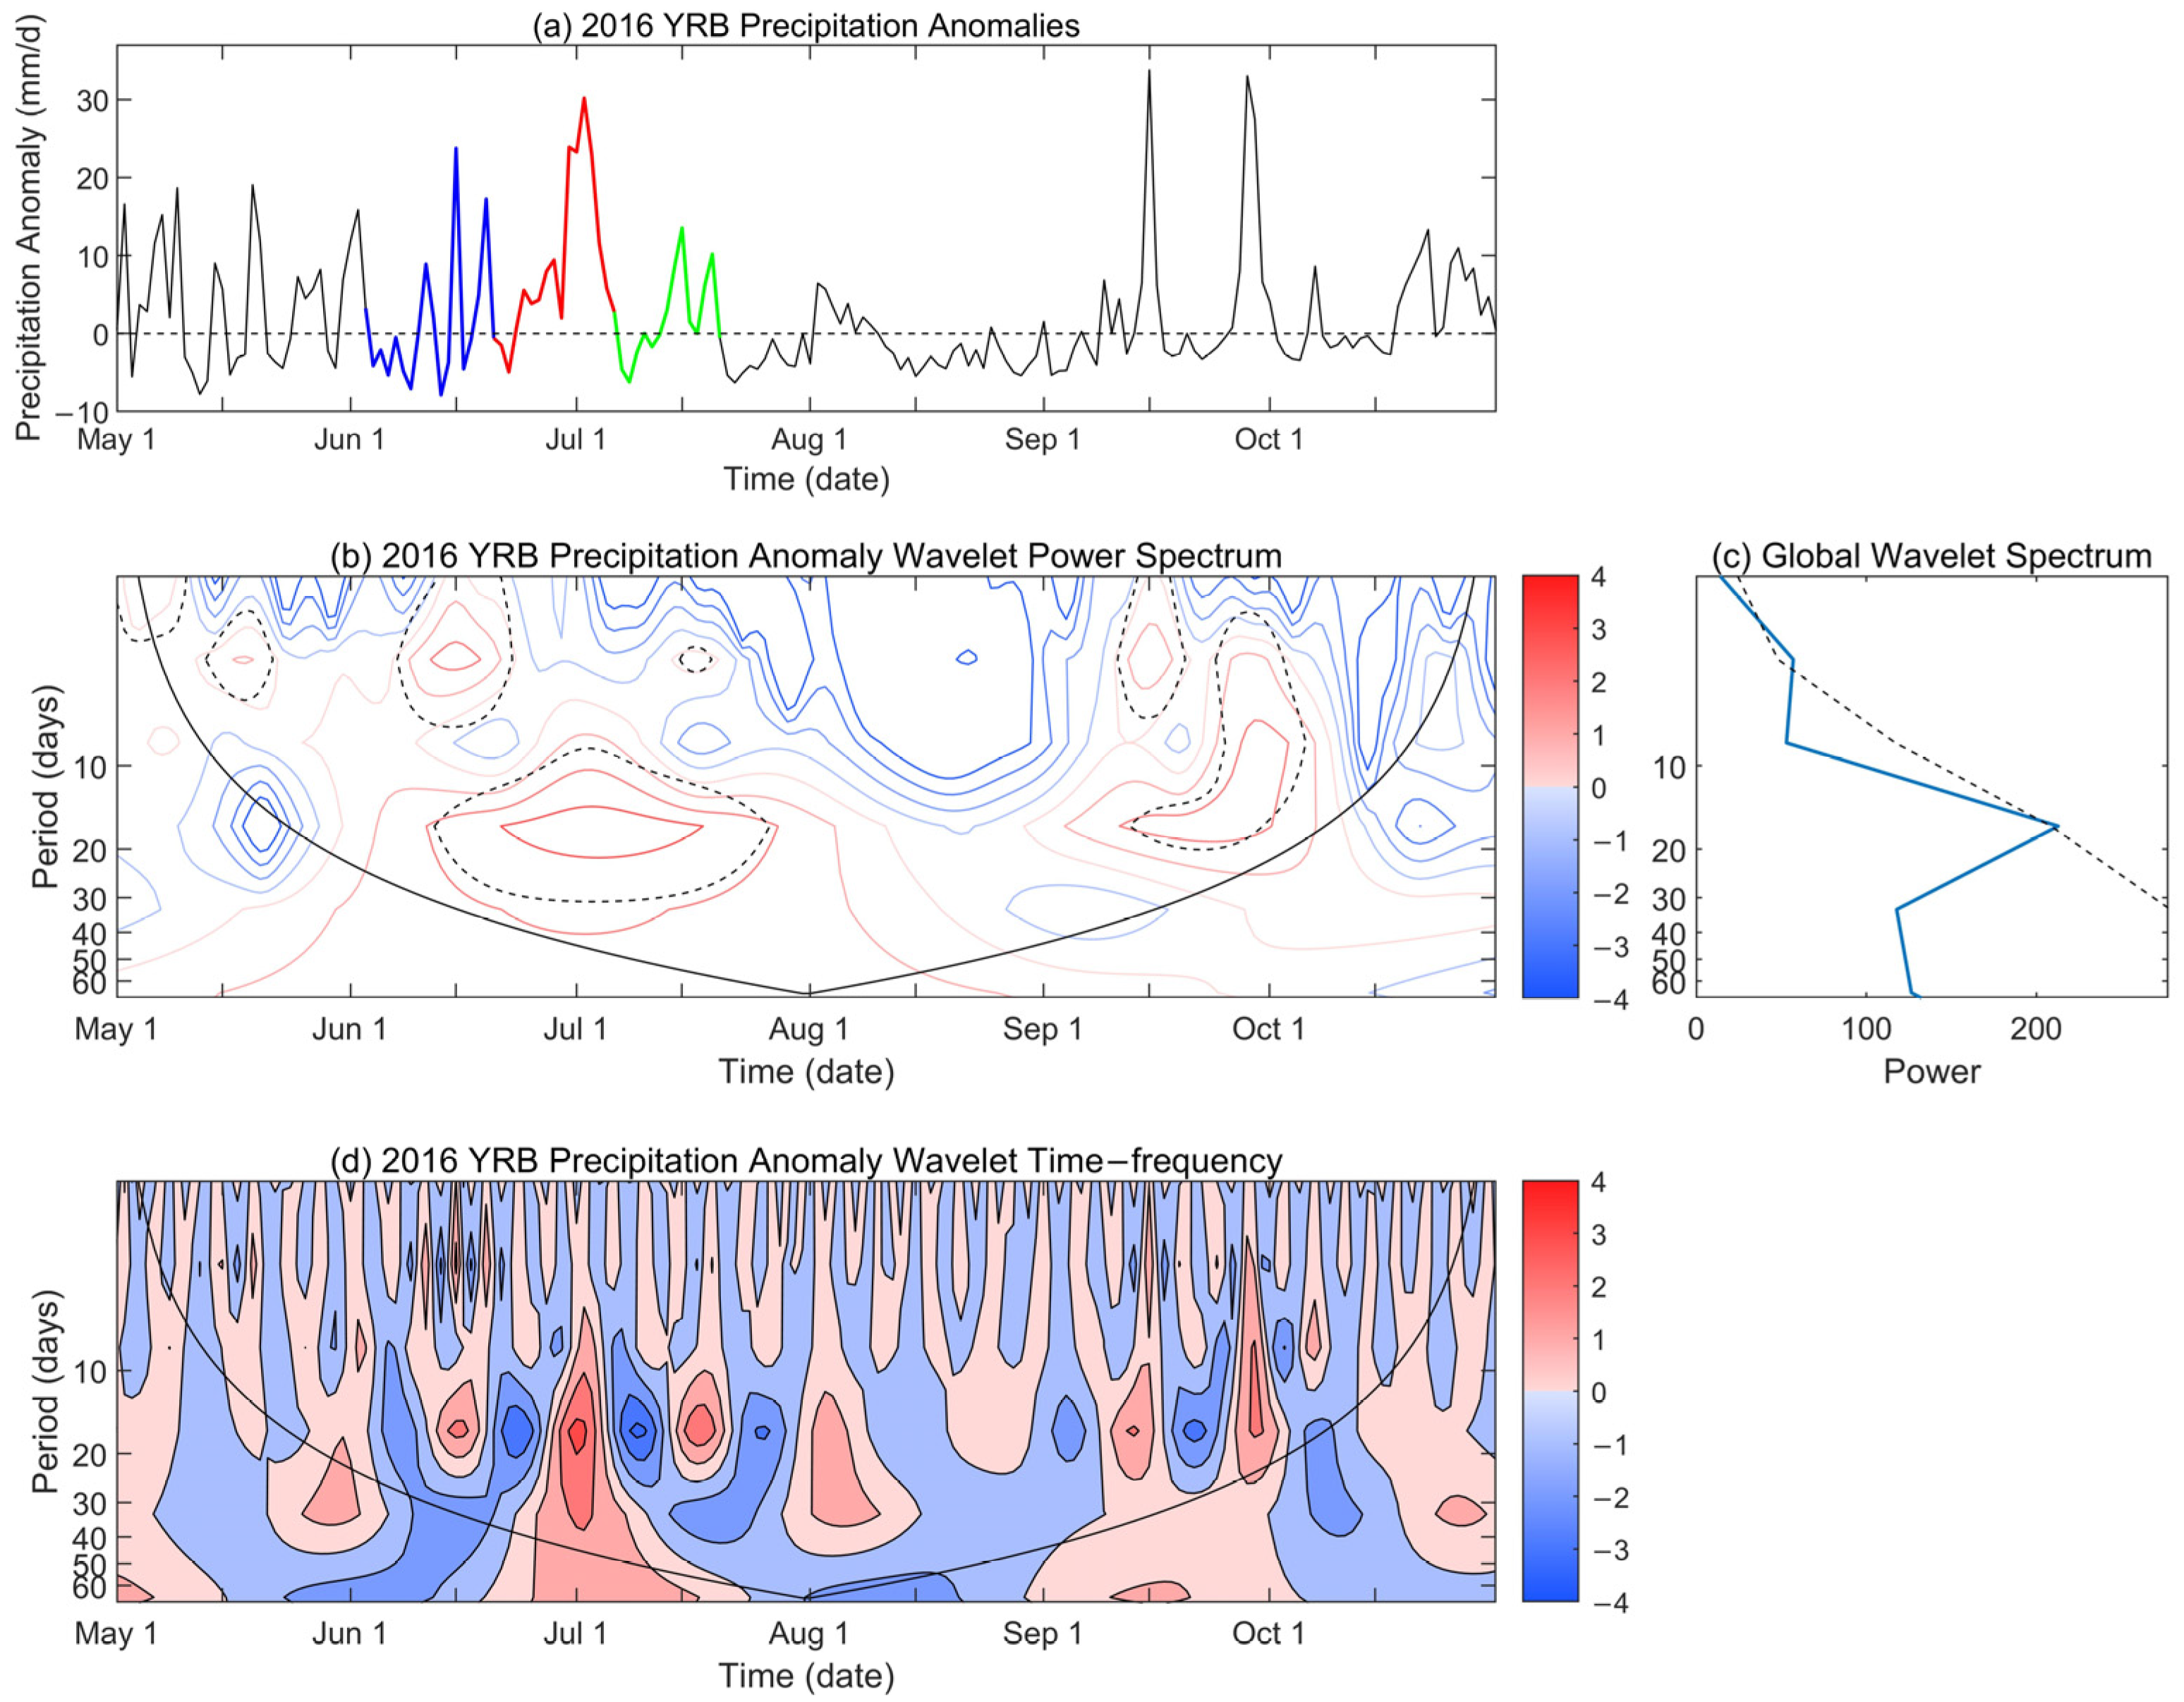
3.1. The Intraseasonal Features of Summer Precipitation over the YRB in 1998 and 2016

Positive rainfall anomalies occurred over the YRB during June–July 1998 and 2016 (Figure 1). Here, the YRB covers the main stream of the Yangtze River’s middle and lower reaches, which is consistent with the domain of the YRB in the previous study [4]. The maximum positive precipitation anomalies emerged south of 30° N in 1998 and on both sides of 30° N in 2016. Maximum positive anomalies occurred over the YRB, accompanied by large standard deviations of precipitation anomalies, implying that precipitations over the YRB in 1998 and 2016 were modulated by strong BSISOs (Figure 1).
Figure 2a shows the time series of the area-averaged precipitation anomalies over the YRB during the extended boreal summer (May–October) of 1998. Positive rainfall anomalies mainly emerged from May to July, while the anomalies were much weaker and shorter-lived from August to October (Figure 2a). The traditional summer lasts from June to August. Considering that the positive rainfall anomalies significantly decrease in August, this study focuses on the rainfall events during June–July. The wavelet analyses suggest that the summer precipitation over the YRB in 1998 was mainly controlled by the 30–60-day oscillation (i.e., BSISO1, Figure 2b–d), and the power of a 10–30-day oscillation (i.e., BSISO2) seems much lower than a 30–60-day oscillation. Two heavy rainfall events occurred over the YRB in 1998 from May 24 to June 28 (1998 event 1) and from June 29 to August 3 (1998 event 2), respectively, accompanying the switch between the dry phase and the wet phase of the BSISO (Figure 2a,d). In each rainfall event in relation to BSISO, the dry episode and the wet episode each occupy about half of the whole cycle (Figure 2a,d). Specifically, the dry (wet) phase corresponds to the basically negative (positive) time series of precipitation anomalies in Figure 2a. Similarly, the dry (wet) phase represents the negative (positive) 30–60-day oscillation of precipitation anomalies in Figure 2d. The alternation of negative and positive anomalies denotes the alternation of dry and wet phases.
In 2016 (Figure 3a), the summer rainfall anomalies over the YRB mainly emerged before mid-July, followed by a decrease in August. The wavelet analyses demonstrate that the summer precipitation over the YRB in 2016 was mainly controlled by the 10–30-day oscillation (Figure 3b–d). As mentioned in the previous paragraph, similarly the main focus is on June and July. Therefore, the precipitation events in May and September 2016 were not identified as summer precipitation events. In addition, considering the edge effects, a longer period of time, i.e., the extended summer period from May to October, was selected to perform wavelet analysis. As shown in Figure 2b (Figure 3b), the 30–60-day (10–30-day) oscillations during June and July were statistically significant in 1998 (2016). If we focus only on June–July, the global power spectrum of 10–30-day oscillation in 2016 can pass the 90% confidence level (not shown). During June–July 2016, there were three transitions from the dry episode to the wet episode. In other words, three heavy rainfall events occurred over the YRB in 2016, with dates from 3 June to 20 June (2016 event 1), 21 June to 6 July (2016 event 2), and 7 July to 20 July (2016 event 3), respectively. The first two rainfall events were stronger, with the amplitude of maximum precipitation exceeding about 30 mm·d−1, compared to the third rainfall event, which was weaker than the first two.
The above analyses indicated that the precipitation over the YRB during June–July in 1998 and 2016 displayed pronounced intraseasonal oscillation characteristics. The 30–60-day oscillation dominated the heavy rainfall events in 1998, while the 10–30-day oscillation dominated the heavy rainfall events in 2016. There were two heavy rainfall events during June–July in 1998, with the precipitation maximum located south of 30° N and distinct transitions from the dry episode to the wet episode. There were three rainfall events during June–July in 2016, with the precipitation maximum located on both sides of 30° N.

3.2. The Evolution of BSISO1 and Its Impact on Yangtze Rainfall in 1998

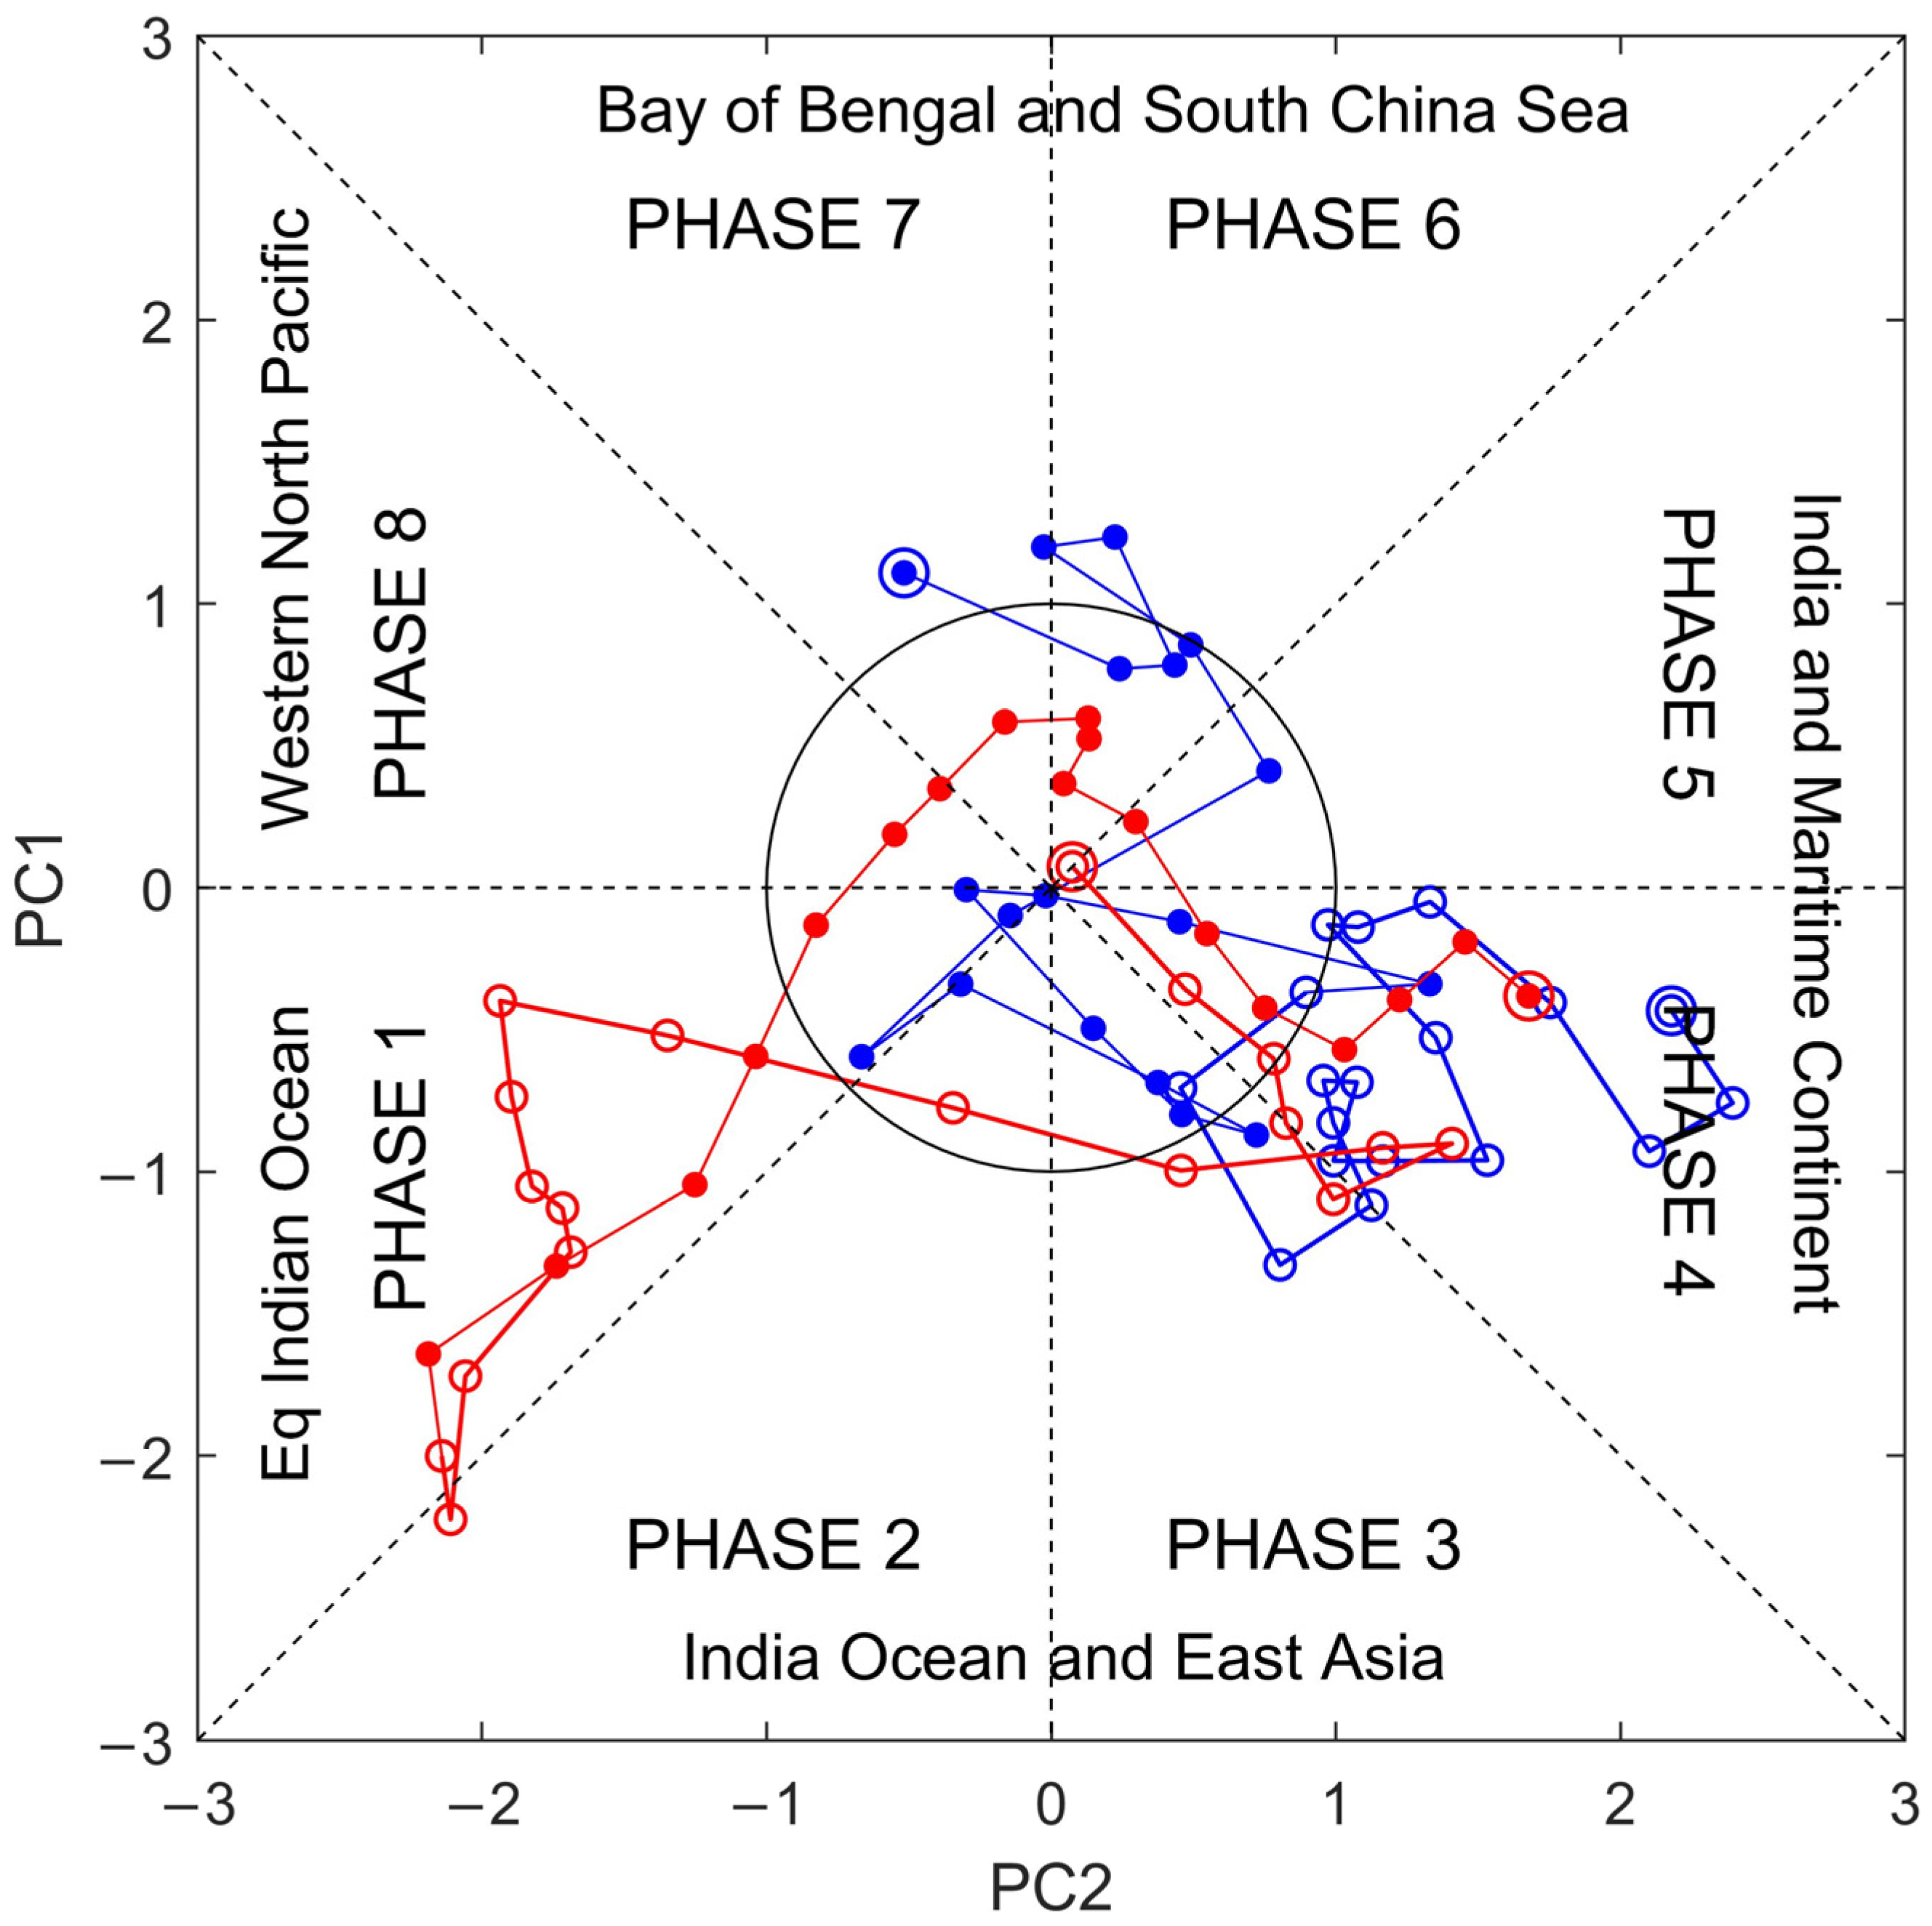
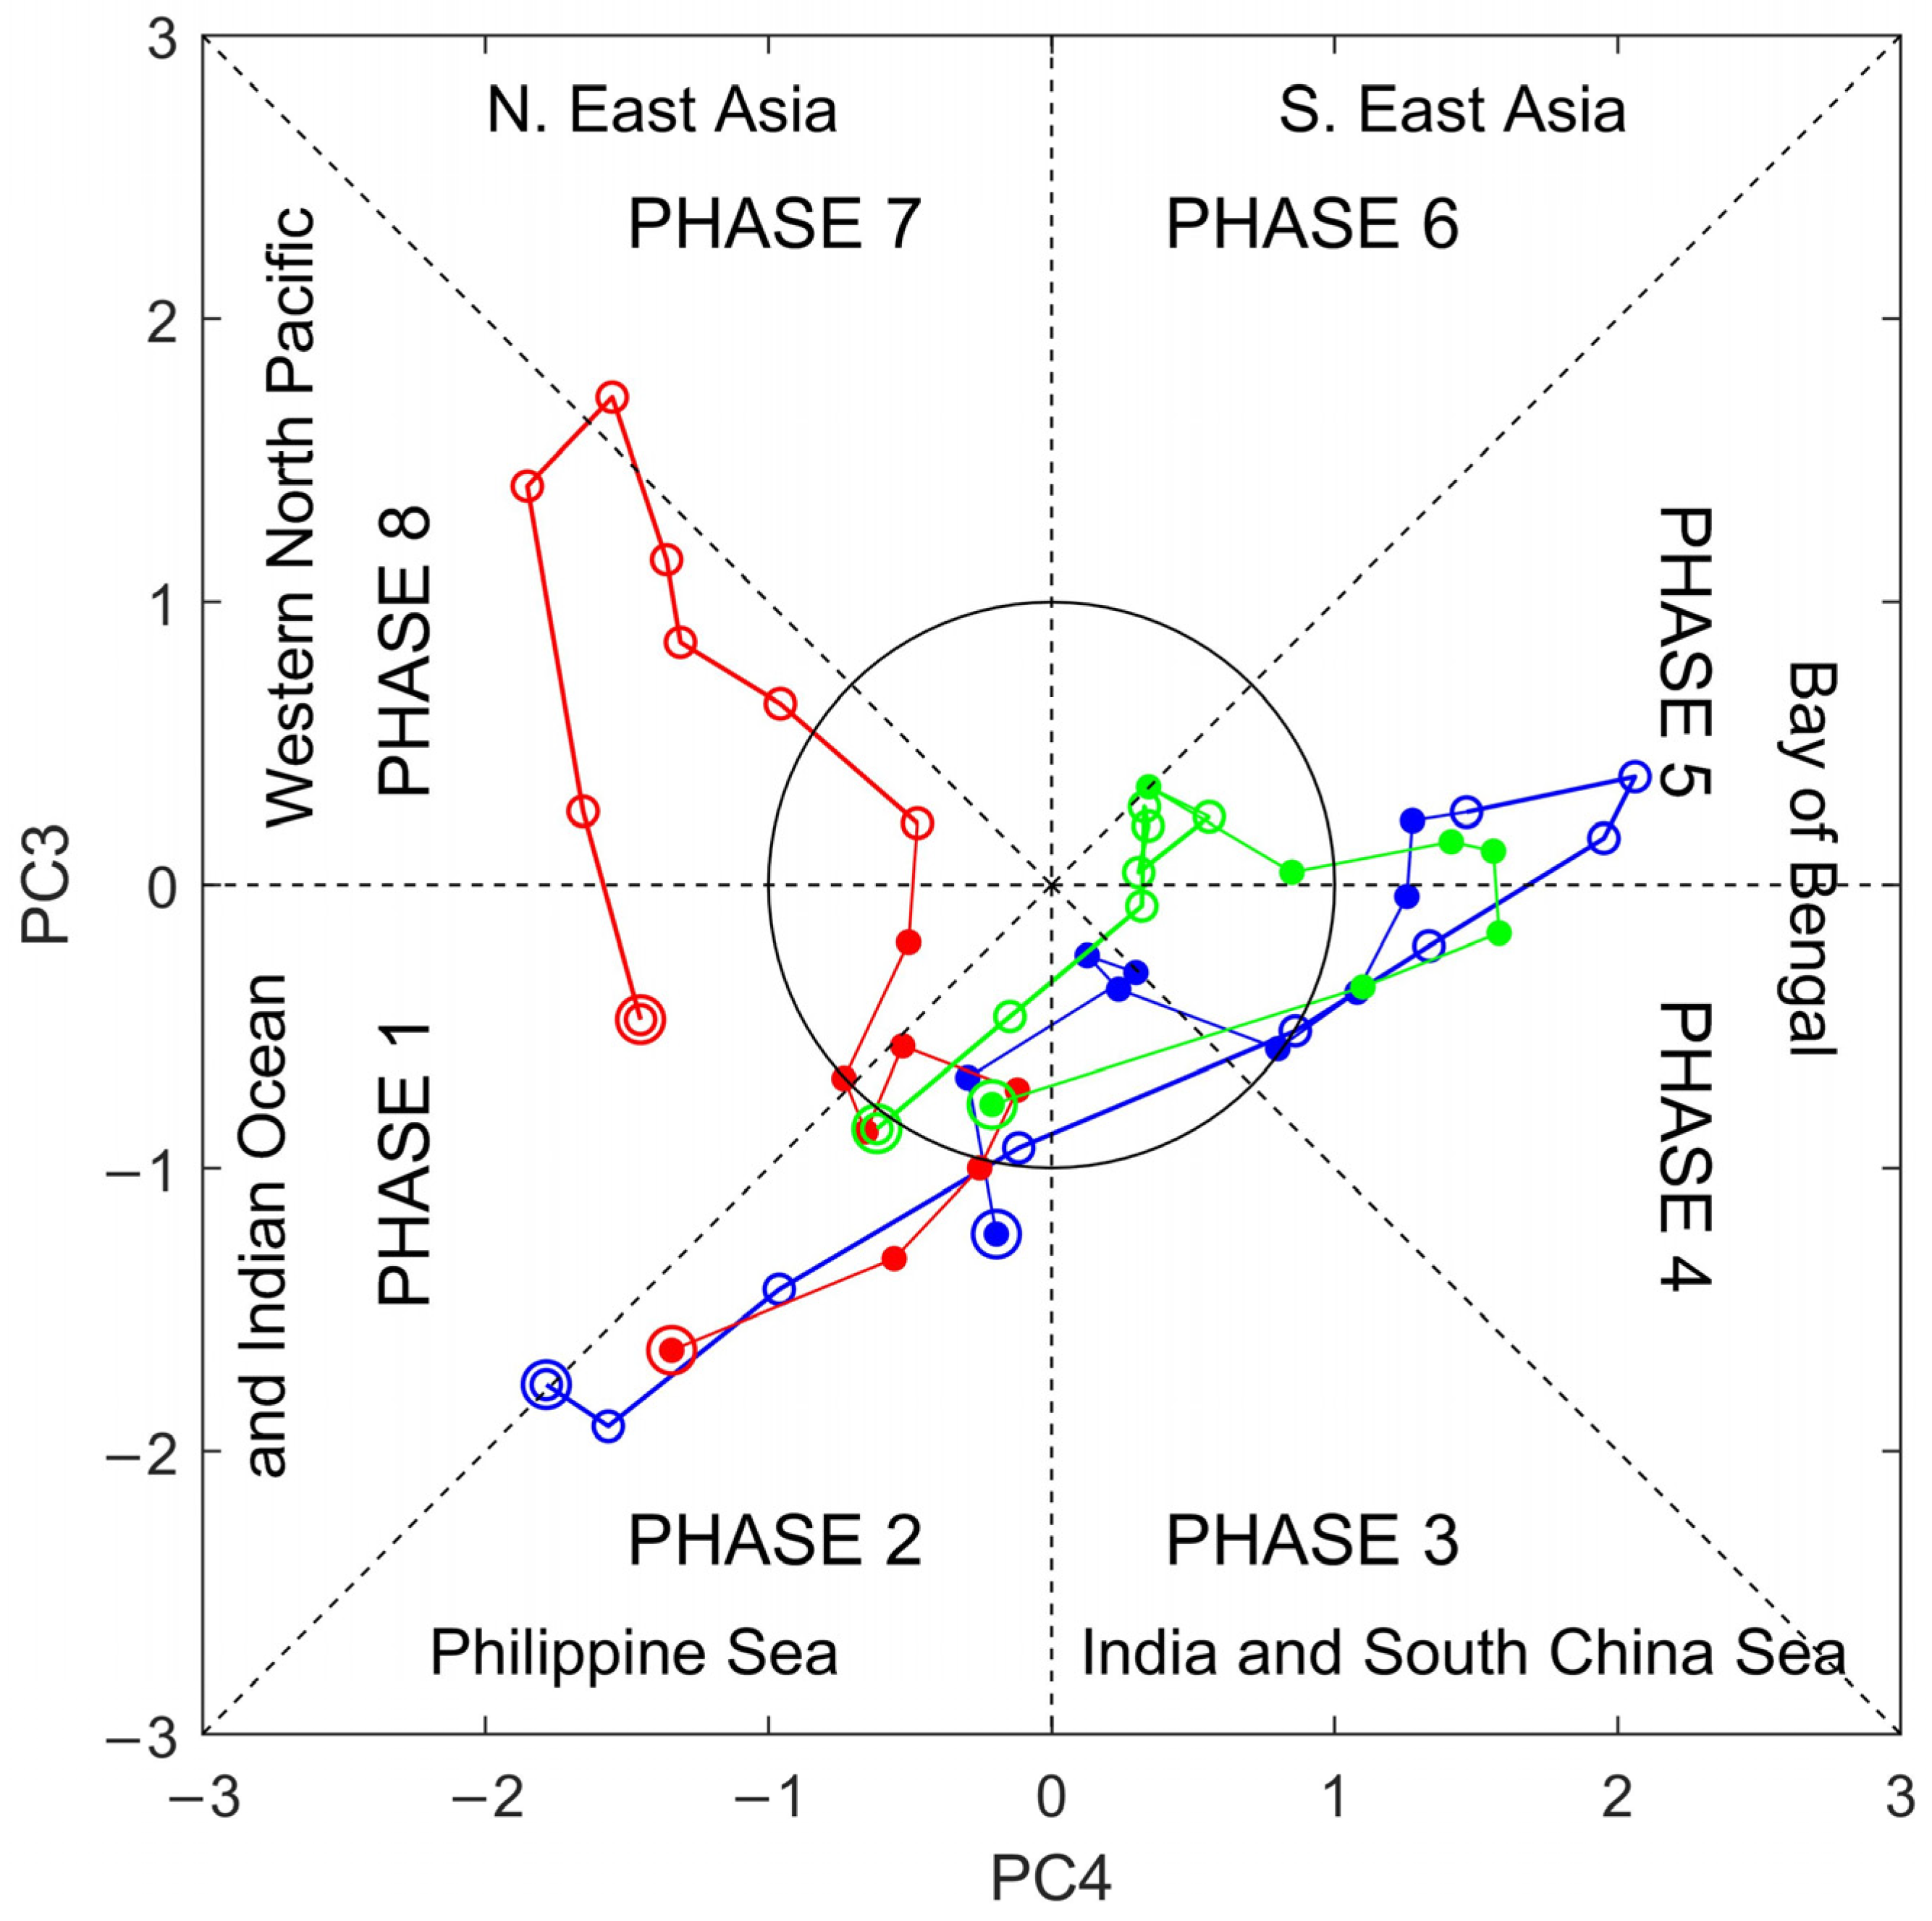
3.2.1. BSISO1 Phase Evolution

As mentioned in Section 3, the summer precipitation over the YRB in 1998 was dominated by the 30–60-day oscillation. To examine the evolution of the 30–60-day oscillation, the BSISO1 index (PC1 and PC2) was used to display the phase-space of the two rainfall events in 1998 (Figure 4). The position of each point denotes the geographical location where active convection emerged.
For rainfall event 1 of 1998 (blue in Figure 4), deep convection arose over the Bay of Bengal and the South China Sea (phases 6–7) and remained there for about a week. Subsequently, the convection migrated towards the tropical Indian Ocean, East Asia, and the Maritime Continent (phases 1–4). The deep convection gradually strengthened and stagnated for about two weeks in the northern Indian Ocean and the Maritime Continent (phase 4). During phase 4, deep convection occurred over the Maritime Continent. At the same time, the extreme precipitation occurred in the YRB (Figure 5d), which could be attributed to the deep convection over eastern China (Figure 6d).
For rainfall event 2 of 1998 (red in Figure 4), deep convection was generated over the northern Indian Ocean and the Maritime Continent (phase 4), and it rapidly weakened in intensity and moved toward the Bay of Bengal and the South China Sea (phases 6–7) and the western North Pacific (phase 8). Then, the convection rapidly strengthened and stagnated for about 10 days in the equatorial Indian Ocean (phase 1). Subsequently, deep convection propagated toward the Maritime Continent (phase 4).
During the wet episode of event 1 in 1998 (June 11 to June 28), deep convection was located in phases 3–4 (blue in Figure 4). The extreme positive precipitation anomalies can be observed in the YRB (Figure 5c,d), corresponding to a strong deep convection over eastern China during this period (Figure 6c,d). During the wet episode of event 2 in 1998 (17 July to 3 August), deep convection was located in phases 1–4 (red in Figure 4). At the same time, the extreme positive precipitation anomalies can be observed in the YRB (Figure 5a–d), corresponding to a strong deep convection over eastern China (Figure 6a–d).

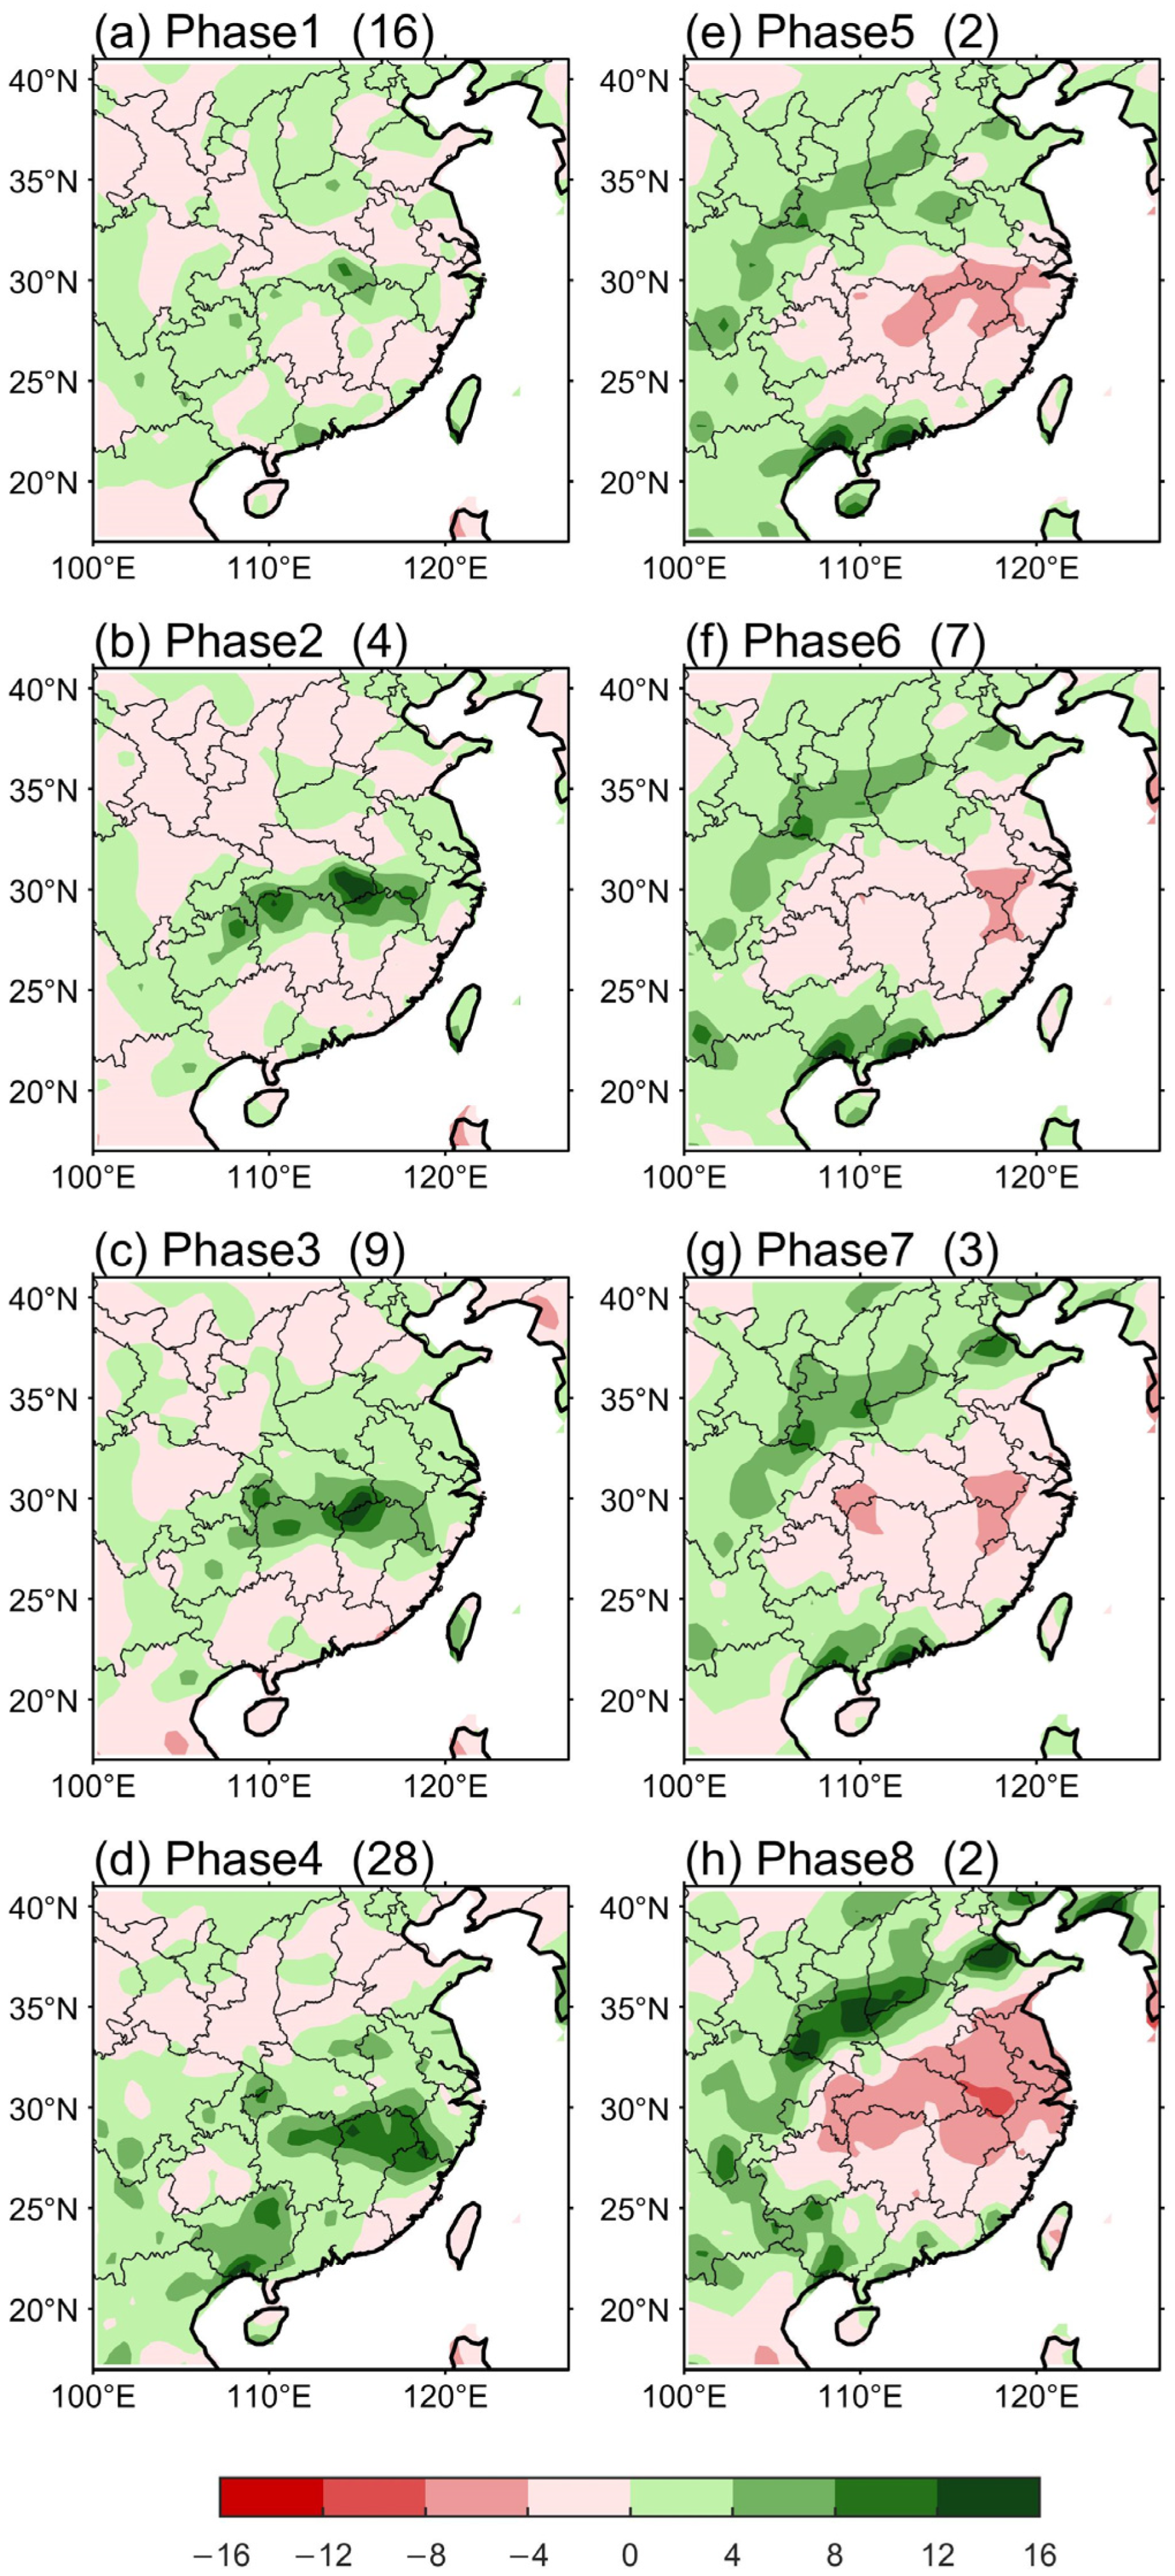
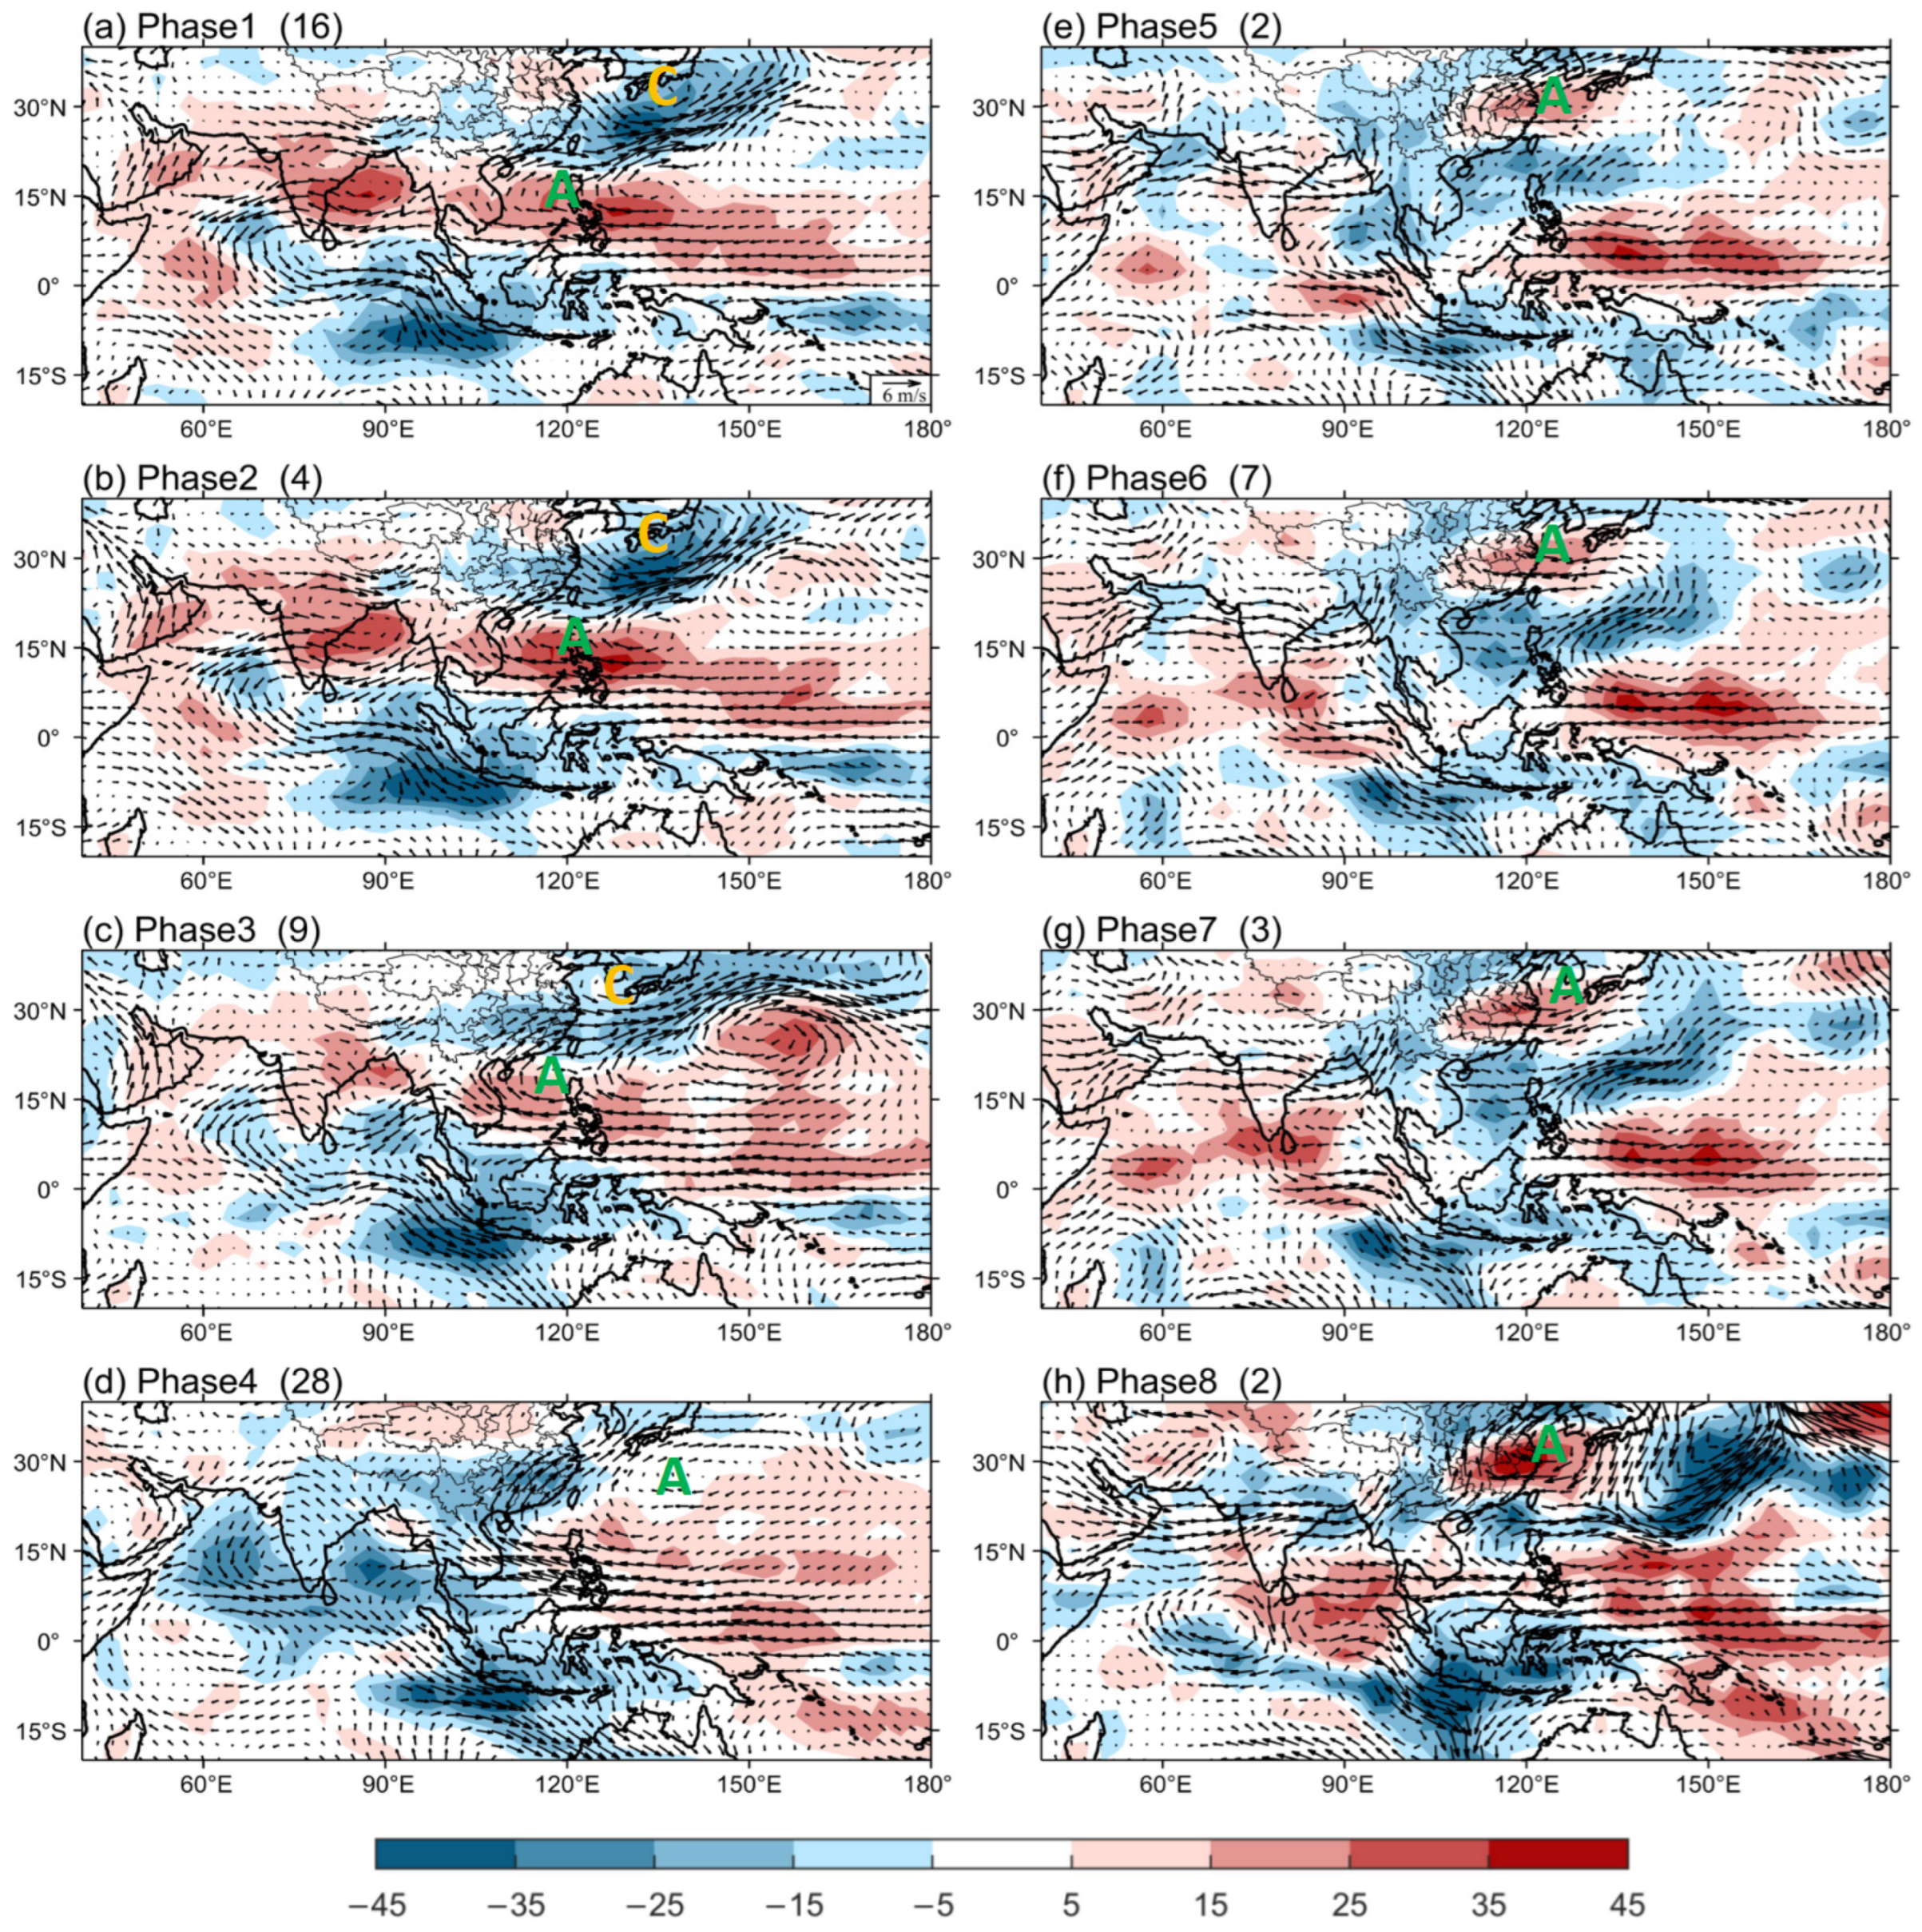
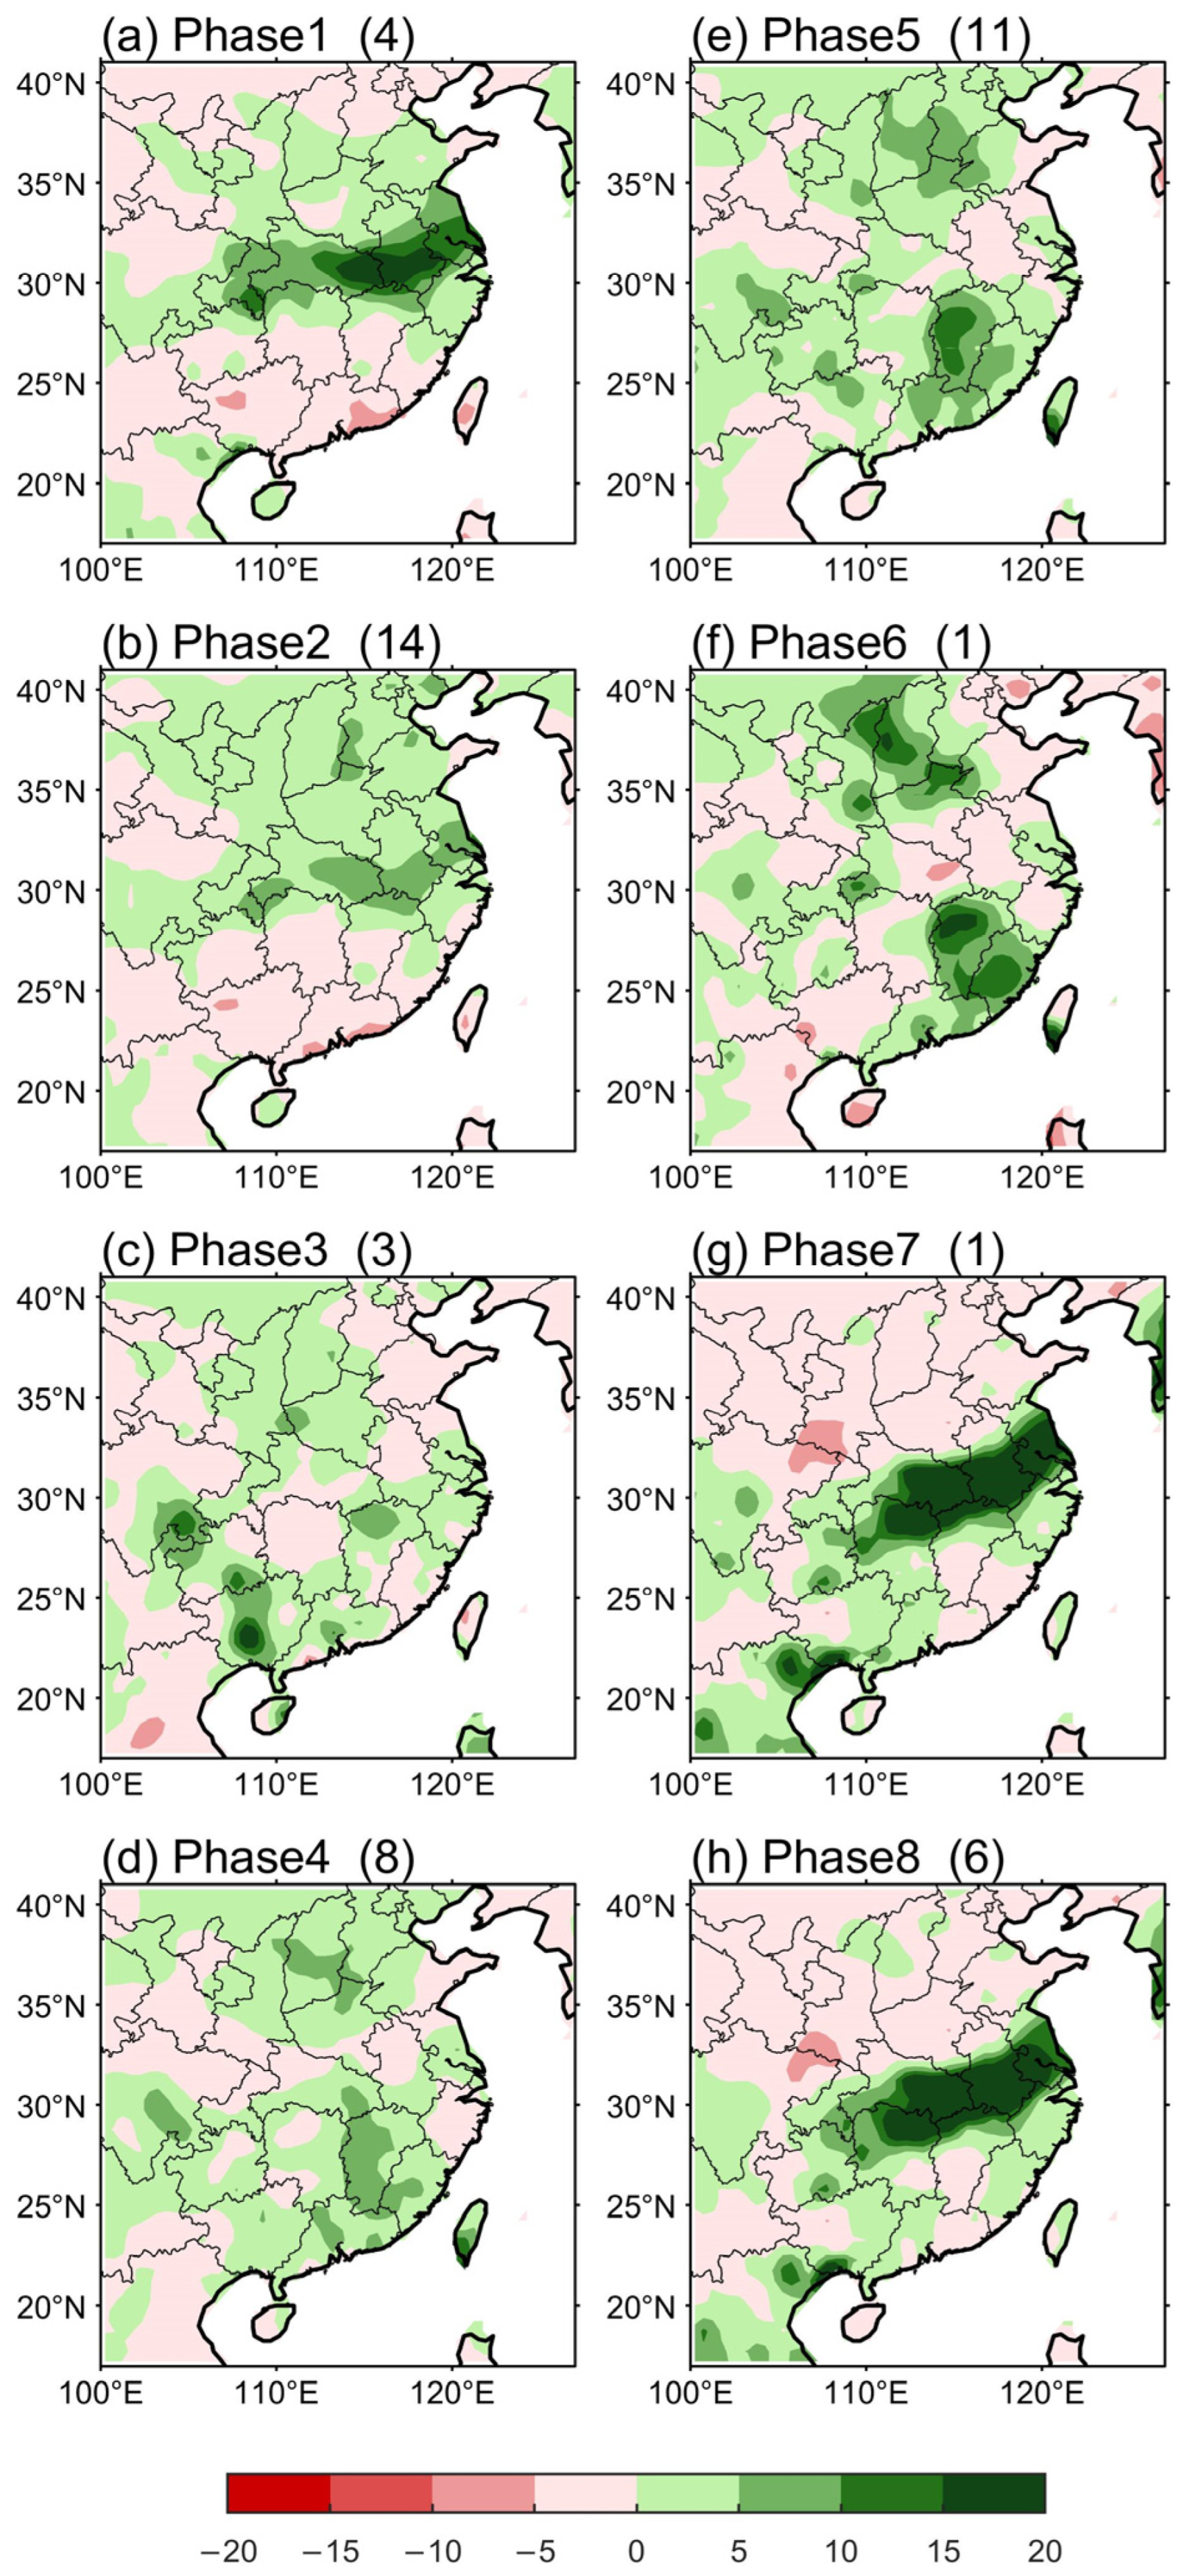
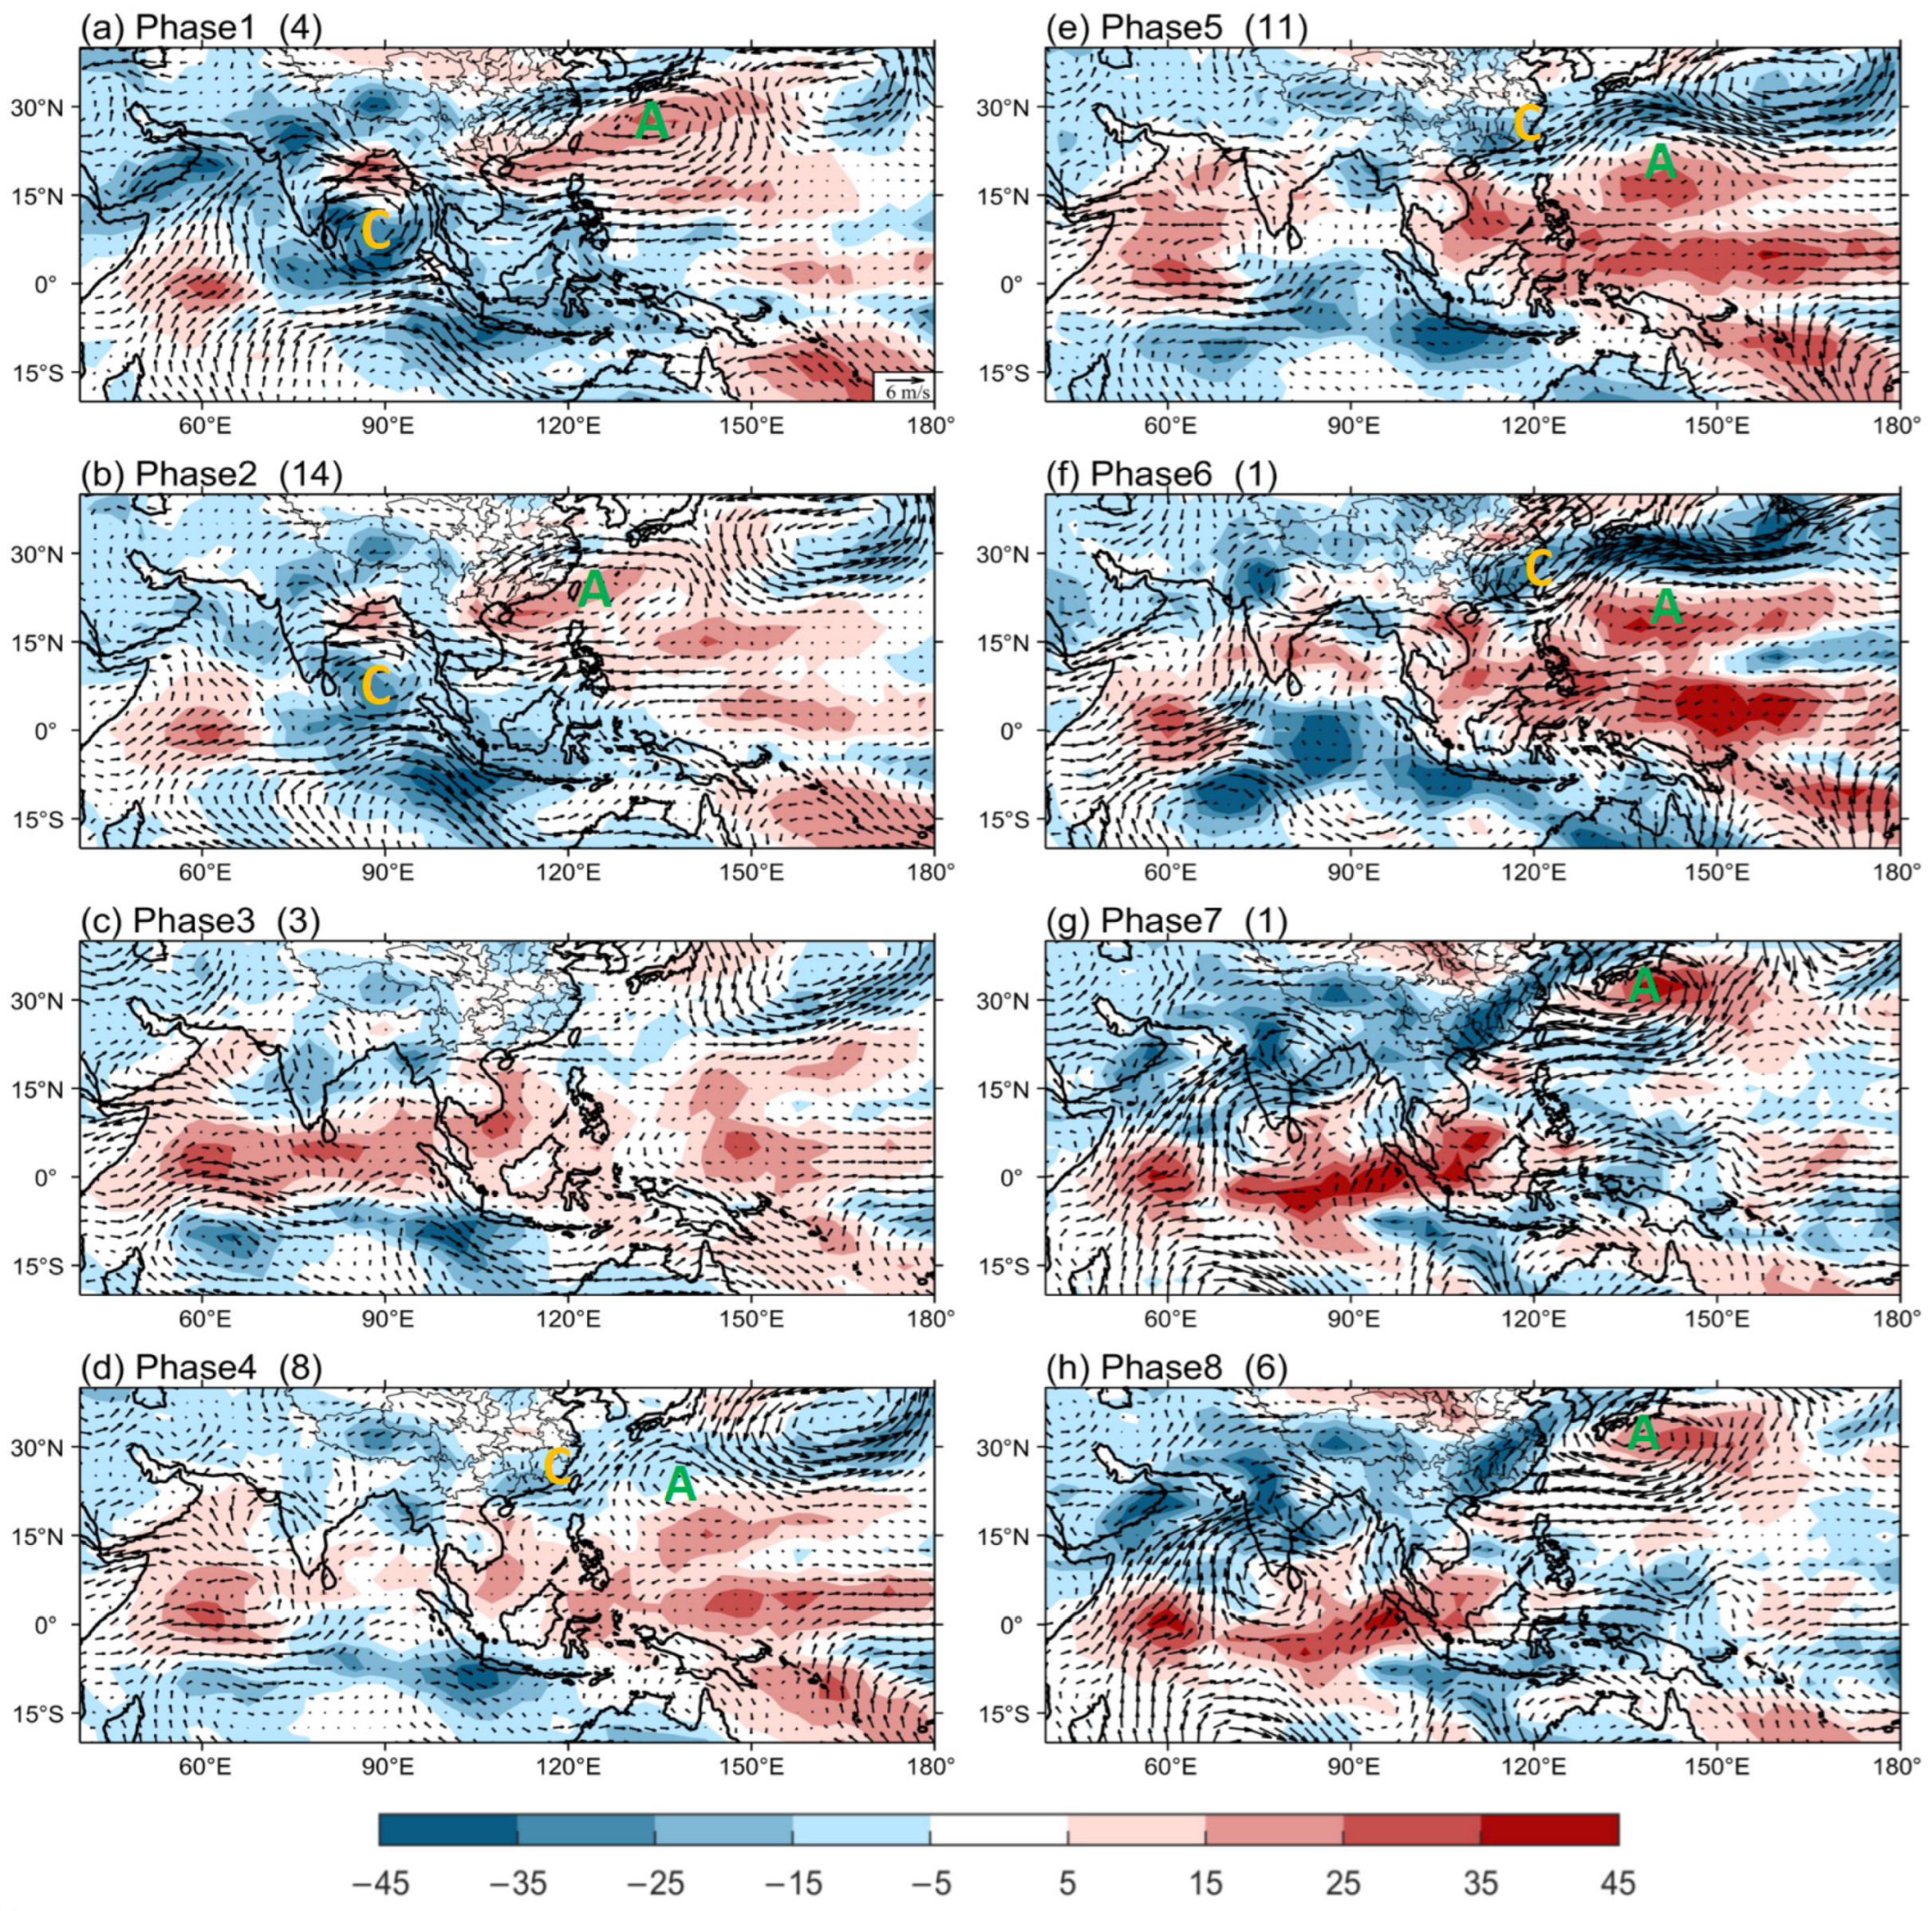
3.2.2. Impact of BSISO1 on Yangtze Rainfall in Eight Phases

Figure 5 presents the composite of the spatial distribution of precipitation anomalies in the YRB during the two events (from 24 May to 3 August) in 1998. In phases 1–4 (Figure 5a–d), i.e., the wet episode, positive precipitation anomalies were observed in the YRB, with the maximum value located south of 30° N. In addition, the maximum positive precipitation anomalies were observed in phase 4, located south of 30° N (Figure 5d). While in phases 5–8 (Figure 5e–h), i.e., the dry episode, negative precipitation anomalies were observed in the YRB, with the maximum negative anomalies occurring in phase 8 (Figure 5h). Precipitation anomalies (Figure 5) are consistent with convection conditions (Figure 6). When the YRB experienced strong convergence anomalies and enhanced convection in phases 1–4, positive precipitation anomalies also occurred during this wet episode. When the YRB was dominated by the suppressed convection in phases 5–8, negative precipitation anomalies also occurred during this dry episode.
To further demonstrate how BSISO1 influences rainfall in the YRB, Figure 6 presents the evolution of composite OLR and 850 hPa wind anomalies of two rainfall events for eight phases in 1998. In phase 1 (Figure 6a), a low-level anomalous anticyclone appeared in the South China Sea, while an anomalous cyclone appeared in the western North Pacific. The anomalous southwesterly winds in the northern part of the anticyclone converged with the anomalous northwesterly winds in the southern part of the cyclone over the YRB, generating active convection. In phases 2–3 (Figure 6b,c), the anomalous anticyclone remained in the South China Sea and strengthened, and its southwesterlies enhanced. The convection also enhanced, affecting the entire YRB. In phase 4 (Figure 6d), the anomalous anticyclone covering the SCS and WNP enhanced, and the Yangtze precipitation was highly influenced by the southwesterlies in the northwestern part of the anticyclone. In phase 5 (Figure 6e), convection in the YRB was suppressed, accompanied by an anomalous cyclone in the SCS and an anomalous anticyclone in the WNP. In phases 6–8 (Figure 6f–h), an anomalous anticyclone stagnated in the YRB and gradually strengthened. The corresponding suppressed convection in the YRB also gradually strengthened.
Vertical motion plays an important role in the evolution of precipitation anomalies in the YRB. The vertical motion represented by meridional wind and omega and the divergence anomalies averaged between 110° E and 122° E in 1998 are shown in Figure 7. During the wet episode (phases 1–4), a descending branch occurred near 15° N and an ascending branch occurred in the YRB, forming a meridional–vertical cell (Figure 7a–d). Significant lower-level convergence and upper-level divergence anomalies (Figure 7a–d) facilitated the transport of water vapor into the YRB, resulting in positive precipitation anomalies (Figure 5a–d). During the dry episode (phases 5–8), ascending airflows emerged near 15° N and descending airflows emerged in the YRB (Figure 7e–h). The lower-level divergence and upper-level convergence anomalies in the YRB (Figure 7e–h) were linked to negative precipitation anomalies in the YRB (Figure 5e–h).

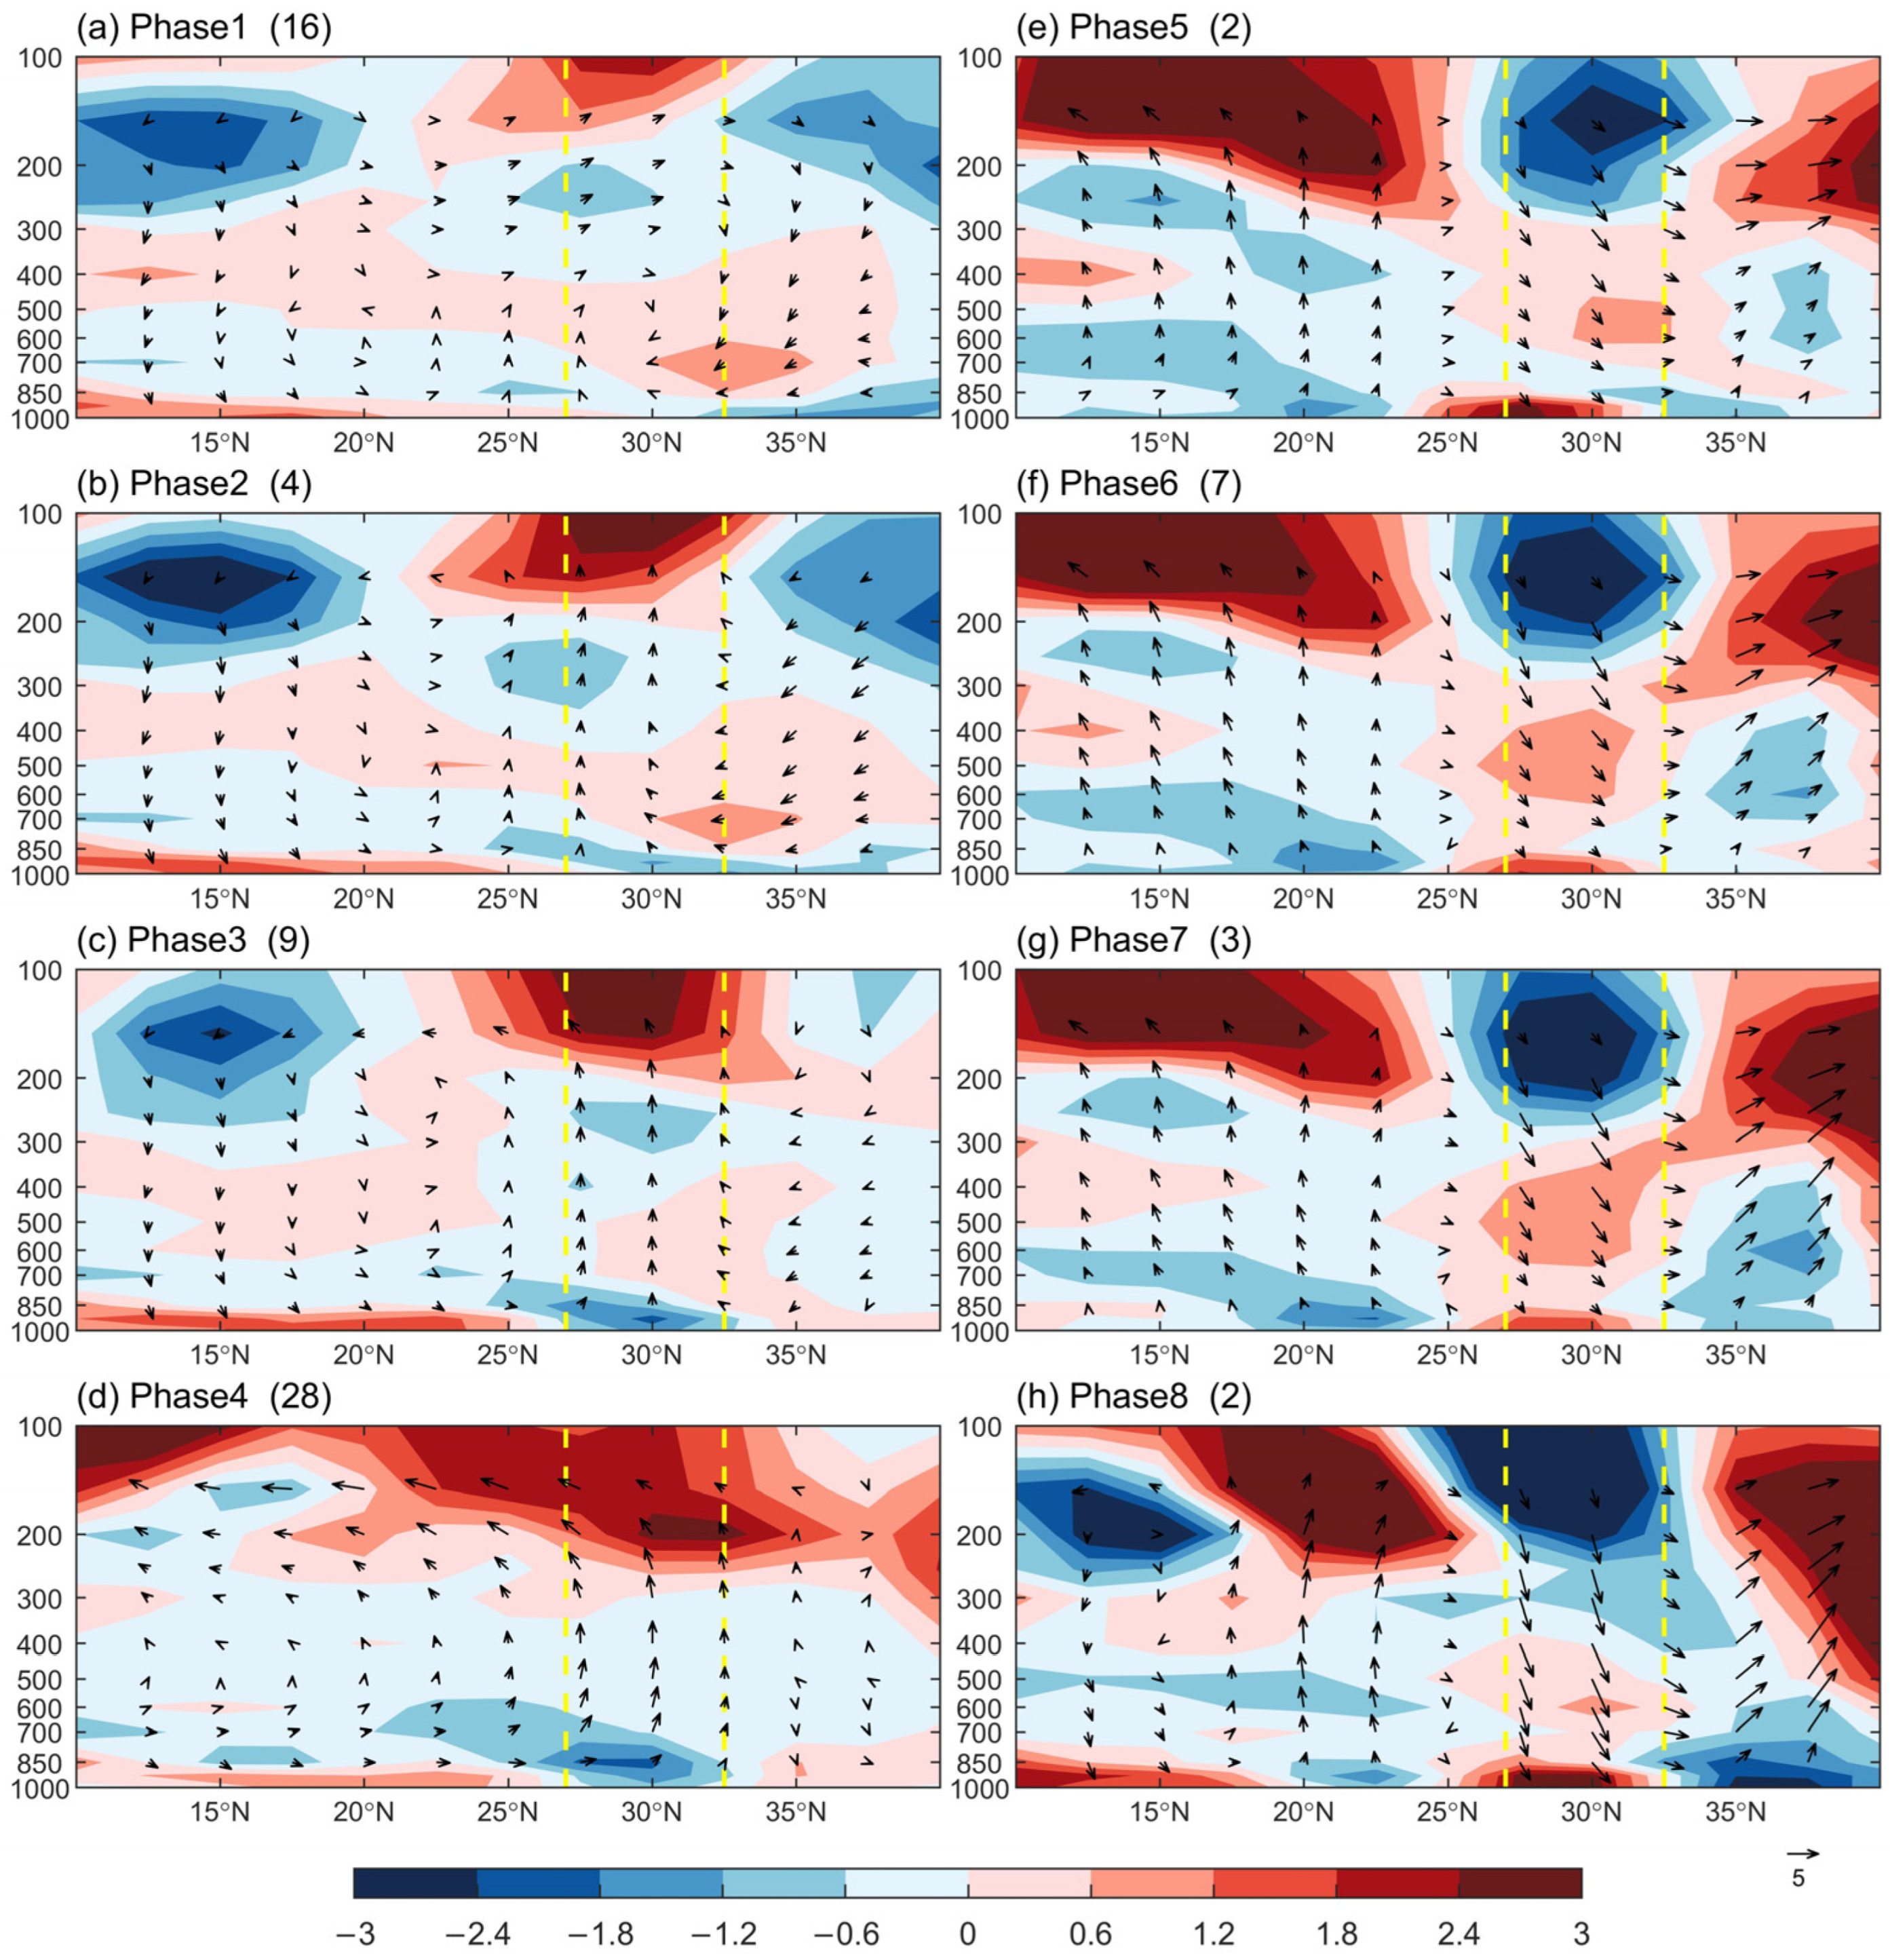
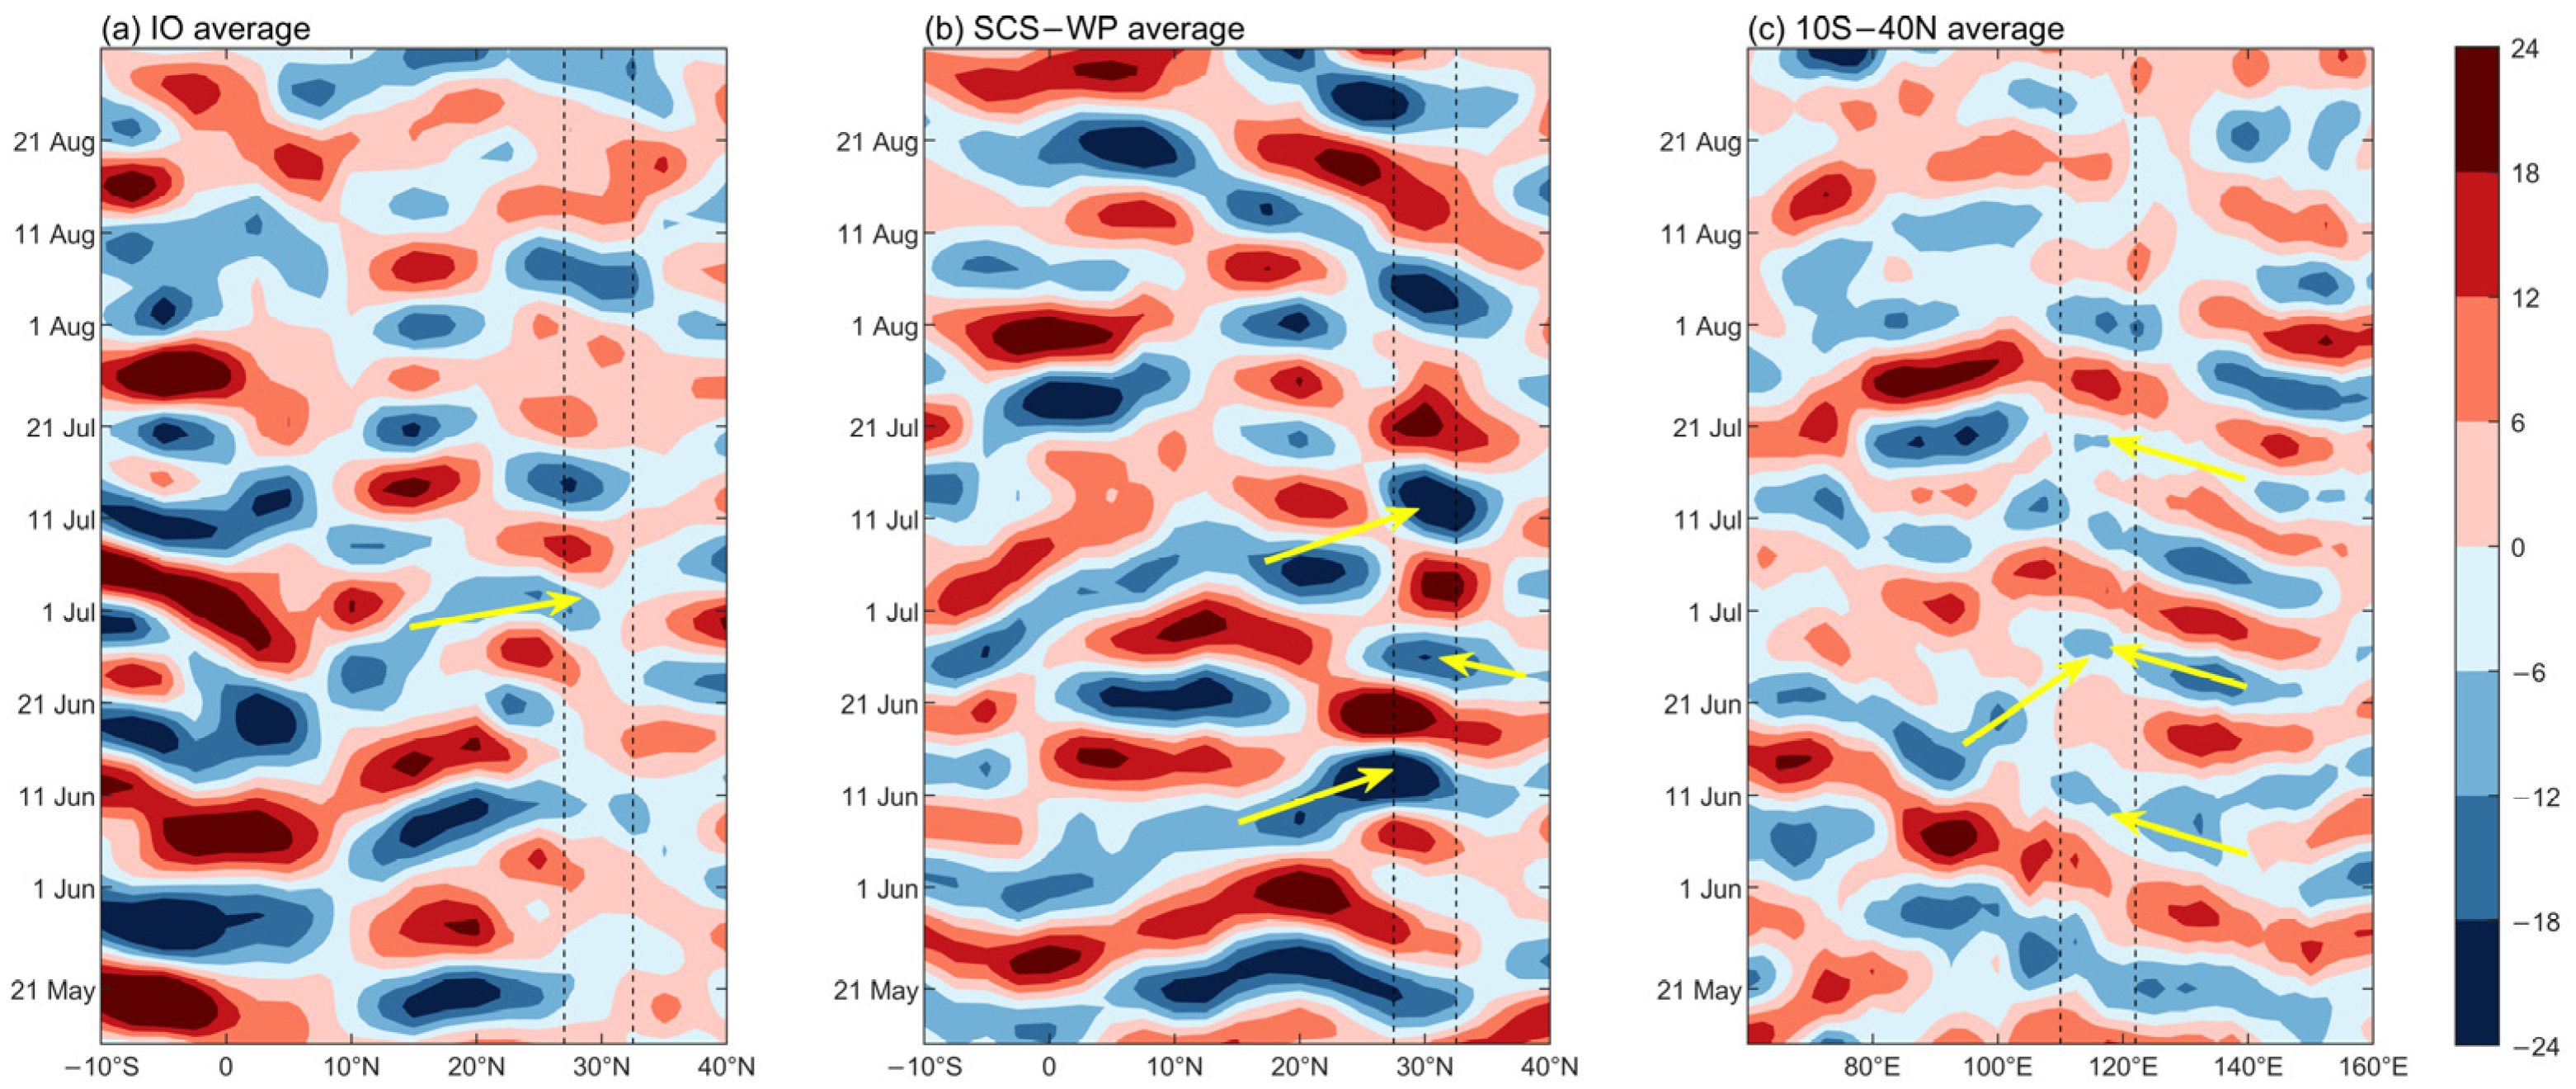
3.2.3. Source of Active Convection

The deep convection may propagate poleward from the tropical Indian Ocean (IO) and the South China Sea–western Pacific (SCS–WP) where the ISO variations can be pronounced [22,50,65,66]. In order to identify whether the deep convection associated with BSISO1 originates from the IO or the SCS–WP region, the area-averaged 30–60-day filtered OLR anomalies in the latitude-time profiles for these two regions are shown in Figure 8a,b. Meanwhile, in order to observe the propagating process of deep convection in the east–west direction during its northward propagation, the longitude-time profile of 30–60-day filtered OLR anomalies is shown in Figure 8c.
In event 1 of 1998, the YRB deep convection had different origins in the early and late stages of the wet episode. The deep convection over the YRB of the early stage originated in the SCS–WP, propagating northward from the SCS and northwestward from the WP (Figure 8b,c). The YRB deep convection of the late stage originated in the tropical IO, propagating northeastward from the IO (Figure 8a,c).
In event 2 of 1998, the YRB deep convection originated from the SCS–WP (Figure 8b,c). Additionally, the active convection propagated northward from the SCS and northwestward from the WP.

3.3. The Evolution of BSISO2 and Its Impact on Yangtze Rainfall in 2016

3.3.1. BSISO2 Phase Evolution

Unlike in 1998, the summer precipitation over the YRB in 2016 was dominated by the 10–30-day oscillation. To investigate the evolution of the 10–30-day oscillation, the BSISO2 index (PC3 and PC4) was used to display the phase-space of the three rainfall events in 2016 (Figure 9). The position of each point denotes the geographical location where active convection occurred.
For event 1 in 2016 (blue in Figure 9), the deep convection was generated in the Indian Ocean–Philippine Sea (phase 2) and then moved to the Bay of Bengal (phases 4–5). This deep convection rapidly strengthened and stayed in the Bay of Bengal for about 9 days, which promoted the positive precipitation in the southern part of the YRB (Figure 10d,e). These positive precipitations were accompanied by the active convection occurring in eastern China in phases 4–5 (Figure 11d,e). Subsequently, the deep convection propagated to the Indian Ocean and the Philippine Sea (phase 2) and stagnated for about 4 days. At the same time, the active convection also occurred in eastern China in phase 2 (Figure 11b), which was favorable for the positive precipitation in the YRB (Figure 10b).
For event 2 in 2016 (red in Figure 9), the deep convection arose from the Indian Ocean–Philippine Sea (phase 2) and gradually migrated to Northeast Asia (phase 7) and the western North Pacific (phase 8), where it remained for about a week and rapidly intensified. At the same time, there was strong deep convection over eastern China in phases 7–8 (Figure 11g,h), which facilitated the positive precipitation anomalies (Figure 10g,h).
The BSISO2 phase evolution trajectory of event 3 in 2016 (green in Figure 9) was similar to that of the 2016 event 1 (blue in Figure 9), except that the intensity of the deep convection was weaker in event 3 (i.e., the smaller amplitude of the BSISO2 index). Correspondingly, the amount of precipitation in event 3 was lower than that in event 1 (Figure 3a).

3.3.2. Impact of BSISO2 on Yangtze Rainfall in Eight Phases

Figure 10 presents the composites of the spatial distribution of precipitation anomalies in the YRB during the three events from 3 June to 20 July for eight phases in 2016. In phase 1–2, positive precipitation anomalies occurred in the YRB (Figure 10a,b), which are consistent with the active convection (Figure 11a,b). In phases 3–6, positive precipitation anomalies occurred that covered the southern part of the YRB and negative precipitation anomalies occurred that covered the northern part of the YRB (Figure 10c–f). The regions with negative (or positive) precipitation anomalies were consistent with the regions where suppressed (or weak active) convection occurred (Figure 11c–f). In phases 7–8, extreme positive precipitation anomalies occurred in the YRB (Figure 10g,h), which are consistent with the strong active convection (Figure 11g,h).
To further demonstrate how BSISO2 impacts rainfall in the YRB, Figure 11 shows the evolution of composite OLR and 850 hPa wind anomalies in 2016. In phase 1, an anomalous cyclone appeared in the tropical Indian Ocean and a strong anomalous anticyclone appeared in the western North Pacific (WNP). Southwesterlies in the northern part of the WNP anticyclone covered eastern China, which is linked with active convection in the YRB (Figure 11a). The circulation pattern in phase 2 was consistent with that in phase 1, except that the anomalous anticyclone and active convection were relatively weaker (Figure 11b). In phase 3 (Figure 11c), the anomalous WNP anticyclone decayed, and weak active convection occurred in the northern SCS and WNP. In phases 4–5 (Figure 11d,e), the anomalous WNP anticyclone shifted eastward and an anomalous cyclone emerged in eastern China. Accompanied by this cyclone, weak active convection emerged in the southern part of the YRB. Additionally, deep convection also occurred in the Bay of Bengal in phases 4–5. In phase 6 (Figure 11f), the anomalous cyclone in eastern China further strengthened. In phases 7–8 (Figure 11g,h), the anomalous WNP anticyclone strengthened and an anomalous cyclone appeared in northern China. The anomalous southwesterly winds in the western part of the anticyclone converged with the anomalous northeasterly winds in the eastern part of the cyclone over the YRB, generating a strong shear line and deep convection. In addition, deep convection also occurred in the equatorial western Pacific.
Figure 12 illustrates the vertical motion and divergence anomalies averaged between 110° E and 122° E in 2016. In phase 1 (Figure 12a), there was an ascending branch over the YRB, with anomalous convergence at lower levels and anomalous divergence at upper levels. The vertical circulation pattern in phase 2 (Figure 12b) was consistent with that in phase 1, except that the upward motion weakened in phase 2. In phases 3–6 (Figure 12c–f), the ascending motion occurred approximately between 20° N and 40° N over southern China, the YRB, and northern China in the lower troposphere. The upward motion is relatively stronger over southern China and northern China and weaker over the YRB. The lower-level convergence over the YRB is shallower than that over southern China and northern China. The weaker lower-level convergence over the YRB was linked to the weaker precipitation anomalies. In phases 7–8, significant lower-level convergence and upper-level divergence anomalies favored a strong ascending motion over the YRB (Figure 12g–h), leading to extreme rainfall anomalies in this region (Figure 10g–h).

3.3.3. Source of Active Convection

To identify whether the active convection associated with BSISO2 originates from the IO or from the SCS–WP region, the area-averaged 10–30-day filtered OLR anomalies in the latitude-time profiles for these two regions are shown in Figure 13a,b. Meanwhile, in order to observe the propagating process of active convection in the east–west direction during its northward propagation, the longitude-time profile of 10–30-day filtered OLR anomalies is shown in Figure 13c.
In event 1 of 2016, the active convection originated in the SCS–WP (Figure 13b,c). Additionally, the active convection propagated northward from the SCS and northwestward from the WP.
In event 2 of 2016, the active convection partly originated in the tropical IO, propagating northeastward from the IO (Figure 13a,c). In conjunction with the tropical ISO from the IO, the active convection also originated in the extratropical western Pacific, propagating southwestward (Figure 13b,c).
Like event 1, the active convection of event 3 of 2016 also originated in the SCS–WP (Figure 13b,c), except that the strength of active convection in event 3 was relatively weaker than in event 1. In addition, the deep convection propagated northward from the SCS and northwestward from the WP (Figure 13b,c).

3.4. SST and Atmospheric Circulation

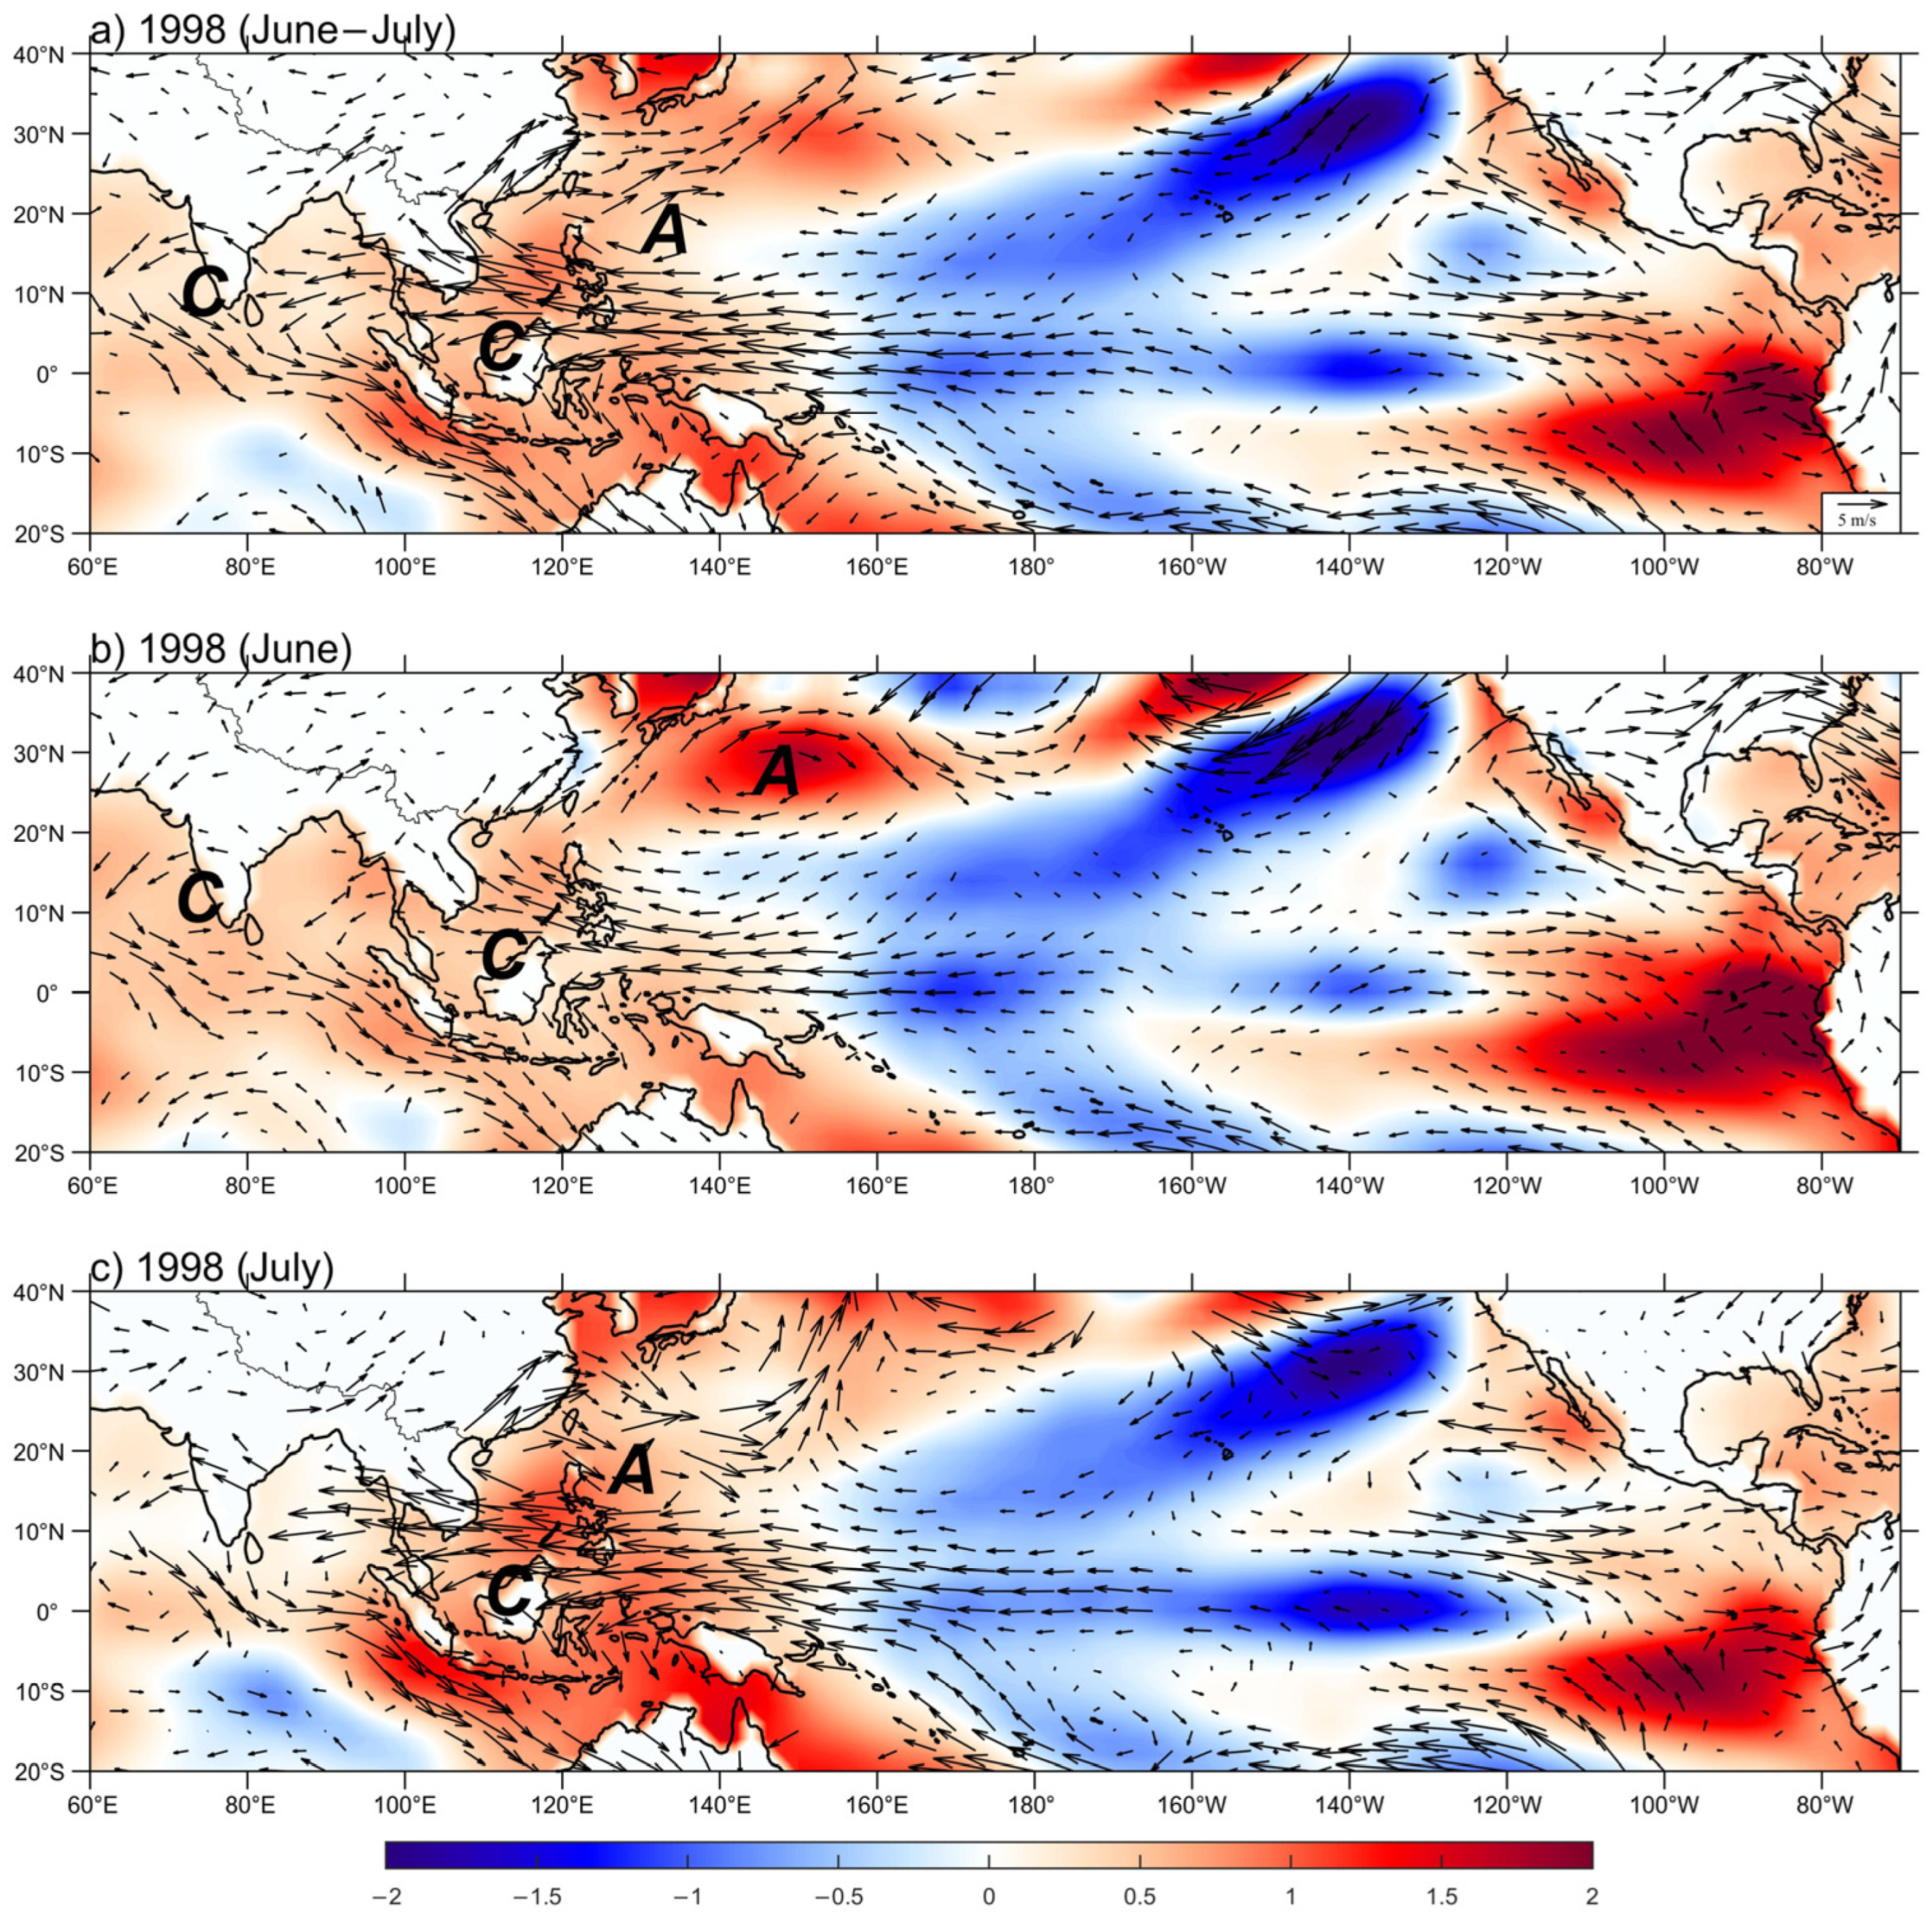
3.4.1. June–July of 1998

Possible explanations for the far-reaching 30–60-day oscillation and enhanced rainfall in 1998 are as follows: 1998 is not only the decaying year of a strong El Niño, but also the developing year of a strong La Niña. In June–July of 1998 (Figure 14a), strong cold SST anomalies emerged in the equatorial central Pacific. These strong cold SST anomalies in the equatorial central Pacific and the warm SST anomalies in the equatorial western Pacific–eastern Indian Ocean led to a strong east–west gradient of SST, strengthening the low-level easterly anomalies in the Indo-Pacific region. Accompanied by strong easterly wind anomalies in the SCS and western Pacific, a strong shear line extended from the western Pacific to the Indian Ocean. Lower-level cyclonic circulation emerged in the Maritime Continent and the northern Indian Ocean. The enhanced convection over the eastern equatorial Indian Ocean and the western Maritime Continent [67] contributed to the development of the 30–60-day oscillation.
In June 1998 (Figure 14b), strong easterlies occurred in the equatorial western Pacific and anticyclonic circulation occurred in the western North Pacific. The YRB deep convection in the early stage of the wet episode of event 1 (11–18 June) was related to the impact of the Maritime Continent’s cyclonic circulation. The relevant active convection propagated northward to reach the YRB in the early stage of the wet episode. The YRB deep convection in the late stage of the wet episode of event 1 (19–28 June) was related to the impact of the northern Indian Ocean cyclonic circulation. The relevant active convection propagated northeastward to reach the YRB in the late stage of the wet episode. The active convection from the two source regions successively affected the YRB, resulting in a heavy rainfall event.
In July 1998 (Figure 14c), the east–west gradient of SST further intensified, and strong easterlies became stronger and covered a wider region. Accordingly, intense cyclonic anomalies emerged in the northern Indian Ocean–SCS–western Pacific, with the maximum located at the SCS. At the same time as the cyclonic circulation at 180° strengthened and moved westward, the anticyclonic circulation in the western North Pacific weakened and shrank. For event 2 of 1998, the cyclonic circulation in the SCS and western Pacific triggered active convection, and the weakened anticyclonic anomaly failed to suppress the northward and northwestward propagation of the active convection. Compared to June of 1998, due to the further enhancement of cyclonic shear near Borneo Island in July, the 30–60-day oscillation propagated further than in June.

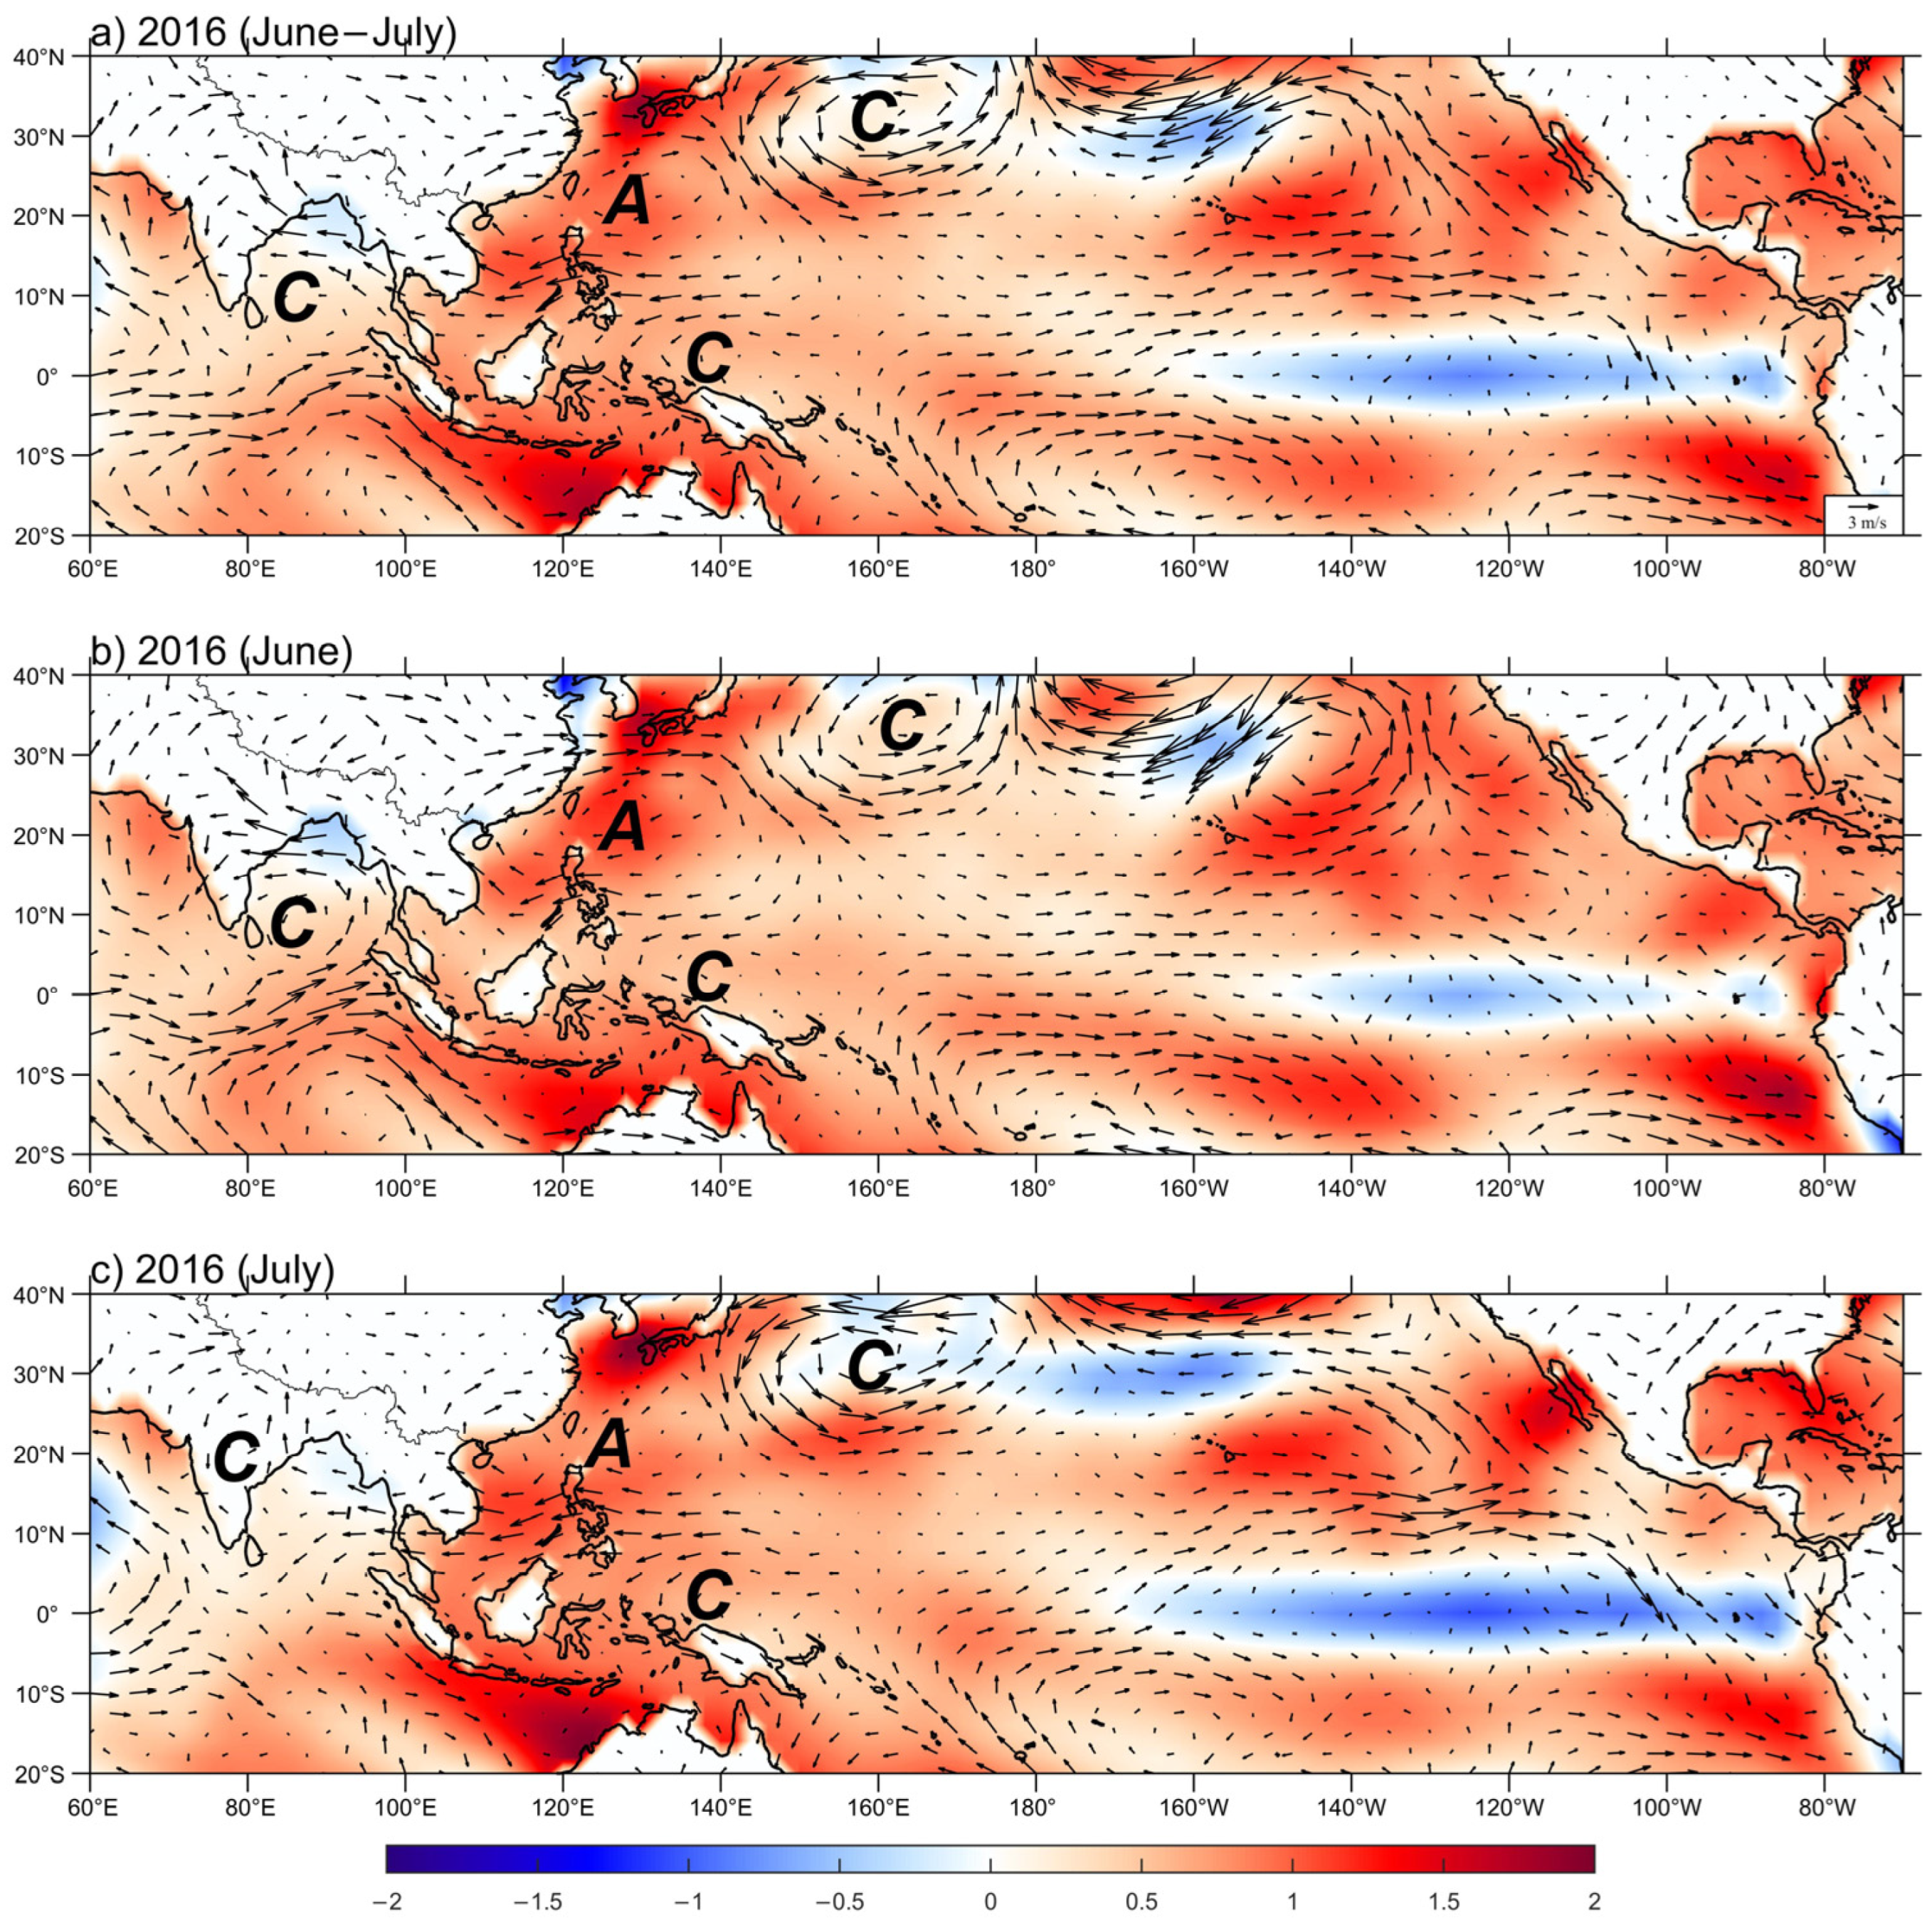
3.4.2. June–July of 2016

The causes for the enhanced ISO rainfall in 2016 are different from that in 1998. As discussed above, the enhanced ISO rainfall can contribute to 10–30-day oscillation. In June–July of 2016 (Figure 15a), there were no SST cold anomalies occurring in the equatorial central Pacific and no strong easterly wind anomalies in the western Pacific. Also, the anticyclone was weaker than it was in 1998. There was no strong cyclonic shear in the SCS and western North Pacific, which was unfavorable for the 30–60-day oscillation. This is consistent with the usual El Niño decaying summers. Meanwhile, the anomalous cyclonic circulation north of New Guinea Island and in the Bay of Bengal both served as two origins of active convection, promoting the development of 10–30-day oscillation. Besides these two origins of active convection in the tropics, the anomalous cyclonic circulation in the east of Japan induced southwestward propagation of ISO from mid-high latitude, which contributed to event 2 of 2016.
In June 2016 (Figure 15b), anomalous cyclonic circulations were observed north of New Guinea Island and in the Bay of Bengal, respectively. In addition, an anomalous anticyclonic circulation was observed over the western North Pacific. During event 1 of 2016, the cyclonic circulation north of New Guinea Island triggered active convection, propagating northwestward to the YRB. During event 2 of 2016, the cyclonic circulation in the tropical Indian Ocean triggered active convection, which propagated northeastward and contributed to the YRB precipitation. At the same time, the anomalous cyclonic circulation east of Japan facilitated the extratropical ISO and this mid-high latitude ISO propagated southwestward to YRB, contributing to the heavy precipitation in event 2 of 2016. For the two origins of active convection for event 2 in 2016, the heavy rainfall in event 2 is the strongest among the three events in 2016.
In July 2016 (Figure 15c), the anomalous cyclone in the Bay of Bengal moved to the southern Asian continent and weakened. The anomalous cyclonic circulation north of New Guinea Island was maintained. During event 3 of 2016, the active convection related to the cyclonic circulation north of New Guinea Island propagated northwestward, promoting positive precipitation anomalies in the YRB.

4. Conclusions and Discussion

The summer rainfall in the Yangtze River basin is significantly influenced by the boreal summer intraseasonal oscillation (BSISO). In the past three decades, two record-breaking El Niño events occurred in 1997/1998 and 2015/2016, and the YRB witnessed extreme precipitation influenced by BSISOs. Based on multiple reanalysis data and BSISO indices, this study examined the periods of BSISOs and identified multiple rainfall events. We investigated the BSISO evolution related to YRB extreme precipitation and the source region of BSISOs, revealing the different causes for different dominating BSISO modes in 1998 and 2016.
BSISO activity that regulated the Yangtze rainfall in 1998 and 2016 displays different periods. In June–July 1998, the Yangtze precipitation was dominated by the 30–60-day oscillation (i.e., BSISO1), while in June–July 2016, the Yangtze precipitation was dominated by the 10–30-day oscillation (i.e., BSISO2), which is in conjunction with extratropical ISO.
Multiple BSISO events were identified and selected since there is more than one extreme rainfall process in summer. Two heavy rainfall events occurred in June–July 1998, while three rainfall events occurred in June–July 2016, with the first two events being heavy rainfall events. Here, a complete rainfall event over the YRB includes the evolution from a dry episode to a wet episode.
Because the dry episode alternates with the wet episode, we analyzed the dry and wet phases in extreme rainfall events. In 1998, when BSISO1 was in phases 5–8, the YRB experienced suppressed convection and negative precipitation anomalies, corresponding to the dry episode. In 1998, when BSISO1 was in phases 1–4, the YRB experienced strong active convection and positive precipitation anomalies, corresponding to the wet episode. In 2016, when BSISO2 was in phases 3–6, the YRB experienced suppressed or weak active convection, negative precipitation anomalies, or weak positive precipitation anomalies, corresponding to the dry episode. In 2016, when BSISO2 was in phases 1–2 and phases 7–8, the YRB experienced strong active convection and significant positive precipitation anomalies, corresponding to the wet episode.
A close inspection identifies the propagation and origin of active convection in each rainfall event. In event 1 of 1998, the YRB deep convection had different origins in the early and late stages of the wet episode. Deep convection of the early stage originated in the South China Sea–western Pacific (SCS–WP), propagating northward from the SCS and northwestward from the WP. Deep convection of the late stage originated in the tropical Indian Ocean (IO), propagating northeastward from the IO. In event 2 of 1998, the YRB deep convection originated in the SCS–WP and the active convection propagated northward from the SCS and northwestward from the WP. In event 1 and event 3 of 2016, the YRB deep convection originated from SCS–WP and the active convection propagated northward from the SCS and northwestward from the WP. In event 2 of 2016, the YRB deep convection partly originated from tropical IO, propagating northeastward from the IO. At the same time, the active convection also originated in the extratropical western Pacific, propagating southwestward. The strength of active convection in event 2 was stronger than the other two events, which led to stronger precipitation.
Due to the differences in SST and atmospheric circulation, the modes of BSISO dominance in the YRB are different. Possible explanations for the far-reaching BSISOs in 1998 and 2016 are as follows: 1998 is the decaying year of a strong El Niño and it is also the developing year of a strong La Niña. During the summer of 1998, strong easterly wind anomalies occurred in the tropical western Pacific and the South China Sea, which were conducive to the enhancement of the 30–60-day oscillation and its propagation to the YRB. During the summer of 2016, there were no strong easterly wind anomalies in the tropical western Pacific and the South China Sea, which were unfavorable for the enhancement and propagation of 30–60-day oscillation. Accompanying the suppressed 30–60-day oscillation in 2016, 10–30-day oscillation was enhanced. In event 1 and event 3 of 2016, besides the active convection propagating northward from the SCS, the cyclonic shear near New Guinea Island facilitated the enhancement of 10–30-day oscillation and its northwestward propagation to the YRB. In event 2 of 2016, there was a combined impact of 10–30-day oscillation from the tropical Indian Ocean and extratropical western Pacific, leading to extreme rainfall in YRB. For convenient viewing, a table has been provided to summarize the BSISO features and mechanisms in 1998 and 2016 (see Table 1).
Some studies focus on the YRB’s extreme rainfall in 1998 [25,41] or 2016 [57,68]. Zhu et al. [25] suggested that the heavy rainfalls in eastern China during the summer of 1998 were related to the 30–60-day oscillation over the western North Pacific. Sun et al. [41] emphasized the effects of wave trains emanating from the northern Indian Ocean during the late June of 1998. It seems that source regions of intraseasonal oscillations related to the YRB extreme precipitation in 1998 are inconsistent and controversial [25,41]. Through identifying multiple rainfall events, we found that the 30–60-day oscillation associated with the YRB’s extreme precipitation in 1998 could have originated from the Indian Ocean, as well as from the South China Sea and the western Pacific region. Shao et al. [57] emphasized the role of MJO in causing the extreme rainfall in China in 2016, especially the northeastward-propagating Rossby wave train associated with the strengthened convection over the tropical Indian Ocean. Zhang et al. [68] studied the quasi-biweekly oscillations of the YRB’s summer rainfall in 2016 from the perspective of potential vorticity anomalies around the eastern Tibetan Plateau. This study revealed the impact of poleward propagating tropical 10–30-day ISO on the extreme rainfall in the YRB in 2016. It is shown that extratropical ISOs from the extratropical western Pacific may also have contributed to the YRB’s extreme rainfall in 2016, such as in 2016 event 2.
Previous studies have investigated and compared causes for the extreme rainfall events occurring in the YRB in 1998 and 2016 [58,69]. Yuan et al. [69] suggested that the circulation systems were more similar in May–July than in August in 1998 and 2016. The overall precipitation in the YRB in May–July both increased in 1998 and 2016, which could be attributed to a more westward-extending western Pacific subtropical high and a weaker-than-normal East Asian summer monsoon. Shen et al. [58] suggested that the rainfall exhibited dramatic diversity in August 1998 and 2016, and rainfall anomalies were manifested as a dipole anomaly pattern over eastern China. They also revealed that the positive and negative SIA anomaly over the BKS in 1998 and 2016 may contribute to the reverse August precipitation anomaly in eastern China. In this study, we focused on the June–July extreme rainfall and the different impacts of BSISO on multiple extreme rainfall events in the YRB in 1998 and 2016. We carefully examined the BSISO propagating processes, the source regions, and possible explanations for different BSISO dominance in the YRB. It is interesting to study the extreme rainfall and the causes from different perspectives.
Intraseasonal oscillations (ISOs) have an impact on near-global precipitation [17,70]. ISOs can significantly affect the Australian summer monsoon [71,72,73,74], as well as intraseasonal precipitation in South America [75] and Africa [76]. Strong convective activity centers emerge in the Indian Ocean [77], and the ISO influences the Indian summer monsoon [78]. Meanwhile, the ISO in summer has a significant influence on both the North American summer monsoon [79,80] and the East Asian summer monsoon [1,3,4,5]. Our research further enriches the understanding of the impact of BSISO on East Asian summer monsoon precipitation, especially on the related extreme precipitation.
In recent decades, ENSO diversity has increased. This study contributes to a better understanding of the regulations of ENSO diversity on the interannual variability of BSISO activity. This also provides new insights into the impacts of ENSO on BSISO-related extreme precipitation and the prediction of BSISO. Besides the Yangtze River basin, the summer rainfall in southern China is also significantly influenced by the BSISO [30,38,81,82]. It will be interesting to further explore the impacts of BSISO on summer precipitation in southern China.

Author Contributions

Conceptualization, L.Y. and M.T.; methodology, L.Y. and M.T.; software, M.T. and L.Y.; formal analysis, M.T., L.Y., S.Z., J.X. and Y.C.; data curation, S.Z. and Y.C.; writing—original draft preparation, M.T. and L.Y.; writing—review and editing, L.Y. and J.X.; visualization, M.T.; funding acquisition, L.Y., J.X. and S.Z. All authors have read and agreed to the published version of the manuscript.

Funding

This study was jointly supported by the Shenzhen Science and Technology Program (JCYJ20210324131810029), the National Key R&D Program of China (Grant 2018YFC1505902), the National Natural Science Foundation of China (72293604 and 42130605), the Strategic Priority Research Program of Chinese Academy of Sciences (XDA20060503), and a program for scientific research start-up funds of Guangdong Ocean University (R19061 & R18023).

Institutional Review Board Statement

Not applicable.

Informed Consent Statement

Not applicable.

Data Availability Statement

The daily and monthly three-dimensional wind datasets were provided by the National Center for Environmental Prediction/the National Center for Atmospheric Research (NCEP/NCAR) Reanalysis 1 and can be found at https://psl.noaa.gov/data/gridded/data.ncep.reanalysis.html, accessed on 19 October 2022. The daily outgoing longwave radiation (OLR) data were obtained from the National Oceanic and Atmospheric Administration (NOAA) and can be found at https://www.psl.noaa.gov/data/gridded/data.olrcdr.interp.html, accessed on 19 October 2022. Daily precipitation data were provided by the NOAA Climate Prediction Center (CPC) and can be found at https://www.psl.noaa.gov/data/gridded/data.cpc.globalprecip.html, accessed on 19 October 2022. The BSISO1 and BSISO2 indices were downloaded from https://apcc21.org/ser/moni.do?lang=en, accessed on 19 October 2022. The monthly Extended Reconstructed Sea Surface Temperature version 5 (ERSST v5) dataset can be found at https://psl.noaa.gov/data/gridded/data.noaa.ersst.v5.html, accessed on 19 October 2022. The datasets used in this study are publicly available online.

Acknowledgments

The authors would like to thank the editor and the anonymous reviewers for their insightful comments and suggestions.

Conflicts of Interest

The authors declare no conflict of interest.

References

  1. Tao, S.-Y. A review of recent research on the East Asian summer monsoon in China. In Monsoon Meteorology; Oxford University Press: New York, NY, USA, 1987; pp. 60–92. [Google Scholar]
  2. Zhang, R. Relations of water vapor transport from Indian monsoon with that over East Asia and the summer rainfall in China. Adv. Atmos. Sci. 2001, 18, 1005–1017. [Google Scholar]
  3. Ninomiya, K.; Shibagaki, Y. Multi-Scale Features of the Meiyu-Baiu Front and Associated Precipitation Systems. J. Meteorolog. Soc. Jpn. Ser. II 2007, 85B, 103–122. [Google Scholar] [CrossRef]
  4. Ding, Y.; Wang, Z. A study of rainy seasons in China. Meteorol. Atmos. Phys. 2008, 100, 121–138. [Google Scholar]
  5. Hu, H.; Deng, Y.; Fang, J.; Wang, R. Mechanism of Regional Subseasonal Precipitation in the Strongest and Weakest East Asian Summer Monsoon Subseasonal Variation Years. J. Ocean Univ. China 2022, 21, 1411–1427. [Google Scholar] [CrossRef]
  6. Chan, J.C.L.; Wi, W.X.; Xu, J.J. Mechanisms responsible for the maintenance of the 1998 South China Sea Summer Monsoon. J. Meteorolog. Soc. Jpn. 2002, 80, 1103–1113. [Google Scholar] [CrossRef]
  7. Zhang, L.; Wang, B.; Zeng, Q. Impact of the Madden–Julian oscillation on summer rainfall in southeast China. J. Clim. 2009, 22, 201–216. [Google Scholar] [CrossRef]
  8. Li, J.; Mao, J.; Wu, G. A case study of the impact of boreal summer intraseasonal oscillations on Yangtze rainfall. Clim. Dyn. 2015, 44, 2683–2702. [Google Scholar] [CrossRef]
  9. Wang, B.; Rui, H. Synoptic climatology of transient tropical intraseasonal convection anomalies: 1975–1985. Meteorol. Atmos. Phys. 1990, 44, 43–61. [Google Scholar] [CrossRef]
  10. Salby, M.L.; Hendon, H.H. Intraseasonal behavior of clouds, temperature, and motion in the tropics. J. Atmos. Sci. 1994, 51, 2207–2224. [Google Scholar] [CrossRef]
  11. Wang, T.; Yang, X.-Q.; Fang, J.; Sun, X.; Ren, X. Role of air–sea interaction in the 30–60-day boreal summer intraseasonal oscillation over the western North Pacific. J. Clim. 2018, 31, 1653–1680. [Google Scholar] [CrossRef]
  12. Madden, R.A.; Julian, P.R. Detection of a 40–50 day oscillation in the zonal wind in the tropical Pacific. J. Atmos. Sci. 1971, 28, 702–708. [Google Scholar] [CrossRef]
  13. Madden, R.A.; Julian, P.R. Description of global-scale circulation cells in the tropics with a 40–50 day period. J. Atmos. Sci. 1972, 29, 1109–1123. [Google Scholar] [CrossRef]
  14. Waliser, D.; Lau, K.; Stern, W.; Jones, C. Potential predictability of the Madden–Julian oscillation. Bull. Am. Meteorol. Soc. 2003, 84, 33–50. [Google Scholar] [CrossRef]
  15. Wheeler, M.C.; Hendon, H.H. An all-season real-time multivariate MJO index: Development of an index for monitoring and prediction. Mon. Weather Rev. 2004, 132, 1917–1932. [Google Scholar] [CrossRef]
  16. Zhang, C. Madden-Julian oscillation. Rev. Geophys. 2005, 43. [Google Scholar] [CrossRef]
  17. Zhang, C. Madden–Julian oscillation: Bridging weather and climate. Bull. Am. Meteorol. Soc. 2013, 94, 1849–1870. [Google Scholar] [CrossRef]
  18. Chen, X.; Ling, J.; Li, C. Evolution of the Madden–Julian oscillation in two types of El Niño. J. Clim. 2016, 29, 1919–1934. [Google Scholar] [CrossRef]
  19. Yasunari, T. Cloudiness fluctuations associated with the Northern Hemisphere summer monsoon. J. Meteorolog. Soc. Jpn. Ser. II 1979, 57, 227–242. [Google Scholar] [CrossRef]
  20. Sikka, D.; Gadgil, S. On the maximum cloud zone and the ITCZ over Indian longitudes during the southwest monsoon. Mon. Weather Rev. 1980, 108, 1840–1853. [Google Scholar] [CrossRef]
  21. Krishnamurti, T.N.; Subrahmanyam, D. The 30–50 day mode at 850 mb during MONEX. J. Atmos. Sci. 1982, 39, 2088–2095. [Google Scholar] [CrossRef]
  22. Lau, K.-M.; Chan, P. Aspects of the 40–50 day oscillation during the northern summer as inferred from outgoing longwave radiation. Mon. Weather Rev. 1986, 114, 1354–1367. [Google Scholar] [CrossRef]
  23. Wang, B.; Webster, P.J.; Teng, H. Antecedents and self-induction of active-break south Asian monsoon unraveled by satellites. Geophys. Res. Lett. 2005, 32. [Google Scholar] [CrossRef]
  24. Chen, G.; Wang, B. Diversity of the boreal summer intraseasonal oscillation. J. Geophys. Res. Atmos. 2021, 126, e2020JD034137. [Google Scholar] [CrossRef]
  25. Zhu, C.; Nakazawa, T.; Li, J.; Chen, L. The 30–60 day intraseasonal oscillation over the western North Pacific Ocean and its impacts on summer flooding in China during 1998. Geophys. Res. Lett. 2003, 30. [Google Scholar] [CrossRef]
  26. Murakami, M. Analysis of the deep convective activity over the Western Pacific and Southeast Asia part II: Seasonal and intraseasonal variations during Northern Summer. J. Meteorolog. Soc. Jpn. Ser. II 1984, 62, 88–108. [Google Scholar] [CrossRef]
  27. Chen, T.-C.; Chen, J.-M. The 10–20-day mode of the 1979 Indian monsoon: Its relation with the time variation of monsoon rainfall. Mon. Weather Rev. 1993, 121, 2465–2482. [Google Scholar] [CrossRef]
  28. Wang, B.; Xie, X. A model for the boreal summer intraseasonal oscillation. J. Atmos. Sci. 1997, 54, 72–86. [Google Scholar] [CrossRef]
  29. Hsu, H.-H.; Weng, C.-H. Northwestward propagation of the intraseasonal oscillation in the western North Pacific during the boreal summer: Structure and mechanism. J. Clim. 2001, 14, 3834–3850. [Google Scholar] [CrossRef]
  30. Kajikawa, Y.; Yasunari, T. Interannual variability of the 10–25-and 30–60-day variation over the South China Sea during boreal summer. Geophys. Res. Lett. 2005, 32. [Google Scholar] [CrossRef]
  31. Lee, J.-Y.; Wang, B.; Wheeler, M.C.; Fu, X.; Waliser, D.E.; Kang, I.-S. Real-time multivariate indices for the boreal summer intraseasonal oscillation over the Asian summer monsoon region. Clim. Dyn. 2013, 40, 493–509. [Google Scholar] [CrossRef]
  32. Jones, C. Occurrence of extreme precipitation events in California and relationships with the Madden–Julian oscillation. J. Clim. 2000, 13, 3576–3587. [Google Scholar] [CrossRef]
  33. Lawrence, D.M.; Webster, P.J. The boreal summer intraseasonal oscillation: Relationship between northward and eastward movement of convection. J. Atmos. Sci. 2002, 59, 1593–1606. [Google Scholar] [CrossRef]
  34. Jones, C.; Carvalho, L.M.; Wayne Higgins, R.; Waliser, D.E.; Schemm, J.E. Climatology of tropical intraseasonal convective anomalies: 1979–2002. J. Clim. 2004, 17, 523–539. [Google Scholar] [CrossRef]
  35. Lau, K.; Yang, G.; Shen, S. Seasonal and intraseasonal climatology of summer monsoon rainfall over East Asia. Mon. Weather Rev. 1988, 116, 18–37. [Google Scholar] [CrossRef]
  36. Annamalai, H.; Slingo, J. Active/break cycles: Diagnosis of the intraseasonal variability of the Asian summer monsoon. Clim. Dyn. 2001, 18, 85–102. [Google Scholar] [CrossRef]
  37. Zhou, W.; Chan, J.C. Intraseasonal oscillations and the South China Sea summer monsoon onset. Int. J. Climatol. 2005, 25, 1585–1609. [Google Scholar] [CrossRef]
  38. Chen, J.; Wen, Z.; Wu, R.; Chen, Z.; Zhao, P. Influences of northward propagating 25–90-day and quasi-biweekly oscillations on eastern China summer rainfall. Clim. Dyn. 2015, 45, 105–124. [Google Scholar] [CrossRef]
  39. Liu, B.; Yan, Y.; Zhu, C.; Ma, S.; Li, J. Record-breaking Meiyu rainfall around the Yangtze River in 2020 regulated by the subseasonal phase transition of the North Atlantic Oscillation. Geophys. Res. Lett. 2020, 47, e2020GL090342. [Google Scholar] [CrossRef]
  40. Mao, J.; Wu, G. Intraseasonal variations of the Yangtze rainfall and its related atmospheric circulation features during the 1991 summer. Clim. Dyn. 2006, 27, 815–830. [Google Scholar] [CrossRef]
  41. Sun, X.; Jiang, G.; Ren, X.; Yang, X.Q. Role of intraseasonal oscillation in the persistent extreme precipitation over the Yangtze River Basin during June 1998. J. Geophys. Res. Atmos. 2016, 121, 10,453–10,469. [Google Scholar] [CrossRef]
  42. Lee, S.-S.; Moon, J.-Y.; Wang, B.; Kim, H.-J. Subseasonal prediction of extreme precipitation over Asia: Boreal summer intraseasonal oscillation perspective. J. Clim. 2017, 30, 2849–2865. [Google Scholar] [CrossRef]
  43. Ding, Y.; Liu, Y.; Hu, Z.-Z. The record-breaking mei-yu in 2020 and associated atmospheric circulation and tropical SST anomalies. Adv. Atmos. Sci. 2021, 38, 1980–1993. [Google Scholar] [CrossRef]
  44. Gualdi, S.; Navarra, A.; Tinarelli, G. The interannual variability of the Madden–Julian oscillation in an ensemble of GCM simulations. Clim. Dyn. 1999, 15, 643–658. [Google Scholar] [CrossRef]
  45. Slingo, J.; Rowell, D.; Sperber, K.; Nortley, F. On the predictability of the interannual behaviour of the Madden-Julian Oscillation and its relationship with El Niño. Q. J. R. Meteorolog. Soc. 1999, 125, 583–609. [Google Scholar] [CrossRef]
  46. Kessler, W.S.; Kleeman, R. Rectification of the Madden–Julian oscillation into the ENSO cycle. J. Clim. 2000, 13, 3560–3575. [Google Scholar] [CrossRef]
  47. Tam, C.-Y.; Lau, N.-C. Modulation of the Madden-Julian Oscillation by ENSO: Inferences from observations and GCM simulations. J. Meteorolog. Soc. Jpn. Ser. II 2005, 83, 727–743. [Google Scholar] [CrossRef]
  48. Hendon, H.H.; Wheeler, M.C.; Zhang, C. Seasonal dependence of the MJO–ENSO relationship. J. Clim. 2007, 20, 531–543. [Google Scholar] [CrossRef]
  49. Moon, J.-Y.; Wang, B.; Ha, K.-J. ENSO regulation of MJO teleconnection. Clim. Dyn. 2011, 37, 1133–1149. [Google Scholar] [CrossRef]
  50. Liu, F.; Li, T.; Wang, H.; Deng, L.; Zhang, Y. Modulation of boreal summer intraseasonal oscillations over the western North Pacific by ENSO. J. Clim. 2016, 29, 7189–7201. [Google Scholar] [CrossRef]
  51. Wu, R.; Cao, X. Relationship of boreal summer 10–20-day and 30–60-day intraseasonal oscillation intensity over the tropical western North Pacific to tropical Indo-Pacific SST. Clim. Dyn. 2017, 48, 3529–3546. [Google Scholar] [CrossRef]
  52. Lin, A.; Li, T. Energy spectrum characteristics of boreal summer intraseasonal oscillations: Climatology and variations during the ENSO developing and decaying phases. J. Clim. 2008, 21, 6304–6320. [Google Scholar] [CrossRef]
  53. Chen, X.; Li, C.; Li, X. Influences of ENSO on boreal summer intraseasonal oscillation over the western Pacific in decaying summer. Clim. Dyn. 2020, 54, 3461–3473. [Google Scholar] [CrossRef]
  54. Paek, H.; Yu, J.Y.; Qian, C. Why were the 2015/2016 and 1997/1998 extreme El Niños different? Geophys. Res. Lett. 2017, 44, 1848–1856. [Google Scholar] [CrossRef]
  55. Ren, H.-L.; Wang, R.; Zhai, P.; Ding, Y.; Lu, B. Upper-ocean dynamical features and prediction of the super El Niño in 2015/16: A comparison with the cases in 1982/83 and 1997/98. J. Meteorolog. Res. 2017, 31, 278–294. [Google Scholar] [CrossRef]
  56. Chen, Y.; Yan, L.; Li, G.; Xu, J.; Long, J.; Zheng, S. Contrasting Impacts of Three Extreme El Niños on Double ITCZs over the Eastern Pacific Ocean. Atmosphere 2021, 12, 424. [Google Scholar] [CrossRef]
  57. Shao, X.; Li, S.; Liu, N.; Song, J. The Madden–Julian oscillation during the 2016 summer and its possible impact on rainfall in China. Int. J. Climatol. 2018, 38, 2575–2589. [Google Scholar] [CrossRef]
  58. Shen, H.; He, S.; Wang, H. Effect of summer Arctic sea ice on the reverse August precipitation anomaly in eastern China between 1998 and 2016. J. Clim. 2019, 32, 3389–3407. [Google Scholar] [CrossRef]
  59. Kalnay, E.; Kanamitsu, M.; Kistler, R.; Collins, W.; Deaven, D.; Gandin, L.; Iredell, M.; Saha, S.; White, G.; Woollen, J.; et al. The NCEP/NCAR 40-Year Reanalysis Project. Bull. Am. Meteorol. Soc. 1996, 77, 437–472. [Google Scholar] [CrossRef]
  60. Liebmann, B.; Smith, C.A. Description of a complete (interpolated) outgoing longwave radiation dataset. Bull. Am. Meteorol. Soc. 1996, 77, 1275–1277. [Google Scholar]
  61. Xie, P.; Chen, M.; Yang, S.; Yatagai, A.; Hayasaka, T.; Fukushima, Y.; Liu, C. A gauge-based analysis of daily precipitation over East Asia. J. Hydrometeorol. 2007, 8, 607–626. [Google Scholar] [CrossRef]
  62. Chen, M.; Shi, W.; Xie, P.; Silva, V.B.; Kousky, V.E.; Wayne Higgins, R.; Janowiak, J.E. Assessing objective techniques for gauge-based analyses of global daily precipitation. J. Geophys. Res. Atmos. 2008, 113. [Google Scholar] [CrossRef]
  63. Huang, B.; Thorne, P.W.; Banzon, V.F.; Boyer, T.; Chepurin, G.; Lawrimore, J.H.; Menne, M.J.; Smith, T.M.; Vose, R.S.; Zhang, H.-M. Extended reconstructed sea surface temperature, version 5 (ERSSTv5): Upgrades, validations, and intercomparisons. J. Clim. 2017, 30, 8179–8205. [Google Scholar] [CrossRef]
  64. Torrence, C.; Compo, G.P. A practical guide to wavelet analysis. Bull. Am. Meteorol. Soc. 1998, 79, 61–78. [Google Scholar] [CrossRef]
  65. Kemball-Cook, S.; Wang, B. Equatorial waves and air–sea interaction in the boreal summer intraseasonal oscillation. J. Clim. 2001, 14, 2923–2942. [Google Scholar] [CrossRef]
  66. Kikuchi, K.; Wang, B. Global perspective of the quasi-biweekly oscillation. J. Clim. 2009, 22, 1340–1359. [Google Scholar] [CrossRef]
  67. Yang, J.; Wang, B.; Wang, B. Anticorrelated intensity change of the quasi-biweekly and 30–50-day oscillations over the South China Sea. Geophys. Res. Lett. 2008, 35. [Google Scholar] [CrossRef]
  68. Zhang, G.; Mao, J.; Wu, G.; Liu, Y. Impact of potential vorticity anomalies around the eastern Tibetan Plateau on quasi-biweekly oscillations of summer rainfall within and south of the Yangtze Basin in 2016. Clim. Dyn. 2021, 56, 813–835. [Google Scholar] [CrossRef]
  69. Yuan, Y.; Gao, H.; Li, W.; Liu, Y.; Chen, L.; Zhou, B.; Ding, Y. The 2016 summer floods in China and associated physical mechanisms: A comparison with 1998. J. Meteorol. Res. 2017, 31, 261–277. [Google Scholar] [CrossRef]
  70. Donald, A.; Meinke, H.; Power, B.; Maia, A.d.H.; Wheeler, M.C.; White, N.; Stone, R.C.; Ribbe, J. Near-global impact of the Madden-Julian Oscillation on rainfall. Geophys. Res. Lett. 2006, 33. [Google Scholar] [CrossRef]
  71. Hendon, H.H.; Liebmann, B. The intraseasonal (30–50 day) oscillation of the Australian summer monsoon. J. Atmos. Sci. 1990, 47, 2909–2924. [Google Scholar] [CrossRef]
  72. Frederiksen, J.S.; Frederiksen, C.S. Twentieth century winter changes in Southern Hemisphere synoptic weather modes. Adv. Meteorol. 2011, 2011, 353829. [Google Scholar] [CrossRef]
  73. Frederiksen, C.S.; Zheng, X.; Grainger, S. Teleconnections and predictive characteristics of Australian seasonal rainfall. Clim. Dyn. 2014, 43, 1381–1408. [Google Scholar] [CrossRef]
  74. Cowan, T.; Wheeler, M.C.; Marshall, A.G. The combined influence of the Madden–Julian oscillation and El Niño–Southern Oscillation on Australian rainfall. J. Clim. 2023, 36, 313–334. [Google Scholar] [CrossRef]
  75. Paegle, J.N.; Byerle, L.A.; Mo, K.C. Intraseasonal modulation of South American summer precipitation. Mon. Weather Rev. 2000, 128, 837–850. [Google Scholar] [CrossRef]
  76. Matthews, A.J. Intraseasonal variability over tropical Africa during northern summer. J. Clim. 2004, 17, 2427–2440. [Google Scholar] [CrossRef]
  77. Lee, S.-S.; Wang, B. Regional boreal summer intraseasonal oscillation over Indian Ocean and Western Pacific: Comparison and predictability study. Clim. Dyn. 2016, 46, 2213–2229. [Google Scholar] [CrossRef]
  78. Keane, R.; Parker, D.; Fletcher, J. Biases in Indian summer monsoon precipitation forecasts in the Unified Model and their relationship with BSISO index. Geophys. Res. Lett. 2021, 48, e2020GL090529. [Google Scholar] [CrossRef]
  79. Englehart, P.J.; Douglas, A.V. Defining intraseasonal rainfall variability within the North American monsoon. J. Clim. 2006, 19, 4243–4253. [Google Scholar] [CrossRef]
  80. Moon, J.-Y.; Wang, B.; Ha, K.-J.; Lee, J.-Y. Teleconnections associated with Northern Hemisphere summer monsoon intraseasonal oscillation. Clim. Dyn. 2013, 40, 2761–2774. [Google Scholar] [CrossRef]
  81. Gao, J.; Lin, H.; You, L.; Chen, S. Monitoring early-flood season intraseasonal oscillations and persistent heavy rainfall in South China. Clim. Dyn. 2016, 47, 3845–3861. [Google Scholar]
  82. Ren, P.; Ren, H.L.; Fu, J.X.; Wu, J.; Du, L. Impact of boreal summer intraseasonal oscillation on rainfall extremes in southeastern China and its predictability in CFSv2. J. Geophys. Res. Atmos. 2018, 123, 4423–4442. [Google Scholar] [CrossRef]
Figure 1. Spatial distributions of daily precipitation anomalies (contours, mm·d−1) and their standard deviations (shading, mm·d−1) in eastern China for June–July of (a) 1998 and (b) 2016. The red boxes denote the Yangtze River basin (YRB, 27° N–32.5° N, 110° E–122° E). The blue lines represent the Yellow River and the Yangtze River, respectively.
Atmosphere 14 01695 g001
Figure 2. (a) Time series of precipitation anomalies for the period of the extended boreal summer (May–October) 1998, area-averaged over the YRB (27° N–32.5° N, 110° E–122° E). The blue solid line represents the first heavy rainfall event (1998 event 1, 24 May to 28 June), and the red solid line represents the second heavy rainfall event (1998 event 2, 29 June to 3 August). (b) Wavelet power spectra (contours) of the time series of the area-averaged YRB precipitation anomalies for the extended boreal summer in 1998 using the Morlet as a wavelet basis function. The black dashed lines indicate the 85% confidence level. (c) Global power spectrum of precipitation anomalies over the YRB. The black (red) dashed line indicates the 85% (90%) confidence level. (d) The time frequency of the time series of the area-averaged YRB precipitation anomalies for the extended boreal summer in 1998. The black curve denotes the cone of influence outside which the edge effects become important.
Atmosphere 14 01695 g002
Figure 3. (a) Time series of precipitation anomalies for the period extended boreal summer (May-October) 2016, area-averaged over the YRB (27° N–32.5° N, 110° E–122° E). The blue solid line represents the first heavy rainfall event (2016 event 1, 3 June to 20 June), the red solid line represents the second heavy rainfall event (2016 event 2, 21 June to 6 July), and the green solid line represents the third rainfall event (2016 event 3, 7 July to 20 July). (b) Wavelet power spectra (contours) of the time series of the area-averaged YRB precipitation anomalies for the extended boreal summer in 2016 using the Morlet as wavelet basis function. The black dashed lines indicate the 85% confidence level. (c) Global Power spectrum of precipitation anomalies over YRB. The black dashed line indicates the 85% confidence level. (d) The time-frequency of time series of the area-averaged YRB precipitation anomalies for the extended boreal summer in 2016. The black curve denotes the cone of influence outside which the edge effects become important.
Atmosphere 14 01695 g003
Figure 4. Phase-space representation of the first two principal components (PCs) BSISO1 index (PC1 and PC2) for the 1998 event 1 (blue) and event 2 (red), with each dot representing the amplitude of the index on a particular day. The black circle represents the region where the amplitude of the BSISO (PC12 + PC22) is less than 1. For each phase, the approximate location of the active convection during the propagation of BSISO1 is shown. The solid (open) circles indicate the starting (ending) position and the positions in the dry (wet) episode.
Atmosphere 14 01695 g004
Figure 5. Composite anomalies of precipitation (shading, mm·d−1) for the 1998 event 1 and event 2 in eastern China; (ah) represent phases 1–8, respectively. The number of days for each phase of BSISO1 is given in each panel.
Atmosphere 14 01695 g005
Figure 6. Composite anomalies of OLR (shading, W·m−2) and 850 hPa wind (vectors, m·s−1) for the 1998 event 1 and event 2; (ah) represent phases 1–8, respectively. “C” denotes cyclonic circulation and “A” denotes anticyclonic circulation. The number of days for each phase of BSISO1 is given in each panel.
Atmosphere 14 01695 g006
Figure 7. The vertical–meridional cross-section of divergence anomalies (shading, 10−6 s−1) and meridional wind (vector, m·s−1) and omega (10−2 Pa·s−1) averaged over 110° E–122° E for the 1998 event 1 and event 2; (ah) represent phases 1–8, respectively. The yellow dashed lines indicate 27° N and 32.5° N. The number of days for each phase of BSISO1 is given in each panel.
Atmosphere 14 01695 g007
Figure 8. (a,b) Latitude-time plots of 30–60-day filtered daily OLR anomalies (shading, W·m−2) averaged over (a) the Indian Ocean (IO, 60° E–110° E) and (b) the South China Sea–western Pacific (SCS–WP, 110° E–160° E) from 15 May to 31 August 1998. The area between the black dashed lines indicates the latitude scope of the YRB (27° N–32.5° N). (c) Longitude-time plots of 30–60-day filtered daily OLR anomalies (shading, W·m−2) averaged over 10° S–40° N from 15 May to 31 August 1998. The area between the black dashed lines indicates the longitude scope of the YRB (110° E–122° E). The yellow arrows denote the propagation of active convection in rainfall events.
Atmosphere 14 01695 g008
Figure 9. Phase-space representation of the second two principal components (PCs) BSISO2 index (PC3 and PC4) for the 2016 event 1 (blue), event 2 (red), and event 3 (green), with each dot representing the amplitude of the index on a particular day. The black circle represents the region where the amplitude of the BSISO (PC32 + PC42) is less than 1. For each phase, the approximate location of the active convection during the propagation of BSISO1 is shown. The solid (open) circles indicate the starting (ending) position and the positions in the dry (wet) episode.
Atmosphere 14 01695 g009
Figure 10. Composite anomalies of precipitation (shading, mm·d−1) for the 2016 event 1, event 2, and event 3 in eastern China; (ah) represent phases 1–8, respectively. The number of days for each phase of BSISO2 is given in each panel.
Atmosphere 14 01695 g010
Figure 11. Composite anomalies of OLR (shading, W·m−2) and 850 hPa wind (vectors, m·s−1) for the 2016 event 1, event 2, and event 3; (ah) represent phases 1–8, respectively. “C” denotes cyclonic circulation and “A” denotes anticyclonic circulation. The number of days for each phase of BSISO2 is given in each panel.
Atmosphere 14 01695 g011
Figure 12. The vertical–meridional cross-section of divergence anomalies (shading, 10−6 s−1) and meridional wind (vector, m·s−1) and omega (10−2 Pa·s−1) averaged over 110° E–122° E for the 2016 event 1, event 2, and event 3; (ah) represent phases 1–8, respectively. The yellow dashed lines indicate 27° N and 32.5° N. The number of days for each phase of BSISO2 is given in each panel.
Atmosphere 14 01695 g012
Figure 13. (a,b) Latitude-time plots of 10–30-day filtered daily OLR anomalies (shading, W·m−2) averaged over the (a) IO and (b) the SCS–WP from 15 May to 31 August 2016. The area between the black dashed lines indicates the latitude scope of the YRB (27° N–32.5° N). (c) Longitude-time plots of 10–30-day filtered daily OLR anomalies (shading, W·m−2) averaged over 10° S–40° N from 15 May to 31 August 2016. The area between the black dashed lines indicates the longitude scope of the YRB (110° E–122° E). The yellow arrows denote the propagation of active convection in rainfall events.
Atmosphere 14 01695 g013
Figure 14. The anomalies of SST (shading, °C) and 850 hPa wind (vector, m·s−1) in (a) June to July, (b) June, and (c) July of 1998. “C” denotes cyclonic circulation and “A” denotes anticyclonic circulation.
Atmosphere 14 01695 g014
Figure 15. The anomalies of SST (shading, °C) and 850 hPa wind (vector, m·s−1) in (a) June to July, (b) June, and (c) July of 2016. “C” denotes cyclonic circulation and “A” denotes anticyclonic circulation.
Atmosphere 14 01695 g015
Table 1. Comparison of BSISO in 1998 and 2016.
YearBSISONumber of Rainfall EventsPhases
for Wet or Dry Episode
Source of BSISO
and Other ISO
SST and Atmospheric Circulation
1998BSISO1
(30–60-day oscillation)
2wet episode:
phases 1–4
dry episode:
phases 5–8
event 1: SCS–WP/IO
event 2: SCS–WP
cold SST anomalies appearing in central equator Pacific
strengthen easterlies
reinforce cyclonic shear
BSISO1 propagate poleward
2016BSISO2
(10–30-day oscillation)
3wet episode:
phases 1–2/7–8
dry episode:
phases 3–6
event 1: SCS–WP
event 2: IO, extratropical WP
event 3: SCS–WP
without cold SST anomalies appearing in central equator Pacific
weaken easterlies
unfavorable for BSISO1 propagating poleward
BSISO2 propagate poleward
Disclaimer/Publisher’s Note: The statements, opinions and data contained in all publications are solely those of the individual author(s) and contributor(s) and not of MDPI and/or the editor(s). MDPI and/or the editor(s) disclaim responsibility for any injury to people or property resulting from any ideas, methods, instructions or products referred to in the content.

