Review

The State of Precipitation Measurements at Mid-to-High Latitudes

by
Lisa Milani
1,2,* and
Christopher Kidd
1,2
1
Earth System Science Interdisciplinary Center, University of Maryland, College Park, MD 20740, USA
2
Mesoscale Atmospheric Processes Laboratory, NASA Goddard Space Flight Center, Greenbelt, MD 20771, USA
*
Author to whom correspondence should be addressed.
Atmosphere 2023, 14(11), 1677; https://doi.org/10.3390/atmos14111677
Submission received: 7 September 2023 / Revised: 7 November 2023 / Accepted: 9 November 2023 / Published: 13 November 2023
(This article belongs to the Special Issue Precipitation Observations and Prediction)

Abstract

:
The measurement of global precipitation is important for quantifying and understanding the Earth’s systems. While gauges form the basis of conventional measurements, global measurements are only truly possible using satellite observations. Over the last 50–60 years, satellite systems have evolved to provide a comprehensive suite of observing systems, including many sensors that are capable of precipitation retrievals. While much progress has been made in developing and implementing precipitation retrieval schemes, many techniques have concentrated upon retrievals over regions with well-defined precipitation systems, such as the tropics. At higher latitudes, such retrieval schemes are less successful in providing accurate and consistent precipitation estimates, especially due to the large diversity of precipitation regimes. Furthermore, the increasing dominance of snowfall at higher latitudes imposes a number of challenges that require further, urgent work. This paper reviews the state of the current observations and retrieval schemes, highlighting the key factors that need to be addressed to improve the estimation and measurement of precipitation at mid-to-high latitudes.

1. Introduction

Precipitation (liquid and/or solid) is a key component of the energy and water cycles that drive the Earth’s climate system. Measuring precipitation on a global basis is essential for monitoring the present distribution and intensity of precipitation and for monitoring changes over longer climate time scales [1]. Since precipitation is a critical component of the Earth system, it has been identified as an essential global variable [2] and an essential climate variable [3]. Precipitation is, fundamentally, the source of all freshwater and is essential to life on Earth, impacting humanity and the natural environment around us. It is also of great interest to a range of scientific disciplines, including hydrology, oceanography, the cryosphere and environmental communities, ecology, and biology, as well as for its economic value for crop forecasting, water resource management and the mitigation of the impacts of droughts or floods.
Measuring precipitation on a global basis is challenging. Conventional networks of gauges and radars are not sufficient to adequately cover the whole of the Earth’s land surface, yet alone the ocean regions. While satellite observations provide data for generating precipitation estimates, errors and uncertainties exist in these estimates. Major international efforts, such as the Global Precipitation Measurement (GPM) mission [4,5], have led the way in improving global estimates from satellite observations, although challenges remain, particularly across the mid-to-high latitudes due to the characteristics of precipitation in these regions. At lower latitudes (<45° N/S), precipitation is generally convective, resulting in stronger signals in satellite observations. However, at higher latitudes, stratiform precipitation systems are more common with snowfall becoming dominant poleward of 70° N/S, resulting in subdued and more subtle signals in satellite observations.
This paper presents a review of the current literature on precipitation retrievals over mid-to-high latitudes to provide a state-of-the-art overview of the sensors and products, complementing and updating the previous relevant review papers such as Kidd et al. [6], Levizzani et al. [7] or Prigent [8]. Section 2 provides some background knowledge on the distribution of precipitation based on latitude and Section 3 provides an overview of the measuring systems utilized to observe and measure precipitation. The current retrieval schemes based on the different types of sensors are described in Section 4, together with some comparisons between the sensors and the currently most advanced multi-satellite products. The open challenges for precipitation retrievals are discussed in Section 5, together with ways to move forward with new and future satellites. Finally, the conclusions are presented in Section 6.

2. Background

The main driver of precipitation at mid-latitudes is the temperature gradient between the equator and the poles, which affects atmospheric stability, the jet stream intensity and extratropical cyclones [9]. Hénin et al. [10] noted that frontal precipitation from these cyclones accounts for up to 80% of all the precipitation in the mid-latitudes, especially during autumn and winter. At higher latitudes, precipitation in its solid form becomes increasingly important. Figure 1 illustrates the contribution of light precipitation to the total precipitation occurrence by liquid, mixed and frozen hydrometeors, as provided by shipborne meteorological reports, highlighting that poleward of a 40–50° latitude, mixed and frozen light precipitation occurs and becomes dominant above 70° latitude.
The distribution of precipitation across all latitudes is determined by the availability of moisture. In the mid-latitudes, the moisture sources include the oceans and plumes of moisture from the tropics. Lu and Hao [12] noted that atmospheric steering, governing the directions of the disturbances at low levels, plays an important role in the transport of tropical moisture and the resulting extreme precipitation, while Yoshimori et al. [13] highlighted the importance of mid-latitude atmospheric eddies and equatorial ocean upwelling. Significant precipitation events have been linked to atmospheric rivers (of moisture) along the west coast of North America and Western Europe [14,15,16,17]. Conversely, linkages between mid-latitude circulation and winter precipitation over the Arabian Peninsula were found by Saeed and Almazroui [18]. At higher latitudes, moisture is limited by the capacity of the lower air temperatures to hold moisture. Warm open water often provides a ready source of moisture, leading to lake-effect snowfall such as over the Great Lakes region of the U.S. [19] and over northern Japan [20]. Over the Arctic, moisture is available from open water close to the ice edge or open water within the ice pack, while over the Antarctic, moisture is limited to the coastal regions since substantial areas of the Antarctic region are classified as desert [21].
The increasing occurrence of snowfall with latitude impacts the subsequent cryospheric processes. The accumulation of snow affects the seasonal-to-multi-year water storage, such as the mass balance of glaciers [22], which impacts the water resources of particular regions [23,24]. Although most glaciers lose mass due to warmer global temperatures, the mass balances of some glaciers are controlled by precipitation [25]. Adams [26] noted that precipitation was a fundamental component in the mass budget of the Antarctic where the balance between precipitation, evaporation and the outflow of ice determined the equilibrium of the continental ice sheet.
Climate change is disproportionally affecting the polar regions and, in particular, the Arctic. Davy and Griewank [27] noted that the Arctic has warmed at nearly four times the global average since 1979 due to temperature amplification caused by the loss of sea ice. The loss of sea ice increases the area of water that is available for moisture uptake by the atmosphere, thereby increasing the moisture available for precipitation. However, Routson et al. [9] found that the warming at high latitudes has weakened the annual surface gradient in the Northern Hemisphere. A comparison with similar patterns seen in the Holocene suggested that a weakened latitudinal temperature gradient would lead to considerable reductions in mid-latitude water availability [9]. A complication is the wider scale teleconnections where consensus is lacking on the future changes in mid-latitude precipitation by, for example, events such as El Niño. Yang et al. [28] showed that La Niña/El Niño-like events caused approximately 20% more precipitation over East Asia and North America through enhanced moisture transport. However, the measurable changes in mid-latitude precipitation noted by Karagiannidis et al. [29] found decreasing trends in extreme precipitation over most of Europe using gauge data from 1958 to 2000. Dukat et al. [30], using the standardized precipitation and evapotranspiration index (SPEI), found that there was an increasing trend (although not statistically significant) in the occurrence of drought for all the considered timescales. A negative trend in frontal precipitation mostly over the Gulf Stream was identified by Hénin et al. [10] when analyzing the model data, although they cautioned that this could be a consequence of the reanalysis model-derived precipitation.
The impact of aerosols on mid-latitude precipitation was highlighted by Osborne and Lambert [31]. Wan et al. [32] found that simulated responses to anthropogenic forcing were consistent with their observed changes, confirming the results of Min et al. [33] who detected anthropogenic influences on high-latitude precipitation. Such changes were consistent with earlier studies on the impact of urban areas on precipitation due to induced changes in cloud microphysics and precipitation mechanisms [34]. However, while Poujol et al. [35] showed an increase in the convective precipitation frequency and intensity with a strong seasonality, they added caution since the exact nature of the precipitation response and its characteristics is still not well understood due to the complex nature of the physical processes underlying the formation of clouds and precipitation. The role of many climate induced changes, such as the thawing of permafrost and associated land–atmosphere interactions, are poorly understood [36].

3. Measuring Precipitation

3.1. Ground-Based Measurements

The ‘standard’ instrument for measuring precipitation (rain and snow) is the rain gauge. These devices are generally relatively simple, offering a direct, physical measure for precipitation and as such can be considered the reference standard. The actual number of rain gauges across the Earth’s surface from which data are collected varies depending on the time, accumulation period and source [1]. However, it is likely to be close to 123,014 monthly accumulation gauges, as noted by Strangeways [37]. For near real-time gauge data, this number is much lower. The World Meteorological Organization (WMO) Global Telecommunication System (GTS) provides information from between 8,000 and 12,000 “first class” stations [3]. While each gauge is deemed to accurately portray the precipitation at their location and to be representative of their surrounding area, the distribution of these gauges is very uneven, with the majority of the gauges situated in populated regions with few, if any, over large tracts, including virtually none over the oceans (Figure 2). Kidd et al. [1] noted that gauges represent an incredibly small fraction of the Earth’s surface, and even if each gauge was evenly distributed globally, less than 1% of the Earth’s surface would be within a 5 km radius around each gauge. Furthermore, errors in gauge measurements arise largely due to the wind effect around the orifice, which are exacerbated by increasing exposure, together with losses or errors from the mechanical construction of the gauge [38,39].
At higher latitudes, the increasing dominance of precipitation in the form of falling snow (as opposed to snow on the ground) presents additional challenges. Snowflakes (and crystals) have significantly different aerodynamic properties to rain drops which, combined with the catchment (in)efficiencies of the gauges, make accurate quantification difficult. Gauges are usually adapted to reduce many measurement biases in snow-prone regions in order to modify (i.e., reduce) the airflow over the gauge, such as placing fences around the gauges and baffles close to the gauge orifices. However, Nitu and Wong [40] noted that only approx. 28% of all precipitation gauges are equipped with such shields, although most gauges are automated with heating elements to prevent snow from accumulating on the rim or sides of the collector [40]. Crucially, less than 25% of all snowfall may actually be measured due to wind effects, compared to the measurement accuracy for rainfall, which is usually within 10–20% of the assumed true value [39,41].
While the errors and uncertainties associated with measuring rainfall and snowfall with manual gauges are reasonably well understood, corrections (or quality control) can be applied. Sugiura et al. [42] evaluated the WMO precipitation correction procedures through the measurement of solid precipitation in Barrow, Alaska. They found that while the unfenced gauge measurements were similar to the double-fenced reference gauge at low wind speeds, the (daily) measurement ratios decreased more rapidly with an increasing wind speed compared to the WMO corrections. In addition, these discrepancies were affected by the temperature-dependent characteristics of the snow particles. Sugiura et al. [42] concluded that the WMO correction equations should not be extrapolated in high-latitude regions for high wind speeds over 6 m s−1. The Global Precipitation and Climatology Project (GPCP) implemented similar corrections to account for gauge undercatch, although a comparison conducted by Swenson [43] of the GPCP merged satellite–gauge precipitation analyses and the Climate Prediction Center Merged Analysis of Precipitation (CMAP) with the water storage anomalies generated from the Gravity Recovery and Climate Experiment (GRACE) indicated that the gauge undercatch correction used by the GPCP may be overestimated.
Weather radars provide a means of measuring the spatial distribution of precipitation on a frequent and regular basis. Depending on the type of radar, measurements may be drawn to a radius of approx. 250 km at resolutions better than 1 km every few minutes. Individual radar measurements are usually combined into single, national, or international mosaics to provide spatial coverage over large regions. The European Operational Programme for Exchange of Weather Radar Information (OPERA) product provides a 15 min, 2 km product from over 20 national radar networks across Europe [44,45]. The U.S. National Oceanic and Atmospheric Administration (NOAA) Multi-Radar Multi-Sensor (MRMS) Quantitative Precipitation Estimation (QPE) [46] covers the continental U.S., while the Automated Meteorological Data Acquisition System (AMeDAS), curated by the Japan Meteorological Agency (JMA), covers Japan [47]. However, the relationship between the backscatter of the radar beam and the precipitation intensity may not be consistent, particularly between the different types of precipitation, such as rain, snow or hail [48]. Corrections may be made routinely (e.g., [46]) or during post analysis [49] to ensure product consistency and accuracy. Additional corrections take into account certain factors, such as the beam elevation (which leads to underestimating or missing shallow precipitation systems) [50], removal of ground clutter [51,52,53], bright band detection and removal [54] and calibration against surface gauge data [55].
While gauge and radar measurements provide the bulk of surface measurements, new technologies and instrumentation are able to provide new insights into precipitation that are notoriously difficult to characterize at mid–high latitudes. Micro Rain Radars (MRRs) provide a vertical profile for a number of parameters, including the reflectivity, precipitation intensity, fall velocity and drop size distribution (DSD) [56,57]. Although these instruments only provide information at one (point) location, they offer a good range/altitude resolution (≥10 m) and a good temporal sampling (≥1 s) providing a vertical profile of precipitation from a point on the surface. Schemes have been developed to use information from the microwave communication links of commercial mobile phone networks to exploit the attenuation caused by precipitation on the microwave signal. The results have shown great promise in providing spatial maps of near-surface precipitation, which compare well with other conventional sources of precipitation information [58,59,60]. Measuring precipitation over the oceans remains challenging due to the physical remoteness and conditions. However, the use of the underwater acoustic properties of precipitation hitting the ocean surface has been studied (e.g., [61,62]), and for longer term analyses, the use of shipborne meteorological reports can be utilized [63].

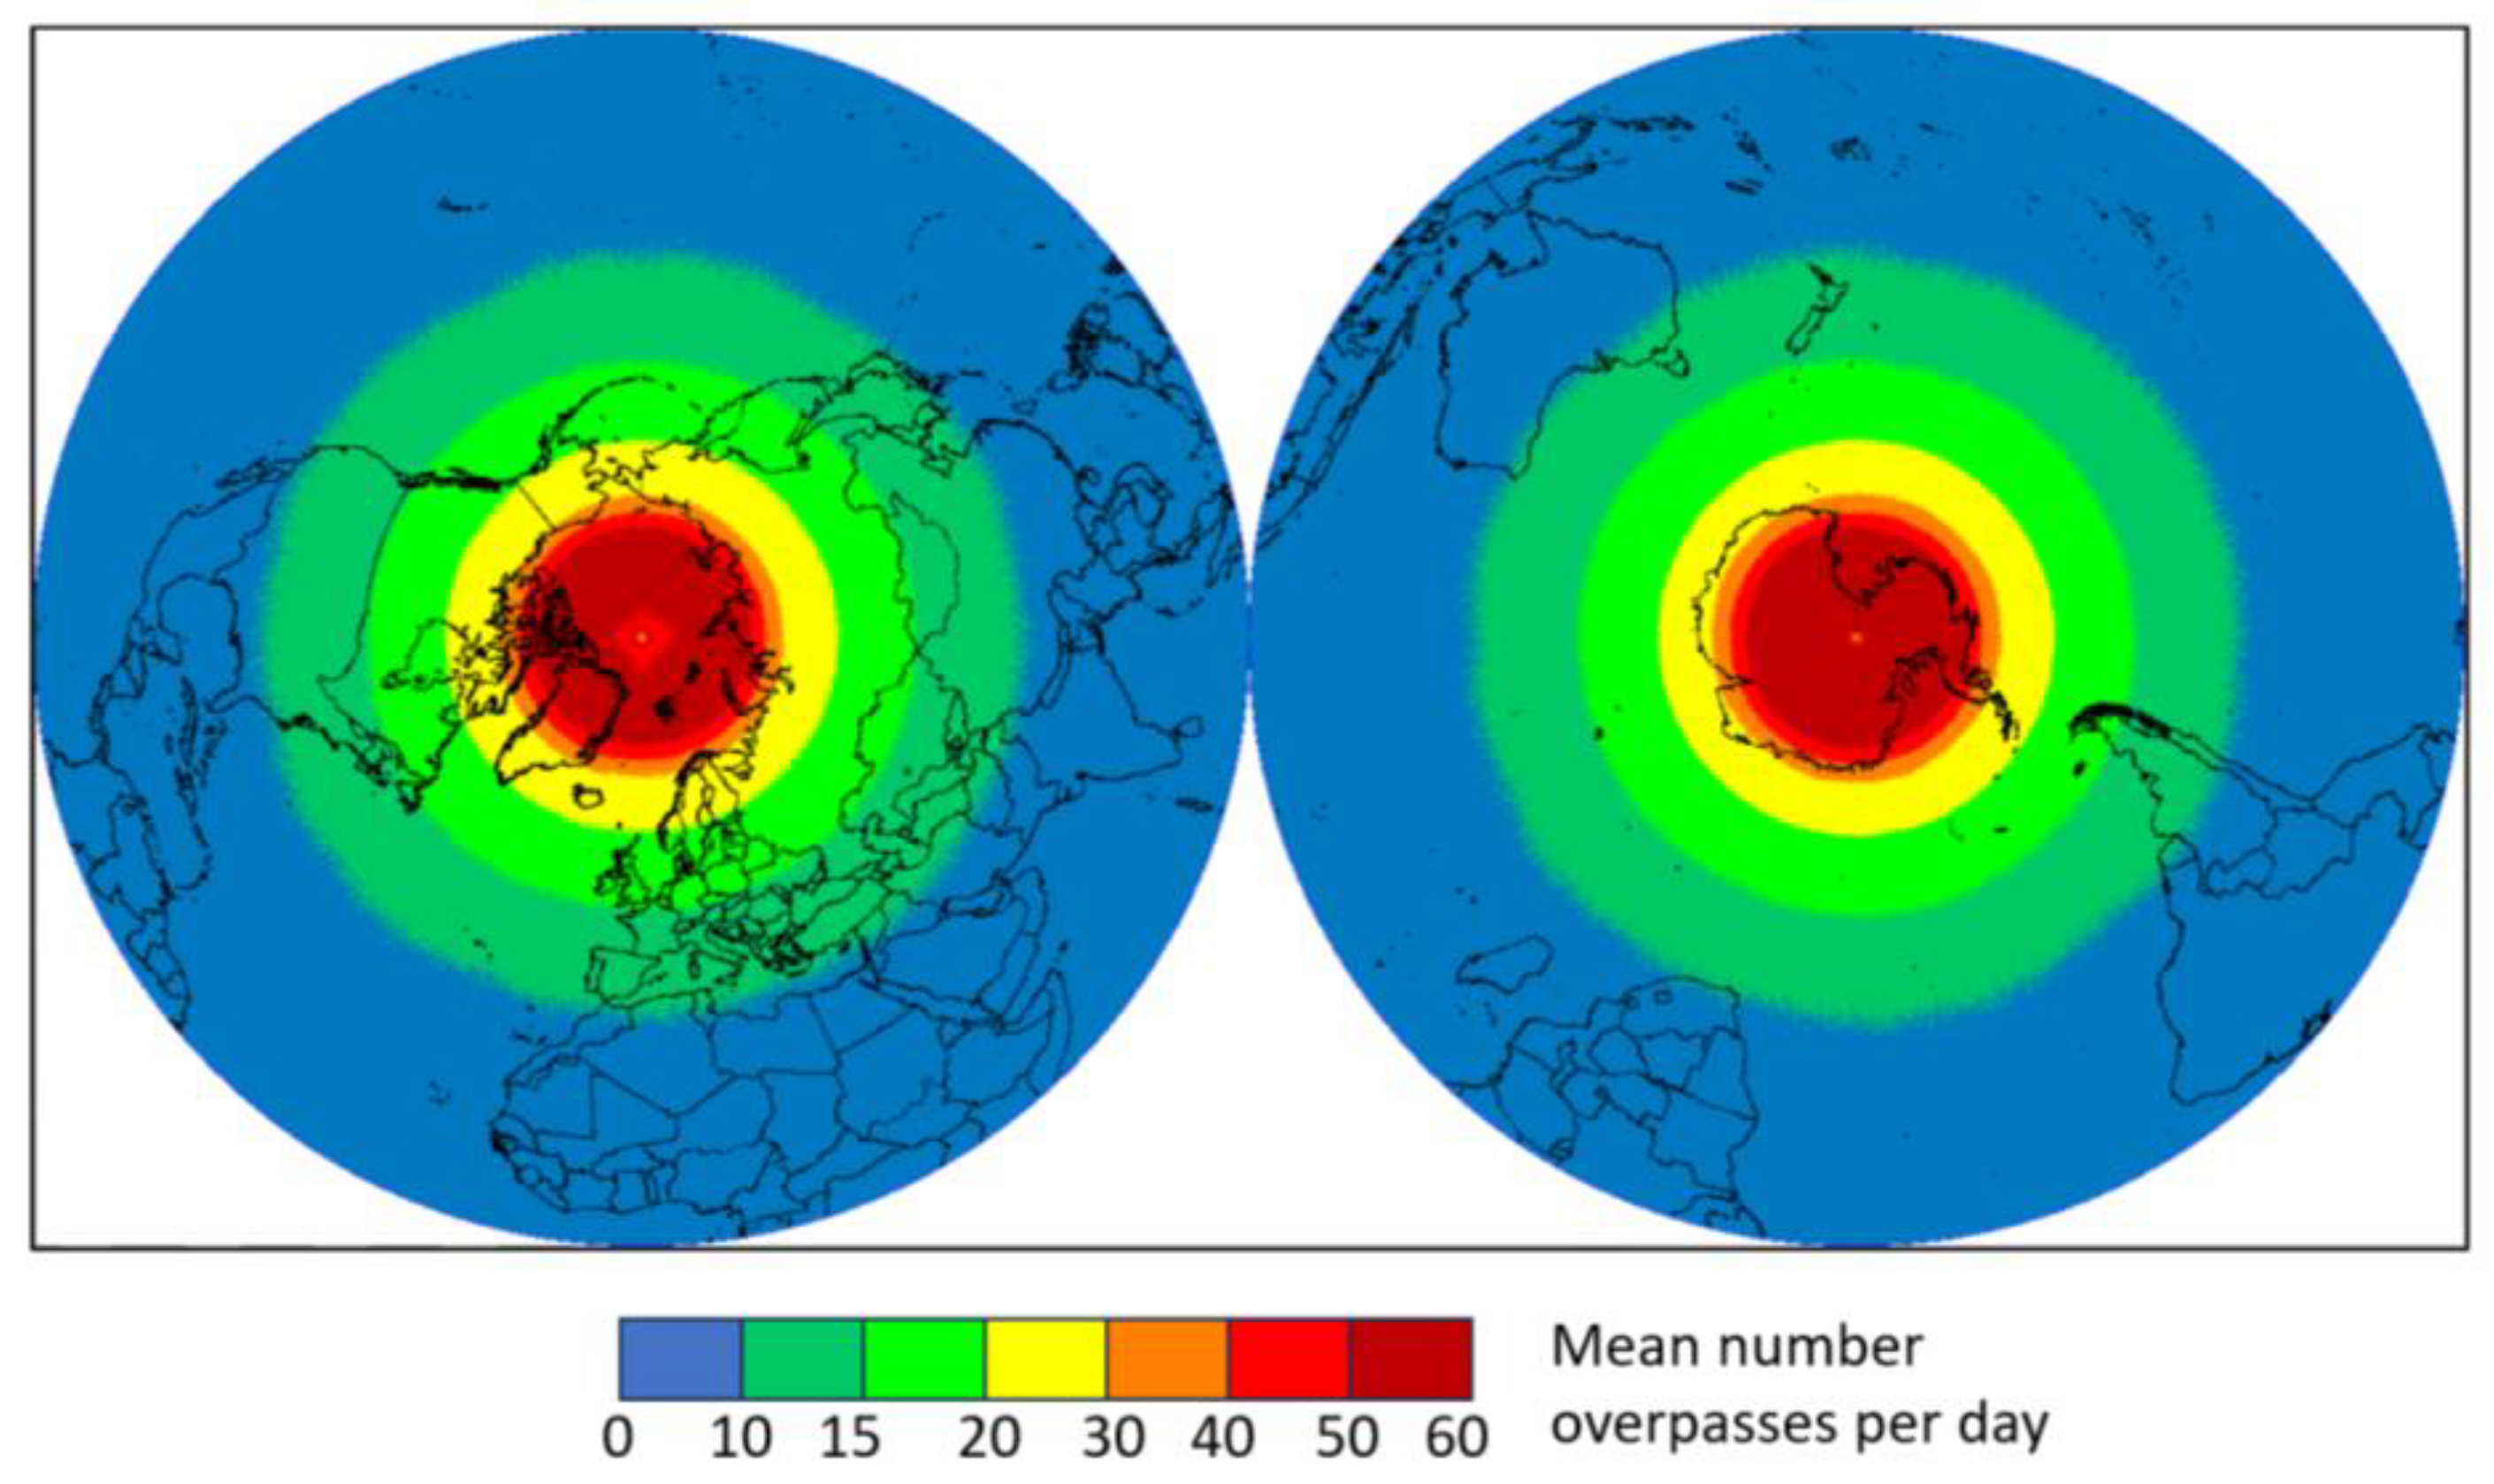
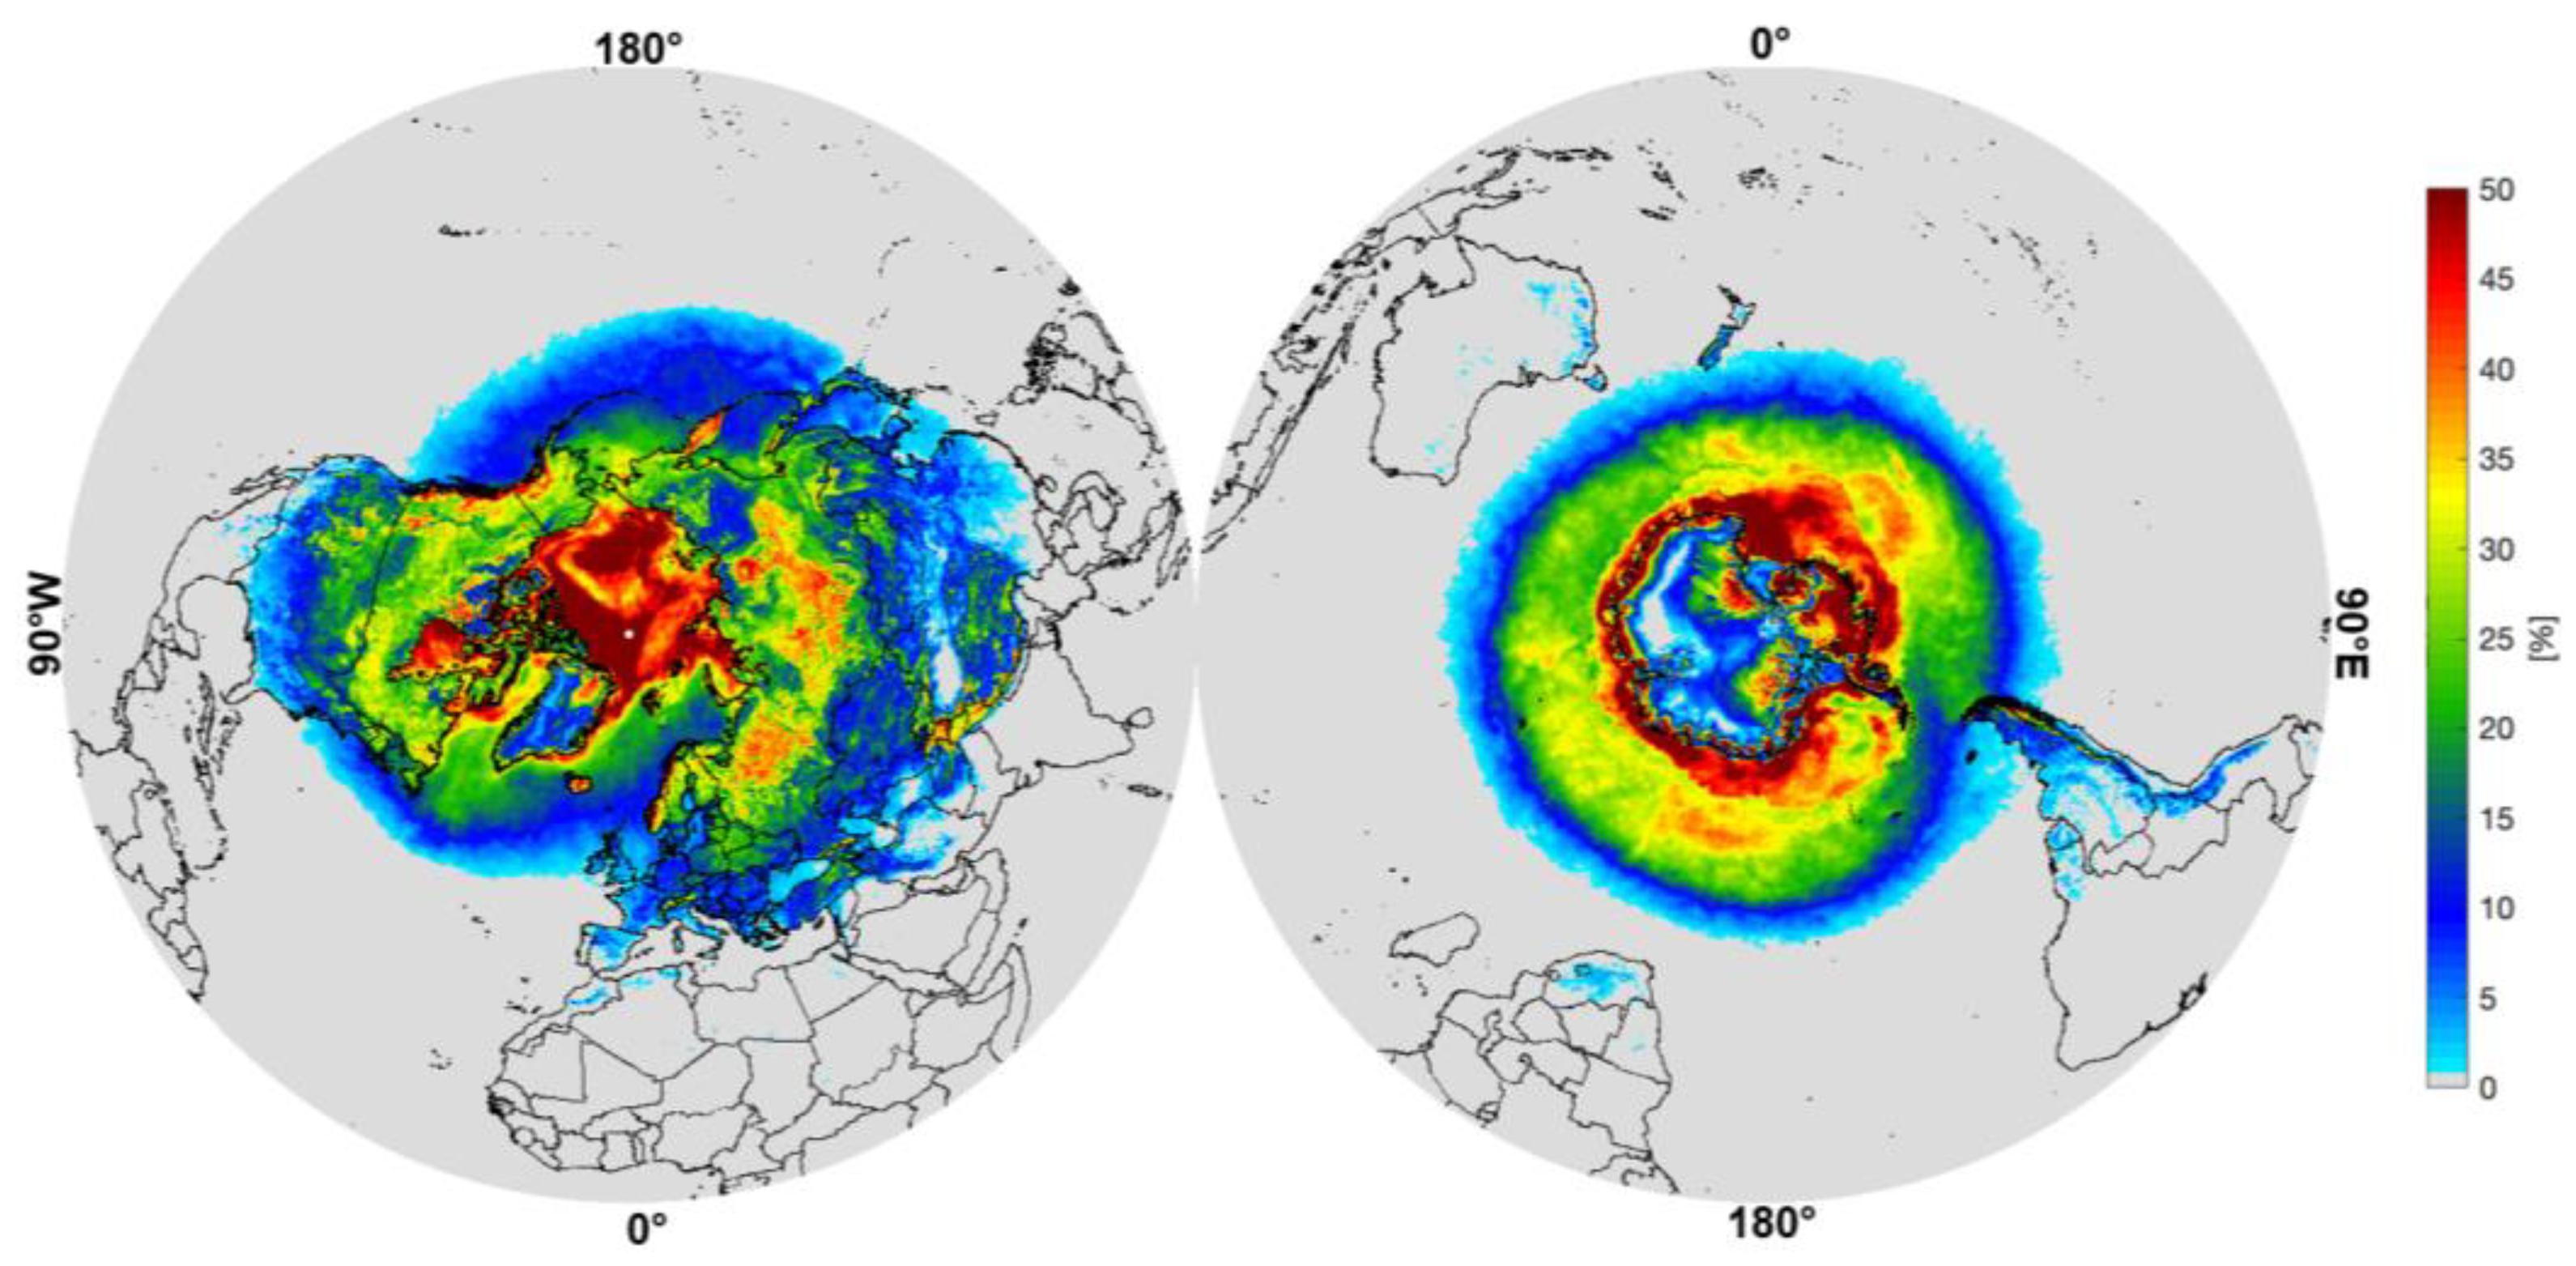
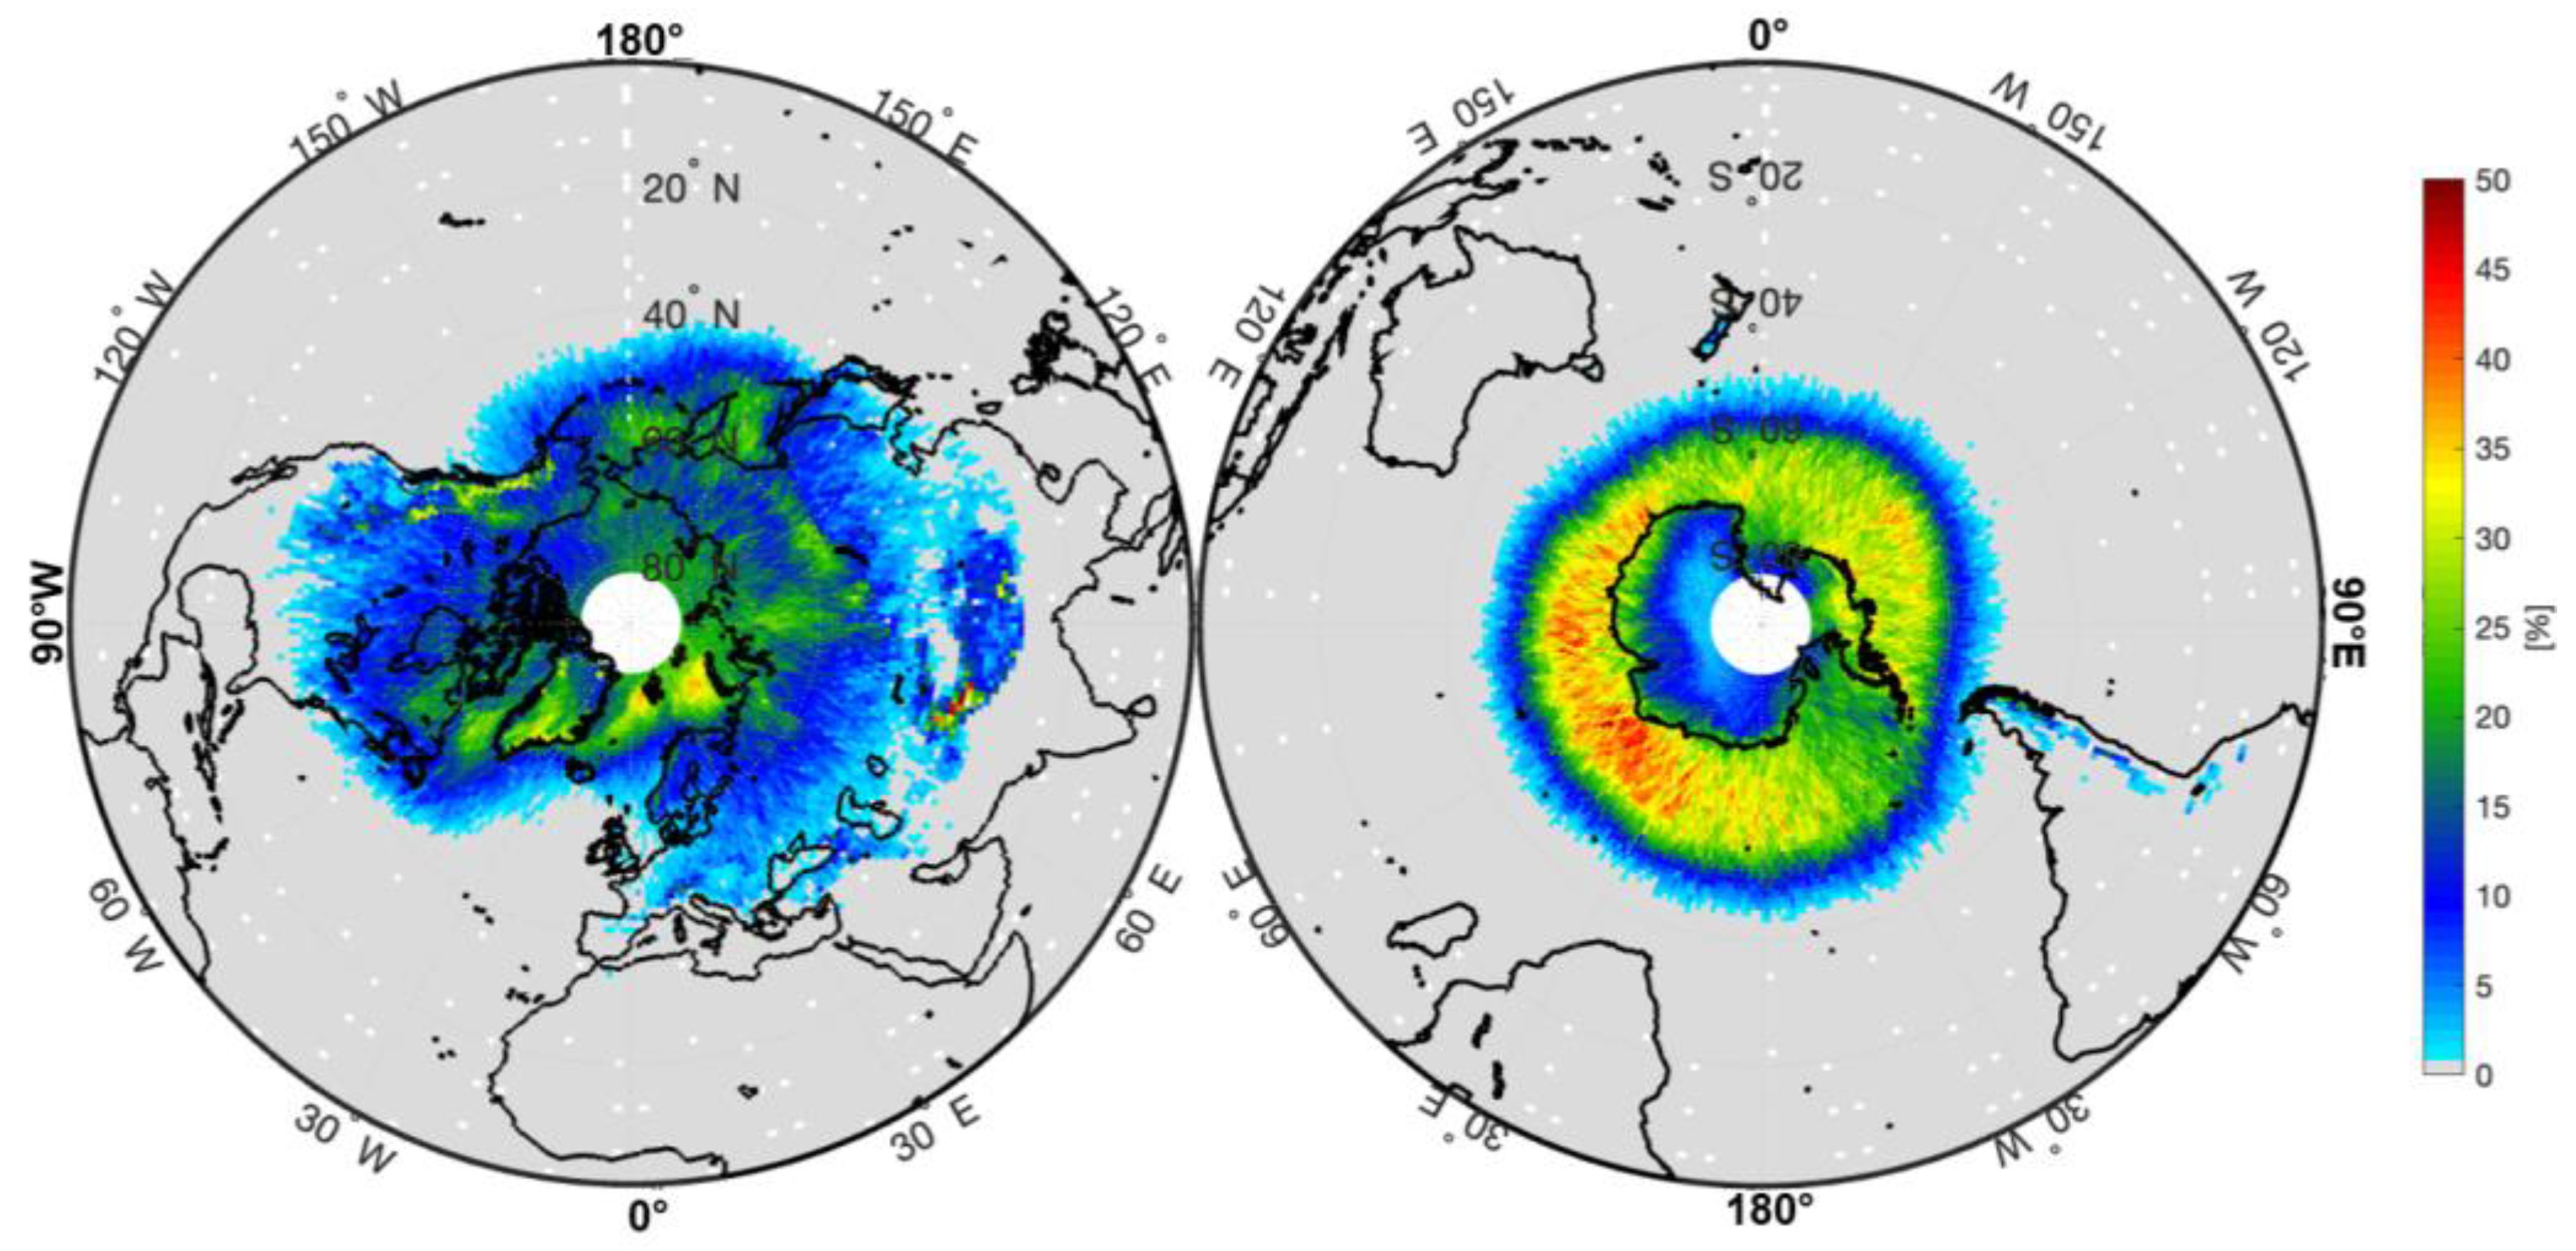
3.2. Satellite-Based Measurements

Observations made by satellite sensors currently offer the only truly viable means of providing information on the intensity and distribution of global precipitation [64]. The ability to observe and measure clouds and precipitation from satellite platforms extends back some 60 years using numerous satellite platforms and a diverse range of sensors and capabilities [65]. However, they may be broadly classified into their orbital characteristics and the channels they use to observe the Earth and its atmosphere.
Low Earth Orbiting (LEO) satellites have formed the mainstay of operational meteorological observations since the start of the satellite era. These satellites are generally placed in polar or Sun-synchronous orbits between 400–800 km in altitude, primarily to provide consistency in their overpass times (and Sun elevation) and provide (near) global coverage twice a day [66,67] (Figure 3). However, some LEO satellites are placed into low-inclination orbits which, while covering less of the Earth’s surface, allow for observations across different times of day, albeit over an extended period. The sensors carried onboard LEO satellites range from visible (Vis) and infrared (IR) to passive microwave (PMW) and active microwave (AMW or radar). The current LEO satellites include the NOAA Joint Polar Satellite System (JPSS) series, [68], the European Meteorological Operational (MetOp) satellite series [69,70] and the Chinese Fengyun (FY) series [71]. These operational missions are augmented by scientific missions such as the GPM Core Observatory (GPM-CO), the U.S. Department of Defense (DoD) Meteorological Satellite Program (DMSP) satellites [72] and the Japan Aerospace Exploration Agency (JAXA) Global Change Observation Mission (GCOM) [73]. Such missions provide very good coverage over the polar regions due to their orbital configuration (Figure 3), and therefore have great potential for improving observations of precipitation in these sparse data regions.
Geostationary, or geosynchronous (GEO), satellites operate in orbits at approx. 36,000 km in altitude, which allow the satellite to (very nearly) remain over the same location above the Earth’s equator. From this vantage point, the sensors onboard GEO satellites are able to capture frequent observations of a full Earth ‘disc’ (i.e., maximum viewable area of the Earth) within the individual capabilities of each sensor. The sensors on GEO platforms are, however, essentially limited to Vis/IR spectral bands due to the large Earth sensor distance. However, the development of new sensors has allowed for more Vis/IR channels and a better determination of clouds and aerosols. Furthermore, additional sensors with some precipitation monitoring/retrieval capabilities have also been included, such as the Geostationary Lightning Mapper (GLM) [74] and the Meteosat Third Generation (MTG) Lightning Mapper (LM) [75]. While GEO platforms offer unrivalled images across the lower latitudes, their orbital position means that the satellite–Earth incidence angle increases at higher latitudes, leading to a poorer spatial resolution and greater parallax issues.
Visible (Vis) imagery relies on reflected light (or albedo) from the cloud tops and is, therefore, constrained by daylight for illumination. The low Sun angle of the polar nights limits the usefulness of visible imagery, although a small number of sensors (e.g., the Visible Infrared Imaging Radiometer Suite, VIIRS) have a high low-light sensitivity, which provides some useful nighttime data (e.g., [76]). When daylight is available, clouds are often difficult to distinguish from surface snow and ice, although multi-channel visible and near-infrared data can help discriminate between the background surface and clouds.
Infrared (IR) imagery senses the emitted thermal radiation from the Earth’s surface and clouds. Techniques have been developed to establish relationships between the cloud-top temperatures and precipitation. However, at higher latitudes, the cloud-top temperatures can often be warmer than the surface background, so using IR data alone is problematic. Additional channels are often used to provide extra information to help define and qualify precipitation. The current generation of sensors, such as the Advanced Baseline Imager (ABI) [77,78,79] and the Flexible Combined Imager (FCI) [75], provide multi-channel/spectral, high temporal/spatial resolution observations. Nevertheless, Vis/IR sensors only observe the cloud-top properties. While the cloud-top-to-surface precipitation relationships could be considered reasonable for convective precipitation, such observations are less useful over regions where stratiform precipitation regimes are dominant.
Passive microwave (PMW) sensors, developed in the 1970s, provide near all-weather observations of the geophysical parameters, such as the sea surface temperature and state, ice extent, land surface characteristics, as well as atmospheric components such as water vapor and precipitation. The first multi-channel radiometer, the Scanning Multichannel Microwave Radiometer (SMMR, [80]), operated from 1978 to 1987 and provided observations from 6.7 GHz to 37 GHz at both vertical and horizontal polarizations. Precipitation estimates could be generated from these channels, particularly over the oceans, and to a much lesser extent over land areas. A significant advance came with the launch of the U.S. DMSP satellite in 1987 with the Special Sensor Microwave/Imager (SSM/I) instrument [81]. This instrument provided measurements from 19.35 to 85.5 GHz. The higher frequencies, particularly at 85.5 GHz, together with an improved spatial resolution, facilitated the retrieval of precipitation over land surfaces. The U.S. DoD Special Sensor Microwave Imager/Sounder (SSMIS, [82]) from 2003 onwards has expanded the frequency range to 150 and 183.31 GHz, thus improving the identification and quantification of light precipitation, including snowfall, paving the way for the later use of PMW sounding instruments (e.g., [83]).
In 1997, the first precipitation-specific mission, the Tropical Rainfall Measuring Mission (TRMM, [84,85]), was launched, which operated in a 35° inclined orbit and carried the TRMM Microwave Imager (TMI) and the (first) Precipitation Radar (PR) operating in the Ku-band at 13.8 GHz. The low-inclination non-Sun-synchronous orbit enabled the sensors to observe the diurnal cycle of precipitation across the tropics from approx. 38° N to 38° S. Although the TRMM primarily observed tropical precipitation, precipitation systems more typical of mid-latitudes were observed over the seasonal cycles, providing insights into the characteristics of light precipitation and snowfall. To address precipitation at higher latitudes, the GPM mission was devised. The GPM is an international satellite mission comprising the GPM-CO and a constellation of international partner satellites and sensors [5,86]. The GPM-CO (launched on 28 February 2014) is a joint National Aeronautics and Space Administration (NASA) and JAXA mission that operates in a 65° inclined orbit at an altitude of 407 km and carries the Dual-frequency Precipitation Radar (DPR, [87,88]) and GPM Microwave Imager (GMI, [89]). The GMI is a 13-channel passive microwave radiometer, providing observations from 10.65 GHz to 183 ± 7 GHz over an 885 km swath with resolutions up to 3 × 5 km.
To improve the temporal sampling necessary to capture the variability of precipitation, the GPM mission exploits observations from all the precipitation-capable passive microwave instruments. In addition to the current suite of SSMIS sensors, JAXA contributes the Advanced Microwave Scanning Radiometer-2 (AMSR2) instrument on the GCOM Water-1 (GCOMW1) satellite, providing observations from 6 to 89 GHz. Passive microwave sounding instruments are also included in the GPM international partnerships, namely the Microwave Humidity Sounder (MHS) and the Advanced Technology Microwave Sounder (ATMS) sensors provided by NOAA and the European Organisation for the Exploitation of Meteorological Satellites (EUMETSAT). Although these sounding instruments are primarily designed for atmospheric sounding close to the water vapor absorption lines (e.g., 183.31 GHz), they provide an additional suite of observations that have proved to be invaluable for precipitation estimates [90,91] as well as operational estimates [92]. The current suite of satellites/sensors contributing to the GPM mission are shown in Table 1 (along with the two precipitation/cloud radar sensors described below). In addition to these ‘primary’ sensors, the observations made by ‘missions of opportunity’ are included when feasible, such as the Indian/French Megha-Tropiques Sondeur Atmospherique du Profil d’Humidite Intertropicale par Radiometrie (SAPHIR, [93]), the NASA/Massachusetts Institute of Technology (MIT) Time-Resolved Observations of Precipitation structure and storm Intensity with a Constellation of Smallsats (TROPICS) mission and the NASA Space Test Program-Houston 8 (STP-H8) mission, which comprise the Compact Ocean Wind Vector Radiometer (COWVR) and Temporal Experiment for Storms and Tropical Systems Technology (TEMPEST-H8) instruments. A full description of these missions can be found in Aonashi and Ferraro [94] and Kidd et al. [5].
Active microwave (AMW) instruments, or radar, provide the most direct measure of precipitation among the currently available spaceborne sensors. These instruments measure the radiation that is scattered back from hydrometeors (and the surface) that is in proportion to the size of the particles. The relationship between the backscatter and particle size is dependent upon the frequency of the radiation. Low frequencies are better at quantifying larger droplets since they are not attenuated by the smaller particles, including clouds. Conversely, high frequencies provide greater sensitivity to the small particles, but attenuate/saturate quickly in the presence of large particles, which limits the penetration of storms with moderate to intense precipitation [95].
The first spaceborne precipitation radar was carried on the TRMM between 1997 and 2015 and operated at 13.8 GHz. Although it was limited to regions from 38° N to 38° S, the data provided the basis for retrievals from the NASA/JAXA (DPR) on the GPM-CO. The DPR, comprised of Ku- and Ka-band radars, was capable of measuring the three-dimensional structure of precipitation at a spatial resolution of 5.4 × 5.4 km and a vertical resolution of 250 m. The Ku-band radar provided data over a 245 km wide swath, while the original Ka-band radar swath was 120 km. After 21 May 2018, this was changed to match that of the Ku-band swath. The choice of the frequencies for the DPR, 13.6 GHz (Ku-band) and 35.5 GHz (Ka-band) with minimum detectable signals of 17 dBZ and 12 dBZ, respectively, was deemed ideal for providing precipitation estimates over mixed-phase/snowfall-dominated precipitation regimes. The radar was designed to measure the precipitation accuracy over a range from 0.2 to 111.0 mm h−1 [86], although the sensitivity of the radar limited the detection of snowfall in moderate to heavy intensities.
NASA and the Canadian Space Agency (CSA) launched the first spaceborne W-band (94 GHz) Cloud Profiling Radar (CPR) in 2006 on the CloudSat mission as part of NASA’s A-Train constellation [96,97]. CloudSat is a nadir-pointing radar flying in a Sun-synchronous orbit with a 1.4 × 1.7 km spatial resolution and a fixed equator crossing time at 0130 am/pm. With a 480 m vertical resolution (oversampled at 240 m), the CPR provided vertical profiles of the lower 30 km of the Earth’s atmosphere. Although the main objective was to acquire global information on clouds, it also resolved many precipitation systems and can be used to retrieve light precipitation and snowfall (e.g., [98,99,100,101]), with the potential to bridge the gap in the measurement of the Earth’s hydrological cycle [102].
Crucially, both cloud and precipitation radars cannot provide observations close to the surface due to strong surface reflectivity (i.e., surface clutter) [103]. The surface clutter typically impacts the lowest three to five range bins above the highest surface point within a footprint, or approx. 700–1500 m at nadir. The scanning pattern of the DPR increases this height limitation to approx. 2000 m towards the edge of the scan [56].

4. Precipitation Retrieval Schemes

The capture, processing, archiving and distribution of data from the GPM mission is undertaken by the NASA Precipitation Processing System (PPS) for both the GPM-CO and the constellation members. Additional data, including the GEO-IR and model data, are collected for use in subsequent precipitation retrieval schemes. The ingested data undergoes quality control to ensure consistency between the different satellite data sets. Most important, the GPM Intersatellite Calibration Working Group (XCAL, [104,105]) implemented a consistent calibration process of the observed brightness temperatures across the different sensors to ensure that the observations can be used interchangeably. The GMI sensor provides the baseline against which other PMW sensors are compared. The differences between the observations from the various sensors are generally below 2–3 K at frequencies below 92 GHz, although some sensors exhibit greater departures. For sounders, the differences tend to be smaller at approx. 0.5 K for the SAPHIR and MHS sensors and 1 K for the ATMS sensor. The resulting products are labelled Level 1C to indicate that these are the intercalibrated brightness temperatures at the footprint resolution. The NASA PPS also generates Level 2 precipitation products, which are the instantaneous precipitation retrievals at the retrieval resolution of each sensor. The official precipitation products are provided for active and passive microwave sensors and for the combination of the two (Table 2). The processing of these observations greatly simplifies the subsequent generation of multi-sensor precipitation retrievals.
Similar to the PPS, the data processing center (DPC) run by the Cooperative Institute for Research in the Atmosphere (CIRA), a research institute at Colorado State University, provides data for the CloudSat mission, from Level 1 to Level 3, as well as auxiliary data.

4.1. Retrieval Schemes

Passive microwave observations have been the mainstay of quantitative precipitation retrievals since they observe the precipitation-size hydrometeors within the clouds and are, therefore, more direct than Vis/IR observations. However, the (spectral) frequency at which the observations are made is important since the lower frequencies respond to liquid precipitation while the higher frequencies respond to precipitation-size ice particles. It is important to note that the observations of ice particles tend to relate to precipitation in the upper parts of the clouds, and therefore may provide a less direct measure of surface precipitation than the lower frequency observations. Furthermore, PMW observations made by sounding instruments primarily use the channels at atmospheric absorption bands, which are sensitive to different levels of the atmosphere and may also not reflect the precipitation at the surface [8,92].
Various techniques are used to retrieve precipitation from PMW observations. However, all the retrieval techniques only work well when there is a clear identifiable precipitation signal, such as with a well-developed precipitation system. It is clear from a qualitative assessment of images from different sensors that certain features, such as hurricanes and deep convection, are easy to identify. While quantitative retrievals from such systems are somewhat more problematic due to the complexity of the meteorology, the spatial resolution, and the directness of the observations from the different sensors, the precipitation estimates are nevertheless generally very good. In contrast, however, the identification and estimation of precipitation from mid- to high-latitude systems is more problematic since the rainfall or snowfall tends to be much lighter in intensity and depth with mixed- or entirely ice-phase precipitation. The latter is important since many PMW techniques rely on high-frequency channels to identify the scatter signature from the ice particles, particularly over land. Where ice particles do exist, the presence of water vapor above the frozen precipitation particles may negate any scattering signal, particularly at frequencies which are water vapor sensitive (e.g., approx. 183.31 GHz) [8,92].
The official NASA GPM operational precipitation retrieval technique used by NASA is the Goddard Profiling Algorithm (GPROF) scheme [106,107,108] (Table 2) for passive microwave observations. The GPROF is a Bayesian retrieval scheme that utilizes a priori databases to relate brightness temperature observations to precipitation rates. The primary a priori database is generated from co-located observations between the GMI and DPR, supported by the GMI and surface radar data (MRMS) matches permitting a better retrieval of light/shallow precipitation that might be missed by the DPR.
For the active microwave observations, the DPR-only product uses the methodology developed by Masaki et al. [109] and Seto and Iguchi [110], and the combined radar–radiometer algorithm (CORRA) uses that of Grecu et al. [111] and Grecu and Olson [112] (Table 2). While the Level 2 products are useful for full-resolution instantaneous retrievals, this limits their usefulness to the applications which need a consistent temporal/spatial resolution product. These Level 2 products generate an estimate of the total precipitation, together with an estimate of the frozen precipitation (i.e., snow) based on the model-derived near-surface temperature/humidity profiles, to determine the precipitation type at the surface [113]. The GPM DPR Level 2 product provides physically-based retrievals due to the dual-frequency radar observations [88]. The DSD parameters are also provided, together with some experimental flags that identify the snowfall at the surface. Note that the differences between the reflectivity from snowfall and rainfall impacts the estimation of the precipitation at the surface. A Level 3 DPR product also provides monthly global precipitation statistics on a 5 × 5° and 0.25 × 0.25° grid. The Level 2 product first processes the measured radar reflectivity to determine whether each pixel is precipitating and then classifies it into three major classes: stratiform, convective or other. The surface backscattering return is used to derive the path-integrated attenuation (PIA) and relate it to a precipitation rate. The DSD parameters and environmental variables are also calculated to determine the relationship between the rainfall rate (R) and the mean diameter (Dm) of the precipitation particles. The classification into classes (stratiform vs. convective) helps determine the precipitation type and intensity through the use of bright band information.
The greatest difference between the products generated by the current retrieval schemes and surface reference data relates to the latitude. While it is not a consequence of latitude per se, it is a result of the observation and interpretation of the different meteorological conditions that are associated with the precipitation systems at these latitudes. Such differences have long been apparent [114]. Where most techniques suggest little precipitation at higher latitudes, only a few products showed significantly greater precipitation, which were more aligned with the surface measurements. Behrangi and Song [115], for example, showed that there was a significant disparity between the oceanic precipitation products from the GPM combined product [111] and the GPCP v2.3 [116], with the GPCP product producing more precipitation poleward of 40° N/S. On a historical note, the products from the TRMM era avoided this problem since the TRMM coverage was limited to 38° S–38° N.
The retrieval of frozen precipitation over high latitudes and the polar regions from satellite observations has been specifically addressed by several researchers (e.g., [117,118,119,120,121,122] among others) with encouraging results. However, the quantification and accuracy of these estimates are yet to be fully determined, especially due to the paucity of the surface data sets for validation.
The observations made by sensors, such as the GMI with high-frequency channels at 89, 166 and 183 GHz (and polarized at 89 and 166 GHz), improve the detection of the scattering signal caused by ice particles in the atmosphere. Panegrossi et al. [123] highlighted the importance of the polarized signal at 166 GHz for snowfall retrievals and found that the 166 GHz polarization difference (Δ166) relationship with snowfall was influenced by sea ice concentrations, the total precipitable water (TPW) and the ice water path (IWP). The Δ166 identified snowfall when the TPW > 3.6 kg m−2 and the IPW > 0.24 kg m−2 over land, and when the TPW > 5.1 kg m−2 and the sea ice concentrations > 57% over sea.
The CloudSat mission provides specific products for liquid and solid precipitation. The 2C-PRECIP-COLUMN [100,101] was originally the main precipitation product. Similar to the DPR, CPR uses the surface backscatter to derive the PIA and relate it to the precipitation rate. After the introduction of the 2C-RAIN-PROFILE product [98,101], the latter is used for the quantitative retrievals of liquid precipitation while the former is used for precipitation detection and phase classification. Based on the precipitation mode detected by the 2C-PRECIP-COLUMN product (i.e., stratiform vs. convective), the surface precipitation type (liquid vs. solid) is determined by the presence of the melting layer, or the proximity of the freezing level to the surface, and a modeled lapse rate for stratiform precipitation, or simply the height of the freezing level for convective precipitation (everything below the freezing level is considered liquid). Based on this classification, the 2C-RAIN-PROFILE or the 2C-SNOW-PROFILE [101,124,125] (Table 2) products can calculate a precipitation rate at the surface and for each bin of the vertical profile. The 2C-SNOW-PROFILE product provides snow water equivalent quantities (expressed in mm h−1) and snow size distribution parameters [126,127], together with uncertainties for the retrieved and derived quantities [128]. The retrieval is based on an optimal estimation method that minimizes a cost function between the estimated and a priori values of the microphysical properties [124]. The European Center for Medium-range Weather Forecasts auxiliary product (ECMWF-AUX) provides all the environmental parameters necessary for processing the 2C-SNOW-PROFILE product.
As noted above, all the spaceborne radars, including the DPR and CPR, are affected by ground clutter in the lowest portion of the vertical profile, such that the first three to five bins (~700–1500 m) are usually discarded [129,130]. Any precipitation within these near-surface-contaminated bins has to be derived from information extrapolated from the low-level vertical profiles of the models or simply assumed to be constant. This so-called blind zone issue is particularly significant for snowfall retrievals given the unpredictable nature of snow particles, depending on the environmental conditions in the near-surface portion of the atmosphere, particularly with melting or drifting.
Although the GPM mission requirements only specify the detection of snowfall, much research has been dedicated to quantifying snowfall. Compared to the CloudSat-specific snowfall product, the GPROF retrieval provides the total (rain and snow) precipitation and frozen (snow) precipitation values based on the wet bulb temperature liquid/solid classification method of Sims and Liu [113]. Figure 4 shows an example of the frequency of occurrence of frozen precipitation calculated as the number of snowfall observations over all the observations as seen by the GPROF-AMSR2 in 2022. The availability of the GPROF product for all the GPM constellation PMW sensors allowed for comparison studies to better understand the best combination of frequencies for the best snowfall retrieval [131]. You et al. [132] assessed the GPROF V05 snowfall retrieval results from 11 radiometers against the DPR and CloudSat. They found that over the ocean, the conical scanning sensors performed better than the cross-track sensors due to the availability of low-frequency channels, while over land the Advanced Microwave Scanning Radiometer–Earth Observing System (AMSR-E) and the AMSR2 showed noticeably worse performances than the other sensors. In general, all the sensors underestimated the snowfall quantities.
Several studies have been dedicated to the calculation of snowfall occurrence and the average snowfall rate using CloudSat over Antarctica [119,120], the Arctic [133,134] and globally [135,136] (Figure 5), mainly using the 2006–2010 operational period of the mission. Since 2011, when CloudSat experienced a battery anomaly, the sensor has been forced to work on a daylight-only mode. This new operation mode introduced a non-negligible bias in snowfall detection and retrievals, especially over the Southern Hemisphere where there are no observations during the austral winter, or some northern latitudes where the bias can be as high as 33%. Globally, the bias on the mean snowfall rate is estimated to be about 12% after 2012 [137].
Given its high sensitivity to light precipitation and despite the radar blind zone issue, CloudSat has been used for the first shallow cumuliform snowfall observational analysis [135], with emphasis on the seasonal variability and dependency on sea ice cover [138]. Some specific areas have been found to be hot spots for shallow cumuliform systems, specifically over the North Atlantic region, the south-west of Greenland, the Sea of Japan and the southern oceans, with the fraction of shallow cumuliform snowfall reaching 70% of the total snowfall observed in the specific region.

4.2. CloudSat—GPM Comparison Studies

Due to the overlap between the GPM and the CloudSat missions, several studies have compared the capabilities of the sensors for detecting and estimating snowfall [103,139,140,141]. Casella et al. [139] showed that the DPR detected only 5–7% of snowfall events. However, due to the DPR’s sensitivity to intense snowfall events, the snowfall mass correctly detected is 29–34% of the CloudSat quantification. Adhikari et al. [140] confirmed that CloudSat underestimated heavy snowfall events, but only by 3% compared to the DPR Ku estimates, while the DPR underestimated light events by 52%. Skofronick-Jackson et al. [103] conducted a comparison study to investigate the source of these disparities. They found that the CloudSat CPR observed 10 times the occurrence and three times the accumulation of snowfall of the DPR. The disparity was substantially reduced when the comparison was made averaging the CloudSat pixels to simulate the DPR pixels and when the CPR observations were truncated below the 8 dBZ threshold. However, even with a similar occurrence, the average snowfall rate remained significantly lower for the DPR (43%) when compared to the CPR, suggesting retrieval assumption differences. Comparisons between the modified reflectivity (Z)–snowfall rate (S) relationships using the same snow scattering properties and particle-size distributions for the two sensors further reduced the disparity to 16%. Some other studies took advantage of the different sensitivities of the two sensors to create a retrieval with a broader snowfall rate range, from very light snow to heavy snowfall events [142].
Following the interest and the subsequent analyses of the comparisons between the GPM and CloudSat, new GPM products have been developed and made publicly available. The Level 2 CSATGPM and the CSATTRMM products match the CloudSat and GPM or TRMM orbits, respectively, to within 30 min from each other, offering an invaluable dataset for easier and accurate comparisons [143]. The CSATGPM product has been especially useful for snowfall analyses since it provides matching orbits up to 65° N/S. Rysman et al. [144,145] developed a snowfall retrieval algorithm based on PMW observations that outperformed the GPROF. The algorithm was based on machine learning methods and used the CloudSat vertical profiles to inform the brightness temperatures on what the snowfall scenario should be. The algorithm provided snowfall detection, supercooled liquid water detection, snow water path (SWP) and snowfall rates for the GMI and ATMS [83] sensors. Camplani et al. [146] further developed the machine learning technique and adapted it specifically for high-latitude conditions, where snow- and ice-covered surfaces most likely interfere with the radiometric signal coming from the precipitation layers of the atmosphere. The algorithm was based on a neural network approach and was applied to the ATMS sensors. The main novelty of the approach was the radiometric characterization of the surface at the time of the overpass [147] to derive multi-channel surface emissivity and clear-sky contributions that could be used in the snowfall retrieval process.

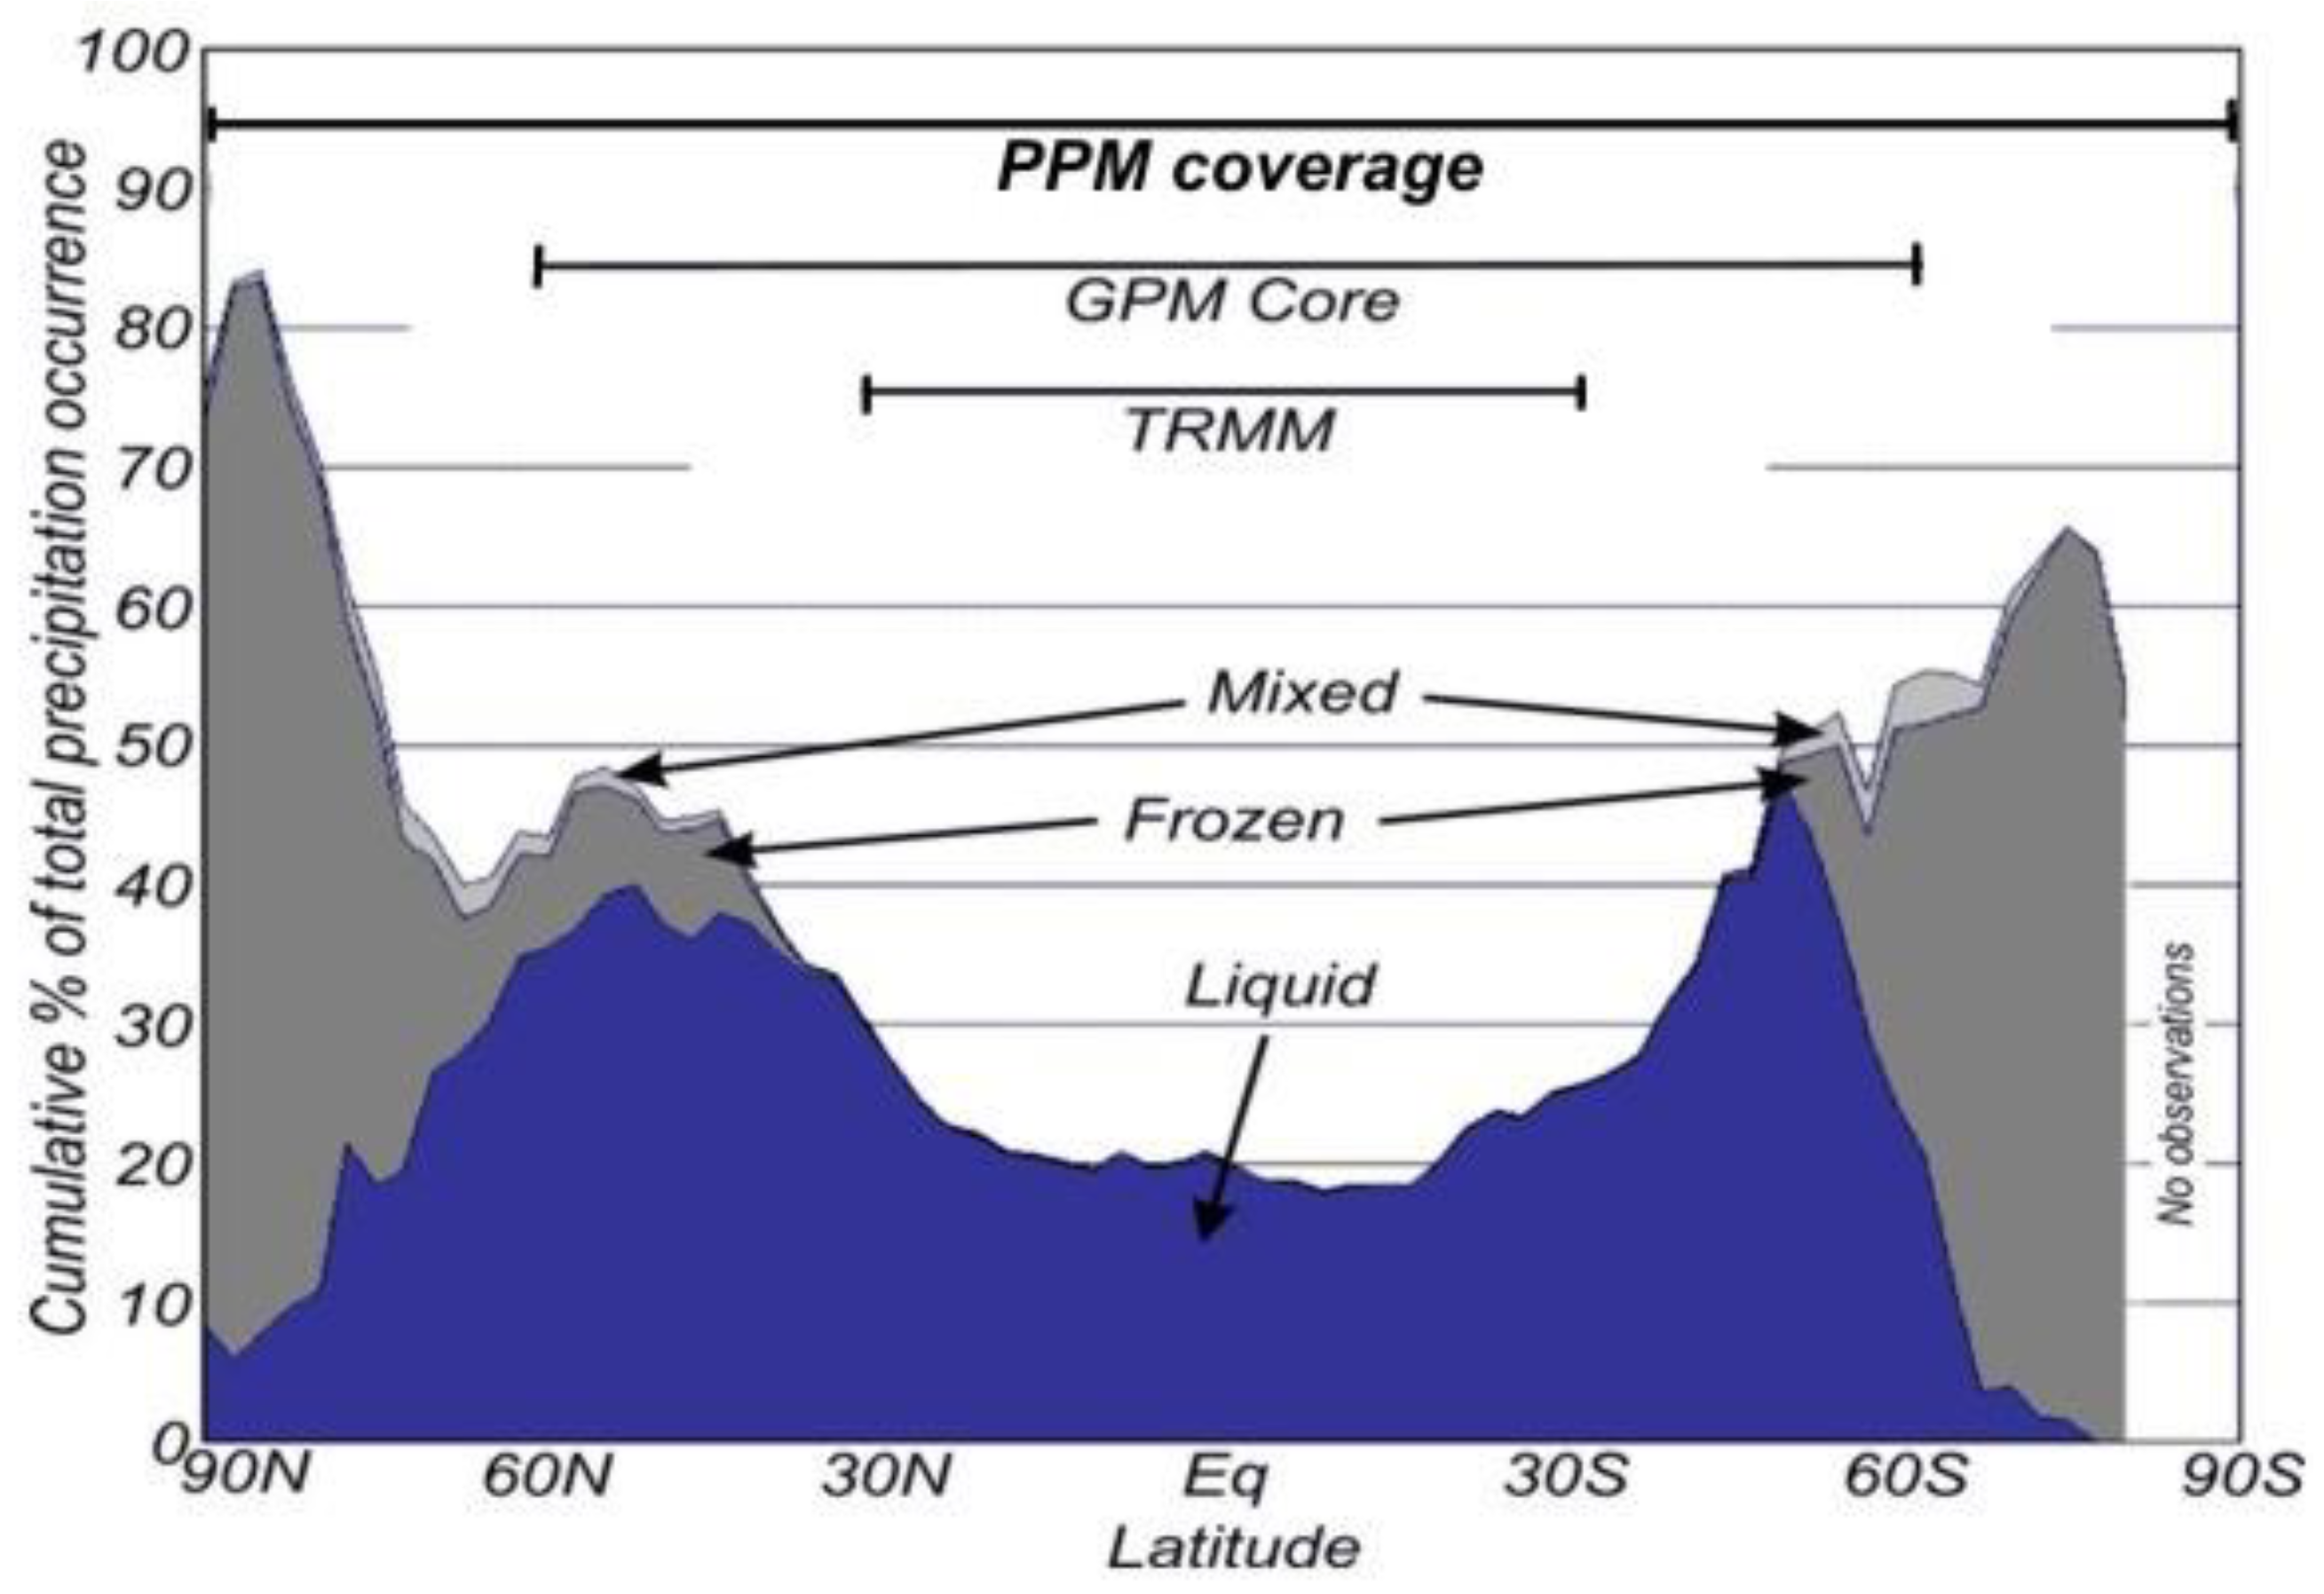
4.3. Integrated Multi-Satellite Retrievals

The U.S. GPM science team’s Integrated Multi-satellitE Retrieval for GPM (IMERG) scheme generated a Level 3 product that provides precipitation estimates at a 0.1° × 0.1°, 30-min resolution [148] (Table 2). The IMERG scheme ingests the GPROF Level 2 product, together with the GEO-IR data, to produce three IMERG products: an early run available within 4 h, a late run within 14 h and a final run incorporating the global monthly gauge analysis within approx. 3 months. The IMERG products contain the precipitation rate as well as the precipitation phase (liquid/solid) based on numerical assimilation/forecast information. Other Level 3 mapped precipitation products are available, such as the Global Satellite Mapping of Precipitation (GSMaP, [149,150,151], Table 2). The GSMaP products are generated hourly at a resolution of 0.1° × 0.1°, with the GSMaP_MVK (satellite only) and GSMaP_Gauge (gauge adjusted) available within 3 days. The GSMaP_NOW and GSMaP_NRT products are available in real time and near real time, respectively. The GSMaP takes into account the precipitation types in its algorithm through the regime classification and precipitation profile information from the GPM/DPR and ancillary meteorological data. In addition, an orographic rainfall scheme [152] is included to better portray precipitation over high-relief regions, while a snowfall estimation scheme extends the product availability to higher latitudes [153].

5. Discussion

The measurement of precipitation at the mid-to-high latitudes poses many challenges, especially due to the differences in the meteorological regimes across the mid and high latitudes. Over the tropics, precipitation is governed primarily by the solar cycle, which provides the necessary energy and from high levels of water vapor due to higher air temperatures. The mid and high latitudes have less solar heating, less moisture due to lower temperatures and a lower and far more variable freezing level than in the tropics.
The differences in the physical characteristics of precipitation in these regions, together with the paucity of surface-based measurements, compound the problem when trying to provide measurements at higher latitudes. While satellites provide more observations over these higher latitudes, the variety of sensors is not necessarily ideal due to the different characteristics (resolution, frequencies, etc.), which requires further processing to ensure consistency between their observations.

5.1. Gaps and Challenges

Although the retrieval of precipitation at higher latitudes has many challenges, these can largely be identified as improving the identification and retrieval of shallow precipitation, the detection and quantification of frozen precipitation (falling snow) and orographic precipitation. Each of these particular challenges are discussed in more detail below.

5.1.1. Shallow Precipitation

At mid-to-high latitudes, shallow precipitation is particularly common (in terms of occurrence) over the oceans and windward coasts. Although shallow precipitation is generally of light intensity, the persistence of such precipitation means that, over many mid- to high-latitude regions, it provides a significant fraction of the annual precipitation accumulation. However, observing precipitation close to the surface is difficult. Ground-based radars need to elevate the radar beam above the surface to avoid ground clutter, causing the altitude of the observations to increase with the radar range. Satellite-based cloud/precipitation radars cannot provide useful observations in the lowest range bins close to the surface either [56,103]. While passive microwave observations provide generally good retrievals for precipitation in the tropics, shallow precipitation often provides little tangible signal when viewed against a variable surface background. The ongoing work [154,155,156] to try to match the observed vertical profiles of precipitation from satellite-based radars with surface precipitation are prone, by their nature, to encounter significant differences. Moreover, if the satellite radars do not observe precipitation above 1000 m, they will not retrieve any precipitation where shallow precipitation might exist [56]. The ability of the radars to observe shallow precipitation has an impact upon many PMW precipitation retrieval schemes since they are ‘calibrated’ by them. In the case of the GPROF, the DPR–GMI combined product is used to generate the primary a priori database. Surface radars are used to generate the a priori database for the GPROF over colder (ice-covered) regions, but this also cannot observe all shallow precipitation. Furthermore, in many cases, the DPR/CPR will observe the frozen precipitation layer (above the bright band), rather than the liquid precipitation, if it exists below 1000 m. Backscatter–precipitation relationships are very different for frozen/liquid precipitation. Milani et al. [157] showed that the brightness temperatures were mostly able to identify lake-effect shallow snowfall bands over the U.S. Great Lakes region, but the retrieval algorithms such as the GPROF were not able to convert this information into a reliable snowfall retrieval.

5.1.2. Detecting and Quantifying Falling Snow

The presence of snow on the ground and the physical properties of the snowpack can obscure the scattering signature of snowfall [158]. In particular, the snow depth, snow density and grain size of a snowpack on the surface complicates the retrieval of falling snow from passive microwave observations. Takbiri et al. [159] related the precipitation scattering signal to the snow water equivalent of the snow cover and the liquid water path of the atmosphere. They highlighted a blind spot for a snow cover water equivalent above 200 kg m−2 and a liquid water path greater than 100–150 g m−2 where the microwave scattering signal was completely masked by the high emissivity of the surface and the liquid water content in snow clouds. Vahedizade et al. [160] specifically extended the study of this PMW issue to snow-covered sea ice, proposing a retrieval algorithm to address this problem using an active–passive a priori database (CloudSat/GPM).
Snowfall retrievals are not only a challenge in terms of detection, but also for quantification. For active sensors, the reflectivity (Z)-to-snowfall-rate (S) relationship depends on the microphysical characteristics of the ice crystals. Some instruments on the ground, like the Precipitation Imaging Package (PIP), have demonstrated their ability to measure the snowfall rate and density, providing valuable information on the snowfall regime [161,162], albeit through visual identification and processing at a particular location. When combined with radars on the ground, such as the Micro Rain Radar (MRR), PIPs and rain gauges provide key information on the Z–S relationship that can then be used for weather radars or satellite radar retrievals. King et al. [163] calculated the Z–S relationships for several locations and snowfall regimes around the world and used them to train a deep neural network for snowfall retrievals, highlighting the importance to feed the model with a variety of examples to cover most of the precipitation regimes that happen globally.
Passive microwave retrievals from observations with frozen hydrometeors are much more complex than those from liquid particles. Liquid droplets tend to be spherical due to the surface tension of water, although as the drops fall the shape becomes flatter, particularly for the larger drops. In contrast, frozen hydrometers can take on a large range of different shapes due to the different mechanisms related to the growth of the ice crystals [164,165]. Moreover, a precipitation system, while containing primarily spherical water droplets, will contain a large number of ice crystals with various shapes and orientations.
In order to make sense of the MW radiative signal for retrievals and data assimilation, it is important to determine the scattering properties of the hydrometeors [166]. Liquid particles have been studied for a long time and they are fairly well understood and represented. However, the complexity of frozen hydrometeors still represents a challenge [167]. At mid–high latitudes, given the predominance of frozen precipitation, it is crucial to improve the representation of ice particles to correctly quantify the total precipitation, both locally and globally. Several scattering methods have been developed over the years, but many of them have begun to show limitations at high frequencies and for large complex hydrometeors [168]. In order to ensure that the physical properties of the modeled particles match the ones observed in in situ observations, the simulation tools need to handle very complex and computationally expensive structures [169,170,171,172,173]. Once all these tools are put together, the precipitation retrieval algorithms still need to face the issue of choosing the correct ensemble of snow particles for the observed snowfall event or a good compromise of particle types and characteristics when applied on a global scale. A crucial step is the correct representation of the crystal habits (or ensemble of habits) within a satellite footprint. Much of work still needs to be done to create a comprehensive database of scattering properties for melting and rimed particles [174,175,176,177], especially for relating the highly variable population of individual ice crystals to the scale of the satellite observation.

5.1.3. Orographic Precipitation

The complexity of mountain regions introduces an additional layer of uncertainties in precipitation retrievals, primarily due to a greater mix of precipitation types at higher altitudes and higher latitudes. Although the mechanisms of orographic precipitation enhancement are well known, quantifying precipitation in complex terrain is still affected by biases and errors due to the complex spatial and temporal variability of the precipitation microphysics [178] as well as the heterogeneity of the terrain within the field of view of a satellite observation. The increased transport of moisture from the tropics towards higher latitudes and the interaction with orographic terrain often leads to extreme precipitation events that need to be accurately quantified to assess the risks for the populations and infrastructures downstream. From a ground base perspective, it is difficult to capture the very high spatial variability of precipitation systems across varying reliefs. Instruments such as rain gauges that require access for maintenance and data collection are often located in the more accessible regions, such as valleys with higher, more inaccessible locations that are sparsely covered. Surface-based radars are affected by beam blocking and surface clutter caused by the terrain, requiring them to be situated on high ground and leading to radar overshooting or poorly detected low-level precipitation [179,180]. Several attempts to correct radar underestimation in complex terrain have been conducted in the past few years [155,178,181,182].
Satellites have the potential to overcome some of the issues encountered by ground-based instruments and potentially improve the quantification of precipitation over complex terrain. However, they also bring with them other intrinsic biases and errors [183]. When considering satellite radars, bright band detection ambiguity and non-uniform beam filling can lead to errors in light precipitation quantification [184]. Another source of error in satellite radar observations is the so-called ‘dark band’, due to attenuation in the melting layer that is comparable to the attenuation in the underneath liquid layer for radars operating at higher frequencies (e.g., W-band 94 GHz; [185]). While multiple scattering of microwave radiation dominates mesoscale convective systems, leading to an overestimation of the precipitation intensity [184,186,187,188], this may also occur within the precipitation systems over mountainous regions where multi-layered precipitation takes place. The ground clutter issue affecting spaceborne radars is more pronounced over complex terrain due to the variation in the surface elevation within a single field of view of the satellite sensor. Corrections are necessary to avoid an overestimation of precipitation due to ground clutter generating high reflectivity [119,189]. However, these corrections often eliminate the information contained in the lower extent of the observable vertical profile, unless other sources of information are considered [190,191]. IR and PMW, with their global satellite precipitation products, have also helped further the understanding of precipitation over complex terrain. Several evaluation exercises have been conducted to assess the quality of multi-sensor precipitation products, such as the IMERG, GSMaP or CMORPH, among others [183,192,193,194]. Satellite precipitation estimates over mountain regions are typically associated with underestimation during heavy precipitation events [183]. The use of PMW observations for detecting and quantifying precipitation, especially during the cold season and over complex terrain, remains a challenge.

5.2. Challenges Mitigation Strategies

To address these issues, considerable effort had been expended into detailing the sources of errors and uncertainties in precipitation measurements at higher latitudes to improve the representation of precipitation. These can be broadly grouped into two categories; first, improving our knowledge and understanding of the fundamentals of precipitation through precise, fine-scale measurements as gathered from well-defined field campaigns, and second, through the development and deployment of new more capable satellite sensors that can better identify and quantify precipitation.

5.2.1. Field Campaigns

To help resolve many of these challenges and improve our knowledge in the gaps of our understanding, many field campaigns have been devised to provide coordinated surface, airborne and satellite observations and measurements. Ultimately, these field campaigns aim to improve the understanding of the micro- and macro-scale physical processes driving the precipitation events observed by satellites [5]. To address the open challenges, a number of ground/airborne field/validation campaigns have been organized. The GPM mission, before and after launch, organized a series of specific campaigns to collect in situ, ground-based radar, and aircraft data for creating improved a priori databases for the precipitation algorithms, training or ground validation datasets. Airborne measurements usually include a set of observations using radars (W-, Ka- Ku-, X-band frequencies) and PMW radiometer data, traditionally covering the 10 to 183 GHz range but now extended to 684 GHz with the new configuration of the Configurable Scanning Submillimeter-wave Instrument/Radiometer (CoSSIR). The microphysical data are collected using probes that measure a range of particles from aerosols to large hydrometeors directly in the clouds. Other ground-based data include radars (NASA S-band Dual Polarimetric Radar (NPOL), Dual-frequency Dual-polarized Doppler Radar (D3R), MRR, etc.), rain and snow gauges, disdrometers, radiosondes, PIPs and snow video imagers.
Several campaigns have been dedicated to high-latitude and cold-season precipitation to provide a better understanding of snowfall and shallow and light precipitation. The Light Precipitation Validation Experiment (LPVEx) [195,196] was dedicated to high-latitude cold precipitation over ocean and land surfaces and took place over the Helsinki testbed region. The LPVEx provided a quantitative assessment of the detection characteristics of precipitation from satellite-based rainfall sensors in shallow freezing level environments and helped assess the uncertainties in the rainfall intensity estimates. The measurements also provided an archive of high-quality microphysics and rainfall intensity measurements of the high-latitude precipitation systems to improve the underlying assumptions in the satellite rainfall algorithms and facilitate the development of algorithms for future sensors. The GPM Cold Season Precipitation Experiment (GCPEx) [197], held north of Toronto, Canada, tackled cold-season mid-latitude synoptic and lake-effect snowfall systems. A total of 25 lake-effect snowfall events were detected during the campaign between February and March 2012, allowing for the collection of the snowfall regime microphysics characteristics and relating them to the satellite observations and model simulations.
To investigate the cold-season precipitating systems, this time over orographically complex terrain, the Olympic Mountains Experiment (OLYMPEX) [198,199] was conducted. Cold-season orographic and oceanic rainfall and snowfall were measured during the winter season from 2015–2016 over the Olympic Peninsula on the West coast of the United States. The physical and hydrological ground validation was provided for the GPM mission, specifically to study how the mid-latitude frontal systems interacted with a coastal mountain area. Other field campaigns have been conducted specifically to study orographic precipitation, not only cold-season precipitation. These campaigns included, for example, the Integrated Precipitation and Hydrology Experiment (IPHEx) [200,201], which investigated warm-season orographic precipitation and performed hydrologic validation over the Southern Appalachians, and the Monsoon Himalaya Orographic Precipitation Experiment (MHOPrEx) [202], which studied the nocturnal maximum in rainfall during monsoons.
The most recent NASA field campaign dedicated to frozen precipitation, completed in March 2023, was the Investigation of Microphysics and Precipitation for Atlantic Coast-Threatening Snowstorms (IMPACTS) [203], which investigated wintertime snowstorms on the East Coast of the United States. The goals of the IMPACTS were to characterize the spatial and temporal scales and structures of snow bands, understand their dynamical, thermodynamical, and microphysical processes and apply this understanding to improve remote sensing and modeling of snowfall. The IMPACTS data have already been widely used by scientists in extracting key information that will help improve remote sensing algorithms of precipitation and atmospheric components, including the ice water path, liquid water path and electric fields [204,205,206].

5.2.2. New Satellite Observations

Observations from recently available satellite sensors are being exploited to improve our knowledge and understanding of precipitation characteristics at higher latitudes. Building upon previous research, Heuscher et al. [74] explored the physical relationship between lightning and precipitation in mid–high latitudes using the GLM and GPM observations. They found that while the (PMW) brightness temperature characteristics of the electrically active convective precipitation features were largely insensitive to the synoptic-scale proxies of convective strength and organization, they were highly correlated to the radar-derived ice mass. The low-flash-density convective precipitation features (cPFs) tended to be more sensitive to synoptic-scale instability and shear than the high-flash-density cPFs. More importantly, they found that the lightning–precipitation relationships derived over tropical regions were maintained at the mid–high latitudes, although regional nuances were found for deep convection. The mid–high-latitude convection was characterized by colder, 30 dBZ echo top heights (indicating stronger updrafts) and a smaller range of microwave brightness temperatures when compared to the tropics.
The development of new satellite observing systems with precipitation capabilities is constantly evolving and incorporating new technologies. Significant progress has been made in the development of passive microwave sensors for use on smallsats and cubesats. The ability to develop and fly these smaller satellites, with lower associated costs, will help address the issue of temporal sampling, which greatly impacts the estimation of satellite-derived precipitation on a sub-daily to multi-day basis. Cubesats in LEO, such as the TROPICS mission [207], are currently in operation and have the potential to provide useful precipitation estimates [208]. The TROPICS mission currently consists of a pathfinder mission, launched in June 2021 into a polar orbit, together with four cubesats launched into low-inclination orbits in May 2023. For mid-to-high-latitude precipitation retrievals, the pathfinder mission is of particular interest, especially since the TROPICS Millimeter-wave Sounder (TMS) carries the first PMW sensor with a frequency above 183.31 GHz (204.8 GHz). Precipitation retrieval schemes for the TROPICS mission are currently being developed and validated, and early investigations show that the 204.8 GHz channel is particularly useful for separating falling snow from snow on the ground. The details of the usefulness of these microwave and sub-mm wave sensors can be found in Accadia et al. [209]. The development of these cubesat/smallsat technologies is ongoing and these new systems are being exploited by some commercial entities, such as tomorrow.io, which will launch and operate constellations of smallsat/cubesats with the aim of improving near real-time weather forecasting and monitoring.
The EUMETSAT European Polar Systems Second Generation (EPS-SG) series of satellites will be launched shortly [210,211], building upon the success of the current operational MetOp series. These satellites will carry several passive microwave sensors, a microwave sounder (MWS) operating at 23.8–229 GHz, a microwave imager (MWI) operating at 18.7–183.31 GHz and the Ice Cloud Imager (ICI) operating at 183.31–664 GHz. The addition of the high-frequency channels will greatly enhance the ability to delineate the precipitation features at higher latitudes. The observations from the EPS-SG will complement those provided by the current operational NOAA JPSS program. In addition, the Arctic Weather Satellite (AWS, or EPS-Sterna) is a prototype microsatellite mission for an operational constellation of microwave sounders [212] that carries a cross-track scanning radiometer operating in the 54, 89, 183 and 325 GHz bands. The proposed AWS constellation would complement the existing meteorological sounders, providing better temporal coverage over the polar regions. NOAA is also planning a QuickSounder mission that will carry an ATMS sensor on a small satellite, complementing the larger JPSS satellites. Another mission of interest is the Earth Cloud Aerosol and Radiation Explorer (EarthCARE, [213]), an ESA/JAXA mission to explore the effect of clouds and aerosols on solar radiation. The satellite is planned to launch in 2024 and will include a Cloud Profiling Radar (CPR), operating at a 94 GHz W-band with Doppler capabilities.
In 2018, the U.S. National Academies of Sciences published the 2017–2027 Decadal Survey for Earth Science and Applications from Space [214], which included two “targeted observable” recommendations for “clouds, convection and precipitation (CCP)” and “aerosols”. Since the publication of the survey, the former recommendation has been developed into the Atmosphere Observing System (AOS), which aims to study and improve our knowledge and understanding of the precipitation processes and the impact of aerosols on those processes. While the final mission architecture is currently being refined, the system is likely to be an international multi-satellite/sensor mission with passive microwave sounders, cloud profiling and precipitation radars and profiling lidars [215]. A full discussion on the future of these precipitation sensors may be found in Kummerow et al. [216].
While the current operational geostationary systems have provided frequent observations based on their equatorial positions, higher latitudes suffer from poor spatial coverage. However, the Russian Arctica satellites, such as the hydrometeorological satellite Arctica-M N1 that launched on 28 Feb 2021 [217], are placed in a highly elliptical Molniya orbit. This orbit provides quasi-geostationary-like imagery over the northern higher latitudes while the satellite is over the pole. At the furthest extent of the orbit, the satellite travels relatively slower, allowing it to provide frequent imagery. Any changes in position due to its constant movement and subsequent geo-registration is relatively simple to compute. However, since the satellite is continuously moving, typically three satellites are required to ensure continuous coverage.

6. Conclusions

Providing precipitation measurements at the mid-to-high latitudes is a challenge. Fundamentally, the characteristics of precipitation in these regions, in terms of the occurrence, intensity and (water/ice) phase, together with the characteristics of the meteorological systems in which precipitation forms, are very varied. Conventional measurements, particularly at high latitudes, tend to be sparse. Due to the limited accessibility and where the measurements are made, the accuracy is often comprised by the measuring instrument. Providing measurements from satellite observations is as difficult. Passive microwave observations provide the main source of observations for generating precipitation retrievals, especially due to a reasonable precipitation-to-observation relationship. The characteristics of the observed precipitation are very variable. Over the tropics, a classical convective model is often used with distinct liquid and solid phases, but at higher latitudes, the range and combination of the liquid/ice phases is much less distinct. Nevertheless, significant progress in our knowledge and understanding of precipitation at these higher latitudes has been gained from missions such as the GPM and CloudSat which will, no doubt, be the focus of future missions, such as the EPS-Sterna and EPS-SG.
The key drivers for improving precipitation retrievals focus on a better appreciation and understanding of the observation of precipitation at mid-to-high latitudes rather than applying tropics-based schemes over these regions. In addition, better surface observations are needed, not only to provide accurate at-surface measurements but also for the calibration/validation of the satellite products. It is important to note that such measurements need to reach the surface to better represent the shallow and multi-phase precipitation systems. Ultimately, such improvements will likely need a combination of observing systems to properly resolve such measurements, whether through improved satellite radar systems, surface radar, vertically pointing radars or conventional gauge/particle-size measurements.

Author Contributions

Both authors have equally contributed to the writing, review and editing of the original draft. All authors have read and agreed to the published version of the manuscript.

Funding

This study was supported by NASA grant 80NSSC23M0011.

Institutional Review Board Statement

Not applicable.

Informed Consent Statement

Not applicable.

Data Availability Statement

Not applicable.

Conflicts of Interest

The authors declare no conflict of interest.

Acronyms

ABIAdvanced Baseline Imager
AMeDASAutomated Meteorological Data Acquisition System
AMSR-EAdvanced Microwave Scanning Radiometer-Earth Observing System
AMSR2Advanced Microwave Scanning Radiometer—2
AMWActive Microwave
AOSAtmosphere Observing System
ATLIDAtmospheric Lidar
ATMSAdvanced Technology Microwave Sounder
AWSArctic Weather Satellite
BBRBroadband Radiometer
CCPClouds Convection and Precipitation
CMAPClimate Prediction Center Merged Analysis of Precipitation
CMORPHCPC Morphing Technique
CORRACombined Radar–Radiometer Algorithm
CoSSIRConfigurable Scanning Submillimeter-wave Instrument/Radiometer
COWVRCompact Ocean Wind Vector Radiometer
cPFconvective Precipitation Features
CPRCloud Profiling Radar
CSACanadian Space Agency
D3DDual-frequency Dual-polarized Doppler Radar
DMSPDoD Meteorological Satellite Program
DoDDepartment of Defense
DPRDual-frequency Precipitation Radar
DSDDrop Size Distribution
EarthCAREEarth Cloud Aerosol and Radiation Explorer
ECMWFEuropean Center for Medium-range Weather Forecast
EPS-SGEuropean Polar System—Second Generation
ESAEuropean Space Agency
EUMETSATEuropean Organisation for the Exploitation of Meteorological Satellites
FCIFlexible Combined Imager
FYFeng Yun
GCOMGlobal Change Observation Mission
GCOMW1GCOM Water 1
GCPExGPM Cold Season Precipitation Experiment
GEOGeostationary
GLMGeostationary Lightning Mapper
GMIGPM Microwave Imager
GPCPGlobal Precipitation and Climatology Project
GPMGlobal Precipitation Measurement
GPM-COGPM Core Observatory
GPROFGoddard Profiling Algorithm
GRACEGravity Recovery and Climate Experiment
GSMaPGlobal Satellite Mapping of Precipitation
GTSGlobal Telecommunication System
ICIIce Cloud Imager
IMERGIntegrated Multi-satellite Retrieval for GPM
IMPACTSInvestigation of Microphysics and Precipitation for Atlantic Coast-Threatening Snowstorms
IPHExIntegrated Precipitation and Hydrology Experiment
IRInfrared
IWPIce Water Path
JAXAJapan Aerospace Exploration Agency
JMAJapan Meteorological Agency
JPSSJoint Polar Satellite System
LEOLow Earth Orbiting
LMLightning Mapper
LPVExLight Precipitation Validation Experiment
MetOpMeteorological Operational
MHOPrExMonsoon Himalaya Orographic Precipitation Experiment
MHSMicrowave Humidity Sounder
MITMassachusetts Institute of Technology
MRMSMulti-Radar Multi-Sensor
MRRMicro Rain Radar
MSIMulti-spectral Imager
MTGMeteosat Third Generation
MWIMicrowave Imager
MWSMicrowave Sounder
NASANational Aeronautics Space Administration
NOAANational Oceanic and Atmospheric Administration
NPOL NASAS-band Dual Polarimetric Radar
OLYMPEXOlympic Mountains Experiment
OPERAOperational Programme for the Exchange of Weather Radar Information
PIAPath-Integrated Attenuation
PIPPrecipitation Imaging Package
PMWPassive Microwave
PPSPrecipitation Processing System
PRPrecipitation Radar
QPEQuantitative Precipitation Estimation
SAPHIRSondeur Atmospherique du Profil d’Humidite Intertropicale par Radiometrie
SMMRScanning Multichannel Microwave Radiometer
SPEIStandardized Precipitation and Evapotranspiration Index
SSM/ISpecial Sensor Microwave/Imager
SSMISSpecial Sensor Microwave Imager Sounder
STP-H8Space Test Program—Houston 8
SWPSnow Water Path
TEMPEST-H8Temporal Experiment for Storms and Tropical Systems Technology—Houston 8
TMITRMM Microwave Imager
TMSTROPICS Millimeter-wave Sounder
TPWTotal Precipitable Water
TRMMTropical Rainfall Measuring Mission
TROPICSTime-Resolved Observations of Precipitation Structure and Storm Intensity with a Constellation of Smallsats
VIIRSVisible Infrared Imager Radiometer Suit
VisVisible
WMOWorld Meteorological Organization
XCAL GPMIntersatellite Calibration Working Group

References

  1. Kidd, C.; Becker, A.; Huffman, G.J.; Muller, C.L.; Joe, P.; Skofronick-Jackson, G.; Kirschbaum, D.B. So, how much of the Earth’s surface is covered by rain gauges? Bull. Am. Meteorol. Soc. 2017, 98, 69–78. [Google Scholar] [CrossRef]
  2. Council, N.R. Earth System Science; National Academies Press: Washington, DC, USA, 1988; ISBN 978-0-309-31866-2. [Google Scholar]
  3. Implementation plan for the Global Observing System for Climate in Support of the UNFCCC. Available online: https://library.wmo.int/records/item/58703-implementation-plan-for-the-global-observing-system-for-climate-in-support-of-the-unfccc (accessed on 1 September 2023).
  4. Skofronick-Jackson, G.; Petersen, W.A.; Berg, W.; Kidd, C.; Stocker, E.F.; Kirschbaum, D.B.; Kakar, R.; Braun, S.A.; Huffman, G.J.; Iguchi, T.; et al. The global precipitation measurement (GPM) mission for science and Society. Bull. Am. Meteorol. Soc. 2017, 98, 1679–1695. [Google Scholar] [CrossRef] [PubMed]
  5. Kidd, C.; Takayabu, Y.N.; Skofronick-Jackson, G.M.; Huffman, G.J.; Braun, S.A.; Kubota, T.; Turk, F.J. The Global Precipitation Measurement (GPM) Mission. In Satellite Precipitation Measurement; Advances in Global Change Research; Springer: Cham, Switzerland, 2020; Volume 67, pp. 3–23. [Google Scholar]
  6. Kidd, C.; Levizzani, V.; Laviola, S. Quantitative Precipitation Estimation from Earth Observation Satellites. Rainfall State Sci. 2013, 191, 127–158. [Google Scholar] [CrossRef]
  7. Levizzani, V.; Laviola, S.; Cattani, E. Detection and Measurement of Snowfall from Space. Remote Sens. 2011, 3, 145–166. [Google Scholar] [CrossRef]
  8. Prigent, C. Precipitation retrieval from space: An overview. Comptes Rendus Geosci. 2010, 342, 380–389. [Google Scholar] [CrossRef]
  9. Routson, C.C.; McKay, N.P.; Kaufman, D.S.; Erb, M.P.; Goosse, H.; Shuman, B.N.; Rodysill, J.R.; Ault, T. Mid-latitude net precipitation decreased with Arctic warming during the Holocene. Nature 2019, 568, 83–87. [Google Scholar] [CrossRef]
  10. Hénin, R.; Ramos, A.M.; Schemm, S.; Gouveia, C.M.; Liberato, M.L.R. Assigning precipitation to mid-latitudes fronts on sub-daily scales in the North Atlantic and European sector: Climatology and trends. Int. J. Climatol. 2019, 39, 317–330. [Google Scholar] [CrossRef]
  11. ESA 2004. EGPM—European Contribution to Global Precipitation Measurement, ESA SP-1279(5). ESA: Noordwijk, The Netherlands. Available online: https://esamultimedia.esa.int/docs/SP_1279_5_EGPM.pdf (accessed on 6 November 2023).
  12. Lu, M.; Hao, X. Diagnosis of the Tropical Moisture Exports to the Mid-Latitudes and the Role of Atmospheric Steering in the Extreme Precipitation. Atmosphere 2017, 8, 256. [Google Scholar] [CrossRef]
  13. Yoshimori, M.; Abe-Ouchi, A.; Tatebe, H.; Nozawa, T.; Oka, A. The Importance of Ocean Dynamical Feedback for Understanding the Impact of Mid–High-Latitude Warming on Tropical Precipitation Change. J. Clim. 2018, 31, 2417–2434. [Google Scholar] [CrossRef]
  14. Waliser, D.; Guan, B. Extreme winds and precipitation during landfall of atmospheric rivers. Nat. Geosci. 2017, 10, 179–183. [Google Scholar] [CrossRef]
  15. Doiteau, B.; Dournaux, M.; Montoux, N.; Baray, J.L. Atmospheric rivers and associated precipitation over france and western europe: 1980–2020 climatology and case study. Atmosphere 2021, 12, 1075. [Google Scholar] [CrossRef]
  16. Mateling, M.E.; Pettersen, C.; Kulie, M.S.; Mattingly, K.S.; Henderson, S.A.; L’Ecuyer, T.S. The Influence of Atmospheric Rivers on Cold-Season Precipitation in the Upper Great Lakes Region. J. Geophys. Res. Atmos. 2021, 126, e2021JD034754. [Google Scholar] [CrossRef]
  17. Mattingly, K.S.; Mote, T.L.; Fettweis, X.; As, D.V.A.N.; Tricht, K.V.A.N.; Lhermitte, S.; Pettersen, C.; Fausto, R.S. Strong summer atmospheric rivers trigger Greenland ice sheet melt through spatially varying surface energy balance and cloud regimes. J. Clim. 2020, 33, 6809–6832. [Google Scholar] [CrossRef]
  18. Saeed, S.; Almazroui, M. Impacts of mid-latitude circulation on winter precipitation over the Arabian Peninsula. Clim. Dyn. 2019, 53, 5253–5264. [Google Scholar] [CrossRef]
  19. Suriano, Z.J.; Wortman, R.D. Temporal trends in snowfall contribution induced by lake-effect synoptic types. Phys. Geogr. 2021, 42, 416–433. [Google Scholar] [CrossRef]
  20. Takeuchi, Y.; Endo, Y.; Murakami, S. High correlation between winter precipitation and air temperature in heavy-snowfall areas in Japan. Ann. Glaciol. 2008, 49, 7–10. [Google Scholar] [CrossRef]
  21. Kuhn, M. The Antarctic—The World’s Largest Desert—The Special Circumstances of the Antarctic Climate. Umshau Wiss. Tecknik 1980, 80, 675–681. [Google Scholar]
  22. Beniston, M.; Farinotti, D.; Stoffel, M.; Andreassen, L.M.; Coppola, E.; Eckert, N.; Fantini, A.; Giacona, F.; Hauck, C.; Huss, M.; et al. The European mountain cryosphere: A review of its current state, trends, and future challenges. Cryosphere 2018, 12, 759–794. [Google Scholar] [CrossRef]
  23. Barnett, T.P.; Adam, J.C.; Lettenmaier, D.P. Potential impacts of a warming climate on water availability in snow-dominated regions. Nature 2005, 438, 303–309. [Google Scholar] [CrossRef]
  24. Mangeruca, A.; Ferrari, G.; Garinei, A.; Cisco, L.; Sozzi, M.; Marconi, M.; Crespi, M.; Chini, A.; Piccioni, E.; Bavera, D.; et al. Snow water equivalent (SWE) measurements for better management of water resources to reduce drought risk. In Proceedings of the 2022 IEEE Workshop on Metrology for Agriculture and Forestry, MetroAgriFor, Perugia, Italy, 3–5 November 2022; pp. 307–312. [Google Scholar]
  25. Howat, I.M.; Tulaczyk, S.; Rhodes, P.; Israel, K.; Snyder, M. A precipitation-dominated, mid-latitude glacier system: Mount Shasta, California. Clim. Dyn. 2007, 28, 85–98. [Google Scholar] [CrossRef]
  26. Adams, N. Precipitation forecasting at high latitudes. Weather Forecast. 2004, 19, 456–472. [Google Scholar] [CrossRef]
  27. Davy, R.; Griewank, P. Arctic amplification has already peaked. Environ. Res. Lett. 2023, 18, 084003. [Google Scholar] [CrossRef]
  28. Yang, Y.-M.; Park, J.-H.; An, S.-I.; Wang, B.; Luo, X. Mean sea surface temperature changes influence ENSO-related precipitation changes in the mid-latitudes. Nat. Commun. 2021, 12, 1495. [Google Scholar] [CrossRef] [PubMed]
  29. Karagiannidis, A.F.; Karacostas, T.; Maheras, P.; Makrogiannis, T. Climatological aspects of extreme precipitation in Europe, related to mid-latitude cyclonic systems. Theor. Appl. Climatol. 2012, 107, 165–174. [Google Scholar] [CrossRef]
  30. Dukat, P.; Bednorz, E.; Ziemblińska, K.; Urbaniak, M. Trends in drought occurrence and severity at mid-latitude European stations (1951–2015) estimated using standardized precipitation (SPI) and precipitation and evapotranspiration (SPEI) indices. Meteorol. Atmos. Phys. 2022, 134, 20. [Google Scholar] [CrossRef]
  31. Osborne, J.M.; Lambert, F.H. The missing aerosol response in twentieth-century mid-latitude precipitation observations. Nat. Clim. Chang. 2014, 4, 374–378. [Google Scholar] [CrossRef]
  32. Wan, H.; Zhang, X.; Zwiers, F.; Min, S.-K. Attributing northern high-latitude precipitation change over the period 1966–2005 to human influence. Clim. Dyn. 2015, 45, 1713–1726. [Google Scholar] [CrossRef]
  33. Min, S.-K.; Zhang, X.; Zwiers, F. Human-Induced Arctic Moistening. Science 2008, 320, 518–520. [Google Scholar] [CrossRef]
  34. Mölders, N.; Olson, M.A. Impact of Urban Effects on Precipitation in High Latitudes. J. Hydrometeorol. 2004, 5, 409–429. [Google Scholar] [CrossRef]
  35. Poujol, B.; Mooney, P.A.; Sobolowski, S.P. Physical processes driving intensification of future precipitation in the mid- to high latitudes. Environ. Res. Lett. 2021, 16, 034051. [Google Scholar] [CrossRef]
  36. Hagemann, S.; Blome, T.; Ekici, A.; Beer, C. Soil-frost-enabled soil-moisture-precipitation feedback over northern high latitudes. Earth Syst. Dyn. 2016, 7, 611–625. [Google Scholar] [CrossRef]
  37. Strangeways, I. Measuring the Natural Environment, 2nd ed.; Cambridge University Press: Cambridge, UK, 2003. [Google Scholar]
  38. Duchon, C.E.; Essenberg, G.R. Comparative rainfall observations from pit and aboveground rain gauges with and without wind shields. Water Resour. Res. 2001, 37, 3253–3263. [Google Scholar] [CrossRef]
  39. Goodison, B.; Louie, P.Y.T.; Yang, D. WMO solid precipitation measurement intercomparison, Instruments and Observing Methods Rep. 67 (WMO/TD 872). Final Rep. 1998, 67, 318. [Google Scholar]
  40. Nitu, R.; Wong, K. CIMO Survey On National Summaries Of Methods And Instruments For Solid Precipitation Measurement At Automatic Weather Stations; Instruments and Observing Methods Report No. 102; WMO: Geneva, Switzerland, 2010; 57p. [Google Scholar]
  41. Vuerich, E.; Monesi, C.; Lanza, L.G.; Stagi, L.; Lanzinger, E. WMO Field Intercomparison of Rainfall Intensity Gauges; Instruments and Observing Methods Report No. 99; WMO: Geneva, Switzerland, 2009; 290p. [Google Scholar]
  42. Sugiura, K.; Ohata, T.; Yang, D. Catch characteristics of precipitation gauges in high-latitude regions with high winds. J. Hydrometeorol. 2006, 7, 984–994. [Google Scholar] [CrossRef]
  43. Swenson, S. Assessing High-Latitude Winter Precipitation from Global Precipitation Analyses Using GRACE. J. Hydrometeorol. 2010, 11, 405–420. [Google Scholar] [CrossRef]
  44. Huuskonen, A.; Saltikoff, E.; Holleman, I. The operational weather radar network in Europe. Bull. Am. Meteorol. Soc. 2014, 95, 897–907. [Google Scholar] [CrossRef]
  45. Saltikoff, E.; Haase, G.; Delobbe, L.; Gaussiat, N.; Martet, M.; Idziorek, D.; Leijnse, H.; Novák, P.; Lukach, M.; Stephan, K. OPERA the Radar Project. Atmosphere 2019, 10, 320. [Google Scholar] [CrossRef]
  46. Zhang, J.; Howard, K.; Langston, C.; Kaney, B.; Qi, Y.; Tang, L.; Grams, H.; Wang, Y.; Cockcks, S.; Martinaitis, S.; et al. Multi-Radar Multi-Sensor (MRMS) quantitative precipitation estimation: Initial operating capabilities. Bull. Am. Meteorol. Soc. 2016, 97, 621–638. [Google Scholar] [CrossRef]
  47. Shibuya, R.; Takayabu, Y.; Kamahori, H. Dynamics of widespread extreme precipitation events and the associated large-scale environment using AMeDAS and JRA-55 data. J. Clim. 2021, 34, 8955–8970. [Google Scholar] [CrossRef]
  48. Illingworth, A.J.; Blackman, T.M. The need to represent raindrop size spectra as normalized gamma distributions for the interpretation of polarization radar observations. J. Appl. Meteorol. 2002, 41, 286–297. [Google Scholar] [CrossRef]
  49. Overeem, A.; van den Besselaar, E.; van der Schrier, G.; Meirink, J.F.; van der Plas, E.; Leijnse, H. EURADCLIM: The European climatological high-resolution gauge-adjusted radar precipitation dataset. Earth Syst. Sci. Data 2023, 15, 1441–1464. [Google Scholar] [CrossRef]
  50. Vignal, B.; Krajewski, W.F. Large-Sample Evaluation of Two Methods to Correct Range-Dependent Error for WSR-88D Rainfall Estimates. J. Hydrometeorol. 2001, 2, 490–504. [Google Scholar] [CrossRef]
  51. Golbon-Haghighi, M.-H.; Zhang, G. Detection of Ground Clutter for Dual-Polarization Weather Radar Using a Novel 3D Discriminant Function. J. Atmos. Ocean. Technol. 2019, 36, 1285–1296. [Google Scholar] [CrossRef]
  52. Golbon-Haghighi, M.-H.; Zhang, G.; Li, Y.; Doviak, R. Detection of Ground Clutter from Weather Radar Using a Dual-Polarization and Dual-Scan Method. Atmosphere 2016, 7, 83. [Google Scholar] [CrossRef]
  53. Hu, X.; Ge, J.; Du, J.; Li, Q.; Huang, J.; Fu, Q. A robust low-level cloud and clutter discrimination method for ground-based millimeter-wavelength cloud radar. Atmos. Meas. Tech. 2021, 14, 1743–1759. [Google Scholar] [CrossRef]
  54. Qi, Y.; Zhang, J.; Zhang, P.; Cao, Q. VPR correction of bright band effects in radar QPEs using polarimetric radar observations. J. Geophys. Res. Atmos. 2013, 118, 3627–3633. [Google Scholar] [CrossRef]
  55. Ware, E.C. Corrections to Radar-Estimated Precipitation Using Observed Rain Gauge Data. Master’s Thesis, Cornell University, Ithaca, NY, USA, 2005; 86p. [Google Scholar]
  56. Kidd, C.; Graham, E.; Smyth, T.; Gill, M. Assessing the impact of light/shallow precipitation retrievals from satellite-based observations using surface radar and micro rain radar observations. Remote Sens. 2021, 13, 1708. [Google Scholar] [CrossRef]
  57. Ma, N.; Chen, Y.; Jia, Z.; Liu, L.; Ma, X.; Huang, Y. Analyses of DSD Vertical Evolution and Rain Variation Mechanism in Stratiform Cloud Cases Using Micro Rain Radar. Remote Sens. 2022, 14, 1655. [Google Scholar] [CrossRef]
  58. Overeem, A.; Leijnse, H.; Uijlenhoet, R. Country-wide rainfall maps from cellular communication networks. Proc. Natl. Acad. Sci. USA 2013, 110, 2741–2745. [Google Scholar] [CrossRef]
  59. Silver, M.; Karnieli, A.; Fredj, E. Improved Gridded Precipitation Data Derived from Microwave Link Attenuation. Remote Sens. 2021, 13, 2953. [Google Scholar] [CrossRef]
  60. Chwala, C.; Kunstmann, H. Commercial microwave link networks for rainfall observation: Assessment of the current status and future challenges. WIREs Water 2019, 6, e1337. [Google Scholar] [CrossRef]
  61. Ma, B.B.; Nystuen, J.A. Passive Acoustic Detection and Measurement of Rainfall at Sea. J. Atmos. Ocean. Technol. 2005, 22, 1225–1248. [Google Scholar] [CrossRef]
  62. Taylor, W.O.; Anagnostou, M.N.; Cerrai, D.; Anagnostou, E.N. Machine Learning Methods to Approximate Rainfall and Wind from Acoustic Underwater Measurements (February 2020). IEEE Trans. Geosci. Remote Sens. 2021, 59, 2810–2821. [Google Scholar] [CrossRef]
  63. Petty, G.W.; Tran, H.K. Seventy-Year Trends in Ship-Reported Oceanic Precipitation Frequency. Geophys. Res. Lett. 2023, 50, e2023GL104270. [Google Scholar] [CrossRef]
  64. Kidd, C.; Levizzani, V. Quantitative precipitation estimation from satellite observations. In Extreme Hydroclimatic Events and Multivariate Hazards in a Changing Environment: A Remote Sensing Approach; Maggioni, V., Massari, C., Eds.; Elsevier: Amsterdam, The Netherlands, 2019; pp. 3–39. ISBN 9780128148990. [Google Scholar]
  65. Kidd, C.; Huffman, G.; Maggioni, V.; Chambon, P.; Oki, R. The global satellite precipitation constellation current status and future requirements. Bull. Am. Meteorol. Soc. 2021, 102, E1844–E1861. [Google Scholar] [CrossRef]
  66. Kidd, C.; Levizzani, V. Status of satellite precipitation retrievals. Hydrol. Earth Syst. Sci. 2011, 15, 1109–1116. [Google Scholar] [CrossRef]
  67. Kidd, C.; Huffman, G. Global precipitation measurement. Meteorol. Appl. 2011, 18, 334–353. [Google Scholar] [CrossRef]
  68. Zou, C.-Z.; Zhou, L.; Lin, L.; Sun, N.; Chen, Y.; Flynn, L.E.; Zhang, B.; Cao, C.; Iturbide-Sanchez, F.; Beck, T.; et al. The Reprocessed Suomi NPP Satellite Observations. Remote Sens. 2020, 12, 2891. [Google Scholar] [CrossRef]
  69. Klaes, K.D.; Cohen, M.; Buhler, Y.; Schlussel, P.; Munro, R.; Luntama, J.P.; von Engeln, A.; Clerigh, E.O.; Bonekamp, H.; Ackermann, J.; et al. An introduction to the Eumetsat polar system. Bull. Am. Meteorol. Soc. 2007, 88, 1085–1096. [Google Scholar] [CrossRef]
  70. Righetti, P.L.; de Juana Gamo, J.M.; Sancho, F. Metop-C deployment and start of three-satellite operations. Aeronaut. J. 2020, 124, 902–916. [Google Scholar] [CrossRef]
  71. Jin, Y.Q.; Lu, N.; Lin, M. Advancement of chinese meteorological feng-yun (FY) and oceanic hai-yang (HY) satellite remote sensing. Proc. IEEE 2010, 98, 844–861. [Google Scholar] [CrossRef]
  72. Weng, F.; Ferraro, R.R.; Grody, N.C. Global precipitation estimations using Defense Meteorological Satellite Program F10 and F11 special sensor microwave imager data. J. Geophys. Res. 1994, 99, 14493. [Google Scholar] [CrossRef]
  73. Imaoka, K.; Kachi, M.; Fujii, H.; Murakami, H.; Hori, M.; Ono, A.; Igarashi, T.; Nakagawa, K.; Oki, T.; Honda, Y.; et al. Global change observation mission (GCOM) for monitoring carbon, water cycles, and climate change. Proc. IEEE 2010, 98, 717–734. [Google Scholar] [CrossRef]
  74. Heuscher, L.; Liu, C.; Gatlin, P.; Petersen, W.A. Relationship Between Lightning, Precipitation, and Environmental Characteristics at Mid-/High Latitudes From a GLM and GPM Perspective. J. Geophys. Res. Atmos. 2022, 127, e2022JD036894. [Google Scholar] [CrossRef]
  75. Holmlund, K.; Grandell, J.; Schmetz, J.; Stuhlmann, R.; Bojkov, B.; Munro, R.; Lekouara, M.; Coppens, D.; Viticchie, B.; August, T.; et al. Meteosat Third Generation (MTG): Continuation and Innovation of Observations from Geostationary Orbit. Bull. Am. Meteorol. Soc. 2021, 102, E990–E1015. [Google Scholar] [CrossRef]
  76. Elvidge, C.D.; Baugh, K.; Zhizhin, M.; Hsu, F.C.; Ghosh, T. VIIRS night-time lights. Int. J. Remote Sens. 2017, 38, 5860–5879. [Google Scholar] [CrossRef]
  77. Schmit, T.J.; Li, J.; Menzel, W.P. Advanced baseline imager (ABI) for future geostationary operational environmental satellites (GOES-R and beyond). In Applications with Weather Satellites, Proceedings of the Third International Asia-Pacific Environmental Remote Sensing Remote Sensing of the Atmosphere, Ocean, Environment, and Space, Hangzhou, China, 23–27 October 2002; Menzel, W.P., Zhang, W.-J., Le Marshall, J., Tokuno, M., Eds.; SPIE: Bellingham, WA, USA, 2003; Volume 4895, p. 111. [Google Scholar]
  78. Schmit, T.J.; Gunshor, M.M.; Menzel, W.P.; Gurka, J.J.; Li, J.; Bachmeier, A.S. Introducing the Next-Generation Advanced Baseline Imager on GOES-R. Bull. Am. Meteorol. Soc. 2005, 86, 1079–1096. [Google Scholar] [CrossRef]
  79. Bessho, K.; Date, K.; Hayashi, M.; Ikeda, A.; Imai, T.; Inoue, H.; Kumagai, Y.; Miyakawa, T.; Murata, H.; Ohno, T.; et al. An Introduction to Himawari-8/9—Japan’s New-Generation Geostationary Meteorological Satellites. J. Meteorol. Soc. Jpn. Ser. II 2016, 94, 151–183. [Google Scholar] [CrossRef]
  80. Njoku, E.; Stacey, J.; Barath, F. The Seasat scanning multichannel microwave radiometer (SMMR): Instrument description and performance. IEEE J. Ocean. Eng. 1980, 5, 100–115. [Google Scholar] [CrossRef]
  81. Colton, M.C.; Poe, G.A. Intersensor calibration of DMSP SSM/I’s: F-8 to F-14, 1987-1997. IEEE Trans. Geosci. Remote Sens. 1999, 37, 418–439. [Google Scholar] [CrossRef]
  82. Yan, B.; Weng, F. Intercalibration Between Special Sensor Microwave Imager/Sounder and Special Sensor Microwave Imager. IEEE Trans. Geosci. Remote Sens. 2008, 46, 984–995. [Google Scholar] [CrossRef]
  83. Sanò, P.; Casella, D.; Camplani, A.; D’Adderio, L.P.; Panegrossi, G. A Machine Learning Snowfall Retrieval Algorithm for ATMS. Remote Sens. 2022, 14, 1467. [Google Scholar] [CrossRef]
  84. Kummerow, C.; Barnes, W.; Kozu, T.; Shiue, J.; Simpson, J. The Tropical Rainfall Measuring Mission (TRMM) sensor package. J. Atmos. Ocean. Technol. 1998, 15, 809–817. [Google Scholar] [CrossRef]
  85. Kummerow, C.; Simpson, J.; Thiele, O.; Barnes, W.; Chang, A.T.C.; Stocker, E.; Adler, R.F.; Hou, A.; Kakar, R.; Wentz, F.; et al. The Status of the Tropical Rainfall Measuring Mission (TRMM) after Two Years in Orbit. J. Appl. Meteorol. 2000, 39, 1965–1982. [Google Scholar] [CrossRef]
  86. Hou, A.Y.; Kakar, R.K.; Neeck, S.; Azarbarzin, A.A.; Kummerow, C.D.; Kojima, M.; Oki, R.; Nakamura, K.; Iguchi, T. The global precipitation measurement mission. Bull. Am. Meteorol. Soc. 2014, 95, 701–722. [Google Scholar] [CrossRef]
  87. Iguchi, T.; Haddad, Z.S. Introduction to Radar Rain Retrieval Methods. Adv. Glob. Chang. Res. 2020, 67, 169–182. [Google Scholar]
  88. Iguchi, T. Dual-Frequency Precipitation Radar (DPR) on the Global Precipitation Measurement (GPM) Mission’s Core Observatory. In Advances in Global Change Research; Levizzani, V., Kidd, C., Kirschbaum, D.B., Kummerow, C.D., Nakamura, K., Turk, F.J., Eds.; Springer: Cham, Switzerland, 2020; Volume 67, pp. 183–192. [Google Scholar]
  89. Draper, D.W.; Newell, D.A.; Wentz, F.J.; Krimchansky, S.; Skofronick-Jackson, G.M. The Global Precipitation Measurement (GPM) microwave imager (GMI): Instrument overview and early on-orbit performance. IEEE J. Sel. Top. Appl. Earth Obs. Remote Sens. 2015, 8, 3452–3462. [Google Scholar] [CrossRef]
  90. Kidd, C.; Matsui, T.; Chern, J.; Mohr, K.; Kummerow, C.; Randel, D. Global precipitation estimates from cross-track passive microwave observations using a physically based retrieval scheme. J. Hydrometeorol. 2016, 17, 383–400. [Google Scholar] [CrossRef]
  91. Laviola, S.; Levizzani, V.; Cattani, E.; Kidd, C. The 183-WSL fast rain rate retrieval algorithm. Part II: Validation using ground radar measurements. Atmos. Res. 2013, 134, 77–86. [Google Scholar] [CrossRef]
  92. Kummerow, C.D. Introduction to Passive Microwave Retrieval Methods. In Satellite Precipitation Measurement; Advances in Global Change Research; Springer: Cham, Switzerland, 2020; Volume 67, pp. 123–140. [Google Scholar]
  93. Roca, R.; Dejus, M.; Chambon, P.; Cloché, S.; Capderou, M. The Megha-Tropiques Mission After Seven Years in Space. In Satellite Precipitation Measurement; Advances in Global Change Research; Springer: Cham, Switzerland, 2020; Volume 67, pp. 45–62. [Google Scholar]
  94. Aonashi, K.; Ferraro, R.R. Microwave Sensors, Imagers and Sounders. In Satellite Precipitation Measurement; Advances in Global Change Research; Springer: Cham, Switzerland, 2020; Volume 67, pp. 63–81. [Google Scholar]
  95. Battaglia, A.; Kollias, P.; Dhillon, R.; Roy, R.; Tanelli, S.; Lamer, K.; Grecu, M.; Lebsock, M.; Watters, D.; Mroz, K.; et al. Spaceborne Cloud and Precipitation Radars: Status, Challenges, and Ways Forward. Rev. Geophys. 2020, 58, e2019RG000686. [Google Scholar] [CrossRef]
  96. Stephens, G.L.; Vane, D.G.; Boain, R.J.; Mace, G.G.; Sassen, K.; Wang, Z.; Illingworth, A.J.; O’Connor, E.J.; Rossow, W.B.; Durden, S.L.; et al. The cloudsat mission and the A-Train: A new dimension of space-based observations of clouds and precipitation. Bull. Am. Meteorol. Soc. 2002, 83, 1771–1790. [Google Scholar] [CrossRef]
  97. Stephens, G.; Winker, D.; Pelon, J.; Trepte, C.; Vane, D.; Yuhas, C.; L’Ecuyer, T.; Lebsock, M. CloudSat and CALIPSO within the A-Train: Ten Years of Actively Observing the Earth System. Bull. Am. Meteorol. Soc. 2018, 99, 569–581. [Google Scholar] [CrossRef]
  98. L’Ecuyer, T.S.; Stephens, G.L. An estimation-based precipitation retrieval algorithm for attenuating radars. J. Appl. Meteorol. 2002, 41, 272–285. [Google Scholar] [CrossRef]
  99. Matrosov, S.Y. Modeling Backscatter Properties of Snowfall at Millimeter Wavelengths. J. Atmos. Sci. 2007, 64, 1727–1736. [Google Scholar] [CrossRef]
  100. Haynes, J.M.; L’Ecuyer, T.S.; Stephens, G.L.; Miller, S.D.; Mitrescu, C.; Wood, N.B.; Tanelli, S. Rainfall retrieval over the ocean with spaceborne W-band radar. J. Geophys. Res. Atmos. 2009, 114, D00A22. [Google Scholar] [CrossRef]
  101. Lebsock, M.D.; L’Ecuyer, T.S.; Wood, N.B.; Haynes, J.M.; Smalley, M.A. Status of the CloudSat Mission. In Advances in Global Change Research; Levizzani, V., Kidd, C., Kirschbaum, D.B., Kummerow, C.D., Nakamura, K., Turk, F.J., Eds.; Springer: Cham, Switzerland, 2020; Volume 67, pp. 25–43. [Google Scholar]
  102. Kollias, P.; Clothiaux, E.E.; Miller, M.A.; Albrecht, B.A.; Stephens, G.L.; Ackerman, T.P. Millimeter-Wavelength Radars: New Frontier in Atmospheric Cloud and Precipitation Research. Bull. Am. Meteorol. Soc. 2007, 88, 1608–1624. [Google Scholar] [CrossRef]
  103. Skofronick-Jackson, G.; Kulie, M.; Milani, L.; Munchak, S.J.; Wood, N.B.; Levizzani, V. Satellite estimation of falling snow: A global precipitation measurement (GPM) core observatory perspective. J. Appl. Meteorol. Climatol. 2019, 58, 1429–1448. [Google Scholar] [CrossRef]
  104. Kroodsma, R.A.; McKague, D.S.; Ruf, C.S. Vicarious Cold Calibration for Conical Scanning Microwave Imagers. IEEE Trans. Geosci. Remote Sens. 2017, 55, 816–827. [Google Scholar] [CrossRef]
  105. Berg, W.; Bilanow, S.; Chen, R.; Datta, S.; Draper, D.; Ebrahimi, H.; Farrar, S.; Jones, W.L.; Kroodsma, R.; McKague, D.; et al. Intercalibration of the GPM Microwave Radiometer Constellation. J. Atmos. Ocean. Technol. 2016, 33, 2639–2654. [Google Scholar] [CrossRef]
  106. Kummerow, C.; Hong, Y.; Olson, W.S.; Yang, S.; Adler, R.F.; McCollum, J.; Ferraro, R.; Petty, G.; Shin, D.B.; Wilheit, T.T. The evolution of the Goddard profiling algorithm (GPROF) for rainfall estimation from passive microwave sensors. J. Appl. Meteorol. 2001, 40, 1801–1820. [Google Scholar] [CrossRef]
  107. Kummerow, C.D.; Randel, D.L.; Kulie, M.; Wang, N.Y.; Ferraro, R.; Joseph Munchak, S.; Petkovic, V. The evolution of the goddard profiling algorithm to a fully parametric scheme. J. Atmos. Ocean. Technol. 2015, 32, 2265–2280. [Google Scholar] [CrossRef]
  108. Randel, D.L.; Kummerow, C.D.; Ringerud, S. The Goddard Profiling (GPROF) Precipitation Retrieval Algorithm. In Advances in Global Change Research; Levizzani, V., Kidd, C., Kirschbaum, D.B., Kummerow, C.D., Nakamura, K., Turk, F.J., Eds.; Springer: Cham, Switzerland, 2020; Volume 67, pp. 141–152. [Google Scholar]
  109. Masaki, T.; Kubota, T.; Oki, R.; Furukawa, K.; Kojima, M.; Miura, T.; Iguchi, T.; Hanado, H.; Kai, H.; Yoshida, N.; et al. Current status of GPM/DPR level 1 algorithm development and DPR calibration. In Proceedings of the 2015 IEEE International Geoscience and Remote Sensing Symposium (IGARSS), Milan, Italy, 26–31 July 2015; pp. 2615–2618. [Google Scholar]
  110. Seto, S.; Iguchi, T.; Shimozuma, T.; Hayashi, S. NUBF correction methods for the GPM/DPR level-2 algorithms. In Proceedings of the 2015 IEEE International Geoscience and Remote Sensing Symposium (IGARSS), Milan, Italy, 26–31 July 2015; pp. 2612–2614. [Google Scholar]
  111. Grecu, M.; Olson, W.S.; Munchak, S.J.; Ringerud, S.; Liao, L.; Haddad, Z.; Kelley, B.L.; Mclaughlin, S.F. The GPM combined algorithm. J. Atmos. Ocean. Technol. 2016, 33, 2225–2245. [Google Scholar] [CrossRef]
  112. Grecu, M.; Olson, W.S. Precipitation Retrievals from Satellite Combined Radar and Radiometer Observations. In Satellite Precipitation Measurement; Advances in Global Change Research; Springer: Cham, Switzerland, 2020; Volume 67, pp. 231–248. [Google Scholar]
  113. Sims, E.M.; Liu, G. A parameterization of the probability of snow-rain transition. J. Hydrometeorol. 2015, 16, 1466–1477. [Google Scholar] [CrossRef]
  114. Adler, R.F.; Kidd, C.; Petty, G.; Morissey, M.; Goodman, H.M. Intercomparison of Global Precipitation Products: The Third Precipitation Intercomparison Project (PIP–3). Bull. Am. Meteorol. Soc. 2001, 82, 1377–1396. [Google Scholar] [CrossRef]
  115. Behrangi, A.; Song, Y. A new estimate for oceanic precipitation amount and distribution using complementary precipitation observations from space and comparison with GPCP. Environ. Res. Lett. 2020, 15, 124042. [Google Scholar] [CrossRef]
  116. Becker, A.; Finger, P.; Meyer-Christoffer, A.; Rudolf, B.; Schamm, K.; Schneider, U.; Ziese, M. A description of the global land-surface precipitation data products of the Global Precipitation Climatology Centre with sample applications including centennial (trend) analysis from 1901–present. Earth Syst. Sci. Data 2013, 5, 71–99. [Google Scholar] [CrossRef]
  117. Liu, G. Deriving snow cloud characteristics from CloudSat observations. J. Geophys. Res. 2008, 113, D00A09. [Google Scholar] [CrossRef]
  118. Liu, Y.; Li, F.; Hao, W.; Barriot, J.-P.; Wang, Y. Evaluation of Synoptic Snowfall on the Antarctic Ice Sheet Based on CloudSat, In-Situ Observations and Atmospheric Reanalysis Datasets. Remote Sens. 2019, 11, 1686. [Google Scholar] [CrossRef]
  119. Milani, L.; Kulie, M.S.; Casella, D.; Dietrich, S.; L’Ecuyer, T.S.; Panegrossi, G.; Porcù, F.; Sanò, P.; Wood, N.B. CloudSat snowfall estimates over Antarctica and the Southern Ocean: An assessment of independent retrieval methodologies and multi-year snowfall analysis. Atmos. Res. 2018, 213, 121–135. [Google Scholar] [CrossRef]
  120. Palerme, C.; Kay, J.E.; Genthon, C.; L’Ecuyer, T.; Wood, N.B.; Claud, C. How much snow falls on the Antarctic ice sheet? Cryosphere 2014, 8, 1577–1587. [Google Scholar] [CrossRef]
  121. Surussavadee, C.; Staelin, D.H. Global millimeter-wave precipitation retrievals trained with a cloud-resolving numerical weather prediction model, part I: Retrieval design. IEEE Trans. Geosci. Remote Sens. 2008, 46, 99–108. [Google Scholar] [CrossRef]
  122. King, F.; Fletcher, C.G. Using CloudSat-CPR Retrievals to Estimate Snow Accumulation in the Canadian Arctic. Earth Sp. Sci. 2020, 7, e2019EA000776. [Google Scholar] [CrossRef]
  123. Panegrossi, G.; Rysman, J.F.; Casella, D.; Marra, A.C.; Sanò, P.; Kulie, M.S. CloudSat-based assessment of GPM microwave imager snowfall observation capabilities. Remote Sens. 2017, 9, 1263. [Google Scholar] [CrossRef]
  124. Wood, N.B.; L’Ecuyer, T.S. Level 2C Snow Profile Process Description and Interface Control Document, Product Version P1_R05; NASA JPL CloudSat Project Document Revision 0. National Aeronautics and Space Administration, Jet Propulsion Laboratory: Pasadena, California, USA, 2018; pp. 1–26. Available online: https://www.cloudsat.cira.colostate.edu/cloudsat-static/info/dl/2c-snow-profile/2C-SNOW-PROFILE_PDICD.P1_R05.rev0_.pdf (accessed on 10 November 2023).
  125. Wood, N.B.; L’Ecuyer, T.S. What millimeter-wavelength radar reflectivity reveals about snowfall: An information-centric analysis. Atmos. Meas. Tech. 2021, 14, 869–888. [Google Scholar] [CrossRef]
  126. Wood, N.B.; L’Ecuyer, T.S.; Heymsfield, A.J.; Stephens, G.L.; Hudak, D.R.; Rodriguez, P. Estimating snow microphysical properties using collocated multisensor observations. J. Geophys. Res. Atmos. 2014, 119, 8941–8961. [Google Scholar] [CrossRef]
  127. Wood, N.B.; L’Ecuyer, T.S.; Heymsfield, A.J.; Stephens, G.L. Microphysical Constraints on Millimeter-Wavelength Scattering Properties of Snow Particles. J. Appl. Meteorol. Climatol. 2015, 54, 909–931. [Google Scholar] [CrossRef]
  128. Wood, N.B.; L’Ecuyer, T.S.; Bliven, F.L.; Stephens, G.L. Characterization of video disdrometer uncertainties and impacts on estimates of snowfall rate and radar reflectivity. Atmos. Meas. Tech. 2013, 6, 3635–3648. [Google Scholar] [CrossRef]
  129. Maahn, M.; Burgard, C.; Crewell, S.; Gorodetskaya, I.V.; Kneifel, S.; Lhermitte, S.; Van Tricht, K.; van Lipzig, N.P.M. How does the spaceborne radar blind zone affect derived surface snowfall statistics in polar regions? J. Geophys. Res. Atmos. 2014, 119, 13604–13620. [Google Scholar] [CrossRef]
  130. Valdivia, J.M.; Gatlin, P.N.; Kumar, S.; Scipión, D.; Silva, Y.; Petersen, W.A. The GPM-DPR Blind Zone Effect on Satellite-Based Radar Estimation of Precipitation over the Andes from a Ground-Based Ka-band Profiler Perspective. J. Appl. Meteorol. Climatol. 2022, 61, 441–456. [Google Scholar] [CrossRef]
  131. You, Y.; Wang, N.Y.; Ferraro, R.; Rudlosky, S. Quantifying the snowfall detection performance of the GPM microwave imager channels over land. J. Hydrometeorol. 2017, 18, 729–751. [Google Scholar] [CrossRef]
  132. You, Y.; Huffman, G.; Petkovic, V.; Milani, L.; Yang, J.X.; Ebtehaj, A.; Vahedizade, S.; Gu, G. Evaluation of Snowfall Retrieval Performance of GPM Constellation Radiometers Relative to Spaceborne Radars. J. Hydrometeorol. 2023, 24, 389–405. [Google Scholar] [CrossRef]
  133. Edel, L.; Claud, C.; Genthon, C.; Palerme, C.; Wood, N.; L’Ecuyer, T.; Bromwich, D. Arctic snowfall from CloudSat observations and reanalyses. J. Clim. 2020, 33, 2093–2109. [Google Scholar] [CrossRef]
  134. Thomas, M.A.; Devasthale, A.; L’Ecuyer, T.; Wang, S.; Koenigk, T.; Wyser, K. Snowfall distribution and its response to the Arctic Oscillation: An evaluation of HighResMIP models in the Arctic using CPR/CloudSat observations. Geosci. Model Dev. 2019, 12, 3759–3772. [Google Scholar] [CrossRef]
  135. Kulie, M.S.; Milani, L.; Wood, N.B.; Tushaus, S.A.; Bennartz, R.; L’Ecuyer, T.S. A shallow cumuliform snowfall census using spaceborne radar. J. Hydrometeorol. 2016, 17, 1261–1279. [Google Scholar] [CrossRef]
  136. Kulie, M.S.; Milani, L.; Wood, N.B.; L’Ecuyer, T.S. Global snowfall detection and measurement. In Advances in Global Change Research; Levizzani, V., Kidd, C., Kirschbaum, D.B., Kummerow, C.D., Nakamura, K., Turk, F.J., Eds.; Springer: Cham, Switzerland, 2020; Volume 69, pp. 699–716. [Google Scholar]
  137. Milani, L.; Wood, N.B. Biases in CloudSat Falling Snow Estimates Resulting from Daylight-Only Operations. Remote Sens. 2021, 13, 2041. [Google Scholar] [CrossRef]
  138. Kulie, M.S.; Milani, L. Seasonal variability of shallow cumuliform snowfall: A CloudSat perspective. Q. J. R. Meteorol. Soc. 2018, 144, 329–343. [Google Scholar] [CrossRef]
  139. Casella, D.; Panegrossi, G.; Sanò, P.; Marra, A.C.; Dietrich, S.; Johnson, B.T.; Kulie, M.S. Evaluation of the GPM-DPR snowfall detection capability: Comparison with CloudSat-CPR. Atmos. Res. 2017, 197, 64–75. [Google Scholar] [CrossRef]
  140. Adhikari, A.; Liu, C.; Kulie, M.S. Global distribution of snow precipitation features and their properties from 3 years of GPM observations. J. Clim. 2018, 31, 3731–3754. [Google Scholar] [CrossRef]
  141. Chase, R.J.; Nesbitt, S.W.; McFarquhar, G.M.; Wood, N.B.; Heymsfield, G.M. Direct Comparisons between GPM-DPR and CloudSat Snowfall Retrievals. J. Appl. Meteorol. Climatol. 2022, 61, 1257–1271. [Google Scholar] [CrossRef]
  142. Hayden, L.; Liu, C. A multiyear analysis of global precipitation combining cloudsat and GPM precipitation retrievals. J. Hydrometeorol. 2018, 19, 1935–1952. [Google Scholar] [CrossRef]
  143. Turk, F.J.; Ringerud, S.E.; Camplani, A.; Casella, D.; Chase, R.J.; Ebtehaj, A.; Gong, J.; Kulie, M.; Liu, G.; Milani, L.; et al. Applications of a cloudsat-trmm and cloudsat-gpm satellite coincidence dataset. Remote Sens. 2021, 13, 2264. [Google Scholar] [CrossRef]
  144. Rysman, J.F.; Panegrossi, G.; Sanò, P.; Marra, A.C.; Dietrich, S.; Milani, L.; Kulie, M.S. SLALOM: An all-surface snow water path retrieval algorithm for the GPM microwave imager. Remote Sens. 2018, 10, 1278. [Google Scholar] [CrossRef]
  145. Rysman, J.-F.; Panegrossi, G.; Sanò, P.; Marra, A.C.; Dietrich, S.; Milani, L.; Kulie, M.S.; Casella, D.; Camplani, A.; Claud, C.; et al. Retrieving Surface Snowfall With the GPM Microwave Imager: A New Module for the SLALOM Algorithm. Geophys. Res. Lett. 2019, 46, 13593–13601. [Google Scholar] [CrossRef]
  146. Camplani, A.; Casella, D.; Sanò, P.; Panegrossi, G. The High lAtitude sNowfall Detection and Estimation aLgorithm for ATMS (HANDEL-ATMS): A new algorithm for the snowfall retrieval at high latitudes. Atmos. Meas. Tech. Discuss. 2023, 2023, 1–30. [Google Scholar] [CrossRef]
  147. Camplani, A.; Casella, D.; Sanò, P.; Panegrossi, G. The Passive microwave Empirical cold Surface Classification Algorithm (PESCA): Application to GMI and ATMS. J. Hydrometeorol. 2021, 22, 1727–1744. [Google Scholar] [CrossRef]
  148. Huffman, G.J.; Bolvin, D.T.; Braithwaite, D.; Hsu, K.L.; Joyce, R.J.; Kidd, C.; Nelkin, E.J.; Sorooshian, S.; Stocker, E.F.; Tan, J.; et al. Integrated Multi-satellite Retrievals for the Global Precipitation Measurement (GPM) Mission (IMERG). Adv. Glob. Chang. Res. 2020, 67, 343–353. [Google Scholar] [CrossRef]
  149. Aonashi, K.; Awaka, J.; Hirose, M.; Kozu, T.; Kubota, T.; Liu, G.; Shige, S.; Kida, S.; Seto, S.; Takahashi, N.; et al. Gsmap passive microwave precipitation retrieval algorithm: Algorithm description and validation. J. Meteorol. Soc. Jpn. 2009, 87A, 119–136. [Google Scholar] [CrossRef]
  150. USHIO, T.; SASASHIGE, K.; KUBOTA, T.; SHIGE, S.; OKAMOTO, K.; AONASHI, K.; INOUE, T.; TAKAHASHI, N.; IGUCHI, T.; KACHI, M.; et al. A Kalman Filter Approach to the Global Satellite Mapping of Precipitation (GSMaP) from Combined Passive Microwave and Infrared Radiometric Data. J. Meteorol. Soc. Jpn. Ser. II 2009, 87A, 137–151. [Google Scholar] [CrossRef]
  151. Kubota, T.; Iguchi, T.; Kojima, M.; Liao, L.; Masaki, T.; Hanado, H.; Meneghini, R.; Oki, R. A Statistical Method for Reducing Sidelobe Clutter for the Ku-Band Precipitation Radar on board the GPM Core Observatory. J. Atmos. Ocean. Technol. 2016, 33, 1413–1428. [Google Scholar] [CrossRef]
  152. Yamamoto, M.K.; Shige, S. Implementation of an orographic/nonorographic rainfall classification scheme in the GSMaP algorithm for microwave radiometers. Atmos. Res. 2015, 163, 36–47. [Google Scholar] [CrossRef]
  153. Kubota, T.; Shige, S.; Hashizume, H.; Aonashi, K.; Takahashi, N.; Seto, S.; Hirose, M.; Takayabu, Y.N.; Ushio, T.; Nakagawa, K.; et al. Global Precipitation Map Using Satellite-Borne Microwave Radiometers by the GSMaP Project: Production and Validation. IEEE Trans. Geosci. Remote Sens. 2007, 45, 2259–2275. [Google Scholar] [CrossRef]
  154. Shimizu, R.; Shige, S.; Iguchi, T.; Yu, C.-K.; Cheng, L.-W. Narrowing the Blind Zone of the GPM Dual-Frequency Precipitation Radar to Improve Shallow Precipitation Detection in Mountainous Areas. J. Appl. Meteorol. Climatol. 2023, 62, 1437–1450. [Google Scholar] [CrossRef]
  155. Chen, H.; Cifelli, R.; Chandrasekar, V.; Ma, Y. A Flexible Bayesian Approach to Bias Correction of Radar-Derived Precipitation Estimates over Complex Terrain: Model Design and Initial Verification. J. Hydrometeorol. 2019, 20, 2367–2382. [Google Scholar] [CrossRef]
  156. Arulraj, M.; Barros, A.P. Automatic detection and classification of low-level orographic precipitation processes from space-borne radars using machine learning. Remote Sens. Environ. 2021, 257, 112355. [Google Scholar] [CrossRef]
  157. Milani, L.; Kulie, M.S.; Casella, D.; Kirstetter, P.E.; Panegrossi, G.; Petkovic, V.; Ringerud, S.E.; Rysman, J.F.; Sano, P.; Wang, N.Y.; et al. Extreme lake-effect snow from a gpm microwave imager perspective: Observational analysis and precipitation retrieval evaluation. J. Atmos. Ocean. Technol. 2021, 38, 293–311. [Google Scholar] [CrossRef]
  158. Rahimi, R.; Ebtehaj, A.; Panegrossi, G.; Milani, L.; Ringerud, S.E.; Turk, F.J. Vulnerability of Passive Microwave Snowfall Retrievals to Physical Properties of Snowpack: A Perspective from Dense Media Radiative Transfer Theory. IEEE Trans. Geosci. Remote Sens. 2022, 60, 1–13. [Google Scholar] [CrossRef]
  159. Takbiri, Z.; Milani, L.; Guilloteau, C.; Foufoula-Georgiou, E. Quantitative investigation of radiometric interactions between snowfall, snow cover, and cloud liquid water over land. Remote Sens. 2021, 13, 2641. [Google Scholar] [CrossRef]
  160. Vahedizade, S.; Ebtehaj, A.; You, Y.; Ringerud, S.E.; Turk, F.J. Passive Microwave Signatures and Retrieval of High-Latitude Snowfall Over Open Oceans and Sea Ice: Insights from Coincidences of GPM and CloudSat Satellites. IEEE Trans. Geosci. Remote Sens. 2022, 60, 1–13. [Google Scholar] [CrossRef]
  161. Pettersen, C.; Kulie, M.S.; Bliven, L.F.; Merrelli, A.J.; Petersen, W.A.; Wagner, T.J.; Wolff, D.B.; Wood, N.B. A composite analysis of snowfall modes from four winter seasons in Marquette, Michigan. J. Appl. Meteorol. Climatol. 2020, 59, 103–124. [Google Scholar] [CrossRef]
  162. Pettersen, C.; Bliven, L.F.; Von Lerber, A.; Wood, N.B.; Kulie, M.S.; Mateling, M.E.; Moisseev, D.N.; Munchak, S.J.; Petersen, W.A.; Wolff, D.B. The precipitation imaging package: Assessment of microphysical and bulk characteristics of snow. Atmosphere 2020, 11, 785. [Google Scholar] [CrossRef]
  163. King, F.; Duffy, G.; Milani, L.; Fletcher, C.G.; Pettersen, C.; Ebell, K. DeepPrecip: A deep neural network for precipitation retrievals. Atmos. Meas. Tech. 2022, 15, 6035–6050. [Google Scholar] [CrossRef]
  164. Bailey, M.; Hallett, J. Growth rates and habits of ice crystals between −20° and −70 °C. J. Atmos. Sci. 2004, 61, 514–544. [Google Scholar] [CrossRef]
  165. Libbrecht, K.G. The physics of snow crystals. Rep. Prog. Phys. 2005, 68, 855–895. [Google Scholar] [CrossRef]
  166. Kneifel, S.; Leinonen, J.; Tyynelä, J.; Ori, D.; Battaglia, A. Scattering of Hydrometeors. In Advances in Global Change Research; Levizzani, V., Kidd, C., Kirschbaum, D.B., Kummerow, C.D., Nakamura, K., Turk, F.J., Eds.; Springer: Cham, Switzerland, 2020; Volume 67, pp. 249–276. [Google Scholar]
  167. Kneifel, S.; Dias Neto, J.; Ori, D.; Moisseev, D.; Tyynelä, J.; Adams, I.S.; Kuo, K.-S.; Bennartz, R.; Berne, A.; Clothiaux, E.E.; et al. Summer Snowfall Workshop: Scattering Properties of Realistic Frozen Hydrometeors from Simulations and Observations, as well as Defining a New Standard for Scattering Databases. Bull. Am. Meteorol. Soc. 2018, 99, ES55–ES58. [Google Scholar] [CrossRef]
  168. Geer, A.J.; Baordo, F. Improved scattering radiative transfer for frozen hydrometeors at microwave frequencies. Atmos. Meas. Tech. 2014, 7, 1839–1860. [Google Scholar] [CrossRef]
  169. Tyynelä, J.; Leinonen, J.; Moisseev, D.; Nousiainen, T. Radar Backscattering from Snowflakes: Comparison of Fractal, Aggregate, and Soft Spheroid Models. J. Atmos. Ocean. Technol. 2011, 28, 1365–1372. [Google Scholar] [CrossRef]
  170. Tyynelä, J.; Chandrasekar, V. Characterizing falling snow using multifrequency dual-polarization measurements. J. Geophys. Res. Atmos. 2014, 119, 8268–8283. [Google Scholar] [CrossRef]
  171. Leinonen, J.; Moisseev, D. What do triple-frequency radar signatures reveal about aggregate snowflakes? J. Geophys. Res. Atmos. 2015, 120, 229–239. [Google Scholar] [CrossRef]
  172. Kuo, K.S.; Olson, W.S.; Johnson, B.T.; Grecu, M.; Tian, L.; Clune, T.L.; Van Aartsen, B.H.; Heymsfield, A.J.; Liao, L.; Meneghini, R. Full access the microwave radiative properties of falling snow derived from nonspherical ice particle models. Part I: An extensive database of simulated pristine crystals and aggregate particles, and their scattering properties. J. Appl. Meteorol. Climatol. 2016, 55, 691–708. [Google Scholar] [CrossRef]
  173. Ekelund, R.; Brath, M.; Mendrok, J.; Eriksson, P. ARTS Microwave Single Scattering Properties Database (1.1.0) [Data set]; Zenodo: Meyrin, Switzerland, 2020. [Google Scholar] [CrossRef]
  174. Leinonen, J.; Szyrmer, W. Radar signatures of snowflake riming: A modeling study. Earth Sp. Sci. 2015, 2, 346–358. [Google Scholar] [CrossRef] [PubMed]
  175. Botta, G.; Aydin, K.; Verlinde, J. Modeling of Microwave Scattering from Cloud Ice Crystal Aggregates and Melting Aggregates: A New Approach. IEEE Geosci. Remote Sens. Lett. 2010, 7, 572–576. [Google Scholar] [CrossRef]
  176. Ori, D.; Maestri, T.; Rizzi, R.; Cimini, D.; Montopoli, M.; Marzano, F.S. Scattering properties of modeled complex snowflakes and mixed-phase particles at microwave and millimeter frequencies. J. Geophys. Res. Atmos. 2014, 119, 9931–9947. [Google Scholar] [CrossRef]
  177. Johnson, B.T.; Olson, W.S.; Skofronick-Jackson, G. The microwave properties of simulated melting precipitation particles: Sensitivity to initial melting. Atmos. Meas. Tech. 2016, 9, 9–21. [Google Scholar] [CrossRef] [PubMed]
  178. Gou, Y.; Ma, Y.; Chen, H.; Wen, Y. Radar-derived quantitative precipitation estimation in complex terrain over the eastern Tibetan Plateau. Atmos. Res. 2018, 203, 286–297. [Google Scholar] [CrossRef]
  179. Zhang, J.; Qi, Y.; Kingsmill, D.; Howard, K. Radar-Based Quantitative Precipitation Estimation for the Cool Season in Complex Terrain: Case Studies from the NOAA Hydrometeorology Testbed. J. Hydrometeorol. 2012, 13, 1836–1854. [Google Scholar] [CrossRef]
  180. Germann, U.; Boscacci, M.; Clementi, L.; Gabella, M.; Hering, A.; Sartori, M.; Sideris, I.V.; Calpini, B. Weather Radar in Complex Orography. Remote Sens. 2022, 14, 503. [Google Scholar] [CrossRef]
  181. Chen, H.; Cifelli, R.; White, A. Improving Operational Radar Rainfall Estimates Using Profiler Observations Over Complex Terrain in Northern California. IEEE Trans. Geosci. Remote Sens. 2020, 58, 1821–1832. [Google Scholar] [CrossRef]
  182. Dinku, T.; Anagnostou, E.N.; Borga, M. Improving Radar-Based Estimation of Rainfall over Complex Terrain. J. Appl. Meteorol. 2002, 41, 1163–1178. [Google Scholar] [CrossRef]
  183. Bartsotas, N.S.; Anagnostou, E.N.; Nikolopoulos, E.I.; Kallos, G. Investigating Satellite Precipitation Uncertainty Over Complex Terrain. J. Geophys. Res. Atmos. 2018, 123, 5346–5359. [Google Scholar] [CrossRef]
  184. Duan, Y.; Wilson, A.M.; Barros, A.P. Scoping a field experiment: Error diagnostics of TRMM precipitation radar estimates in complex terrain as a basis for IPHEx2014. Hydrol. Earth Syst. Sci. 2015, 19, 1501–1520. [Google Scholar] [CrossRef]
  185. Kollias, P.; Albrecht, B. Why the melting layer radar reflectivity is not bright at 94 GHz. Geophys. Res. Lett. 2005, 32, L24818. [Google Scholar] [CrossRef]
  186. Marzano, F.S.; Roberti, L.; Di Michele, S.; Mugnai, A.; Tassa, A. Modeling of apparent radar reflectivity due to convective clouds at attenuating wavelengths. Radio Sci. 2003, 38, 2-1–2-16. [Google Scholar] [CrossRef]
  187. Bouniol, D.; Protat, A.; Plana-Fattori, A.; Giraud, M.; Vinson, J.-P.; Grand, N. Comparison of Airborne and Spaceborne 95-GHz Radar Reflectivities and Evaluation of Multiple Scattering Effects in Spaceborne Measurements. J. Atmos. Ocean. Technol. 2008, 25, 1983–1995. [Google Scholar] [CrossRef]
  188. Battaglia, A.; Tanelli, S.; Mroz, K.; Tridon, F. Multiple scattering in observations of the GPM dual-frequency precipitation radar: Evidence and impact on retrievals. J. Geophys. Res. Atmos. 2015, 120, 4090–4101. [Google Scholar] [CrossRef] [PubMed]
  189. Palerme, C.; Claud, C.; Wood, N.B.; L’Ecuyer, T.; Genthon, C. How Does Ground Clutter Affect CloudSat Snowfall Retrievals over Ice Sheets? IEEE Geosci. Remote Sens. Lett. 2019, 16, 342–346. [Google Scholar] [CrossRef]
  190. Arulraj, M.; Barros, A.P. Shallow Precipitation Detection and Classification Using Multifrequency Radar Observations and Model Simulations. J. Atmos. Ocean. Technol. 2017, 34, 1963–1983. [Google Scholar] [CrossRef]
  191. Arulraj, M.; Barros, A.P. Improving quantitative precipitation estimates in mountainous regions by modelling low-level seeder-feeder interactions constrained by Global Precipitation Measurement Dual-frequency Precipitation Radar measurements. Remote Sens. Environ. 2019, 231, 111213. [Google Scholar] [CrossRef]
  192. Derin, Y.; Anagnostou, E.; Anagnostou, M.N.; Kalogiros, J.; Casella, D.; Marra, A.C.; Panegrossi, G.; Sano, P. Passive microwave rainfall error analysis using high-resolution X-band dual-polarization radar observations in complex terrain. IEEE Trans. Geosci. Remote Sens. 2018, 56, 2565–2586. [Google Scholar] [CrossRef]
  193. Derin, Y.; Yilmaz, K.K. Evaluation of Multiple Satellite-Based Precipitation Products over Complex Topography. J. Hydrometeorol. 2014, 15, 1498–1516. [Google Scholar] [CrossRef]
  194. Hirpa, F.A.; Gebremichael, M.; Hopson, T. Evaluation of high-resolution satellite precipitation products over very complex terrain in Ethiopia. J. Appl. Meteorol. Climatol. 2010, 49, 1044–1051. [Google Scholar] [CrossRef]
  195. L’Ecuyer, T.; Petersen, W.; Moiseev, D. Light Precipitation Validation Experiment (LPVEx) Science Plan. 2010. Available online: https://ghrc.nsstc.nasa.gov/home/sites/default/files/lpvex_science_plan_June2010.pdf (accessed on 10 November 2023).
  196. Iguchi, T.; Matsui, T.; Tao, W.K.; Khain, A.P.; Phillips, V.T.J.; Kidd, C.; Lecuyer, T.; Braun, S.A.; Hou, A. WRF-SBM simulations of melting-layer structure in mixed-phase precipitation events observed during LPVEx. J. Appl. Meteorol. Climatol. 2014, 53, 2710–2731. [Google Scholar] [CrossRef]
  197. Skofronick-Jackson, G.; Hudak, D.; Petersen, W.; Nesbitt, S.W.; Chandrasekar, V.; Durden, S.; Gleicher, K.J.; Huang, G.J.; Joe, P.; Kollias, P.; et al. Global precipitation measurement cold season precipitation experiment (GCPEX): For measurement’s sake, let it snow. Bull. Am. Meteorol. Soc. 2015, 96, 1719–1741. [Google Scholar] [CrossRef]
  198. Houze, R.A.; McMurdie, L.A.; Petersen, W.A.; Schwall Er, M.R.; Baccus, W.; Lundquist, J.D.; Mass, C.F.; Nijssen, B.; Rutledge, S.A.; Hudak, D.R.; et al. The olympic mountains experiment (Olympex). Bull. Am. Meteorol. Soc. 2017, 98, 2167–2188. [Google Scholar] [CrossRef] [PubMed]
  199. Chase, R.J.; Finlon, J.A.; Borque, P.; McFarquhar, G.M.; Nesbitt, S.W.; Tanelli, S.; Sy, O.O.; Durden, S.L.; Poellot, M.R. Evaluation of Triple-Frequency Radar Retrieval of Snowfall Properties Using Coincident Airborne In Situ Observations During OLYMPEX. Geophys. Res. Lett. 2018, 45, 5752–5760. [Google Scholar] [CrossRef]
  200. Erlingis, J.M.; Gourley, J.J.; Kirstetter, P.E.; Anagnostou, E.N.; Kalogiros, J.; Anagnostou, M.N.; Petersen, W. Evaluation of operational and experimental precipitation algorithms and microphysical insights during iphex. J. Hydrometeorol. 2018, 19, 113–125. [Google Scholar] [CrossRef]
  201. Barros, A.P.; Petersen, W.; Wilson, A.M. Integrated Precipitation and Hydrology Experiment (IPHEx)/Orographic Precipitation Processes Study Field Campaign Report; DOE ARM Climate Research Facility: Washington, DC, USA, 2016. [Google Scholar]
  202. Barros, A.P.; Lang, T.J. Monitoring the Monsoon in the Himalayas: Observations in Central Nepal, June 2001. Mon. Weather Rev. 2003, 131, 1408–1427. [Google Scholar] [CrossRef]
  203. McMurdie, L.A.; Heymsfield, G.M.; Yorks, J.E.; Braun, S.A.; Skofronick-Jackson, G.; Rauber, R.M.; Yuter, S.; Colle, B.; McFarquhar, G.M.; Poellot, M.; et al. Chasing Snowstorms: The Investigation of Microphysics and Precipitation for Atlantic Coast-Threatening Snowstorms (IMPACTS) Campaign. Bull. Am. Meteorol. Soc. 2022, 103, E1243–E1269. [Google Scholar] [CrossRef]
  204. Schultz, C.J.; Harkema, S.S.; Mach, D.M.; Bateman, M.; Lang, T.J.; Heymsfield, G.M.; McLinden, M.L.; Li, L.; Poellot, M.; Sand, K. Remote Sensing of Electric Fields Observed Within Winter Precipitation During the 2020 Investigation of Microphysics and Precipitation for Atlantic Coast-Threatening Snowstorms (IMPACTS) Field Campaign. J. Geophys. Res. Atmos. 2021, 126, e2021JD034704. [Google Scholar] [CrossRef]
  205. Colle, B.A.; Yeh, P.; Finlon, J.A.; McMurdie, L.; McDonald, V.; DeLaFrance, A. An Investigation of a Northeast U.S. Cyclone Event Without Well-Defined Snow Banding During IMPACTS. Mon. Weather Rev. 2023, 151, 2465–2484. [Google Scholar] [CrossRef]
  206. Heymsfield, A.; Bansemer, A.; Heymsfield, G.; Noone, D.; Grecu, M.; Toohey, D. Relationship of Multiwavelength Radar Measurements to Ice Microphysics from the IMPACTS Field Program. J. Appl. Meteorol. Climatol. 2023, 62, 289–315. [Google Scholar] [CrossRef]
  207. Blackwell, W.J.; Braun, S.; Bennartz, R.; Velden, C.; DeMaria, M.; Atlas, R.; Dunion, J.; Marks, F.; Rogers, R.; Annane, B.; et al. An overview of the TROPICS NASA Earth Venture Mission. Q. J. R. Meteorol. Soc. 2018, 144, 16–26. [Google Scholar] [CrossRef] [PubMed]
  208. Kidd, C.; Matsui, T.; Blackwell, W.; Braun, S.; Leslie, R.; Griffith, Z. Precipitation Estimation from the NASA TROPICS Mission: Initial Retrievals and Validation. Remote Sens. 2022, 14, 2992. [Google Scholar] [CrossRef]
  209. Accadia, C.; Mattioli, V.; Colucci, P.; Schlüssel, P.; D’Addio, S.; Klein, U.; Wehr, T.; Donlon, C. Microwave and Sub-mm Wave Sensors: A European Perspective. In Satellite Precipitation Measurement; Advances in Global Change Research; Springer: Cham, Switzerland, 2020; Volume 67, pp. 83–97. [Google Scholar]
  210. Kayal, G.; Schlüssel, P. Introduction to the next generation EUMETSAT Polar System (EPS-SG) observation missions. In Proceedings of the SPIE Remote Sensing, Warsaw, Poland, 11–14 September 2017. [Google Scholar] [CrossRef]
  211. Mattioli, V.; Accadia, C.; Ackermann, J.; Di Michele, S.; Hans, I.; Schlussel, P.; Colucci, P.; Canestri, A. The EUMETSAT Polar System—Second Generation (EPS-SG) Passive Microwave and Sub-mm Wave Missions. Prog. Electromagn. Res. Symp. 2019, 2019, 3926–3933. [Google Scholar] [CrossRef]
  212. Birkeland, R. An Overview of Existing and Future Satellite Systems for Arctic Communication. In Proceedings of the 4S Symposium 2014, Majorca, Spain, 26–30 May 2014; pp. 1–11. [Google Scholar]
  213. Wehr, T.; Kubota, T.; Tzeremes, G.; Wallace, K.; Nakatsuka, H.; Ohno, Y.; Koopman, R.; Rusli, S.; Kikuchi, M.; Eisinger, M.; et al. The EarthCARE mission—Science and system overview. Atmos. Meas. Tech. 2023, 16, 3581–3608. [Google Scholar] [CrossRef]
  214. National Academies of Sciences, Engineering, and Medicine; Division on Engineering and Physical Sciences; Space Studies Board; Committee on the Decadal Survey for Earth Science and Applications from Space. Thriving on Our Changing Planet; National Academies Press: Washington, DC, USA, 2018; ISBN 978-0-309-46757-5. [Google Scholar]
  215. Braun, S.A.; Yorks, J.; Thorsen, T.; Cecil, D.; Kirschbaum, D. NASA’S Earth System Observatory-Atmosphere Observing System. In Proceedings of the IGARSS 2022–2022 IEEE International Geoscience and Remote Sensing Symposium, Kuala Lumpur, Malaysia, 17–22 July 2022; pp. 7391–7393. [Google Scholar]
  216. Kummerow, C.D.; Tanelli, S.; Takahashi, N.; Furukawa, K.; Klein, M.; Levizzani, V. Plans for Future Missions. Adv. Glob. Chang. Res. 2020, 67, 99–119. [Google Scholar] [CrossRef]
  217. Mitnik, L.; Kuleshov, V.; Baranyuk, A.; Mitnik, M.; Khazanova, E.; Panfilova, M. Monitoring of the Arctic Region Using Optical and Infrared Data from the Highly Elliptical Arktika-M Space System and Microwave Measurements from Low Earth Orbit Satellites. In Proceedings of the IGARSS 2022–2022 IEEE International Geoscience and Remote Sensing Symposium, Kuala Lumpur, Malaysia, 17–22 July 2022; pp. 7194–7197. [Google Scholar]
Figure 1. The latitudinal occurrence of the different light intensity (<1 mm h−1) precipitation types as a percentage of the total precipitation occurrence derived from shipborne observations (1958–1991). Liquid precipitation is represented by blue shading, frozen precipitation by dark grey shading and mixed precipitation by light grey shading. (Source: Chris Kidd ESA. EGPM—European Contribution to Global Precipitation Measurement; ESA SP-1279(5); ESA: Noordwijk, The Netherlands, 2004; p. 60 [11]).
Atmosphere 14 01677 g001
Figure 2. Distribution of the WMO GTS stations that report precipitation.
Atmosphere 14 01677 g002
Figure 3. The average number of overpasses per day over the polar regions provided by the 10 passive microwave radiometers of the GPM constellation (GPM GMI, GCOMW1 AMSR2, F16/17/18 DMSP SSMIS, NOAA19/MetOp-B/MetOp-C MHS and NPP/NOAA20 ATMS).
Atmosphere 14 01677 g003
Figure 4. Frequency of occurrence of frozen precipitation (snowfall) in 2022, derived from the GPROF Level 2 data using AMSR-2 observations.
Atmosphere 14 01677 g004
Figure 5. CloudSat frequency of occurrence of frozen precipitation (snowfall) from 2006–2010.
Atmosphere 14 01677 g005
Table 1. Satellites and sensors currently contributing to the GPM constellation, together with the two active microwave precipitation/cloud radars. The retrieval resolution relates to all scan positions at the surface except for ‘$’ which is at nadir only, while ‘#’ denotes the vertical resolution. (Note, only the frequencies routinely used for precipitation retrievals are shown. Additional frequencies are available, such as 50–60 GHz, on the SSMIS and ATMS sensors, which could be exploited).
SensorSSMISAMSR2GMIMHSATMSDPRCPR
TypeConicalConicalConicalCross-trackCross-trackCross-trackNadir only
Satellite(s)DMSP-F16
DMSP-F17
DMSP-F18
GCOMW1GPMNOAA-19
MetOp-B
MeOp-C
SNPP
NOAA-20
NOAA-21
GPMCloudSat
Frequencies (GHz)-6.925/7.3 VH-----
-10.65 VH10.65 VH--13.8-
19.35 VH18.70 VH18.70 VH----
22.235 V23.80 VH23.80 V-23.8 QV--
37.0 VH36.5 VH36.5 VH-31.4 QV35.5-
91.65 VH89.0 VH89.0 VH89 V87–91 QV-94.05
150 H-165.5 VH157 V164–167 QH--
183.31 H-183.31 V ×2183.31 H ×2183.31 QH ×5--
---190.31 V---
Along/
Cross-track resolution
12.8
×
12.6 km
4.7
×
4.3 km
5.1
×
13.2 km
16.9
×
17.6 km
16.1
×
17.7 km
5.4
×
5.4 km
3.5
×
1.4 km
Retrieval resolution50 × 40 km19 × 11 km16 × 10 km16 × 16 km $16 × 16 km $5.4 × 5.4
km
250 m #
3.5 × 1.4
km
500 m #
Table 2. GPM and CloudSat precipitation products.
Precipitation
Products
DescriptionSensor(s)Inputs
2AGPROFPMW precipitationGMI, AMSR2, SSMIS, MHS, ATMSBrightness temperatures and model environmental information
2ADPRAMW precipitationDPRRadar backscatter and model environmental information
2BCMB (CORRA)Combined AMW/PMW precipitationDPR, GMIBrightness temperatures, radar backscatter and model environmental information
IMERG L3AMapped multi-satellite merged precipitationGMI, AMSR2, SSMIS, MHS, ATMS, GEO-IRGPROF L2A, CPC gauges, GPCP, GEO IR, CORRA, CMORPH, PERSIANN-CCS and snow/sea ice cover
GSMaPMapped multi-satellite merged precipitationPMW sensors on multiple LEO satellites, GEO-IRBrightness temperatures, GEO-IR, radar backscatter, CPC gauges and NOAA snow/sea ice cover
2C-SNOW-PROFILEAMW snowfallCPRRadar backscatter and model environmental information
2C-RAIN-PROFILEAMW rainfallCPRRadar backscatter and model environmental information
Disclaimer/Publisher’s Note: The statements, opinions and data contained in all publications are solely those of the individual author(s) and contributor(s) and not of MDPI and/or the editor(s). MDPI and/or the editor(s) disclaim responsibility for any injury to people or property resulting from any ideas, methods, instructions or products referred to in the content.

