Article

Multiscale Analysis of a Record-Breaking Predecessor Rain Event Ahead of Typhoon Danas (2019) in Jiangsu, China

1
Nantong Meteorological Bureau, Nantong 226000, China
2
Shenzhen National Climate Observatory, Meteorological Bureau of Shenzhen Municipality, Shenzhen 518040, China
3
Jiangsu Meteorological Observatory, Nanjing 210041, China
4
Haimen Meteorological Bureau, Nantong 226100, China
*
Authors to whom correspondence should be addressed.
Atmosphere 2023, 14(11), 1608; https://doi.org/10.3390/atmos14111608
Submission received: 18 July 2023 / Revised: 11 September 2023 / Accepted: 12 September 2023 / Published: 27 October 2023
(This article belongs to the Special Issue Precipitation Observations and Prediction)

Abstract

:
On 17 July 2019, an unusually intense rainfall occurred in the central-eastern part of Jiangsu Province in China, resulting in a record-breaking daily precipitation of 286.4 mm at the Rugao station, not seen since 1961. A comprehensive analysis was conducted on various multiscale characteristics of the initial rain event, such as the large-scale surroundings, moisture transport, triggering and maintenance mechanisms, and microphysical characteristics. Multi-sources of data were utilized, such as reanalysis data, automatic weather stations, wind-profiling radar, laser-optical Particle Size Velocity instruments, soundings, S-band dual-polarization radar, and a Lagrangian model. The findings suggest that the intense precipitation in Rugao resulted from the convergence of the warm and moist airflow from Typhoon Danas and the cold air moving southward from the north, along with the ample moisture and energy provided by the circulation of Typhoon Danas. Convection, which showed good consistency with the intense precipitation process, was initiated by mesoscale temperature gradients and wind field convergence. This was associated with the intrusion of a near-surface cold pool and the maintenance of a ground convergence line in the Rugao area. This convection exemplified a standard system of warm clouds with high precipitation efficacy. It had a high concentration of raindrops, especially large ones, resulting in record-breaking precipitation in a short amount of time.

1. Introduction

China is situated in the monsoon region of Asia, which is characterized by frequent and intense rainfall. The rainfall patterns in this region are often sudden and localized, leading to significant socio-economic losses. For example, on 21 July 2012, Beijing and the surrounding areas experienced an exceptionally heavy downpour, surpassing historical records at many stations. This event resulted in 79 fatalities and caused tens of billions of yuan in socio-economic damages. Similarly, on 7 May 2017, Guangzhou encountered an unusual and notable precipitation episode, leading to severe flooding and the collapse of houses in several villages, causing significant financial losses. Moreover, from 20 to 22 July 2021, the northern part of Henan Province faced exceptionally heavy rainfall for two consecutive days. Combined with convective precipitation, this intense rainfall triggered severe flash floods and mudslides that damaged grain fields, transportation, communication, and water and electricity facilities, causing serious casualties. The occurrence of heavy rainfall during the summer is a significant meteorological phenomenon in the middle and lower regions of the Yangtze River, posing substantial hazards to life, property, and industrial and agricultural activities [1]. With global warming, extreme precipitation generally tends to increase [2]. The prediction of heavy rainfall and floods has always been one of the key tasks of disaster prevention and mitigation in China.
Tropical cyclone remote rainfall is clearly defined as the precipitation outside the range of tropical cyclones and having an intrinsic physical connection with tropical cyclones [3]. Cote [4] also proposed the concept of predecessor rain events ahead of tropical cyclones, similar to tropical cyclone remote rainfall given by Chen [3]. Predecessor rain events occur as a result of tropical moisture and energy transported ahead of tropical cyclones and lifted along the low-level frontogenetical baroclinic zone in the equatorial entrance zone of the upper southeasterly jet [4,5,6,7,8,9,10].
The heavy rainstorms are mainly caused by relatively high precipitation intensities and long durations as a result of adequate moisture supply and stronger uplifting motion [11], while the duration is influenced by a combination of the movement speed, scale, and organization of the rainfall system. Tropical cyclones can interact with mid-latitude systems (including westerly troughs, vortex, weak cold air, etc.) to enhance and expand the rainstorm band, and their daily amount of precipitation is often not less than the tropical cyclone body rainfall, which is an important feature of summer rainstorms in eastern China [3,8,9,10,12,13,14,15,16,17,18]. The heavy rainstorms in eastern China are more directly associated with mesoscale convective systems (MCSs), which are more likely to produce short-duration rainstorms to sustain high precipitation intensity and persistence [19,20,21]. The back-building–quasi-stationary processes impacted by surface fronts [22], midlevel cyclonic circulations [23,24], and the mesoscale boundary [25,26] are one of effective patterns of MCS organization leading to heavy precipitation [27].
The microphysical characteristics of the precipitation system are influenced by the atmospheric circulation, and the precipitation intensity is closely related to the microphysical characteristics of the precipitation particles. Polarimetric radar can provide detailed microphysical information of the size, shape, and orientation of the particles, and help us to explore the cloud-physical processes in different stages of the heavy precipitation process. Such analysis has been used on different convective systems, including supercells [28,29,30,31] and tropical cyclones [32,33,34,35]. The study of the raindrop size distribution (RSD) can compensate for the lack of access to atmospheric information due to the limitations of radar detection and is useful for analyzing the thermodynamic information of rapid tropospheric changes and micro-scale to mesoscale temperature and humidity changes [36,37,38,39], and can contribute significantly to a better understanding of cloud microphysics and to improving cloud models [40,41]. Nonetheless, there is a paucity of studies that focus on the microphysical processes encompassing extreme, ultra-intense, and short-duration heavy precipitation events.
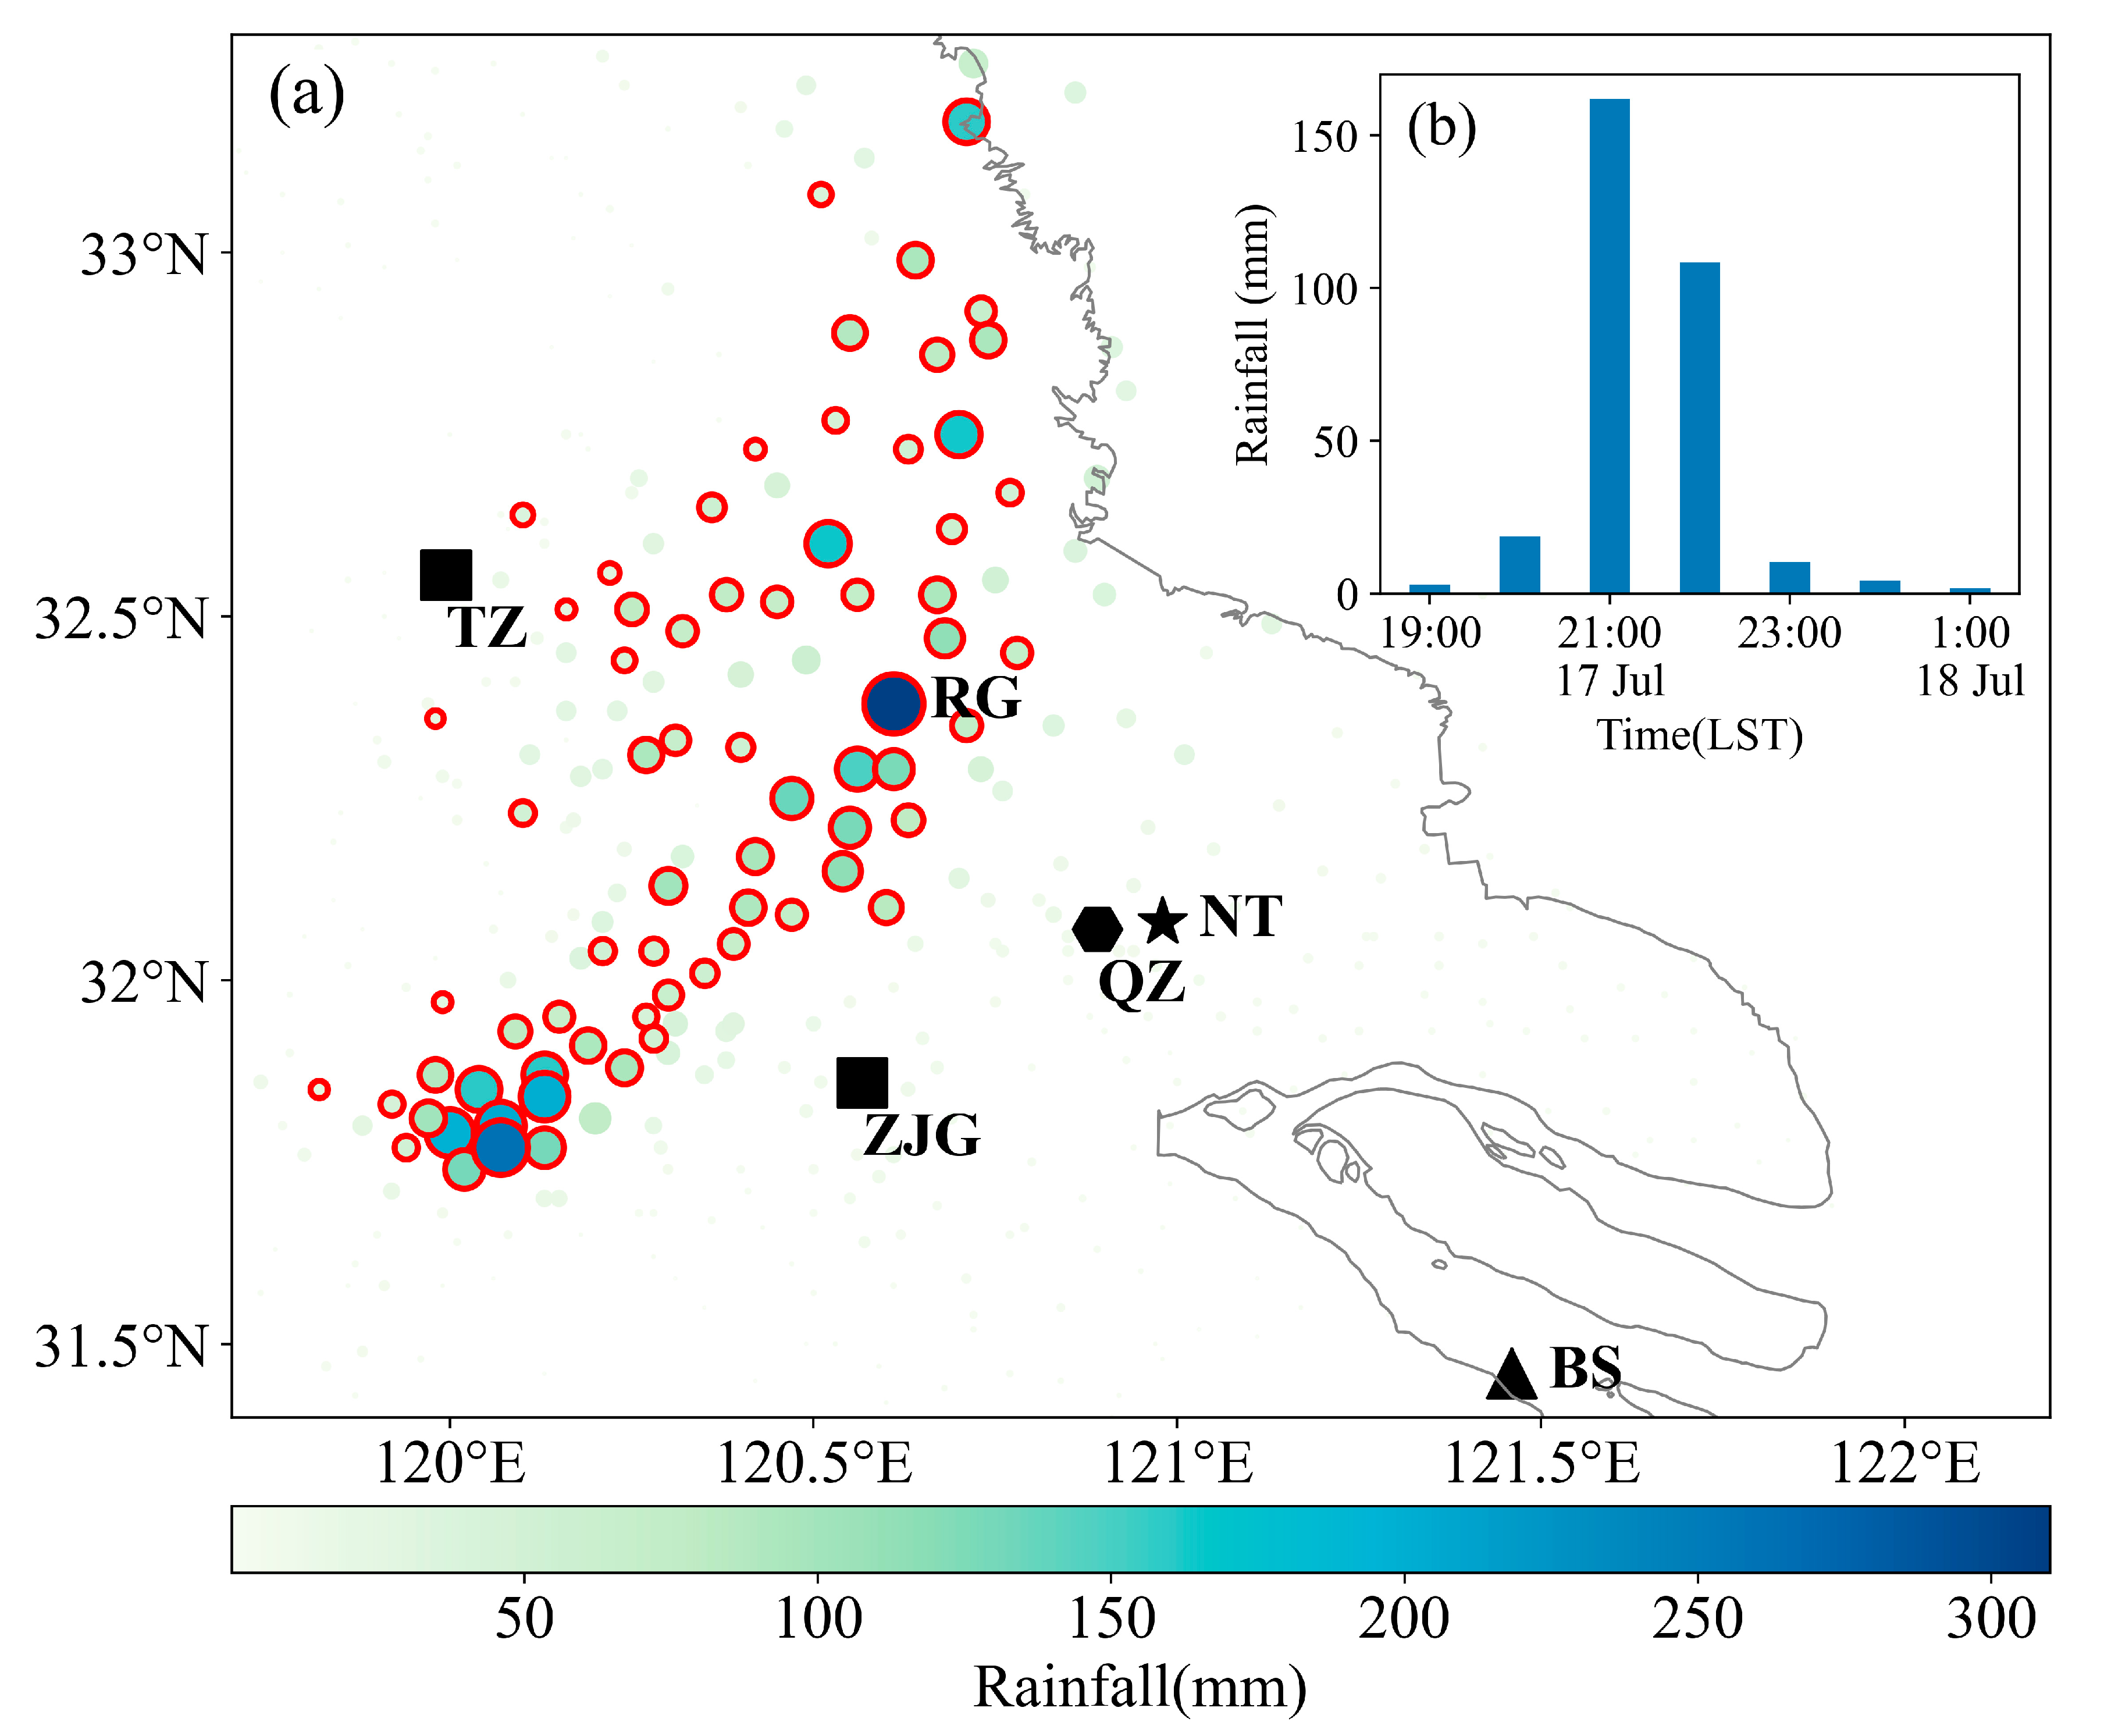
On 17 July 2019, the central-eastern part of Jiangsu Province, China experienced an extremely heavy rainfall event due to the influence of long-range typhoon “Danas”, causing severe urban flooding, deaths, and serious socio-economic damage. The Rugao station has observed a record-breaking daily precipitation of 286.4 mm and hourly precipitation of 161.9 mm since 1961. During the heavy precipitation event, Typhoon “Danas” was located approximately 1400 km east of Luzon Island in the Philippines, which is a considerable distance from the affected area. Despite the absence of direct influences from this typhoon on Jiangsu, the occurrence of extraordinarily heavy rainfall in the region was historically rare when the typhoon was in the eastern ocean of Taiwan.
Enhancing our understanding of precipitation structure and microphysical characteristics is crucial for improving the forecasting and warning accuracy of heavy precipitation. This study aims to investigate how a range of factors, such as the large-scale environment, moisture transport, trigger and maintenance mechanisms, and microphysical characteristics, influence the development of this record-breaking precursor rain event. It also seeks to enhance our understanding of the interplay between these multiscale aspects that lead to the occurrence of the precursor rain event in the lower reaches of the Yangtze River basin. Additionally, this research could contribute to more efficient and accurate predictions of severe weather events as well as enhance the effectiveness of disaster response efforts, playing a crucial role in safeguarding human life and property from the impact of natural disasters.
The data and methods used in this study are presented in the following section. Section 3 provides an overview of the rainfall event, while Section 4 illustrates the moisture transport paths and source regions for heavy rainfall. Section 5 examines the development of precipitation systems and the related mesoscale circulations. Section 6 examines the microphysical characteristics of convection that cause intense precipitation. The conclusions and discussion are provided in Section 7.

2. Data and Method

2.1. Data

This study utilized 2 m temperature, 2 m dewpoint temperature, 10 m winds, and precipitation from automatic weather stations shown in Figure 1a. The European Center for Medium-Range Weather Forecasts (ECMWF) ERA5 global reanalysis products with a horizontal resolution of approximately 31 km available every 1 h were used for synoptic conditions, with sounding at Baoshan. The ERA data was accessed on 14 June 2018 can be freely obtained from https://cds.climate.copernicus.eu/. The precipitable water vapor (PWV) derived from GNSS observations and profiler wind observed by wind-profiling radar were also used to help explore water vapor transport features.
Data gathered from S-band operational Doppler radar in Nantong (32.08° N, 120.98° E) were used to investigate the record-breaking predecessor rain event. The composite equivalent reflectivity factor at horizontal polarization (ZH), the differential reflectivity (ZDR), and the specific differential phase (KDP) were utilized to analyze the evolution and microphysical characteristics of the convective system. The laser-optical Particle Size Velocity (PARSIVEL) instrument was also applied to measure the precipitating particle size.

2.2. Backward Trajectory Analysis

The hybrid single-particle Lagrangian integrated trajectory (HYSPLIT, version 4.9) model developed by the NOAA Air Resources Laboratory [42] was applied to calculate the air mass back trajectories using the meteorological data obtained from ERA5 at 1 h intervals. In this study, the 72 h backward air parcel trajectories with an endpoint over Rugao at 20:00 LST 17 July 2019 at 500, 1500, and 5000 m above mean sea level were calculated. More details about the HYSPLIT model which was accessed on 28 January 2010 can be freely obtained from https://www.ready.noaa.gov/HYSPLIT.php (NOAA Air Resources Laboratory, College Park, MD, USA).

2.3. Rain and Ice Water Content Estimation

To determine the rain and ice water contents from Nantong radar measurements, the ZH (dBZ) horizontal polarization reflectivity was initially examined to distinguish water and ice by implementing the ZDP (dB) difference reflectivity method developed by Cifelli et al. (2002) [43]. A Zrain-ZDP relationship in this case was utilized to estimate the rainfall component of ZH.
Z r a i n = 0.8178   ×   Z D P + 12.5088
and
Z i c e = Z H Z r a i n
The Z-M relationship developed was employed to estimate the ice and liquid water contents.
M w = 3.44 × 10 3 ( Z r a i n ) 4 / 7
M i = 1000 π ρ i N 0 3 / 7 × 10 3 ( 5.28 × 10 18 Z i c e 720 ) 4 / 7
where Mw and Mi are the water contents of rain and ice, respectively; ρ i represents the density of ice; and N0 denotes the intercept parameter of an assumed inverse exponential distribution for ice. In the case of pure ice, Equation (4) was utilized to compute the ice water content.

2.4. Parsivel Disdrometer

The Parsivel is an advanced laser-based disdrometer used for simultaneous measurements of precipitated particle size (ranging from 0.2 to 5 mm for liquid particles and 0.2 to 25 mm for solid particles) and fall velocity (ranging from 0.2 to 20 m/s). The instrument records these data using a grid of 32 × 32 in size and fall velocity classes [44,45].
The 1 min samples with fewer than 10 raindrops or rainfall rates less than 0.1 mm/h were excluded from the analysis to ensure data accuracy. Additionally, raindrops with diameters greater than 6 mm and 60% above or below the empirical fall velocity–diameter relationship established by Atlas et al. (1973) [46] were also discarded. It is worth noting that no solid precipitation was observed.
The following equation was then used to describe the quality-controlled raw spectra, which was used to estimate the raindrop number concentration N D i (unit: mm−1 m−3).
N D i = j = 1 32 n i j A · t · V j · D i
where n i j represents the number of raindrops in the i-th (where i ranges from 1 to 32) size bin and j-th (where j ranges from 1 to 32) velocity class. A (unit: m2) denotes the effective sampling area (0.0054 m2) and t (unit: s) is the sampling times. V j (unit: m/s) and D i (unit: mm) indicate the fall velocity of raindrops within the j-th velocity class and the diameter of raindrops in the i-th size bin, respectively. The width of the i-th class diameter is denoted by D i . N D i represents the number concentration of raindrops within the size range from D i to D i + D i in the i-th diameter class over all velocity classes.

3. Case Overview

3.1. Rainfall Distribution

Figure 1a shows the distribution of the 12 h accumulated precipitation from 20:00 on 17 July to 08:00 on 18 July, and the main rain band was located in the central-eastern part of Jiangsu Province along the Yangtze River. An hourly precipitation of 161.9 mm was observed in Rugao sation (Figure 1b), which broke the historical record and is also the second highest hourly precipitation in Jiangsu since 1961.
The time series of minute precipitation and radar reflectivity over Rugao (Figure 2) show that the precipitation process experienced four main stages, S1 (19:02–19:50 LST), S2 (19:51–21:10 LST), S3 (21:11–22:10 LST), and S4 (22:11–00:57 LST). At S1, under the influence of the convective system periphery, the precipitation intensity was no more than 0.5 mm/min. Starting from 19:51 LST, affected by the convective body, the reflectivity almost exceeded 50 dBZ, and some under the melting layer even surpassed 60 dBZ. Also, the echo top was below 10 km. At S2, precipitation efficiency was very high, the minute precipitation significantly exceeded 2 mm, and the peak reached 3.8 mm. After 21:11 LST, influenced by another newly generated convection, which was weak compared to S2, the reflectivity below the melting layer was within 50 dBZ. However, the echo top was higher; above 10 km, there was still a reflectivity of more than 30 dBZ. In addition, the precipitation intensity had decreased, with a minute precipitation ranging from 1.5 to 2 mm. Since 22:11 LST, the strong convection moved away from Rugao, leaving the influence of weaker convection and bringing a significantly lower precipitation intensity, with a minute precipitation less than 0.5 mm.

3.2. General Radar Evolution

From 17:00 LST 17 July 2019, convection was generated along the coast and gradually developed to the southwest until about 19:00 LST (Figure 3a,b). At 19:00 LST, a new convection was generated southwest of Rugao, merged and strengthened with the monomer propagating from its northeast, and rapidly and gradually developed into a northeast–southwest-oriented MCS system [21]. The convection rapidly increased, with the strongest reflectivity exceeding 60 dBZ (Figure 3c–f). This rainband repeatedly formed near Rugao, similar to the quasi-stationary backward building MCS, resulting in the echo-training process, bringing about continuous heavy rainfall over Rugao. After 22:00 LST (Figure 3g–i), convection weakened, the precipitation intensity also weakened, and the strong precipitation gradually weakened and stopped.

3.3. Synoptic Conditions

Typhoon Danas was located offshore east of Luzon Island in the Philippines at the time of the heavy precipitation, about 1400 km away from the area where the heavy precipitation occurred. At 08:00 LST 17 July (Figure 4a), before the precipitation started, there was a high-altitude jet stream north of 35° N at 200 hPa with the maximum wind speed exceeding 35 m s−1, and the high-altitude jet stream gradually strengthened and moved southward. At 20:00 LST 17 July (Figure 4b), when the heavy precipitation occurred, the jet stream moved southward to 34° N with the maximum wind speed exceeding 40 m s−1. At 500 hPa, there was obvious dry and cold air transport over the precipitation area, the westerly trough gradually moved eastward over the area near 120° E where the heavy precipitation occurred, the western Pacific subtropical high was in the shape of a partial flat belt, and its ridge was located near 26° N. As Typhoon Danas moved northward, the subtropical high gradually moved northward and the moisture gradually increased. At 850 hPa, there was a shear line maintained near 30~33° N (Figure 4c). The shear line moved slightly south, maintained near 33° N, with the northward movement of the typhoon. The low-level jet stream gradually moved northward, and by 20:00 LST 17 July, it moved to the south side of the region where the heavy precipitation occurred (Figure 4d). The specific humidity exceeded 14 g kg−1 and the relative vorticity reached more than 25 × 105 s−1 at the time of precipitation occurrence over Rugao.
The sounding of Baoshan station at 20:00 LST 17 July showed a lower relative humidity near 500 hPa and 750–800 hPa, an approximately saturated warm moist layer below 850 hPa, and a reduced loss of water vapor from dry air entrainment. Southerly flows were below 600 hPa (Figure 5). The very small convective inhibition (CIN, approximately −4.24 J kg−1), low level of free convection (LFC, ~755 hPa, 2.52 km), lifting condensation level (LCL, ~948 hPa, 0.53 km), and medium thin convective available potential energy (CAPE, ~1850 J kg−1) suggested that the atmospheric environment was conducive to the development of short-term heavy rainstorms. Using the height between the LCL and the melting layer height (~5.49 km) to estimate the warm cloud thickness shows that it was approximately 4.96 km, which was a relatively deep warm cloud layer and ensured the sufficient development of the warm rain.

4. Moisture Sources and Transport

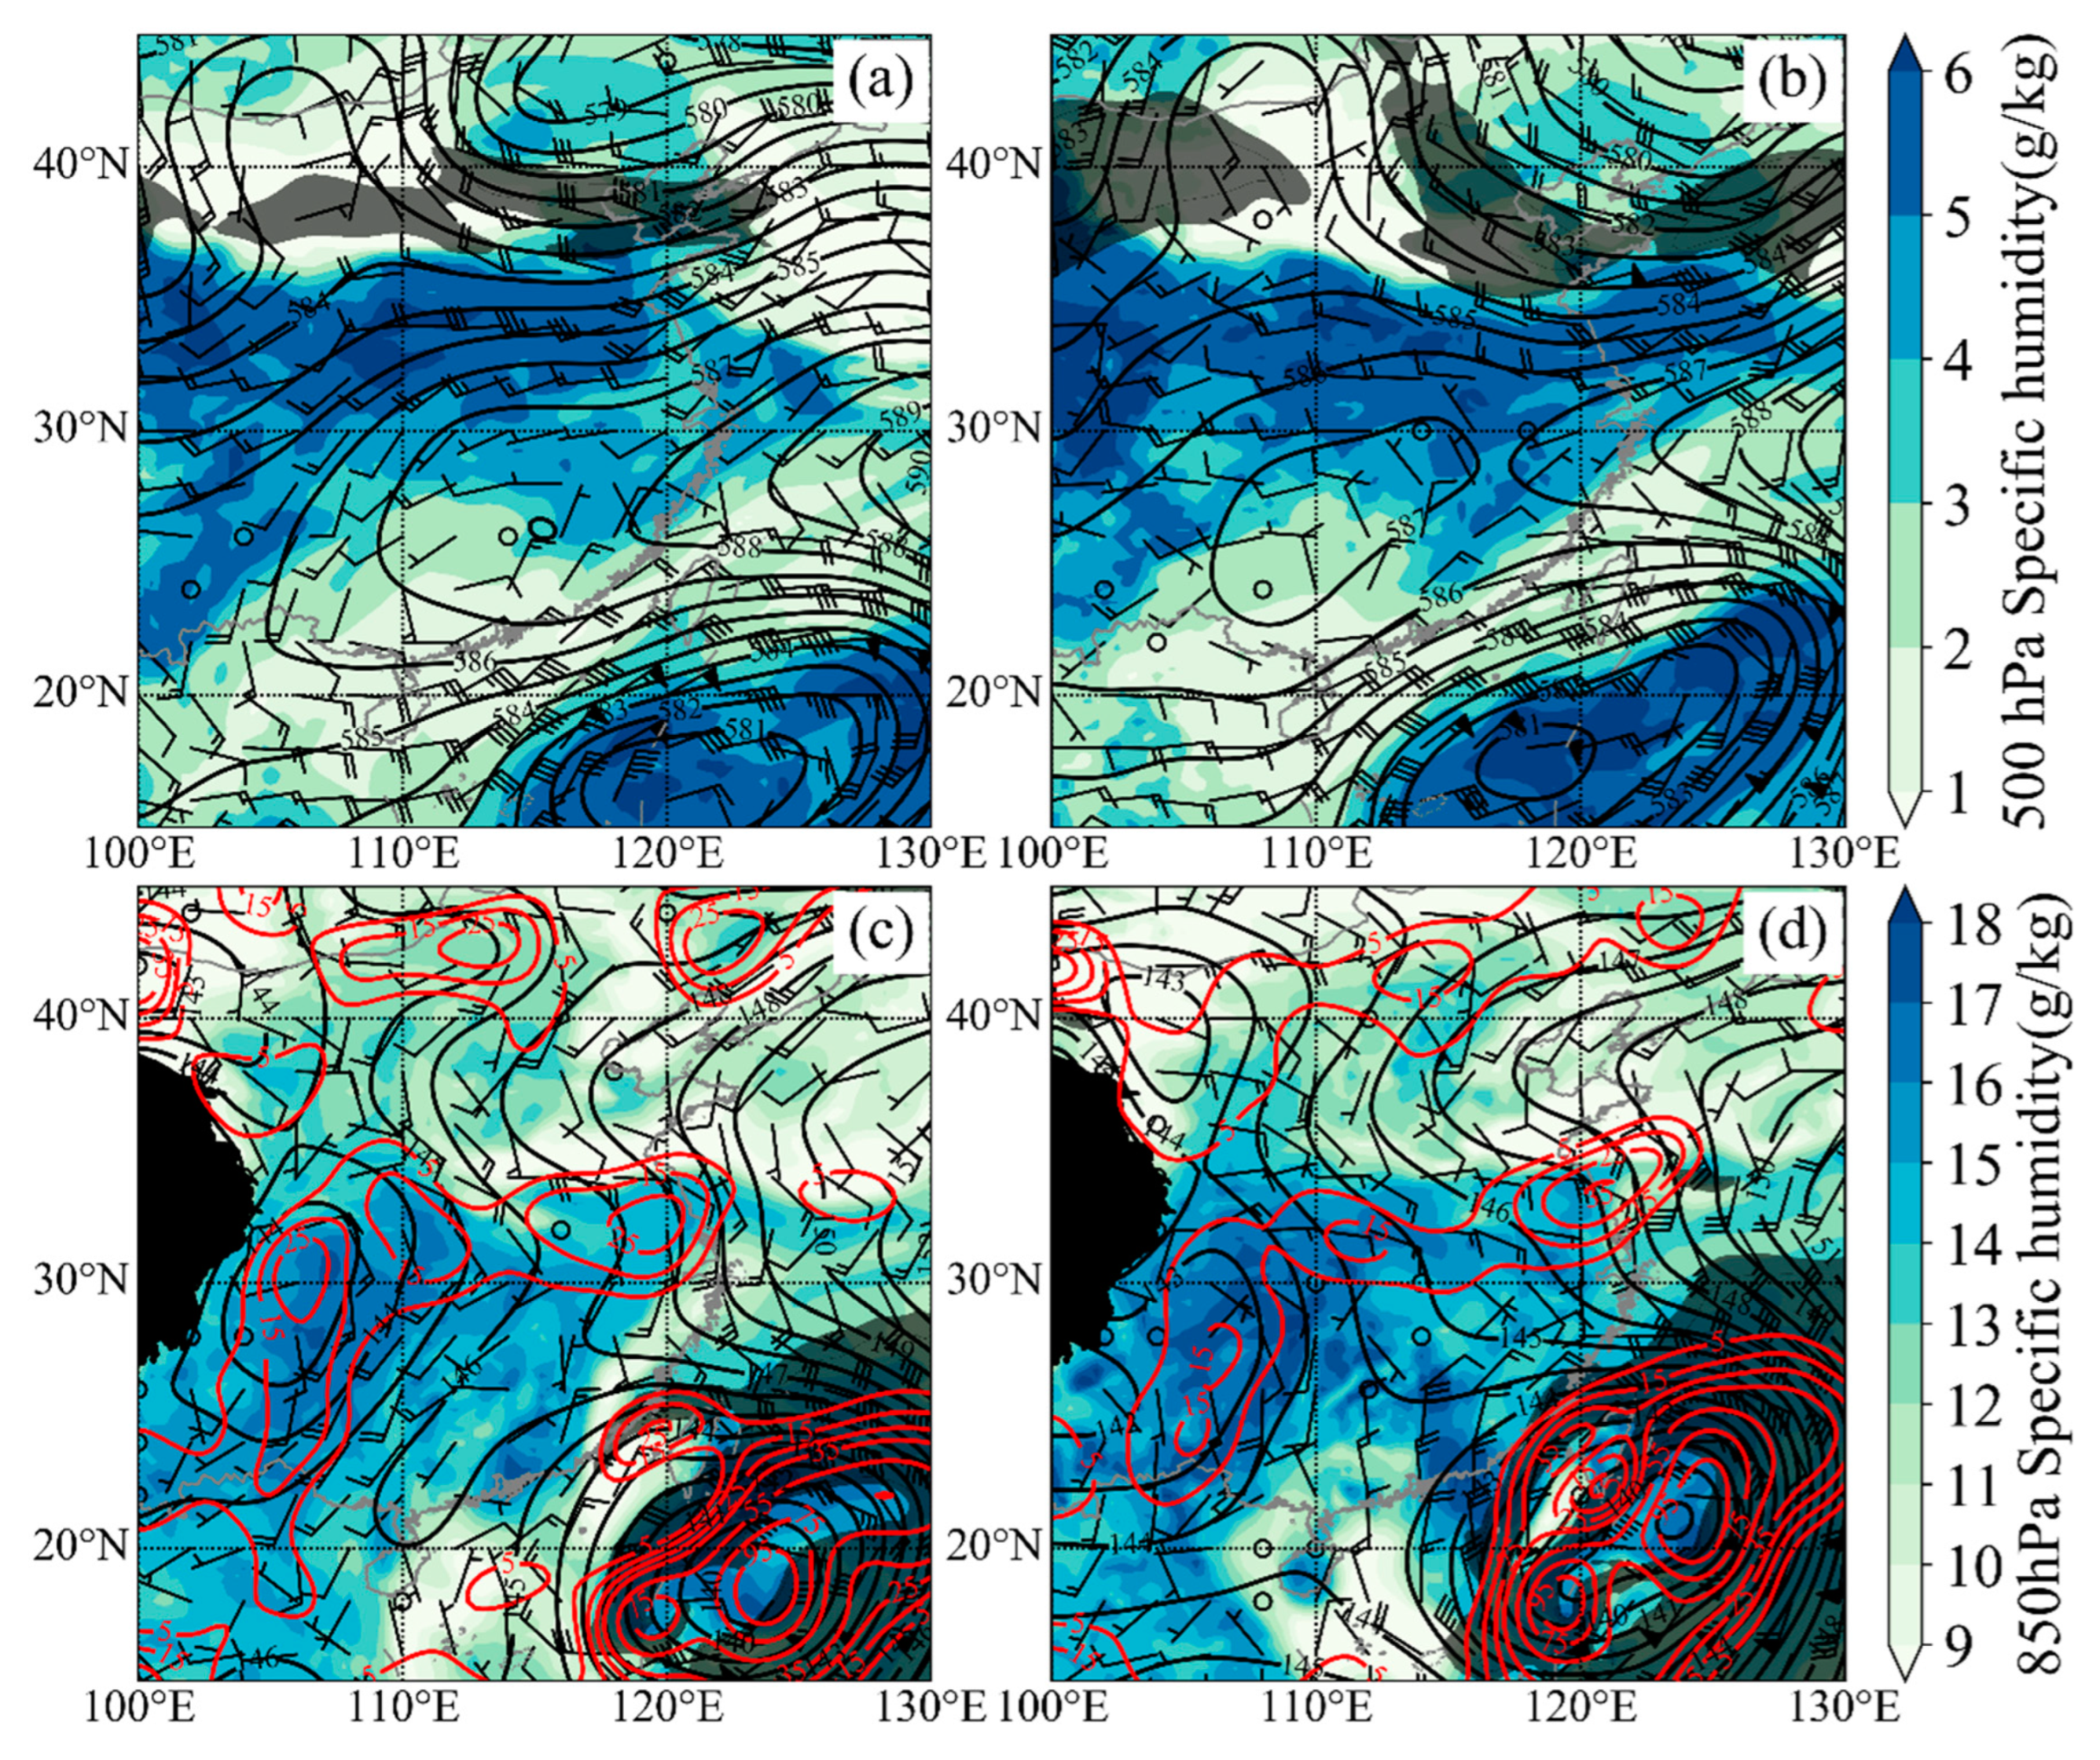
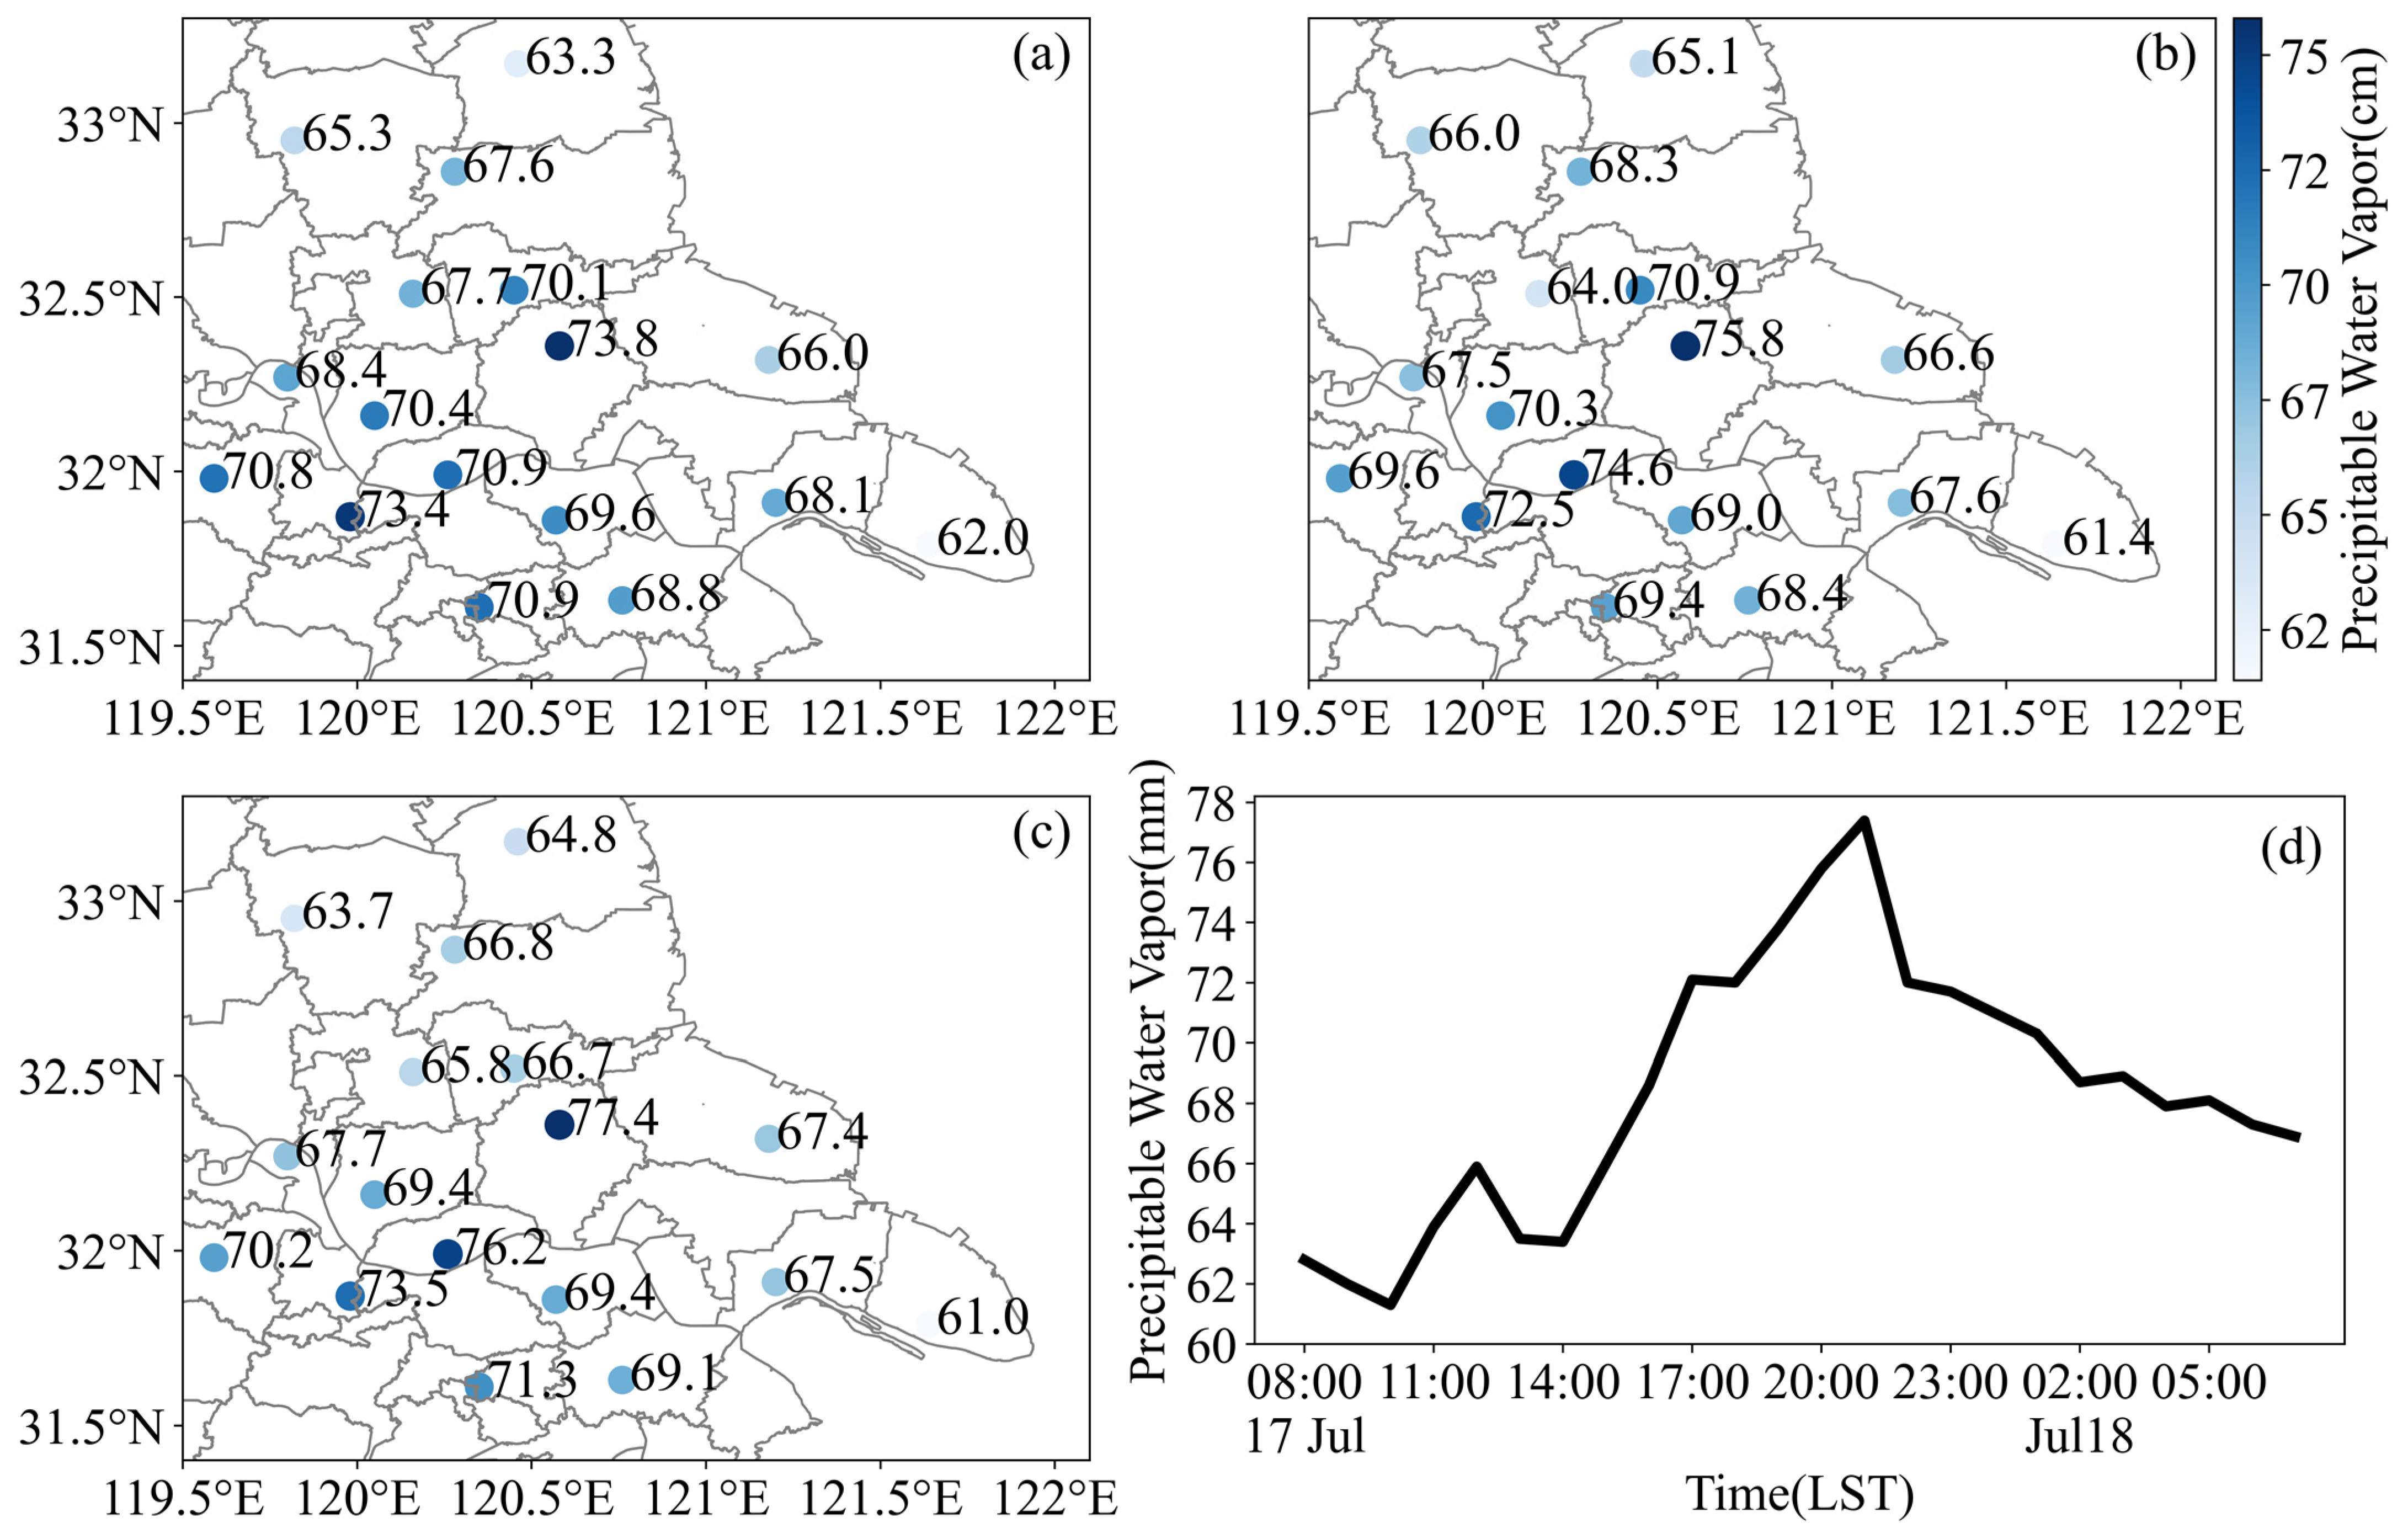
A sufficient supply of moisture is crucial to the maintenance of heavy rainfall. Starting from the afternoon of 17 July, the typhoon outer southerly airflow transported moisture to reach the heavy precipitation area (Figure 6d). The PWV of Rugao increased from 68.6 mm to 72.1 mm from 16:00 LST to 17:00 LST. And at 19:00 LST before the beginning of heavy precipitation, the PWV in the heavy precipitation area exceeded 70 mm, with the PWV of Rugao station the largest, reaching 73.8 mm (Figure 6a). But the PWV of the surrounding areas without a rainstorm was generally lower than 65 mm. With the development of a rainstorm, the PWV of the strong precipitation area gradually increased, reaching the strongest at 21:00 (Figure 6b,c), up to 77.4 mm at Rugao.
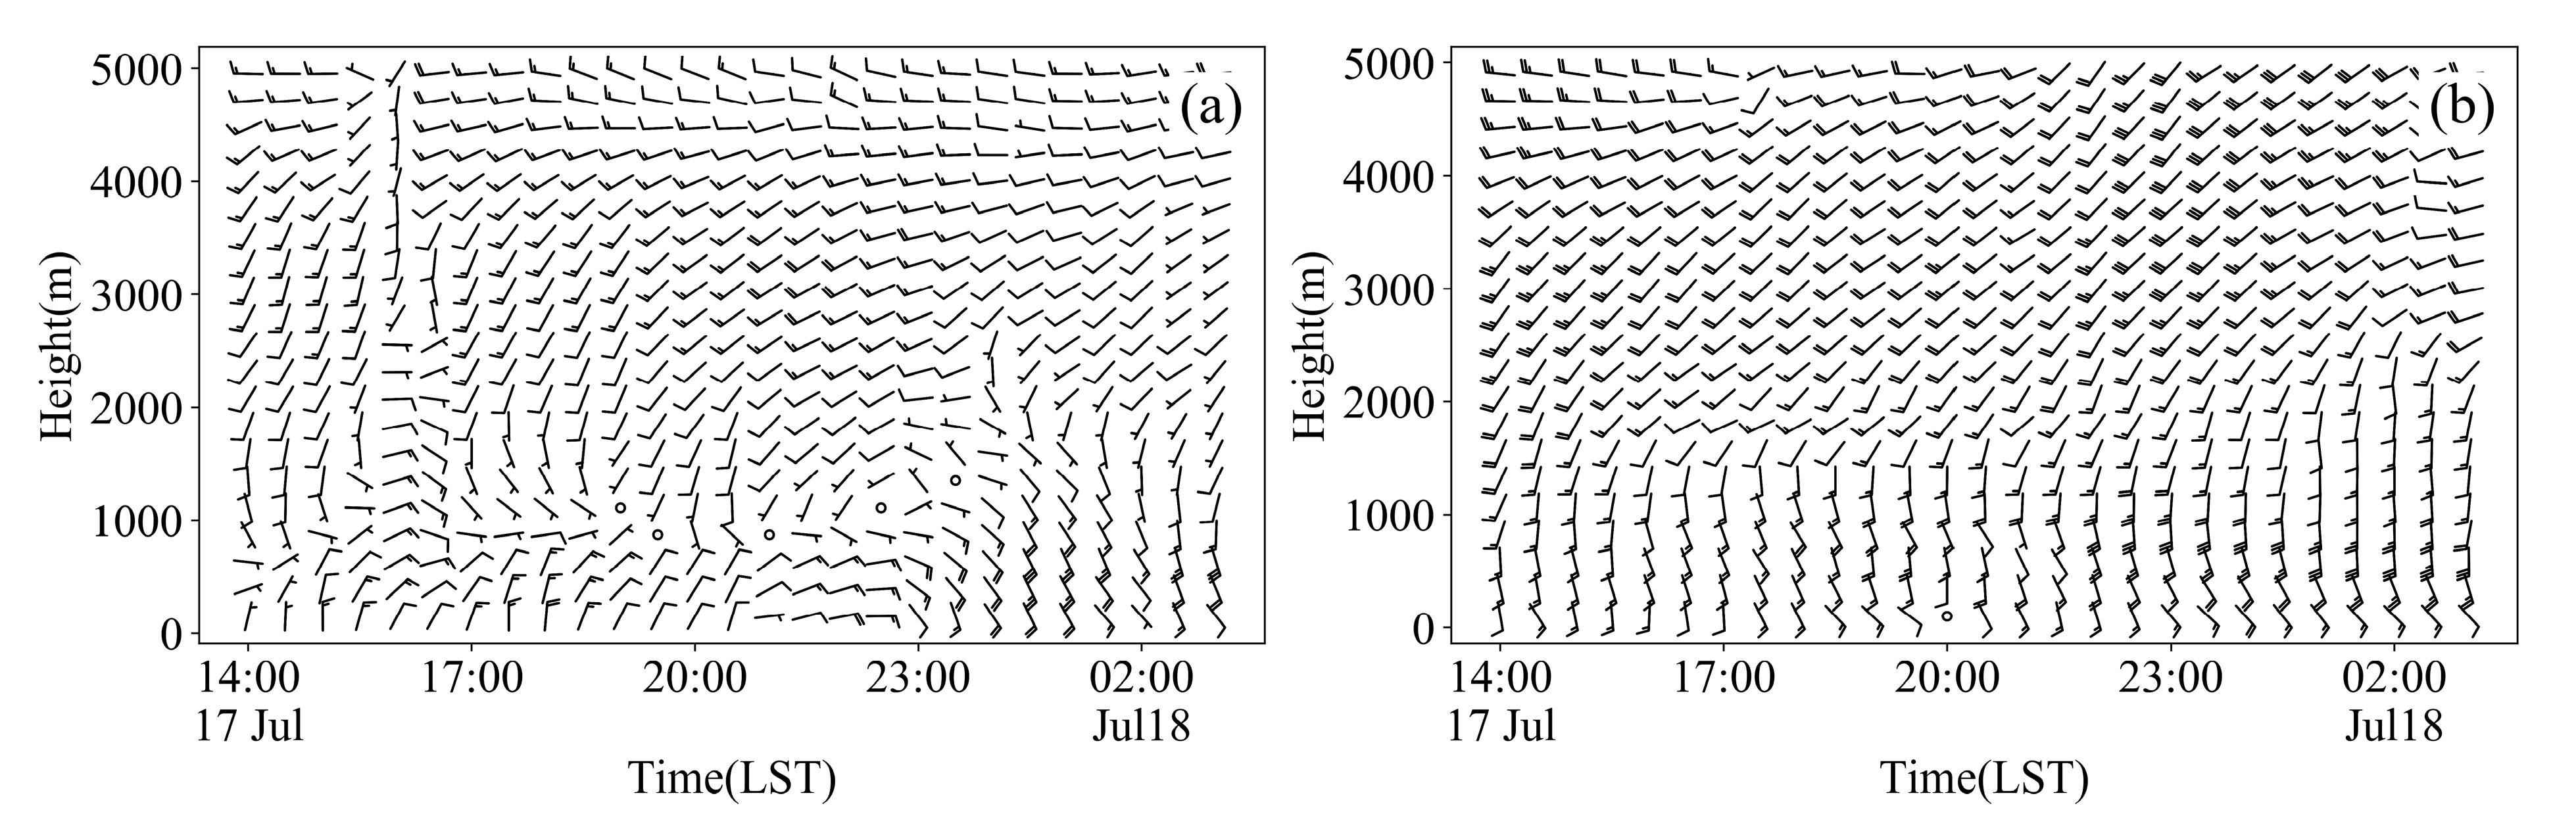
The low-level moisture increase was closely related to the changes in the winds. From 14:00 LST to 20:00 LST before the beginning of strong precipitation in Rugao, the Zhangjiagang wind-profiling radar south of the rainfall center observed a consistent southerly airflow at low altitude with a thickness of about 1.5 km and a consistent southeasterly airflow above 2 km (Figure 7a). And a consistent northerly flow, with a thickness of about 1 km, was observed on the northwest side of the Taizhou wind-profiling radar (Figure 7b). The low-altitude wind field formed an obvious convergence, which was favorable for the accumulation of moisture in the region, making the convection more organized. After the start of the heavy precipitation, the low-altitude winds observed in Taizhou gradually changed to easterly-southeasterly winds, and the intensity of the low-altitude southerly winds observed in Zhangjiagang increased significantly and stretched to more than 2 km with enhanced thickness, which could continuously transport more water vapor to the area of heavy precipitation.
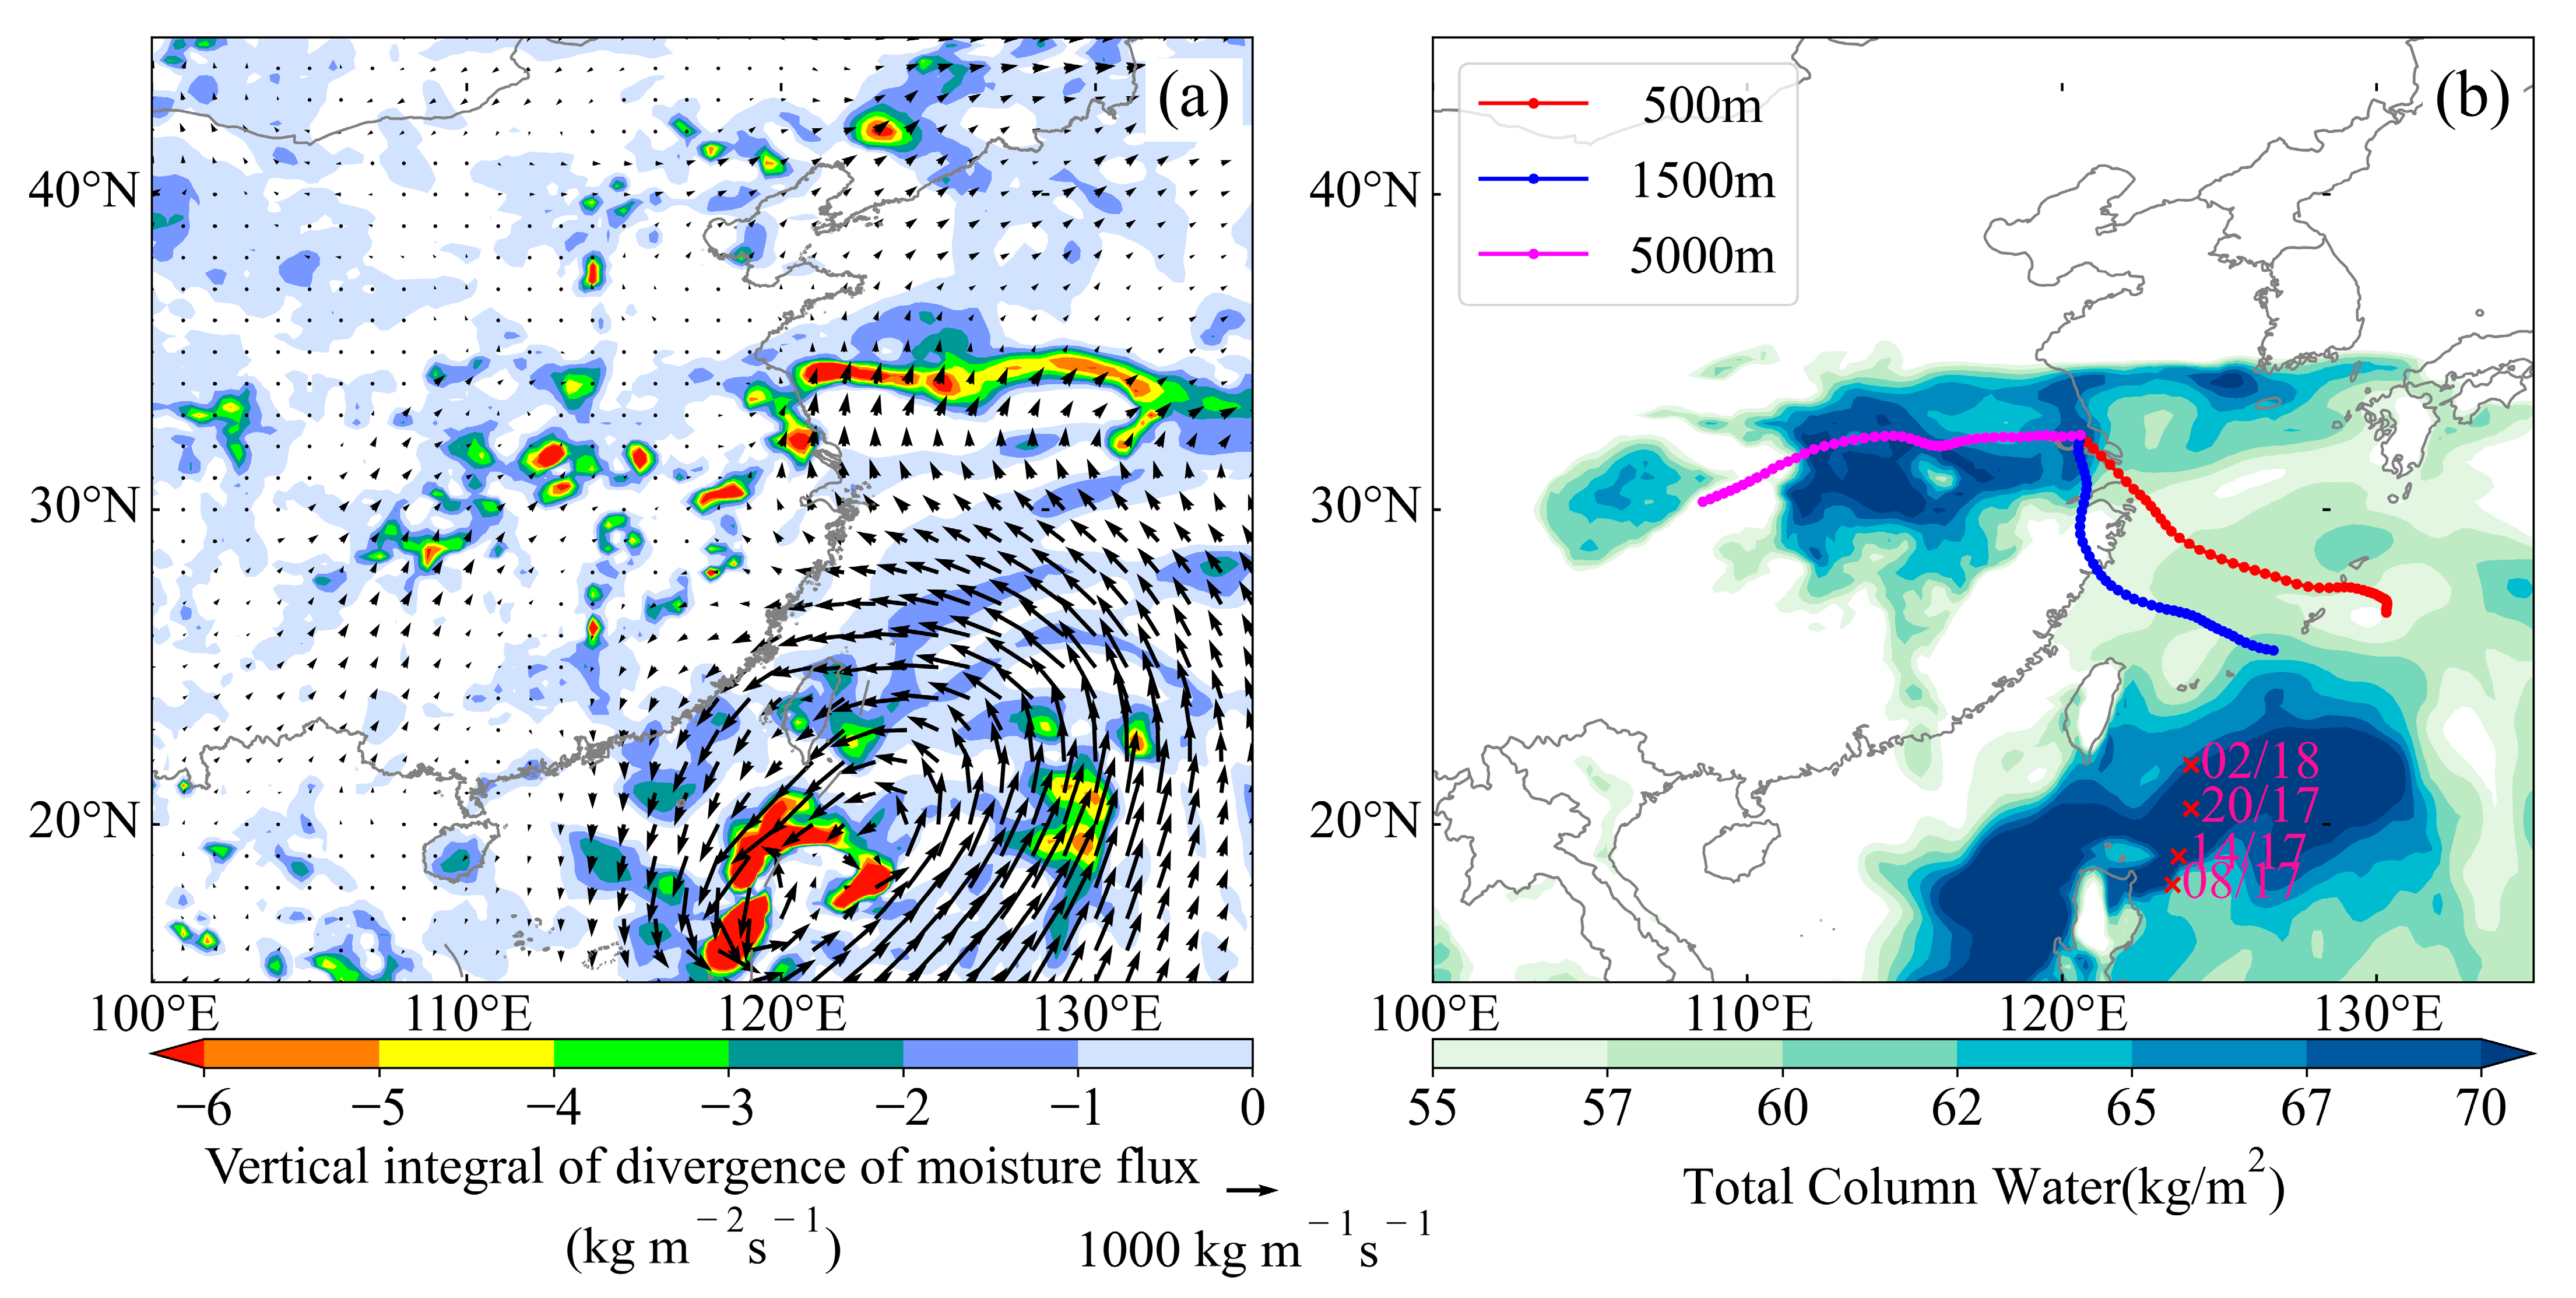
Figure 8a shows the vertical integral of divergence of the moisture flux as well as moisture flux vectors at 16:00 LST 17 July. An obvious water vapor conveyor belt can be detected to be transported from the southward direction of the typhoon circulation over the area of heavy precipitation, and a strong water vapor flux convergence formed over it. Backward trajectories for a 72 h period ending at 20:00 LST 17 July and ending at 500 m, 1500 m, and 5000 m over Rugao for the water vapor transport characteristics at ultra-low, low, and mid-high altitudes, respectively, were computed (Figure 8b). The results show that the low and ultra-low air masses in this heavy precipitation region mainly came from the East China Sea, consistent with the typhoon circulation, while the dryer air masses at high altitudes were transported from southwest China. Adequate water vapor transport and large atmospheric precipitable water over Rugao provided sufficient water vapor for the occurrence of a record-breaking heavy rainstorm.

5. Evolution of Mesoscale Precipitation System

As the Rugao station recorded the extreme hourly precipitation associated with the precursor precipitation system separate from Danas, it is of interest to investigate how the evolution of mesoscale raining systems affected the variations in local rainfall at Rugao.
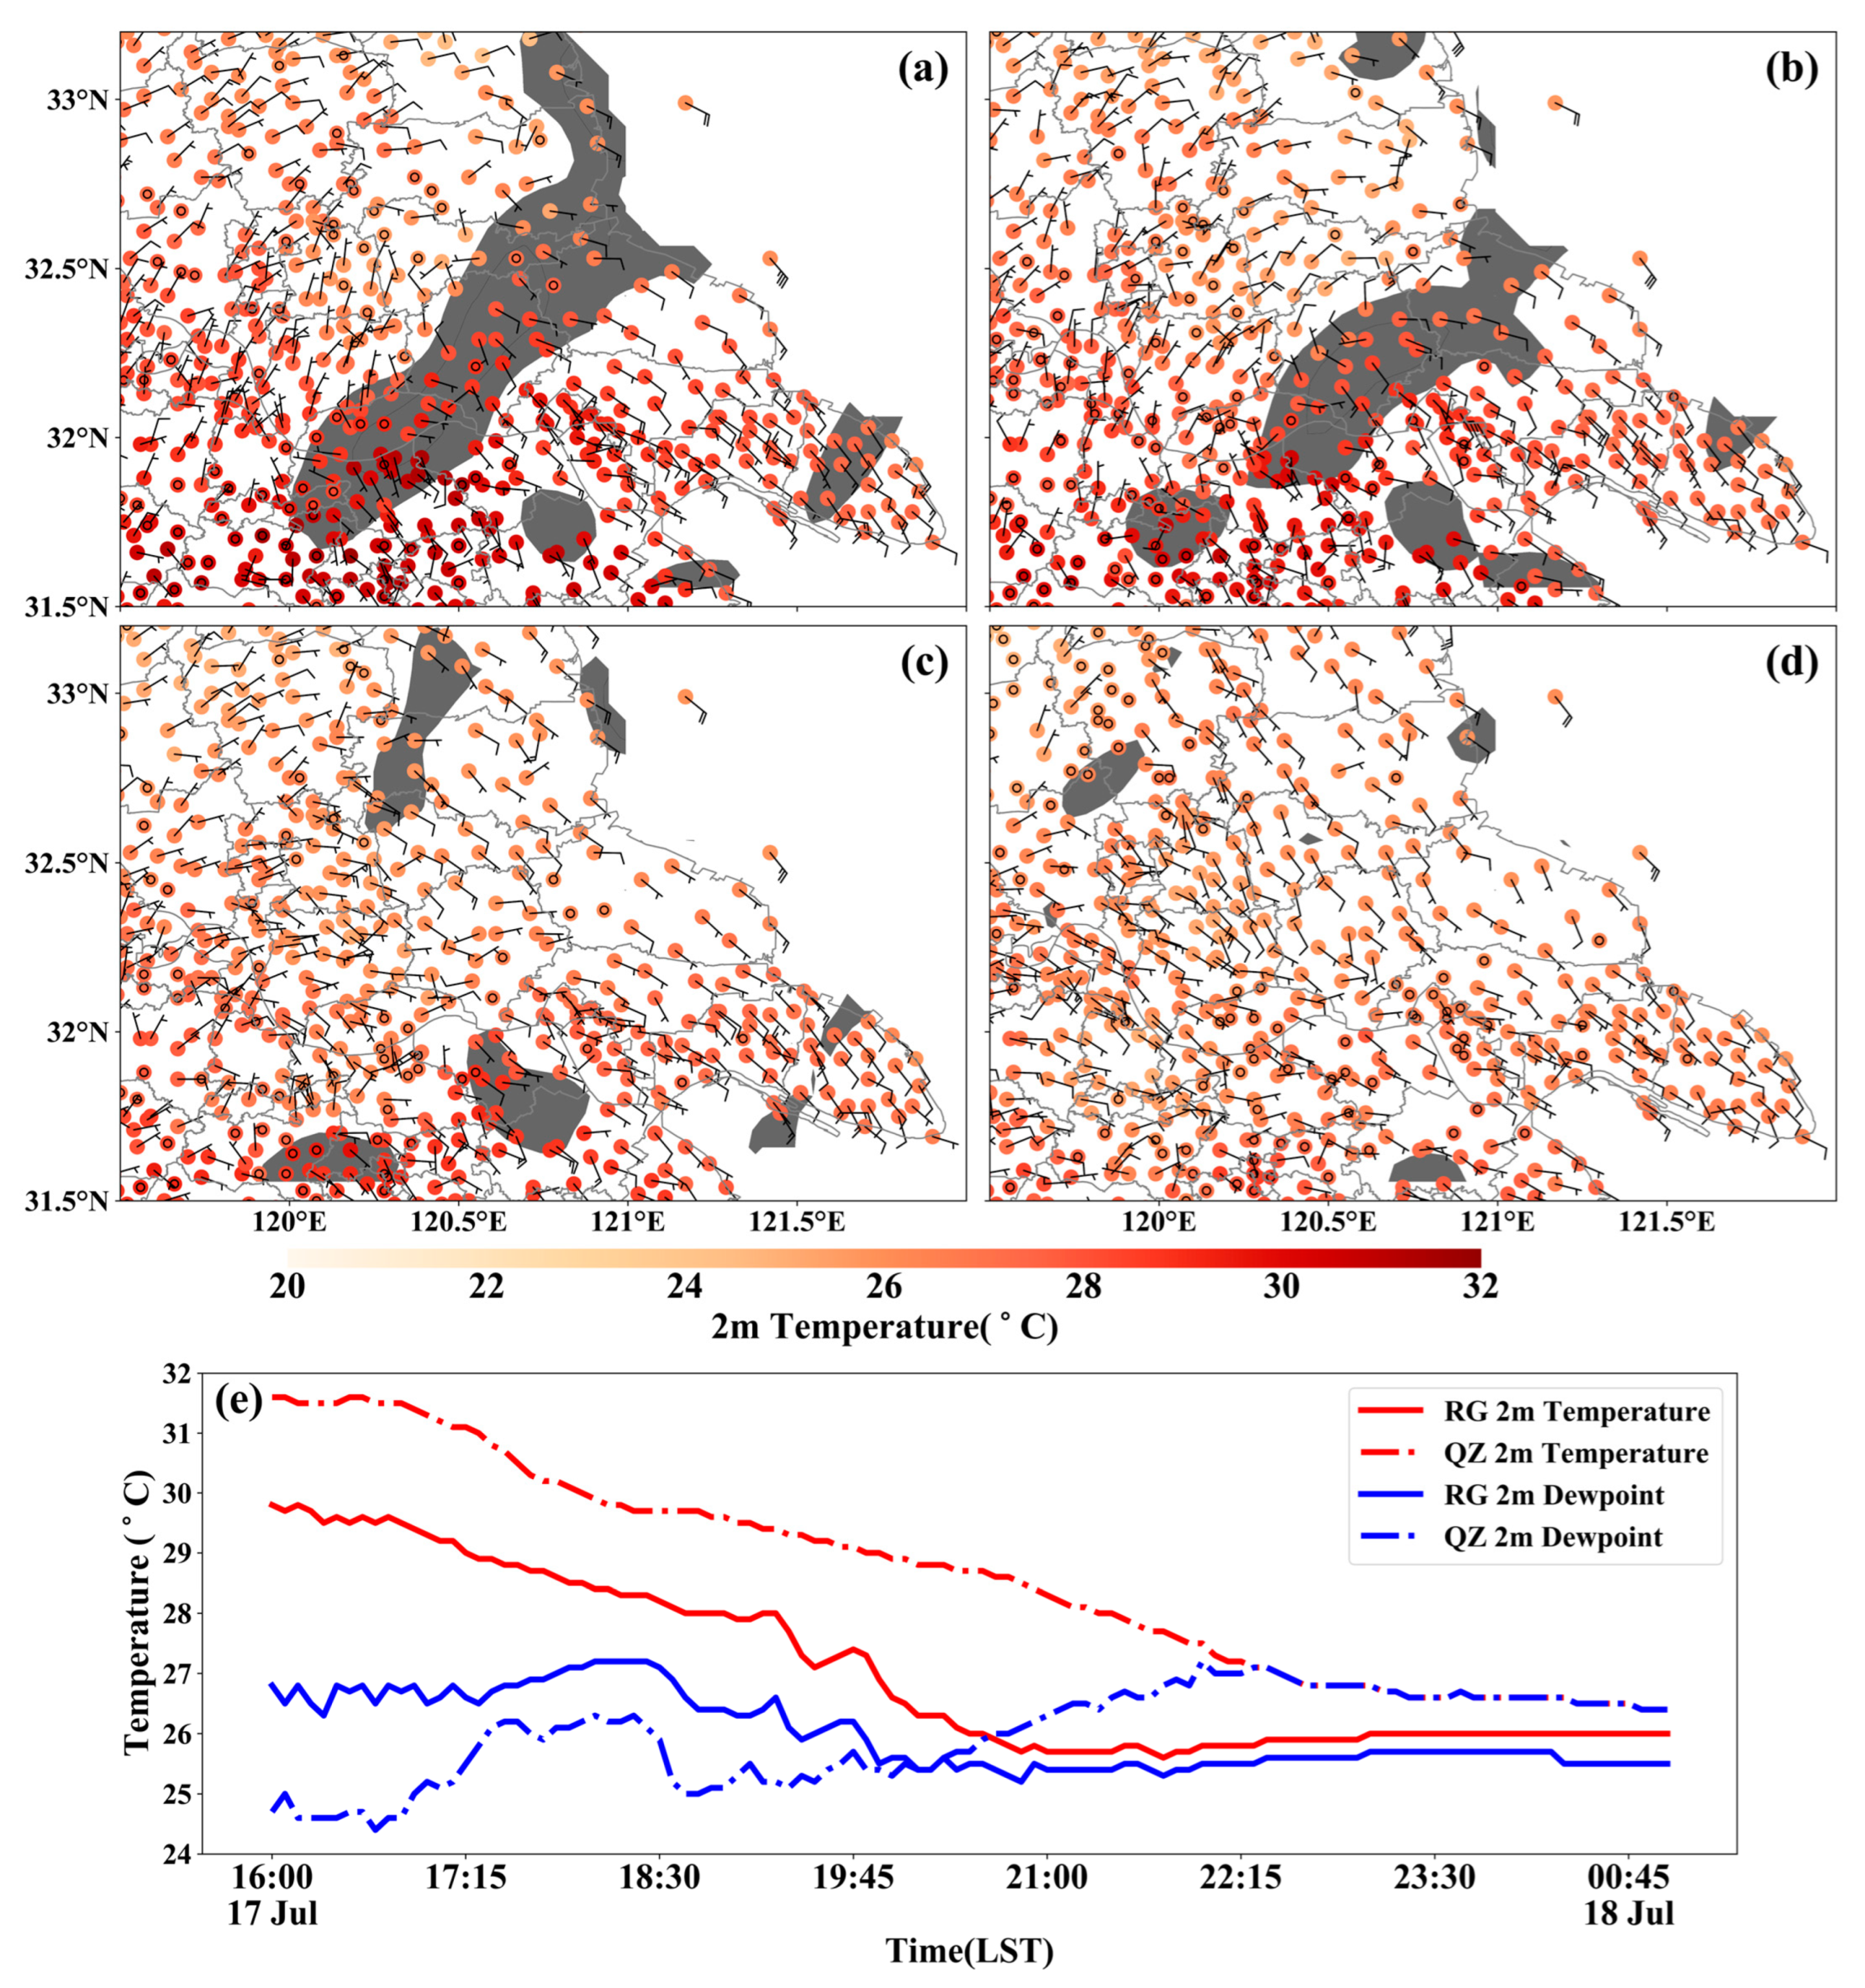
Analysis of the automatic station data showed that a low-temperature center was formed at 19:00 LST (Figure 9a), with Rugao as the center. Since the low-temperature center appeared earlier than the precipitation, the precipitation was not the main reason for the cooling. The time series of the 5 min 2 m temperature (Figure 9e) show that with the gradual weakening of sunshine, Rugao’s temperature began to decrease, and the temperature dropped from 29.8 °C to 28 °C starting at 16:00 LST to 19:15 LST. After 19:15 LST, influenced by the cold advection from the ground, the temperature from 28 °C to 19:20 reduced to 27.7 °C. The cooling rate was 6.5 times the normal radiation cooling level, compared with the QinZao automatic station on the south side of Rugao, where the temperature gradient increased significantly. No precipitation was observed at Rugao station during this period, and the wind direction changed from southwesterly to northerly, with a significant drop in dewpoint at the same time. This was a result of the sinking of the near-surface cold pool generated by the convection, bringing low-level inflow to invade near Rugao, and the convergence of the southeasterly warm and moist airflow triggered the convection. Meanwhile, the mesoscale temperature gradient caused by the cold pool and the convergence of the wind field are important reasons for the convection trigger.
After the triggering of convection (Figure 8b), consistent northerly flows existed in the Rugao area, indicating that large-scale weak cold air merged with the cold pool caused by convection, producing drastic cooling. The rapid southward movement of the mesoscale front affected the Rugao area, merging with the already existing convection in the southwest to develop and enhance. In comparison with the Qinzao automatic weather station (Figure 9e), the station only observed precipitation beginning at 21:30, with an 8.3 mm precipitation amount, which was located at the edge of the main rainband. Its temperature dropped slowly before the precipitation started, and the speed was slightly lower than the cooling speed brought by radiation cooling. The dewpoint temperature gradually increased from 26.1 °C at 18:30 LST to 26.8 °C before the precipitation started at 21:30 LST, which indicated that there was warm advection on the south side of the main rainband all the time, conveying warm and moist airflow to the main rainband.
However, although the cold air was relatively weak, the southward warm and moist airflow was relatively strong. The mesoscale front remained stable near Rugao, making the convection over Rugao persistently maintained, and eventually produced a total rainfall of more than 286.4 mm of extreme heavy precipitation (Figure 9c). After 22:00 LST (Figure 9d), the cold pool gradually disappeared, consistent easterly airflows appeared over Rugao (with weaker warm and moist airflow transport at low altitude), convection weakened, and precipitation gradually stopped. The slow movement and prolonged maintenance of mesoscale convective rainbands due to back-building processes were the determining factors for record-breaking precipitation in Rugao.

6. Microphysical Characteristics

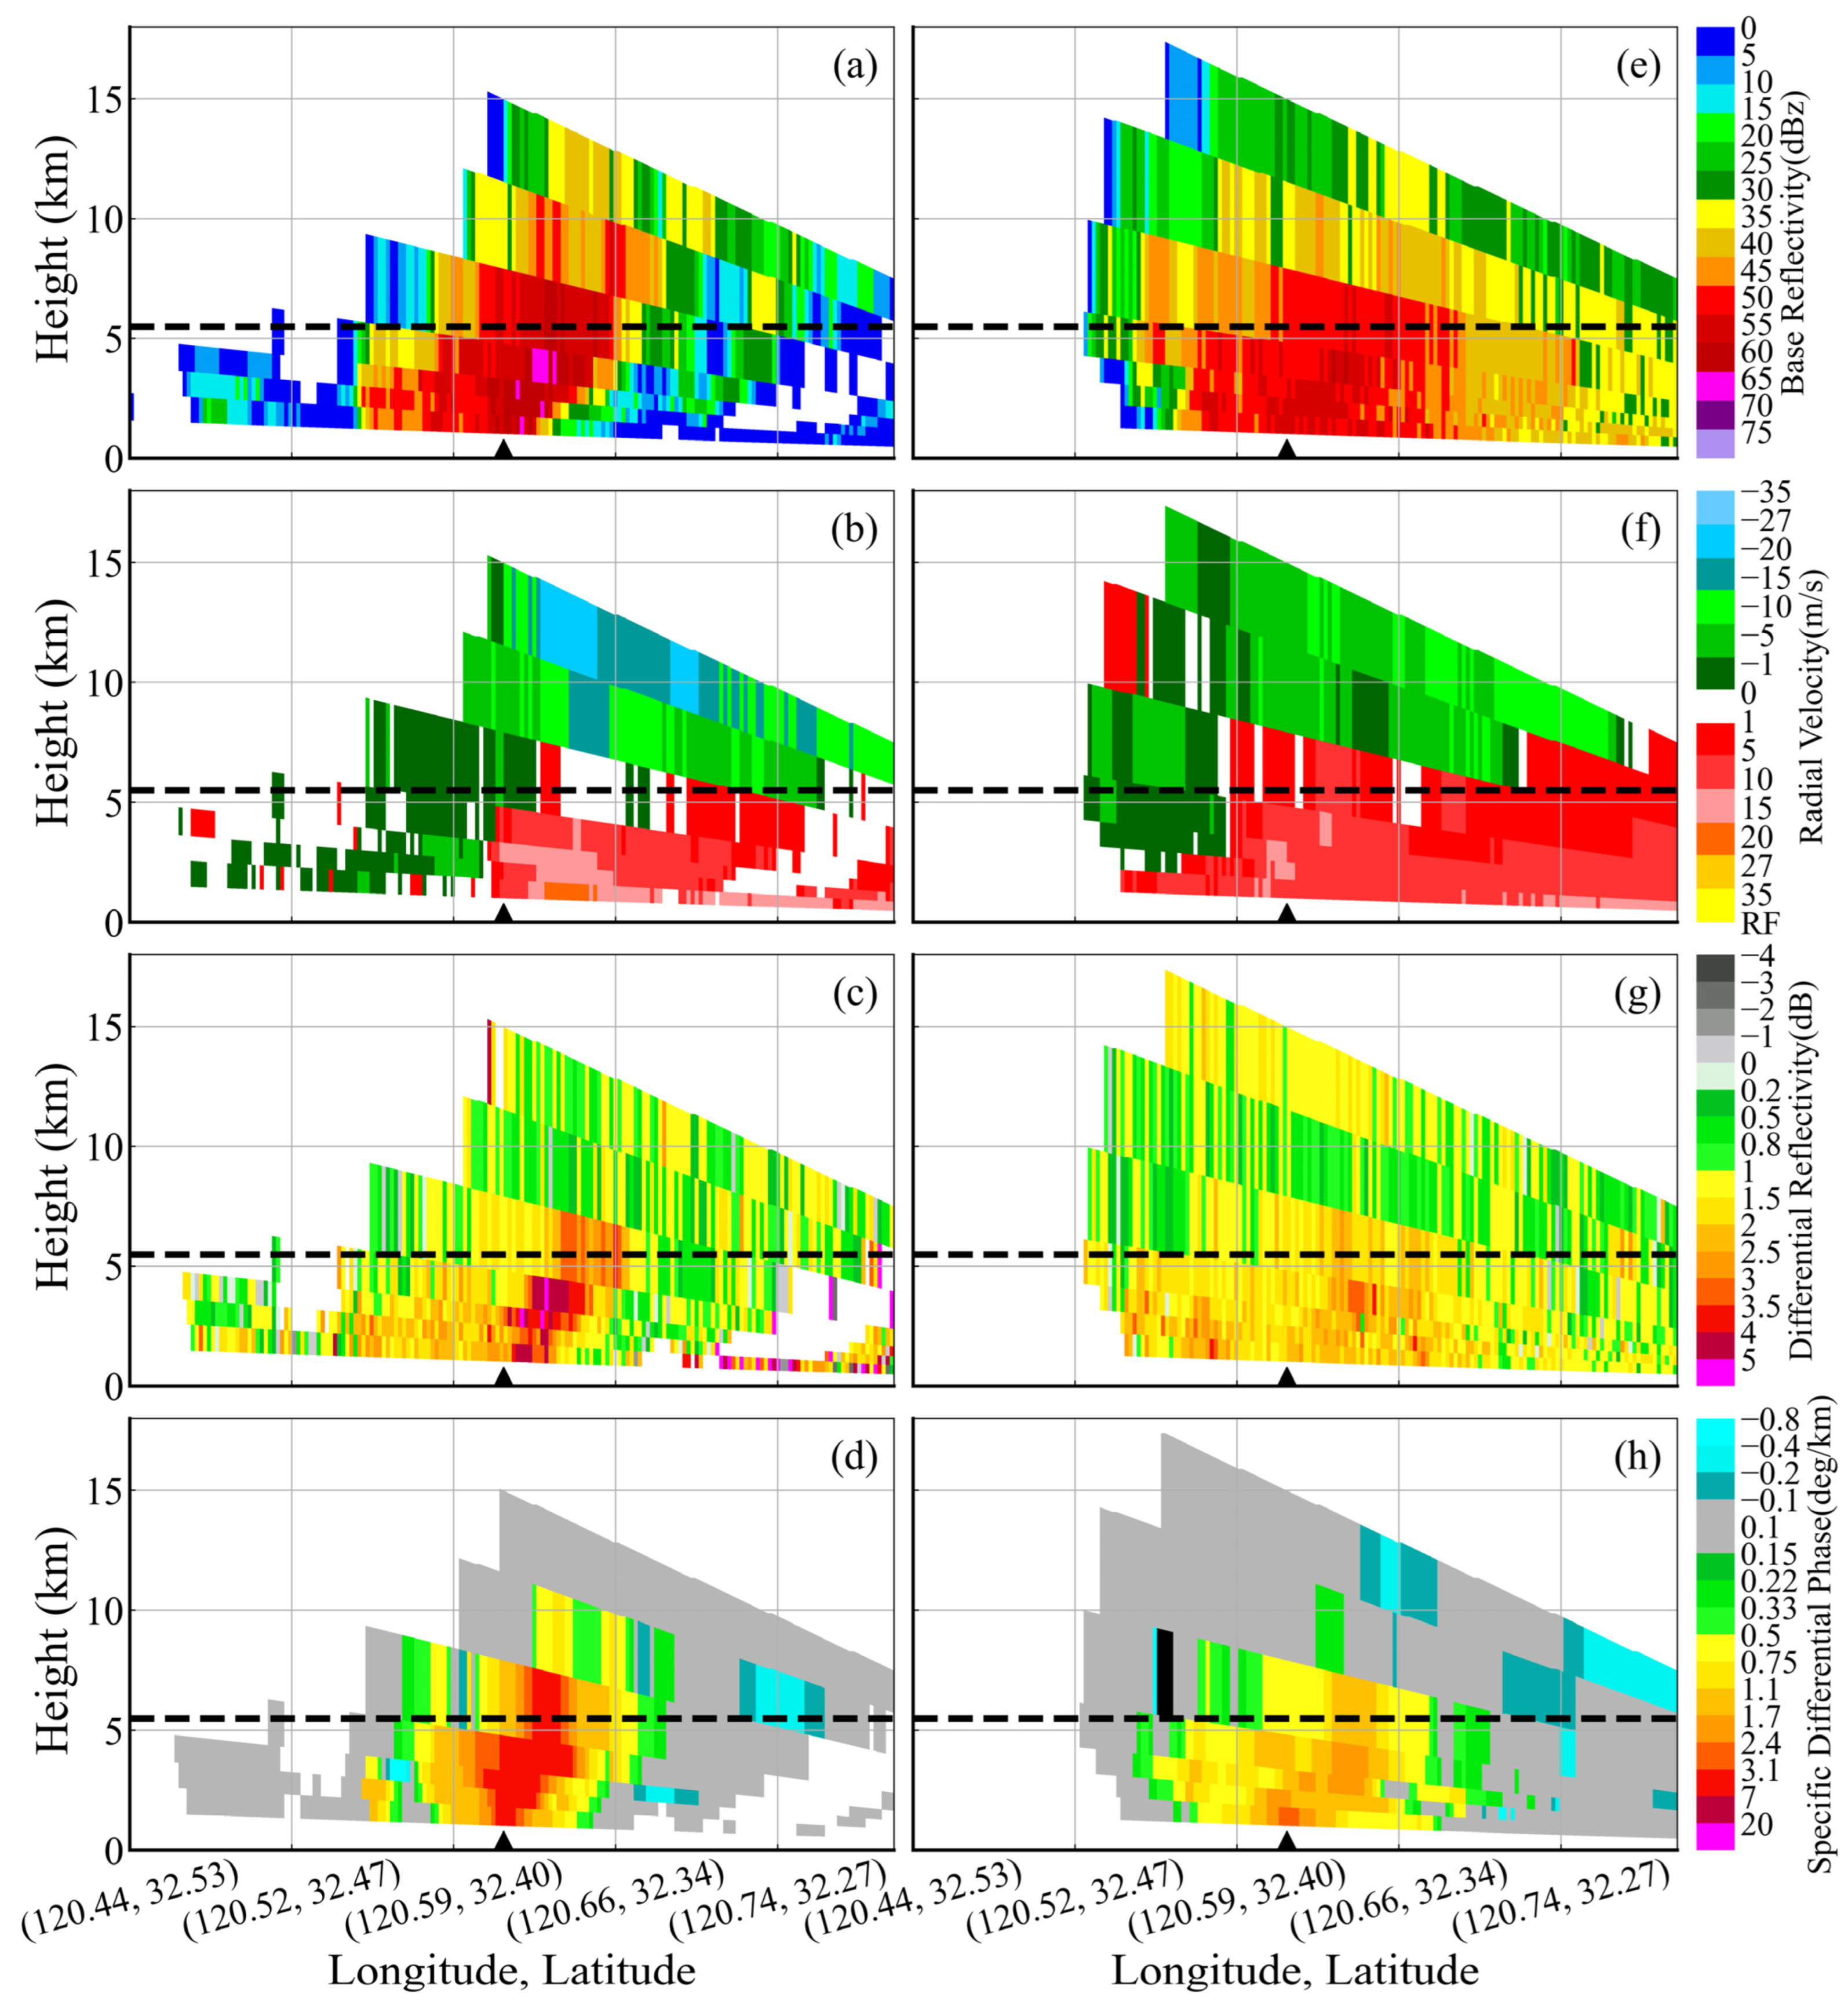
Figure 10 shows the vertical cross-sections of polarimetric variables of the developing and mature stage over Rugao. The strongest reflectivity of the Rugao convection development stage (Figure 9a) was located below the melting layer with a dense structure of convection, and there was an obvious bounded weak echo area. There was a reflectivity above 55 dBZ above 8 km, and strong echoes above 60 dBZ appeared in the lower layers, which were characteristic of a low-core convection structure. The phase of precipitation particles in this type of cloud was dominated by liquid water, and the content of ice-phase particles was low, which can explain the high precipitation efficiency and low frequency of lightning in this event. The airflow had produced a strong convergence over Rugao (
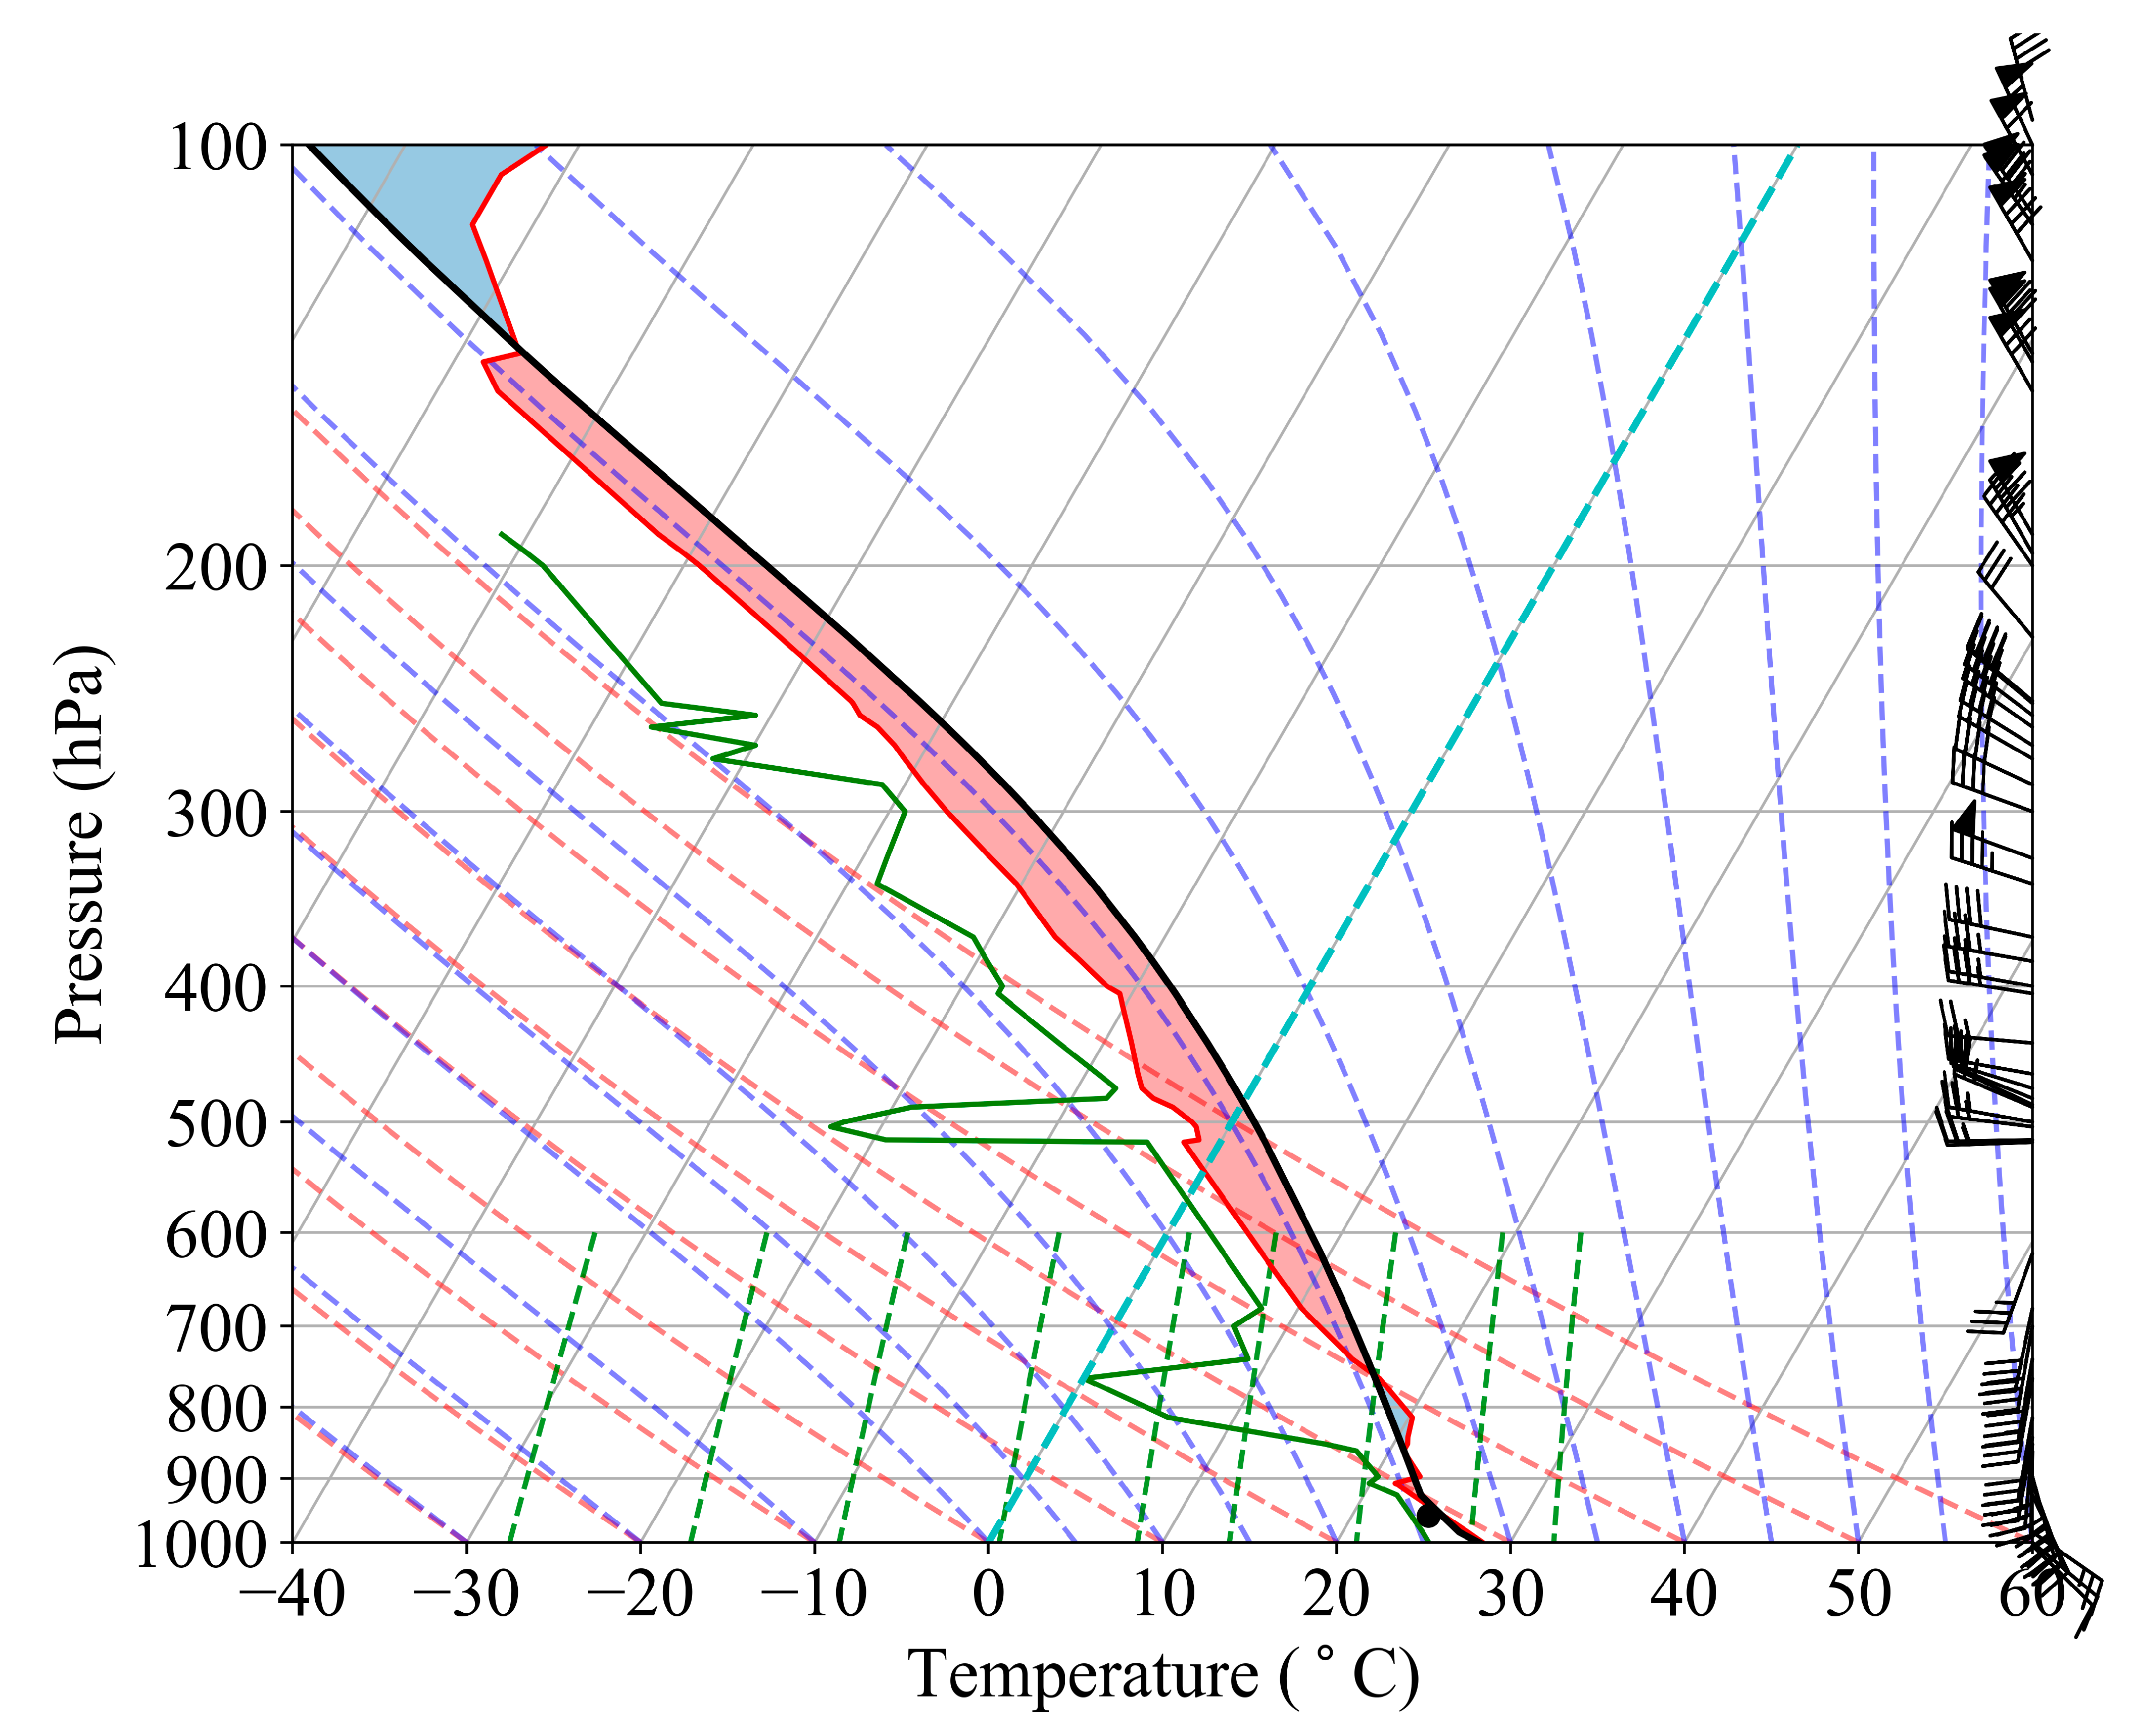
Figure 10b), forming a strong updraft. The velocity of the southeastern airflow in the low-altitude atmosphere was up to 20–27 m s−1, which had been significantly larger than the wind speed detected by the sounding (Figure 4), indicating that the strong warm and moist airflow at low altitude was located in the frontal inclined upward motion area of the well-developed convective system. The enhanced low-level airflow brought sufficient moisture and energy transport, which was favorable for the further development of the well-organized MCS system. In the back-building processes of convection, the mechanism of convection development is the interaction of its own kinematic field with the warm and moist airflow. The presence of very strong ZDR column echoes greater than 4 dB over the southeast of Rugao, up to near 8 km, and the area where the ZDR column was located having a radial velocity away from the radar (Figure 10c), indicating the existence of this strong updraft here, are consistent with the findings of Brandes et al. (1995) [47] through aircraft observations. Similar to the ZDR column, the KDP column (the region where kdp > 0° km −1 extends vertically above the melting layer) was located to the northwest of the ZDR column and to the left of the updraft (Figure 10d), and the separated ZDR column in the spatial distribution appeared closer to the location of the maximum ZH. The location of the KDP column corresponds well to the ground rain intensity maximum [48].
At the late mature stage, the bounded weak echo area had disappeared, while 45–50 dBZ of reflectivity still existed in the lower layer (Figure 10e), which was weakened compared with the developing stage. The lower layer had shifted to the southeast flow away from the radar, and the velocity had also weakened to 5–10 m s−1. The high-altitude jet stream had also disappeared, and the weaker velocity convergence still existed (Figure 10f). Thus, the convective system was still maintained, but weakened. The ZDR and KDP columns also weakened significantly (Figure 10g,h), and the rainfall intensity decreased during this period.
The generation of extreme rainfall is closely related to the type of precipitation, convective structure, and microphysical characteristics. 
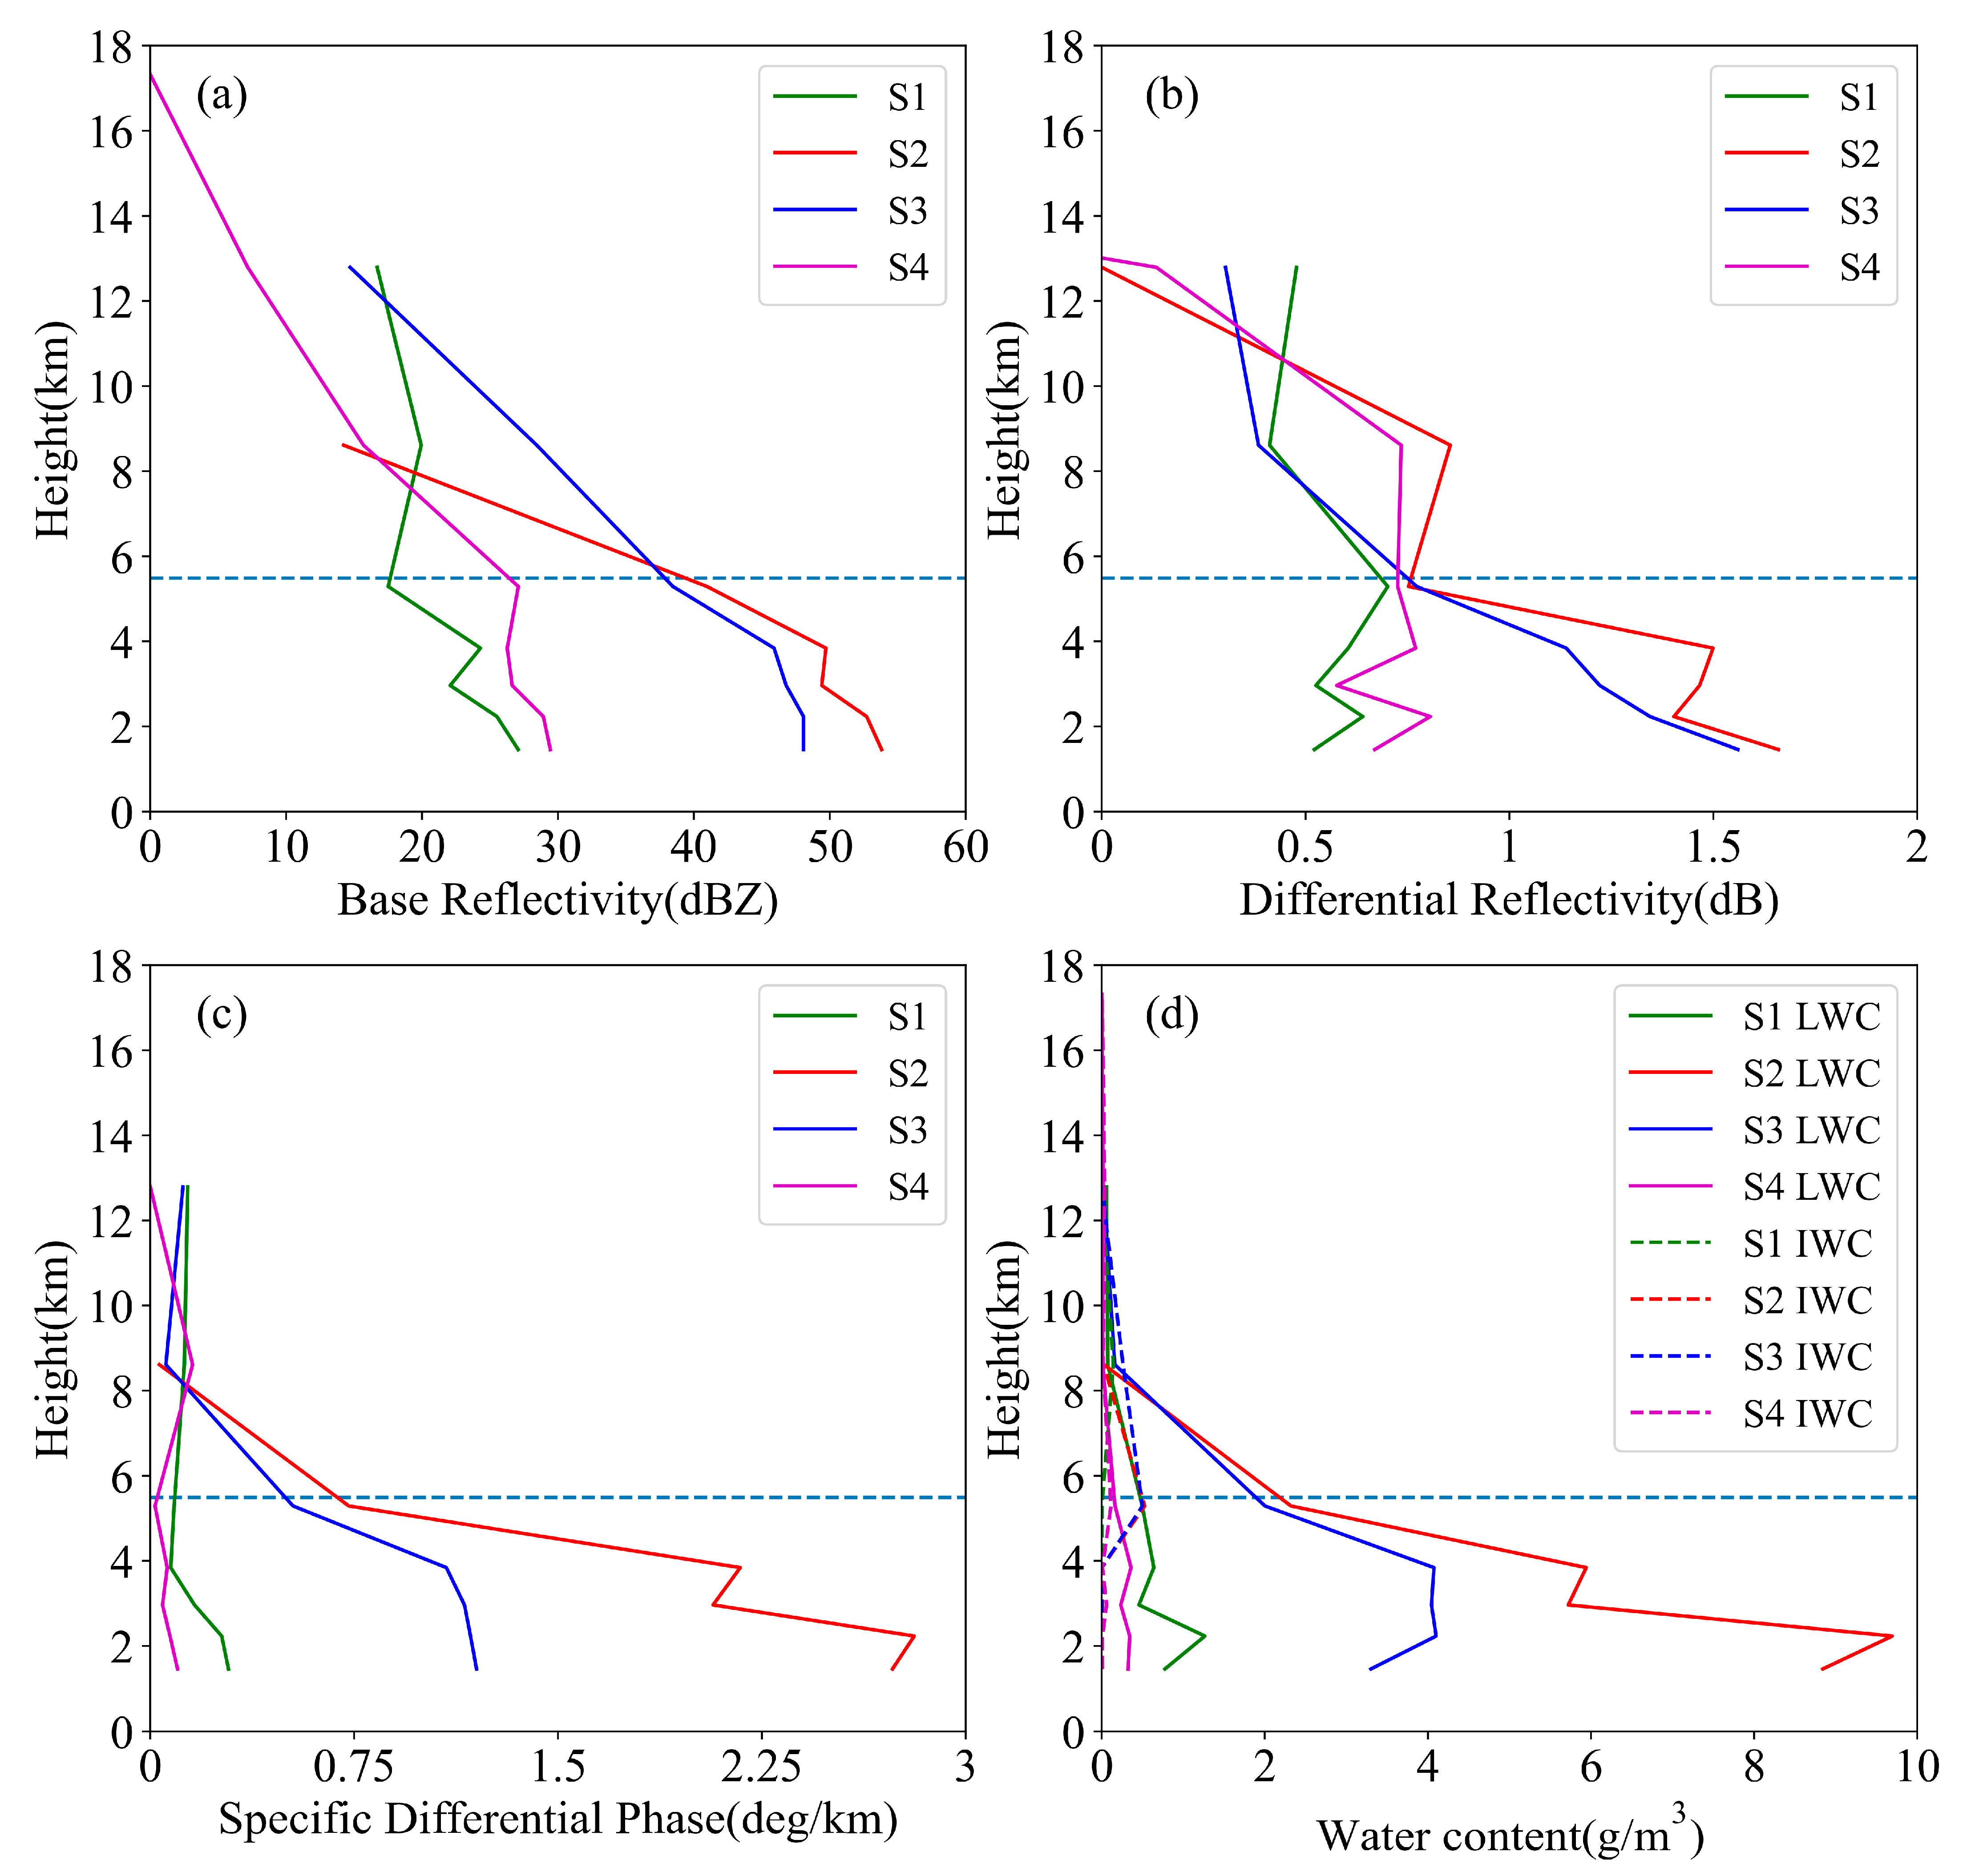
Figure 11 shows mean vertical profiles of ZH, ZDR, KDP, liquid, and ice water content over Rugao during four rainfall stages. For the S2 period with the strongest precipitation, the maximum average reflectivity reached 53.8 dBZ, located at 1.5 km, and that below the melting layer (5.5 km) exceeded 40 dBZ (Figure 11a). The convective core was maintained at a low height, with the average convective core below 3 km, which meant that the main body of clouds was composed of liquid raindrops above 0 °C. For the S3 period, with the second strongest precipitation and the same low-core clouds, the reflectivity below the melting layer was lower than that of the S2 period. Moreover, the convective cloud tops were higher and the reflectivity was stronger above 8 km. For the S1 and S4 period, with weak precipitation, the convective core was also below 5 km. For the S2, S3, and S4 periods, below the melting layer, the ZDR rose steeply at 5.5 km–4.5 km (Figure 11b), which may be caused by the melting process of the particles, making a significant growth of their dielectric constants [49,50]. The increment in ZDR in the S2 period from 6 km to 9 km may be caused by the aggregation of ice-phase particles [51]. In contrast, the S1 period at the beginning of precipitation, probably because of the stronger upward velocity and smaller particle size, had a higher location for the peak of its ZDR phase, which is located near the melting layer.
The KDP also increased in the same altitude range (Figure 11c), which corresponds to the increase in the detected liquid water (Figure 11d). The peaks of ZDR and KDP in S2 and S3 periods were in the lower layer below 2 km, which indicated that the number of raindrops in the lower layer was significant and a considerable number of large raindrops existed, and the liquid water content was quite high, especially in the S2 period, where the precipitation efficiency reached the maximum. The ZDR and KDP in S1 and S4 periods were not large in the lower layers, which indicates that the lower layers were dominated by small raindrops and the number was lower, and the precipitation efficiency was lower than those in S2 and S3.
The liquid and ice water contents were calculated using the method introduced in Section 2.1. The liquid water content was much larger than the ice water content, which indicates that this process had warm rain and the ice phase process played a small role. For the liquid water content, the peak of the S2 phase reached 9.69 g m−3, that below 4 km reached 6 g m−3, and the low-level liquid water content was near 6 g m−3 in S3, which brought extremely strong precipitation. This indicated that this heavy rainfall event was mainly dominated by warm clouds [52], which consisted of liquid precipitation with a high precipitation efficiency and without lightning and thunderstorms.
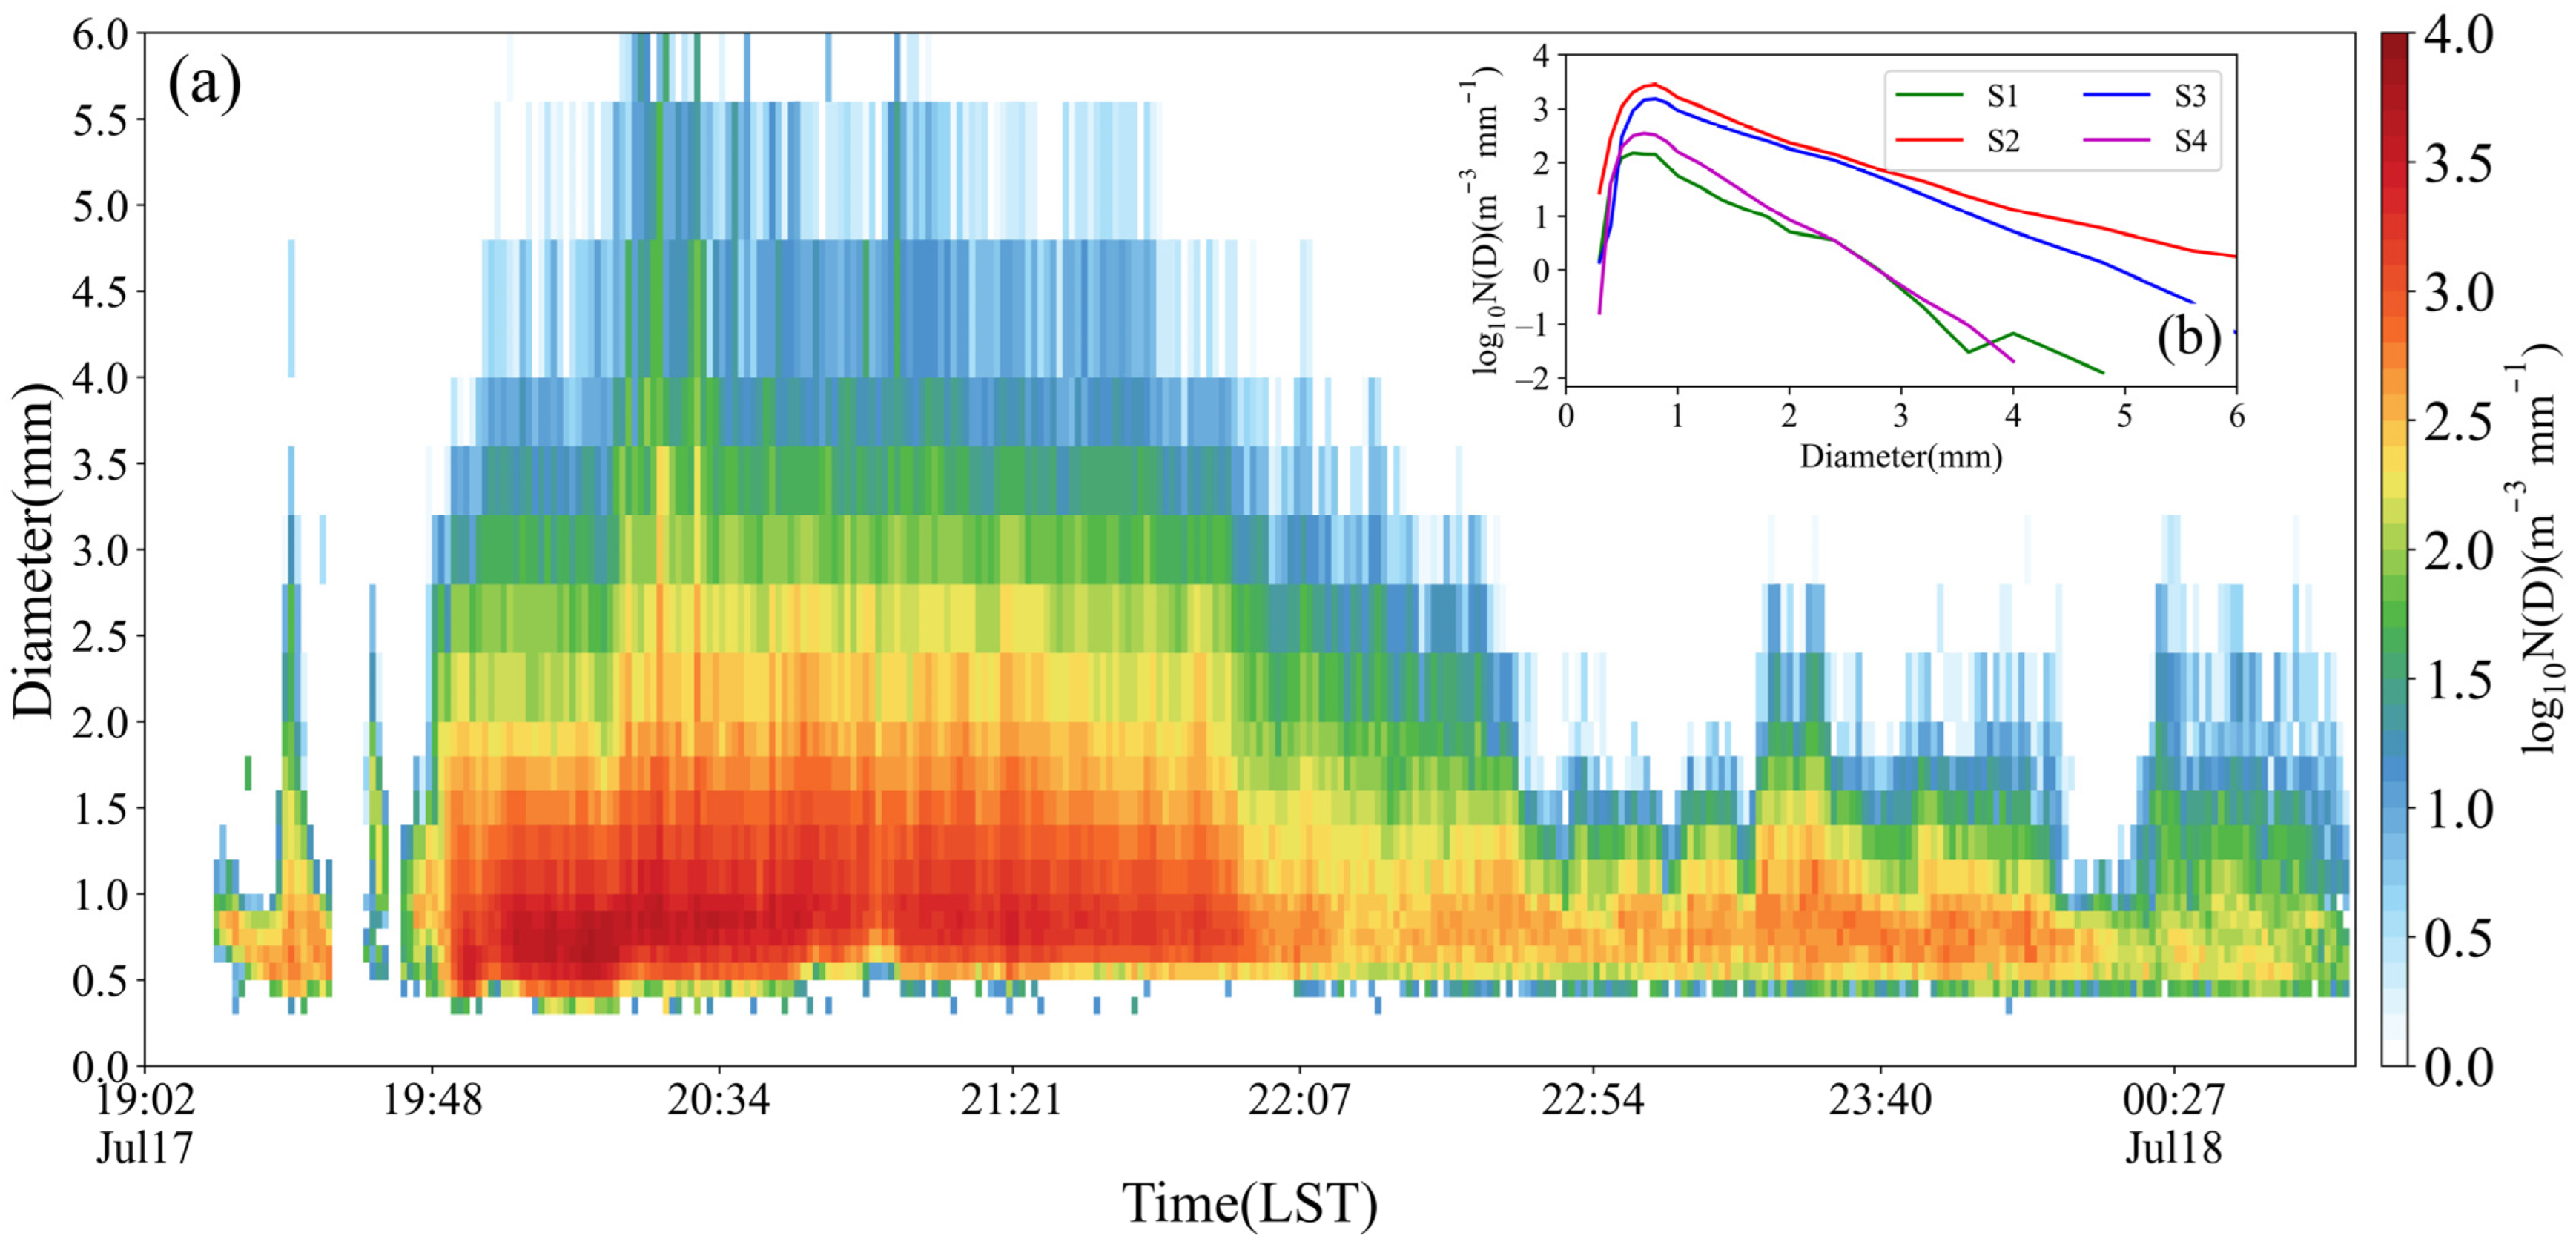
Figure 12a shows the temporal variation in raindrop size distribution at Rugao station during this rainstorm. The raindrop concentration N D observed at Rugao station was high and the raindrop size was large. And the concentration of small raindrops (<1 mm) during the strongest precipitation period exceeded 105 mm−1m3, which was significantly higher than that of ordinary convective precipitation. Meanwhile, a considerable percentage of raindrops had a diameter of more than 4 mm.
The average distribution characteristics of raindrop particle size for the four stages of precipitation (Figure 12b) were compared and analyzed. The concentrations of raindrops of all sizes in the S2 period were higher than those in the S3 period. The concentrations of large particles above 4 mm were also significantly higher than those in the S3 period, which produced very strong short-term heavy precipitation locally, with a maximum rain intensity of 3.8 mm per minute (226 mm h−1). The concentrations of particles above 3 mm were low during S1 and S4, when precipitation was weak, and large particles above 4 mm were almost non-existent.
In summary, the raindrop size distribution of this event was characterized by the overall high concentrations of raindrops and the presence of a considerable number of large raindrops, producing a high rain intensity that lasted for quite a long time, making it possible to produce extreme record-breaking precipitation within a short period of time. From the structure and microphysical characteristics of the precipitation cloud cluster, it can be inferred that this precipitation had a very high precipitation efficiency, which is an important condition to produce this record-breaking short-duration rainstorm. The analysis of the microphysical characteristics of the convective system showed that it was typical warm clouds with very high precipitation efficiency.
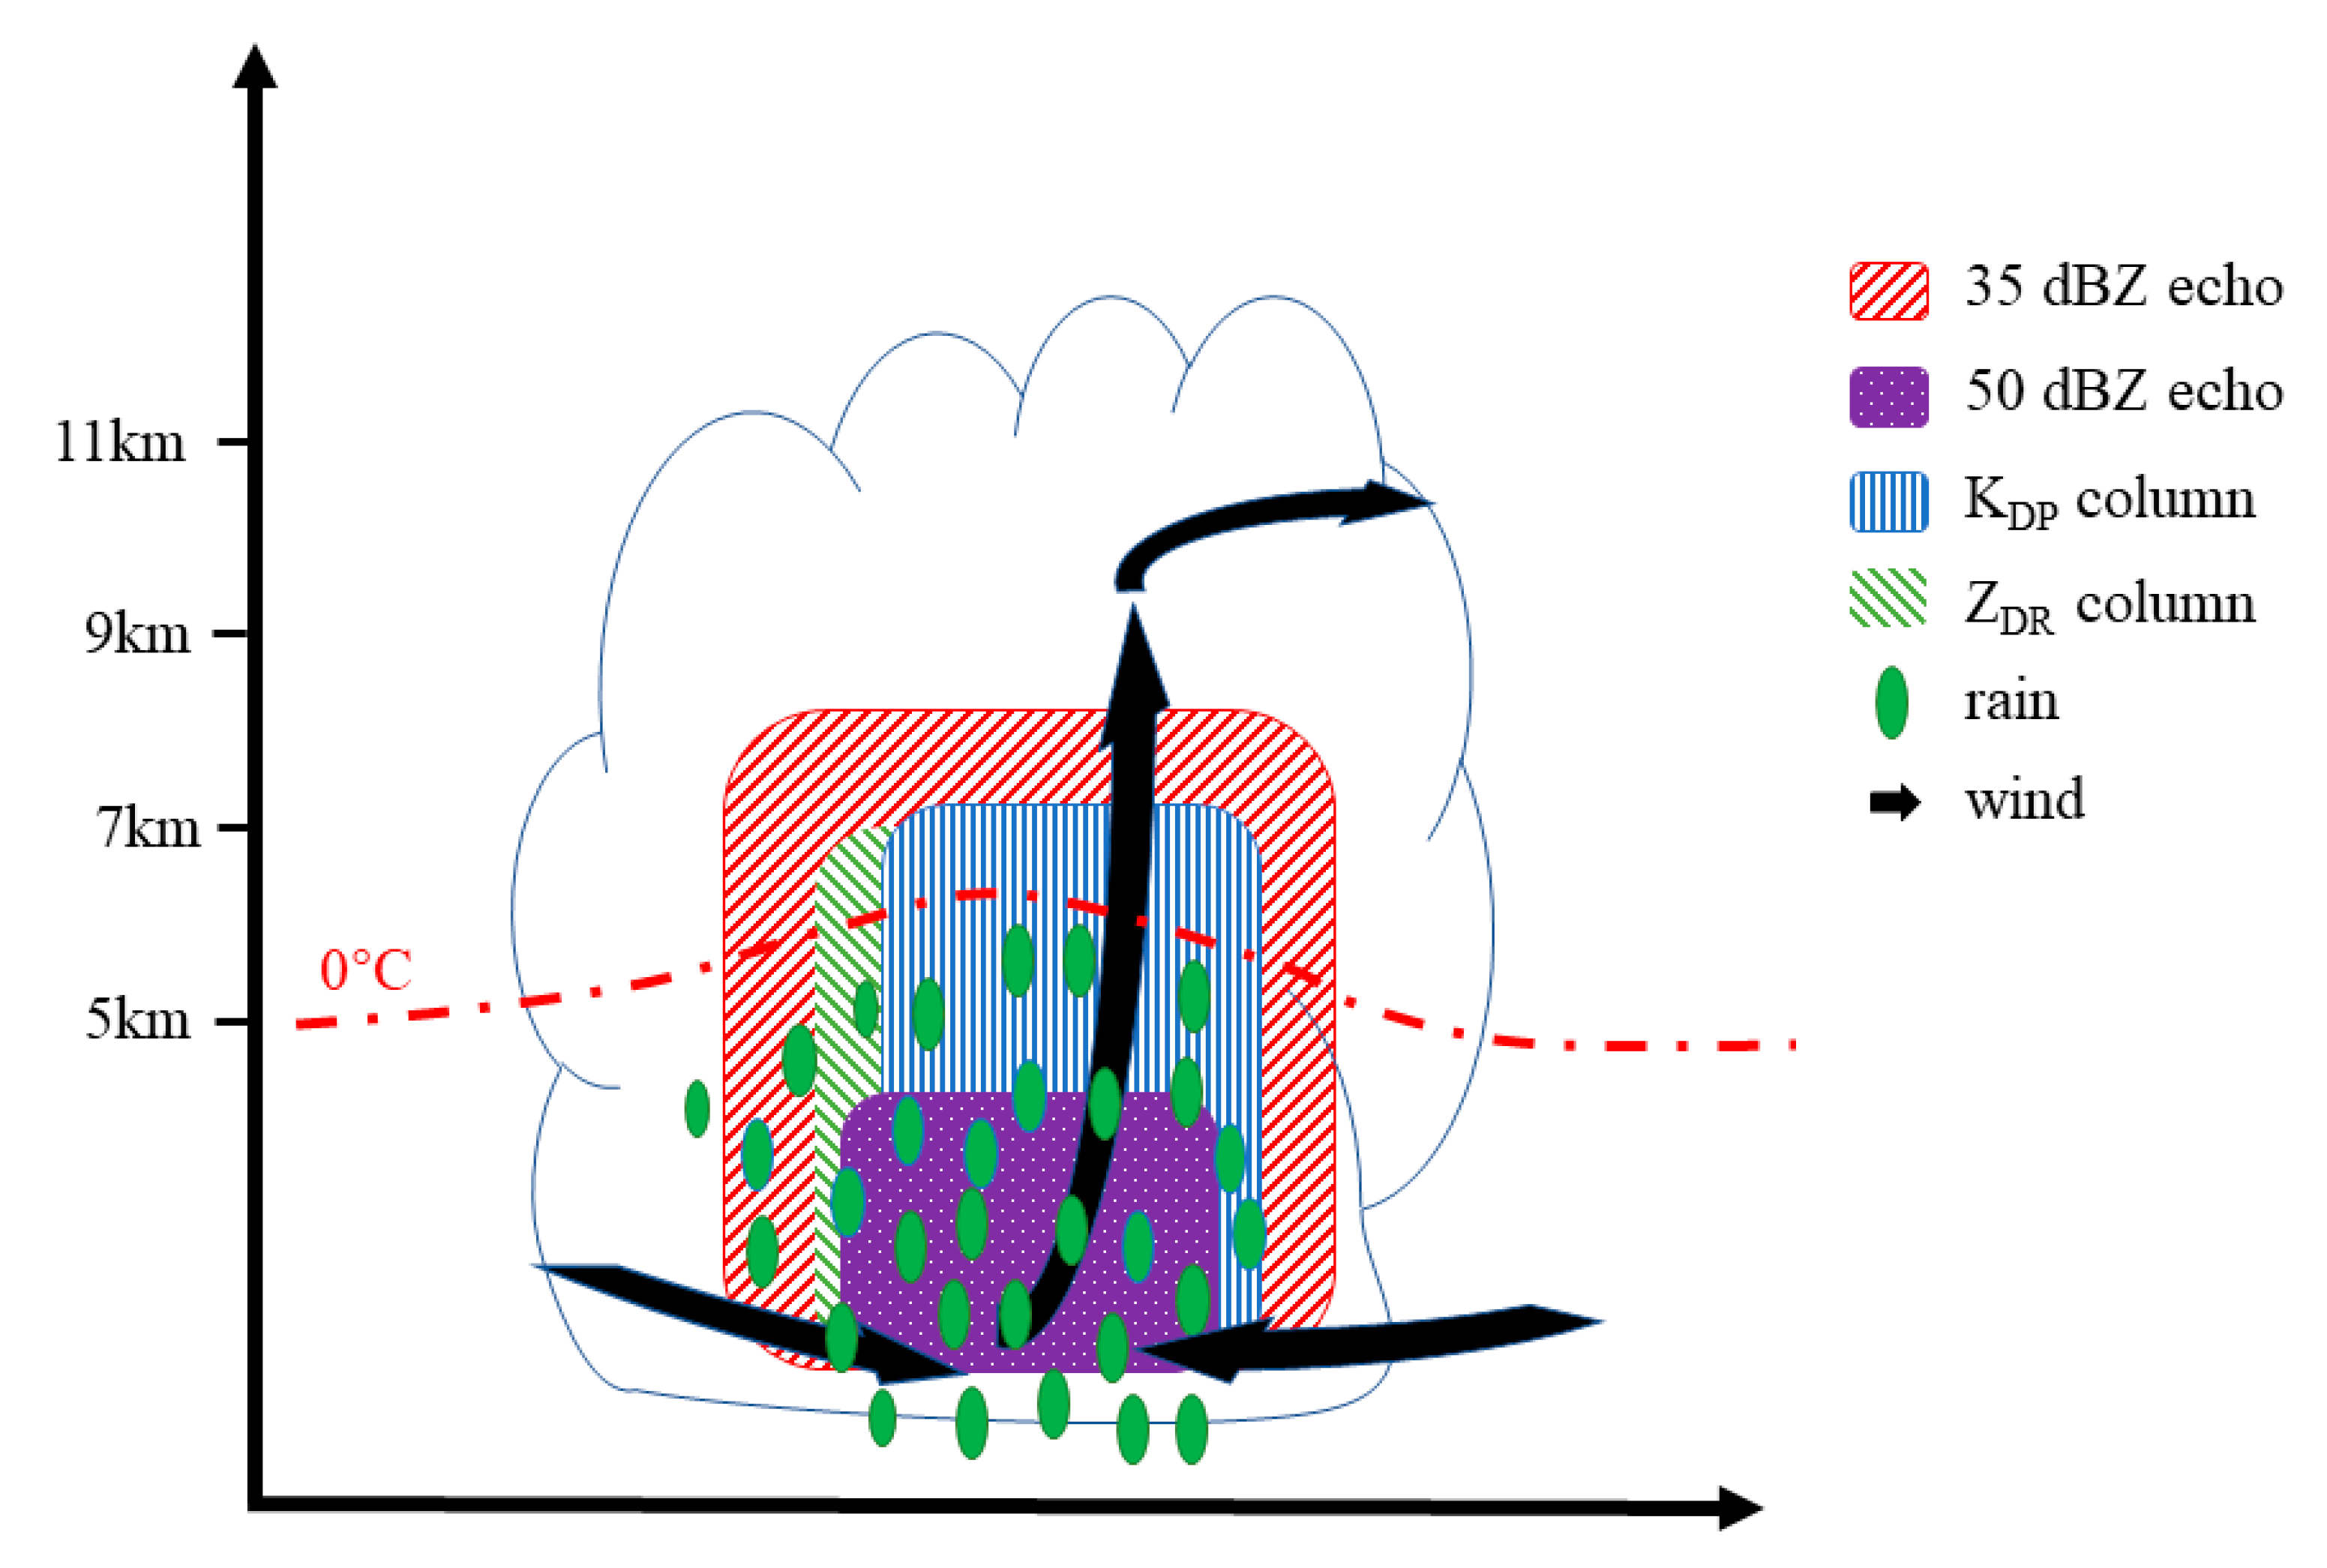
Figure 13 depicts the conceptual model that directly associates the kinematic and radar echo structures of extreme heavy precipitation. During the most intense periods of precipitation, strong echoes above 35 dBZ, the KDP column, and the ZDR column all stretch over 7 km and there are even stronger echoes above 50 dBZ in the lower layers. A descending inflow and strong convergence exist at the lower levels, as well as a strong internal updraft that lifts cloud droplets to higher levels. Below the melting layer, larger ice-phase particles fall and melt, and the aggregation and growth of raindrops in the lower layers due to the strong warm rain process result in larger raindrops, bringing extreme heavy precipitation processes. In this event, ice-phase microphysical processes are important mechanisms for effectively precipitating startup and enhancement.

7. Conclusions and Discussion

This study primarily investigated a record-breaking predecessor rain event that occurred in the central-eastern part of Jiangsu Province, China before the arrival of Typhoon Danas on 17 July 2019. Reanalysis data, automatic weather stations, wind-profiling radar, the laser-optical Particle Size Velocity instrument, sounding, S-band dual-polarization radar, and a Lagrangian model were used to analyze multiscale characteristics. This analysis encompassed the large-scale environment, moisture transport and source regions, as well as the trigger and maintenance mechanisms of mesoscale convection and the microphysical characteristics of the convective system.
Multiple studies in the literature have documented the synoptic-scale conditions that give rise to precipitation-related extreme events occurring prior to tropical cyclones. This occurs as a tropical moisture plume advances in combination with a low-level jet and is compelled to rise along a baroclinic zone located in the equatorward entry region of an upper-level jet [3,4,5,6,7,8]. This heavy rainfall event documented in this paper occurred as a result of the combined impacts of the warm and moist flow from Typhoon Danas and the southward diffusion of cold air. The convergence of the cold air and the strong easterly jet maintained a vertical moisture flow and low-altitude shear.
A comparison of previous studies was made on mesoscale convective systems for heavy precipitation in eastern China [12,13,14,15]. The convective system near Rugao was initially triggered by the mesoscale temperature gradient and the convergence of surface wind fields caused by the intrusion of cold pools near the surface. The warm advection to the south of the main rainband continuously transported warm and moist air, resulting in the slow movement and extended maintenance of mesoscale fronts and a surface convergence line. Consequently, back-building processes [22,23,24] near Rugao constantly triggered convections, leading to the repeated formation and maintenance of rainbands that accounted for the record-breaking rainfall over Rugao.
In recent years, dual-polarization radar has emerged as a valuable tool for achieving a comprehensive and enhanced understanding of the microphysics inherent to precipitation systems [28,29]. Statistical analysis of different precipitation stages using dual-polarization radar data revealed that the convective system generating this extreme heavy precipitation had a low center of mass, indicative of typical warm clouds. Strong albedo factors were primarily distributed below the 0 °C layer height, making them unfavorable for lightning generation.
A comparison was made with previous inferred microphysics studies on the typhoon inner rainband and outer rainband [32,33,34,35]. In this tropical cyclone remote rainfall case, the presence of a ZDR column with elevated ZDR values over regions of weak echoes indicated the position of an updraft, while a KDP column with elevated KDP values to the west of the ZDR column corresponded closely to the location of surface rainfall.
The convective system that produced this extreme heavy precipitation was composed of typical warm clouds, exhibiting a very high precipitation efficiency, a high overall concentration of raindrops throughout the process, and the presence of a substantial number of large raindrops. These characteristics contribute to the ability to generate record-breaking extreme precipitation within a short period of time.
This paper presents the kinematic and microphysical characteristics of this extreme rainstorm event and provides a preliminary exploration of the triggering and maintenance mechanisms of the convective system. However, it is worth noting that our understanding of this case remains limited due to constraints in observational data quality and analysis methodologies. More cases must be analyzed and studied in the future to comprehend the similarities and differences in polarimetric characteristics in various synoptic conditions. This is necessary to endorse the extensive operational implementation of polarimetric radar. Furthermore, given the limitations of observational data, future studies could employ mesoscale numerical models to simulate convective triggering, movement mechanisms, and microphysical characteristics.

Author Contributions

Methodology, K.W., X.X., P.G. and X.P.; Resources, P.G.; Data curation, M.L.; Writing—original draft, K.W.; Writing—review & editing, X.W. and X.P.; Visualization, K.W., X.X. and M.L.; Funding acquisition, X.W. All authors have read and agreed to the published version of the manuscript.

Funding

This research was funded by National Key Research and Development Program of China (grant number 2021YFC3000900), the Science and Technology Research Project of the Guangdong Provincial Meteorological Bureau (grant number GRMC2021Q12), Beijige Funding from Jiangsu Research Institute of Meteorological Science (grant number BJG202211), Jiangsu Marine Meteorology Open Research Fund (grant number HYQX202204).

Institutional Review Board Statement

Not applicable.

Informed Consent Statement

Not applicable.

Data Availability Statement

The datasets generated during and/or analyzed during the current study are available from the corresponding author on reasonable request.

Conflicts of Interest

The authors declare no conflict of interest.

References

  1. Xie, Z.; Yin, D.U.; Zeng, Y.; Miao, Q. Classification of yearly extreme precipitation events and associated flood risk in the Yangtze-Huaihe River Valley. Sci. China Earth Sci. 2018, 61, 1341–1356. [Google Scholar] [CrossRef]
  2. Goswami, B.N.; Venugopal, V.; Sengupta, D.; Madhusoodanan, M.M.S.; Xavier, P.K. Increasing Trend of Extreme Rain Events Over India in a Warming Environment. Science 2007, 314, 1442–1445. [Google Scholar] [CrossRef]
  3. Chen, L.-S. Prediction of landed tropical cyclone rainstorms. In Fourteenth National Tropical Cyclone Science Seminar Abstract Book; Shanghai Typhoon Institute: Shanghai, China, 2007; pp. 3–7. [Google Scholar]
  4. Cote, M.R. Predecessor Rain Events in Advance of Tropical Cyclones. Master’s Thesis, Department of Atmospheric and Environmental Sciences, University at Albany, State University of New York, Albany, NY, USA, 2007. [Google Scholar]
  5. Bosart, L.F.; Carr, F.H. A Case Study of Excessive Rainfall Centered Around Wellsville, New York, 20–21 June 1972. Mon. Weather Rev. 1978, 106, 348. [Google Scholar] [CrossRef]
  6. Byun, K.Y.; Lee, T.Y. Remote effects of tropical cyclones on heavy rainfall over the Korean peninsula—Statistical and composite analysis. Tellus 2012, 64, 14983. [Google Scholar] [CrossRef]
  7. Galarneau, T.J., Jr.; Bosart, L.F.; Schumacher, R.S. Predecessor Rain Events ahead of Tropical Cyclones. Mon. Weather Rev. 2010, 138, 3272–3297. [Google Scholar] [CrossRef]
  8. Cong, C.-H.; Chen, L.-S.; Lei, X.-T.; Li, Y. An overview on the study of tropical cyclone remote rainfall. J. Trop. Meteorol. 2011, 27, 264–270. [Google Scholar]
  9. Cong, C.-H.; Chen, L.-S.; Lei, X.-T.; Li, Y. A study on the mechanism of the tropical cyclone remote precipitation. Acta Meteorol. Sin. 2012, 70, 717–727. [Google Scholar]
  10. Li, G.; Liang, H.; Wang, S.; Wang, Y.; Zhang, C.; Zhong, T. The Mesoscale System Character Analysis of Far Distance Typhoon Haitang Rainstorm. Meteorol. Mon. 2007, 33, 17–22. [Google Scholar]
  11. Doswell, C.A.; Brooks, H.E.; Maddox, R.A. Flash Flood Forecasting: An Ingredients-Based Methodology. Weather Forecast. 1996, 11, 560–581. [Google Scholar] [CrossRef]
  12. Cao, X.; Wang, H. Analysis on a Tropical Cyclone Remote Rain Event in Shanghai in 23–24 August 2015. Meteorol. Mon. 2016, 42, 1184. [Google Scholar]
  13. Cao, X.; Wang, H.; Qi, L. The combined effects of typhoon Fitow and Danas together with cool air on an excessive heavy rain from October 7 to 8 in 2013 in Shanghai. Torrential Rain Disasters 2014, 33, 351–362. [Google Scholar]
  14. Chen, Z.; Huang, F.; He, G. A Case Study of Interactions between the Tropical Cyclone and the Southwest Vortex. Part I: Diagnostic Analysis. Chin. J. Atmos. Sci. 2002, 26, 352–360. [Google Scholar]
  15. Xu, H.; Xu, X.; Zhang, S.; Fu, Z. Long-Range Moisture Alteration of a Typhoon and Its Impact on Beijing Extreme Rainfall. Chin. J. Atmos. Sci. 2014, 38, 537–550. [Google Scholar]
  16. Xu, Y.; Lv, X.; Zhang, L.; Huang, Y. Analysis on the Characteristics and Forecasting Difficulty of Severe Typhoon Fitow (No. 1323). Meteorol. Mon. 2015, 41, 1222–1231. [Google Scholar]
  17. Yang, X.; Chen, L.; Liu, S.; Xue, D.; Chen, W. A study of the far distance tropical cyclone torrential rainfalls in Shandong Province. Acta Meteorol. Sin. 2008, 66, 108–122. [Google Scholar]
  18. Zhu, Q.; Lin, J.; Shou, S. Principles and Methods of Synoptic Meteorology, 4th ed.; Meteorological Press: Beijing, China, 2007. [Google Scholar]
  19. Chappell, C.F. Quasi-Stationary Convective Events; American Meteorological Society: Boston, MA, USA, 1986. [Google Scholar]
  20. Corfidi, S.F. Cold Pools and MCS Propagation: Forecasting the Motion of Downwind-Developing MCSs. Weather Forecast. 2010, 18, 997–1017. [Google Scholar] [CrossRef]
  21. Parker, M.D.; Johnson, R.H. Organizational Modes of Midlatitude Mesoscale Convective Systems. Mon. Weather Rev. 2000, 128, 3413–3436. [Google Scholar] [CrossRef]
  22. Sanders, F. Frontal Focusing of a Flooding Rainstorm. Mon. Weather Rev. 2000, 128, 4155–4159. [Google Scholar] [CrossRef]
  23. Schumacher, R.S.; Johnson, R.H. Mesoscale Processes Contributing to Extreme Rainfall in a Midlatitude Warm-Season Flash Flood. Mon. Weather Rev. 2008, 136, 3964–3986. [Google Scholar] [CrossRef]
  24. Schumacher, R.S.; Johnson, R.H. Quasi-Stationary, Extreme-Rain-Producing Convective Systems Associated with Midlevel Cyclonic Circulations. Weather Forecast. 2009, 24, 555–574. [Google Scholar] [CrossRef]
  25. Maddox, R.A.; Chappell, C.F.; Hoxit, L.R. Synoptic and Meso-α Scale Aspects of Flash Flood Events. Bull. Am. Meteorol. Soc. 1979, 60, 115–123. [Google Scholar] [CrossRef]
  26. Xu, W.; Zipser, E.J.; Chen, Y.-L.; Liu, C.; Liou, Y.-C.; Lee, W.-C.; Jou, B.J.D. An Orography-Associated Extreme Rainfall Event during TiMREX: Initiation, Storm Evolution, and Maintenance. Mon. Weather Rev. 2012, 140, 2555–2574. [Google Scholar] [CrossRef]
  27. Schumacher, R.S.; Johnson, R.H. Organization and Environmental Properties of Extreme-Rain-Producing Mesoscale Convective Systems. Mon. Weather Rev. 2005, 133, 961–976. [Google Scholar] [CrossRef]
  28. Kumjian, M.R.; Ryzhkov, A.V. Polarimetric Signatures in Supercell Thunderstorms. J. Appl. Meteorol. Climatol. 2008, 47, 1940–1961. [Google Scholar] [CrossRef]
  29. Liu, L.; Wang, Z. The study of spacial distribution of phase and size of hydrometeorsin cloud by dual linear polarization radar. Acta Meteorol. Sin. 1996, 54, 590. [Google Scholar]
  30. Pan, J.; Jiang, L.; Wei, M.; Luo, C.; Gao, L.; Zheng, X.; Peng, J. Analysis of a high precipitation supercell based on dual polarization radar observations. Acta Meteorol. Sin. 2020, 78, 86–100. [Google Scholar]
  31. Wang, H.; Wu, N.; Wan, Q.; Zhan, T. Analysis of S-band polarimetric radar observations of a hail-producing supercell. Acta Meteorol. Sin. 2018, 76, 92–103. [Google Scholar]
  32. Didlake, A.C.; Kumjian, M.R. Examining Polarimetric Radar Observations of Bulk Microphysical Structures and Their Relation to Vortex Kinematics in Hurricane Arthur (2014). Mon. Weather Rev. 2017, 145, 4521–4541. [Google Scholar] [CrossRef]
  33. May, P.T.; Kepert, J.D.; Keenan, T.D. Polarimetric Radar Observations of the Persistently Asymmetric Structure of Tropical Cyclone Ingrid. Mon. Weather Rev. 2008, 136, 616–630. [Google Scholar] [CrossRef]
  34. Wang, M.; Zhao, K.; Xue, M.; Zhang, G.; Liu, S.; Wen, L.; Chen, G. Precipitation microphysics characteristics of a Typhoon Matmo (2014) rainband after landfall over eastern China based on polarimetric radar observations. J. Geophys. Res. Atmos. 2016, 121, 12415–12433. [Google Scholar] [CrossRef]
  35. Wu, D.; Zhao, K.; Kumjian, M.R.; Chen, X.; Huang, H.; Wang, M.; Didlake, A.C.; Duan, Y.; Zhang, F. Kinematics and Microphysics of Convection in the Outer Rainband of Typhoon Nida (2016) revealed by Polarimetric Radar. Mon. Weather Rev. 2018, 146, 2147–2159. [Google Scholar] [CrossRef]
  36. Janapati, J.; Kumar, B.; Lin, P.L.; Wang, P.K.; Unnikrishnan, C.K. Raindrop Size Distribution Characteristics of Indian and Pacific Ocean Tropical Cyclones Observed at India and Taiwan Sites. J. Meteorol. Soc. Jpn. 2020, 98, 299–317. [Google Scholar] [CrossRef]
  37. Seela, B.K.; Janapati, J.; Lin, P.-L.; Wang, P.K.; Lee, M.-T. Raindrop Size Distribution Characteristics of Summer and Winter Season Rainfall Over North Taiwan. J. Geophys. Res. Atmos. 2018, 123, 11602–11624. [Google Scholar] [CrossRef]
  38. Ushiyama, T.; Krishna Reddy, K.; Kubota, H.; Yasunaga, K.; Shirooka, R. Diurnal to interannual variation in the raindrop size distribution over Palau in the western tropical Pacific. Geophys. Res. Lett. 2009, 36. [Google Scholar] [CrossRef]
  39. Wen, L.; Zhao, K.; Chen, G.; Wang, M.; Zhou, B.; Huang, H.; Hu, D.; Lee, W.-C.; Hu, H. Drop Size Distribution Characteristics of Seven Typhoons in China. J. Geophys. Res. Atmos. 2018, 123, 6529–6548. [Google Scholar] [CrossRef]
  40. Tokay, A.; Short, D.A. Evidence from Tropical Raindrop Spectra of the Origin of Rain from Stratiform versus Convective Clouds. J. Appl. Meteorol. 1996, 35, 355–371. [Google Scholar] [CrossRef]
  41. Zhang, G.; Sun, J.; Brandes, E.A. Improving Parameterization of Rain Microphysics with Disdrometer and Radar Observations. J. Atmos. Sci. 2006, 63, 1273–1290. [Google Scholar] [CrossRef]
  42. Stein, A.F.; Draxler, R.R.; Rolph, G.D.; Stunder, B.J.B.; Cohen, M.D.; Ngan, F. NOAA’s HYSPLIT Atmospheric Transport and Dispersion Modeling System. Bull. Am. Meteorol. Soc. 2015, 96, 2059–2077. [Google Scholar] [CrossRef]
  43. Cifelli, R. Radar observations of the kinematic, microphysical, and precipitation characteristics of two MCSs in TRMM LBA. J. Geophys. Res. 2002, 107, LBA-44. [Google Scholar] [CrossRef]
  44. Löffler-Mang, M.; Joss, J. An Optical Disdrometer for Measuring Size and Velocity of Hydrometeors. J. Atmos. Ocean. Technol. 2000, 17, 130–139. [Google Scholar] [CrossRef]
  45. Yuter, S.E.; Kingsmill, D.E.; Nance, L.B.; Löffler-Mang, M. Observations of Precipitation Size and Fall Speed Characteristics within Coexisting Rain and Wet Snow. J. Appl. Meteorol. Climatol. 2006, 45, 1450–1464. [Google Scholar] [CrossRef]
  46. Atlas, D.; Srivastava, R.C.; Sekhon, R.S. Doppler radar characteristics of precipitation at vertical incidence. Rev. Geophys. 1973, 11, 1–35. [Google Scholar] [CrossRef]
  47. Brandes, E.A.; Vivekanandan, J.; Tuttle, J.D.; Kessinger, C.J. A Study of Thunderstorm Microphysics with Multiparameter Radar and Aircraft Observations. Mon. Weather Rev. 1995, 123, 3129–3143. [Google Scholar] [CrossRef]
  48. Snyder, J.C.; Bluestein, H.B.; Dawson Ii, D.T.; Jung, Y. Simulations of Polarimetric, X-Band Radar Signatures in Supercells. Part II: ZDR Columns and Rings and KDP Columns. J. Appl. Meteorol. Climatol. 2017, 56, 2001–2026. [Google Scholar] [CrossRef]
  49. Kumjian, M.R.; Prat, O.P. The Impact of Raindrop Collisional Processes on the Polarimetric Radar Variables. J. Atmos. Sci. 2014, 71, 3052–3067. [Google Scholar] [CrossRef]
  50. Li, H.; Wan, Q.; Peng, D.; Liu, X.; Xiao, H. Multiscale analysis of a record-breaking heavy rainfall event in Guangdong, China. Atmos. Res. 2020, 232, 104703. [Google Scholar] [CrossRef]
  51. Andrić, J.; Kumjian, M.R.; Zrnić, D.S.; Straka, J.M.; Melnikov, V.M. Polarimetric Signatures above the Melting Layer in Winter Storms: An Observational and Modeling Study. J. Appl. Meteorol. Climatol. 2013, 52, 682–700. [Google Scholar] [CrossRef]
  52. Houze, R.A. Chapter 8—Cumulonimbus and Severe Storms. In International Geophysics; Houze, R.A., Ed.; Academic Press: Oxford, UK, 2014; pp. 187–236. [Google Scholar]
Figure 1. (a) The 12 h precipitation from 18:00 LST 17 July to 08:00 LST 18 July 2019 (colored dots with rainfall shaded according to the color bar in mm, red edge color denotes hourly rainfall ≧20 mm h−1 during the period) observed by automatic weather stations (AWSs). The stations’ names are abbreviated in alphabetic order as follows: BS (Baoshan), NT (Nantong), QZ (Qinzao), TZ (Taizhou), and ZJG (Zhangjiagang). The black star denotes the location of NT radar, the black triangle denotes the sounding at BS, two black squares denote the locations of wind-profiling radar at TZ and ZJG, and black hexagon denotes the location of QZ AWS. Black word “RG” indicates the position of Rugao station. (b) Hourly precipitation (mm) at Rugao station.
Atmosphere 14 01608 g001
Figure 2. (a) Time–height cross-section of radar reflectivity (dBZ) over Rugao from 19:02 LST 17 July to 00:45 LST 18 July observed by NT radar. Dashed black lines represent the altitude of 0 °C temperature. (b) Time series of minute precipitation at Rugao from 19:02 LST 17 July to 00:45 LST 18 July.
Atmosphere 14 01608 g002
Figure 3. Composite radar reflectivity (dBZ) at (a) 19:02, (b) 19:54, (c) 20:17, (d) 20:34, (e) 21:03, (f) 21:32, (g) 22:07, (h) 22:42, and (i) 23:46 LST 17 July 2019, observed by NT radar. Black lines in (c,f) denote the position of the most intense convective activity.
Atmosphere 14 01608 g003
Figure 4. The 500 hPa geopotential height (solid black contours every 10 hPa), 500 hPa wind (full barb and half barb denote 4.0 and 2.0 m s−1, respectively), 500 hPa specific humidity (shaded in g kg−1), and 200 hPa wind speed ≥ 30 m s−1 are marked enclosing black shaded area, at (a) 08:00 LST 17 July and (b) 12:00 LST 17 July 2019. The 850 hPa geopotential height (solid black contours every 10 dam), 850 hPa wind (full barb and half barb denote 4.0 and 2.0 m s−1, respectively), 850 hPa specific humidity (shaded in g kg−1), 850 hPa relative vorticity (solid red contours every 5 × 10⁵ s−1), and 850 hPa windspeed ≥ 12 m s−1 are marked enclosing black shaded area, at (c) 08:00 LST 17 July and (d) 12:00 LST 17 July 2019.
Atmosphere 14 01608 g004
Figure 5. The skew T–logp diagram and vertical wind profile of the Baoshan radiosonde at 20:00 LST 17 July 2019. The dark black solid lines indicate state profiles. The red solid lines are temperature stratification profiles. The green solid lines are dew point stratification profiles. The blue dashed lines are wet adiabatic profiles. The orange dashed lines are dry adiabatic profiles. The green dashed lines are iso-saturated specific humidity profiles. The gray sloping solid lines are isothermal profiles. The cyan-blue dashed lines are 0 °C isotherm profiles. The red and blue areas represent CAPE and CIN respectively.
Atmosphere 14 01608 g005
Figure 6. The atmospheric column precipitable water vapor detected by GNSS (colored dots shaded according to the color bar in cm) at (a) 19:00, (b) 20:00, and (c) 21:00 LST 17 July 2019. (d) Time series of GNSS PWV at Rugao from 08:00 17 July to 07:00 18 July LST 2019.
Atmosphere 14 01608 g006
Figure 7. Time series of half-hourly mean wind profile (full bar and half barb denote 4.0 and 2.0 m s−1, respectively) from wind-profiling radar in (a) TZ and (b) ZJG on 14:00 LST 17 July–03:00 LST 18 July 2019.
Atmosphere 14 01608 g007
Figure 8. (a) Vertical integral of divergence of moisture flux (color, kg m−2 s−1) and vertical integral of moisture flux vectors (kg m−1 s−1) at 16:00 LST 17 July 2019. (b) The 72 h backward air parcel trajectories with endpoint at Rugao and ERA5 total column PW (shaded according to the color bar in kg m−2) at 20:00 LST 17 July 2019, with trajectories derived from the ERA5. The red, blue, and fuchsia air parcel trajectories start at 500, 1500, and 5000 m above mean sea level, respectively. The positions of Danas at 08:00, 14:00, and 20:00 LST 17 July and 02:00 LST 18 July are marked with red X.
Atmosphere 14 01608 g008
Figure 9. The 2 m temperature (colored dots with temperature shaded according to the color bar in °C) and 10 m winds (full barb and half barb denote 4.0 and 2.0 m s−1, respectively), observed by AWSs at different times: (a) 19:00, (b) 20:00, (c) 21:00, and (d) 22:00 LST 17 July 2019; horizontal divergence ≤ −105 s−1 is marked enclosing black shaded area. (e) The 2 m temperature (lines, °C) and dewpoint temperature (dashed lines, °C) at RG (red) and QZ (blue) of time interval 5 min from 16:00 LST 17 July to 01:00 LST 18 July.
Atmosphere 14 01608 g009
Figure 10. Vertical cross-sections along the lines given in Figure 2 of (a,e) ZH (dBZ), (b,f) V (m s−1), (c,g) ZDR (dB), and (d,h) KDP (° km−1) observed through NT radar, at 20:18 (left column) and 21:33 (right column) LST 17 July. The black triangle indicates the position of Rugao station. Dashed black lines represent the altitude of 0 °C temperature.
Atmosphere 14 01608 g010
Figure 11. Mean vertical profiles of (a) ZH (dBZ), (b) ZDR (dB), (c) KDP (° km−1), and (d) liquid (LWC, solid lines) and ice (IWC, dashed lines) water content (g m−3) over Rugao during four rainfall stages (S1: green lines, S2: red lines, S3: blue lines, and S4 magenta lines). Dashed black lines represent the altitude of 0 °C temperature.
Atmosphere 14 01608 g011
Figure 12. (a) Time series of raindrop size distribution in Rugao for 19:02 LST 17 July–00:57 LST 18 July, and (b) drop size distribution in Rugao during four rainfall stages (S1: green line, S2: red line, S3: blue line, and S4: magenta line).
Atmosphere 14 01608 g012
Figure 13. Conceptual model of kinematic and microphysical structure of extremely heavy rainfall in Rugao based on the observations of dual-polarization radar and laser-optical Particle Size Velocity instrument.
Atmosphere 14 01608 g013
Disclaimer/Publisher’s Note: The statements, opinions and data contained in all publications are solely those of the individual author(s) and contributor(s) and not of MDPI and/or the editor(s). MDPI and/or the editor(s) disclaim responsibility for any injury to people or property resulting from any ideas, methods, instructions or products referred to in the content.

