Article

Investigation on the Perception of Microclimatic Factors by the Elderly in Humid and Hot Areas: The Case of Guangzhou, China

Guangzhou Academy of Fine Arts, Guangzhou 510261, China
*
Author to whom correspondence should be addressed.
Atmosphere 2023, 14(10), 1570; https://doi.org/10.3390/atmos14101570
Submission received: 19 September 2023 / Revised: 12 October 2023 / Accepted: 13 October 2023 / Published: 16 October 2023
(This article belongs to the Section Climatology)

Abstract

:
The problem of population aging in China is becoming increasingly serious. Increasing outdoor space can increase the frequency of outdoor activities for the elderly and effectively improve their quality of life. In this study, we examined the thermal comfort of outdoor activity spaces for older adults in summer using a subjective questionnaire in Guangzhou City, calculated and analyzed the perception and comfort range of microclimatic factors for older adults in hot and humid areas, and explored gender differences. The specific results were as follows: (1) The neutral physiological equivalent temperature (PET) for the overall respondents was 30.4 °C, compared to an acceptable PET of 33.8 °C. The neutral wind speed and acceptable wind speed for the overall respondents were both 0.4 m/s. The neutral relative humidity for the overall respondents was 56.49%, whereas the acceptable relative humidity was 64.94%. (2) Gender differences were observed among older respondents regarding PET and relative humidity, while no significant gender differences were found among older respondents regarding wind speed. (3) Summer thermal sensation voting for older adults in hot and humid areas were mainly centered on “hot” (30.2%), and “not too hot nor cold” (38.7%). The wind sensation voting was centered on “not high or low” (44.6%). Humidity sensation voting was mainly concentrated on “not wet nor dry” (69.4%). This study provides guidance to urban planners and architects to help them create urban environments that are more comfortable and responsive to the needs of the aging population.

1. Introduction

1.1. Research Background

The increasing urban heat island effect is due to rapid urbanization and changes in urban subsurface materials [1]. The high summer temperatures and humidity in hot and humid areas superimposed on the heat island effect pose a great threat to people’s lives and health [2]. Harsh thermal environments can lead to a range of heat-related illnesses, including coronary heart disease, cerebrovascular disease, heart attack, and heat stroke, among others, and in severe cases, death [3]. Numerous previous studies have shown that urban microclimates directly impact the use of public open spaces, including parks, squares, campuses, and neighborhoods [4,5,6,7]. There is a growing interest in improving urban outdoor habitats.
Additionally, global birth rates are decreasing, people are living longer, and the global population is aging, with this trend accelerating particularly in urban areas [8]. In the center of Guangzhou, China, the proportion of elderly residents has reached 22.5% [9]. In reviews of high temperatures and climate change, the elderly are often defined as a vulnerable group that is at greater risk from global climate change. Consequently, improving the health and comfort of the elderly has become a popular research topic [10,11].

1.2. Literature Review

In the earliest studies of thermal comfort in older adults, significant differences in thermal comfort have been found between older and younger adults [12]. Some studies have found that as we age, our metabolic rate decreases, and our ability to perceive our environment, including sensitivity to heat, diminishes, making older people less sensitive to heat than younger individuals [13,14]. It also makes older people more responsive to environmental changes than other age groups [15]. Yang et al. [16] conducted a study on the indoor thermal sensation of elderly people in 26 nursing homes in South Korea. The results of the study revealed that the elderly preferred the cold season over the hot season due to the greater variety of thermal-resistant clothing options available during colder months. At the same time, many studies suggest that when older people express dissatisfaction with the indoor environment, they can enhance their comfort by adjusting their thermal adaptation behaviors, such as reducing physical activity, increasing water intake, modifying clothing, or adjusting air conditioning [17,18,19]. As a result, the environmental needs of older people differ from those of other age groups [20]. While some studies suggest that outdoor activity is a crucial aspect of aging well [21,22], today’s bioclimatic design strategies for cities often do not address the outdoor heat-related needs of elderly individuals [23,24,25]. And because outdoor environments are more complex and variable than indoor environments, simple thermal sensations in outdoor environments are not fully representative of the comfort of older adults when enjoying urban outdoor spaces [26].
As research advances, an increasing number of scholars are discovering that relative humidity is one of the key factors that affect the comfort of outdoor activity spaces [27,28]. In hot climates, the human body dissipates excess heat through sweating to maintain a stable body temperature. In high-humidity environments, the presence of moisture in the air slows down the evaporation of sweat, causing people to feel even hotter [29]. A study by Du et al. [30] found a significant increase in humidity sensation voting (HSV) when summer air temperatures exceeded 32 °C. Li et al. [31] investigated the range of comfortable humidity for different seasons and found that the comfortable humidity ranged from 7.9 to 15.1 g/kg in spring, 3.3 to 18.8 g/kg in summer, and 2.9 to 12.8 g/kg (humidity ratio) in fall and winter, respectively. In addition to humidity, natural outdoor air is an equally important factor in outdoor thermal comfort. Lu et al. [32] conducted a study on the thermal comfort of semi-open buildings under natural ventilation conditions in Hainan, China. The results showed a significant positive correlation between wind speed and thermal satisfaction for both local residents and tourists. In Hong Kong, a hot and humid area, Ng et al. [33] investigated the impact of wind speed on human thermal comfort. The results indicated that people require a minimum wind speed of 0.9–1.3 m/s for good thermal comfort in summer.
In conclusion, due to the extreme heat environments during the summer months in humid and hot areas, many researchers have begun to analyze the effects of extreme climatic conditions on the physiological safety of the human body, and the high outdoor temperatures in humid and hot areas are of particular concern [34,35]. When living in hot environments above 35 °C [36], exposure to high temperatures may increase the probability of illness (heat stroke, heat cramps and heat exhaustion) [37,38]. To reduce health risks in hot environments, researchers have proposed a number of strategies to improve outdoor thermal environments to protect urban residents at work, training, and recreation [39]. However, these strategies do not focus on the aging population as a group. In order to address the health and well-being of the aging population, there is a need to investigate summer outdoor comfort for older adults.

1.3. Research Objective

While studies have explored heat perception among elderly people in various regions, research on heat perception, wind perception, and humidity perception of elderly individuals in hot and humid subtropical climate zones remains limited. This study investigated not only heat perception (including heat comfort, heat sensation and heat acceptability) but also wind perception (including wind comfort, wind sensation and wind acceptability) and humidity perception (including humidity comfort, humidity sensation and humidity acceptability), which have been neglected in the past. In addition to this, the study also examined the effect of gender on these perceptions. The results of this study can extend the understanding of summer outdoor microclimatic factors for the elderly in hot and humid areas and provide guidance to urban planners and architects to help them create urban environments that are more comfortable and responsive to the needs of the elderly.

2. Methodology

2.1. Study Sites

Guangzhou (112°E–114.2°E, 22.3°N–24.1°N), located in the south of China, is the capital city of Guangdong Province and a megacity in the Pearl River Delta city cluster. Ac-cording to the Köppen climate classification, Guangzhou has a humid subtropical climate, with south-easterly winds prevailing in summer [40]. Guangzhou has hot and humid summers with abundant rainfall and relatively mild winters with little rain. Figure 1 displays a typical meteorological year for Guangzhou from 2014 to 2018, indicating an annual average air temperature of approximately 22 °C and an annual average relative humidity of around 77%. In August, the average air temperature is about 26 °C, with an average relative humidity of approximately 73% [41]. With the combination of high temperatures and high humidity in Guangzhou, summer thermal environments often experience moderate to high levels of heat stress [42].

2.2. On-Site Measurement

The experiment was conducted from 17 August to 26 August 2023, during which six typical summer meteorological days were selected for the measurement of outdoor spatial thermal environment parameters, the collection of subjective thermal evaluation questionnaires and the measurement of human physiological parameters. The measurements and questionnaires were taken and distributed over a period of 570 min, from 9:30 a.m. to 6:00 p.m. The field instrumentation automatically recorded the outdoor thermal environment parameters, while the experimenters recorded the physiological parameters and subjective perception of microclimatic factors of the aging people in the experimental site. This survey was conducted in a city park in Panyu District, Guangzhou City. During each survey in the park, mobile observers randomly distributed questionnaires to elderly respondents. The questionnaires were distributed in spaces such as shade trees, open walkways, and lakeside. The specific park layout and mobile route are shown in Figure 2.
During the field measurements, the globe temperature of the outdoor environment was measured using the SSDZY-1 thermal comfort meter, while the air temperature (Ta) and relative humidity (RH) were measured using the HOBO Pro. The wind speed (Va) of the outdoor environment was recorded using the Kestrel 5500 handheld anemometer. The measurement range, accuracy and data acquisition frequency of all instruments are in accordance with the ISO7726 standard [43]. Specific instrument parameters are shown in Table 1. According to ISO 7726, the instrument was arranged near 1.1 m from the vicinity of the subject, which is the center of gravity position recommended by the ISO 7726 standard for human standing. The globe thermometer has a diameter (D) of 0.15 m and a sphere emissivity (εg) of 0.95. The mean radiant temperature (MRT) is calculated from Equation (1) [44]. This is one of the most commonly used methods for estimating the outdoor MRT [45,46,47,48].
M R T = T g + 273 4 + 1.1 × 10 8 × V a 0.6 ε g × D 0.4 × T g T a 1 4 273 ,

2.3. Survey Questionnaire

According to the age classification regulations of the National Bureau of Statistics of China, people aged 65 and above are considered elderly [49]. Therefore, the age of the respondents in this study was greater than or equal to 65 years. The questionnaire for this study consisted of two parts. The first part included the physical characteristics of the respondents, such as gender, age, height, weight, clothing status, and exercise status during the past 20 min. The heat resistance and human metabolic rate of the garments are determined according to ISO 7730 and ISO 9920 [50,51]. The second section includes the respondents’ subjective perception of meteorological factors, including thermal sensation, wind sensation, humidity sensation, wind acceptability, humidity acceptability, and overall thermal acceptability. The range of thermal, humidity and wind sensations corresponds to thermal environments as described in ASHRAE 55 and ISO 7730. The traditional ASHRAE seven-point scale was used as follows: −3, cold (very dry, very light winds); −2, cool (dry, light winds); −1, slightly cool (slightly dry, slightly light winds); 0, neutral; 1, slightly hot (slightly humid, slightly windy); 2, warm (humid, very windy); 3, hot (very humid, excessive windy). A three-point scale was used for thermal, humidity and wind comfort: −1, uncomfortable; 0, fair; 1 comfortable. Thermal, humidity and wind sensations were accepted on a two-point scale: 0, acceptable; 1, unacceptable. Older people are the age group most susceptible to disease, and taking medication can affect the results of subjective questionnaires, so the effects of disease and medication were excluded from this study, and all respondents lived in Guangzhou for more than one year without chronic diseases or taking medication. The detailed questionnaire is shown in Appendix A.

2.4. The Thermal Index

Physiological Equivalent Temperature (PET) is a thermal comfort indicator derived from human heat balance modeling and is widely used in the evaluation of elderly outdoor thermal comfort [52,53,54]. In this study, MRT, Ta, RH and Va were utilized to calculate PET in the Rayman model to assess outdoor human thermal comfort. The PET derived from Rayman’s model is the same as the PET calculated using Höppe’s PET Fortran program [55,56].

3. Results

3.1. Physiological Characteristics

A total of 594 questionnaires were distributed in this study and 543 valid questionnaires were returned. Male respondents accounted for 48.6% and female respondents 51.4%. Table 2 shows the number and physical characteristics of respondents per day. According to ISO 7730 standards and ASHRAE Standard 55, metabolism is influenced by many factors, including activity type, age, and gender. The metabolic rates of people in various states were set as follows: quietly seated (1 met), standing (1.2 met), walking (2 met), brisk walking (2.6 met), and jogging (3.8 met), respectively. One met unit at the relaxed sitting state is calculated as 58.2 W/m2. Respondents had the following mean characteristics: clothing insulation of 0.38 ± 0.08 clo, metabolic rate of 88.2 ± 27.4 W/m2, height of 162.2 ± 3.4 cm, weight of 60.2 ± 4.3 kg, and an age of 69 ± 2.4 years. The youngest of these respondents was 65 years old and the oldest was 76 years old.

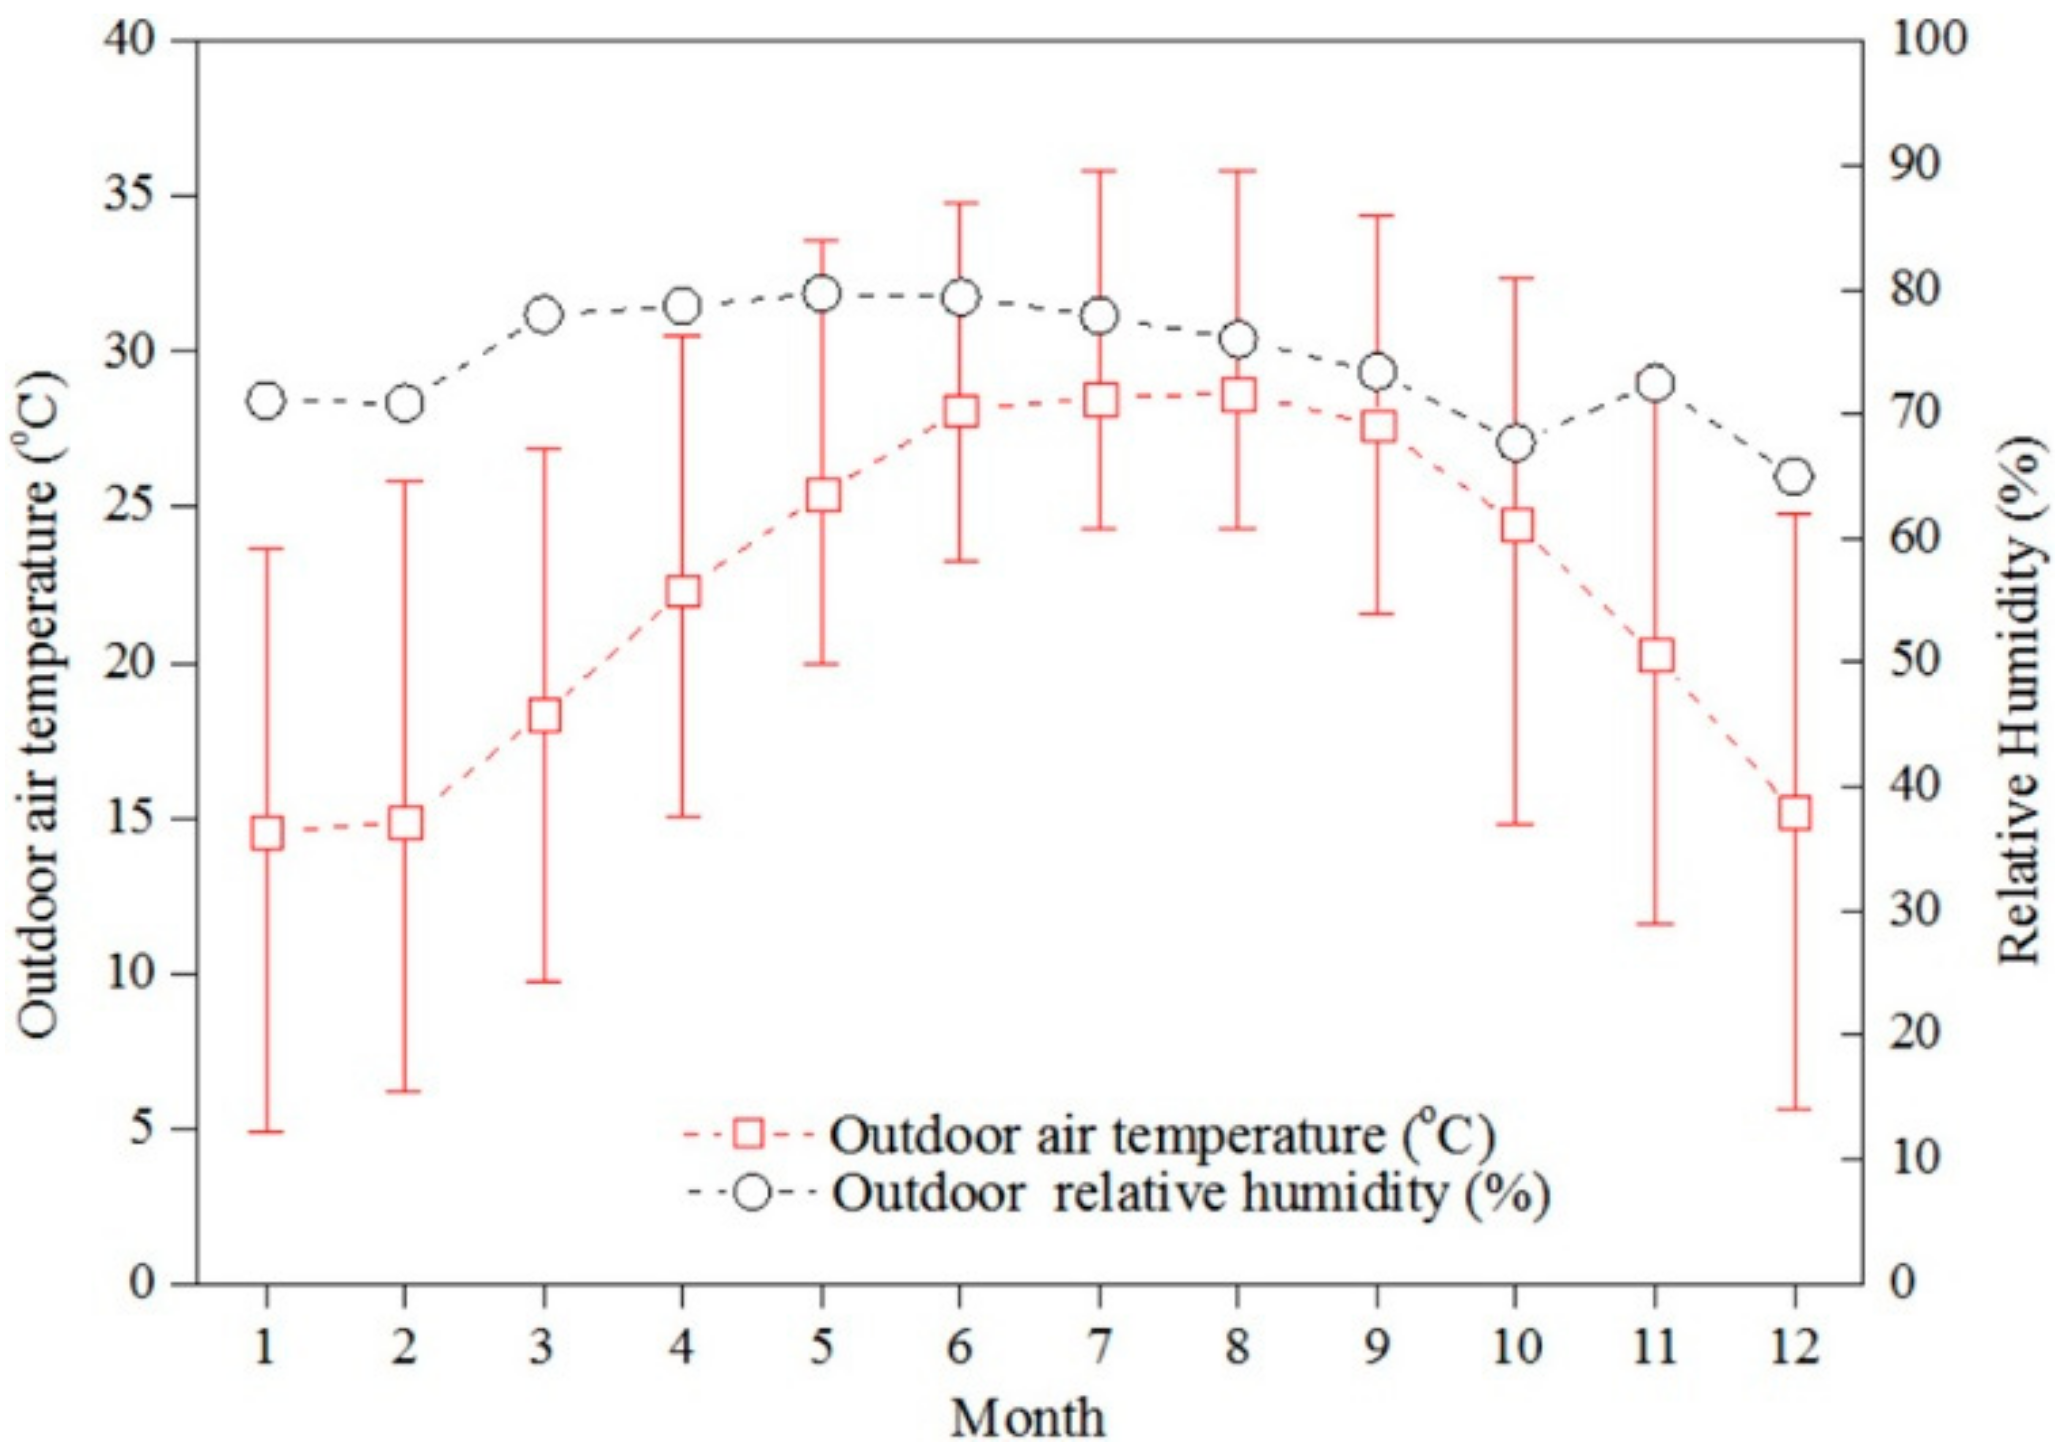
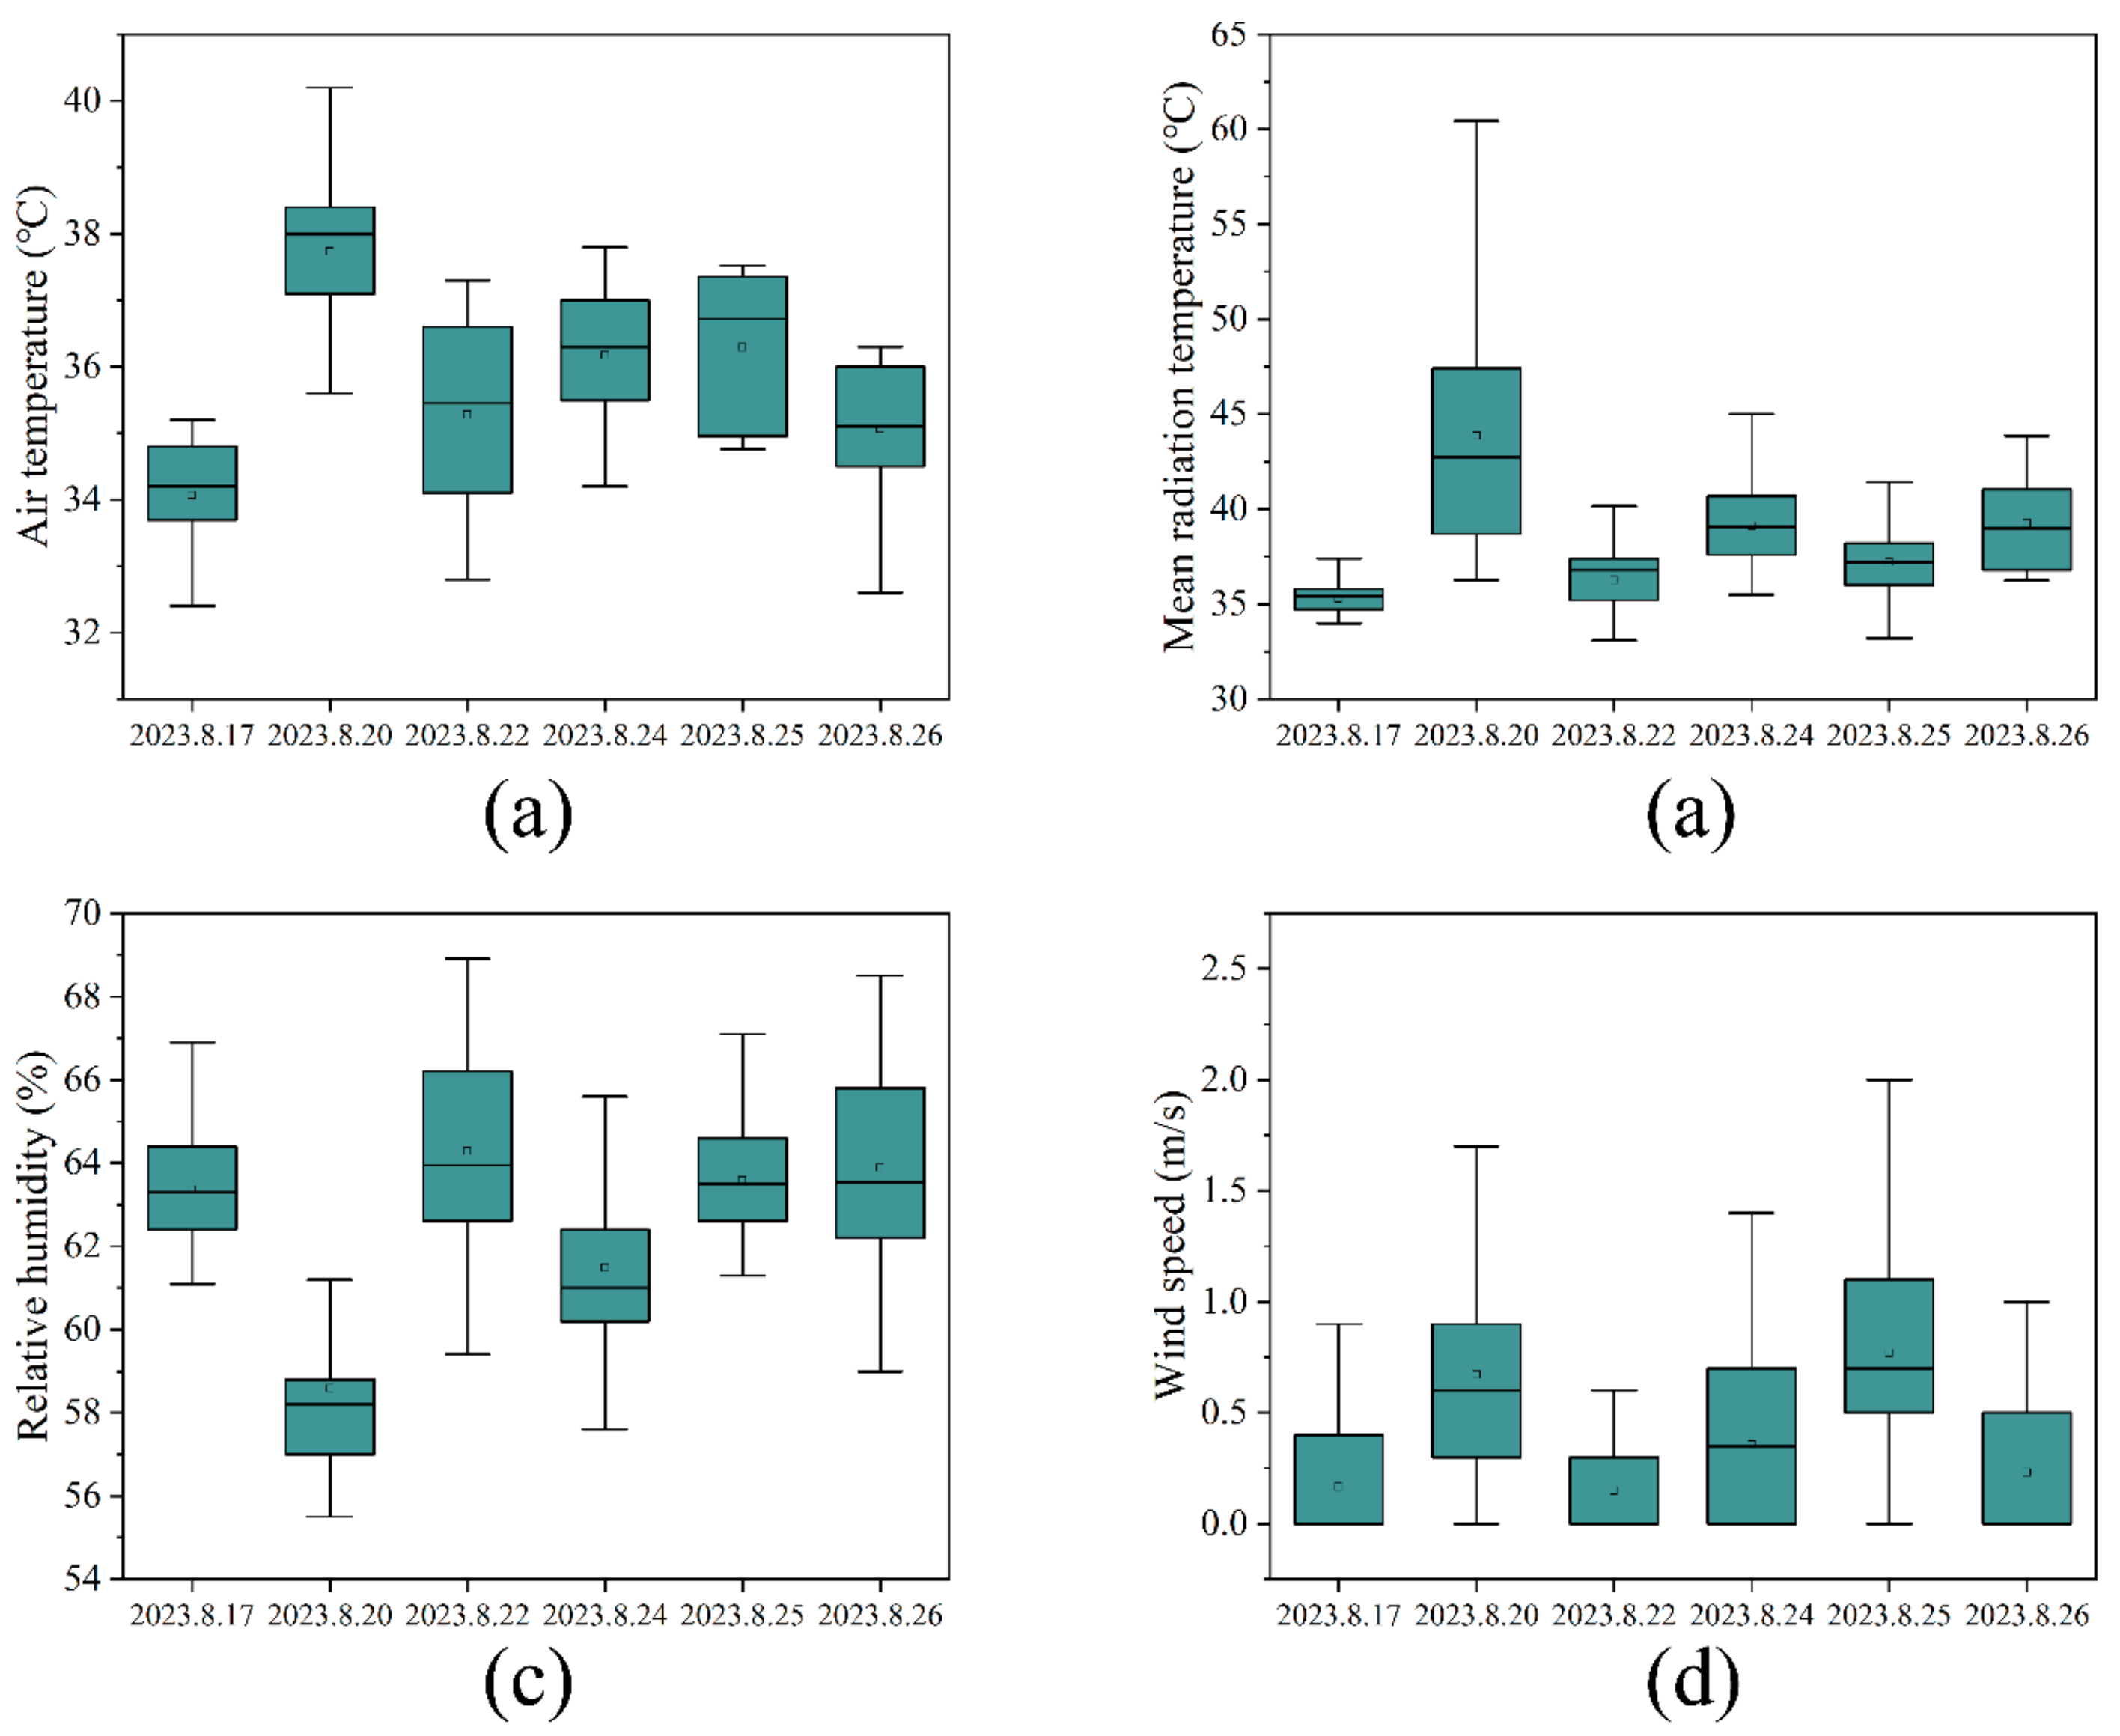
3.2. Meteorological Parameters

The measured outdoor microclimate parameters are shown in Figure 3. The mean Ta, MRT, RH and Va values during the experimental period were 35.8 °C, 38.5 °C, 62.5% and 0.39 m/s, respectively. The maximum and minimum Ta were 40.9 °C and 32.3 °C, the maximum and minimum MRT were 60.4 °C and 33.2 °C, the maximum and minimum RH were 68.9% and 55.2%, and the maximum and minimum Va were 1.8 m/s and 0 m/s, respectively. The measured results are consistent with the typical summer day climate characteristics of Guangzhou City.

3.3. Distribution of Subjective Perception and Comfort Votes

Figure 4a shows the thermal sensation voting (TSV), wind sensation voting (WSV) and humidity sensation voting (HSV) percentages. Throughout the fieldwork, 17.9% of respondents felt “very hot”, 30.2% of the respondents felt “hot”, 11.6% of respondents felt “warm”, 38.7% of respondents felt “neutral”, and only 1.6% of respondents felt “slightly cold”. For WSV, 1.7% of respondents felt that there was “excessive windy”, 7.9% of respondents felt “very windy”, 10.3% of respondents felt “slightly windy”, 44.6% of respondents feel “neutral”, 17.3% of the respondents felt that the wind was “slightly light winds”, 11.6% of the respondents felt that there were “light winds”, 6.6% of the respondents felt that there were “very light winds”. For HSV, 6.8% of respondents felt “very humid”, 2.4% of respondents felt “humid”, 13.3% of respondents felt “slightly humid”, 69.4% of respondents felt “neutral”, 5.6% of respondents felt “slightly dry”, and 2.5% of respondents felt “dry”. Figure 4b shows the percentage of Thermal Comfort Vote (TCV), Wind Comfort Vote (WCV) and Humidity Comfort Vote (HCV). Throughout the fieldwork 17.7% of respondents found the current thermal environment to be “uncomfortable”, 50.3% found it to be “just so so”, and 32% found it to be “comfortable”. Regarding the wind environment, 18.4% of the respondents thought that the current wind environment was “uncomfortable”, 27.4% thought that it was “just so so”, and 45.8% thought that it was “comfortable”. Regarding the humidity environment, 7.9% of the respondents considered it “uncomfortable”, 14.6% considered it “just so so”, and 77.5% considered it “comfortable”. Since the respondents have been living in hot and humid areas for a long time, they have adapted to the high humidity outside in summer, so the proportion of RH “uncomfortable” is significantly smaller than that of other microclimate factors.

3.4. Distribution of Preference Vote

Respondents’ preference voting for meteorological parameters during the survey period is shown in Figure 5. For Ta, 56.4% of the respondents needed a lower Ta, 41.1% said that the current Ta did not need to be changed, and 2.5% needed a higher Ta. For MRT, 54.1% of respondents needed a lower MRT, 42.7% said that the current MRT did not need to be changed, and 3.2% needed a higher MRT. For RH, 18.2% of the respondents needed a lower RH, 77.7% said that the current RH did not need to be changed, and 3.2% needed a higher RH. For Va, 1.6% of respondents needed a lower Va, 71.3% of respondents said that the current Va did not need to be changed, and 27.1% of respondents needed a higher Va. This result shows that older respondents were more satisfied with RH and Va than with Ta and MRT.

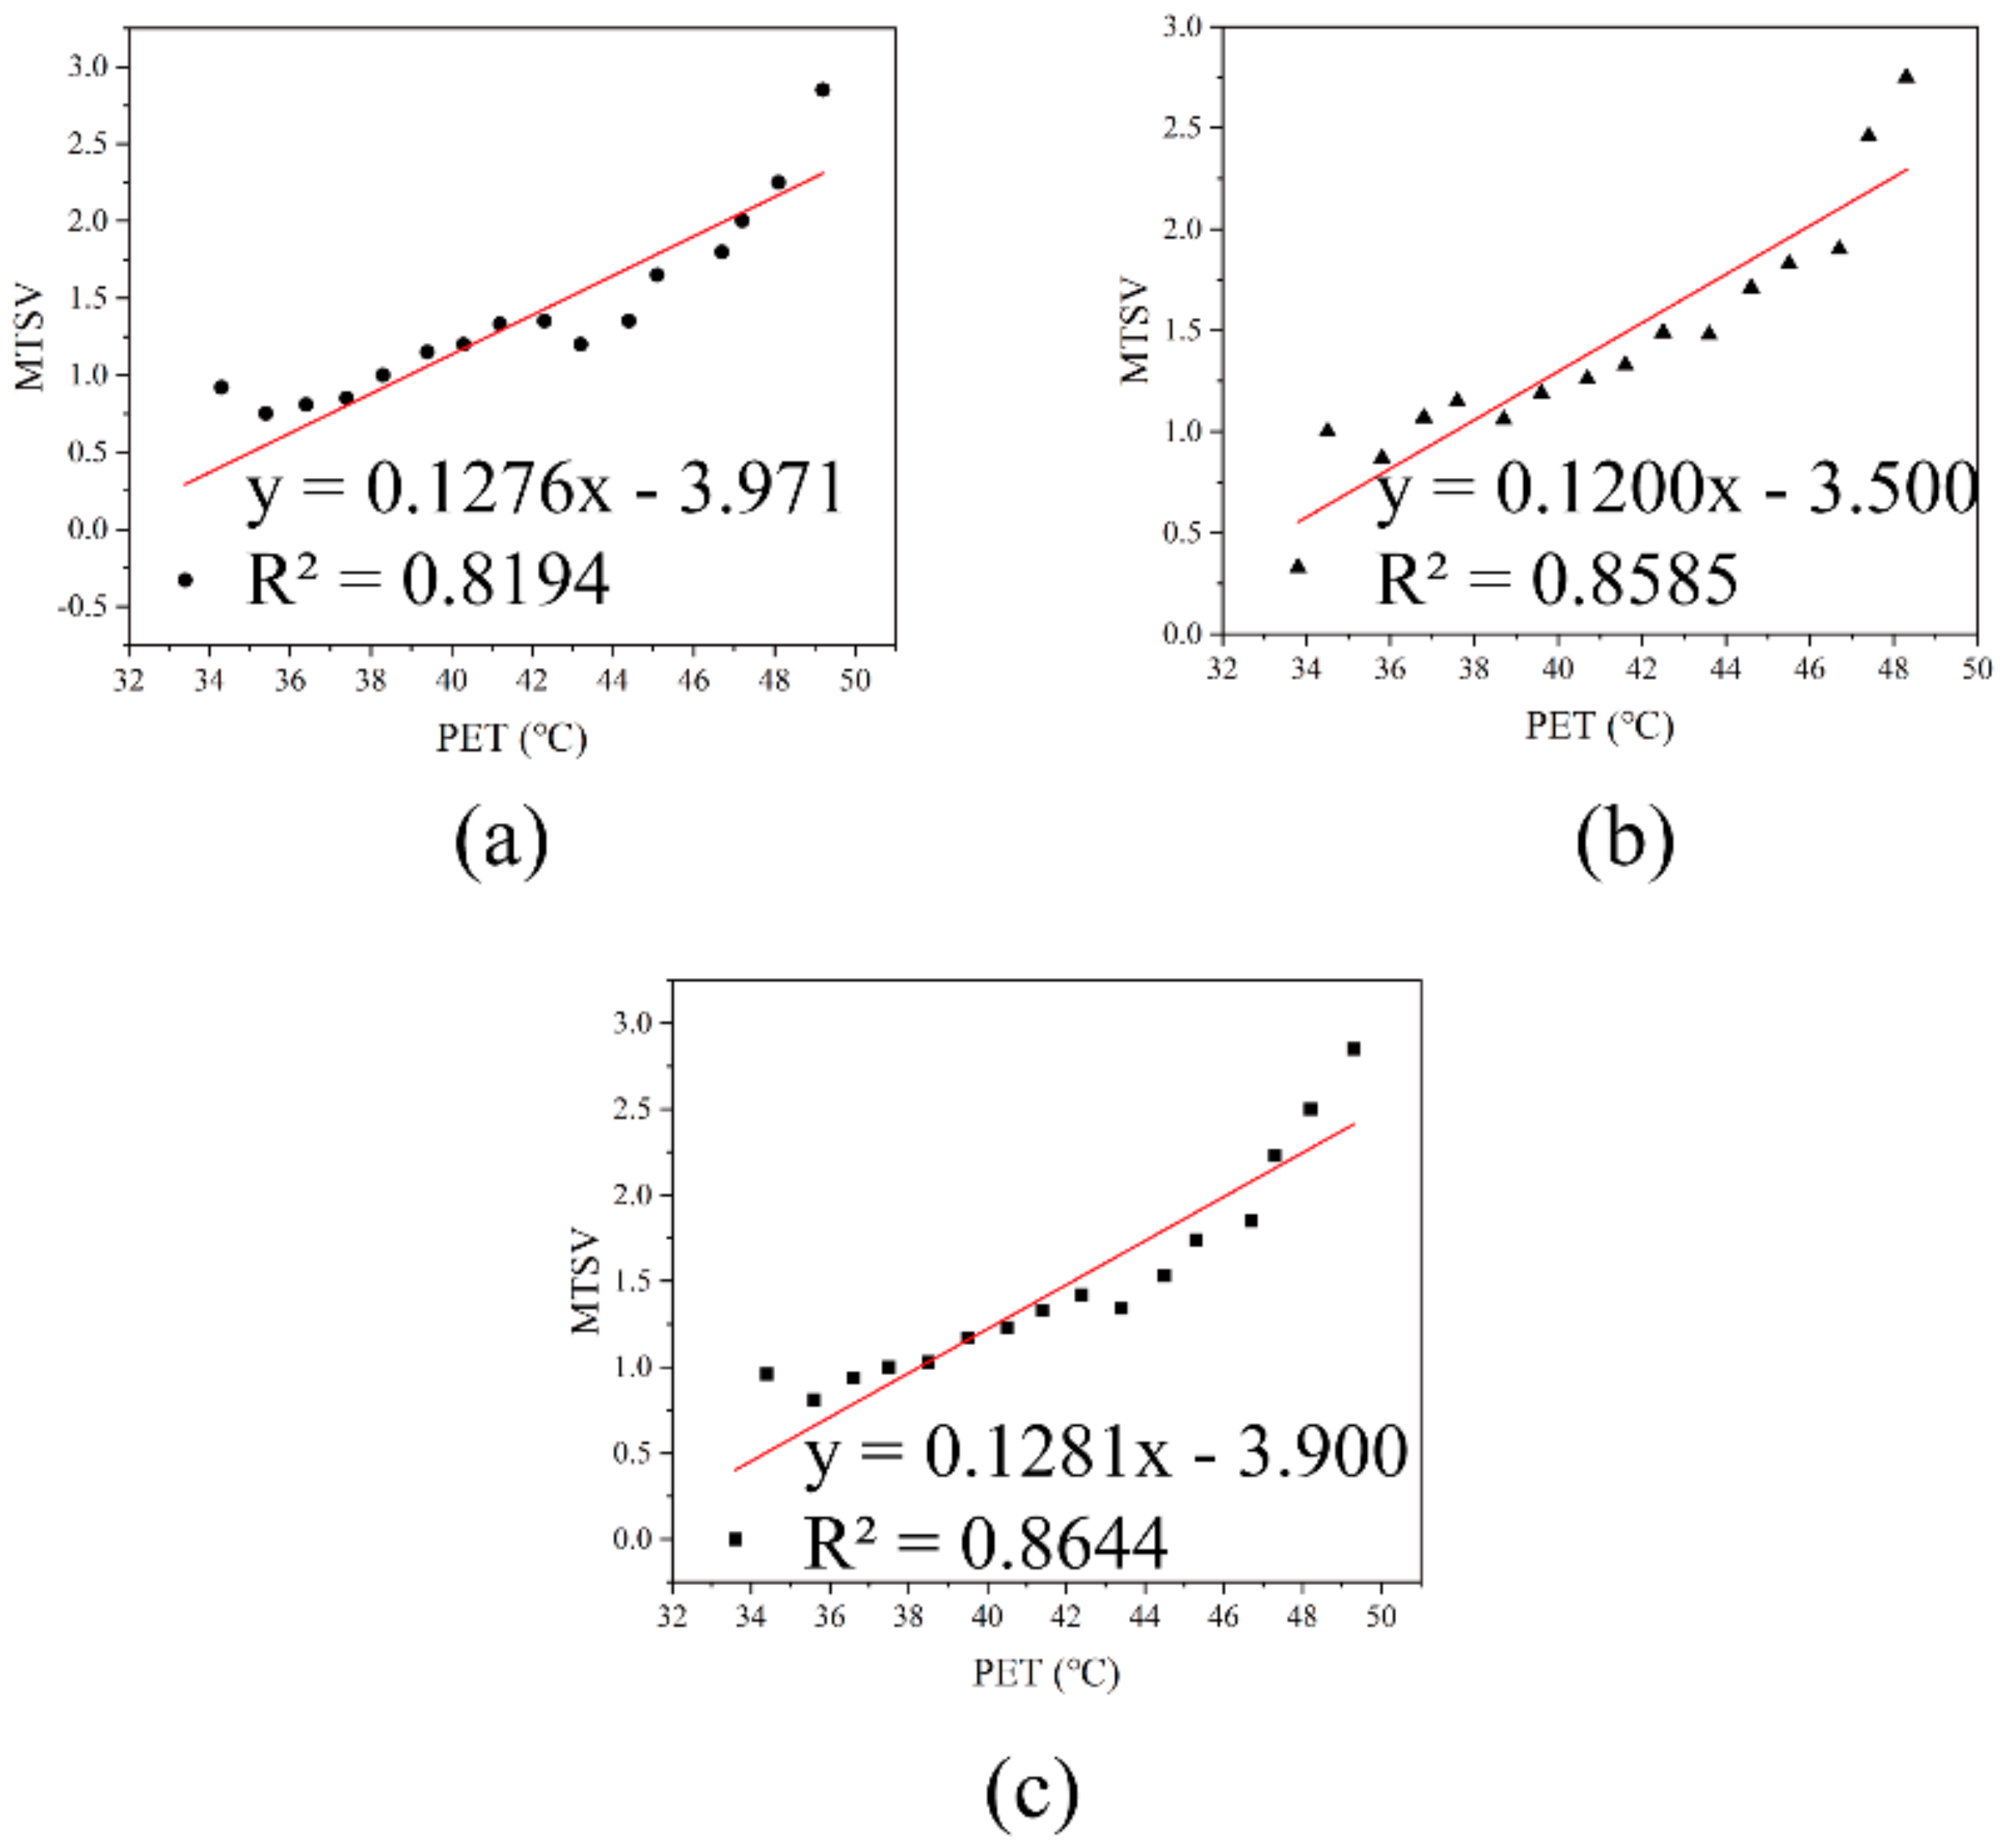
3.5. Thermal Sensation and Thermal Acceptability

3.5.1. Neutral PET (NPET)

We calculated the Mean TSV (MTSV) for male and female respondents at a PET interval of 1 °C and plotted these values against each other. The results of the calculations are shown in Figure 6. The slope of the regression equation for male respondents was 0.1276, which corresponds to 7.8 °C PET/MTSV. The slope of the regression equation for female respondents was 0.1200, which corresponds to 10.1 °C PET/MTSV. The slope of the regression equation for all respondents was 0.1281, which corresponds to 7.8 °C PET/MTSV. This suggests that male elderly individuals in summer are less sensitive to changes in PET than female elderly individuals. Neutral temperature is the temperature at which people feel neither cold nor hot [4]. When MTSV = 0, NPET was 31.1 °C for male respondents, 29.2 °C for female respondents, and 30.4 °C for all respondents [Equations (3)–(5)]. The NPET range (NPETR) is the temperature range within the TSV range of −0.5 to 0.5 [57]. The NPETR was 27.2–35.0 °C for male respondents, 25.0–33.3 °C for female respondents, and 26.5–34.4 °C for all respondents. The upper and lower limits of NPETR were 1.7 and 2.2 °C higher in male respondents, respectively, compared to female respondents. This indicates that male respondents were less thermally sensitive to hot conditions than female respondents and more heat resistant than female respondents.
Male respondent: MTSV = 0.1276PET − 3.971 (R2 = 0.8194)
Female respondent: MTSV = 0.1200PET − 3.500 (R2 = 0.8585)
Total respondent: MTSV = 0.1281PET − 3.900 (R2 = 0.8644)

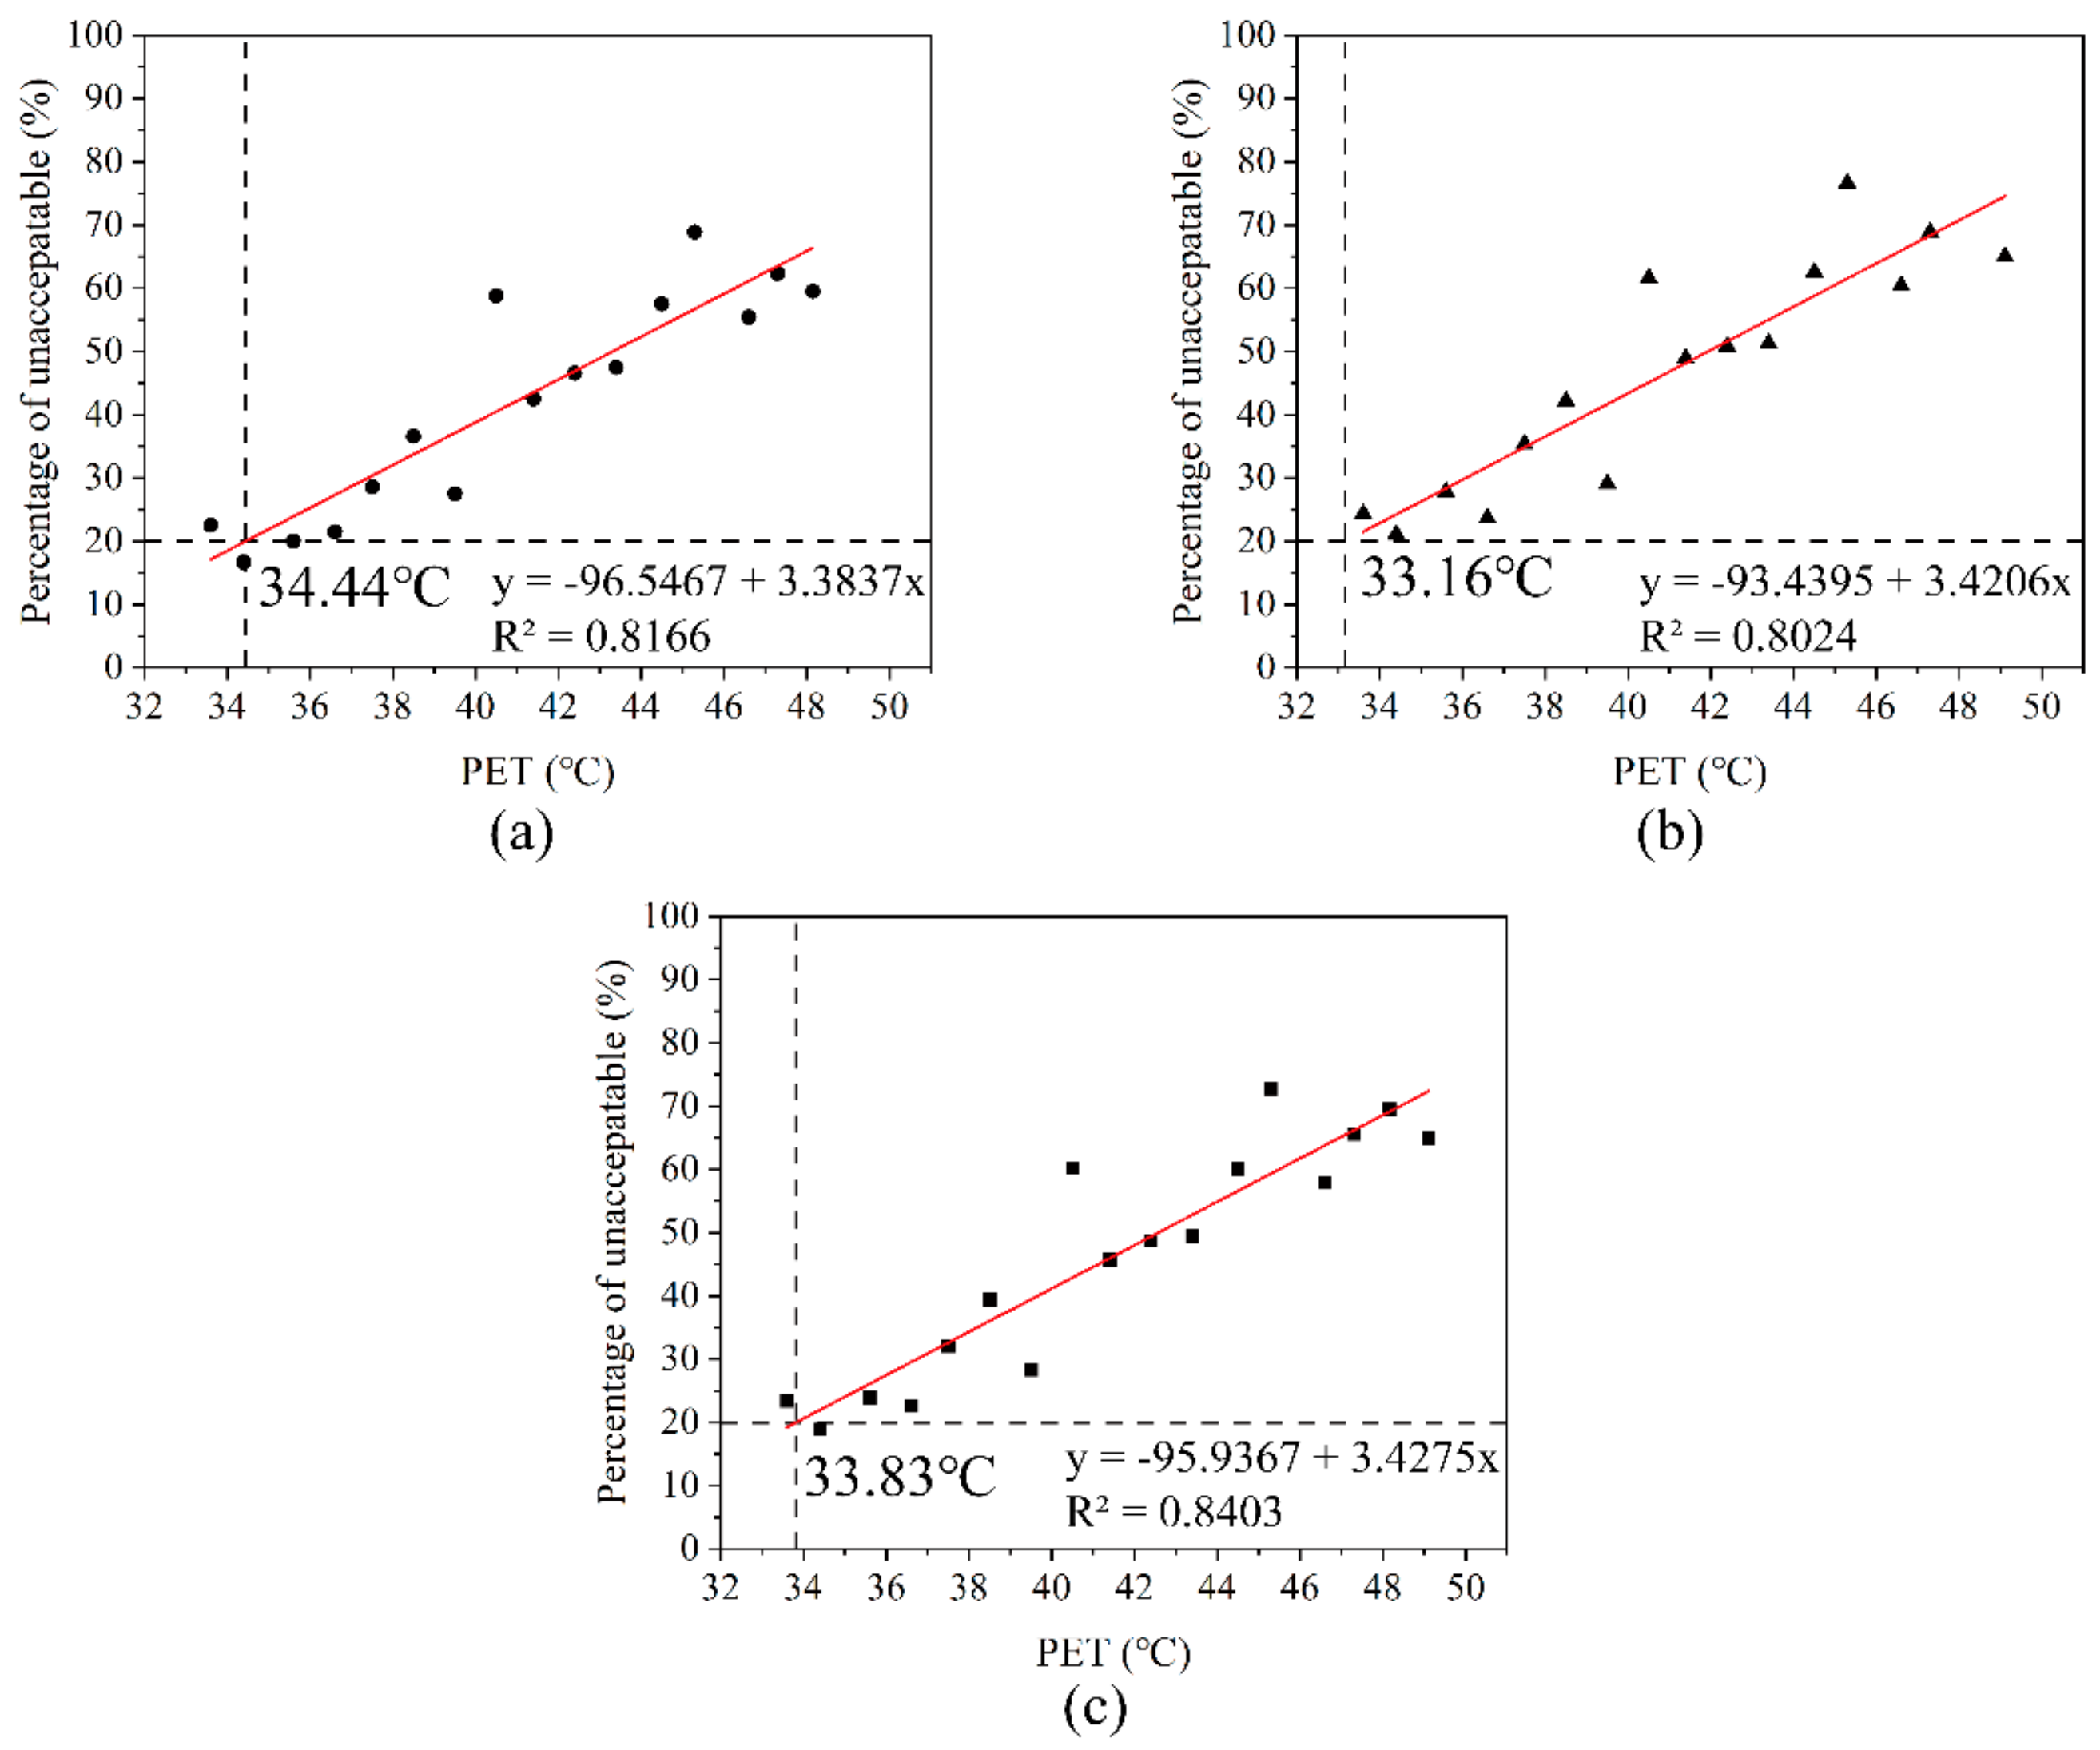
3.5.2. Thermal Acceptability

ASHRAE Standard 55 states that at least 80% of respondents indicating that the thermal environment is acceptable means that the thermal environment is acceptable for that condition [34]. We calculated the proportion of unacceptability within each 1 °C interval of PET among male and female respondents and performed a linear fit to PET. The results are shown in Figure 7. At a thermal acceptability rate of 80%, the acceptable PET was 34.4 and 33.2 °C for male and female respondents, respectively. Acceptable PET for all respondents was 33.8 °C. Acceptable PET for male respondents was 1.2 °C higher than female respondents. In summary, male respondents had a higher thermal tolerance than female respondents.

3.6. Wind Sensation and Wind Acceptability

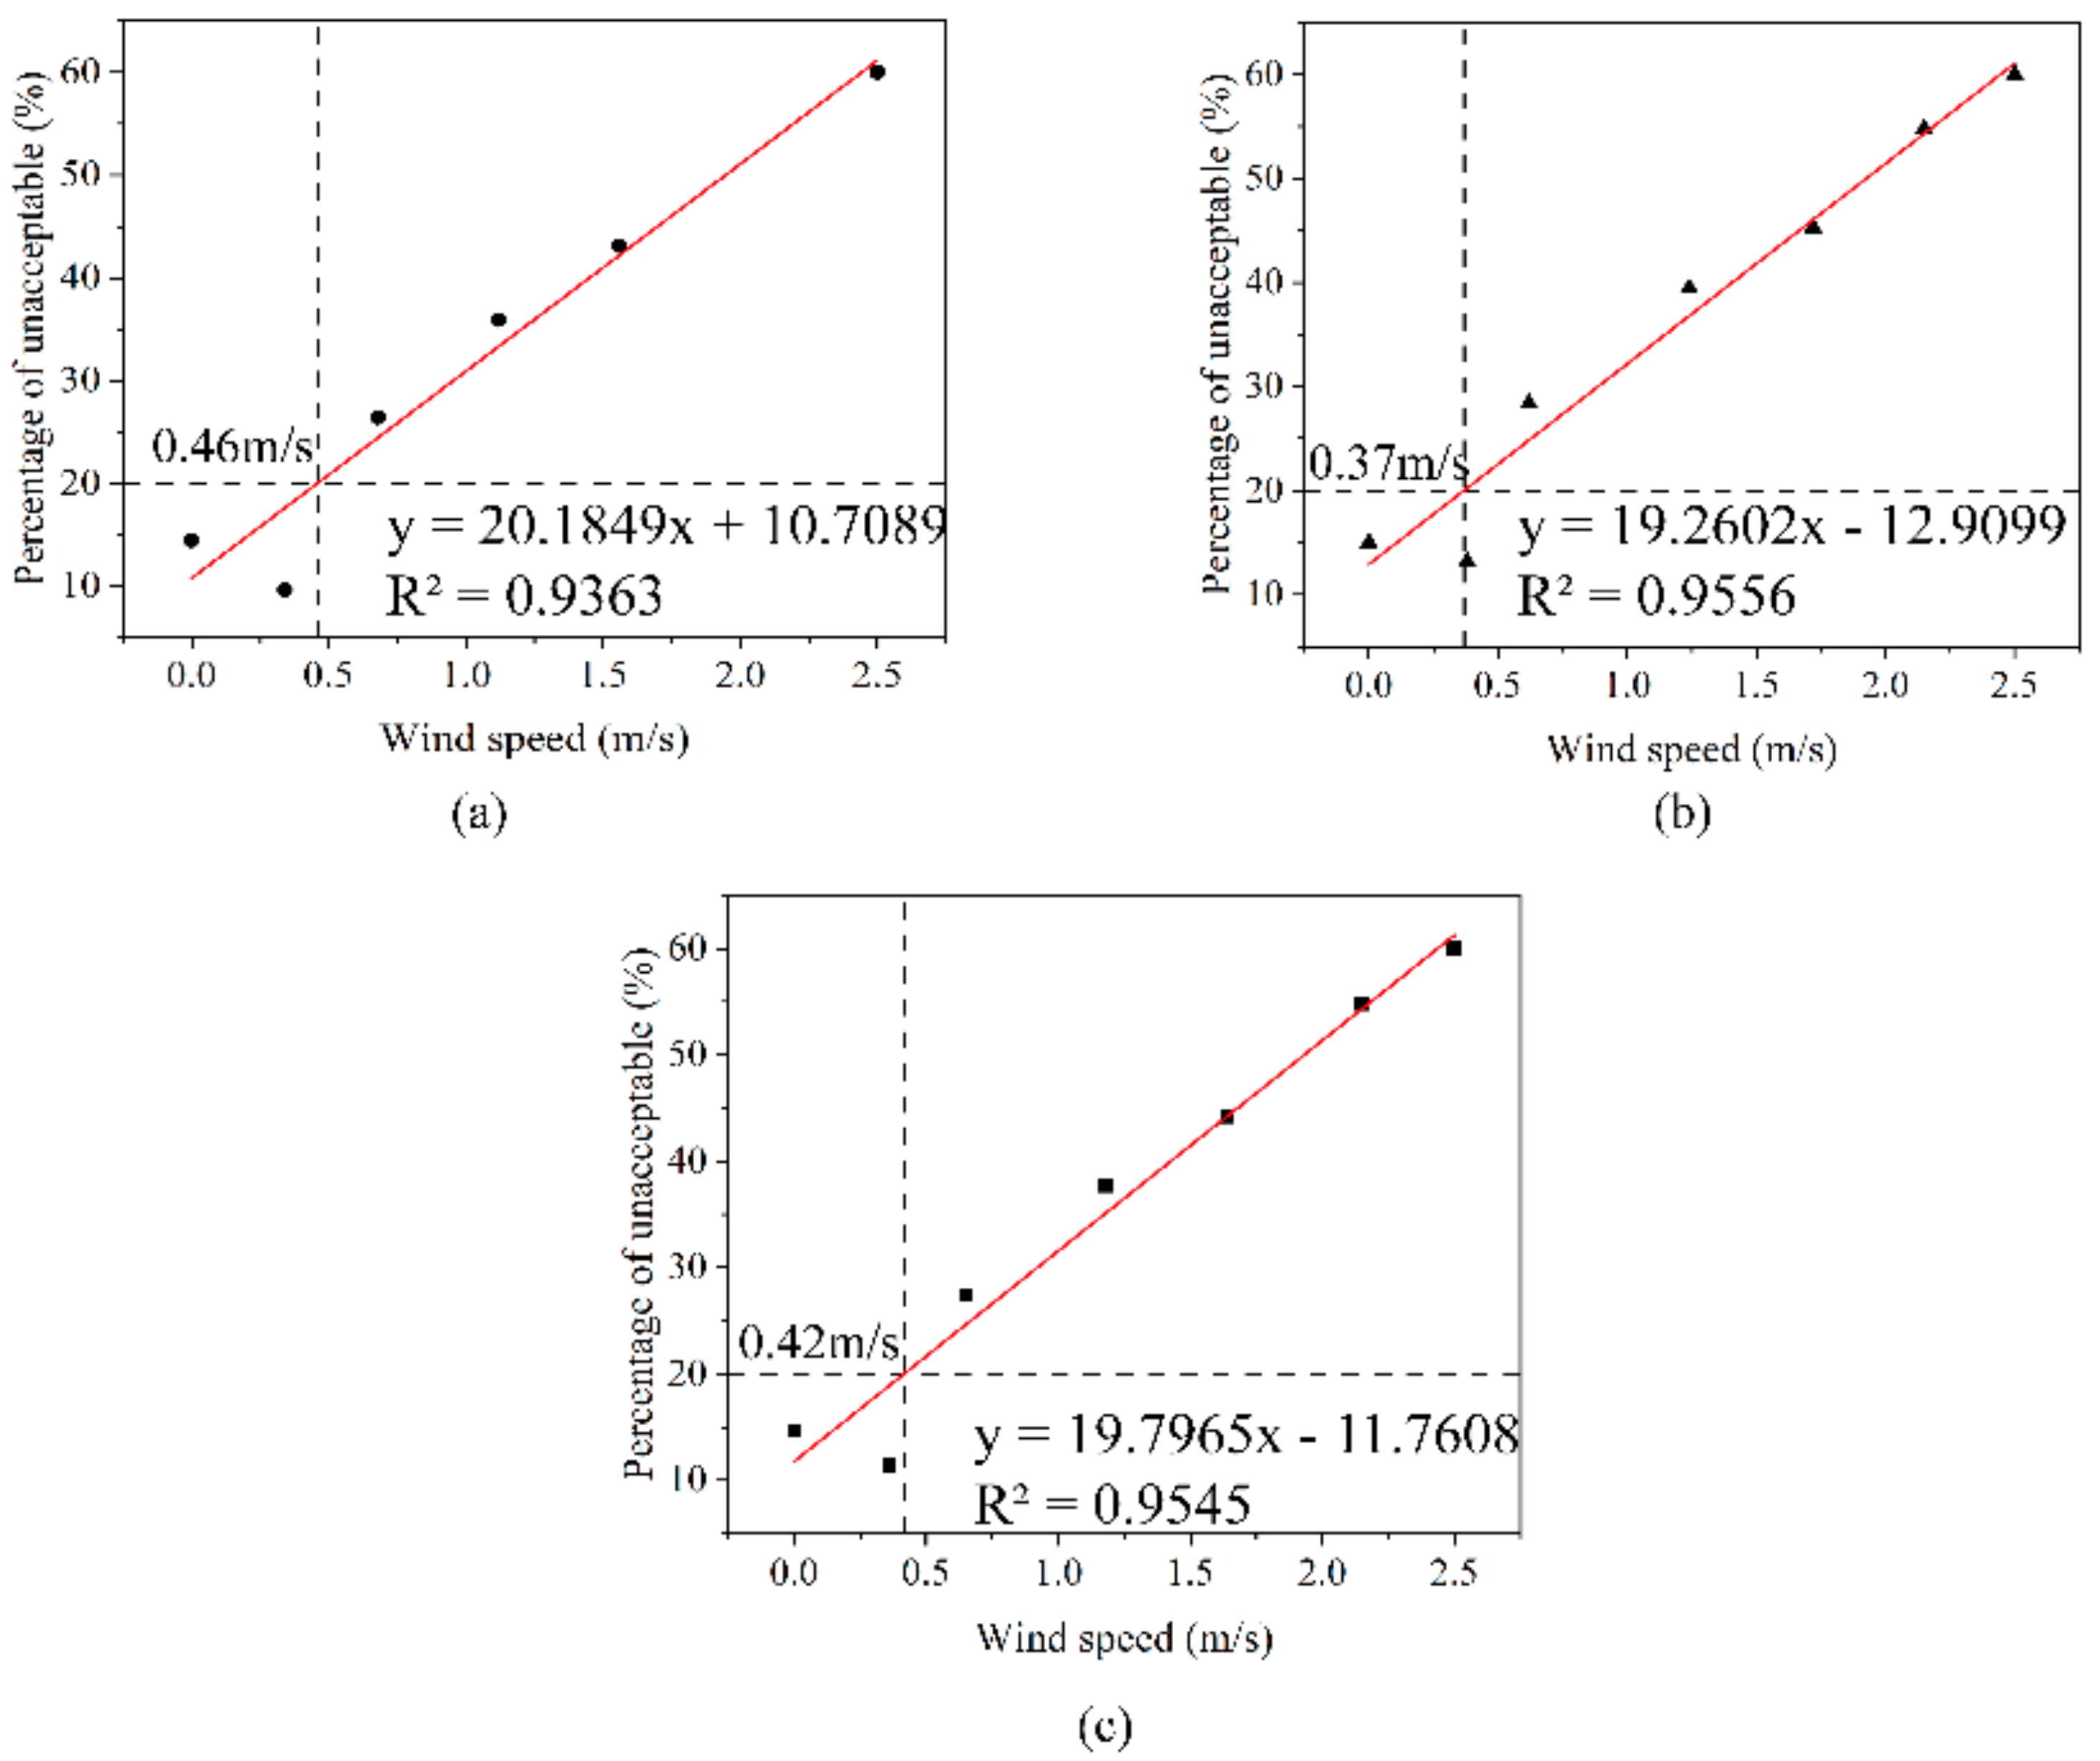
3.6.1. Neutral Wind Speed (NVa)

We calculated the Mean WSV (MWSV) at wind speed intervals of every 0.5 m/s, and Figure 8 displays the mean wind speed sensation reported by the respondents. The slope of the regression equation for male respondents was 1.2076, which corresponds to 0.8 m/s Va/MWSV, for female respondents it was 1.2167, which corresponds to 0.9 m/s Va/MWSV, and for all respondents it was 1.2578, which corresponds to 0.8 m/s Va/MWSV. This means that male respondents were slightly less sensitive to Va than female respondents. When MWSV = 0, the corresponding Va is 0.4 m/s for male respondents, 0.5 m/s for female respondents, and 0.4 m/s for all respondents [Equations (6)–(8)]. The NVa range (NVaR) is the range of wind speeds within the WSV range −0.5 to 0.5. The NVaR was 0–0.8 m/s for male respondents, 0.1–0.9 m/s for female respondents, and 0.1–0.9 m/s for all respondents. The lower and upper NVaR limits for male respondents were slightly lower than those for female respondents, but the overall difference was not significant.
Male respondent: MWSV = 1.2076Va − 0.4981 (R2 = 0.8390)
Female respondent: MWSV = 1.2167Va − 0.6123 (R2 = 0.9414)
Total respondent: MWSV = 1.2578Va − 0.5766 (R2 = 0.9226)

3.6.2. Wind Acceptability

We calculated the proportion of unacceptability within each 0.5 m/s interval of Va among male and female respondents and conducted a linear fit to Va. The results are shown in Figure 9. At a wind acceptability of 80%, the acceptable Va was 0.5 and 0.4 m/s for male and female respondents, respectively. The acceptable Va for all respondents was 0.4 m/s. Acceptable Va was 0.1 m/s higher for male respondents than for female respondents. Male respondents had a slightly lower NVaR than females, but their Acceptable Va was slightly higher than that of females, implying that males have a higher tolerance for slightly higher winds than females, but the overall gender difference was not significant.

3.7. Humidity Sensation and Humidity Acceptability

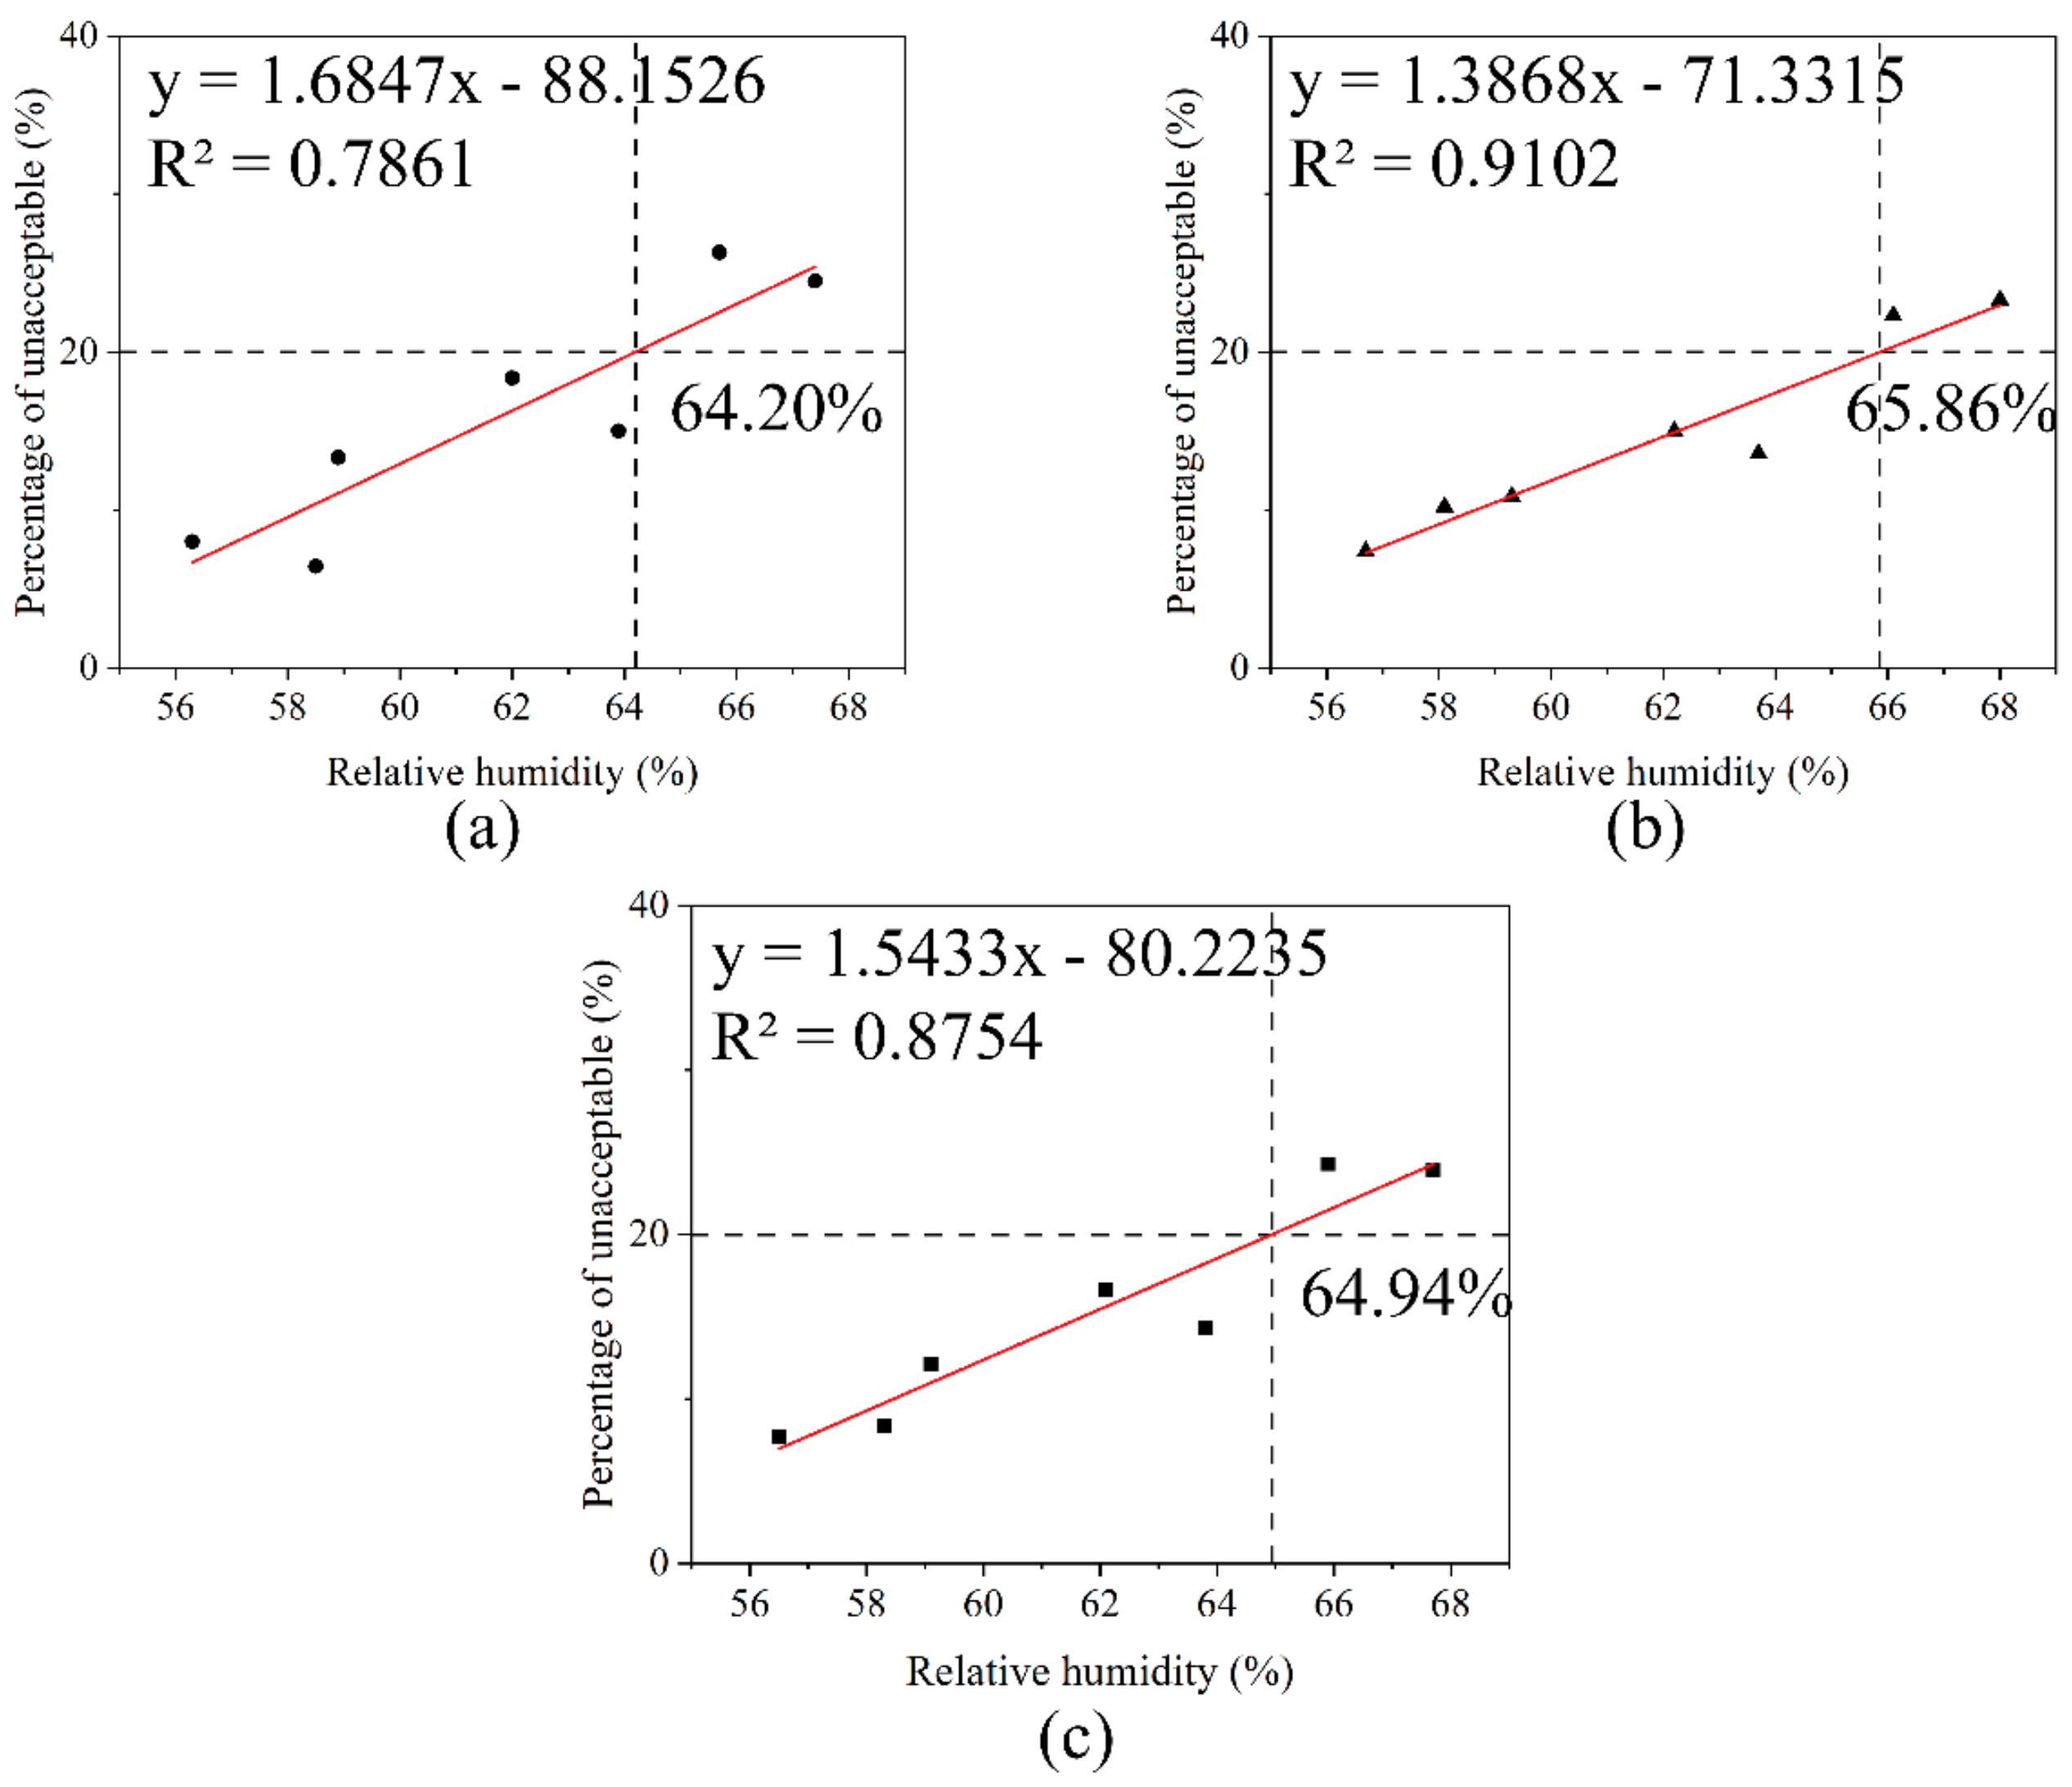
3.7.1. Neutral Relative Humidity (NRH)

We calculated the Mean HSV (MHSV) at relative humidity intervals of every 2%. Figure 10 shows the mean humidity sensation vote of the respondents. The slope of the regression equation for male respondents was 0.0520, which corresponds to 19.23%/RH/MHSV, the slope of the regression equation for female respondents was 0.0509, which corresponds to 19.65%/RH/MHSV, and the slope of the regression equation for all respondents was 0.0516, which corresponds to 19.38%/RH/MHSV. This means that male respondents were less sensitive to changes in RH than female respondents during the summer. When MHSV = 0, the corresponding RH was 56.05% for male respondents, 57.28% for female respondents, and 56.49% for all respondents [Equations (8)–(10)]. The NRH range (NRH)R is the range of relative humidity within the WSV range −0.5 to 0.5. The NRHR ranged from 46.44–65.67% for male respondents, 47.45–67.10% for female respondents, and 48.82–66.20% for all respondents. The lower and upper NRHR limits for male respondents were slightly lower than those for female respondents, implying that male respondents tolerated humidity less than female respondents.
Male respondent: MHSV = 0.0520RH − 2.9147 (R2 = 0.8434)
Female respondent: MHSV = 0.0509RH − 2.9153 (R2 = 0.8526)
Total respondent: MHSV = 0.0516RH − 2.9161 (R2 = 0.8507)

3.7.2. Humidity Acceptability

We calculated the proportion of unacceptability within each 2% interval of RH among male and female respondents and conducted a linear fit to the RH. The results are shown in Figure 11. At 80% acceptable humidity, the acceptable RH was 64.20 and 65.86% for male and female respondents, respectively. The acceptable RH for all respondents was 64.94%. Acceptable RH was 1.66% lower for male respondents than for female respondents. Overall, all respondents had a much higher level of acceptability of current humidity conditions than other microclimate factors.

4. Discussion

4.1. Thermal Environment

Male respondents in this study (27.2–35.0 °C) were less thermally sensitive to high-temperature conditions than female respondents (25.0–33.3 °C), and the overall respondents had a summer NPETR of 26.5–34.4 °C, which was higher than that of young people in the Guangzhou area (19.2–24.6 °C) [42]. And the outdoor NPET is 2.3 °C higher than that of Malaysian university students (28.1 °C) in the same humid and hot areas [58]. The weakening of the thermoregulatory system, due to the deterioration of various bodily functions in the elderly, affects the surface skin temperature of the elderly resulting in a reduced ability to perceive the thermal environment [59]. Under heat exposure, the stored heat in the body of the elderly cannot be eliminated, leading to a decrease in sensitivity to the surrounding heat environment [60,61]. In addition to this, when facing a hot environment, the elderly will have a more positive attitude than the young to cope with the hot weather, which reduces the subjective feeling of feeling the heat [15]. Comparisons of NPET among the elderly in different regions are shown in Table 3. The NPET was significantly higher in the summer months for older adults in hot and humid regions than for older adults in other regions. In this study, more than 80% of the elderly respondents have lived in Guangzhou for more than 30 years, and due to the long-term exposure to hot and humid climatic conditions, the elderly people in Guangzhou have developed a high level of heat tolerance.

4.2. Wind Environment

The NVa in this study was 0.41 m/s for male respondents and 0.5 m/s for female respondents, both falling within the range of 0.5 m/s. According to the Beaufort Wind Scale, a force 1 wind is 0.3–1.49 m/s and a force 2 wind is 1.5–3.25 m/s [62]. The NVa of all respondents was within the wind range of class 1. And in Hong Kong Du et al. specified wind comfort criteria for young people, which are considered unacceptable wind environments when the wind speed is below 1.5 m/s (force 2 wind) and the air temperature is higher than 30 °C [63]. It can be seen that the attitude of the elderly towards natural outdoor breezes is markedly different from that of the young. The reason for this difference is attributed to the aging of the body’s immune system in the elderly. Immune aging leads to the weakening of immune cells in the elderly’s bodies, making them more susceptible to diseases than other populations [64]. As a result, most elderly individuals choose to have lower wind speeds to avoid unnecessary health risks. Meanwhile, our results found that the slopes of the regression equations corresponding to PET, Va and RH for the older respondents were 0.1281, 1.2167 and 0.0516, respectively, and that the sensitivity of the older people facing Va was much higher than that of PET and RH. Therefore, when facing the outdoor high-wind environment in the summer, they tended to choose a lower wind speed.

4.3. Humidity Environment

The high summer humidity that characterizes the climate in hot and humid regions can exacerbate thermal maladaptation outdoors, and the relative humidity was in the range of 55–69% throughout the experimental period. In the face of high humidity, as many as 77.7% of the respondents indicated that there was no need to change the current RH and that the MHSV values of the respondents in this study were not high, ranging between −0.1 and 0.6. Only a small proportion of respondents (15.3%) found RH during the trial unacceptable. This shows that the RH during the experiment was largely within the comfort range. This is because people are much less sensitive to RH perception than to other environmental factors, especially when they are in a certain climate zone for a long time [4]. The respondents in this study lived in Guangzhou for a long period of time resulting in a reduced sensitivity to high humidity, and they tended to feel less humid than respondents in other climatic zones [65].

5. Conclusions

In this study, we investigated the perception of various meteorological factors by elderly people in Guangzhou City, China, through microclimate observation and the questionnaire method, and compared the outdoor thermal comfort of male and female elderly people. The following conclusions were drawn:
(1)
The NPET of the overall respondents was 30.4 °C and the acceptable PET was 33.8 °C; the NVa of the overall respondents was 0.4 m/s and the acceptable Va was 0.4 m/s; the NRH of the overall respondents was 56.49% and the acceptable RH was 64.94%.
(2)
Summer TSVs for older adults in hot and humid areas were mainly centered on ‘very hot’ (17.9%); ‘hot’ (30.2%); ‘warm’ (11.6%); and ‘not too hot’ (38.7%). WSVs were centered on ‘slightly windy’ (10.3%); ‘not too windy’ (44.6%); ‘slightly windy’ (44.6%); and ‘little wind’ (11.6%). HSV was mainly concentrated on ‘slightly wet’ (13.3%) and ‘neither wet nor dry’ (69.4%).
(3)
There were significant gender differences in PET and RH among older respondents, but no significant gender differences were found in Va among older respondents.
Based on the results of the study, urban planners should set up special activity areas for the elderly in the design of urban outdoor spaces to create comfortable outdoor activity spaces for the elderly. In addition, our study has several limitations. First, we ignored the perception of meteorological factors in the winter and transitional seasons of the elderly in Guangzhou, leaving a gap in our perception of meteorological factors in the elderly for a year. Second, we did not analyze the effect of age on the perception of weather factors in the elderly. Finally, none of the respondents we selected for this study had chronic diseases or were taking medications, and we ignored the influence of this important factor of disease and medication in the older population. At the same time, however, these limitations provide direction for our subsequent work.

Author Contributions

Conceptualization, methodology, software, validation, formal analysis, investigation, writing—original draft preparation, C.L. and Q.F.; writing—review and editing, C.L. and Q.F.; visualization, C.L.; supervision, C.L., J.H. and R.Z, project administration, Q.F., J.H. and R.Z.; funding acquisition, Q.F and R.Z. All authors have read and agreed to the published version of the manuscript.

Funding

This paper is supported by the projects “ The research team for cross-disciolinary innovation and design at the intersection of art and technology” (Grant No. 22TDD06) and “Research on the Innovative Linkage Mechanism of “Smart City” and “Art City” in Guangdong, Hong Kong and Macao Great Bay Area “(Grant No. GD23XYS056) and “Project of Guangdong Higher Education Department An Initial Exploration and Construction of a Curatorial System for Graduation Design Teaching “ (Grant No. 6040321159).

Institution Review Board Statement

Not applicable.

Informed Consent Statement

Not applicable.

Data Availability Statement

Not applicable.

Conflicts of Interest

The authors declare no conflict of interest.

Appendix A. Outdoor Thermal Comfort Questionnaire

Part I Information for respondents
  Location:  Time:  Date:
  Gender: □Male □Female  Age:  Height: (m)  Weight: (kg)
  Hometown:  Length of time living in Guangzhou:
  1. Please check all of the subject’s current clothing (multiple choice)
  Upper body: □Sleeveless vest □T–shirt: (□Long-sleeved T–shirt/□Short-sleeved T–shirt) □Jacket
  Lower body: □Short trousers □Long trousers (□Thin □Thick) □Short skirt □Long skirt □Dress (□Long-sleeved dress/□Short-sleeved dress)
  Feet: □Socks □Shoes □Boots
  Others: □Hat □Mouthpieces
  If this subject wears other clothes, please describe specifically:
  2. What was the subject doing in the last 20 min (single choice)
  □High-intensity exercise  □Standing
  □Medium-intensity exercise  □Seated
  □Low-intensity exercise  □Reclining
Part II: Thermal perception
  1. Please describe your current thermal sensation:
  □Very cold  □Cold  □Cool  □Neutral  □Warm  □Hot  □Very hot
  2. Please describe your thermal comfort level:3. Please describe your acceptable level for current thermal environment
  □Uncomfortable□Just so-so□Comfortable□Unacceptable□Acceptable
  4. Please describe your current wind sensation:
  □Very small□Small□A little small□Neutral□A little windy□Windy□Very windy
  5. Please describe your wind comfort level:6. Please describe your acceptable level for current wind environment
  □Uncomfortable□Just so-so□Comfortable□Unacceptable□Acceptable
  7. Please describe your current humidity sensation:
  □Very dry□Dry□A little dry□Neutral□A little wet□Wet□Very wet
  8. Please describe your humidity comfort level:9. Please describe your acceptable level for current humidity environment
  □Uncomfortable□Just so-so□Comfortable□Unacceptable□Acceptable
  10. How would you prefer the following meteorological parameters to be?
  Temperature□Warmer□No change□Cooler
  Wind speed□Higher□No change□Lower
  Solar radiation□Stronger□No change□Weaker
  Relative humidity□Higher□No change□Lower

References

  1. Zhang, X.; Zhao, L.; Yao, L.; Zhong, X.; Ren, P. Investigating the micro-scale thermal effects of natural underlying surfaces on adjacent spaces in a subtropical zone with an optimized method. Build. Environ. 2022, 222, 109382. [Google Scholar] [CrossRef]
  2. Tan, Z.; Lau, K.K.-L.; Ng, E. Planning strategies for roadside tree planting and outdoor comfort enhancement in subtropical high-density urban areas. Build. Environ. 2017, 120, 93–109. [Google Scholar] [CrossRef]
  3. Tang, T.; Zhu, Y.; Zhou, X.; Guo, Z.; Mao, Y.; Jiang, H.; Fang, Z.; Zheng, Z.; Chen, X. Investigation of the effects of face masks on thermal comfort in Guangzhou, China. Build. Environ. 2022, 214, 108932. [Google Scholar] [CrossRef] [PubMed]
  4. Huang, B.; Hong, B.; Tian, Y.; Yuan, T.; Su, M. Outdoor thermal benchmarks and thermal safety for children: A study in China’s cold region. Sci. Total Environ. 2021, 787, 147603. [Google Scholar] [CrossRef]
  5. Sanusi, R.; Johnstone, D.; May, P.; Livesley, S.J. Microclimate benefits that different street tree species provide to sidewalk pedestrians relate to differences in Plant Area Index. Landsc. Urban Plan. 2017, 157, 502–511. [Google Scholar] [CrossRef]
  6. Abdallah, A.S.H.; Hussein, S.W.; Nayel, M. The impact of outdoor shading strategies on student thermal comfort in open spaces between education building. Sustain. Cities Soc. 2020, 58, 102124. [Google Scholar] [CrossRef]
  7. Shih, W.-M.; Lin, T.-P.; Tan, N.-X.; Liu, M.-H. Long-term perceptions of outdoor thermal environments in an elementary school in a hot-humid climate. Int. J. Biometeorol. 2017, 61, 1657–1666. [Google Scholar] [CrossRef]
  8. Li, J.; Han, X.; Zhang, X.; Wang, S. Spatiotemporal evolution of global population ageing from 1960 to 2017. BMC Public Health 2019, 19, 1–15. [Google Scholar] [CrossRef]
  9. Yang, X.; Fan, Y.; Xia, D.; Zou, Y.; Deng, Y. Elderly Residents’ Uses of and Preferences for Community Outdoor Spaces during Heat Periods. Sustainability 2023, 15, 11264. [Google Scholar] [CrossRef]
  10. Santamouris, M. Recent progress on urban overheating and heat island research. Integrated assessment of the energy, environmental, vulnerability and health impact. Synergies with the global climate change. Energy Build. 2020, 207, 109482. [Google Scholar] [CrossRef]
  11. Van Hoof, J.; Schellen, L.; Soebarto, V.; Wong, J.K.W.; Kazak, J.K. Ten questions concerning thermal comfort and ageing. Build. Environ. 2017, 120, 123–133. [Google Scholar] [CrossRef]
  12. Handbook, A. HVAC applications. In ASHRAE Handbook, Fundamentals; Ashrae: New York, NY, USA, 2007. [Google Scholar]
  13. Chen, R.; Yang, Q. Microclimate adaptability for outdoor recreation in humid and cold cities in winter–a case study of the elderly in Chengdu City. Landsc. Archit. 2018, 10, 16–20. [Google Scholar]
  14. Larriva, M.T.B.; Higueras, E. Health risk for older adults in Madrid, by outdoor thermal and acoustic comfort. Urban Clim. 2020, 34, 100724. [Google Scholar] [CrossRef]
  15. Yung, E.H.K.; Wang, S.; Chau, C.-K. Thermal perceptions of the elderly, use patterns and satisfaction with open space. Landsc. Urban Plan. 2019, 185, 44–60. [Google Scholar] [CrossRef]
  16. Yang, J.; Nam, I.; Sohn, J.-R. The influence of seasonal characteristics in elderly thermal comfort in Korea. Energy Build. 2016, 128, 583–591. [Google Scholar] [CrossRef]
  17. Chen, L.; Wen, Y.; Zhang, L.; Xiang, W.-N. Studies of thermal comfort and space use in an urban park square in cool and cold seasons in Shanghai. Build. Environ. 2015, 94, 644–653. [Google Scholar] [CrossRef]
  18. Jiao, Y.; Yu, H.; Wang, T.; An, Y.; Yu, Y. Thermal comfort and adaptation of the elderly in free-running environments in Shanghai, China. Build. Environ. 2017, 118, 259–272. [Google Scholar] [CrossRef]
  19. Jiao, Y.; Yu, H.; Yu, Y.; Wang, Z.; Wei, Q. Adaptive thermal comfort models for homes for older people in Shanghai, China. Energy Build. 2020, 215, 109918. [Google Scholar] [CrossRef]
  20. Ma, T.; Xiong, J.; Lian, Z. A human thermoregulation model for the Chinese elderly. J. Therm. Biol. 2017, 70, 2–14. [Google Scholar] [CrossRef]
  21. Lai, D.; Chen, B.; Liu, K. Quantification of the influence of thermal comfort and life patterns on outdoor space activities. In Building Simulation; Springer: Berlin/Heidelberg, Germany, 2020. [Google Scholar]
  22. Kumar, P.; Sharma, A. Study on importance, procedure, and scope of outdoor thermal comfort–A review. Sustain. Cities Soc. 2020, 61, 102297. [Google Scholar] [CrossRef]
  23. Potchter, O.; Cohen, P.; Lin, T.-P.; Matzarakis, A. Outdoor human thermal perception in various climates: A comprehensive review of approaches, methods and quantification. Sci. Total Environ. 2018, 631, 390–406. [Google Scholar] [CrossRef]
  24. Shao, T.; Jin, H. A field investigation on the winter thermal comfort of residents in rural houses at different latitudes of northeast severe cold regions, China. J. Build. Eng. 2020, 32, 101476. [Google Scholar] [CrossRef]
  25. Chen, X.; Xue, P.; Liu, L.; Gao, L.; Liu, J. Outdoor thermal comfort and adaptation in severe cold area: A longitudinal survey in Harbin, China. Build. Environ. 2018, 143, 548–560. [Google Scholar] [CrossRef]
  26. Norouziasas, A.; Ha, P.P.; Ahmadi, M.; Rijal, H.B. Evaluation of urban form influence on pedestrians’ wind comfort. Build. Environ. 2022, 224, 109522. [Google Scholar] [CrossRef]
  27. Lam, C.K.C.; Cui, S.; Liu, J.; Kong, X.; Ou, C.; Hang, J. Influence of acclimatization and short-term thermal history on outdoor thermal comfort in subtropical South China. Energy Build. 2021, 231, 110541. [Google Scholar] [CrossRef]
  28. Xu, M.; Hong, B.; Mi, J.; Yan, S. Outdoor thermal comfort in an urban park during winter in cold regions of China. Sustain. Cities Soc. 2018, 43, 208–220. [Google Scholar] [CrossRef]
  29. Alber-Wallerström, B.; Holmér, I. Efficiency of sweat evaporation in unacclimatized man working in a hot humid environment. Eur. J. Appl. Physiol. Occup. Physiol. 1985, 54, 480–487. [Google Scholar] [CrossRef]
  30. Du, C.; Li, B.; Liu, H.; Li, C. Effect of Air Humidit y on Human Acceptable Thermal Environments and Evaluation. Chin. J. 2020, 64, 311–324. [Google Scholar]
  31. Li, C.; Liu, H.; Li, B.; Sheng, A. Seasonal effect of humidity on human comfort in a hot summer/cold winter zone in China. Indoor Built Environ. 2019, 28, 264–277. [Google Scholar] [CrossRef]
  32. Lu, S.; Xia, H.; Wei, S.; Fang, K.; Qi, Y. Analysis of the differences in thermal comfort between locals and tourists and genders in semi-open spaces under natural ventilation on a tropical island. Energy Build. 2016, 129, 264–273. [Google Scholar] [CrossRef]
  33. Ng, E.; Cheng, V. Urban human thermal comfort in hot and humid Hong Kong. Energy Build. 2012, 55, 51–65. [Google Scholar] [CrossRef]
  34. Fang, Z.; Xu, X.; Zhou, X.; Deng, S.; Wu, H.; Liu, J.; Lin, Z. Investigation into the thermal comfort of university students conducting outdoor training. Build. Environ. 2019, 149, 26–38. [Google Scholar] [CrossRef]
  35. Zheng, Z.; Dai, K.; Zhou, X.; Liu, J.; Liu, W.; Lu, J.; Fang, Z. Field investigation of thermal comfort with face masks in outdoor spaces in South China: A case study. Urban Clim. 2023, 51, 101632. [Google Scholar] [CrossRef]
  36. Zhao, J.; Zhu, N.; Lu, S.L. Productivity model in hot and humid environment based on heat tolerance time analysis. Build. Environ. 2009, 44, 2202–2207. [Google Scholar] [CrossRef]
  37. Zheng, G.; Zhu, N.; Tian, Z.; Chen, Y.; Sun, B. Application of a trapezoidal fuzzy AHP method for work safety evaluation and early warning rating of hot and humid environments. Saf. Sci. 2012, 50, 228–239. [Google Scholar] [CrossRef]
  38. Piver, W.T.; Ando, M.; Ye, F.; Portier, C.J. Temperature and air pollution as risk factors for heat stroke in Tokyo, July and August 1980–1995. Environ. Health Perspect. 1999, 107, 911–916. [Google Scholar] [CrossRef]
  39. Tang, T.; Zhang, Y.; Zheng, Z.; Zhou, X.; Fang, Z.; Liu, W. Detailed thermal indicators analysis based on outdoor thermal comfort indices in construction sites in South China. Build. Environ. 2021, 205, 108191. [Google Scholar] [CrossRef]
  40. Peel, M.C.; Finlayson, B.L.; McMahon, T.A. Updated world map of the Köppen-Geiger climate classification. Hydrol. Earth Syst. Sci. 2007, 11, 1633–1644. [Google Scholar] [CrossRef]
  41. Xia, D.; Zhong, Z.; Huang, Y.; Zou, Y.; Lou, S.; Zhan, Q.; Guo, J.; Yang, J.; Guo, T. Impact of coupled heat and moisture transfer on indoor comfort and energy demand for residential buildings in hot-humid regions. Energy Build. 2023, 288, 113029. [Google Scholar] [CrossRef]
  42. Fang, Z.; Feng, X.; Xu, X.; Zhou, X.; Lin, Z.; Ji, Y. Investigation into outdoor thermal comfort conditions by different seasonal field surveys in China, Guangzhou. Int. J. Biometeorol. 2019, 63, 1357–1368. [Google Scholar] [CrossRef]
  43. ISO 7726; Ergonomics of the Thermal Environment—Instruments for Measuring Physical Quantities. ISO: Geneva, Switzerland, 1998; pp. 1–56.
  44. Alfano, F.R.D.; Dell’Isola, M.; Ficco, G.; Palella, B.I.; Riccio, G. On the measurement of the mean radiant temperature by means of globes: An experimental investigation under black enclosure conditions. Build. Environ. 2021, 193, 107655. [Google Scholar] [CrossRef]
  45. Manavvi, S.; Rajasekar, E. Estimating outdoor mean radiant temperature in a humid subtropical climate. Build. Environ. 2020, 171, 106658. [Google Scholar] [CrossRef]
  46. Tan, C.L.; Wong, N.H.; Jusuf, S.K. Outdoor mean radiant temperature estimation in the tropical urban environment. Build. Environ. 2013, 64, 118–129. [Google Scholar] [CrossRef]
  47. Alfano, F.R.D.; Ficco, G.; Frattolillo, A.; Palella, B.I.; Riccio, G. Mean Radiant Temperature Measurements through Small Black Globes under Forced Convection Conditions. Atmosphere 2021, 12, 621. [Google Scholar] [CrossRef]
  48. Thorsson, S.; Lindberg, F.; Eliasson, I.; Holmer, B. Different methods for estimating the mean radiant temperature in an outdoor urban setting. Int. J. Climatol. 2007, 27, 1983–1993. [Google Scholar] [CrossRef]
  49. China National Bureau of Statistics 2021. Available online: https://www.stats.gov.cn (accessed on 26 August 2023).
  50. ISO 7730:2006; Ergonomics of the Thermal Environment: Analytical Determination and Interpretation of Thermal Comfort Using Calculation of the PMV and PPD Indices and Local Thermal Comfort Criteria = Ergonomie des Ambiances Thermiques: Détermination Analytique et Interp. ISO: Geneva, Switzerland, 2006.
  51. ISO 9920:2007; Ergonomics of the Thermal Environment—Estimation of Thermal Insulation and Water Vapour Resistance of A Clothing Ensemble (Corrected Version 2008-11-01). ISO: Geneva, Switzerland, 2009.
  52. Li, X.; Li, X.; Tang, N.; Chen, S.; Deng, Y.; Gan, D. Summer Outdoor Thermal Perception for the Elderly in a Comprehensive Park of Changsha, China. Atmosphere 2022, 13, 1853. [Google Scholar] [CrossRef]
  53. Ma, X.; Tian, Y.; Du, M.; Hong, B.; Lin, B. How to design comfortable open spaces for the elderly? Implications of their thermal perceptions in an urban park. Sci. Total Environ. 2021, 768, 144985. [Google Scholar] [CrossRef]
  54. Yao, F.; Fang, H.; Han, J.; Zhang, Y. Study on the outdoor thermal comfort evaluation of the elderly in the Tibetan plateau. Sustain. Cities Soc. 2022, 77, 103582. [Google Scholar] [CrossRef]
  55. Höppe, P.R. Heat balance modelling. Experientia 1993, 49, 741–746. [Google Scholar] [CrossRef]
  56. Höppe, P. The physiological equivalent temperature–a universal index for the biometeorological assessment of the thermal environment. Int. J. Biometeorol. 1999, 43, 71–75. [Google Scholar] [CrossRef]
  57. Fang, Z.; Feng, X.; Liu, J.; Lin, Z.; Mak, C.M.; Niu, J.; Tse, K.-T.; Xu, X. Investigation into the differences among several outdoor thermal comfort indices against field survey in subtropics. Sustain. Cities Soc. 2019, 44, 676–690. [Google Scholar] [CrossRef]
  58. Othman, N.E.; Zaki, S.A.; Rijal, H.B.; Ahmad, N.H.; Abd Razak, A. Field study of pedestrians’ comfort temperatures under outdoor and semi-outdoor conditions in Malaysian university campuses. Int. J. Biometeorol. 2021, 65, 453–477. [Google Scholar] [CrossRef]
  59. Aji, B.; Wijayanti, S.P.M.; Masfiah, S.; Anandari, D.; Chamchan, C. Physical Functioning Among Community-Dwelling Elderly in Rural Indonesia. Community Health Equity Res. Policy 2022, 42, 375–380. [Google Scholar] [CrossRef] [PubMed]
  60. Meade, R.D.; Akerman, A.P.; Notley, S.R.; McGinn, R.; Poirier, P.; Gosselin, P.; Kenny, G.P. Physiological factors characterizing heat-vulnerable older adults: A narrative review. Environ. Int. 2020, 144, 105909. [Google Scholar] [CrossRef] [PubMed]
  61. Blatteis, C.M. Age-dependent changes in temperature regulation–a mini review. Gerontology 2012, 58, 289–295. [Google Scholar] [CrossRef]
  62. Zhen, M.; Chen, Z.; Zheng, R. Outdoor Wind Comfort and Adaptation in a Cold Region. Buildings 2022, 12, 476. [Google Scholar] [CrossRef]
  63. Du, Y.; Mak, C.M.; Kwok, K.; Tse, K.-T.; Lee, T.-C.; Ai, Z.; Liu, J.; Niu, J. New criteria for assessing low wind environment at pedestrian level in Hong Kong. Build. Environ. 2017, 123, 23–36. [Google Scholar] [CrossRef]
  64. Tutuncu, Z.; Kavanaugh, A. Rheumatic disease in the elderly: Rheumatoid arthritis. Rheum. Dis. Clin. North Am. 2007, 33, 57–70. [Google Scholar] [CrossRef]
  65. Lam, C.K.C.; Gao, Y.; Yang, H.; Chen, T.; Zhang, Y.; Ou, C.; Hang, J. Interactive effect between long-term and short-term thermal history on outdoor thermal comfort: Comparison between Guangzhou, Zhuhai and Melbourne. Sci. Total Environ. 2021, 760, 144141. [Google Scholar] [CrossRef]
Figure 1. Monthly ranges and averages of daily outdoor relative humidity and air temperature from 2014 to 2018.
Atmosphere 14 01570 g001
Figure 2. Study area and movement paths.
Atmosphere 14 01570 g002
Figure 3. Measured outdoor thermal data: (a) Air temperature, (b) Mean radiation temperature, (c) Relative humidity, (d) Wind speed.
Atmosphere 14 01570 g003
Figure 4. Subjective perception and comfort votes: (a) Subjective perception of each weather factor votes, (b) Comfort votes.
Atmosphere 14 01570 g004
Figure 5. Meteorological parameter votes.
Atmosphere 14 01570 g005
Figure 6. Correlation between PET and MTSV: (a) Male respondent; (b) Female respondent; (c) Total respondents.
Atmosphere 14 01570 g006
Figure 7. Correlation between the thermal unacceptable rate and PET: (a) Male respondents; (b) Female respondents; (c) Total respondents.
Atmosphere 14 01570 g007
Figure 8. Correlation between wind speed and MWSV: (a) Male respondent; (b) Female respondent; (c) Total respondents.
Atmosphere 14 01570 g008
Figure 9. Correlation between the wind speed unacceptable rate and wind speed: (a) Male respondents; (b) Female respondents; (c) Total respondents.
Atmosphere 14 01570 g009
Figure 10. Correlation between relative humidity and MHSV: (a) Male respondent; (b) Female respondent; (c) Total respondents.
Atmosphere 14 01570 g010
Figure 11. Correlation between the humidity unacceptable rate and relative humidity: (a) Male respondents; (b) Female respondents; (c) Total respondents.
Atmosphere 14 01570 g011
Table 1. Instruments and technical parameters.
InstrumentsParameterRangeAccuracySampling Rate
SSDZY-1Globe temperature−20–80 °C±0.3 °C60 s
HOBO ProAir temperature−40–70 °C±0.02 °C
Relative humidity0–100%±2.5%
Kestrel 5500Wind speed0–5 m/s±0.05 m/s
Table 2. Detailed information on subjects during the trial.
DatesNumberClothing Insulation (clo) Mean ± SDMetabolic Rate (W/m2) Mean ± SDPhysiological Parameter
Height (cm) Mean ± SDWeight (kg) Mean ± SDAge Mean ± SD
17 August 2023870.40 ± 0.1093.4 ± 22.6163.4 ± 4.3562.4 ± 4.7569 ± 2.61
20 August 2023750.36 ± 0.0485.3 ± 31.4162.8 ± 3.6459.4 ± 3.7167 ± 1.67
22 August 2023920.40 ± 0.0597.6 ± 25.3159.7 ± 2.6859.8 ± 4.3971 ± 3.26
24 August 2023850.39 ± 0.1090.5 ± 27.6161.2 ± 2.7658.7 ± 4.2372 ± 2.87
25 August 2023790.32 ± 0.1187.5 ± 20.2164.5 ± 3.4461.3 ± 4.9467 ± 1.86
26 August 2023990.41 ± 0.0874.9 ± 37.3161.7 ± 3.3759.3 ± 3.7469 ± 2.21
SD—standard deviation.
Table 3. Comparison of NPET in different regions.
Climatic ZoneCityResearch AreaIndicatorsCrowdNPET
Hot summer and warm winterGuangzhou, China (this study)CommunitiesPETElderly30.4 °C
Hot summer and cold winterChangsha, China [52]Urban parkPETElderly24.5 °C
ColdXi’an, China [53]Urban parkPETElderly20.3 °C
Severe coldLhasa, China [54]Urban Outdoor SpacePETElderly20.6 °C
Disclaimer/Publisher’s Note: The statements, opinions and data contained in all publications are solely those of the individual author(s) and contributor(s) and not of MDPI and/or the editor(s). MDPI and/or the editor(s) disclaim responsibility for any injury to people or property resulting from any ideas, methods, instructions or products referred to in the content.

