
Analysis of the Actual Usage and Emission Reduction Potential of Electric Heavy-Duty Trucks: A Case Study of a Steel Plant
Abstract
:1. Introduction
2. Data and Method
2.1. Electric Heavy-Duty Trucks and Charging/Battery Swap Infrastructures in the Steel Plant
2.2. Vehicle Operation Scenarios
2.3. Data Description and Pre-Processing
2.4. Analysis Methods of Emission Reduction Potential
2.4.1. Calculation of Atmospheric Pollutant Emissions
2.4.2. Calculation of CO2 Emissions
3. Results and Discussion
3.1. Charging Behavior of Electric Heavy-Duty Trucks
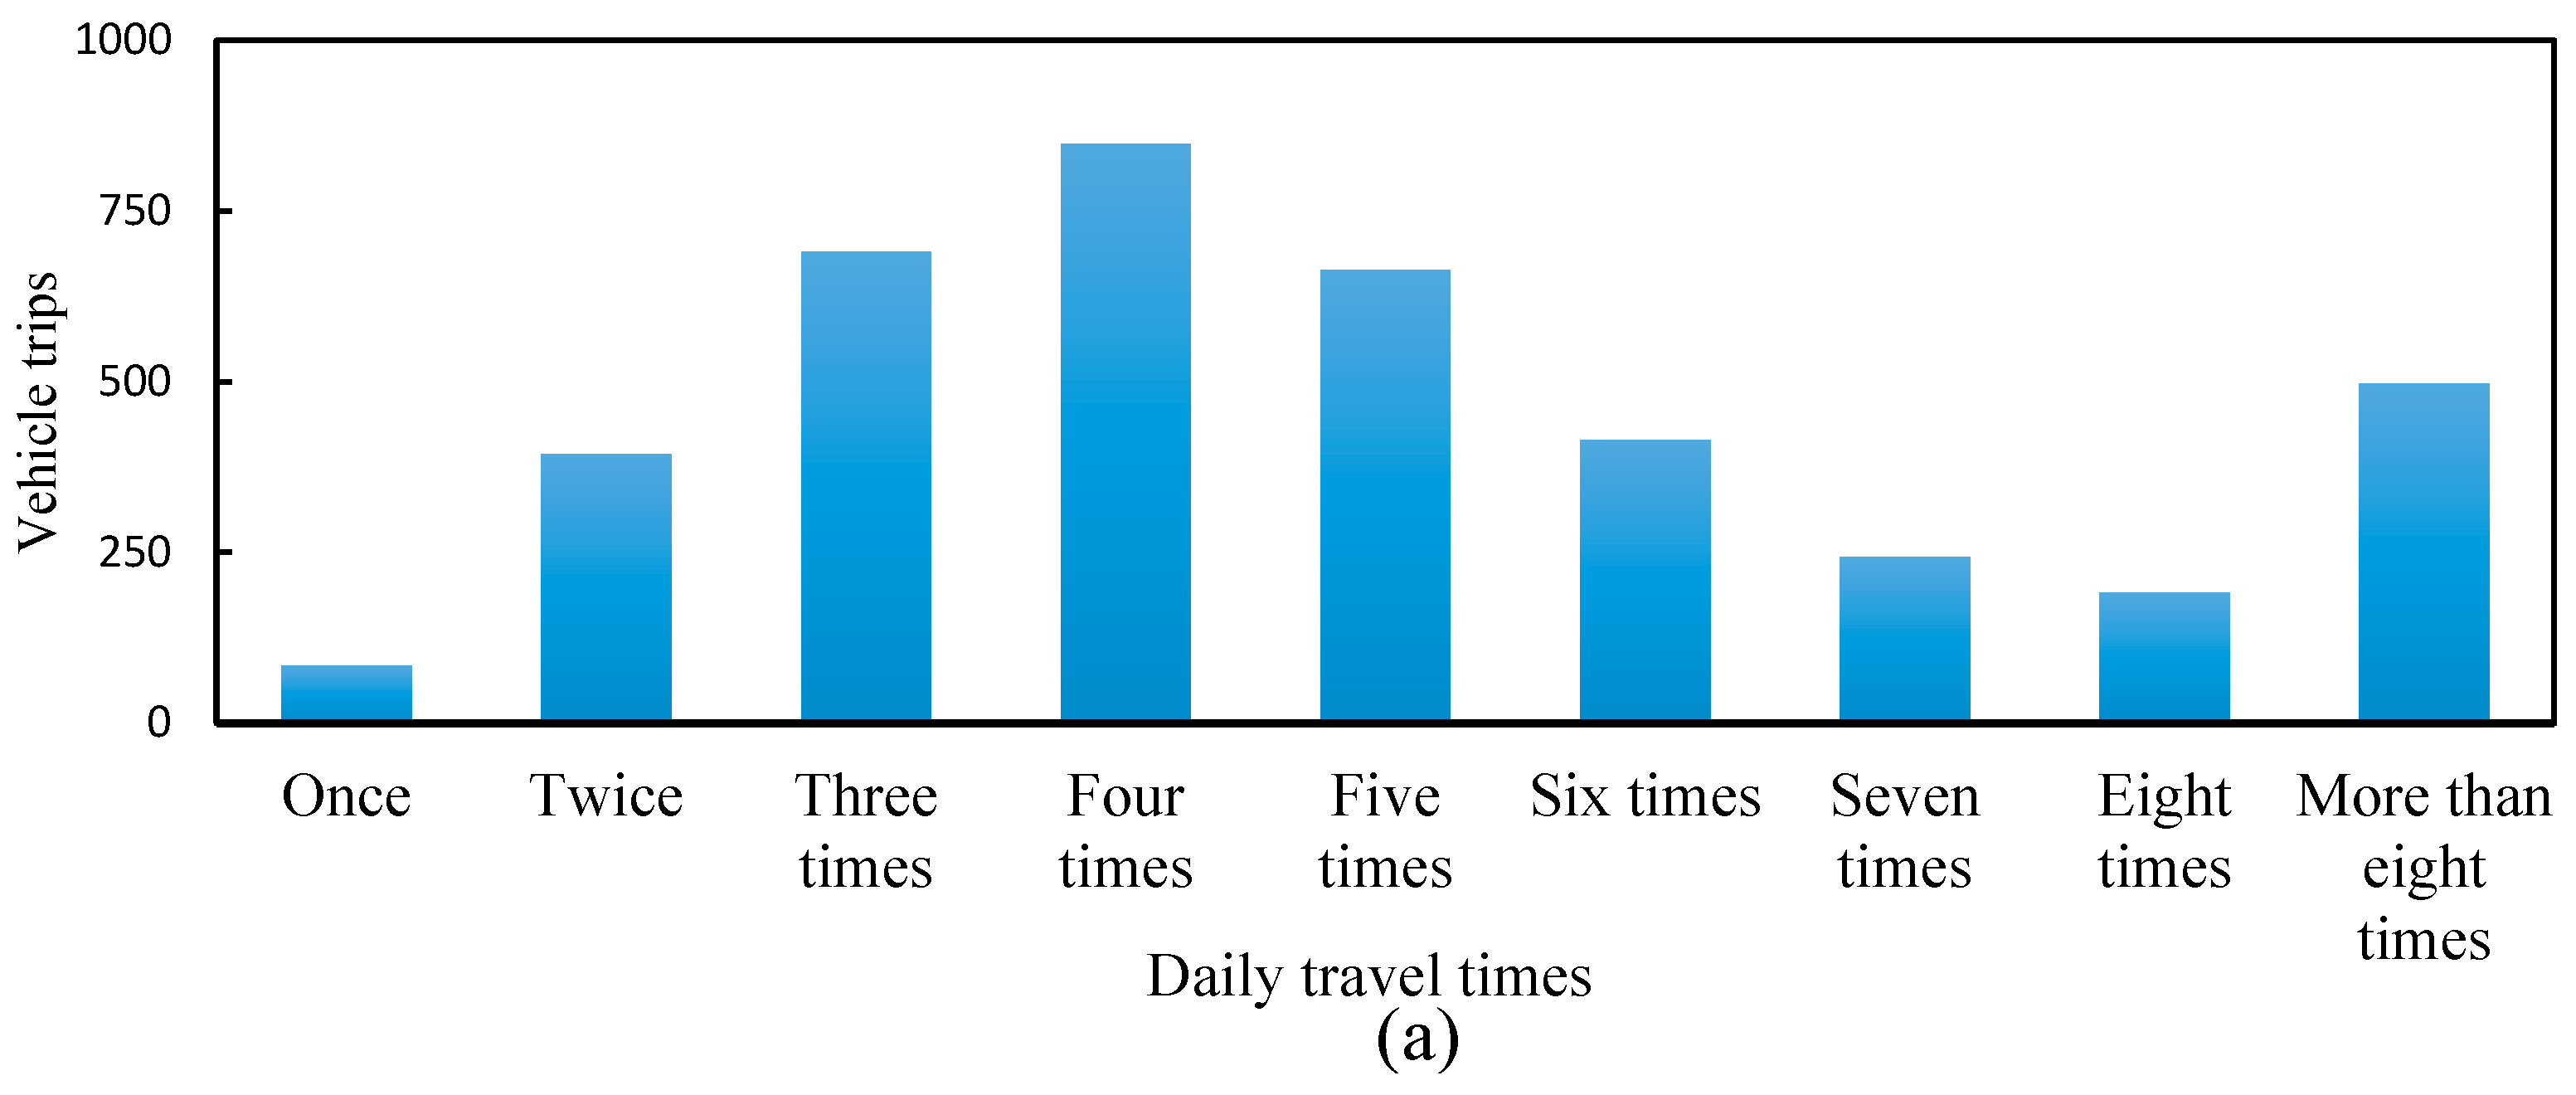
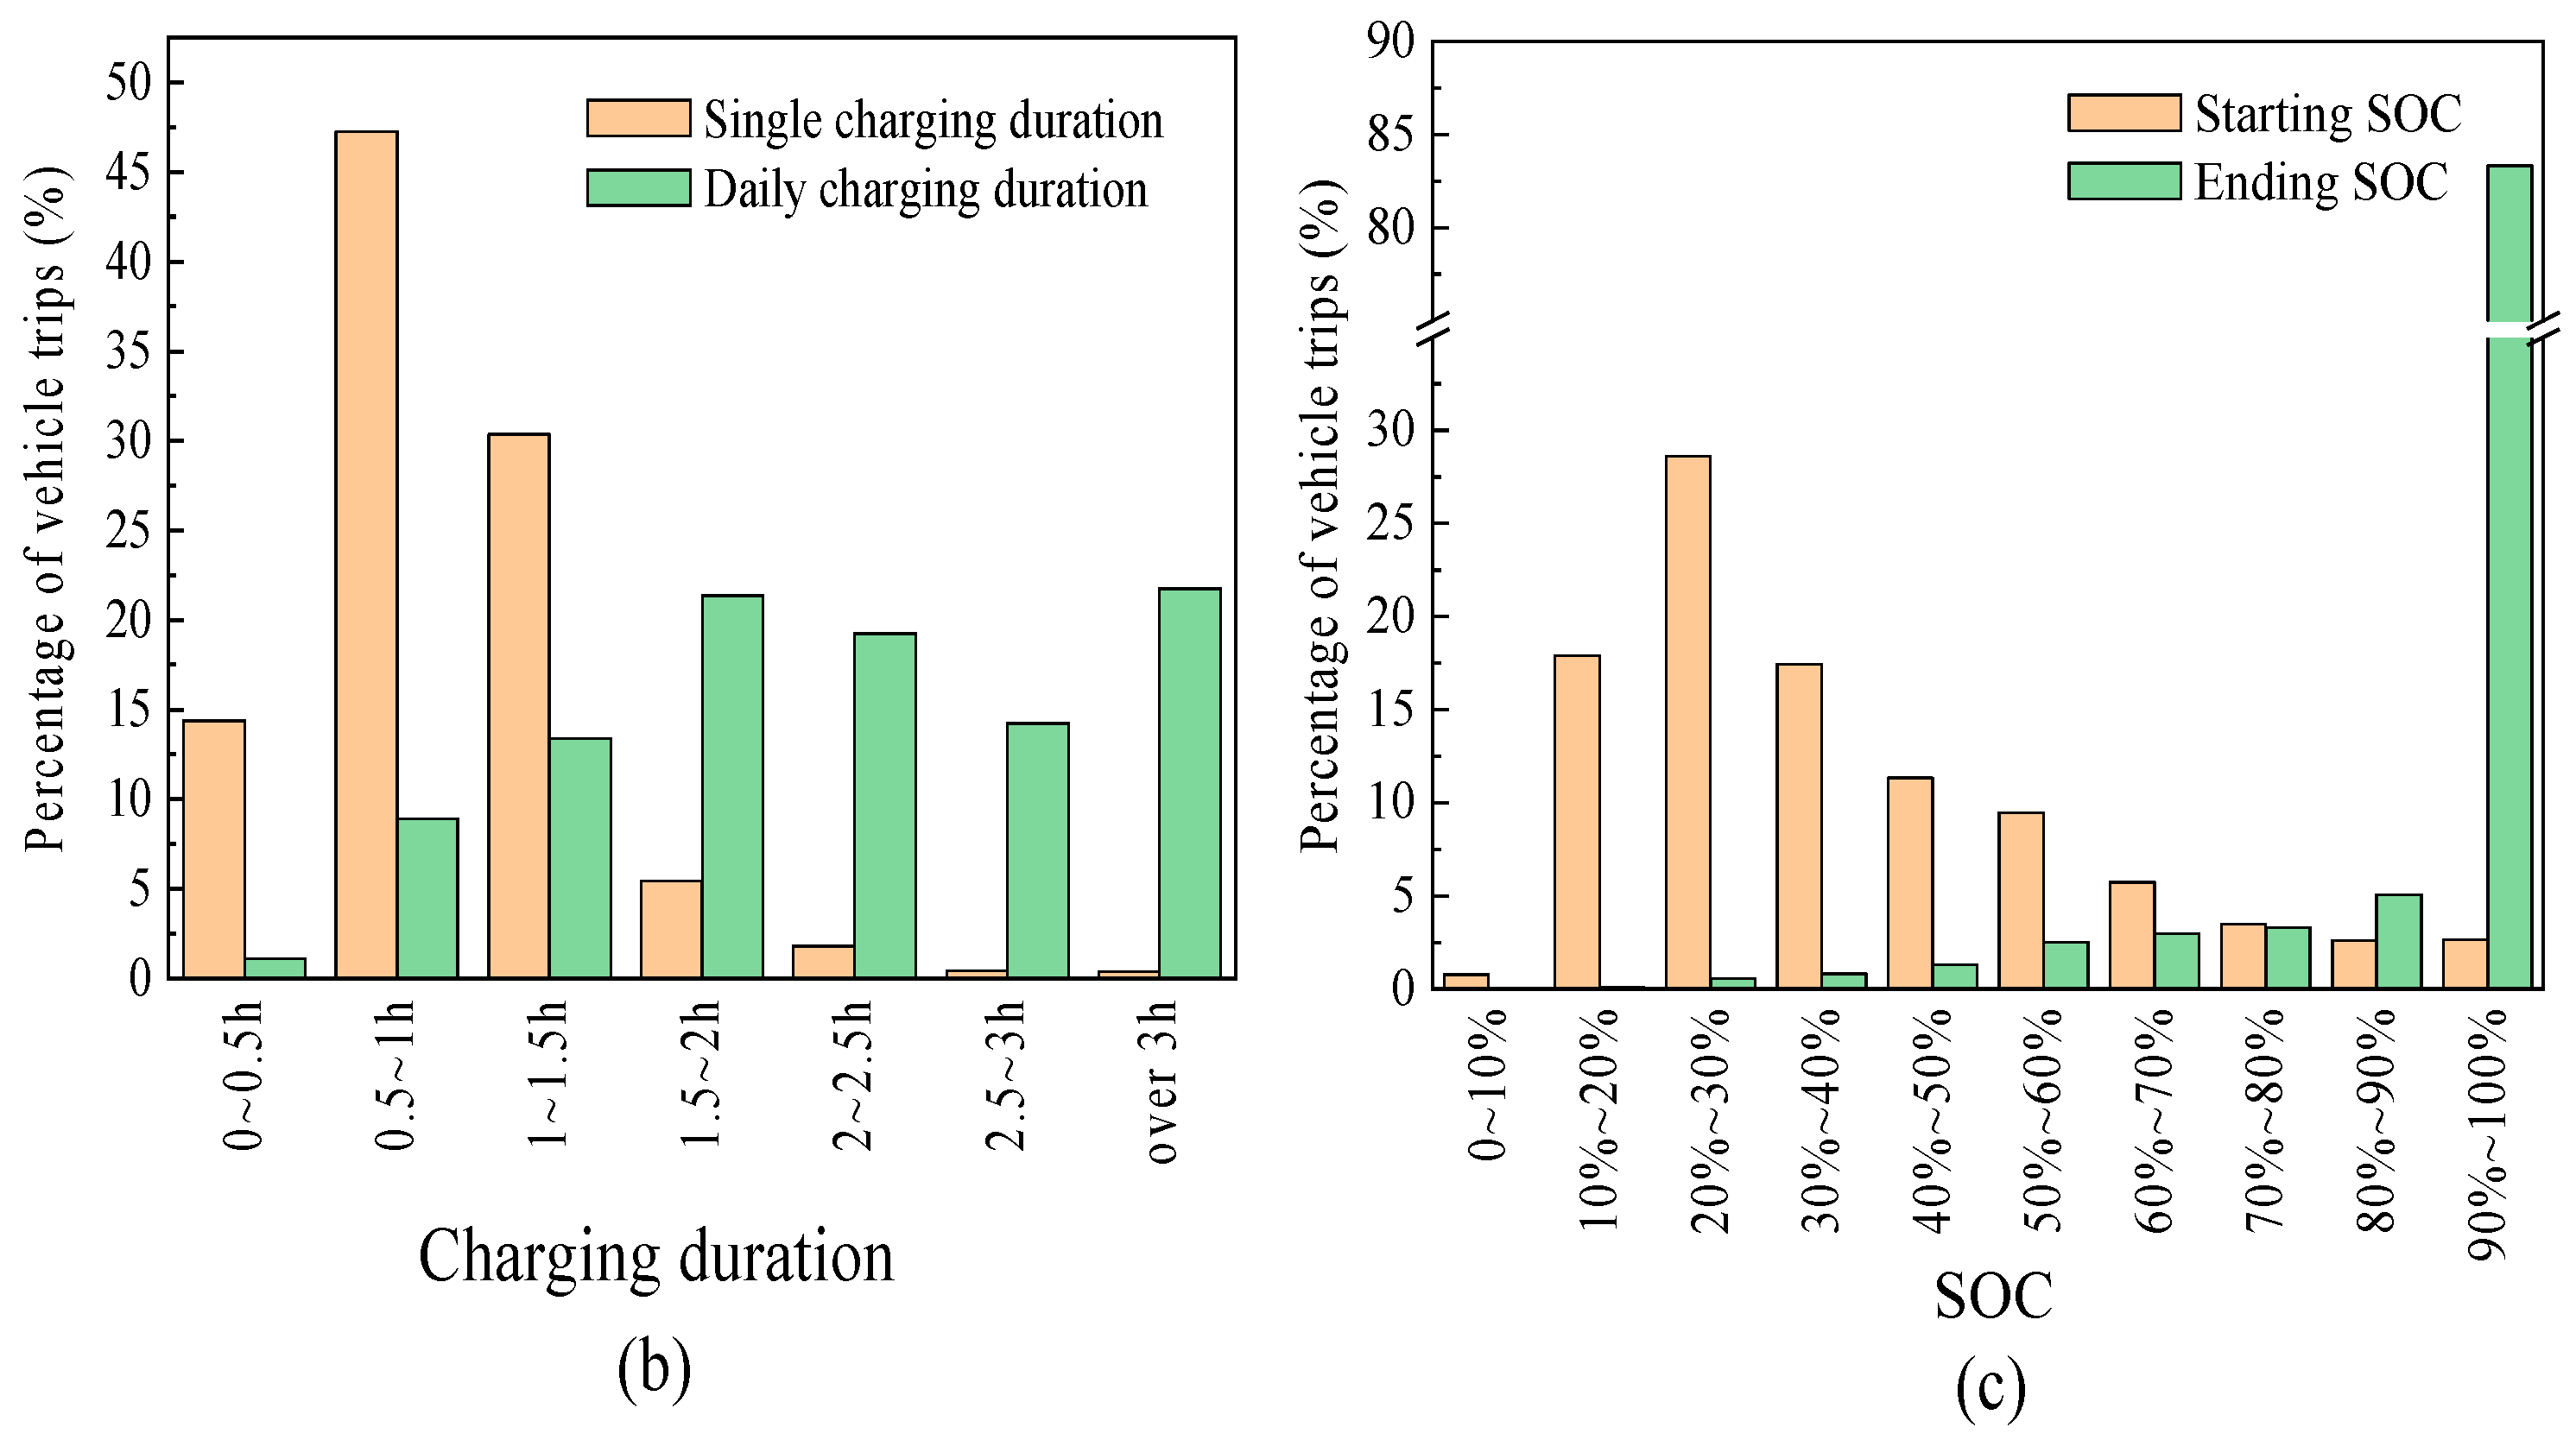
3.1.1. Daily Travel Times and Charging Duration/SOC
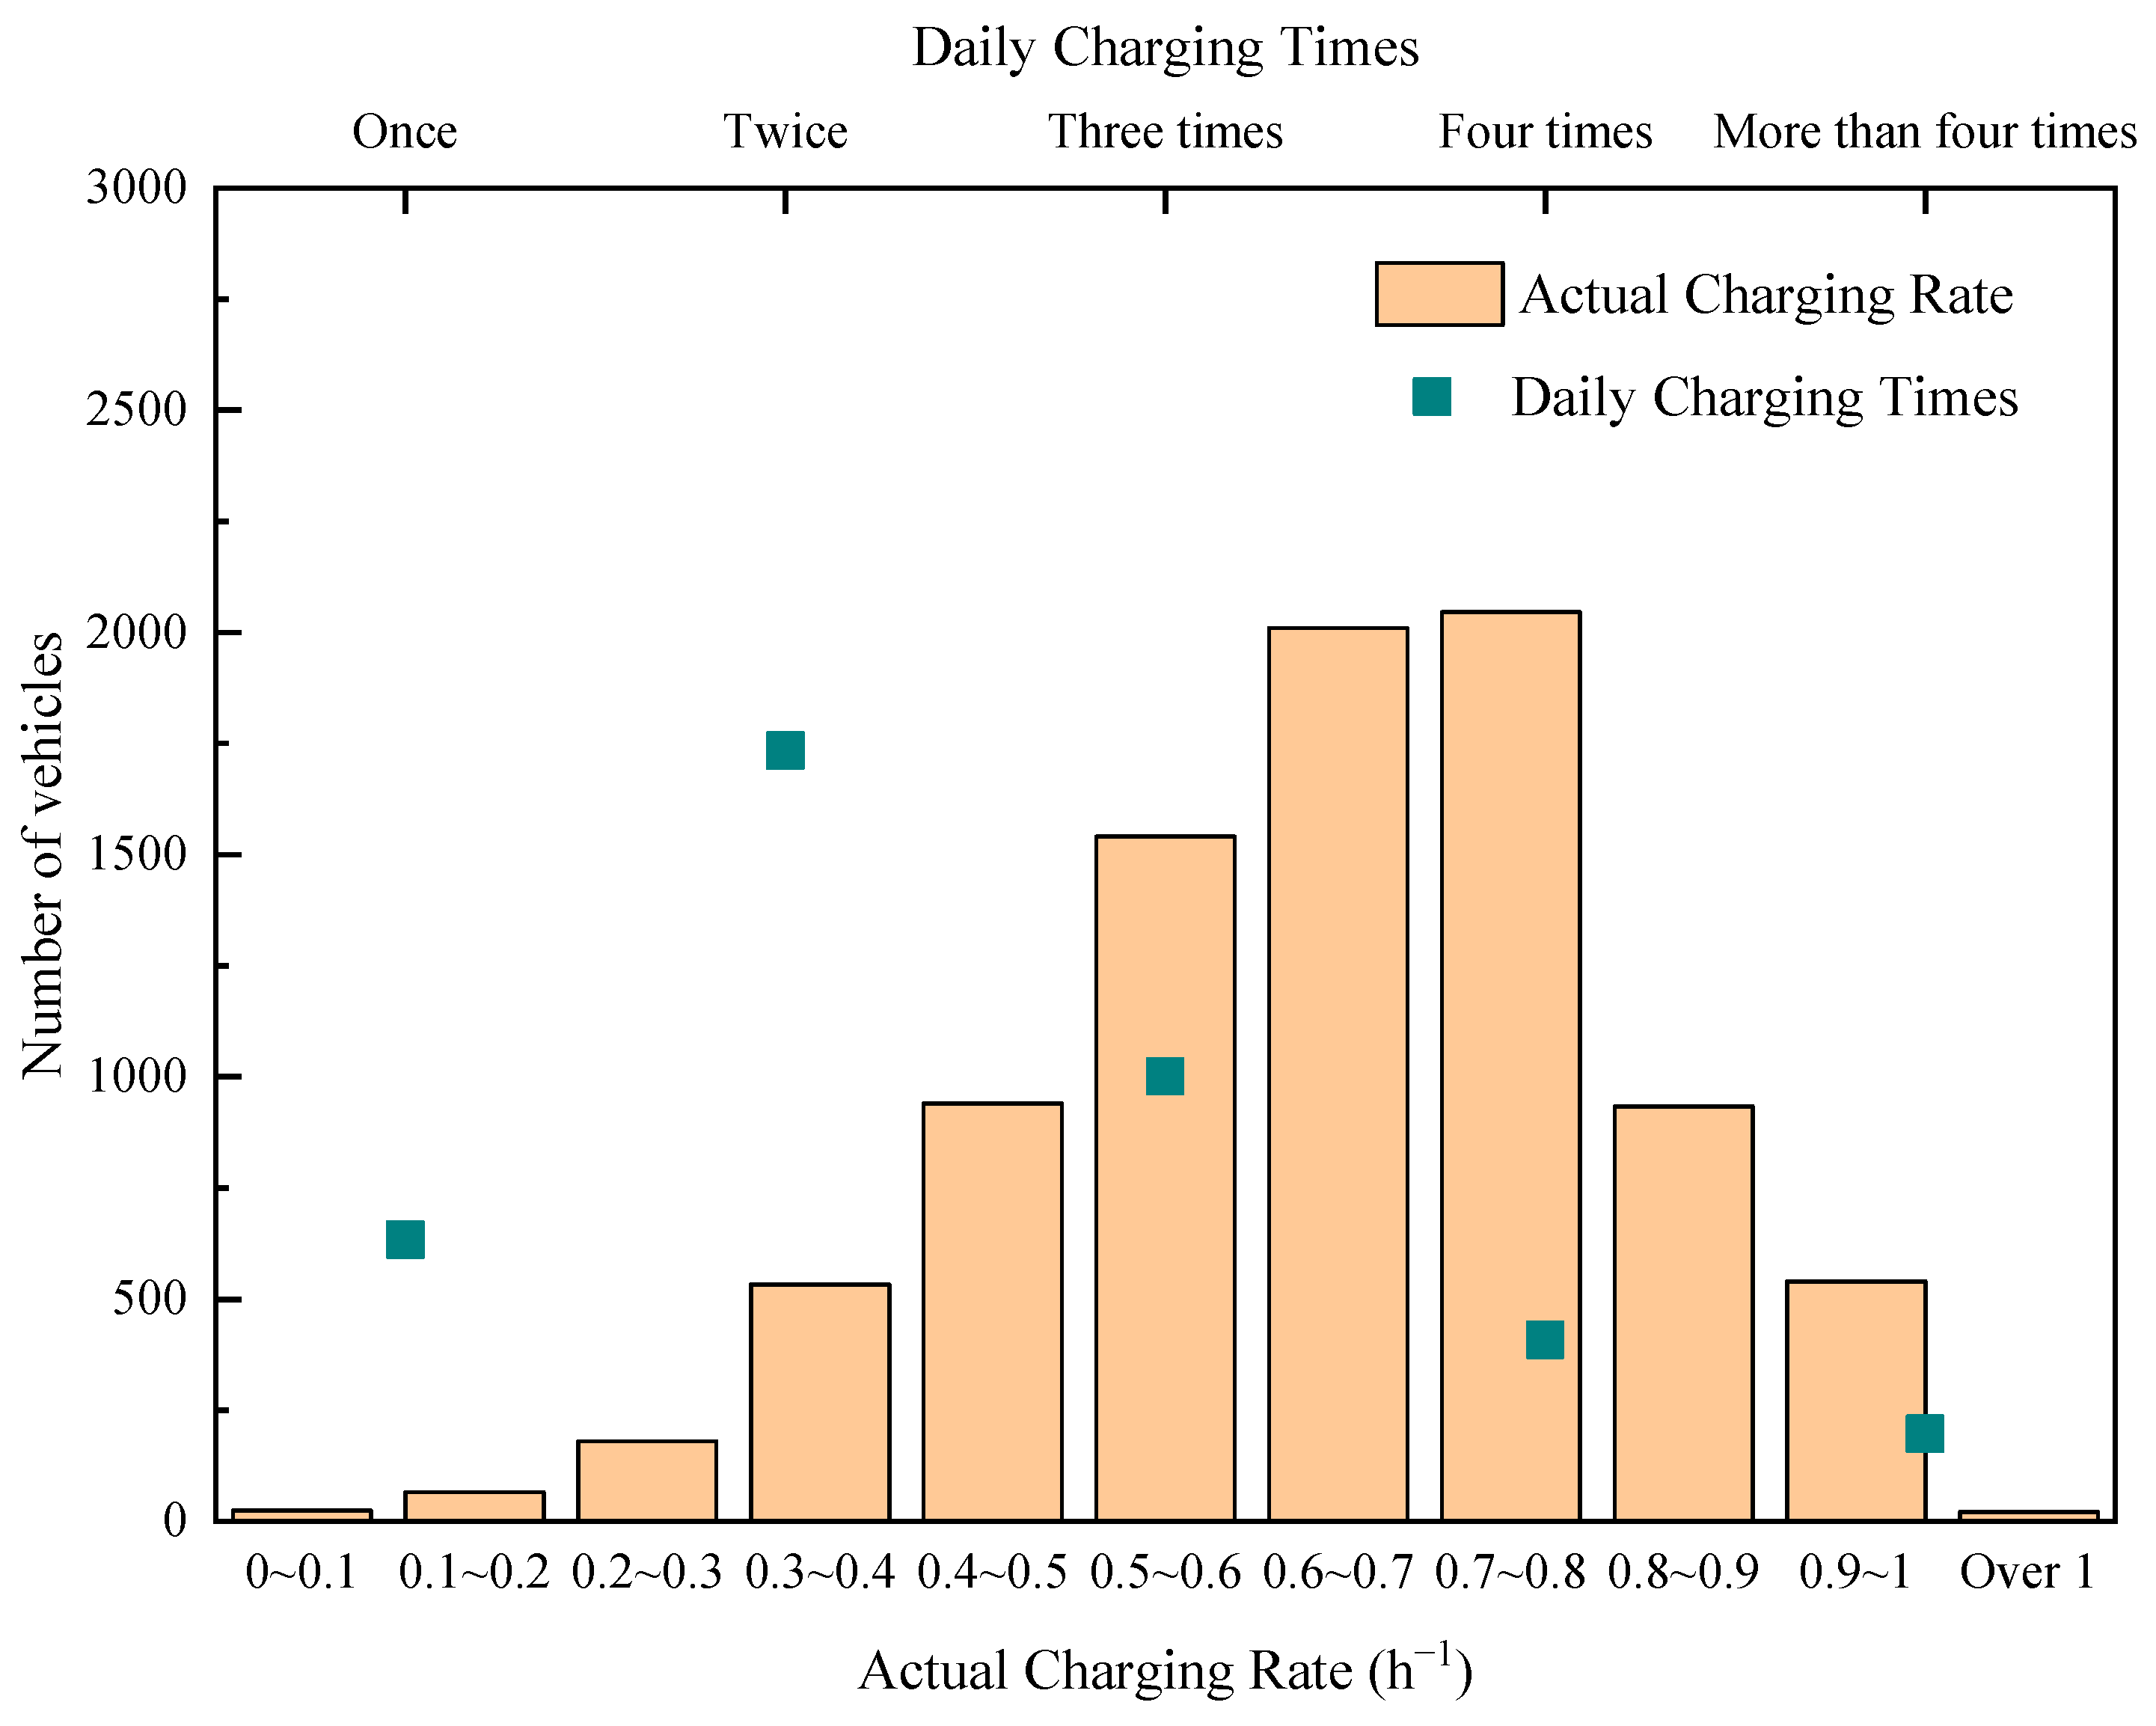
3.1.2. Charging Times and Charging Rates
3.1.3. Starting Times for Charging
3.2. Comparison of Operating Characteristics between Electric Heavy-Duty Trucks and Diesel Heavy-Duty Trucks
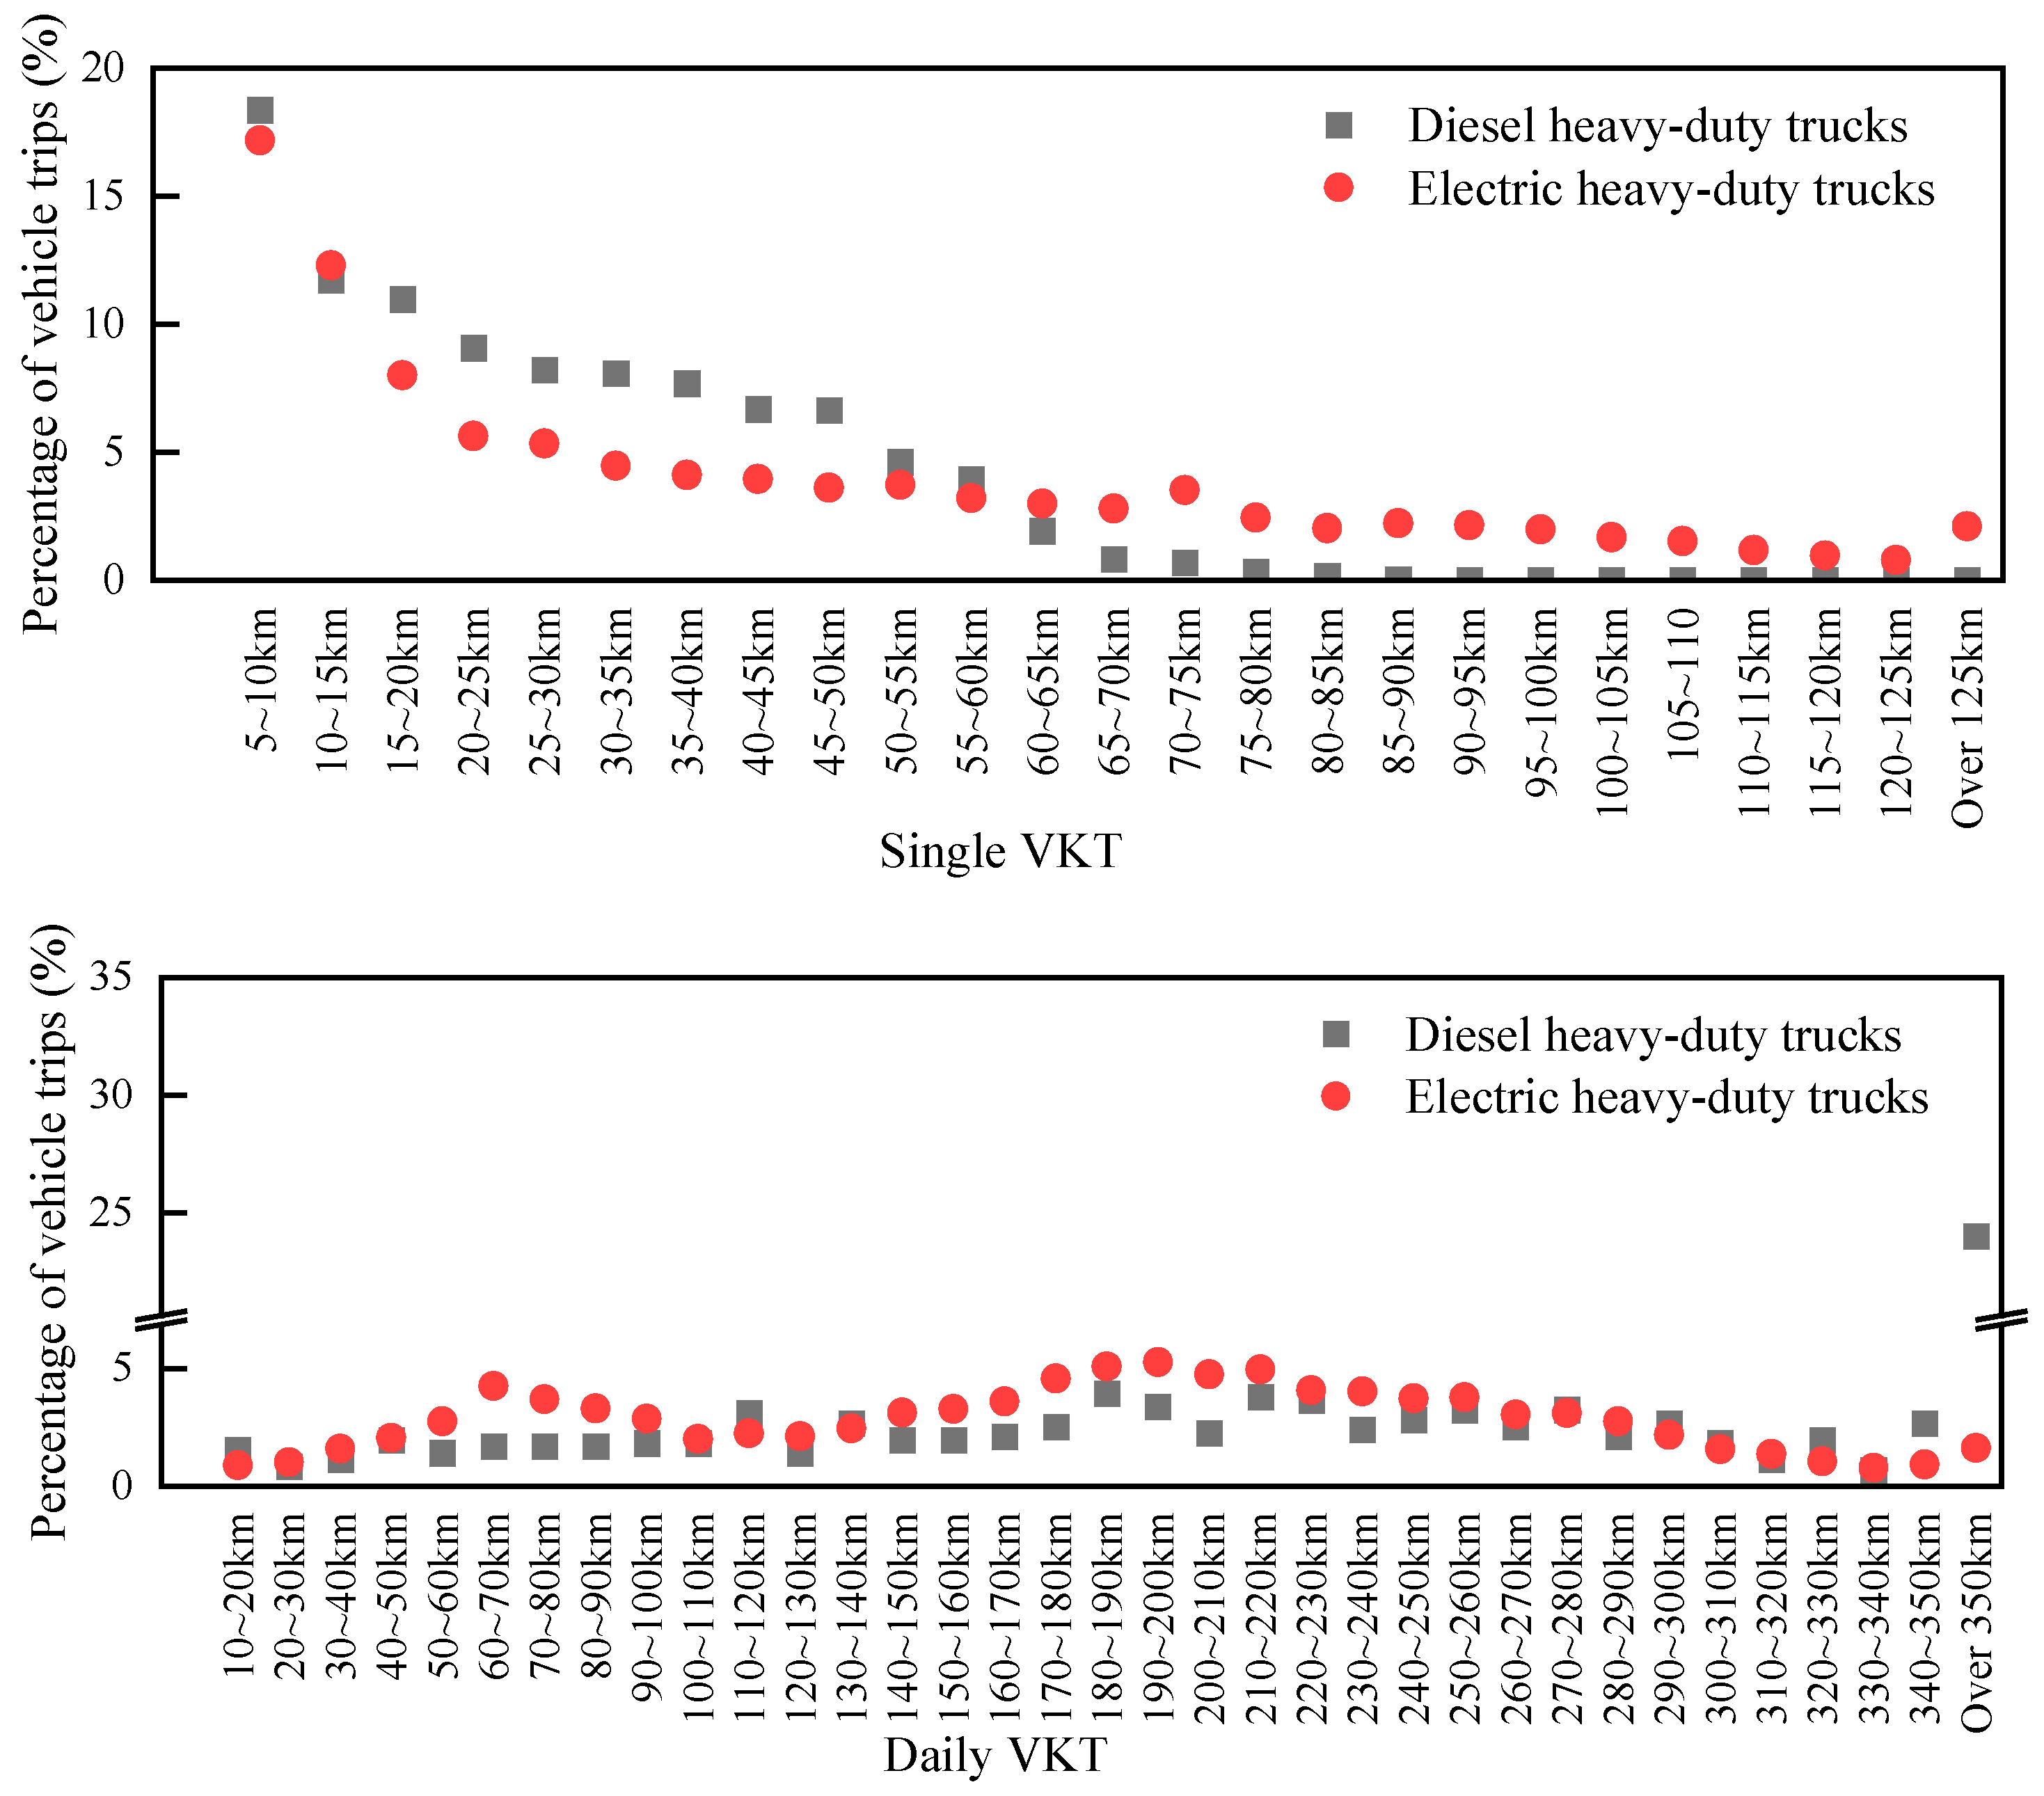
3.2.1. VKT
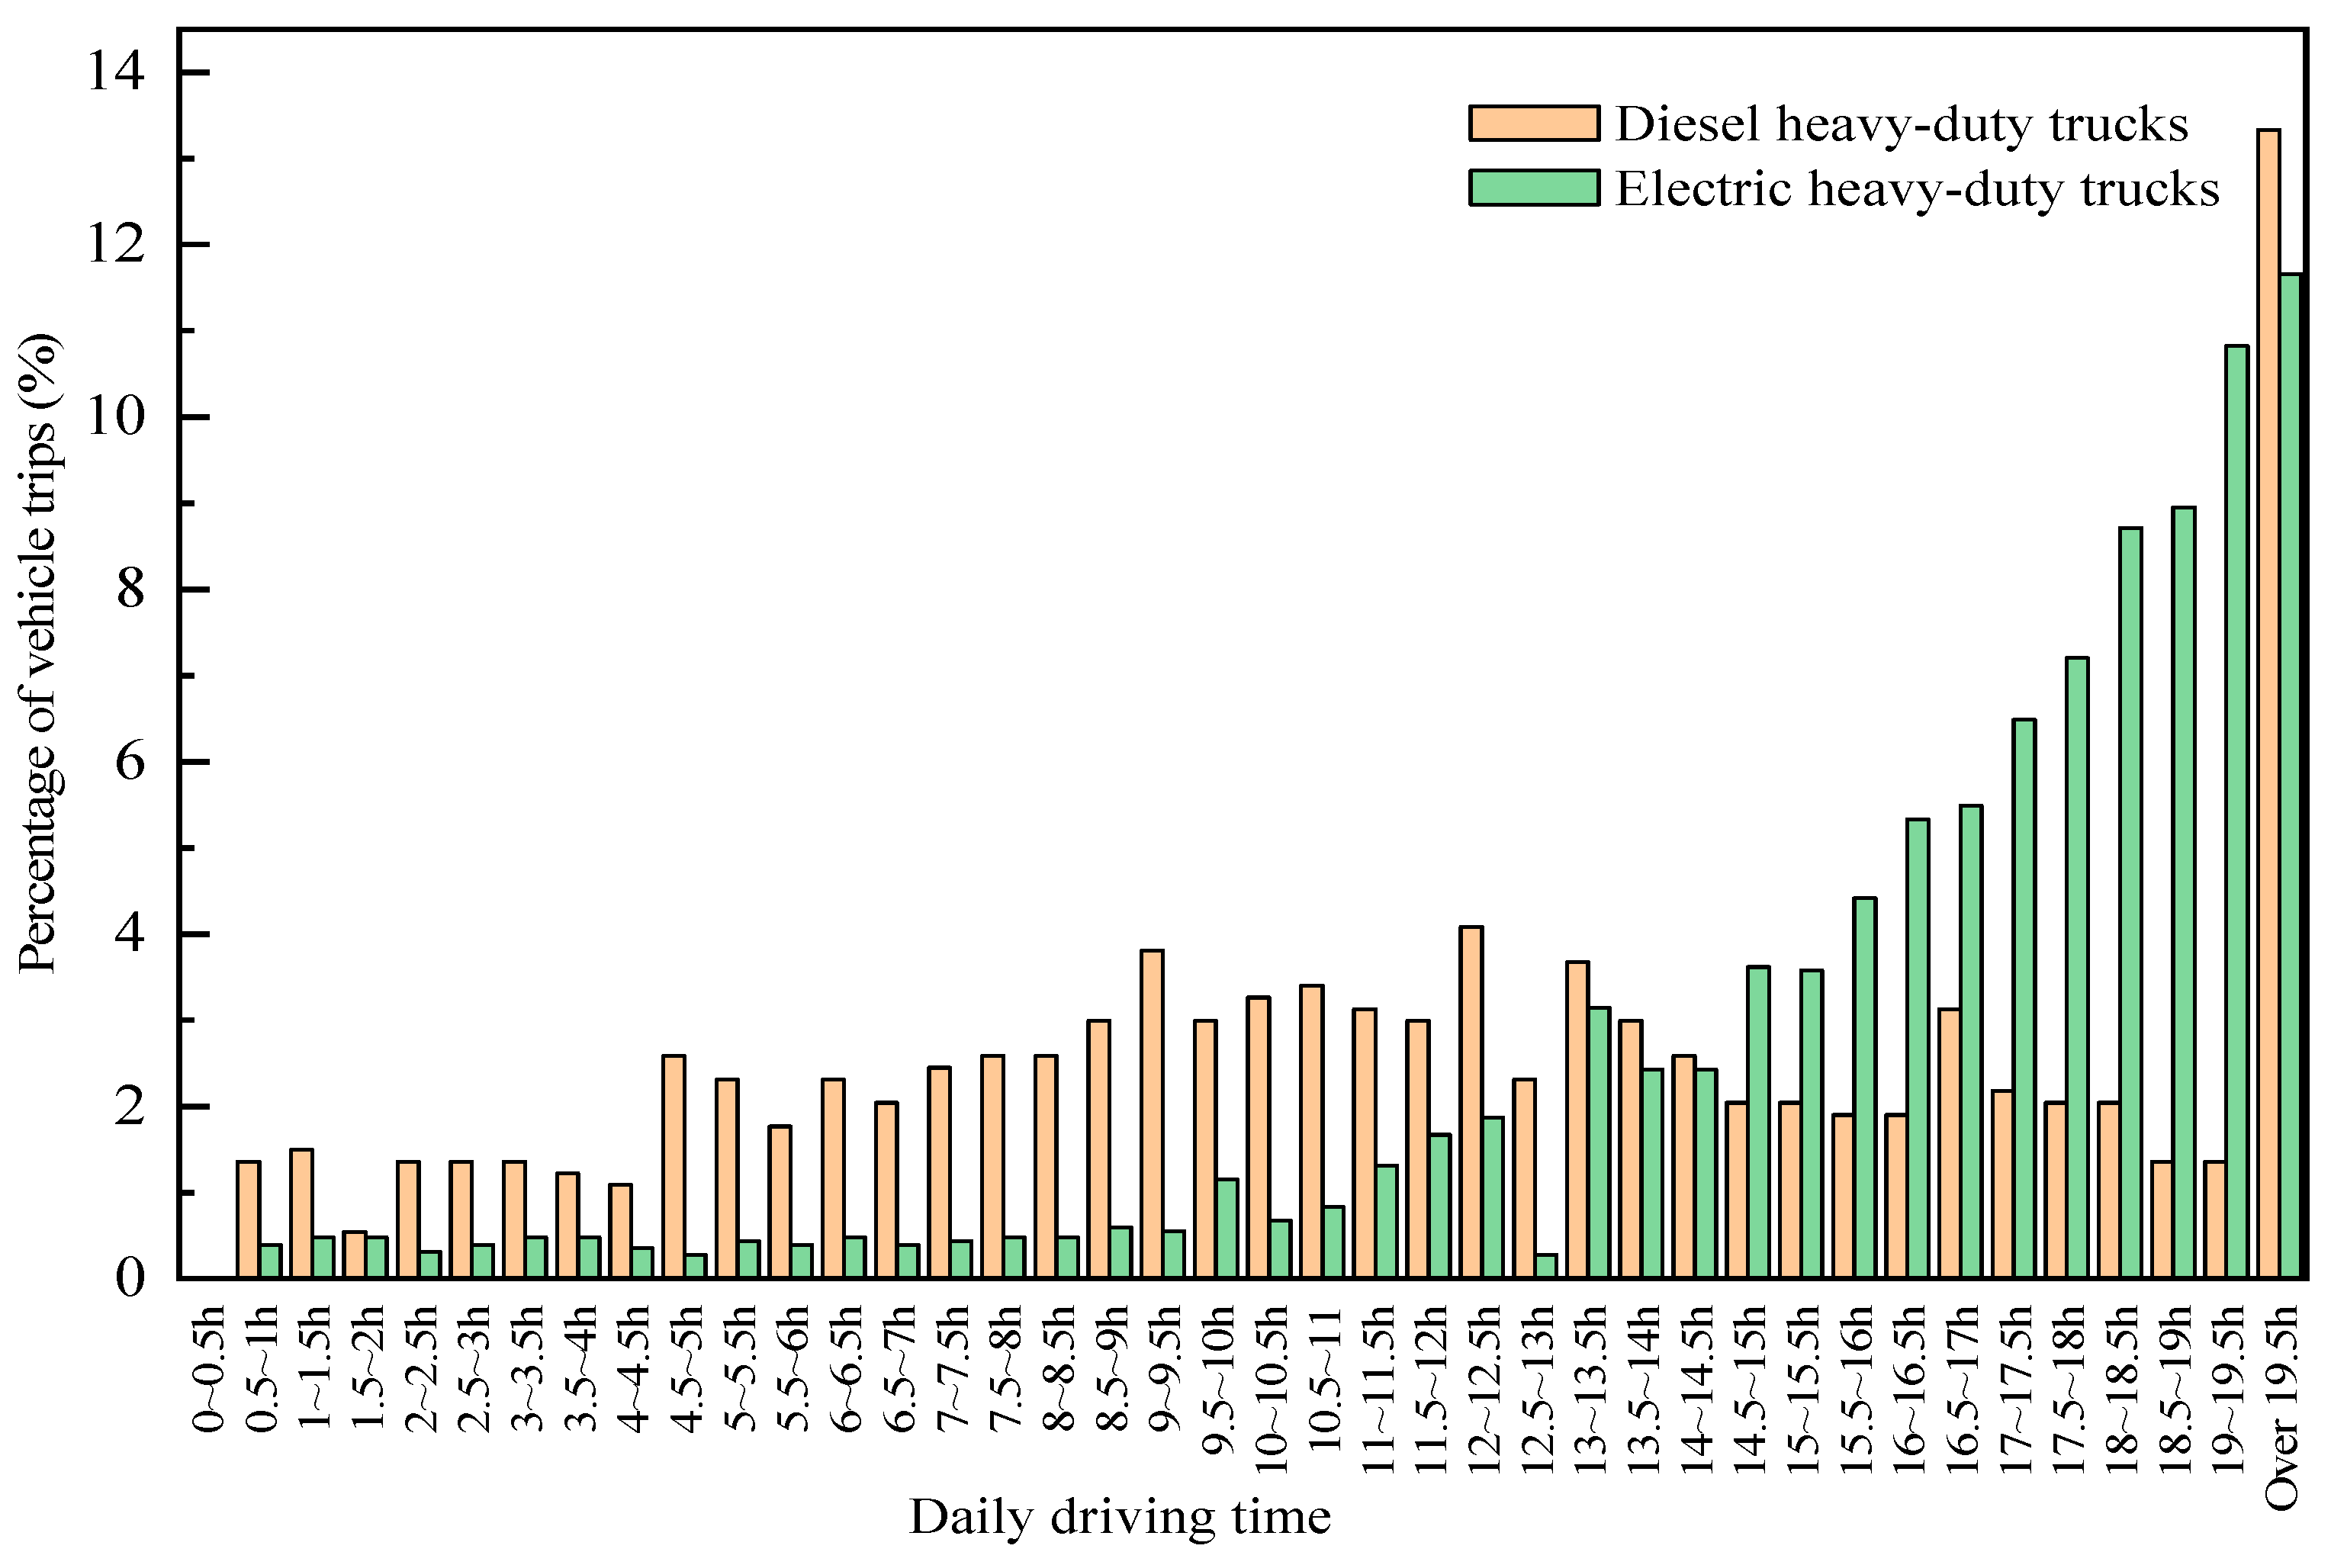
3.2.2. Driving Time
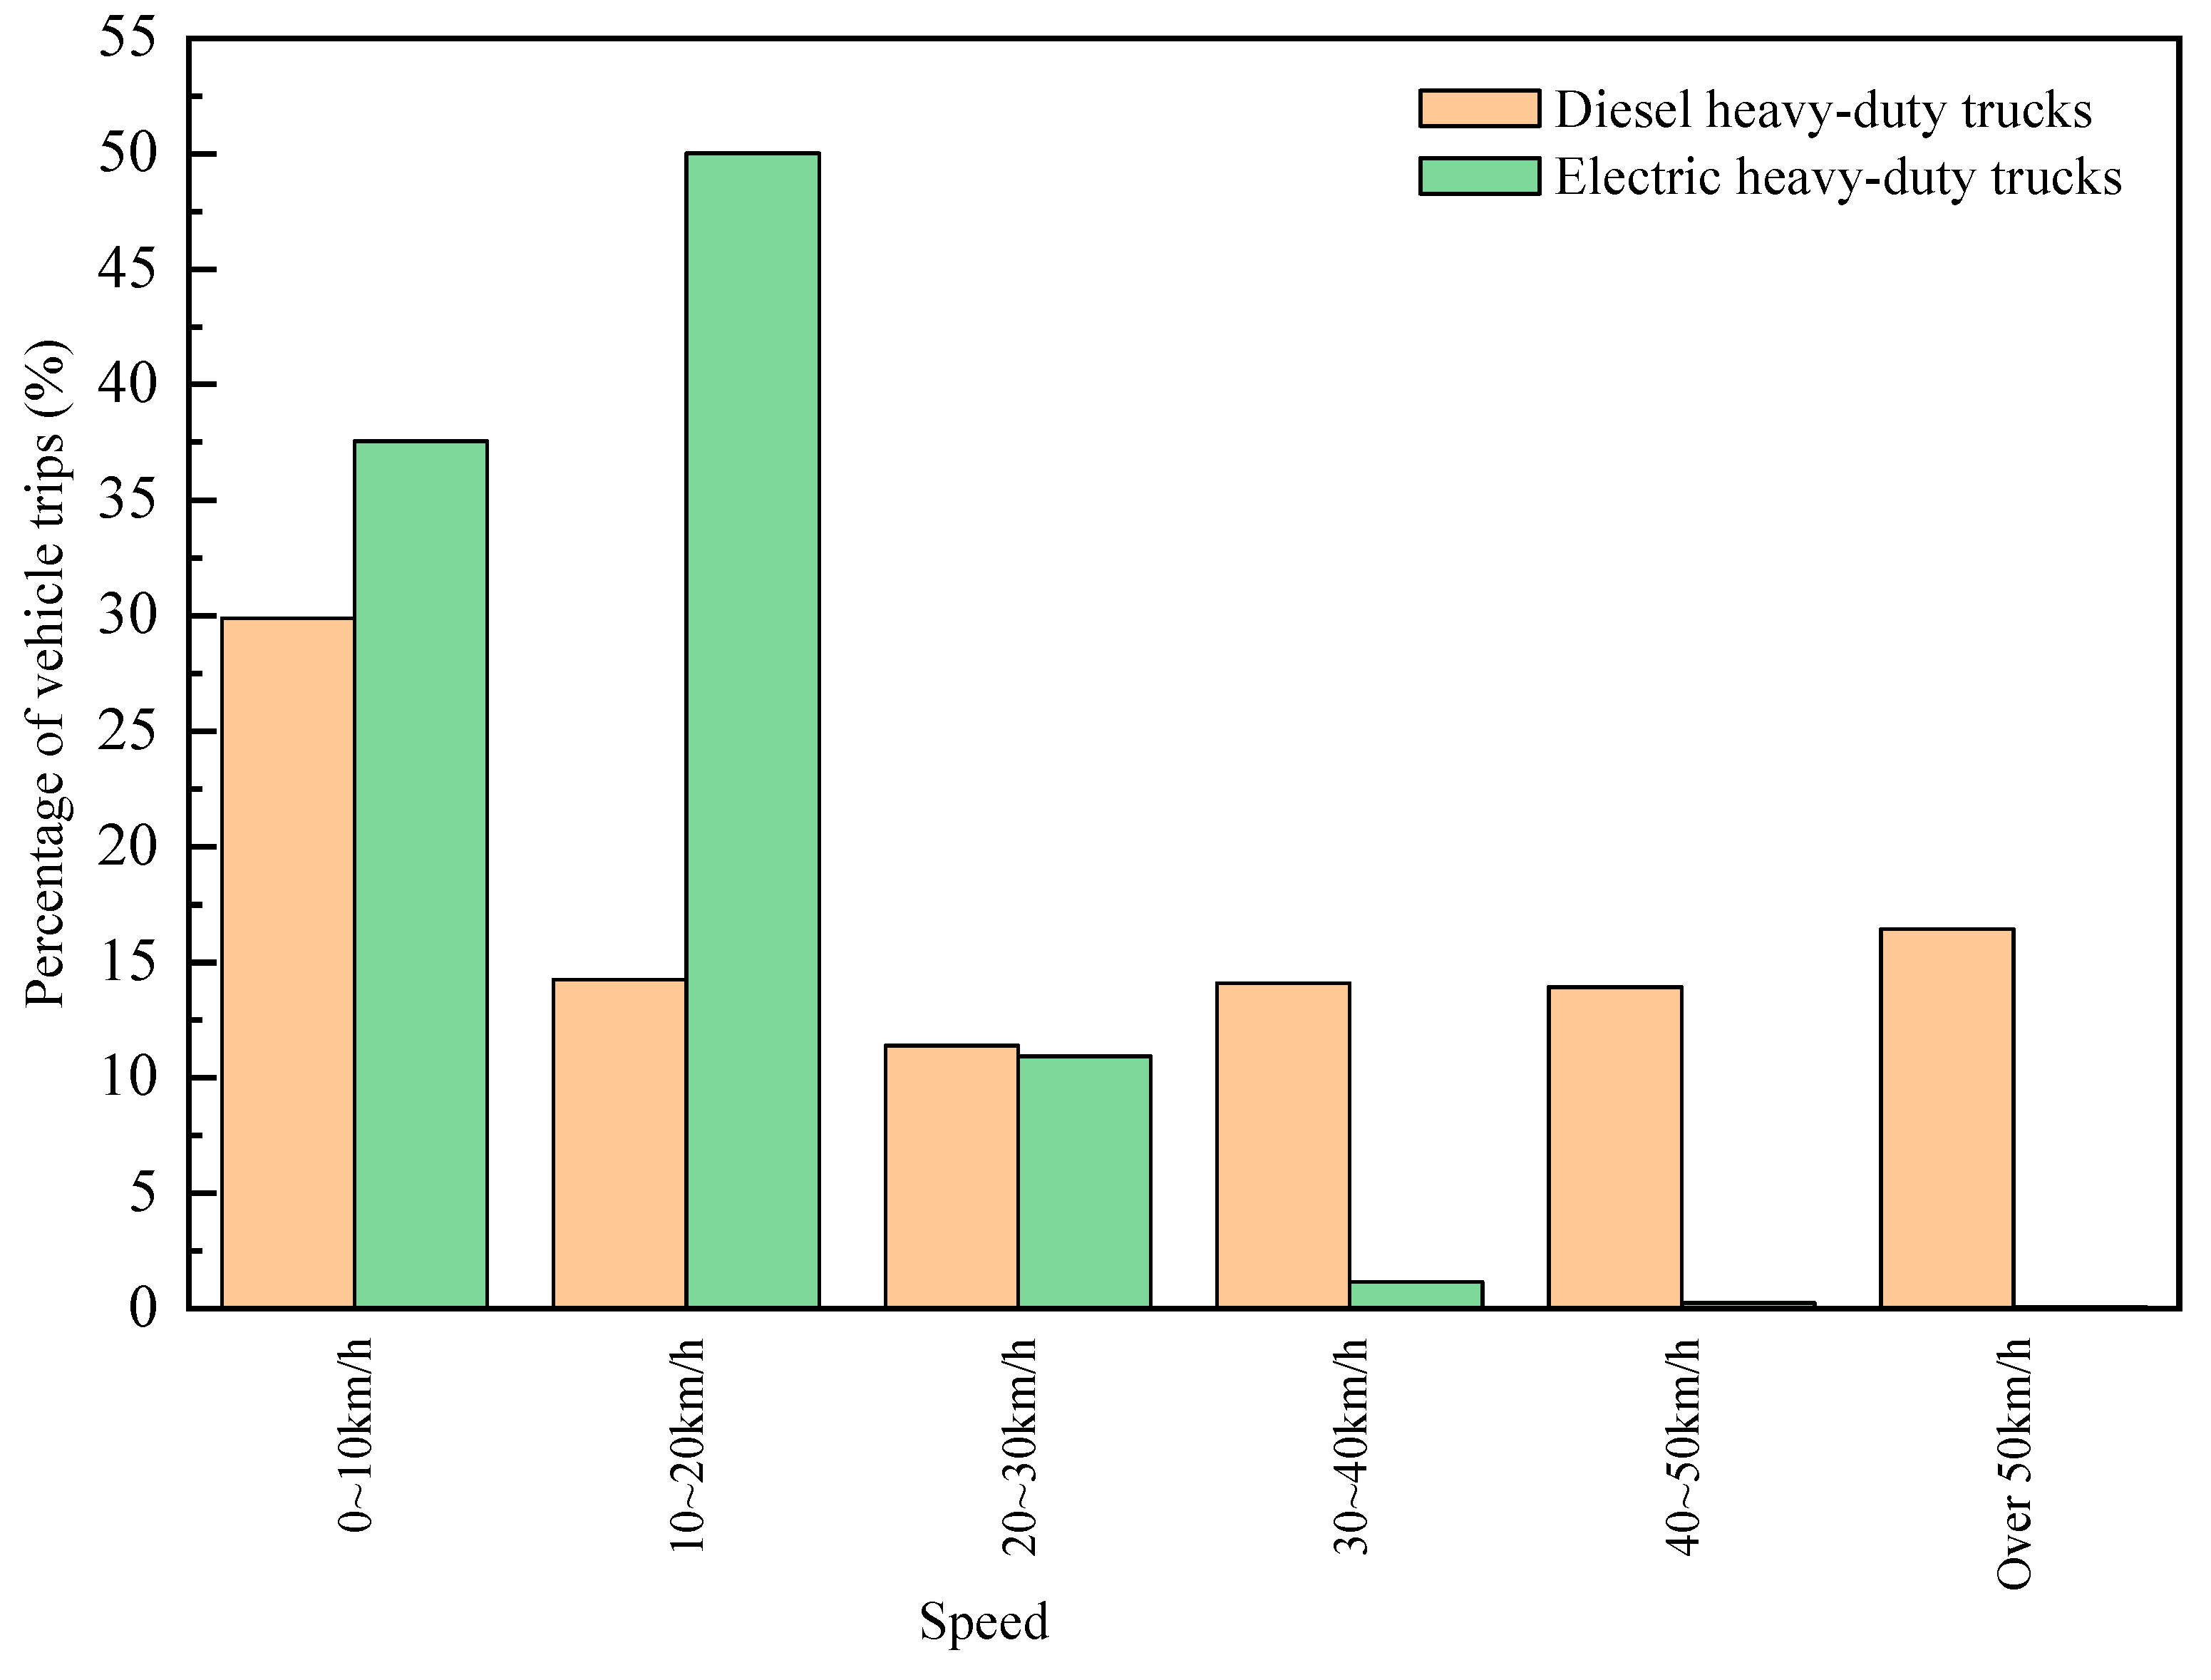
3.2.3. Speed Distribution
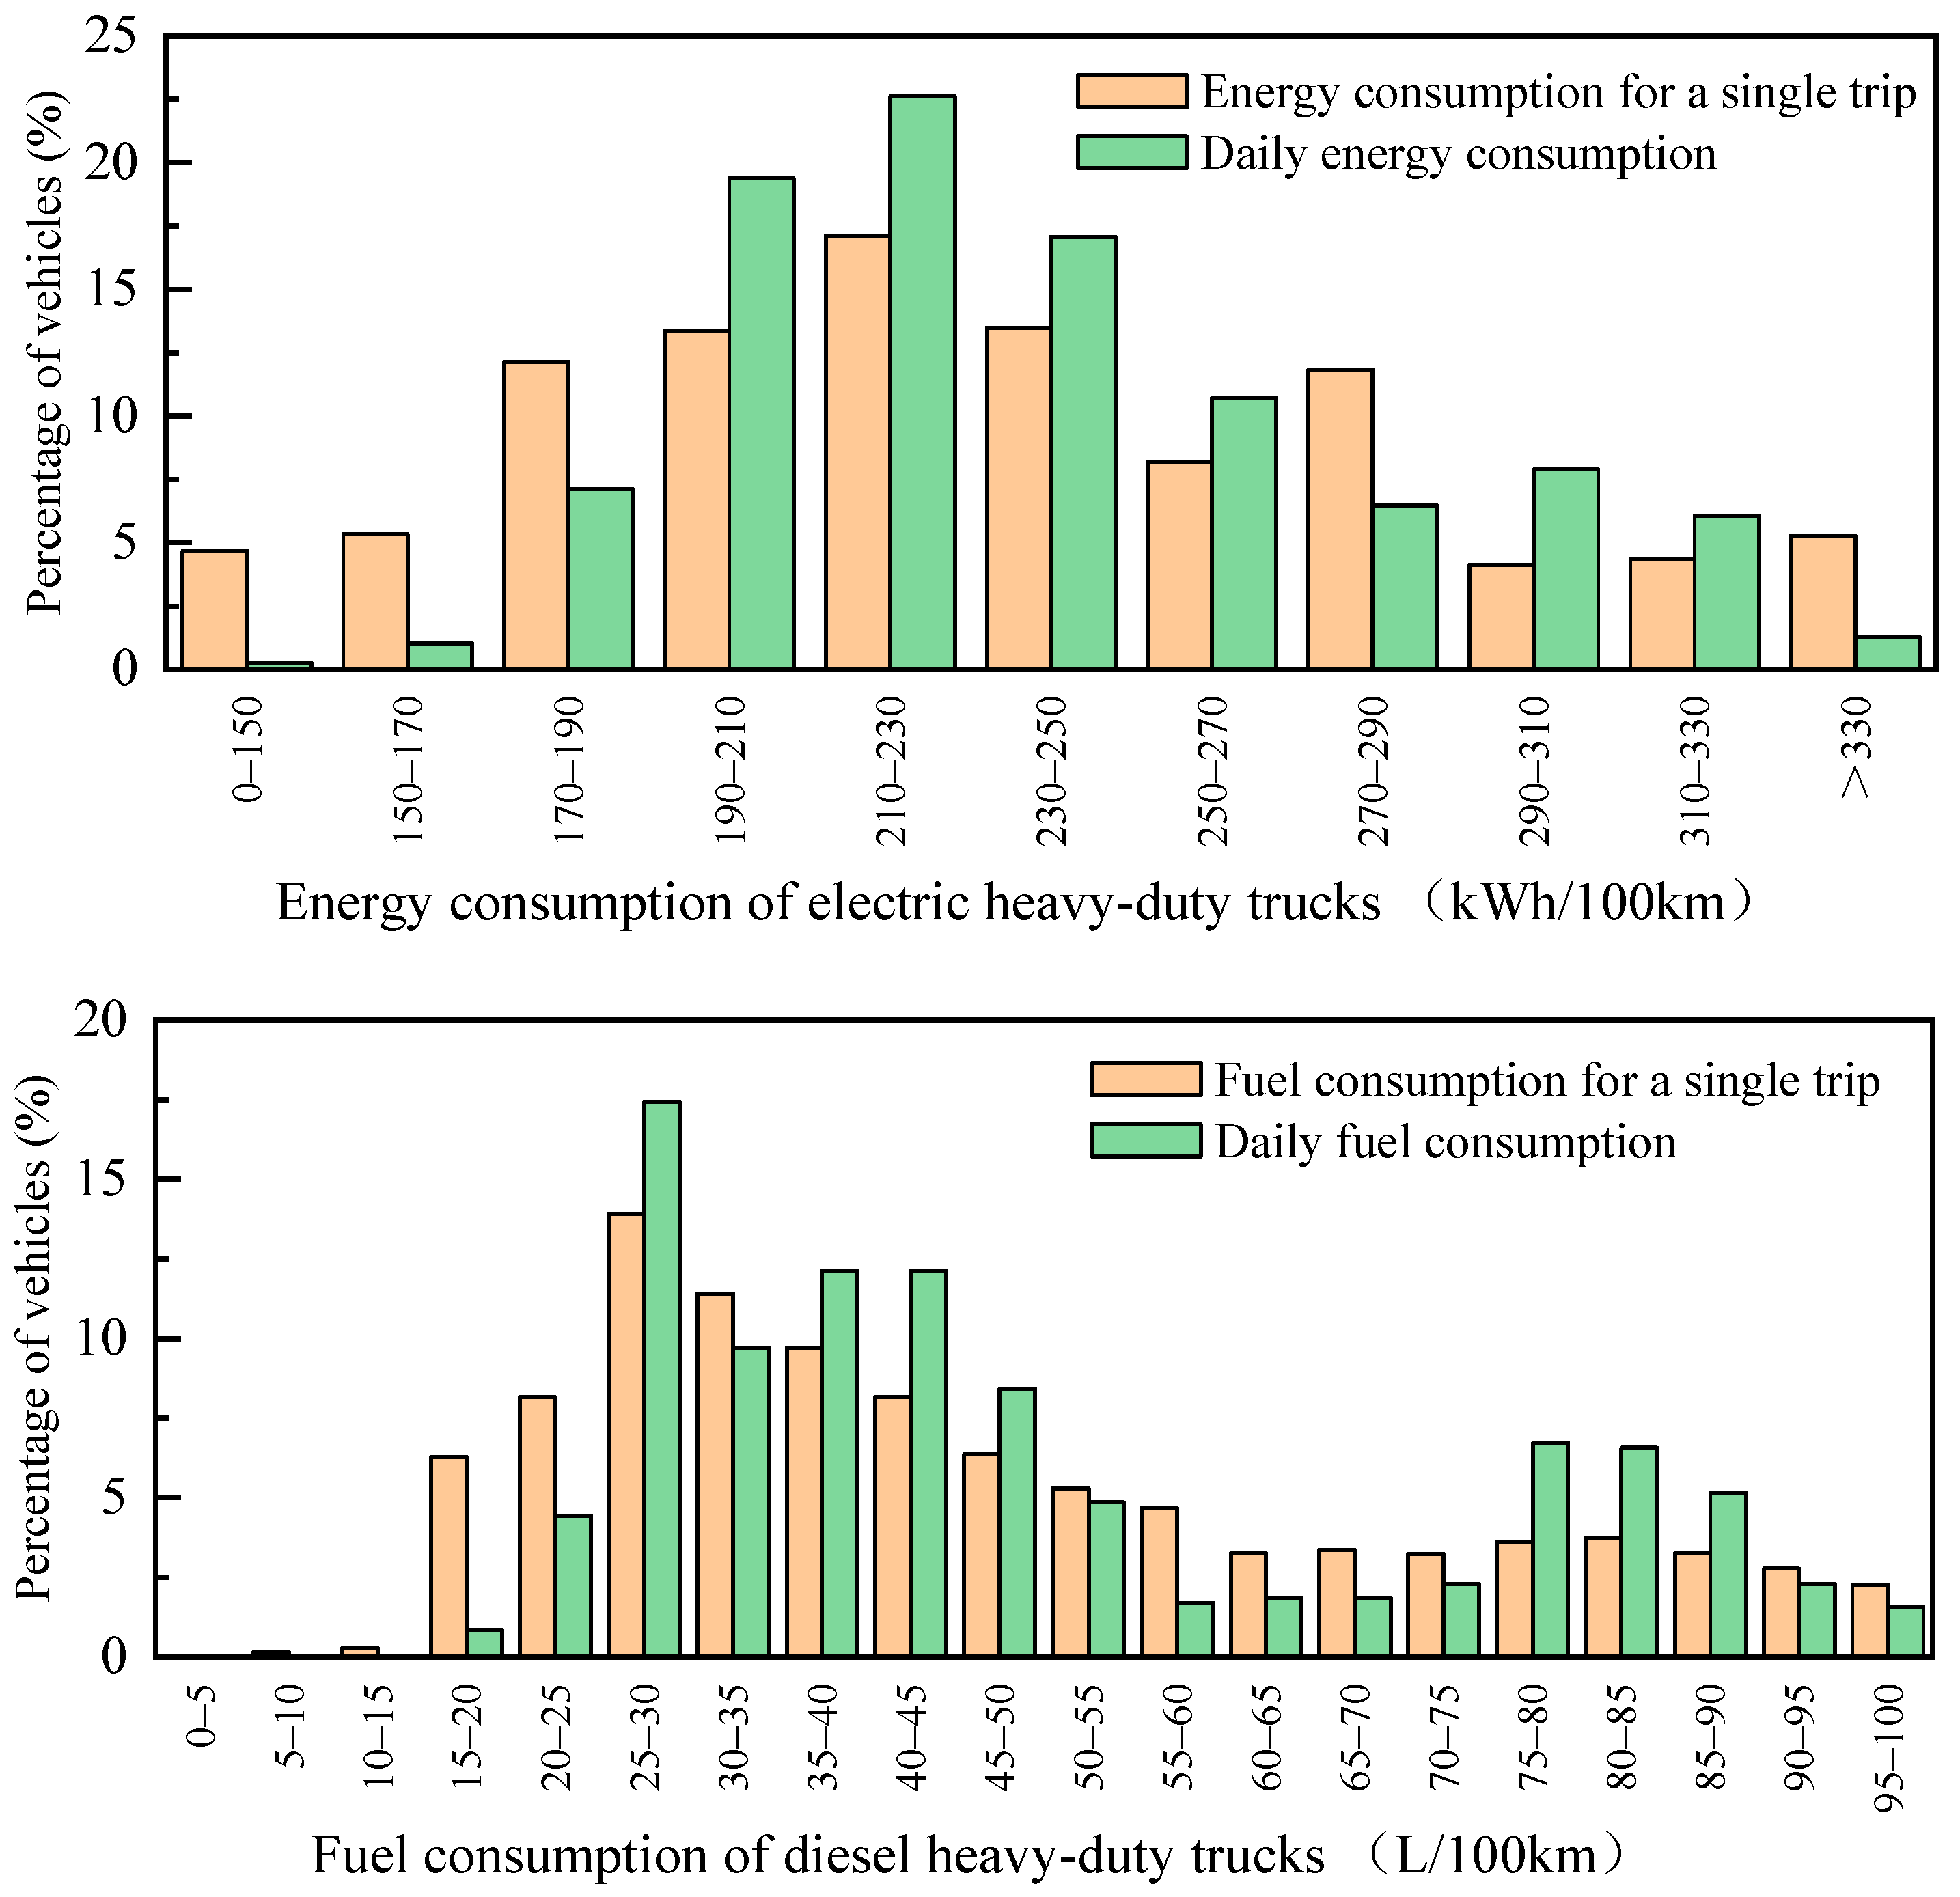
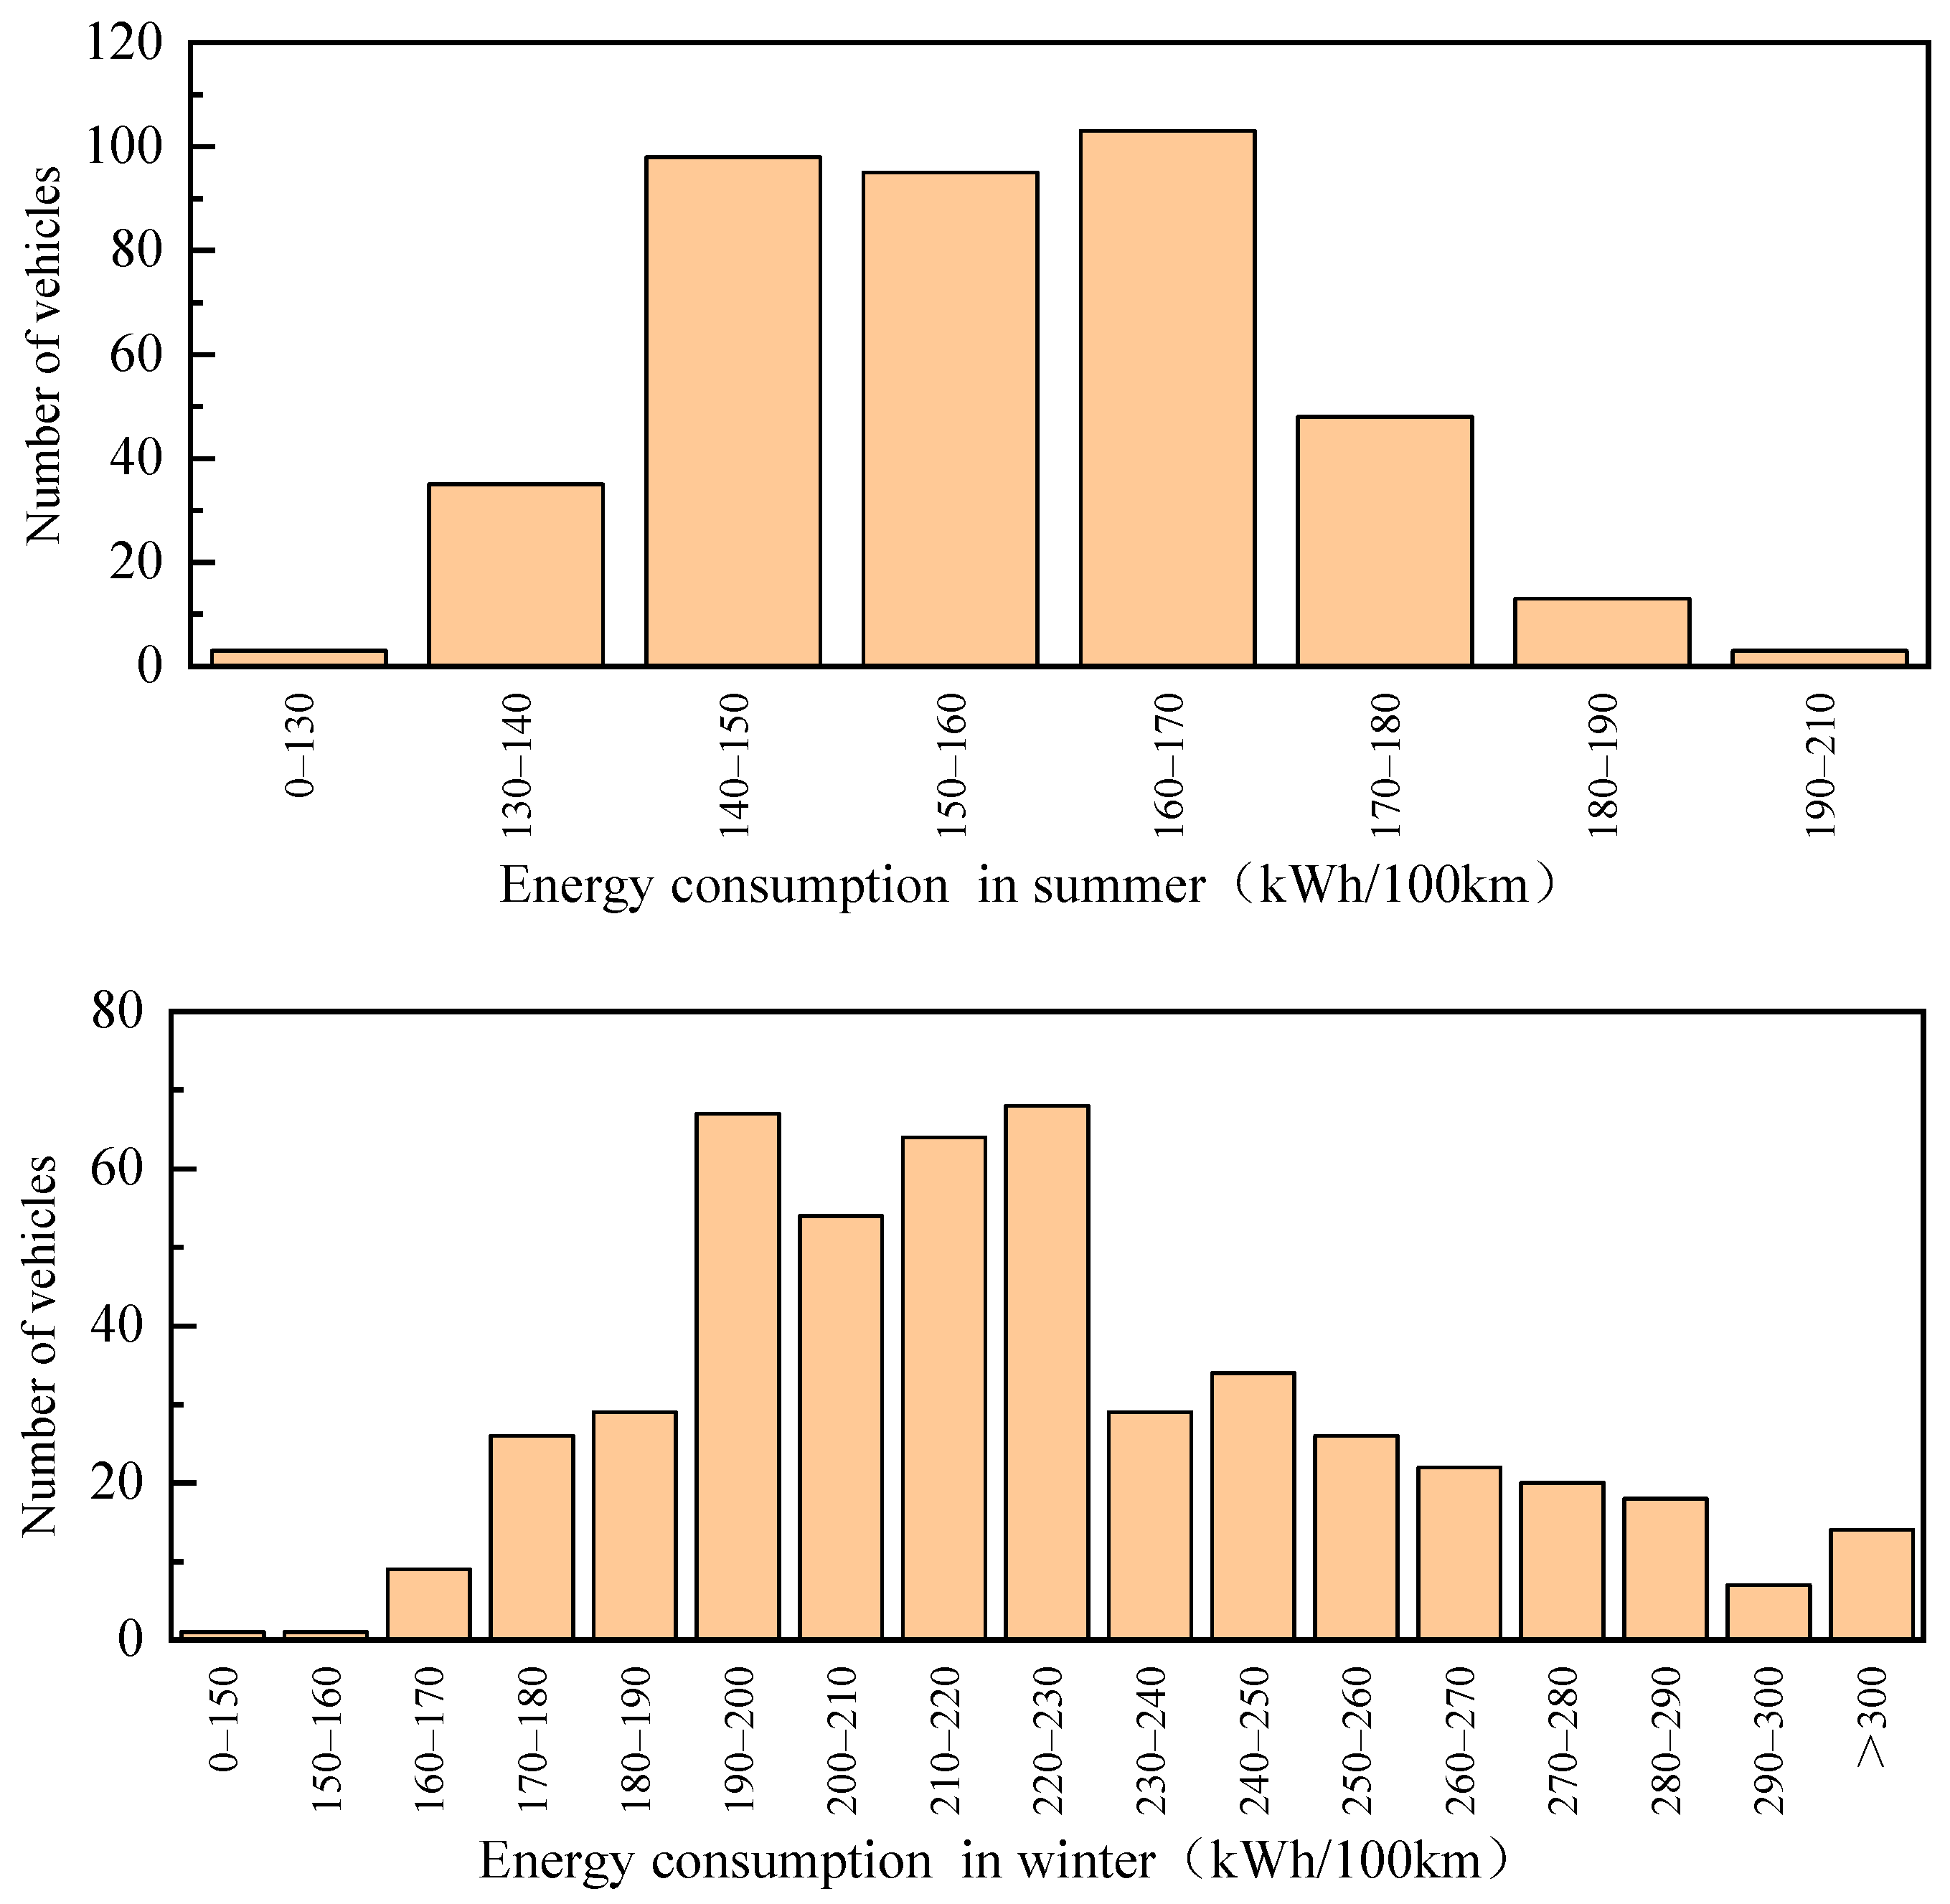
3.2.4. Energy Consumption
3.3. Environmental and Economic Benefit Analysis
4. Policy Recommendation
5. Conclusions
Author Contributions
Funding
Institutional Review Board Statement
Informed Consent Statement
Data Availability Statement
Conflicts of Interest
References
- Sicard, P.; Agathokleous, E.; Anenberg, S.; Marco, A.; Paoletti, E.; Calatayud, V. Trends in urban air pollution over the last two decades: A global perspective. Sci. Total Environ. 2023, 858, 160064. [Google Scholar] [CrossRef] [PubMed]
- Stanaway, J.; Afshin, A.; Gakidou, E.; Lim, S.S.; Abate, D.; Abate, K.H.; Abbafati, C.; Abbasi, N.; Abbastabar, H.; Abd-Allah, F.; et al. Global, regional, and national comparative risk assessment of 84 behavioural, environmental and occupational, and metabolic risks or clusters of risks for 195 countries and territories, 1990–2017: A systematic analysis for the Global Burden of Disease Study 2017. Lancet 2018, 392, 1923–1994. [Google Scholar]
- Cohen, A.; Brauer, M.; Burnett, R.; Anderson, H.R.; Frostad, J.; Estep, K.; Balakrishnan, K.; Brunekreef, B.; Dandona, L.; Dandona, R.; et al. Estimates and 25-year trends of the global burden of disease attributable to ambient air pollution: An analysis of data from the Global Burden of Diseases Study 2015. Lancet 2017, 389, 1907–1918. [Google Scholar] [CrossRef] [PubMed]
- Liang, H.; Zhou, X.; Zhu, Y.; Li, D.; Jing, D.; Su, X.; Pan, P.; Liu, H.; Zhang, Y. Association of outdoor air pollution, lifestyle, genetic factors with the risk of lung cancer: A prospective cohort study. Environ. Res. 2023, 218, 114996. [Google Scholar] [CrossRef] [PubMed]
- Agathokleous, E.; Feng, Z.; Oksanen, E.; Sicard, P.; Wang, Q.; Saitanis, C.J.; Araminiene, V.; Blande, J.D.; Hayes, F.; Calatayud, V.; et al. Ozone affects plant, insect, and soil microbial communities: A threat to terrestrial ecosystems and biodiversity. Sci. Adv. 2020, 33, eabc1176. [Google Scholar] [CrossRef]
- Hu, E.; Ren, Z.; Wang, X.; Zhang, H.; Zhang, W. Effect of elevated tropospheric ozone on soil carbon and nitrogen: A meta-analysis. Environ. Res. Lett. 2022, 17, 043001. [Google Scholar] [CrossRef]
- Perring, M.; Bullock, J.; Alison, J.; Holder, A.; Hayes, F. Out of sight, out of mind—But not out of scope. The need to consider ozone in restoration science, policy, and practice. Restor. Ecol. 2022, 7, e13622. [Google Scholar] [CrossRef]
- The Intergovernmental Panel on Climate Change. Special Report: Global Warming of 1.5 °C. 2018. Available online: https://www.ipcc.ch/sr15/ (accessed on 7 August 2023).
- International Energy Agency. Global Energy Review: CO2 Emissions in 2021. 2022. Available online: https://www.iea.org/reports/global-energy-review-co2-emissions-in-2021-2 (accessed on 7 August 2023).
- Ministry of Ecology and Environment of the People’s Republic of China. China Mobile Source Environmental Management Annual Report. 2022. Available online: https://www.mee.gov.cn/hjzl/sthjzk/ydyhjgl/202212/W020221207387013521948.pdf (accessed on 16 June 2023).
- Peng, T.; Ren, L.; Ou, X. Development and application of life-cycle energy consumption and carbon footprint analysis model for passenger vehicles in China. Energy 2023, 282, 128412. [Google Scholar] [CrossRef]
- Qiao, Q.; Zhao, F.; Liu, Z.; He, X.; Hao, H. Life cycle greenhouse gas emissions of Electric Vehicles in China: Combining the vehicle cycle and fuel cycle. Energy 2019, 177, 222–233. [Google Scholar] [CrossRef]
- Santana, J.C.C.; Machado, P.G.; Nascimento, C.A.O.d.; Ribeiro, C.d.O. Economic and Environmental Assessment of Hydrogen Production from Brazilian Energy Grid. Energies 2023, 16, 3769. [Google Scholar] [CrossRef]
- Shaheen, S.; Martin, E.; Totte, H. Zero-emission vehicle exposure within U.S. carsharing fleets and impacts on sentiment toward electric-drive vehicles. Transp. Policy 2020, 85, A23–A32. [Google Scholar] [CrossRef]
- International Energy Agency. Global EV Outlook 2022. 2022. Available online: https://www.iea.org/reports/global-ev-outlook-2022 (accessed on 7 June 2023).
- National Big Data Alliance of New Energy Vehicles. Annual Report on the Big Data of New Energy Vehicle in China (2022); China Machine Press: Beijing, China, 2022; pp. 10–11. [Google Scholar]
- Wu, Y.; Gu, F.; Ji, Y.; Ma, S.; Guo, J. Electric vehicle adoption and local PM2.5 reduction: Evidence from China. J. Clean. Prod. 2023, 396, 136508. [Google Scholar] [CrossRef]
- Li, W.; Long, R.; Chen, H.; Wang, M.; Li, Q.; Wu, M.; Cheng, X. Inter-provincial emissions transfer embodied in electric vehicles in China. Transp. Res. Part D Transp. Environ. 2023, 119, 103756. [Google Scholar] [CrossRef]
- Gao, Z.; LaClair, T.; Ou, S.; Huff, S.; Wu, G.; Hao, P.; Boriboonsomsin, K.; Barth, M. Evaluation of electric vehicle component performance over eco-driving cycles. Energy 2019, 172, 823–839. [Google Scholar] [CrossRef]
- Fernández, R.; Caraballo, S.; López, F. A probabilistic approach for determining the influence of urban traffic management policies on energy consumption and greenhouse gas emissions from a battery electric vehicle. J. Clean. Prod. 2019, 236, 117604. [Google Scholar] [CrossRef]
- Komnos, D.; Tsiakmakis, S.; Pavlovic, J.; Ntziachristos, L.; Fontaras, G. Analysing the real-world fuel and energy consumption of conventional and electric cars in Europe. Energy Convers. Manag. 2022, 270, 116161. [Google Scholar] [CrossRef]
- Zhang, C.; Shen, K.; Yang, F.; Yuan, C. Multiphysics Modeling of Energy Intensity and Energy Efficiency of Electric Vehicle Operation. Procedia CIRP 2019, 80, 322–327. [Google Scholar] [CrossRef]
- Saikong, W.; Kulworawanichpong, T. Comparative Study of Energy Consumption for Electric Vehicles with Various On-board Energy Storage Systems. Energy Procedia 2017, 138, 81–86. [Google Scholar] [CrossRef]
- Qi, Z.; Yang, J.; Jia, R.; Wang, F. Investigating Real-World Energy Consumption of Electric Vehicles: A Case Study of Shanghai. Procedia Comput. Sci. 2018, 131, 367–376. [Google Scholar] [CrossRef]
- Zhang, J.; Wang, Z.; Liu, P.; Zhang, Z. Energy consumption analysis and prediction of electric vehicles based on real-world driving data. Appl. Energy 2020, 275, 115408. [Google Scholar] [CrossRef]
- Bucher, J.; Bradley, T.; Lohse-Busch, H.; Rask, E. Analyzing the Energy Consumption Variation during Chassis Dynamometer Testing of Conventional, Hybrid Electric, and Battery Electric Vehicles. SAE Int. J. Alt. Power. 2014, 3, 36–43. [Google Scholar] [CrossRef]
- De Gennaro, M.; Paffumi, E.; Martini, G.; Manfredi, U.; Vianelli, S.; Ortenzi, F.; Genovese, A. Experimental Test Campaign on a Battery Electric Vehicle: Laboratory Test Results (Part 1). SAE Int. J. Alt. Power. 2015, 4, 100–114. [Google Scholar] [CrossRef]
- Al-Wreikat, Y.; Serrano, C.; Sodré, J. Driving behaviour and trip condition effects on the energy consumption of an electric vehicle under real-world driving. Appl. Energy 2021, 297, 117096. [Google Scholar] [CrossRef]
- Suttakul, P.; Fongsamootr, T.; Wongsapai, W.; Mona, Y.; Poolsawat, K. Energy consumptions and CO2 emissions of different powertrains under real-world driving with various route characteristics. Energy Rep. 2022, 8, 554–561. [Google Scholar] [CrossRef]
- Donkers, A.; Yang, D.; Viktorović, M. Influence of driving style, infrastructure, weather and traffic on electric vehicle performance. Transp. Res. Part D Transp. Environ. 2020, 88, 102569. [Google Scholar] [CrossRef]
- Jiang, J.; Yu, Y.; Min, H.; Cao, Q.; Sun, W.; Zhang, Z.; Luo, C. Trip-level energy consumption prediction model for electric bus combining Markov-based speed profile generation and Gaussian processing regression. Energy 2023, 263, 125866. [Google Scholar] [CrossRef]
- Nan, S.; Tu, R.; Li, T.; Sun, J.; Chen, H. From driving behavior to energy consumption: A novel method to predict the energy consumption of electric bus. Energy 2022, 261, 125188. [Google Scholar] [CrossRef]
- Li, P.; Zhang, Y.; Zhang, Y.; Zhang, Y.; Zhang, K. Prediction of electric bus energy consumption with stochastic speed profile generation modelling and data driven method based on real-world big data. Appl. Energy 2021, 298, 117204. [Google Scholar] [CrossRef]
- Hu, L.; Dong, J.; Lin, Z.; Yang, J. Analyzing battery electric vehicle feasibility from taxi travel patterns: The case study of New York City, USA. Transp. Res. Part C Emerg. Technol. 2018, 87, 91–104. [Google Scholar] [CrossRef]
- Tu, W.; Santi, P.; Zhao, T.; He, X.; Li, Q.; Dong, L.; Wallington, T.J.; Ratti, C. Acceptability, energy consumption, and costs of electric vehicle for ride-hailing drivers in Beijing. Appl. Energy 2019, 250, 147–160. [Google Scholar] [CrossRef]
- Zhang, J.; Wang, Z.; Miller, E.; Cui, D.; Liu, P.; Zhang, Z. Charging demand prediction in Beijing based on real-world electric vehicle data. J. Energy Storage 2023, 57, 106294. [Google Scholar] [CrossRef]
- Borlaug, B.; Moniot, M.; Birky, A.; Alexander, M.; Muratori, M. Charging needs for electric semi-trailer trucks. Renew. Sust. Energy Transit. 2022, 2, 100038. [Google Scholar]
- Teimouri, A.; Kabeh, K.; Changizian, S.; Ahmadi, P.; Mortazavi, M. Comparative lifecycle assessment of hydrogen fuel cell, electric, CNG, and gasoline-powered vehicles under real driving conditions. Int. J. Hydrogen Energy 2022, 89, 37990–38002. [Google Scholar] [CrossRef]
- Yamamura, C.L.K.; Takiya, H.; Machado, C.A.S.; Santana, J.C.C.; Quintanilha, J.A.; Berssaneti, F.T. Electric Cars in Brazil: An Analysis of Core Green Technologies and the Transition Process. Sustainability 2022, 14, 6064. [Google Scholar] [CrossRef]
- Amiri, A.; Amin, S.; Zolfagharinia, H. A bi-objective green vehicle routing problem with a mixed fleet of conventional and electric trucks: Considering charging power and density of stations. Expert Syst. Appl. 2023, 213, 119228. [Google Scholar] [CrossRef]
- Gallo, J.; Russell, R.; Johnson, K.; Durbin, T. Chassis Dynamometer Testing of a Class 5 Battery Electric Commercial Truck. SAE Int. J. Commer. Veh. 2015, 8, 761–772. [Google Scholar] [CrossRef]
- Mareev, I.; Becker, J.; Sauer, D. Battery Dimensioning and Life Cycle Costs Analysis for a Heavy-Duty Truck Considering the Requirements of Long-Haul Transportation. Energies 2018, 11, 55. [Google Scholar] [CrossRef]
- Tong, F.; Wolfson, D.; Jenn, A.; Scown, C.; Auffhammer, M. Energy consumption and charging load profiles from long-haul truck electrification in the United States. Environ. Res. Infrastruct. Sustain. 2021, 1, 025007. [Google Scholar] [CrossRef]
- Çabukoglu, E.; Georges, G.; Küng, L.; Pareschi, G.; Boulouchos, K. Battery electric propulsion: An option for heavy-duty vehicles? Results from a Swiss case-study. Transp. Res. Part C Emerg. Technol. 2018, 88, 107–123. [Google Scholar] [CrossRef]
- Sen, B.; Ercan, T.; Tatari, O. Does a battery-electric truck make a difference?—Life cycle emissions, costs, and externality analysis of alternative fuel-powered Class 8 heavy-duty trucks in the United States. J. Clean. Prod. 2017, 141, 110–121. [Google Scholar] [CrossRef]
- Sato, S.; Jiang, Y.; Russell, R.; Miller, J.; Karavalakis, G.; Durbin, T.; Johnson, K. Experimental driving performance evaluation of battery-powered medium and heavy duty all-electric vehicles. Int. J. Electr. Power Energy Syst. 2022, 141, 108100. [Google Scholar] [CrossRef]
- Ministry of Ecology and Environment of the People’s Republic of China. Technical Guidelines for Compiling Atmospheric Pollutant Emission Inventory of Road Motor Vehicles (Trial). Available online: https://www.mee.gov.cn/gkml/hbb/bgg/201501/W020150107594587831090.pdf (accessed on 14 July 2023).
- The Intergovernmental Panel on Climate Change. 2006 IPCC Guidelines for National Greenhouse Gas Inventories. 2006. Available online: https://www.ipcc-nggip.iges.or.jp/public/2006gl/index.html (accessed on 7 August 2023).
- Rastani, S.; Yüksel, T.; Çatay, B. Effects of ambient temperature on the route planning of electric freight vehicles. Transp. Res. Part D Transp. Environ. 2019, 74, 124–141. [Google Scholar] [CrossRef]
- Yuksel, T.; Michalek, J. Effects of Regional Temperature on Electric Vehicle Efficiency, Range, and Emissions in the United States. Environ. Sci. Technol. 2015, 49, 3974–3980. [Google Scholar] [CrossRef] [PubMed]
- Yi, Z.; Smart, J.; Shirk, M. Energy impact evaluation for eco-routing and charging of autonomous electric vehicle fleet: Ambient temperature consideration. Transp. Res. Part C Emerg. Technol. 2018, 89, 344–363. [Google Scholar] [CrossRef]


| Indicator | Diesel Heavy-Duty Trucks | Electric Heavy-Duty Trucks |
|---|---|---|
| Number of Vehicle | 15 | 61 |
| Curb Weight | 9 t | 11 t |
| Maximum Tractive Tonnage | 40 t | 38 t |
| Maximum Speed | 89 km/h | 89 km/h |
| Vehicle Emission Phase | China VI | / |
| Battery Type | / | Lithium Iron Phosphate |
| Battery Capacity | / | 282 kWh |
| Charging Time | / | 20–90% ≤1 h |
| Driving Range | / | About 150 km |
| Number of Trips | 44,530 | 9953 |
| No. | Data Type | Statistical Method |
|---|---|---|
| 1 | Daily Travel Times | Count the number of journeys a vehicle makes each day. |
| 2 | Single Charging Duration | Count the duration of each charge for the electric heavy-duty truck, setting the interval length to 0.5 h. |
| 3 | Daily Charging Duration | Count the daily charging duration for electric heavy-duty trucks and set the interval length at 0.5 h. |
| 4 | Daily Charging Times | Count the charging times of electric heavy-duty trucks per day. |
| 5 | Actual Charging Rate | Calculated by dividing the change in state of charge (SOC) per charge of electric heavy-duty trucks by charging duration and setting the interval length at 0.1 h−1. |
| 6 | Starting/Ending SOC of Charging | Count the distribution of the starting and ending SOC of each charge for electric heavy-duty trucks, with a step length of 10%. |
| 7 | Single VKT | Take 15 min of vehicle immobility as the standard for determining the end of a trip and count the VKT for each travel, with an interval length of 5 km. |
| 8 | Daily VKT | Count the cumulative daily VKT of the vehicles and set the interval length at 10 km. |
| 9 | Daily Travel Duration | Count the cumulative daily travel duration of the vehicles and set the interval length at 0.5 h. |
| 10 | Single-Trip Energy Consumption | The calculation method for electric heavy-duty trucks’ energy consumption is the consumed SOC × nominal energy storage ÷ corresponding travel distance; take 15 min of vehicle immobility as the standard for determining the end of a trip; and set the interval length at 20 kWh/100 km. |
| 11 | Daily Energy Consumption | Count the average energy consumption for the daily travel of electric heavy-duty trucks and set the interval length at 20 kWh/100 km. |
| 12 | Single-Trip Fuel Consumption | Take 15 min of vehicle immobility as the standard for determining the end of a trip, count the fuel consumption for each trip of diesel heavy-duty trucks, and set the interval length at 5 L/100 km. |
| 13 | Daily Fuel Consumption | Count the average fuel consumption for the daily travel of diesel heavy-duty trucks and set the interval length at 5 L/100 km. |
| 14 | Average Speed per Trip | Take 15 min of vehicle immobility as the standard for determining the end of a trip, count the average speed for each trip of vehicles, and set the interval length at 10 km/h. |
| Indicator | Unit | The Steel Plant | The Steel Industry in China |
|---|---|---|---|
| Replacement Quantity | vehicle | 300 | 1,618,800 |
| Annual Mileage | km | 73,000 | 73,000 |
| Average Speed Correction Factor of NOx and PM | / | 1.12 | 1.12 |
| NOx Emission Factor | g/km | 5.288 | 5.288 |
| NOx Emission Reduction | tons | 115.8 | 624,838.9 |
| PM Emission Factor | g/km | 0.034 | 0.034 |
| PM Emission Reduction | tons | 0.7 | 3970.6 |
| CO2 Emission Factor | kg/km | 0.224 | 0.224 |
| CO2 Emission Reduction | 10,000 tons | 1.8 | 9705.9 |
| Energy Cost Saving | million USD | 1.0–1.6 | 5318–8745 |
Disclaimer/Publisher’s Note: The statements, opinions and data contained in all publications are solely those of the individual author(s) and contributor(s) and not of MDPI and/or the editor(s). MDPI and/or the editor(s) disclaim responsibility for any injury to people or property resulting from any ideas, methods, instructions or products referred to in the content. |
© 2023 by the authors. Licensee MDPI, Basel, Switzerland. This article is an open access article distributed under the terms and conditions of the Creative Commons Attribution (CC BY) license (https://creativecommons.org/licenses/by/4.0/).
Share and Cite
Dou, G.; Ke, J.; Liang, J.; Wang, J.; Li, J.; Liu, Q.; Hao, C. Analysis of the Actual Usage and Emission Reduction Potential of Electric Heavy-Duty Trucks: A Case Study of a Steel Plant. Atmosphere 2023, 14, 1562. https://doi.org/10.3390/atmos14101562
Dou G, Ke J, Liang J, Wang J, Li J, Liu Q, Hao C. Analysis of the Actual Usage and Emission Reduction Potential of Electric Heavy-Duty Trucks: A Case Study of a Steel Plant. Atmosphere. 2023; 14(10):1562. https://doi.org/10.3390/atmos14101562
Chicago/Turabian StyleDou, Guangyu, Jia Ke, Jindong Liang, Junfang Wang, Jinhu Li, Qing Liu, and Chunxiao Hao. 2023. "Analysis of the Actual Usage and Emission Reduction Potential of Electric Heavy-Duty Trucks: A Case Study of a Steel Plant" Atmosphere 14, no. 10: 1562. https://doi.org/10.3390/atmos14101562