1. Introduction
Vehicle emissions are a major source of volatile organic compounds (VOCs), which can lead to the formation of ozone and fine particle matter (PM
2.5) and also be a potential source of sulfur and nitrogen-containing organics in urban areas [
1,
2]. VOC emissions from gasoline-fueled vehicles are released into the atmosphere through emissions from the tailpipe exhaust while the vehicle is in operation and through non-tailpipe (evaporative) emissions, which can occur when the vehicle is parked, refueled, or operated. Wu et al. indicated that the tailpipe and evaporative emissions of real-world gasoline vehicle fleets accounted for 43.2% and 33.7% of VOCs, respectively [
3]. Evaporative emissions are generally classified into five different source categories for emissions testing and inventory modeling: hot soak, diurnal, refueling, permeation, and running loss.
Evaporative emissions are efficiently reduced through the introduction of more stringent regulatory standards. Activated carbon canisters are added to gasoline vehicles to control the evaporative emissions of VOCs from the fuel tank from being released to the atmosphere during diurnal, refueling, and running loss conditions. Evaporative emissions are becoming increasingly important to total VOC emissions in China [
1,
4].
In China, Liu et al. [
1] and Man et al. [
4] provided detailed estimates of VOC evaporative emissions from different processes, including diurnal, hot soak, refueling, and permeation. Dai et al., Yue et al., Man et al., and Li et al. found that the characteristics of VOC species from hot soak, diurnal emissions, and headspace vapor were different due to their different emission mechanisms, and diurnal loss dominated evaporative emissions from high-mileage vehicles [
5,
6,
7,
8]. Zhu et al. also showed that hot soak losses and diurnal breathing losses were slightly impacted by fuel properties [
9]. Huang et al. and Yue et al. found that evaporative emissions of volatile organic compounds (VOCs) from motor vehicles were sensitively dependent upon the ambient temperature [
10,
11]. Hata et al. evaluated gasoline evaporative emissions from fuel cap removal during the refueling process [
12].
To strengthen evaporative emission control in China, “Limits and measurement methods for emissions from light-duty vehicles (China 6)” were implemented starting 1 July 2020 [
13]. China 6 reduced the 48-h hot soak and diurnal evaporative emissions limit to 0.7 g/test and introduced a refueling emission limit of 0.05 g/L. U.S. Tier 3 standards, which were implemented in 2017, are the most stringent global standards for evaporative emissions [
14]. In addition to more stringent hot soak and diurnal standards relative to China 6 (0.30 g/day), U.S. Tier 3 standards are designed to ensure that near-zero fuel vapor emissions are being emitted by vehicles from the fuel tank through the activated carbon canister through the addition of a canister bleed emission test procedure (BETP) with an emission standard of 0.020 g/test for all light-duty vehicles and 0.030 g/test for all heavy duty gasoline vehicles.
Prior to the introduction of China 6, the Manufacturers of Emissions Controls Association (MECA) estimated that each pre-China 6 light-duty gasoline vehicle could emit as much as 8.2 kg of evaporative VOC emissions each year [
15]. Liu et al. conducted a set of 30 evaporative emission tests on two U.S. Tier 2 vehicles and three Euro 4 vehicles (representative of China 4 vehicles) to quantify the benefits of China advancing evaporative emission standards to a level equivalent to U.S. Tier 2 [
1]. The study quantified diurnal, hot soak, permeation, and refueling emissions and found that the Euro 4 vehicles had an average evaporative emission of 1.6 kg/vehicle/year, which was about four times higher than the average evaporative emission from a U.S. Tier 2 vehicle (0.4 kg/vehicle/year). Martini et al. evaluated the evaporative emissions from an Italian fleet of Euro 5 and earlier passenger cars using real-world mobility data and found that fleet averaged evaporative emissions for small passenger cars could be as high as 1.15 kg/vehicle/year [
16]. Schifter et al. examined VOC emissions in a representative fleet of light-duty gasoline vehicles in the Metropolitan Area of Mexico City and found that evaporative emissions from light-duty vehicles in the Metropolitan Area of Mexico City were estimated to be 39% of the total annual amount of hydrocarbons emitted [
17]. Hata et al. and Dong et al. also evaluated the total annual evaporative emissions and OFP in Japan, Guangzhou, and Chicago by the model method [
18,
19,
20].
Liu et al. quantified the hot soak and diurnal evaporative emission reduction potential of China 6 vehicles relative to China 5 vehicles, while also quantifying the evaporative emission from new vs. in-use China 5 vehicles [
21]. Eleven light-duty gasoline vehicles were studied, including six China 6 vehicles, three new China 5 vehicles, and two in-use China 5 vehicles. China 6 vehicles were found to have 69–72% lower diurnal emissions compared with China 5 vehicles. Emissions from in-use China 5 vehicles exceeded new China 5 vehicles by a factor of 5.94, which was attributed to the possible aging of the carbon canister, vapor lines, and/or valves. Additionally, it was estimated that China 6′s implementation would result in a 62.9% reduction in annual total evaporative emissions for one car compared to China 5, according to Beijing’s parking behavior [
21]. Huang et al. conducted a series of evaporative tests on a parked gasoline-fueled vehicle in a Variable Temperature SHED chamber under seven temperatures from 298 K to 313 K at intervals of 2.5 K. The results showed that total hydrocarbon emissions at 313 K were 25.7, 12.3, and 26.7 times those at 298 K for China V, China VI, and ethanol blended E10 fuels, respectively [
10].
Sun et al. conducted laboratory tests to quantify refueling emissions for ten China 6 vehicles and three China 5 vehicles [
22]. The authors found that China 6 vehicles had a 98.8% reduction in refueling emissions relative to China 5 vehicles. Zhong et al. provided a summary of China 3, China 4, China 5, and China 6 certification data for hot soak and diurnal evaporative emissions from a random selection of 20 vehicles from each year spanning 2004 to 2019 [
23]. While the results show that significant progress has been made to reduce refueling and evaporative emissions with the introduction of China 6, Zhong et al. concluded that there remain further opportunities to reduce evaporative emissions in China. The current China 6 standards for hot soak and diurnal emissions (0.7 g/test) are slightly less stringent than the U.S. Tier 2 standard (0.65 g/test) and are significantly higher than the U.S. Tier 3 standard of 0.30 g/test.
Liu et al. performed evaporative emission experiments in a sealed housing evaporative determination (SHED) using eleven new and in-use light-duty gasoline vehicles to investigate the evaporative VOC emissions from China 5 and China 6 vehicles and unravel the deterioration of the evaporation control system of in-use ones [
21]. Li et al. [
24] investigated the evaporative emission performance of the same test vehicle under Euro 6D and China 6B regulations and showed that the carbon canister was more severely degraded under Euro 6D regulations due to pre-aging, and the final Euro 6D evaporative emission results were slightly higher than those of Euro 6. Liu et al. [
25] carried out the evaporation emission test of China 5 and China 6 light-duty gasoline vehicles and obtained the actual evaporation emission factor.
However, few studies have compared the emission gap between China 6 and Tier 3 vehicles. Therefore, the purpose of this study is to provide a comparison of the evaporative emissions from a selection of current China 6 vehicles with a selection of U.S. Tier 3 vehicles that are designed to meet stricter evaporative emission standards compared to China 6 [
26]. The evaporative emissions from the selected test vehicles are evaluated for both U.S. EPA and China 6 testing conditions to quantify the emission reduction benefits that could be achieved with the next generation of China light-duty vehicle evaporative emission standards. Evaporative hot soak and diurnal emissions from five test vehicles were measured by automotive manufacturers in a full-vehicle SHED. Additionally, the canister bleed emissions were quantified following the U.S. Bleed Emission Test Procedure (BETP). The data were analyzed for differences in SHED-determined hot soak and diurnal emissions and BETP-determined canister bleed emissions for vehicles designed to U.S. Tier 3 standards and China 6 standards. This study represents the most comprehensive analysis of evaporative emissions from China 6 vehicles relative to U.S. Tier 3 standards.
2. Materials and Methods
Four different automakers conducted evaporative emissions testing at their respective laboratory facilities. Individual automakers and the specific make and models of the vehicles tested are not disclosed to maintain anonymity. A matrix of requested tests and conditions to support this study was provided to the automakers, as defined in
Table 1.
Table 2 provides a summary of the evaporative emissions tests and testing conditions conducted by each automaker.
Five vehicles were tested by automotive manufacturers at their respective laboratory facilities. The tested vehicles were labeled Vehicles A–E. Three of the five vehicles (Vehicles A, B, and C) were designed to meet U.S. EPA Tier 3 evaporative emission standards. Two vehicles (Vehicles D and E) were designed to meet China 6 evaporative emission standards. Vehicle E was not tested under U.S. EPA conditions, and neither vehicle D nor E was tested for BETP at 38 °C.
The evaporative emission tests were carried out following the China 6 two-day procedures [
13] and the U.S. EPA two-day [
27] and BETP procedures [
28]. Tier 3 and China 6 vehicles were tested in a full vehicle SHED for hot soak and 2-day diurnal emissions at the U.S. EPA and China 6 test conditions. The vehicle engine purge was also monitored and recorded. The reported purge volume in liters is reported in the tables that are included in the
supplementary materials. A general summary of the test procedures is provided below; however, the test procedures as referenced should be consulted for the full details.
Table 1 specifies the conditions for the laboratory tests.
The hot soak and diurnal evaporative emission tests are used to determine the hydrocarbons produced due to diurnal temperature fluctuation, hot-soak during parking, and driving. The test consisted of the following phases, with test fuel, temperatures, and drive cycles varying based on the region of the test (e.g., U.S., E.U., China, Tables S1–S5 [
26]): (1) vehicle fuel tank conditioning with a fuel drain and 40% fill. U.S. EPA procedures specify a certification fuel of Tier 3 E10 gasoline, and China 6 procedures specify a certification fuel of China 6 E0 gasoline; (2) vehicle soak for 6–36 h, followed by a preconditioning drive consisting of test drive cycles representative of the local environment (FTP-75 for U.S. or WLTP for E.U and China); (3) vehicle fuel tank conditioning with a fuel drain and 40% fill, followed by a canister preconditioning by loading with butane until 2-g breakthrough; (4) a soak and drive consisting of test drive cycles representative of the local environment (FTP-75 for U.S. or WLTP for E.U and China). In China 6, the soak and drive is conducted at an elevated temperature of 38 °C, whereas in the U.S., it is conducted at 25 °C; (5) a 1-h hot soak loss determination, obtained by placing the vehicle in the SHED after the test drive and measuring the hydrocarbon concentrations in the SHED over one hour. In China 6, the hot soak is performed with the SHED controlled to 38 °C; (6) A vehicle soak at ambient temperature for 6–36 h followed by the 2-day diurnal emissions test, obtained by placing the vehicle in the SHED after the soak and changing the temperature of the SHED over a 24-h period following a prescribed diurnal cycle while measuring the hydrocarbon concentration of the SHED. The U.S. EPA diurnal temperature range is 22.2–35.6 °C, whereas the China 6 diurnal temperature range is 20–35 °C; (7) the test results are obtained by adding the hydrocarbon values from the hot soak test and the highest of the diurnal breathing test.
The U.S. EPA BETP is used to determine only the canister vent emissions during diurnal temperature fluctuation. The BETP is included within the U.S. EPA Tier 3 standards and requires that manufacturers measure diurnal emissions over the 2-day diurnal test procedure from only the fuel tank and the evaporative emission canister using Tier 3 certification fuel and comply with a 0.020 g/test standard for all light-duty gasoline vehicles and medium duty gasoline passenger vehicles and a 0.030 g/test standard for all heavy-duty gasoline vehicles. Canister vent bleed emissions are not due to a lack of adsorptive capacity in the canister, but rather to diffusion that transfers some of the adsorbed fuel vapors from the region of high vapor concentration (the tank side of the canister) to the region of low vapor concentration (the vent side of the canister) [
29]. To minimize these canister bleed emissions and comply with the U.S. Tier 3 BETP standard, the evaporative emission canisters of Tier 3 vehicles contain a secondary element, either attached to the canister or integrated into the design of the canister. This secondary element is designed to purge readily so that it can capture any bleed emissions that diffuse from the canister vent.
The U.S. BETP test procedures were first adopted by the California Air Resources Board as part of the LEV III program. These procedures, which are defined in PART III.D.12 of the California Evaporative Emission Standards and Test Procedures for 2001 and Subsequent Model Motor Vehicles [
28], were also adopted by the U.S. EPA for Tier 3. The procedures allow manufacturers the choice of three different methods for capturing the canister vent hydrocarbon bleed emissions: (1) hydrocarbon capture of the canister vent emissions in an environmental chamber with a Tedlar or equivalent bag, commonly referred to as the sampling bag method; (2) hydrocarbon capture of the canister vent emissions in a diurnal evaporative emission measurement enclosure, commonly referred to as the SHED method; and (3) continuous analysis of canister vent emissions using a FID (requires advanced approval by a regulatory authority), commonly referred to as the point-source method.
The procedures of the BETP are similar to the 2-day diurnal test, with the exception that only the canister vent emissions are measured via one of the options described above. (1) Carbon canister system stabilization. The carbon canister system shall be stabilized to a 4000-mile test condition either on the vehicle or with an alternative carbon canister system purge/load cycling with fuel vapor. (2) Fuel tank drain, 40% fill, and soak to stabilize the fuel system. (3) Carbon canister loading, soak, and purge. The carbon canister is loaded with a mixture of 50/50 nitrogen/fuel vapor until 2-g breakthrough. The canister is then soaked for a minimum of one hour before purging the canister with a drive cycle representative of the local conditions. The U.S. EPA BETP preconditions the canister using an FTP-75 drive cycle at 25 °C and uses Tier 3 E10 test fuel, whereas the China 6 BETP procedure used a WLTP ORVR drive cycle (Low + Medium + High + Extra High) at 25 °C with China 6 E0 test fuel. (4) 2-day diurnal temperature cycling and measurement of canister vent emissions using either a mini-SHED, micro-SHED, or sampling bag method. The U.S. EPA diurnal temperature range for the BETP test is 22.2–35.6 °C, whereas the China 6 diurnal temperature range is 20–35 °C. The highest of the two-day hydrocarbon concentration is recorded as the BETP test result.
3. Results
3.1. Summary of Full Vehicle SHED Hot Soak and Diurnal Evaporative Emissions
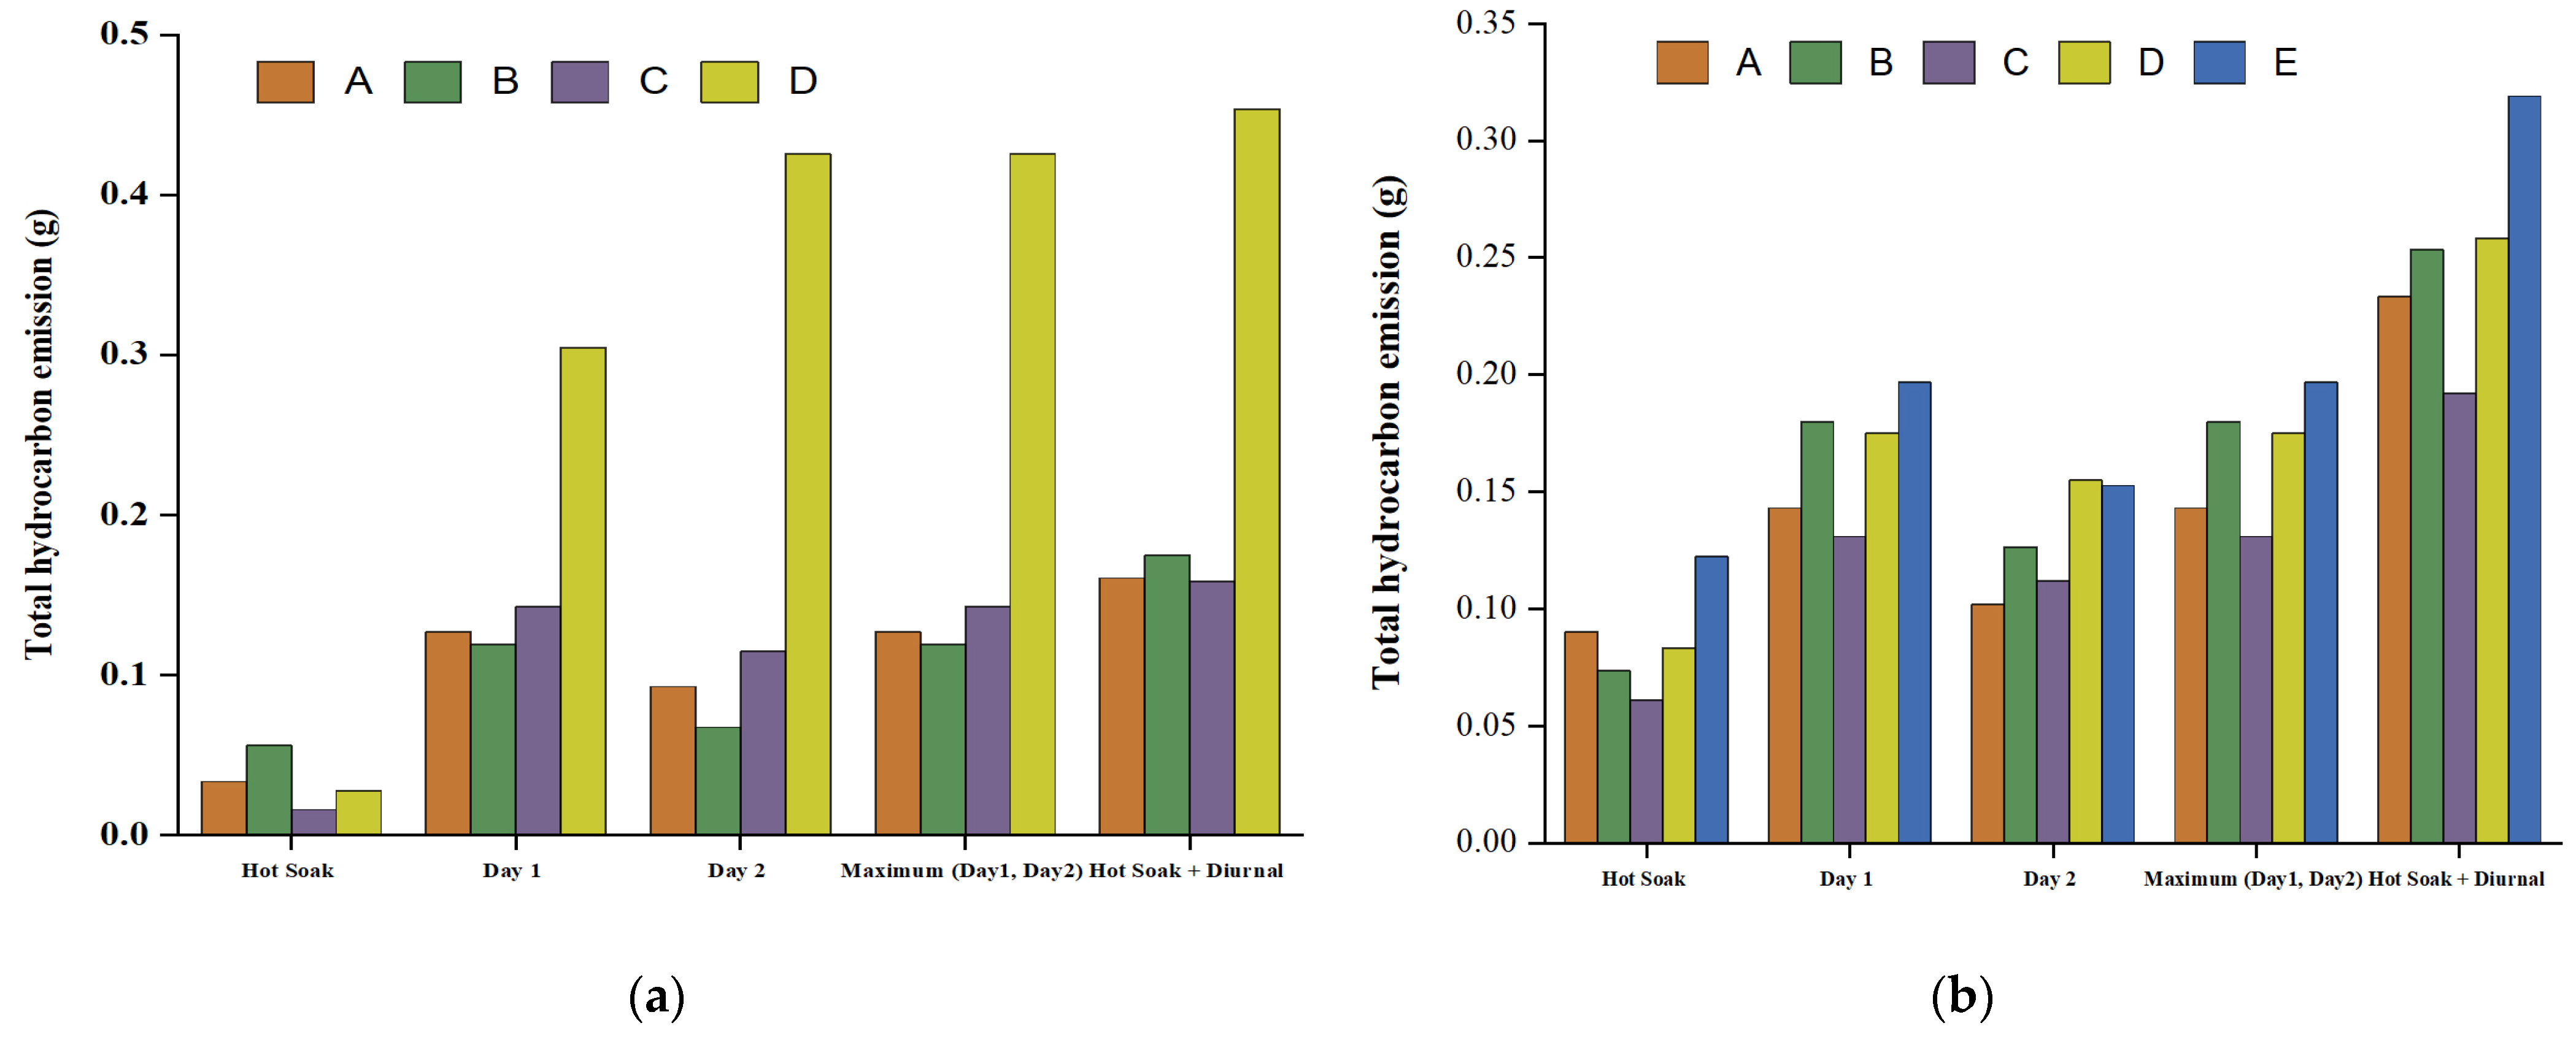
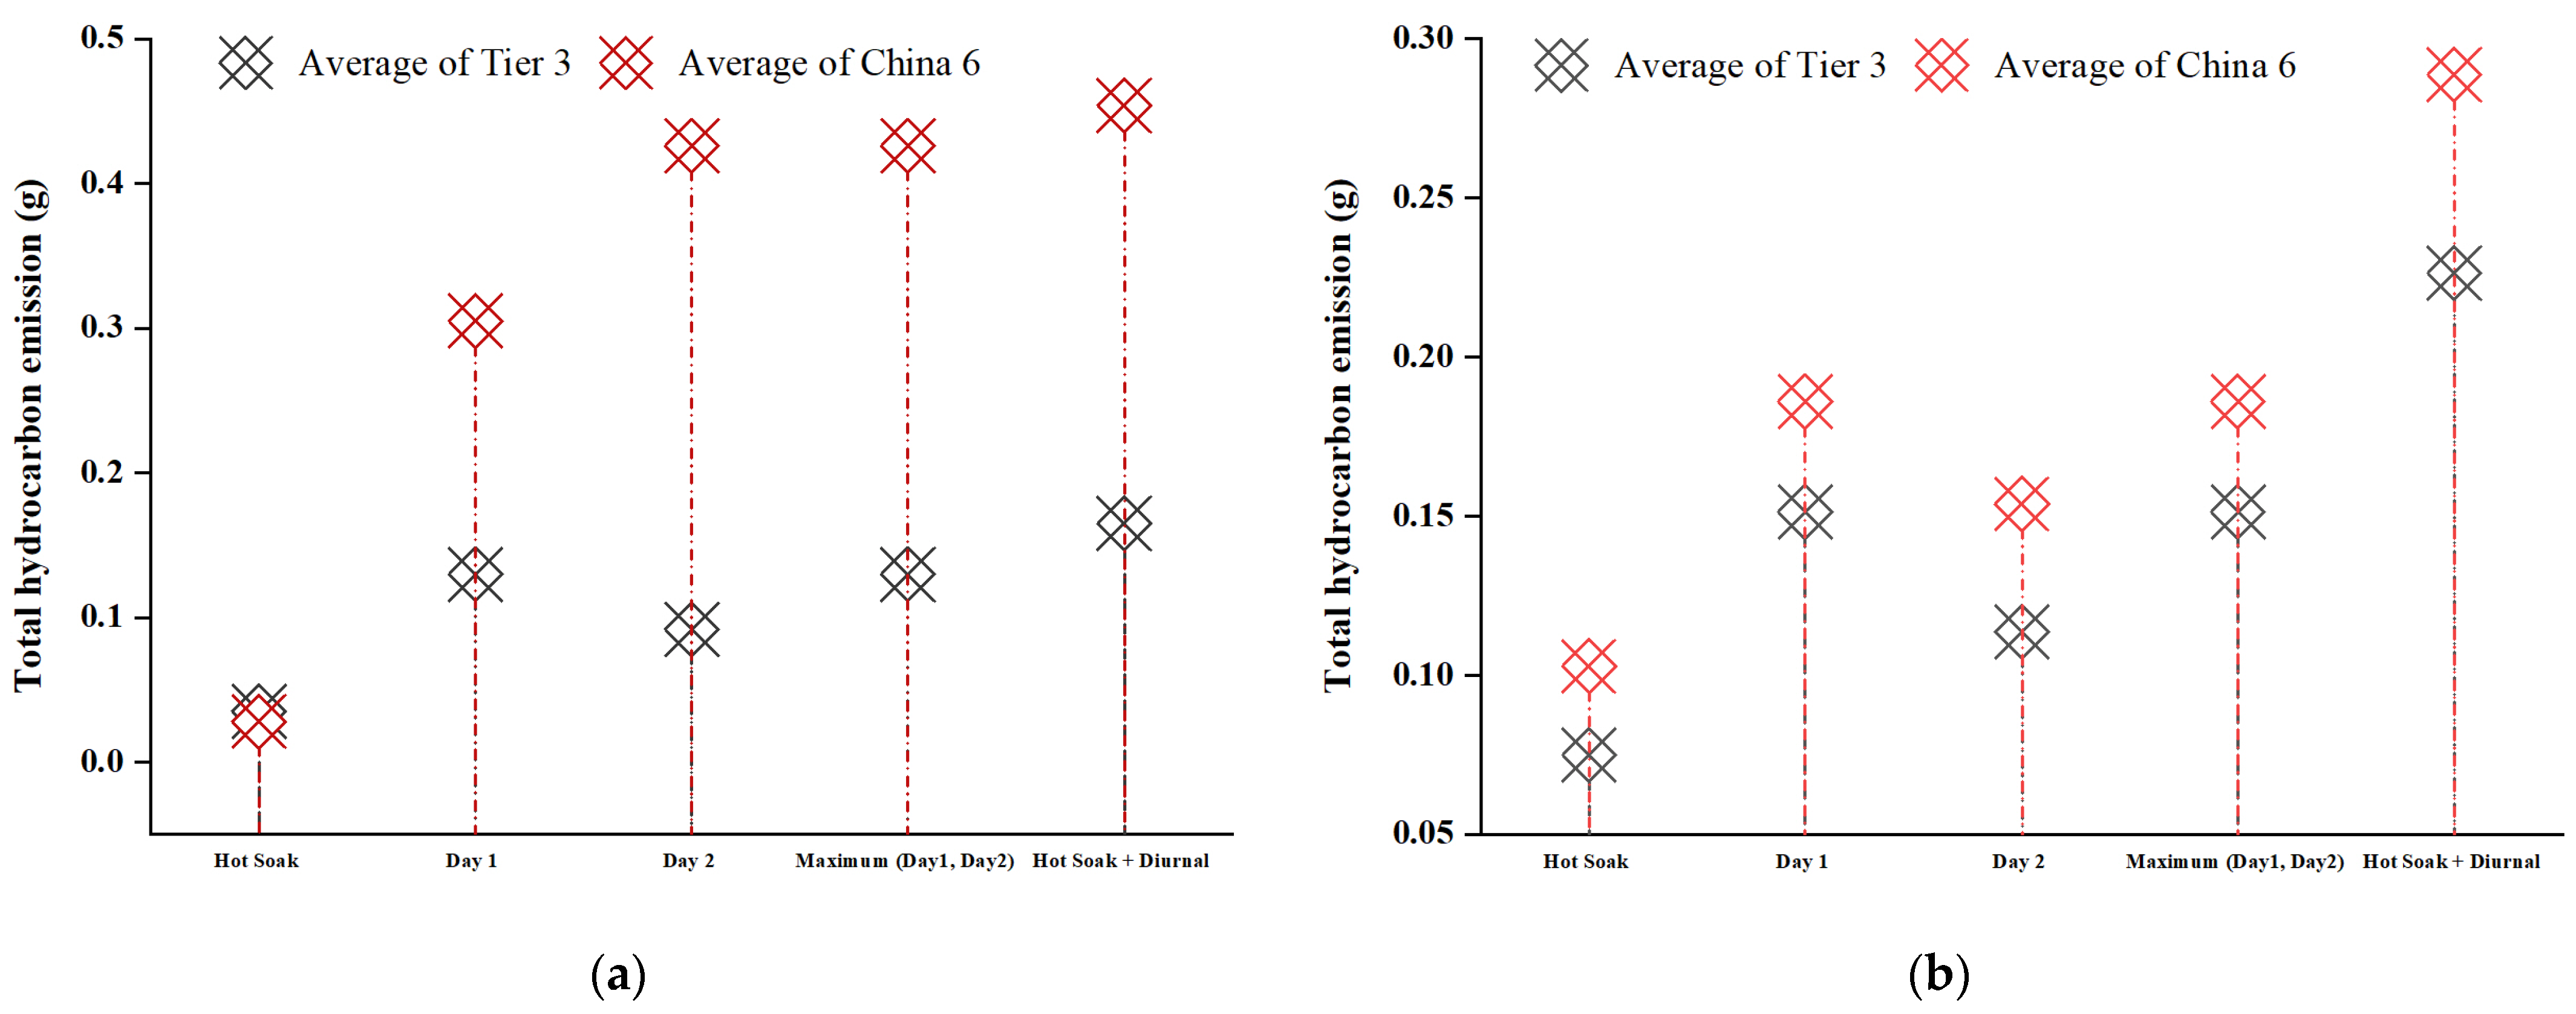
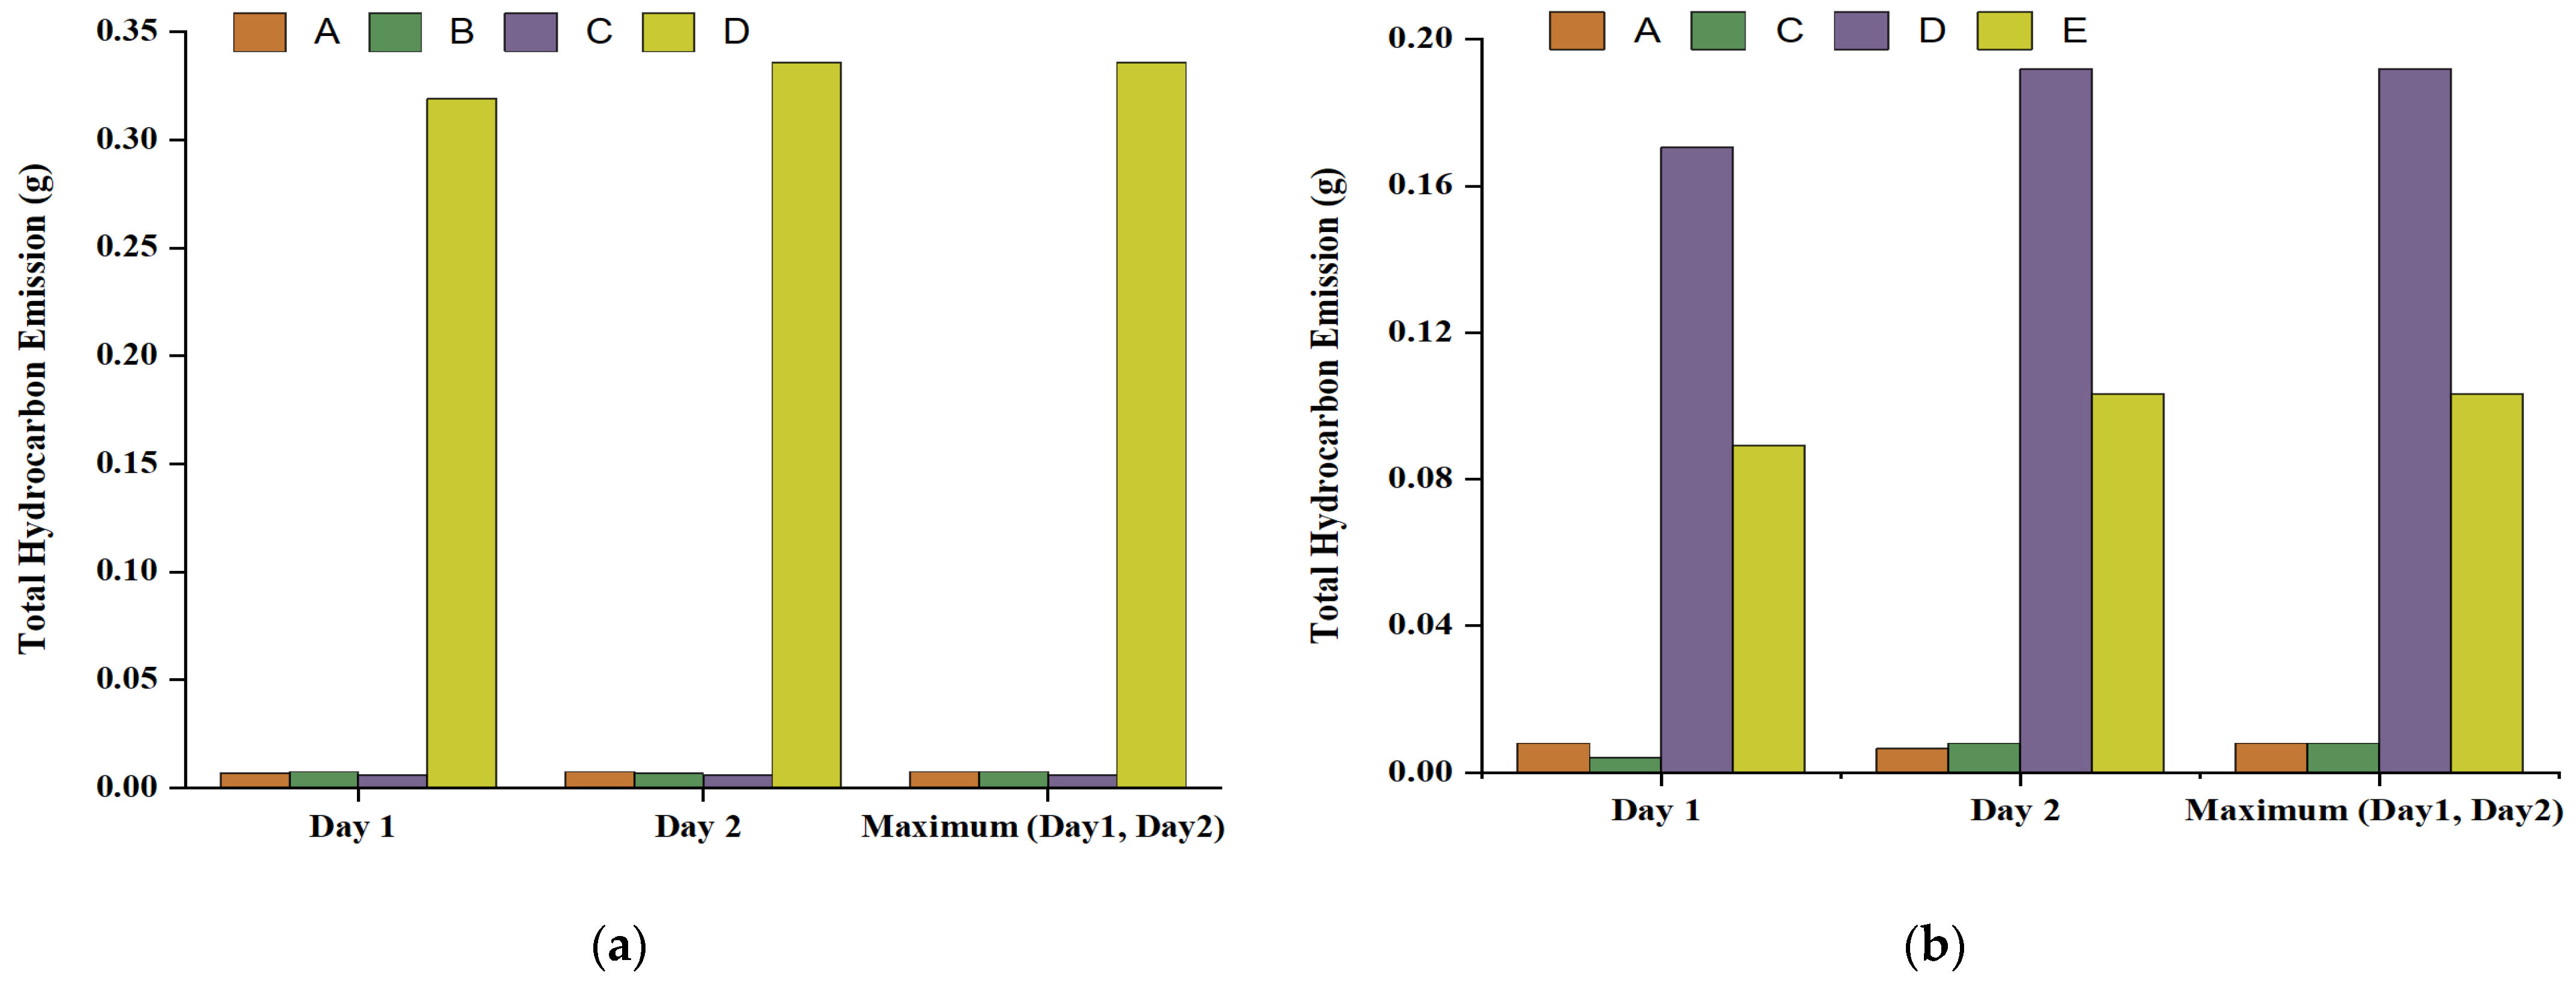
A summary of the hot soak, day 1 and day 2 evaporative emission results is provided in
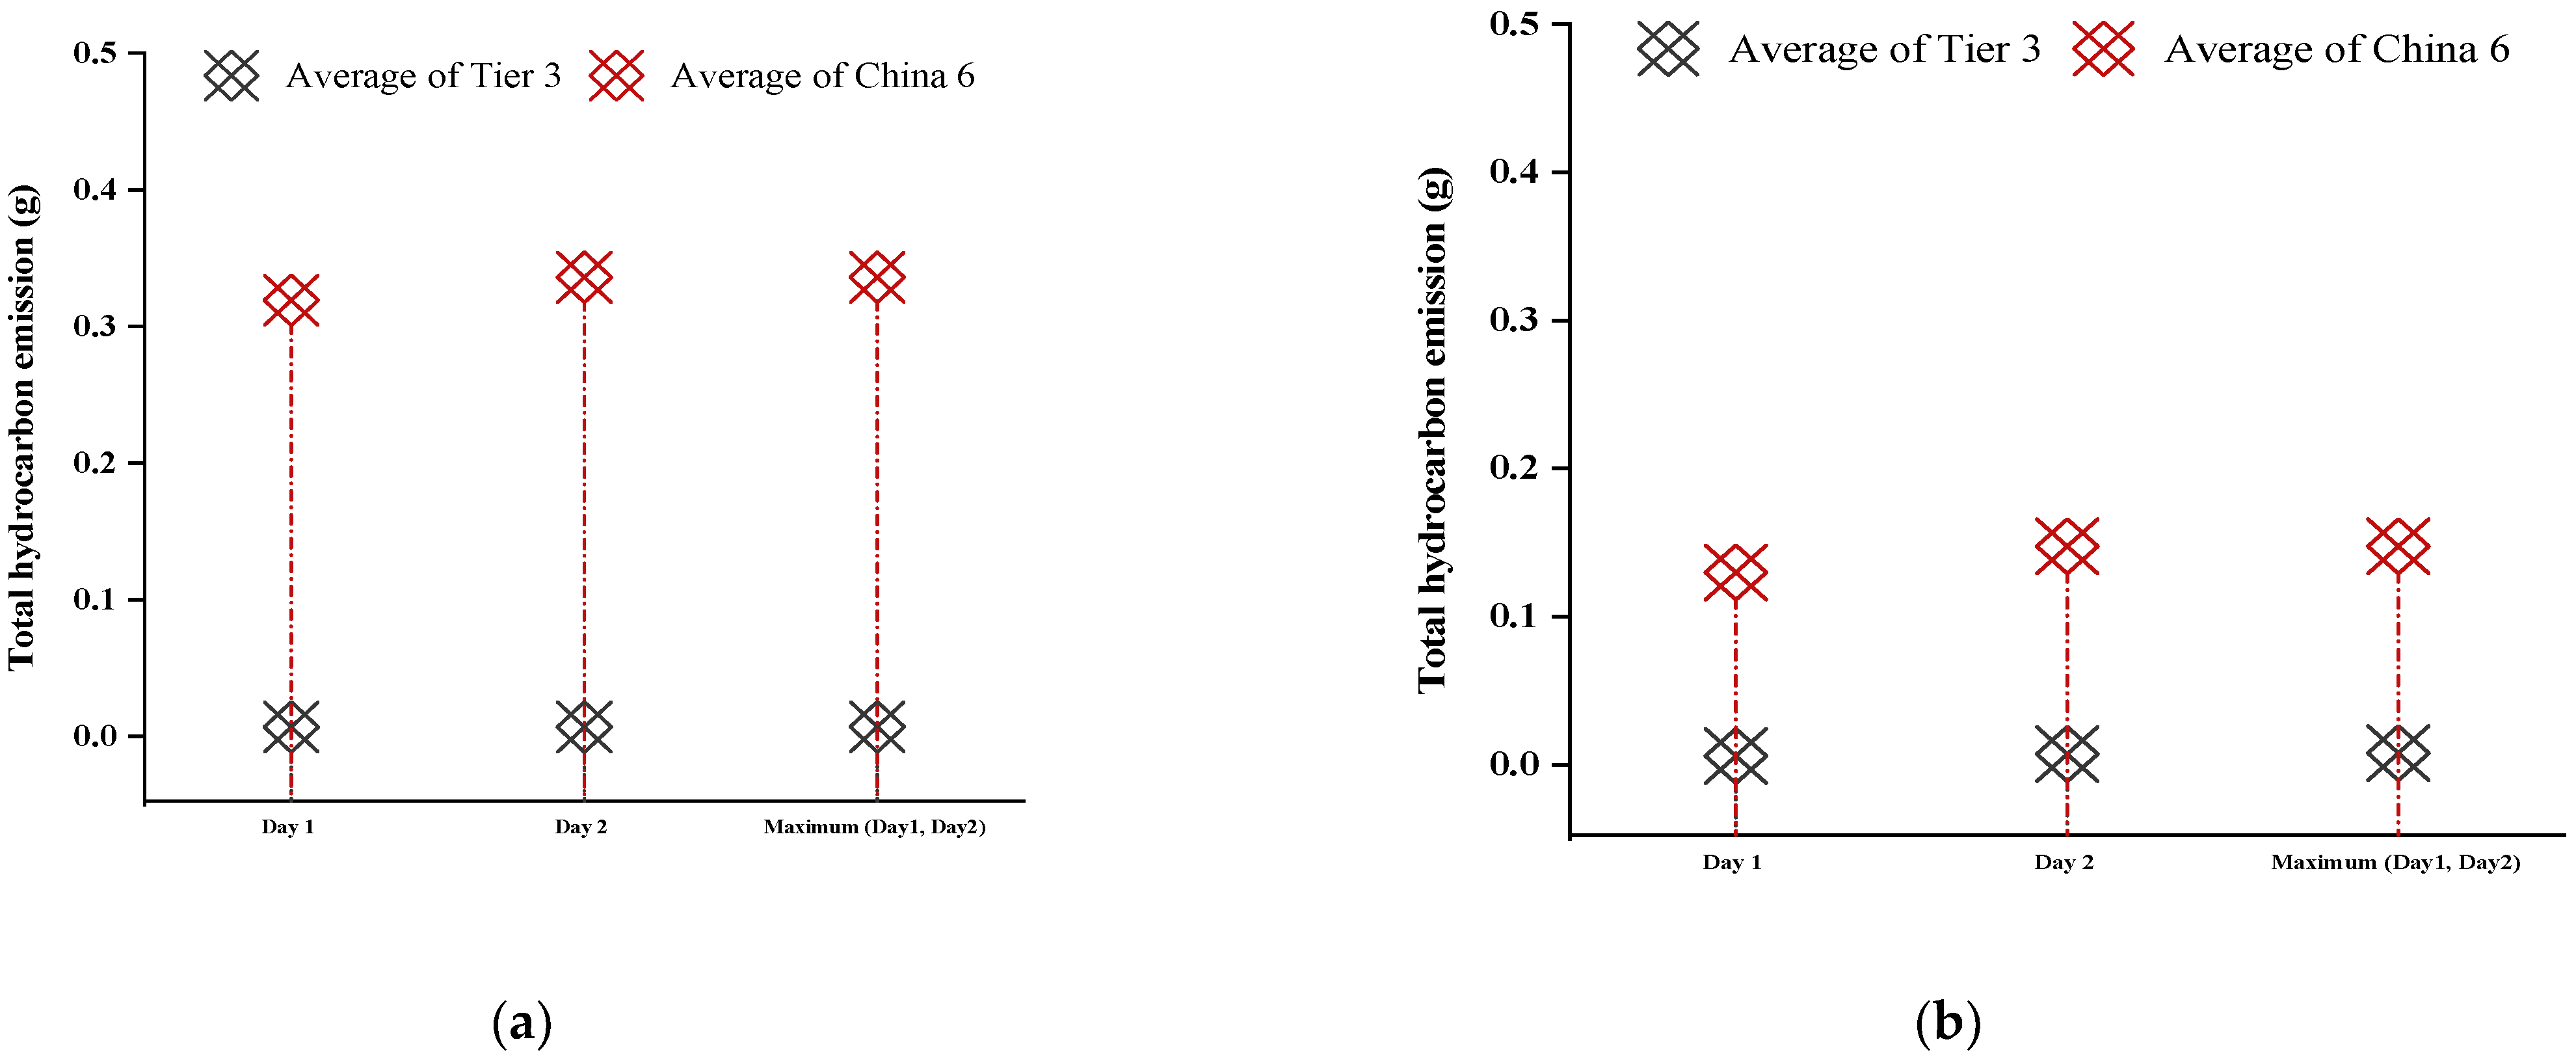
Figure 1 for all five test vehicles for both the U.S. EPA Tier 3 and China 6 test conditions. The average evaporative emission results for the three vehicles designed to U.S. EPA Tier 3 standards and the two vehicles designed to China 6 standards are provided in
Figure 2. For the U.S. EPA test condition, the three vehicles designed to the Tier 3 standards (Vehicles A, B, C) had an average hot soak + diurnal emission of 0.165 g, which was 63.7% lower than the 0.454 g observed from Vehicle D tested at the same conditions. Vehicle E was not tested in the U.S. EPA test condition. For the China 6 test condition, the three vehicles designed to the Tier 3 standards (Vehicles A, B, C) had an average hot soak + diurnal emission of 0.226 g, which was 21.6% lower than the 0.289 g observed from China 6 vehicles tested under the same conditions.
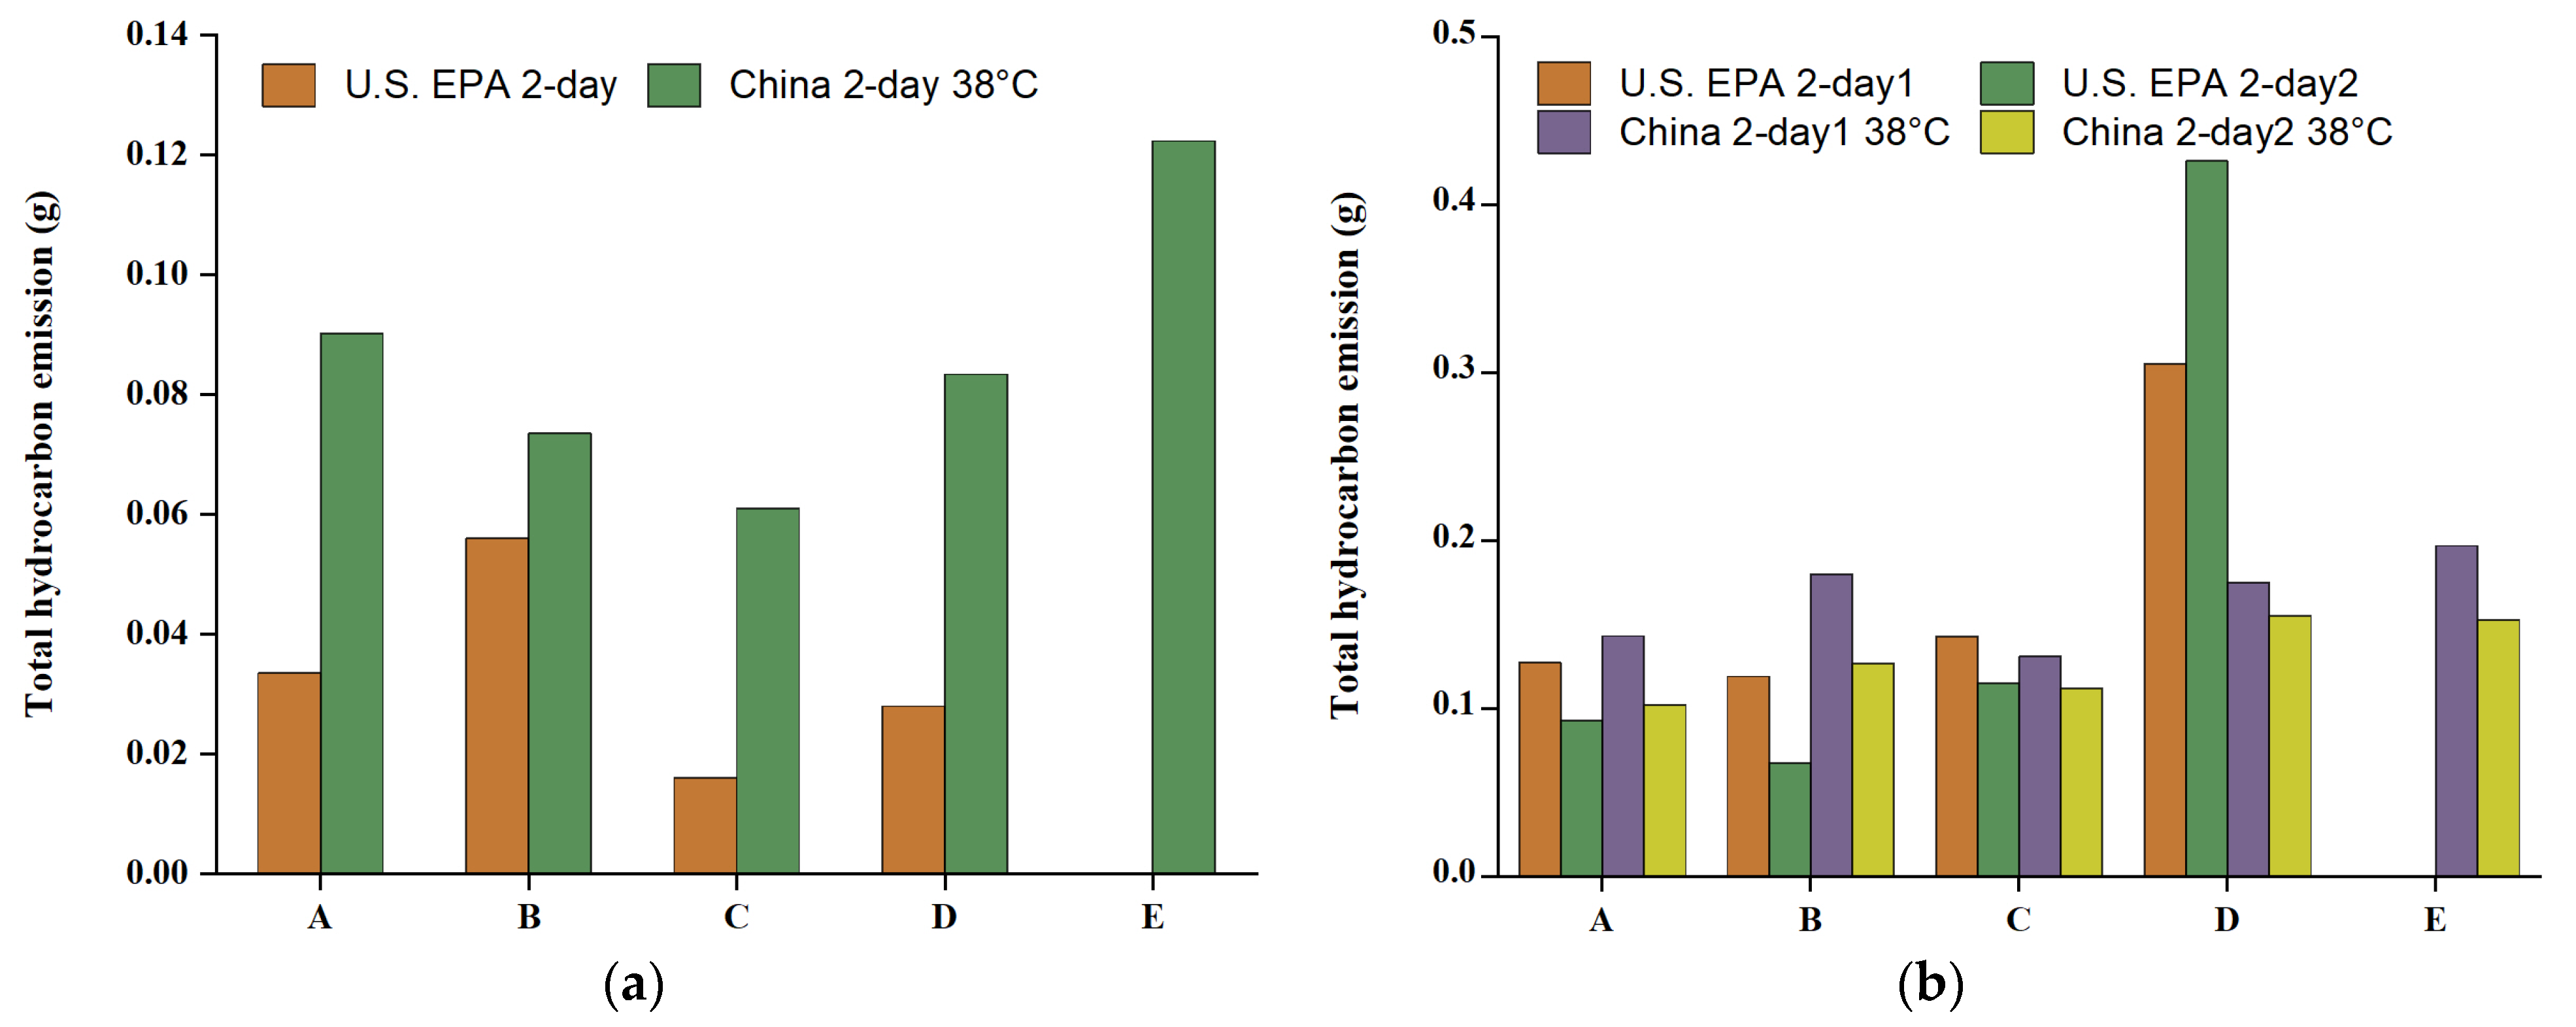
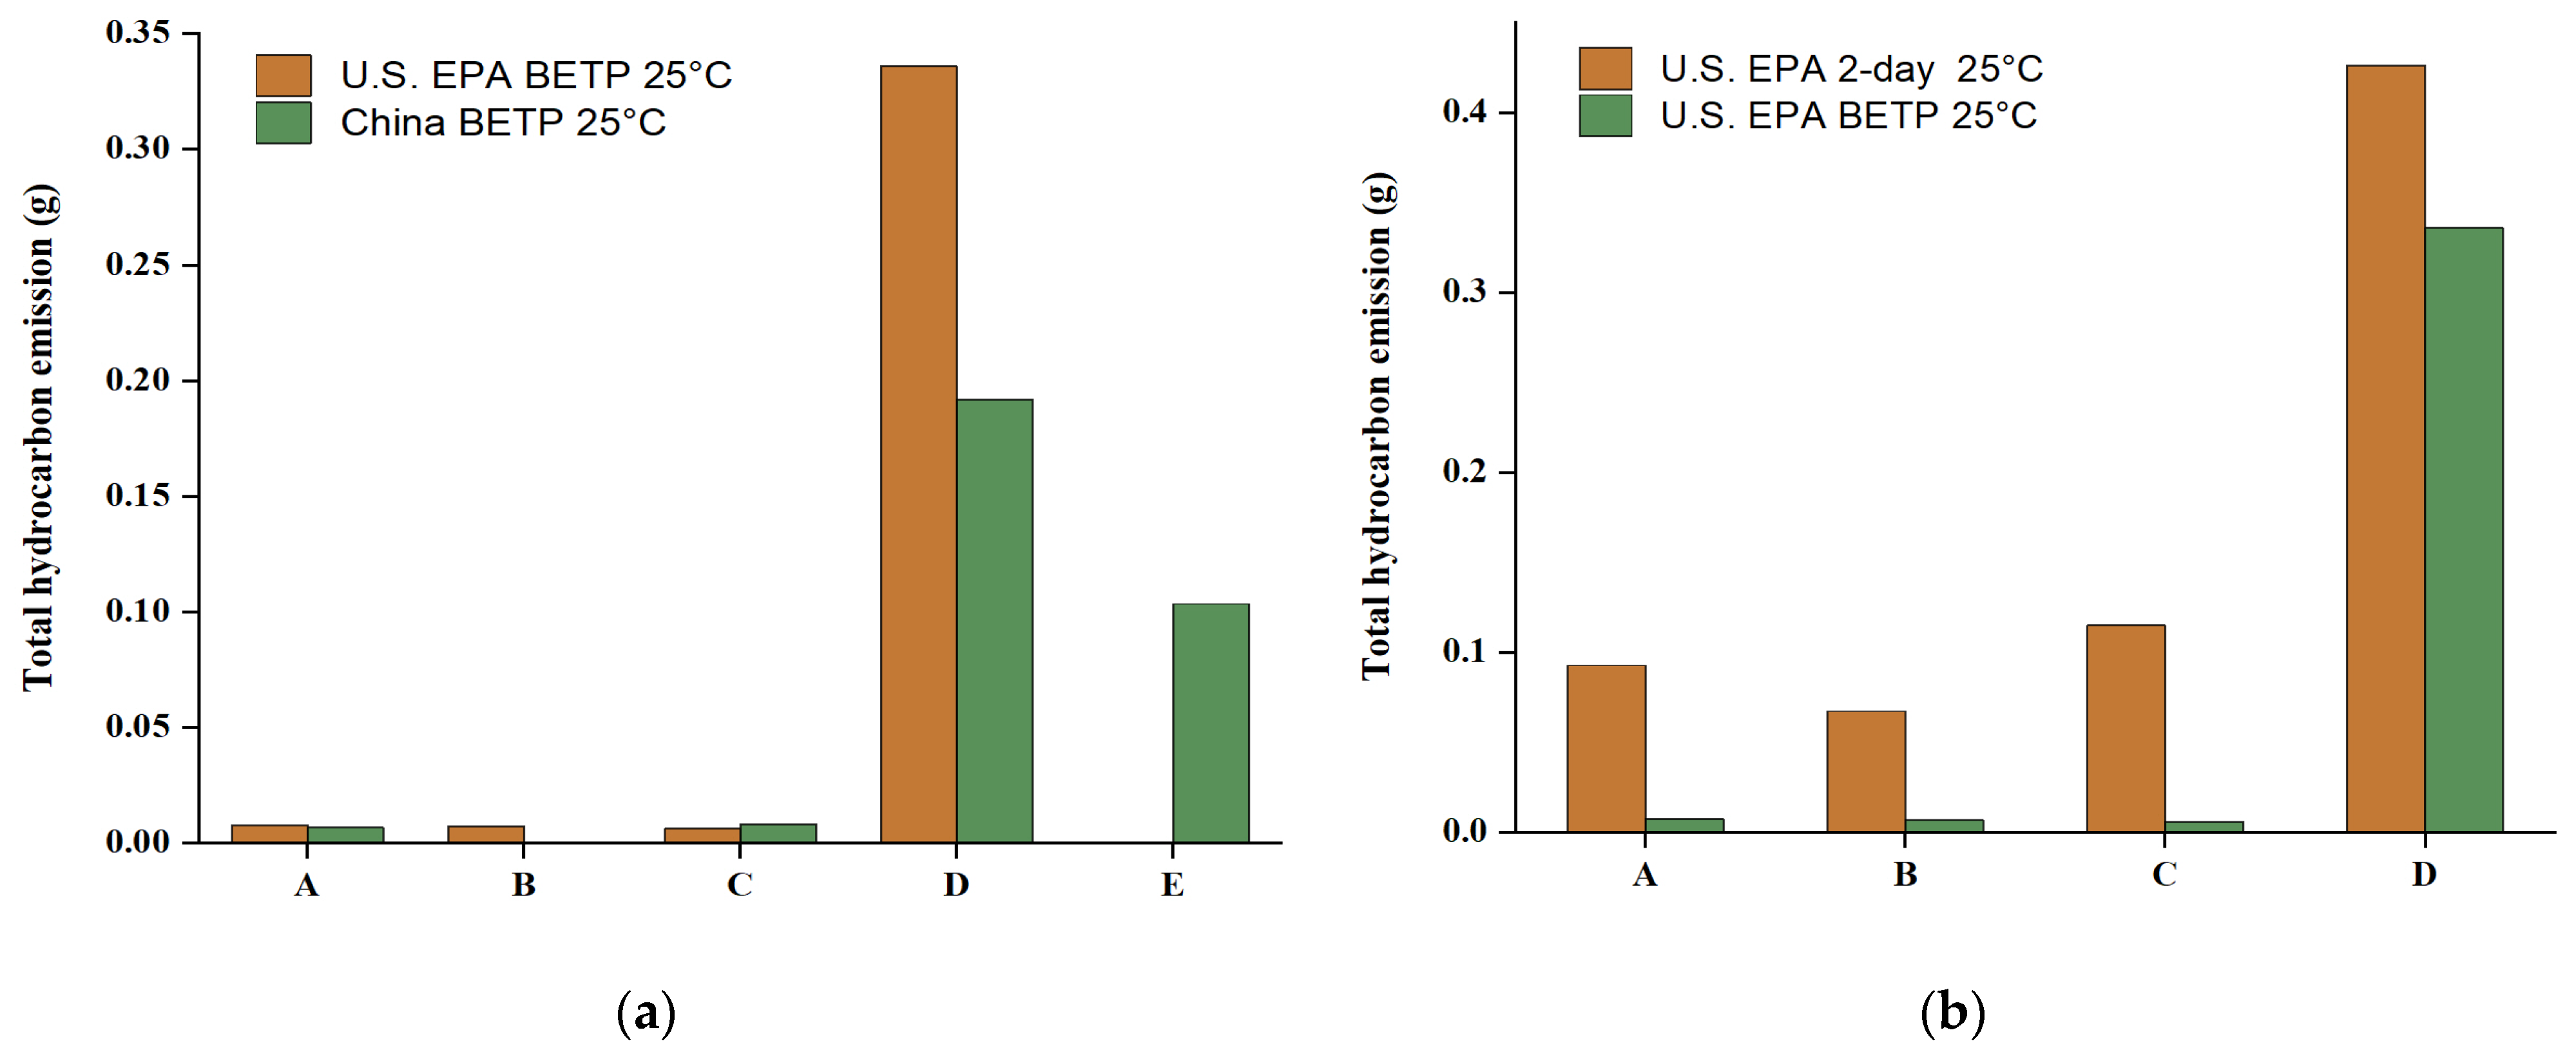
Figure 3a provides the hot soak results for the vehicles tested, with the average value for Tier 3 vehicles being 0.035 g under EPA Tier 3 test conditions and 0.075 g under China 6 test conditions, which was 2.13 times the Tier 3 test conditions. The hot soak value for vehicle D under Tier 3 test conditions was 0.028 g, and the average value under China 6 test conditions was 0.103 g, which was 3.67 times the Tier 3 test conditions. It can be seen that the hot soak emissions under the China 6 test procedure were significantly higher due to the driving cycle of carbon canister desorption taking place at the high temperature of 38 °C, which exacerbated the heat load placed on the vehicle, thus releasing more VOC emissions (including vehicle background VOCs) during the subsequent 1 h hot soak.
In order to indirectly control the running loss of evaporation emissions, a 38 °C high temperature pretreatment driving cycle was introduced in the China 6 test to increase the vehicle heat radiation simulation and strengthen the requirements for evaporation control of the whole vehicle [
13]. It is also obvious from
Figure 3a that there was a difference between the hot soak emissions after pretreatment at FTP 25 °C ambient temperature and WLTC 38 °C high temperatures. The amount of carbon canister purge was even more pronounced at the high temperature, as the desorption process of the carbon canister to fuel vapor is a heat absorption process. The high temperature was more favorable to the desorption performance of the carbon canister at the same rate, which was in great contradiction to the actual vehicle operating conditions. However, the high-temperature pretreatment exacerbated the heat radiation to the vehicle, and this high temperature was more likely to stimulate emissions of background VOCs from the vehicle itself, not evaporative emissions from the fuel system.
Figure 3b provides the diurnal emission results for the different vehicles under U.S. EPA Tier 3 and China 6 test conditions. As can be seen, regardless of which test procedure was used for the Tier 3 vehicles, the diurnal emissions were basically below 0.2 g/24 h for day 1 and day 2, with lower emissions for day 2 compared to day 1. The difference in diurnal emissions was more pronounced for the China 6 vehicles D on the different test procedures. In particular, the diurnal emissions were also below 0.2 g/24 h for the China 6 vehicles under the China 6 test conditions, which was basically the same as the performance of Tier 3 vehicles. When the Tier 3 test procedure was used, the diurnal emissions of China 6 vehicles on both days were significantly higher than the other vehicles, and it was clear that the diurnal emissions on the first day were much lower than the emissions on the second day.
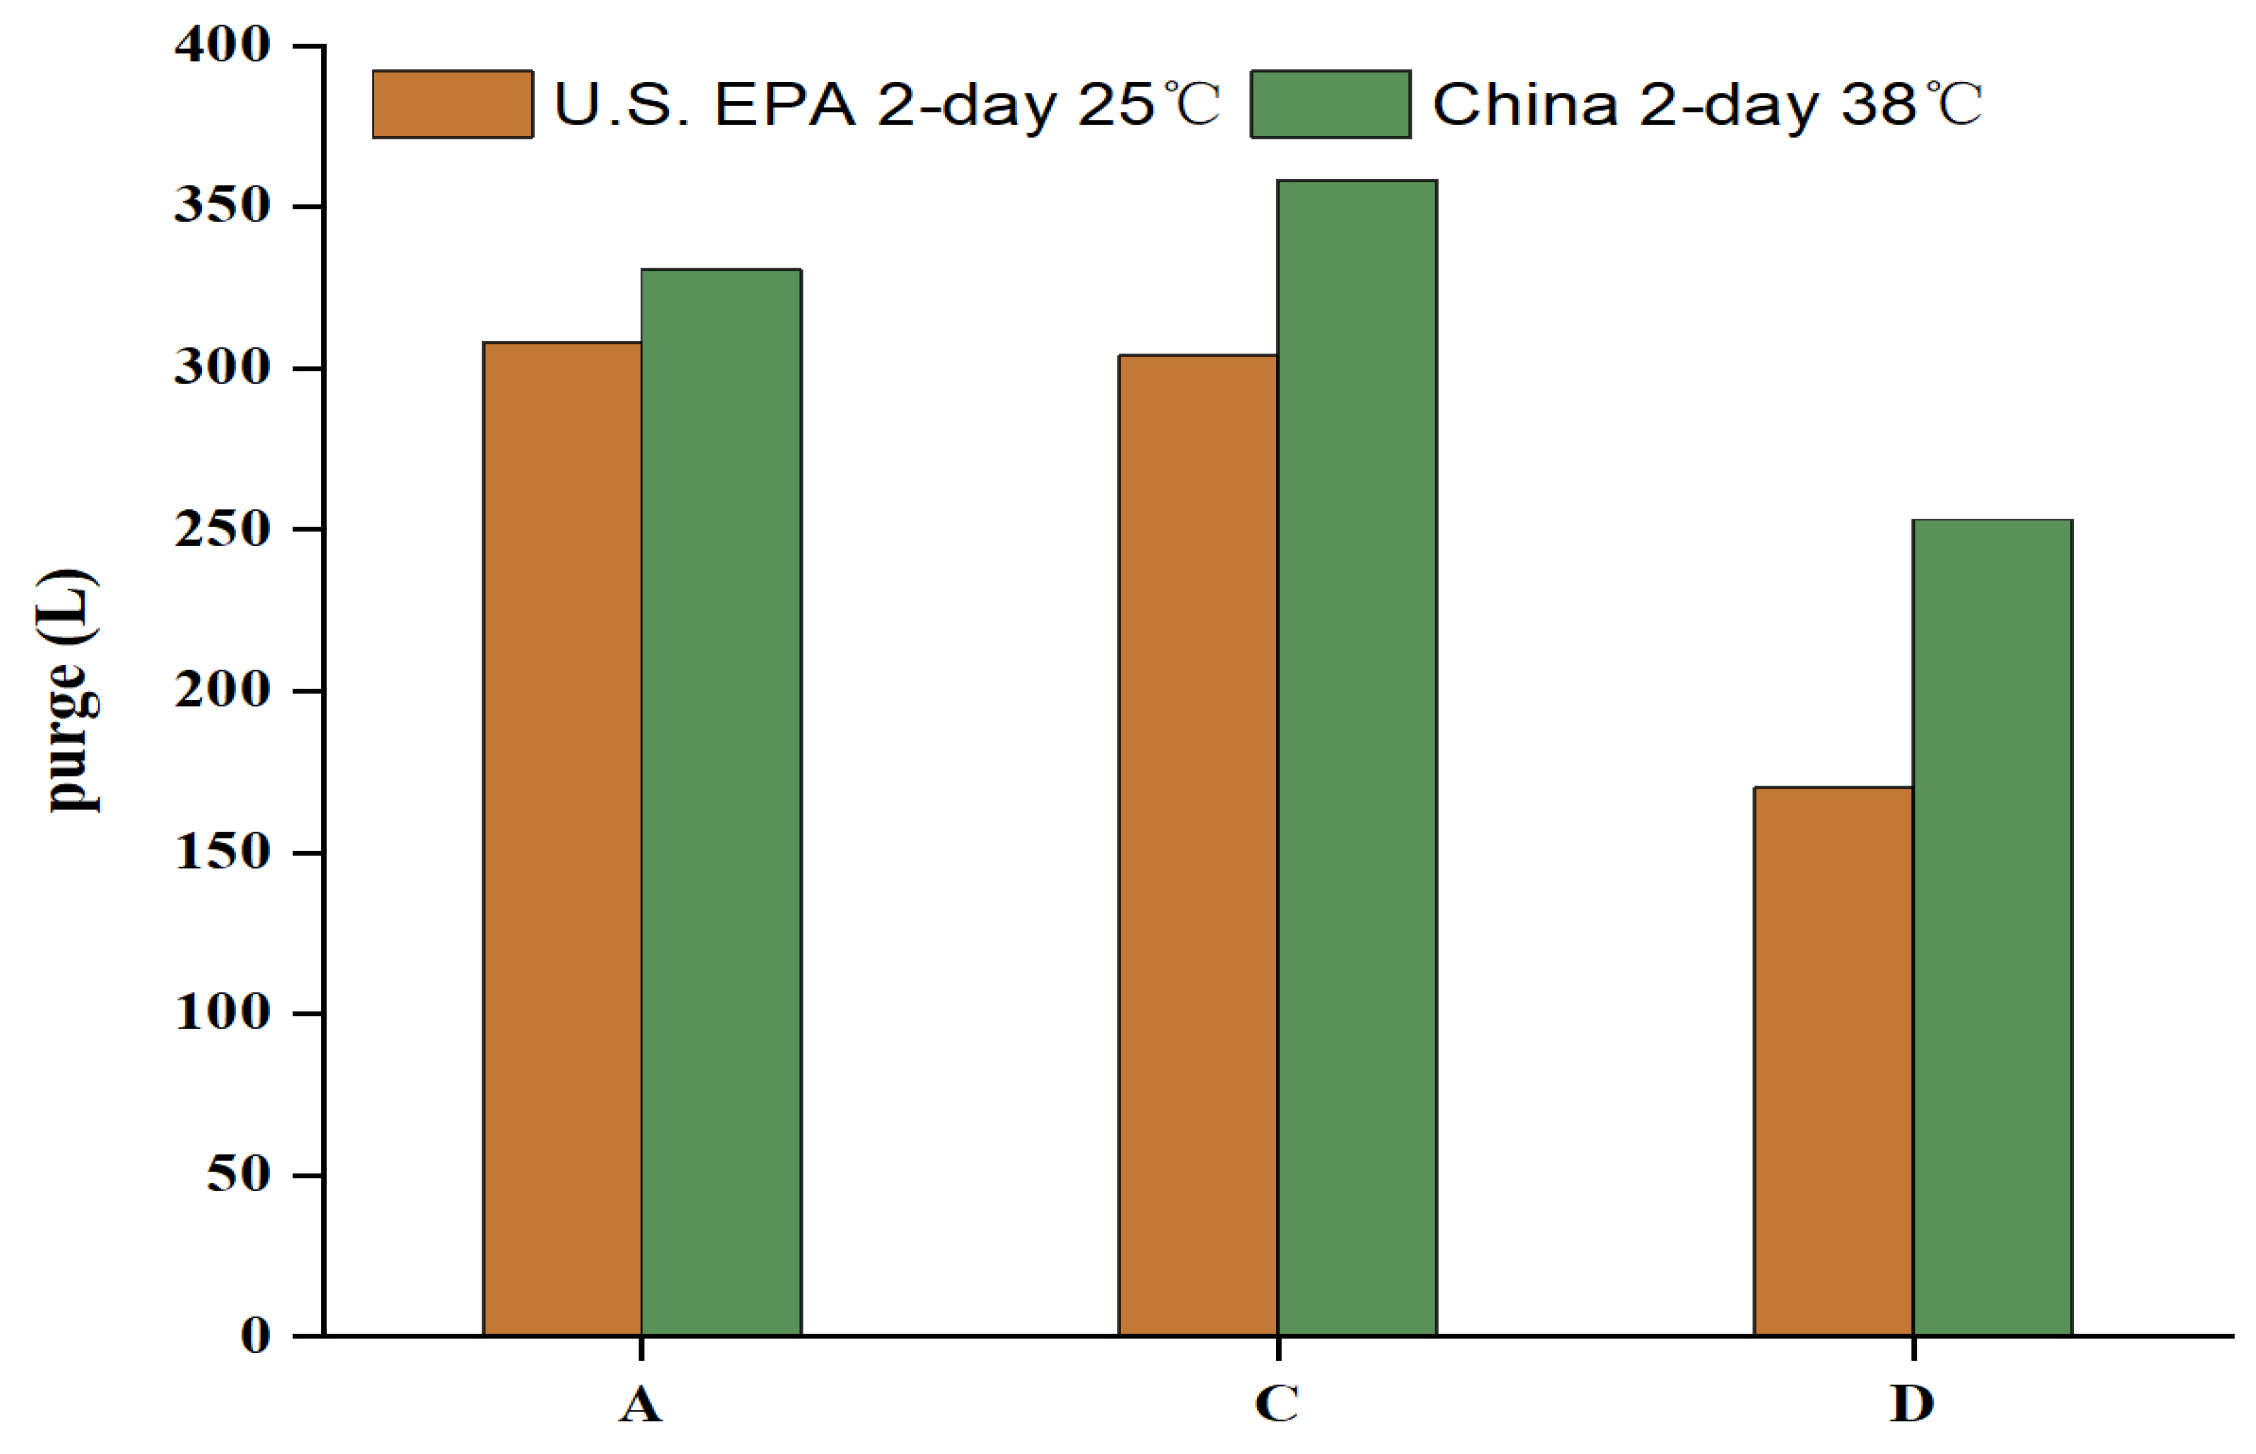
The purge cycle prior to the hot soak and diurnal tests directly determines the initial state of the vehicle’s carbon canister, as shown in
Figure 4. The different driving cycles play a decisive role in the actual amount of vehicle purges. As can be seen in
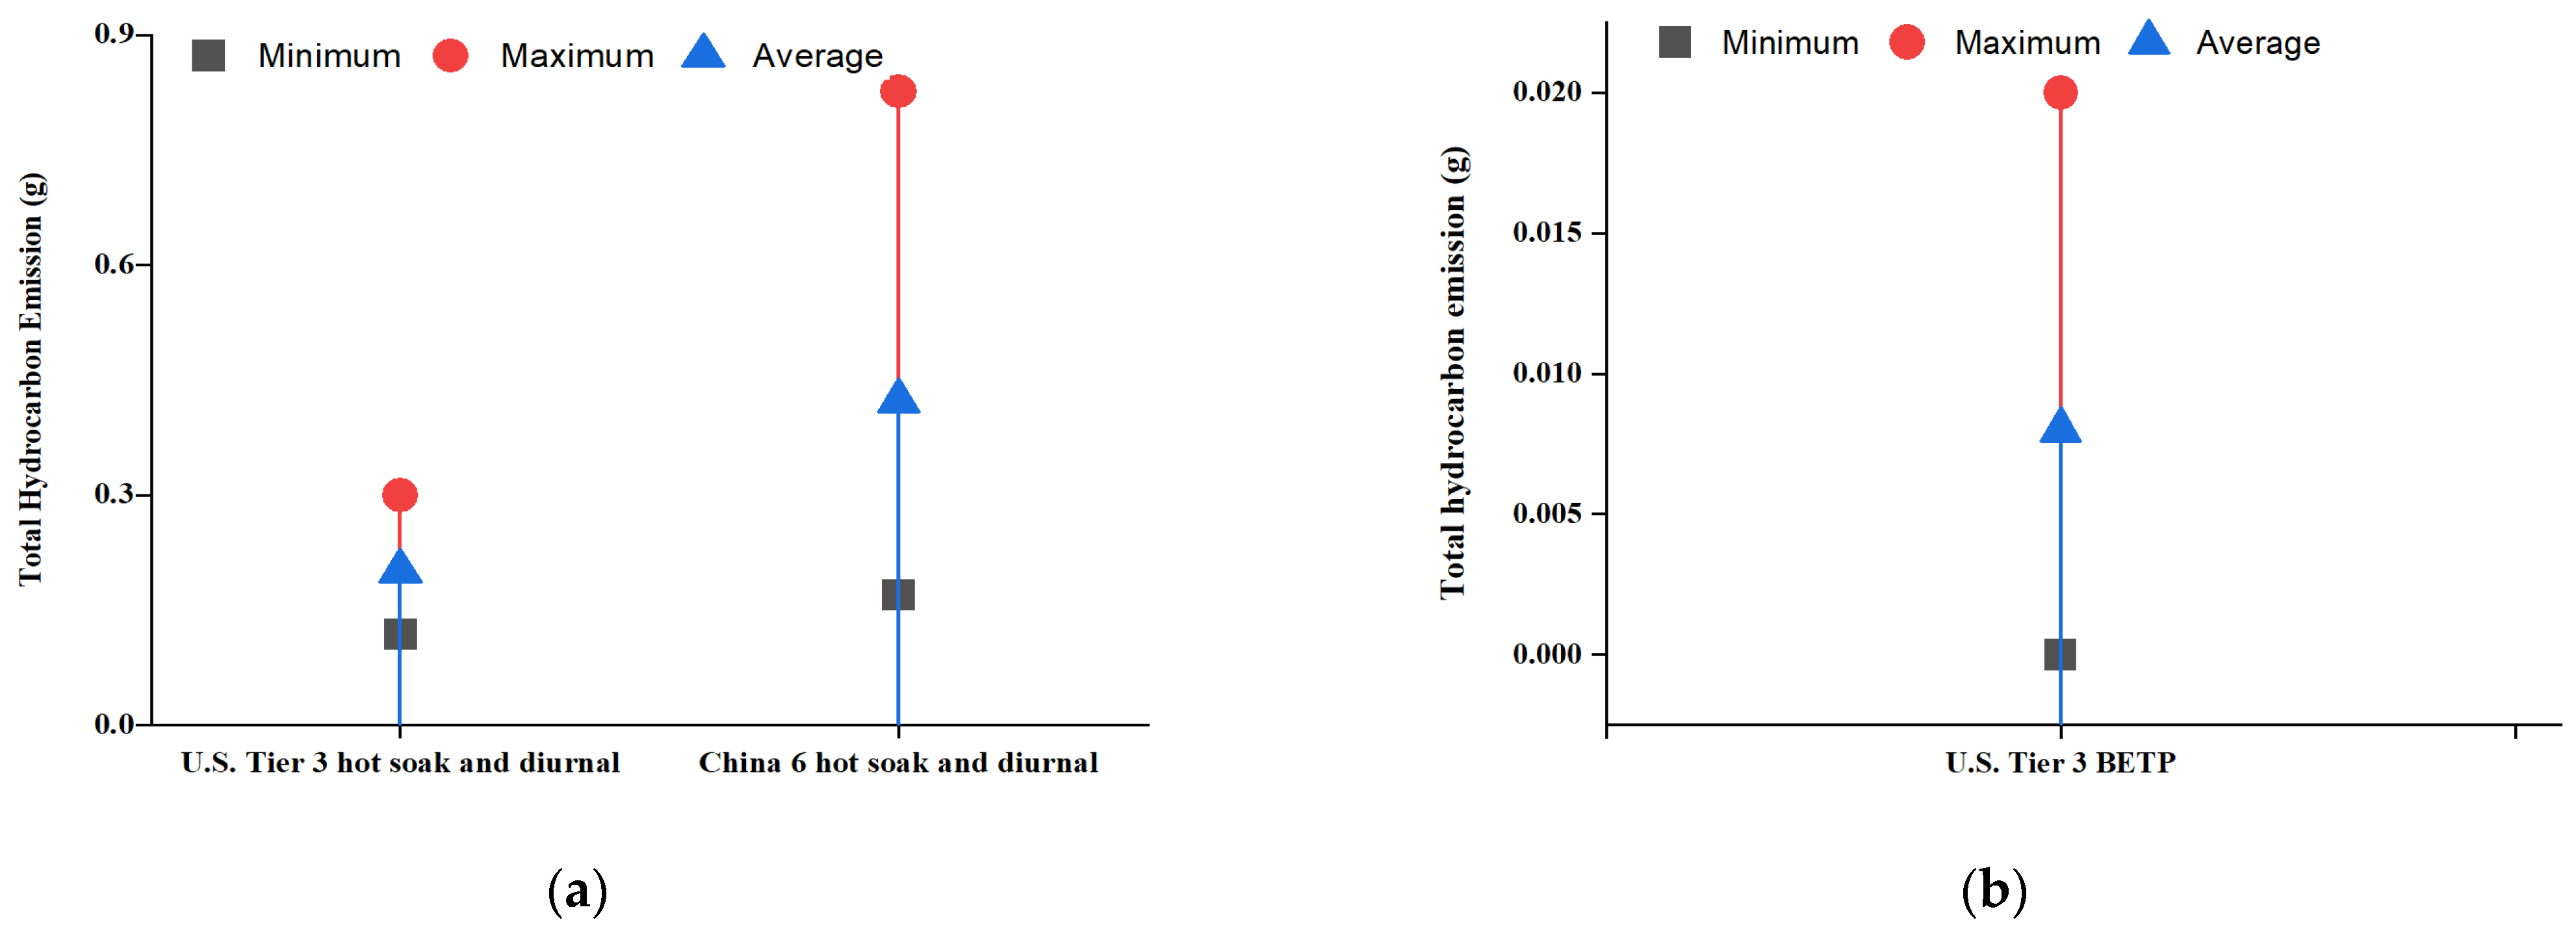
Figure 4, the U.S. EPA Tier 3 test procedure based on FTP-75 conditions showed a lower purge volume than the China 6 test procedure on WLTC conditions in all three vehicles tested. The difference was particularly noticeable for the China 6b vehicle D. For either driving cycle, Tier 3 vehicles A and C showed significantly higher purge volumes than the China 6 vehicles D. The Tier 3 vehicles purged between 283 and 358 L, and Vehicle D purged 170 L at 25 °C in FTP-75, which was 33% less than the China 6 certification cycle of 253 L purged (38 °C in WLTC). Clearly, there were some differences in the calibration of the amount of purge volume for China 6 vehicles relative to Tier 3 vehicles, with a lower purge under off-cycle test conditions. Although the hot soak emissions for Vehicle D were similar to those for Tier 3 vehicles (A, B, and C), diurnal emissions were significantly higher, 2.4 times (0.305/0.12975) on Day 1 and 4.6 times (0.426/0.092) on Day 2, compared to the average for Tier 3 vehicles. Additionally, the higher diurnal evaporative emissions observed from vehicle D can be explained by an additional factor: the smaller carbon canister capacity of the China 6 design relative to Tier 3.
All three vehicles designed for Tier 3 (A, B, C) demonstrated the ability to meet a 0.350 g 2-day full vehicle hot soak + diurnal test limit under both U.S. Tier 3 and China 6 test conditions. A comparison of hot soak values suggests that hot soak was, on average, 40–75 mg higher for the China 6 test condition (hot soak at 38 °C) compared with the U.S. EPA test condition (hot soak at 25 °C). However, the increase in hot soak at elevated temperatures does not impact the ability of Tier 3 or Tier 2 vehicle to meet a 0.350 g standard.
The hot soak evaporative emissions for Vehicle D (0.083 g) and Vehicle E (0.122 g) at the China 6 test conditions (38 °C) were within the averages reported for the China 6 certifications (a range of 0.09–0.12 g based on canister size) and were also consistent with the 0.16 ± 0.08 g of hot soak reported from a study of six China 6 vehicles by Liu et al. [
21]. The diurnal evaporative emissions (including the addition of 0.06 g for a default deterioration factor (DF)) were 0.235 g for Vehicle D and 0.257 for Vehicle E. These diurnal emissions with the addition of a DF were consistent with the averages reported in the China 6 certifications (a range of 0.26–0.28 g based on canister size) and the emission factors for diurnal breathing loss (DBL) of 0.25 ± 0.13 g reported for the six China 6 vehicles studied by Li et al. [
21].
These data confirm that implementation of an emission limit equivalent to Tier 3 is feasible for China test conditions and will result in an additional 22% reduction of hot soak and diurnal evaporative emissions. As noted above, it is important to note that when Vehicle D was tested in the U.S. EPA test condition, representing an off-cycle test condition for this vehicle, the diurnal emissions increased by a factor of 2.4 times (0.426 g/0.175 g) due to the vehicle purging 33% less during this off-cycle condition. Therefore, it is important that vehicle purge calibration accommodate ambient and elevated temperatures.
3.2. Summary of Canister Bleed Emissions
Tier 3 and China 6 vehicles were tested for canister bleed emissions at the U.S. EPA conditions and for conditions representative of China 6 test conditions. A summary of the canister bleed evaporative emission results is provided in
Figure 5 for all five test vehicles for both the U.S. EPA Tier 3 BETP and China 6 BETP test conditions. The average canister BETP emissions for the three vehicles designed to U.S. EPA Tier 3 standards (A, B, C) and the two vehicles designed to China 6 standards (D, E) are provided in
Figure 6. Vehicles designed to U.S. EPA Tier 3 standards all included a bleed emission control element in addition to the canister, whereas the two vehicles designed to China 6 standards did not include any bleed emission control elements.
For the U.S. EPA BETP, the three vehicles designed to the Tier 3 standards (A, B, C) had an average canister bleed emission of 0.07 g, which was 98% lower than the 0.336 g observed from Vehicle D tested under the same conditions. Vehicle E was not tested under the U.S. EPA BETP test conditions. These data confirm that Tier 3 vehicles with a bleed emission control element achieve near-zero canister evaporative emissions. For the BETP at test conditions representative of China 6 (WLTP ORVR purge at 25 °C), the three vehicles designed to the Tier 3 standards (A, B, C) had an average canister bleed emission of 0.08 g, which was 95% lower than the 0.148 g observed from the average of Vehicles D and E tested at the same conditions.
The current U.S BETP test procedure was based on the FTP purge cycle and ambient temperature, whereas China’s LDV emission standard was based on WLTC and had a 38 °C high-temperature purge. Therefore, the localized BETP test was based on the equivalent switching of the WLTC-based purge cycle.
Figure 7a provides the analysis based on the higher BETP emission results. It can be seen that for Tier 3 vehicles (A, B, and C), the BETP test results did not change significantly under any of the purge cycles, being well below 0.02 g/24 h, while for the China 6 vehicles, it can be seen that the BETP emissions under the FTP purge cycle were much higher than those under the WLTC cycle, at 75.13%, mainly due to the purge calibration of China 6 vehicles was carried out under WLTC conditions.
Figure 7b shows a comparison of the BETP and diurnal emission results under the EPA test procedure using the FTP purge cycle. As can be seen from the results, the difference between the bleed emissions and diurnal emissions results with the bleed emission control element was substantial, with the bleed emission basically being less than 10% of the diurnal emissions. In contrast, the carbon canister bleed emissions from China 6 vehicles accounted for around 80% of the diurnal emissions, i.e., emissions due to carbon canister bleed emissions are still the most significant source of evaporative emissions in China 6 vehicles. In addition, if no other factors were taken into account and only the carbon canister bleed part and the whole vehicle background were distinguished, it can be seen that there was a difference between the whole vehicle diurnal results and the carbon canister bleed results, which means the vehicle background VOC emissions were in the range of 0.05~0.1 g/24 h, remaining basically the same regardless of the technology vehicles.
All U.S. Tier 3 certified vehicles tested met the BETP emission standard of 0.020 g/test for all test conditions. As expected, Vehicles D and E, which were certified to China 6 (and without any Tier 3 technology), did not meet the 0.020 g/test limit and had emissions five to ten times this limit. This demonstrates that a 0.020 g/test BETP standard is feasible to implement in the next China light-duty emission standard as a new test procedure and would significantly reduce canister emissions by more than 95% (relative to China 6 vehicles) and to near-zero levels. Emissions below 0.020 g/test were obtained for both U.S. and China test conditions, suggesting that existing U.S. Tier 3 control technologies are sufficient to meet the standard across a wide range of test temperatures and purge rates.
3.3. Comparison of Evaporative Emission Test Results to Certification Values
A comparison of the average 48-h hot soak and diurnal evaporative emissions certification values for China 6 and U.S. Tier 3 is provided in
Figure 8. Certification values are provided to regulatory authorities by automotive manufacturers. Each vehicle family from a manufacturer is certified for evaporative emissions following the defined regulatory test procedures (e.g., China 6 or U.S. EPA Tier 3). The certification data for U.S Tier 3 vehicles was obtained from the U.S. EPA, and the certification data for China 6 vehicles was obtained from the Environmental Protection Information Disclosure System for Motor Vehicles and Non-Road Mobile Machinery in China [
30]. For U.S. Tier 3 vehicles certifying to a 0.300 g/test 48-h hot soak and diurnal evaporative emissions standard, the average 48-h hot soak + diurnal certification value is 0.201 ± 0.04 g. For China 6 vehicles certifying to a 0.7 g/test 48-h hot soak and diurnal evaporative emissions standard, the average 48-h hot soak and diurnal certification value was 0.423 ± 0.123 g. The average of all current U.S. Tier 3 certifications was, on average, 52.4% lower than the average of all current China 6 certifications. Additionally, for U.S. Tier 3 vehicles certifying a 0.020 g/test canister Bleed Emission Test Procedure (BETP), the average canister BETP certification value was 0.008 ± 0.005 g, confirming that canisters designed to Tier 3 standards were near-zero emissions.
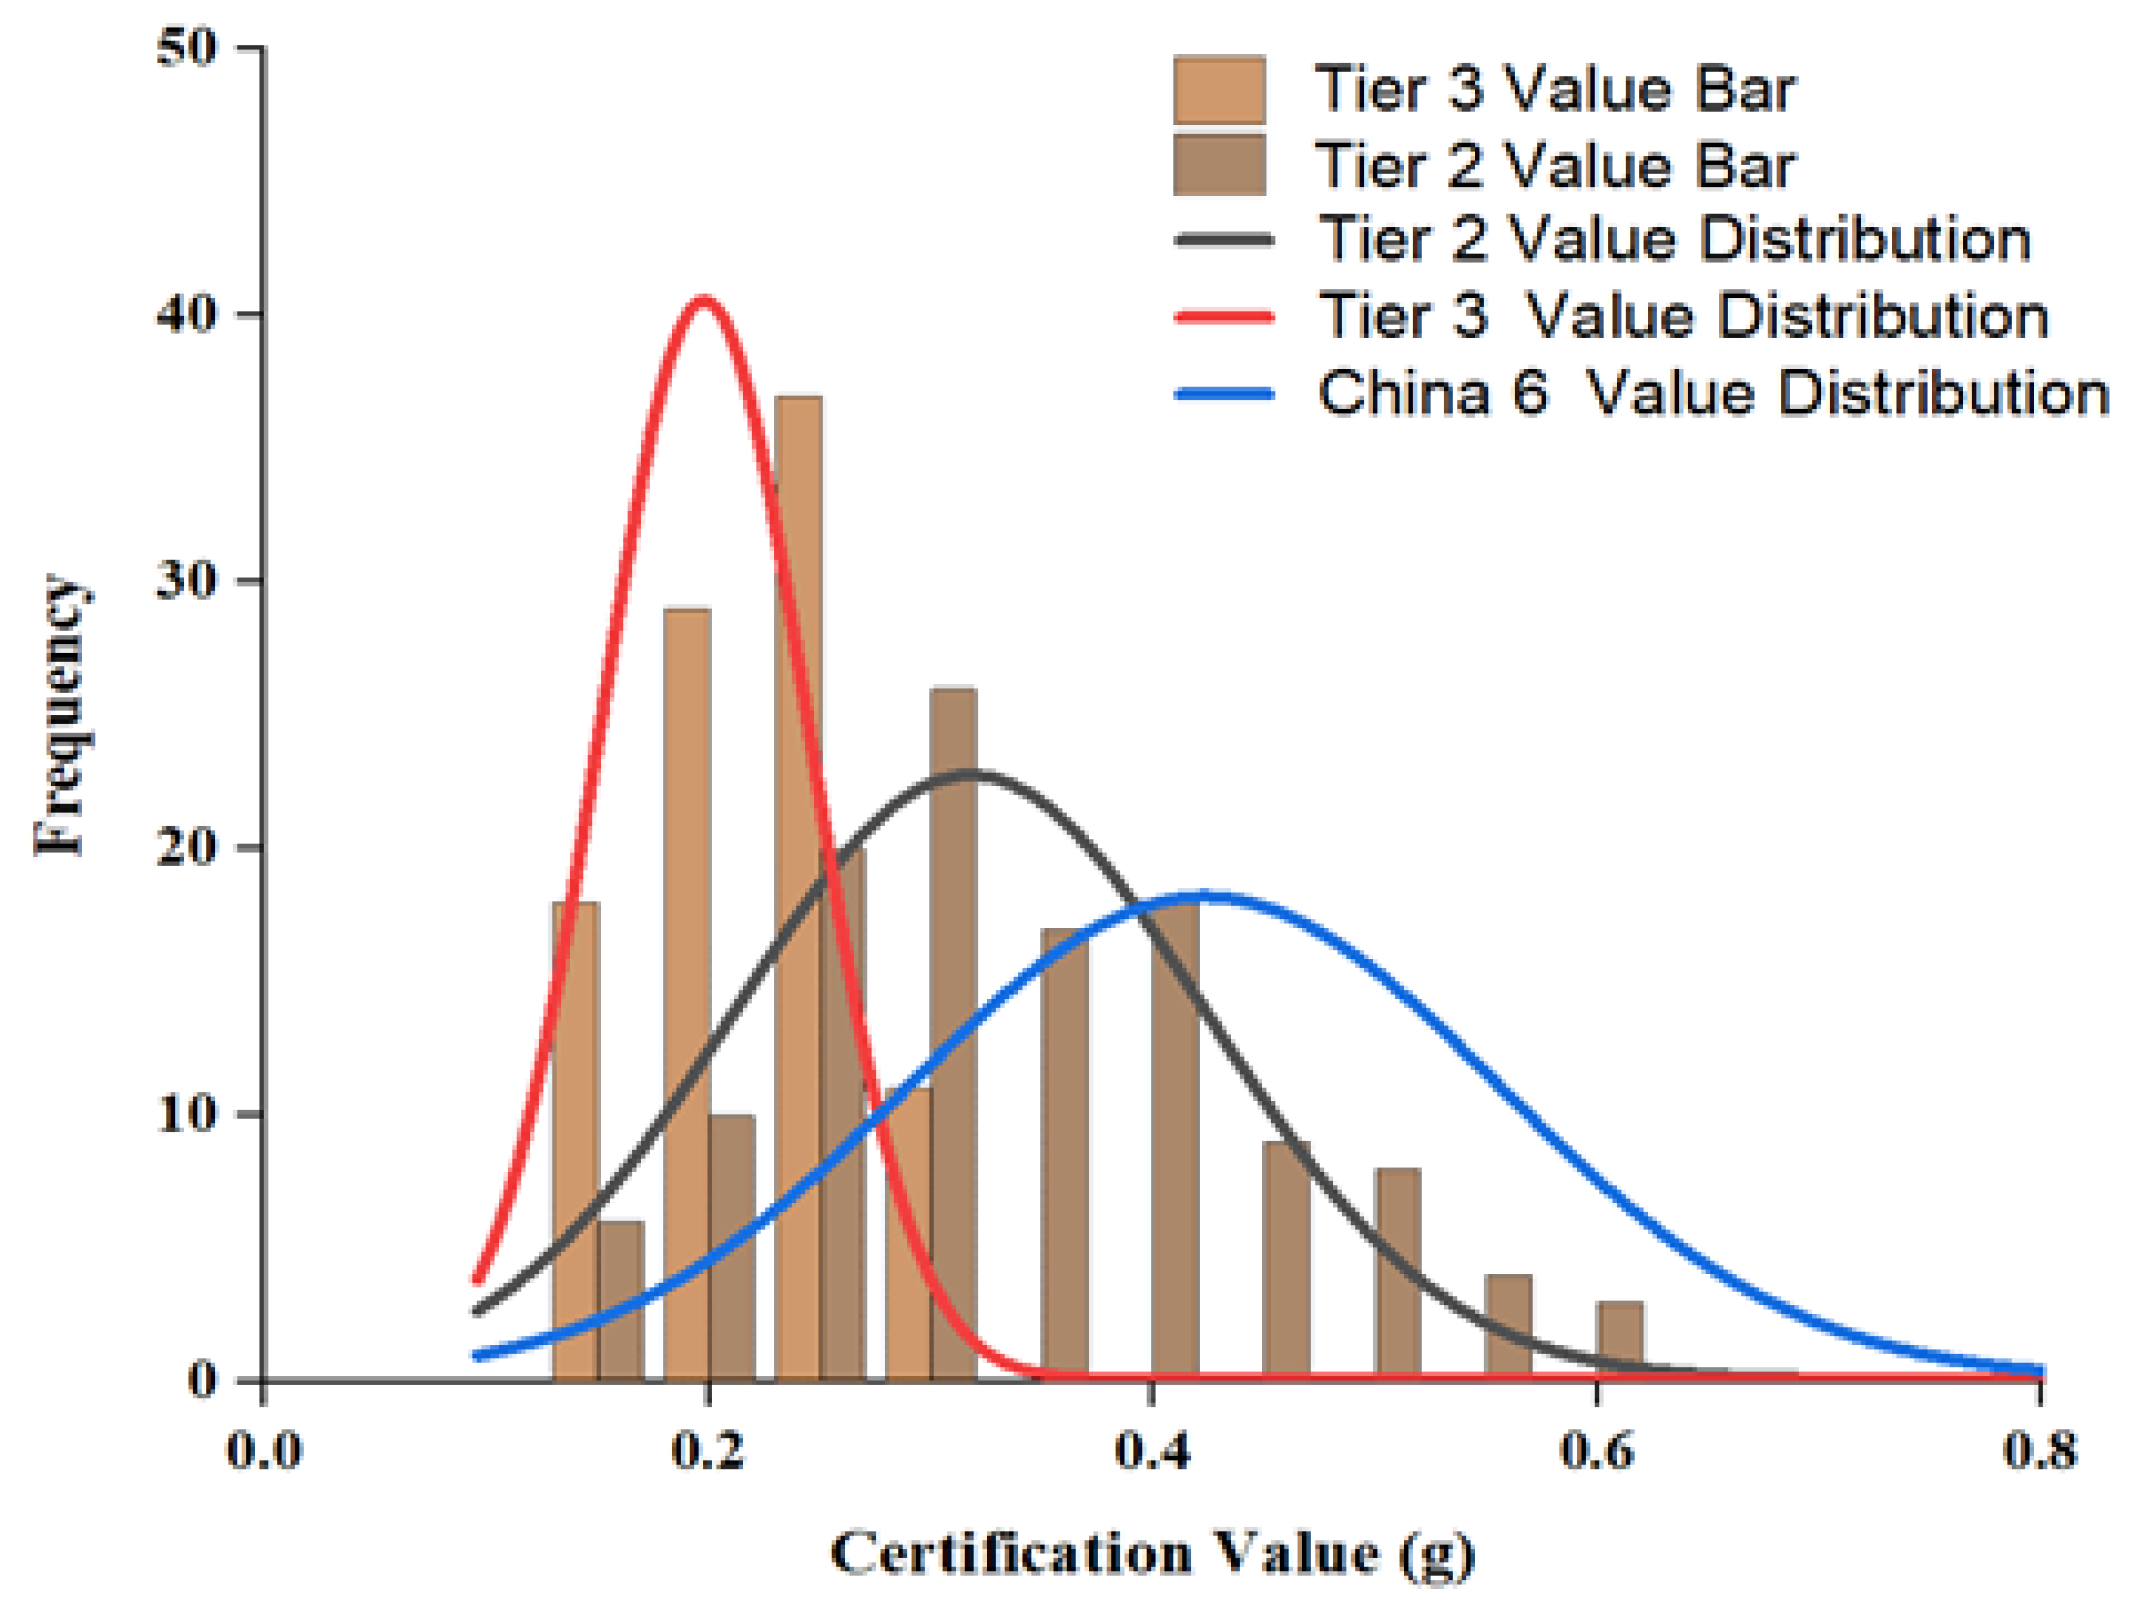
The impact of more stringent evaporative emission standards on the distribution of vehicle fleet certification values is shown in
Figure 9. Prior to the introduction of U.S. Tier 3 standards, the distribution of light-duty vehicle evaporative emission certification values in the U.S. was broad, with about half of the vehicles certifying to levels less than 0.3 g/day and the other half of vehicles certifying to values between 0.3 and 0.6 g/day. With the introduction of the U.S. Tier 3 standard of 0.300 g/day, the distribution of evaporative emission certifications has become much narrower, with more than half of vehicles now certifying to a value less than 0.200 g/day. The current distribution of light-duty vehicle certifications for China 6 is broader than the distribution of U.S. Tier 2 vehicles due to a slightly less stringent standard for China 6 compared to U.S. Tier 2. To narrow the distribution of evaporative emission certifications for light-duty vehicles in China, a more stringent hot soak and evaporative emission standard is needed, such as alignment with Tier 3. This is in alignment with the conclusion of Zhong et al. [
9], who also suggest the current emission limit of China 6 (0.7 g/test) is relatively loose compared with U.S. Tier 3 (0.300 g/test). Additionally, Zhong et al. recommend a canister durability standard, such as the procedure found in Euro 6d, to ensure evaporative emissions control is maintained in use as the vehicle ages [
9].
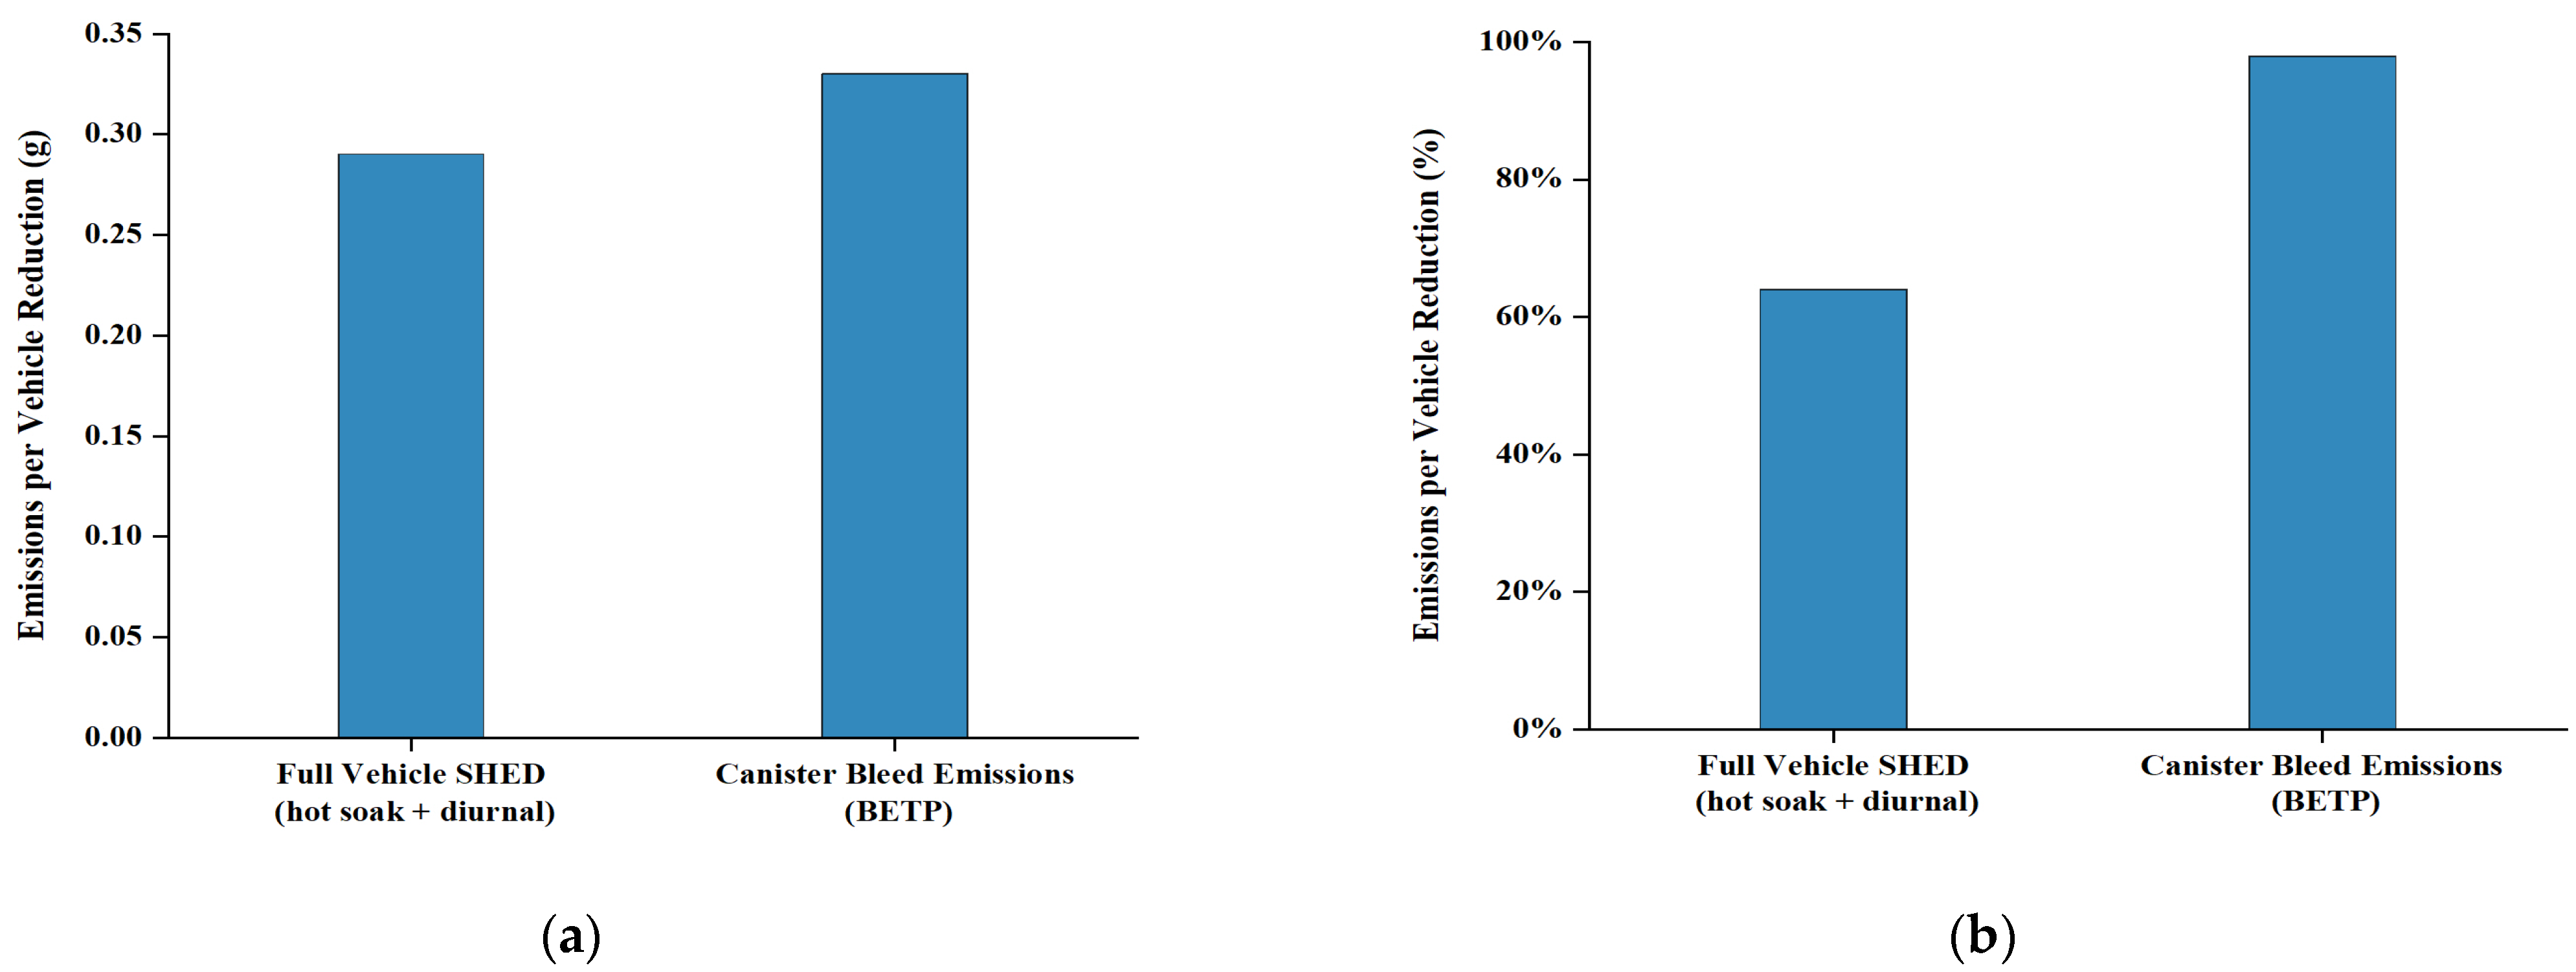
A summary of the evaporative emissions reduction potential of Tier 3 technology vs. China 6 technology for the full vehicle SHED (hot soak + diurnal) and canister bleed emissions (BETP) is provided in
Figure 10. In the U.S. EPA test conditions, Tier 3 vehicles were observed to have 64% lower hot soak + diurnal emissions and 98% lower canister bleed emissions. At the China 6 test conditions, Tier 3 vehicles were observed to have 22% lower hot soak + diurnal emissions and 95% lower canister bleed emissions. These results were further validated by comparing the average of the current certification values, provided in
Figure 8. The average of all current U.S. Tier 3 certifications was, on average, 52.4% lower than the average of all current China 6 certifications.
4. Conclusions
Currently, on the basis of the China 6b evaporation control technology, there is still a large potential to further reduce VOC emissions from the whole vehicle.
The results suggest a consistent requirement for the next light-duty vehicle emission standard for China (defined as hot soak + a maximum of Day 1, Day 2 diurnal + deterioration factor) is feasible at China test conditions (WLTP drive cycle, 38 °C hot soak and precondition drive, and China test fuel). The results also suggest that a new BETP requirement is feasible to implement in the next light-duty vehicle emission standard. All test data for vehicles certified to Tier 3 were below 0.020 g/test. Vehicles certified to China 6 had canister bleed emissions more than 5 times higher, suggesting a significant emissions reduction potential can be realized in China’s next light-duty vehicle emission standard by implementing a BETP test procedure.
An important observation from the test program was the different purge behavior between certification conditions (China 6 test condition of 38 °C) and off-cycle conditions (U.S. EPA test condition of 25 °C) for the China 6 certified Vehicle D. Purge volumes for Vehicle D were 33% lower during off-cycle conditions of the EPA test, resulting in 2-day diurnal emissions that were up to 4.6 times higher. Since canister emissions are influenced by the amount of purge, it is important to have a high purge calibrated across a wide range of temperatures.
Since only one China 6 vehicle was tested in an off-cycle condition during this test program, it is recommended that additional China 6 vehicles be tested in the U.S. EPA test condition to further verify if other China 6 vehicles purge less during off-cycle conditions (25 °C), resulting in higher diurnal emissions.


