Article

Reclassifying the Spring Maize Drought Index on the Loess Plateau under a Changing Climate

1
School of Atmospheric Sciences, Chengdu University of Information Technology, Chengdu 610225, China
2
Inner Mongolia Meteorological Service Center, Hohhot 010051, China
3
Key Laboratory of Arid Climate Change and Disaster Reduction of Gansu Province, Institute of Arid Meteorology, China Meteorological Administration, Lanzhou 730020, China
*
Author to whom correspondence should be addressed.
Atmosphere 2023, 14(10), 1481; https://doi.org/10.3390/atmos14101481
Submission received: 16 June 2023 / Revised: 13 August 2023 / Accepted: 23 August 2023 / Published: 25 September 2023

Abstract

:
Drought is the main meteorological disaster that affects the yield and quality of spring maize on the Loess Plateau. This study used data of the spring maize growth period, relative soil humidity, and yield at 18 agricultural meteorological observation stations on the Loess Plateau from 1997 to 2013 to determine the drought category based on the yield reduction rate. Through the drought index according to the conformity rate of category standard and individual case verification, a refined suitability drought index of spring maize on the Loess Plateau was constructed, and the spatial distribution characteristics of drought in different growth stages of spring maize were analyzed. The results showed the following: (1) The number of days in the whole growth period of spring maize in all regions of the Loess Plateau has been extended. The average sowing date of spring maize in the northwest region of the Loess Plateau was 9 April, and that in the east and central regions was 26 April. In terms of spatial distribution, each growth period was gradually delayed from west to east. (2) The correlation between relative soil humidity and yield of spring maize at the jointing stage and heading stage was the best, followed by the milky stage and mature stage, and the relative soil humidity at the sowing stage and emergence stage had little effect on the yield. (3) According to the national drought category standard “Drought Category of Spring Maize in the North”, based on the data of yield reduction rate, the drought index of spring maize on the Loess Plateau was refined by region and growth stage. The drought category index values of spring maize in different growth stages and regions changed according to the revised drought category standard, with 71.4% of the sites in the sowing seedling stage and 85.7% of the sites in the seedling jointing stage, and the revised drought category was more severe than the national drought category standard, while at 57.1% of the sites in the jointing and tasseling stages and 71.4% in the tasseling and milking stages, the revised drought category was less severe than the national drought category standard. (4) Based on the revised refined drought index for spring maize on the Loess Plateau, the spatial distribution of drought occurrence frequency across different growth stages of spring maize on the Loess Plateau was analyzed. The frequency of drought occurrence during the seeding and emergence stages was 25–75%. With the change in growth stages, the high-value area of drought occurrence frequency gradually moved northward, and the overall frequency of drought occurrence decreased. For the milky mature stage, the frequency of drought occurrence in a few regions was around 42%, and the drought frequency in most regions was between 8% and 33%.

1. Introduction

The Loess Plateau, a climate-change-sensitive area and drought-prone zone in China, has been severely affected by drought, which has impacted the development of local agricultural production [1]. Maize is the main grain crop on the Loess Plateau, which has important significance for ensuring food security on the Loess Plateau [2]. Previous research results have shown that drought can lead to maize plant dwarfing, hindered growth and development, deteriorated ear traits, and ultimately, a significant decrease in economic yield and biomass [3]. Since the 1990s, the annual precipitation on the Loess Plateau has shown a significant decrease, with droughts becoming increasingly frequent [4], the frequency and degree of droughts increasing and deepening [5,6,7], and the impact of drought on maize intensifying [8,9]. Therefore, timely and objective monitoring of the spatiotemporal distribution characteristics of maize drought on the Loess Plateau, analyzing the impact of climate change on it, has important practical significance for improving maize’s disaster prevention and reduction capabilities.
Objectively and effectively monitoring and estimating maize drought and accurately reflecting the degree, scope, and duration of maize drought require appropriate and accurate maize drought indicators [10,11,12,13,14]. Relative soil humidity can directly reflect the available water status of maize and has a good correlation with yield [15], which is a key factor affecting the growth, development, and yield of maize. In addition, during the analyzed period, the relative soil humidity observation stations of the China Meteorological Administration Agricultural Meteorological Observatory were widely distributed, and the time series of the observation data was long. Therefore, this study selected relative soil humidity as a monitoring indicator, which could better reflect the degree of maize drought on the Loess Plateau [16].
Although the “China Meteorological Administration’s Northern Spring Maize Drought Rating” (QX/T 259-2015) [17] stipulates the standard of relative soil humidity drought rating in different growth periods of maize (Table 1), the standard does not take regional differences into account, and the same maize drought index values were used in different regions. The application of this standard to study the spatiotemporal distribution characteristics of spring maize drought on the Loess Plateau was not sufficiently precise. In order to more accurately monitor and evaluate the impact of climate change on spring maize drought on the Loess Plateau and analyze the spatiotemporal distribution characteristics of spring maize drought on the Loess Plateau, this study used 18 representative spring maize agricultural meteorological observation stations on the Loess Plateau from 1997 to 2013 to observe the growth period and yield of spring maize, manually observing the moisture content (relative soil humidity) data of maize every ten days and determining the drought level based on the yield reduction rate. We revised Table 1 “Drought Levels of Spring Maize in the North (QX/T 259-2015)” by region and growth period to construct a new refined drought index for the relative soil humidity of spring maize on the Loess Plateau and, based on this, study the impact of climate change on spring maize drought on the Loess Plateau.

2. Materials and Methods
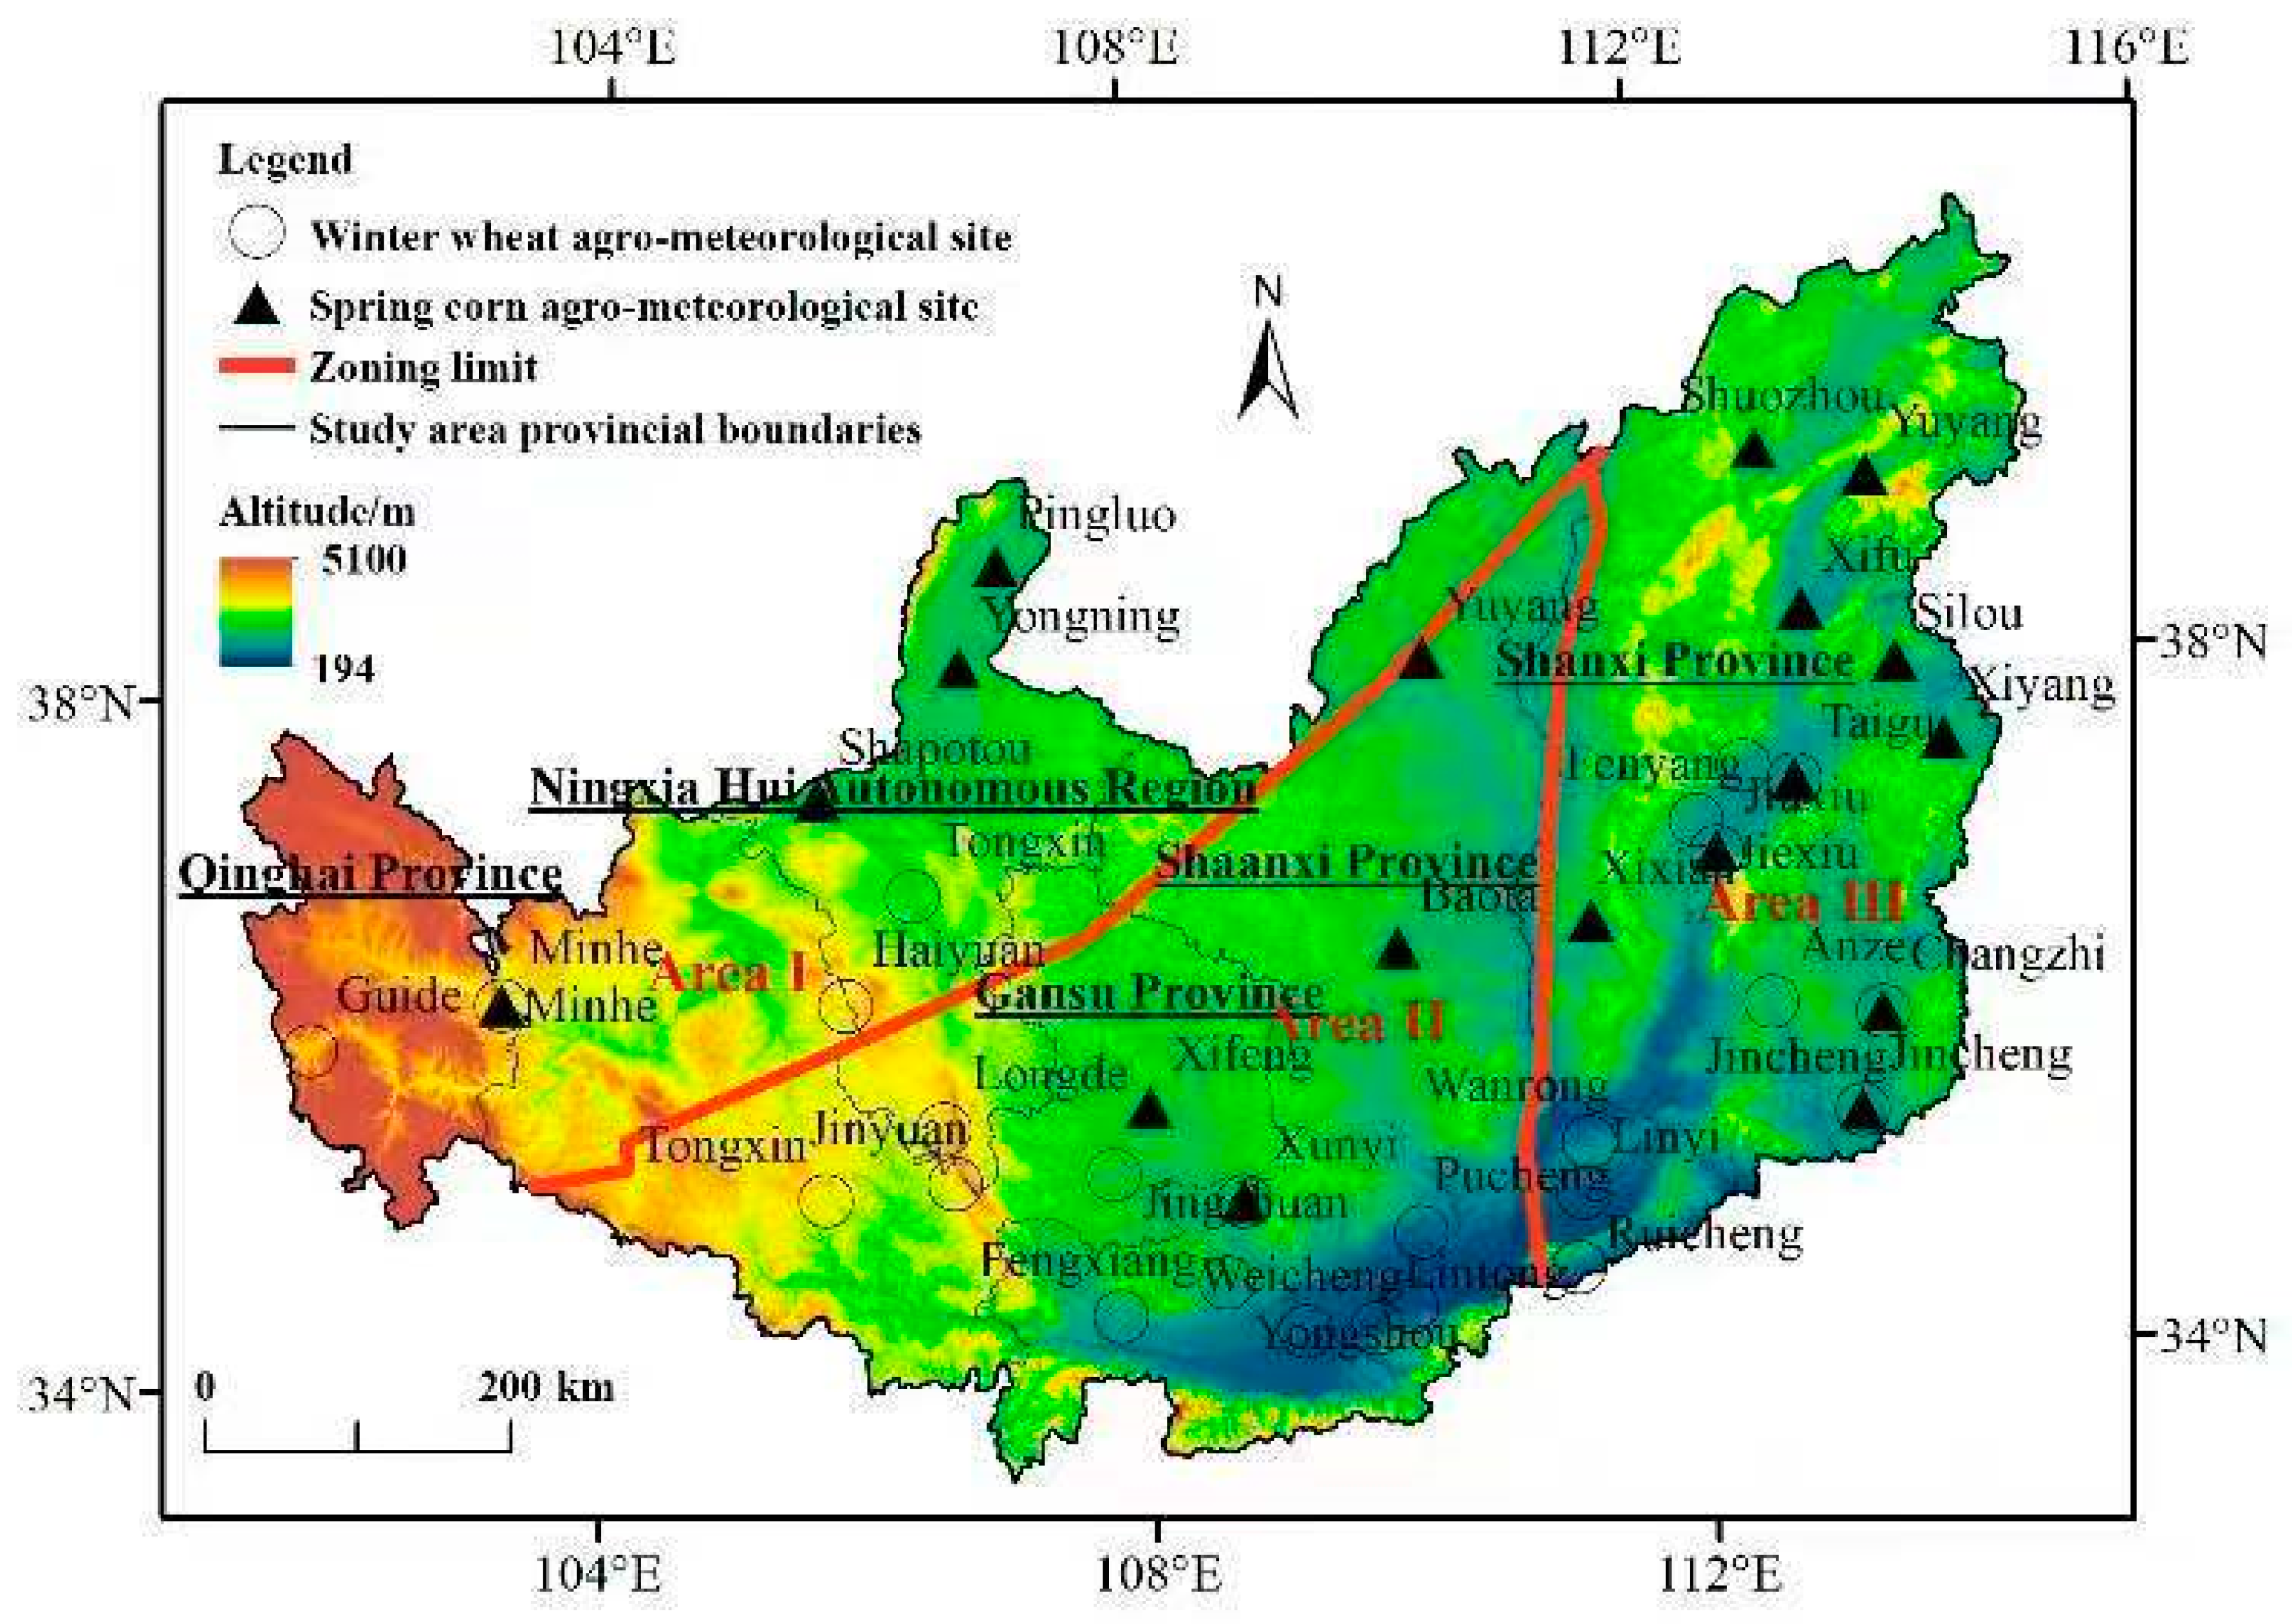
2.1. Study Area

Considering the main planting areas of spring maize, the Loess Plateau in this study spanned Shaanxi Province, Shanxi Province, Ningxia, the middle east of Gansu Province, and the east of Qinghai Province. Due to its wide coverage and obvious differences in crop growth periods in different regions, the study area was divided into three regions based on China’s agricultural natural division, referred to as the northwest Loess Plateau (Zone I), the central region of the Loess Plateau (Zone II), and the eastern region of the Loess Plateau (Zone III) (Figure 1).

2.2. Data

(1)
Relative soil humidity data were extracted from the China Meteorological Data Network (http://data.cma.cn/, accessed on 12 August 2023). In this study, 18 spring maize agrometeorological observation stations (Minhe, Pingluo, Yongning, Shapotou, Xifeng, Xunyi, Yuyang, Baota, Shuozhou, Fanshi, Xinfu, Shilou, Xiyang, Taigu, Jiexiu, Xixian, Changzhi, and Jincheng) from 1997 to 2013 were selected, and relative soil humidity data with depths of 10, 20, and 50 cm were collected. The soil moisture data were observed by an agrometeorological observation station according to the “Specifications for Agrometeorological Observation” of the China Meteorological Administration, which satisfied the requirements of this study.
(2)
Data of the growth period (seeding, seedling emergence, jointing, tasseling, milking, and ripening) of 18 spring maize agrometeorological observation stations from 1997 to 2013 were sourced from the China Meteorological Data Network.
(3)
Production data were collected from the “Decadal Data Set of China’s Crop Yield Data” and collated by the China Meteorological Administration, then extracted from the China Meteorological Data Network, including the actual production data of 16 spring maize agricultural meteorological observation stations (ibid., Shapotou and Xunyi) from 1997 to 2013. There were 272 spring maize data samples in total (sample number = 17 years × 16 sites); however, after excluding some missing data, the final number of valid samples involved in the analysis was 190.
(4)
The agrometeorological drought disaster data were obtained from the statistical results of some documents and the “China Agrometeorological Disaster Data Set” collected and sorted by the China Meteorological Administration and obtained by the China Meteorological Data Network. In this study, a drought disaster record of the data set at each agrometeorological observation station on the Loess Plateau region was defined as a drought event. Drought disaster data for the stations and years not recorded in the data set were supplemented by consulting relevant documents.

2.3. Research Methods

2.3.1. Relative Humidity of Soil (R)

The relative humidity of the soil (R) was calculated according to Equation (1).
R = W g f c × 100 %
where R is the relative humidity (%) of the soil, Wg is the soil weight water content (g/g), and fc is the soil field water capacity (g/g).

2.3.2. Correlation Analysis

In this study, the Pearson correlation coefficient between the relative soil humidity and the production of spring maize in each ten-day growth period was calculated to reveal the influence of relative soil humidity on production in different development periods. The correlation was calculated according to Equation (2).
γ a , b = C o v a , b V a r a V a r b
where γ a , b is the correlation coefficient of a and b, C o v a , b is the covariance of a and b, V a r a is the variance of a, V a r b is the variance of b, and the value range of correlation coefficient γ is [−1, 1]; if γ > 0, it means that there is a positive correlation between the two variables.

2.3.3. Yield Reduction Rate

The difference between the annual actual output and the trend output was the negative value of the percentage of the trend output (%). Many methods can be used to calculate the production reduction rate. If the data skip a long time, the trend production method could be used. Generally, this method is more accurate. If the span of the data is short (less than 15 years) and the trend production cannot be calculated, the average method could be used.
(1)
Trend production method [18]
Trend production was calculated according to Equation (3).
W = Y Y t Y t × 100 % Y < Y t
where W is the production reduction rate, Y is the actual production, and Y t is the trend mean.
(2)
Mean method [19]
Trend production was calculated according to Equation (4).
W = Y Y ¯ Y t × 100 % Y < Y ¯
where W is the production reduction trend, Y is the actual production, and Y ¯ is the average production.
Light drought refers to a reduction of less than 10%, moderate drought refers to a 10% ≤ W < 20% reduction, severe drought refers to a 20% ≤ W < 30% reduction, and extreme drought refers to a ≥30% reduction.

2.3.4. Frequency of Drought

The drought frequency was calculated according to Equation (5). If the total number of years of crop planting was N at a certain site, i, and the number of years of drought in a certain growth period was n, then the frequency of drought occurrence, Fi, could be expressed as:
F i = n N × 100 %

2.3.5. Comparison with National Standards

In the verification process, the new drought classification results were compared with the national standards. The comparing results were divided into three categories, namely, compliance (where the drought level of the two treatments was consistent), basic compliance (where the difference between the two treatments was one level), and non-conformance (where the difference between two treatments was greater than two levels). Using the statistics of the three categories, the percentage of the number of time periods that agreed over the total number of time periods was the compliance rate.

3. The Impact of Climate Change on the Growth Period of Spring Maize in the Loess Plateau

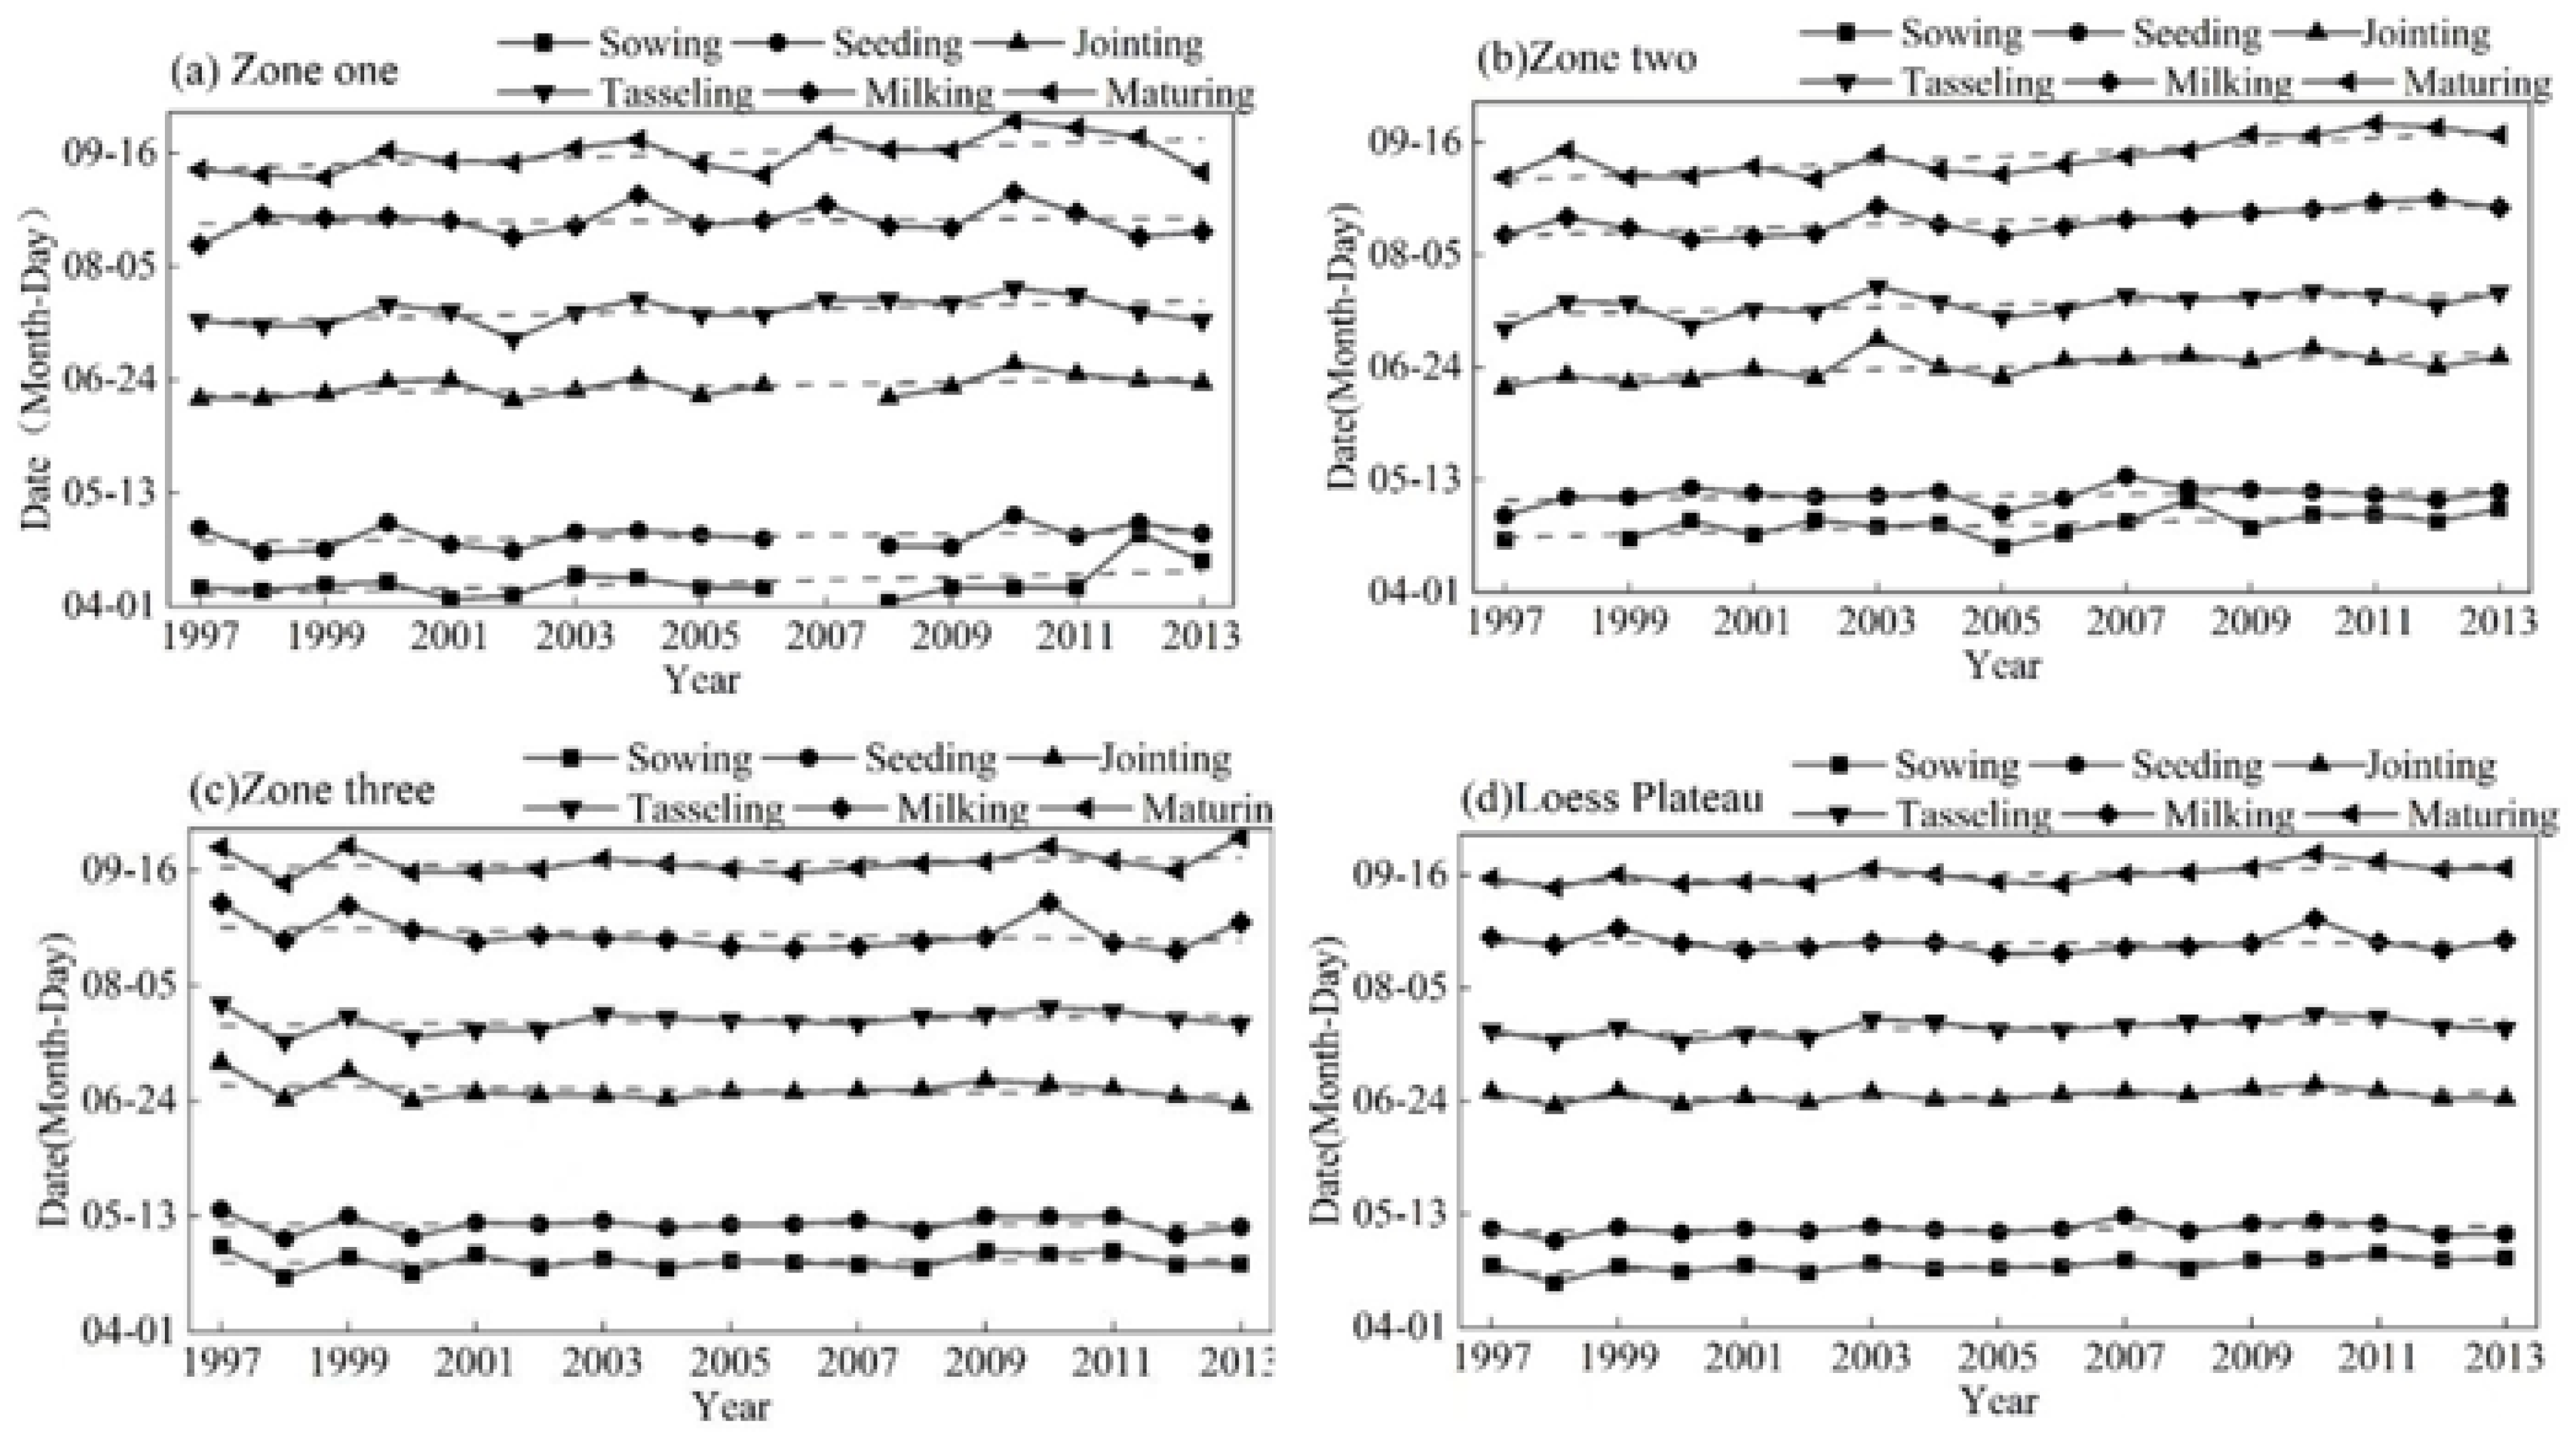
3.1. Temporal Changes in Key Growth Periods of Spring Maize on the Loess Plateau

The changes in the growth period of spring maize have altered the length of its nutritional and reproductive growth periods, resulting in changes in the water and heat conditions experienced by spring maize during the important stage of yield formation. This study used data of the spring maize growth period observed by 18 agricultural meteorological stations on the Loess Plateau from 1997 to 2013, and average values of the spring maize growth period in three regions of the Loess Plateau from 1997 to 2013 were calculated using the partitioning method depicted in Figure 1.
As shown in Figure 2, the multi-year average sowing date of spring maize in Zone Ⅰ was 9 April. The earliest was 2 April and the latest was 28 April. The average maturity date was 15 September, the earliest was 7 September, and the latest was 28 September. The number of days in the whole growth period (seeding–maturity period) was the shortest in 2013: 144 days. The longest period, in 2010, was 173 days. The number of days in the whole growth period tended to be longer. There were different degrees of delay from sowing to maturity. It can be seen in Figure 2b that the multi-year average sowing date of spring maize in Zone II of the Loess Plateau was 26 April, the earliest was 18 April, and the latest was 5 May. The average maturity date was 10 September, the earliest was 2 September, and the latest was 23 September. The number of days in the whole reproductive period was the shortest in 2002, 127 days. The longest year in 2009 was 147 days. The number of days in the whole growth period showed a trend of lengthening, and the inter-annual changes in the growth period in Zone II and Zone I was similar, with a trend of postponing from the sowing period to the mature period of spring maize. Figure 2c shows that the annual average sowing date of spring maize in Zone III of the Loess Plateau was 26 April, the earliest was 20 April, and the latest was 2 May. The average maturity date was September 18, the earliest was September 11, and the latest was 28 September. The number of days in the whole reproductive period was the shortest in 2001, 139 days, while the longest was 2013: 156 days. The sowing date, tasseling date, and ripening date exhibited a tendency to delay, and the emergence, jointing, and milk ripening dates were becoming earlier, although the trend was not significant. Figure 2d shows that the average sowing date of spring maize in the whole region was 24 April, the earliest was 17 April, while the latest was 28 April. The multi-year average maturity date was 16 September, the earliest was 11 September, and the latest was 23 September. The shortest maturity in the whole reproductive period was 142 days, and the longest was 150 days.

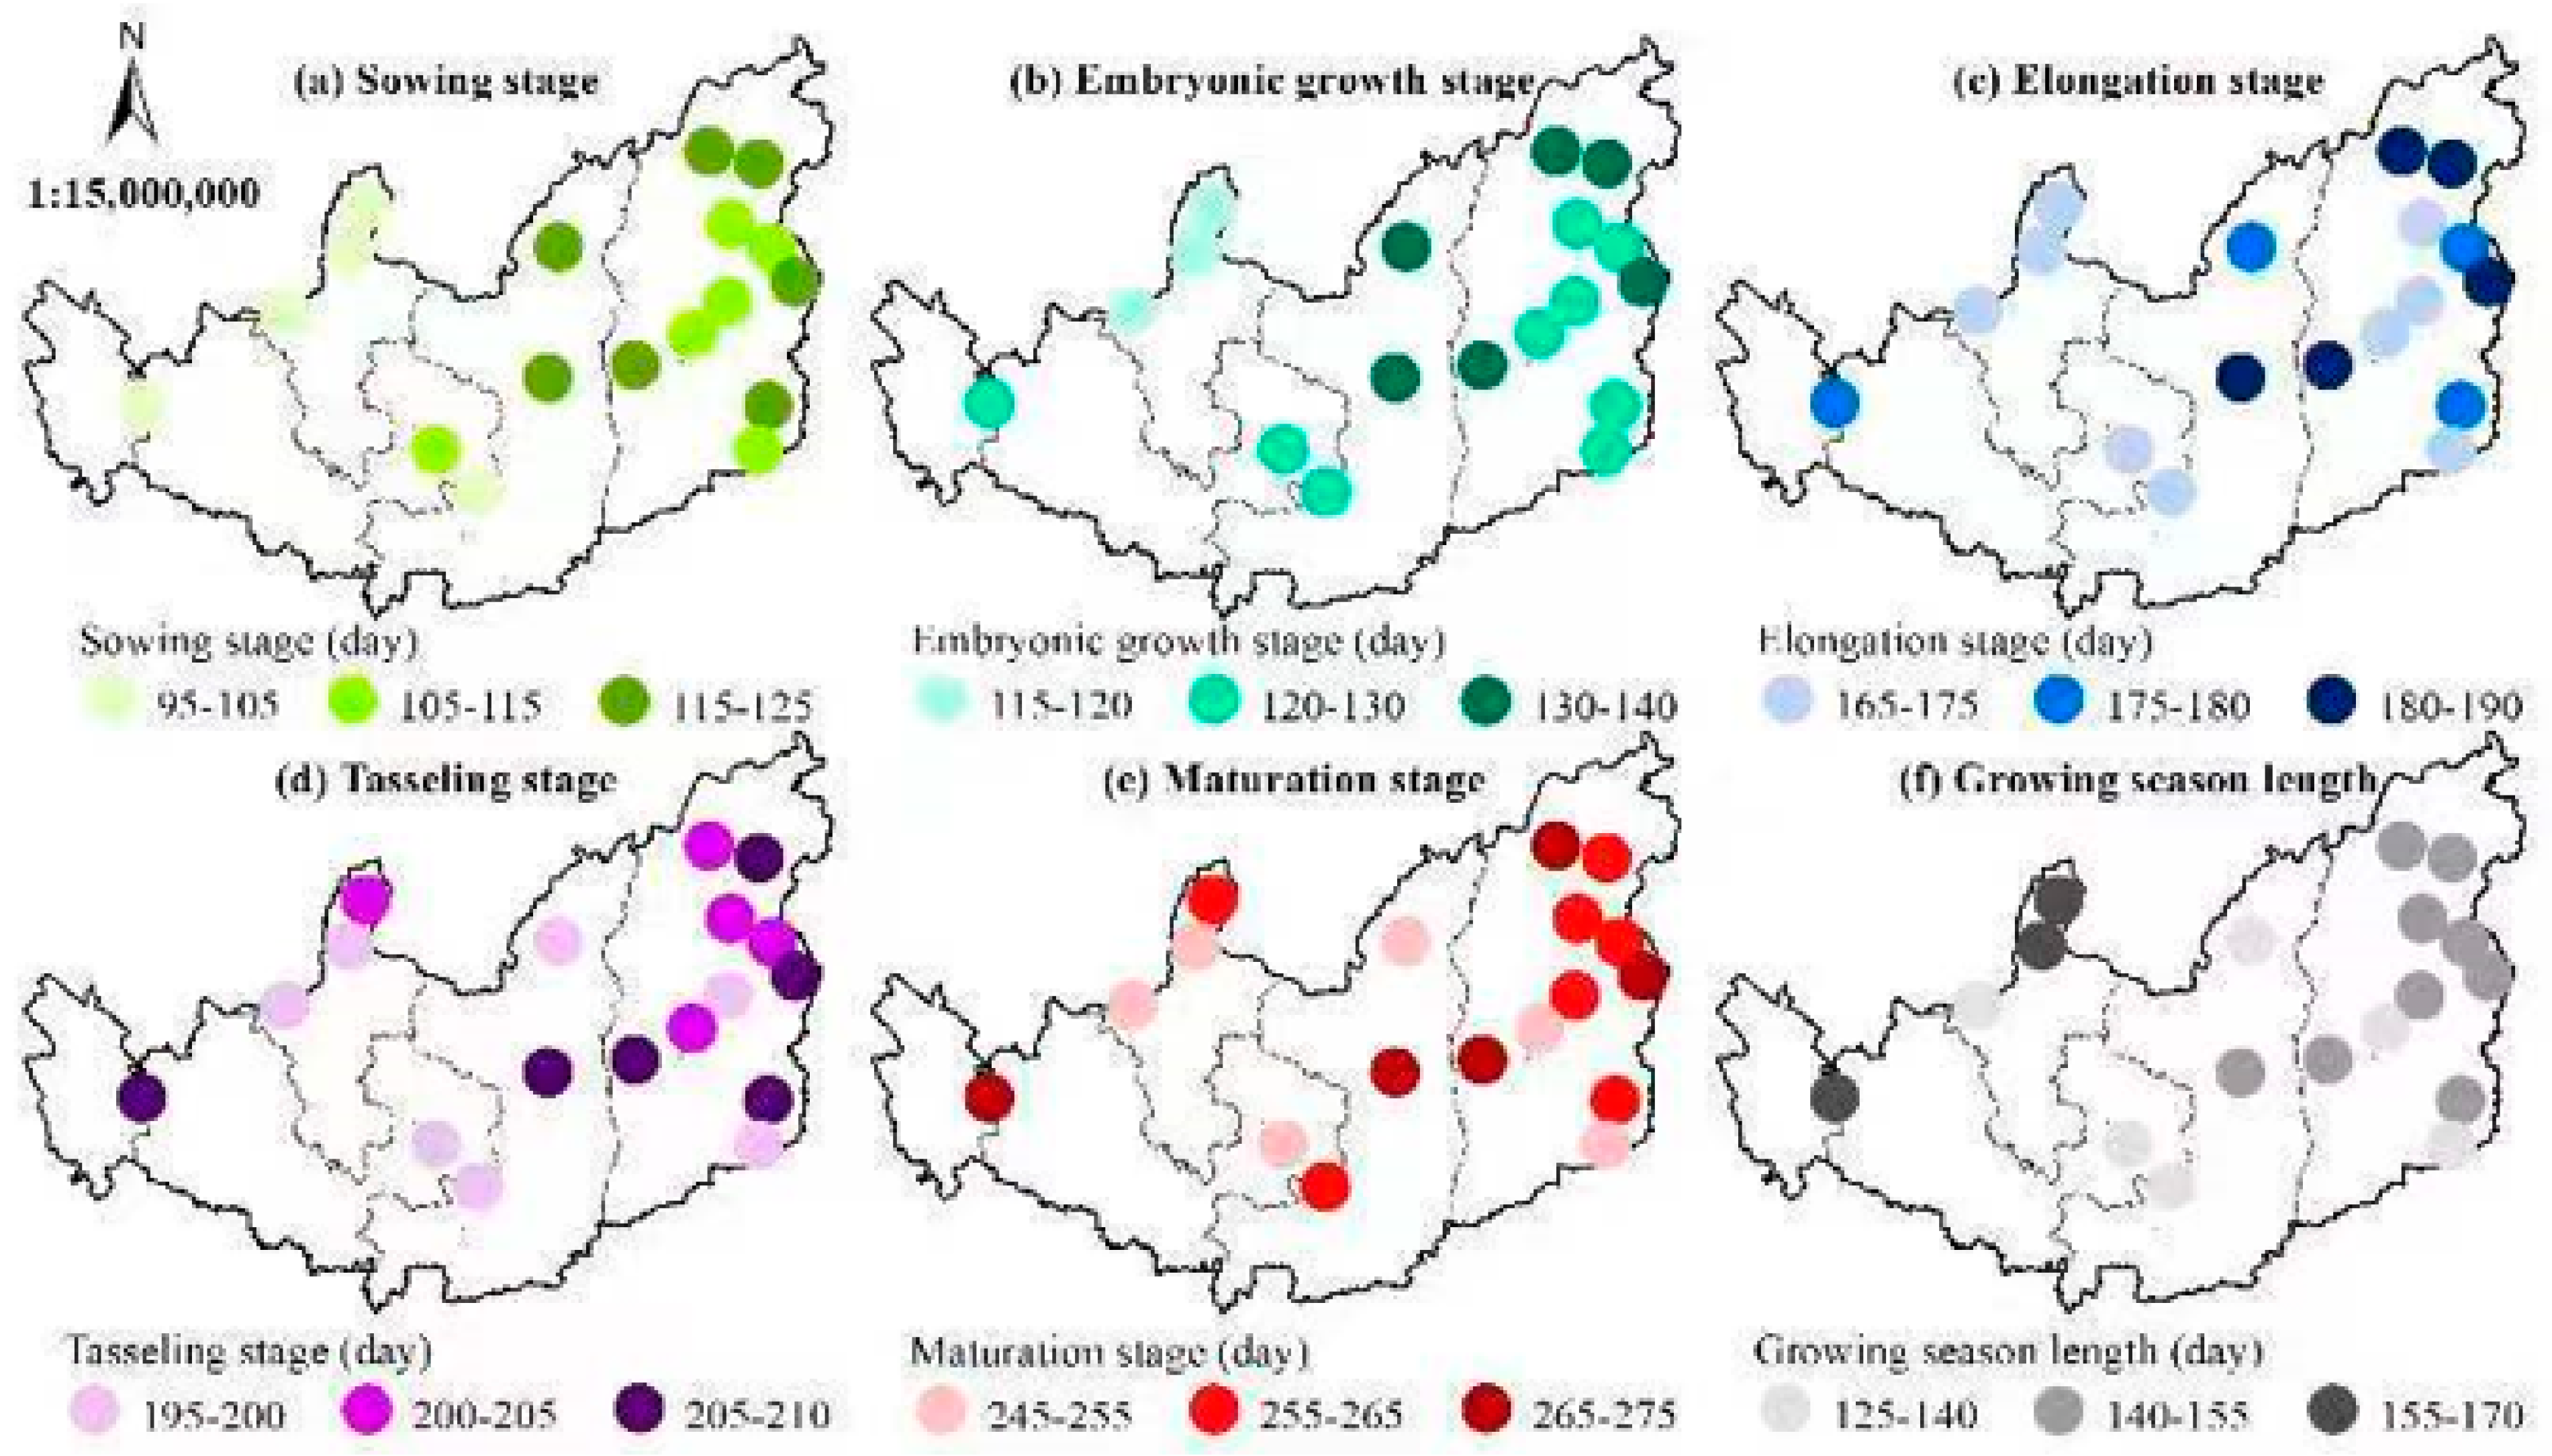
3.2. Spatial Distribution of Key Growth Periods of Spring Maize on the Loess Plateau

Figure 3 shows the spatial distribution of the average value (1997–2013) of the Julian date of sowing, emergence, jointing, tasseling, maturity, and the whole growth periods of spring maize on the Loess Plateau.
Figure 3 shows that the sowing period of spring maize was gradually postponed from west to east, with Ningxia and Qinghai concentrated in early April, Gansu and central Shaanxi mainly in mid-to-late April, and Shanxi and northern Shaanxi mainly in late April to early May. The emergence period also showed a delay in the east–west direction, i.e., the emergence period gradually became later from west to east, and the emergence date was mainly from late April to early May. The jointing period of spring maize was postponed from west to east in mid-June to early July. The jointing period of spring maize in Shanxi and Shaanxi was generally later, mainly distributed in late June to early July. The tasseling stage and jointing stage demonstrated the same pattern, gradually becoming later from west to east, concentrated in mid-to-late July. The maturity period was mainly from early to late September. The number of days during the entire growth period was the shortest in the central region of the Loess Plateau (less than 140 days), the longest in the western region (155–170 days), and the longest in the eastern region.

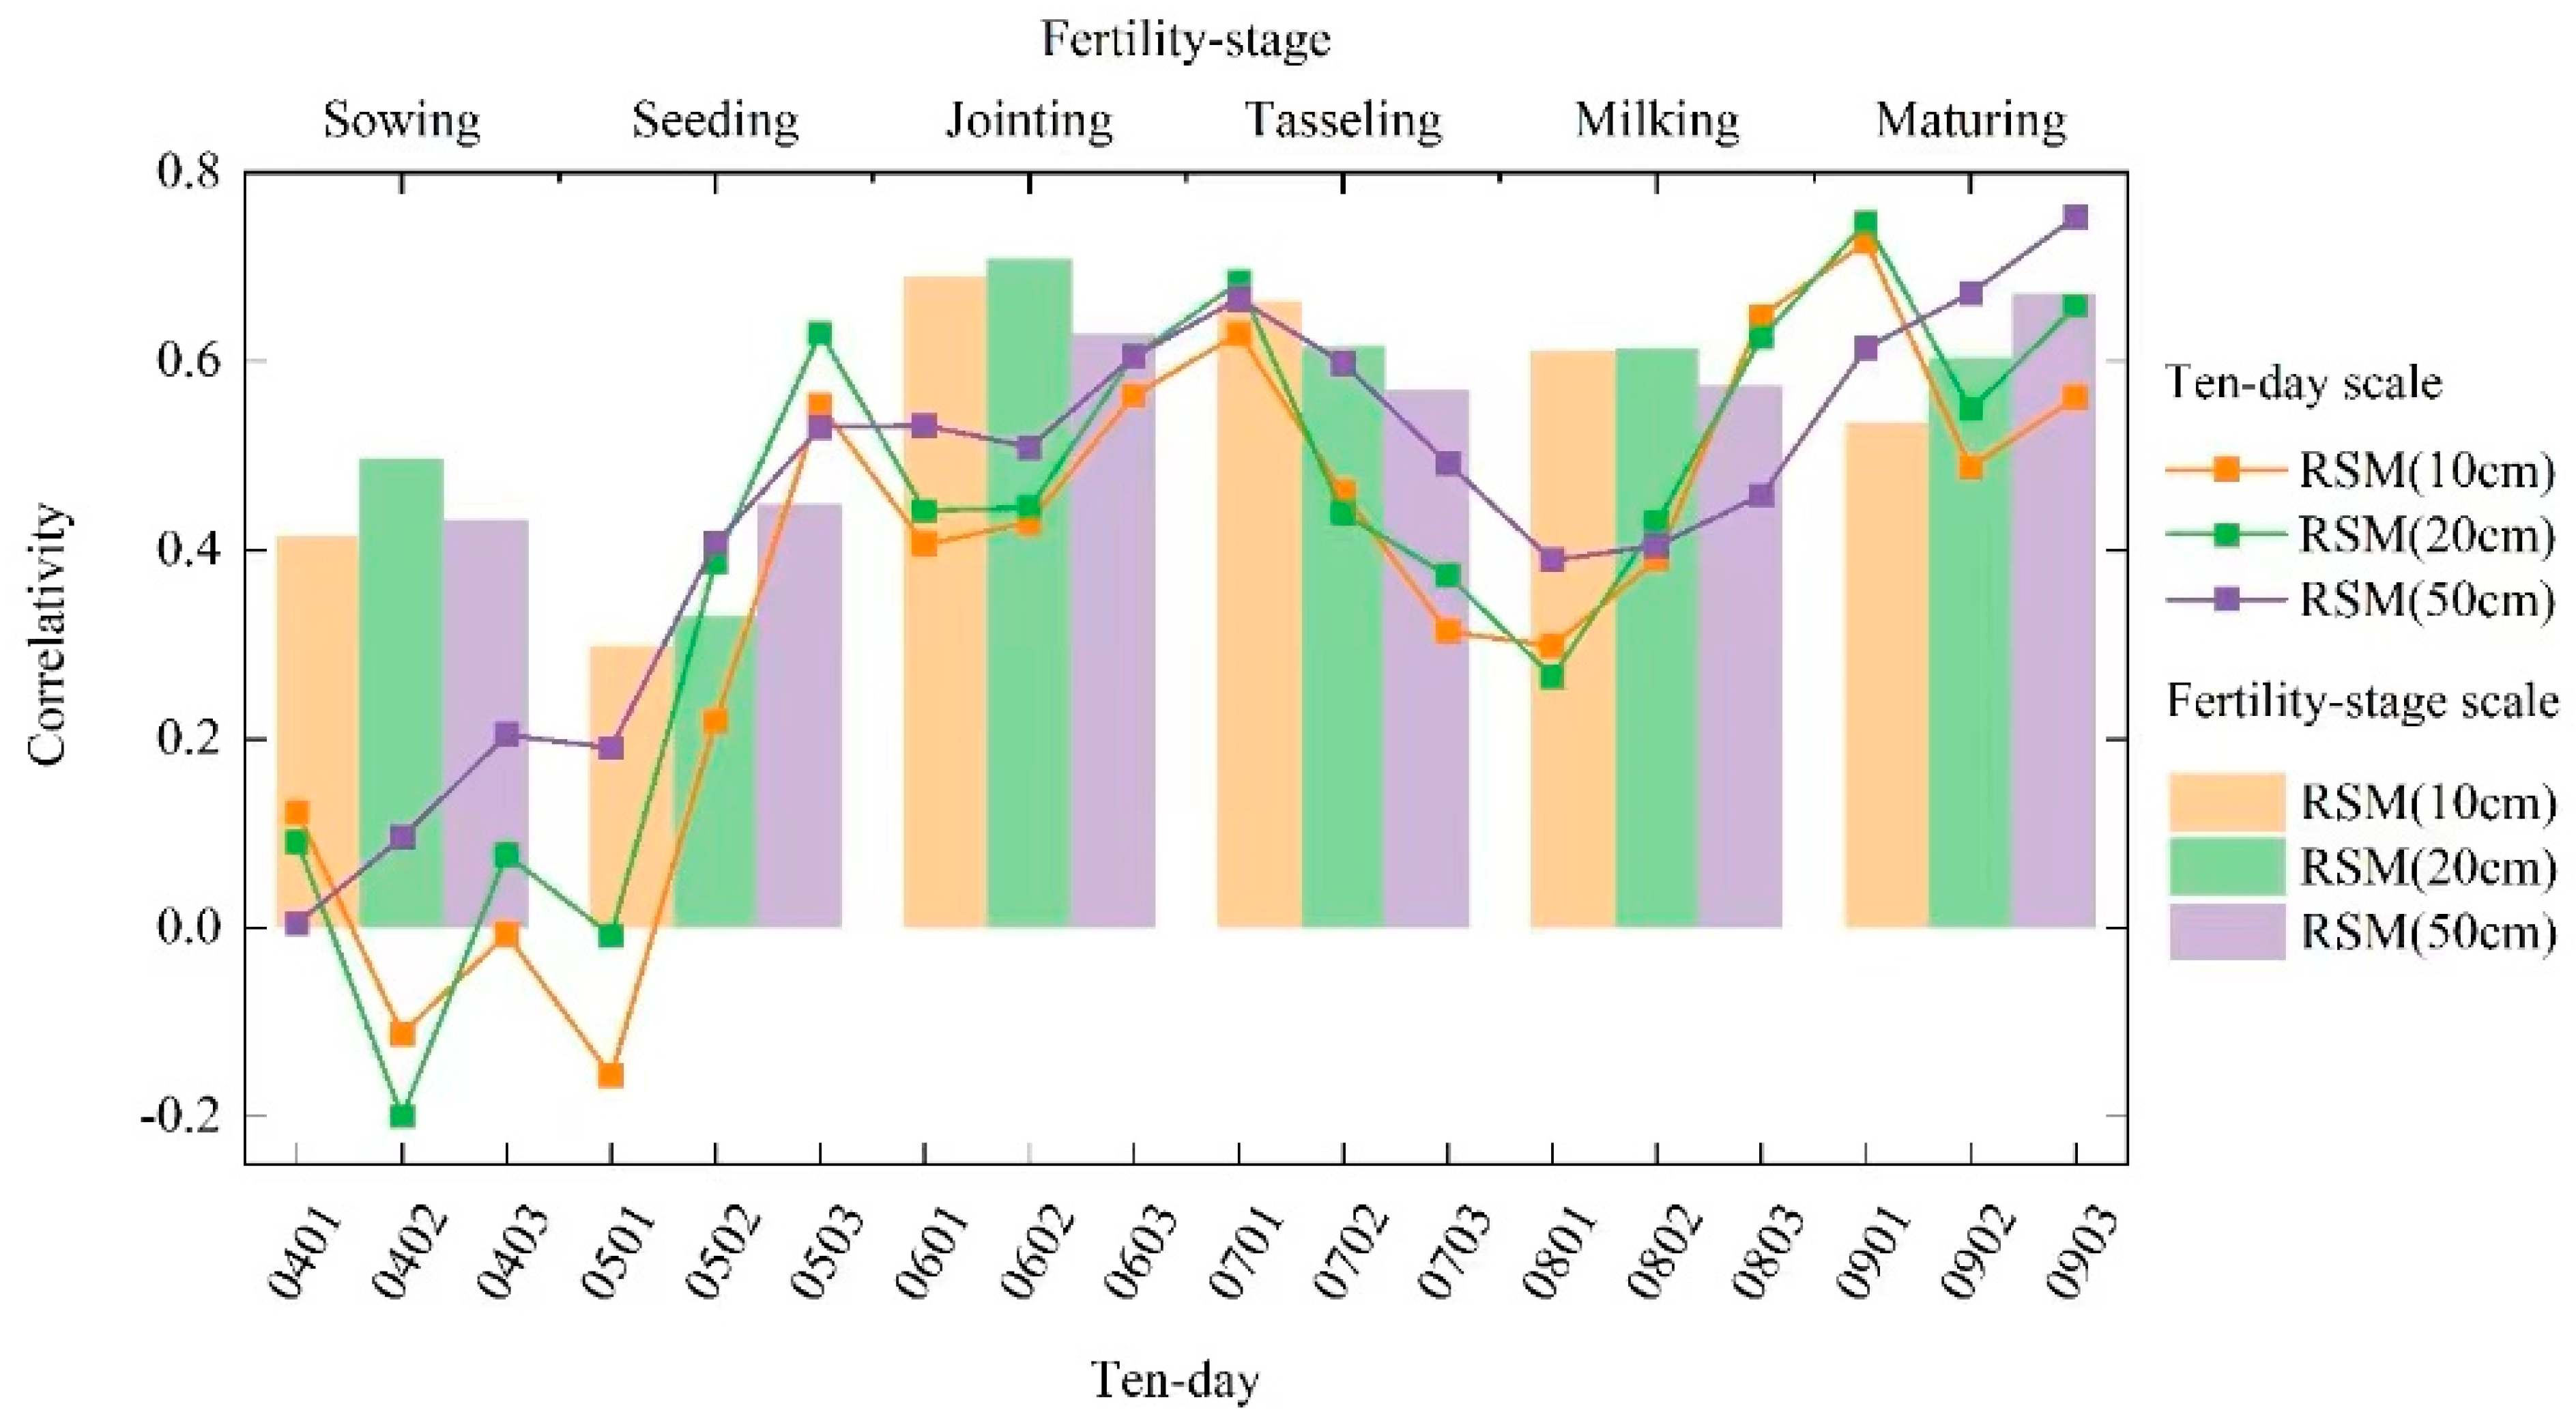
4. Effects of Relative Soil Humidity on Spring Maize Production

The whole growth period of maize can be divided into the vegetative growth stage (seeding stage–jointing stage), transitional stage (jointing stage–tasseling stage), and reproductive growth stage (tasseling stage–mature stage). The results showed that the water demand for maize growth at the seedling stage is low. If drought occurs at the vegetative growth stage, the conditions will be better at the later stage, and the crops will exhibit characteristics of recovering or compensating for these effects, which would have a minor impact on the growth of spring maize. If drought occurs in the reproductive growth stage of maize, after the jointing stage, especially in the early stage of reproductive growth, even if the water conditions improve in the later stage, it will have a considerable impact on the growth of maize: the harvest could even fail [19,20]. We determine the key growth period of spring maize by analyzing the relationship between relative soil humidity and yield of spring maize in different periods on the Loess Plateau.
Due to the long duration of each growth period of maize, in order to more accurately determine the key period for the effects of relative soil humidity on the growth and development of maize, this study analyzed the correlation between the relative soil humidity and yield in the whole growth period of maize. Figure 4 shows the correlation coefficient between relative soil humidity and the production of spring maize in different growth stages on the Loess Plateau. Figure 4 shows that the relationship between relative soil humidity and production was the best in May, late June, early July, and September. The relative soil humidity at each depth passed the 0.05 significance test, and the relative soil humidity at each depth in early July and early September passed the 0.01 significance test. In addition, the relative humidity of 50 cm soil passed the 0.05 significance test in mid- and late July, and the relationship between the relative humidity of 10 cm and 20 cm soil and production passed the 0.01 significance test in late August. From the growth period perspective, the relationship between relative soil humidity and production at each depth from jointing stage to mature stage passed the 0.05 significance test, and the soil depth at jointing stage and heading stage passed the 0.01 significance test. The results showed that the relative humidity of soil at the jointing and heading stages of spring maize had the best correlation with yield, which was superior to the relative humidity at other growth stages, followed by the milky and mature stages, and the relative humidity of soil at the sowing and seedling stages had little impact on the yield. According to previous research results [20,21], tasseling–milking is the reproductive growth stage of maize and the key period of maize growth and development, which was similar to the results of this study.

5. Construction of Refined Drought Indicators for Spring Maize at Different Growth Stages on the Loess Plateau

5.1. Revision of Refined Drought Indicator of Spring Maize at Different Growth Stages

Table 1 details the “Drought Grade of Northern Spring Maize (QX/T259-2015) ” [22] issued by the China Meteorological Administration, which presents the standards of relative soil humidity drought grades in different growth periods of maize; the standard of maize in all growth periods was the same in all regions. The standard of relative soil humidity drought grade in different growth periods of maize was correlated to the region and local, in order to make the standard of drought grade of spring maize on the Loess Plateau more accurate. Refined revisions needed to be made based on drought and disaster data from various regions and maize yield reduction rates. This study used the actual observation data of relative soil humidity, maize yield, and drought disasters from 16 spring maize agricultural meteorological observation stations on the Loess Plateau from 1997 to 2013 to analyze the impact of relative soil humidity on maize growth, development, and yield year by year. The standard compliance rate of relative soil humidity on drought disaster record data was tested, and the drought grade index of relative soil humidity at different growth stages of maize at this station was revised. The results are shown in Table 2. The relative soil humidity data of spring maize used in the study showed that the average relative humidity was 0–20 cm during the sowing emergence period, and the average relative soil humidity was 0–50 cm during other growth periods [21].
Due to the complex of reasons for the annual yield reduction, the maize yield reduction rate was calculated year by year for each station, and the relative soil humidity during the maize growth period was also calculated. According to the annual drought disaster records of each agricultural meteorological observation station on the Loess Plateau recorded in the Ten-day Data Set of China’s Agrometeorological Disasters collected and collated by the China Meteorological Administration (a drought disaster record is defined as a drought event, and the drought disaster data of stations and years not recorded in the data set are supplemented by consulting the relevant literature), it was determined whether drought occurred in a certain year. The reduction in maize production that year was identified as a result of drought. Although there may be some errors in reductions in maize production caused by drought in dry years, as well as other factors, it could generally be considered in agricultural meteorological research that this reduction in maize production was caused by drought.
Due to the change in relative soil humidity observation method, the time period of relative soil humidity recorded by the agrometeorological observation stations in the China Meteorological Data Network was restricted within the years 1997–2013. It was reasonable and effective to determine the drought index of spring maize refinement suitability on the Loess Plateau with a time span of 17 years. The change in relative soil humidity was slow, and the ten-day data were reasonable and effective.
According to the relative soil humidity and production data of 18 spring maize agrometeorological observation stations on the Loess Plateau from 1997 to 2013, the production reduction rate of maize was calculated year by year. Although the yield of maize in 12 stations decreased, the relative soil humidity in each growth period of maize did not meet the drought category standards of relative soil humidity in different growth periods of maize specified in the Drought Category of Spring Maize in the North (QX/T 259-2015). It could be considered that the maize production reductions were not caused by drought [23]. There were seven stations (Minhe, Pingluo, Shuozhou, Baota, Fanshi, Xiyang, and Xifeng) at which the maize yield reduction rate corresponded to the drought standards of relative soil humidity. The Drought Category of Spring Maize in North China (QX/T 259-2015) was revised by combining the yield reduction rate and the drought disaster data on the Loess Plateau.
According to the statistics of relative soil humidity and production data of 18 spring maize agrometeorological observation stations on the Loess Plateau from 1997 to 2013, the production reduction rate of maize was calculated year by year [24]. Although the production of maize in 12 stations decreased, the relative soil humidity in each growth period of maize did not meet the drought category standard of relative soil humidity in different growth periods of maize specified in the Drought Category of Spring Maize in the North (QX/T 259-2015). It could be considered that the maize production reductions were not caused by drought. There were seven stations (Minhe, Pingluo, Shuozhou, Baota, Fanshi, Xiyang, and Xifeng) at which the maize yield reduction rate corresponded to the drought standard of relative soil humidity. The Drought Category of Spring Maize in North China (QX/T 259-2015) was subsequently revised by combining the production reduction rate and the drought disaster data on the Loess Plateau.
The indexes of drought-free and light drought in the seed–seedling stage and milk–maturing stage after revision in Pingluo increased by 5–10% compared with the original national standard value, and the indexes of moderate drought, severe drought, and extreme drought decreased by 5% compared with the original national standard value. The drought indexes of emergence and jointing increased by 5% compared with the original national standard values. The drought indexes of jointing–tasseling and tasseling–milking decreased by 5–10% compared with the original national standard values. Compared with the original national standard value, the indicators of drought-free, light drought, and moderate drought in Shuozhou decreased by 2–5%, and the indicators of severe drought and extreme drought increased by 5%. The drought indexes of jointing–tasseling and tasseling–milking decreased by 10–25% compared with the original national standard values. The drought indexes of the seedling–jointing stage and milk–maturing stage were the same as the national standard. The drought indexes in the periods of sowing–emergence, jointing–tasseling, and tasseling–milking in Baota decreased by 5–15% compared with the original national standard. The drought index in the period from seedling emergence to jointing increased by 5–15% compared with the original national standard value. The drought index of the milk–ripening period was the same as the national standard. The drought indexes of the seed–seedling stage, jointing–tasseling stage, and tasseling–milking stage in Fanshi decreased by 3–17% compared with the original national standard values. The drought indexes of the seedling–jointing stage and the milk–maturing stage increased by 3–15% compared with the original national standard values. Compared with the original national standard values, the indexes of drought-free and light drought in the seed–seedling stage and milk–maturing stage in Xiyang decreased by 2–15%, and the indexes of moderate drought, severe drought, and extreme drought increased by 5–15%. The drought indexes of the seedling–jointing stage and jointing–tasseling stage increased by 3–20% compared with the original national standard value. The drought index in the period from tasseling to milking was the same as the national standard. The drought indexes of the Xifeng seed–seedling stage and the seed–jointing stage increased by 10–25% compared with the original national standard value. The drought indexes of the jointing–tasseling stage, tasseling–milking stage, and milking–ripening stage decreased by 3–20% compared with the original national standard values.
In summary: (1) the drought standard value of relative soil humidity had increased by 3–25% at 71.4% of the stations in the seed–seedling stage and at 85.7% of the stations in the seed–jointing stage, which indicates that the national standard index of this growth period underestimates the drought category and the disaster degree of drought; (2) the drought standard value of relative soil humidity had decreased by 3–25% at 27.1% of the sites in the jointing–tasseling stage and at 71.4% sites in the tasseling–milking stage, indicating that the national standard index of this growth period overestimates the disaster degree of drought.

5.2. Reclassification of the Drought Index of Spring Maize on the Loess Plateau

Using the yield reduction rate and drought disaster data, we validated the revised relative soil humidity drought category standard for spring maize at different growth stages at seven stations (Minhe, Pingluo, Xifeng, Baota, Shuozhou, Fanshi, and Xiyang). The validation period of this study was 1997–2013, a total of 17 years, and each year was divided into five fertility stages, a total of 85 periods. During the validation process, the compliance was divided into three types, namely, compliance (where the drought level of the two is the same), basic compliance (where the difference between the two is one level), and non-conformance (where the difference between the two is two levels or more). Through the statistics of the three cases, the percentage of time periods satisfying the three cases in the total number of time periods was obtained; then, the changes in percentages before and after category correction were compared (Figure 5).
Figure 5 shows that the compliance degree of the relative soil humidity suitability index after correction had been significantly improved, and the compliance rate of each station category had increased by 8.2–20%, with Pingluo and Fanshi exhibiting the most obvious improvement in the compliance rate. Non-conformance rates of each station decreased by varying degrees, among which the rate of non-compliance at Shuozhou decreased the most, reaching 21.7%, and the rate of non-compliance at Fanshi decreased the least, by only 6.3%. After correction of the index category, the proportion of actual drought at the seven stations in line with the calculated results was significantly increased, while the proportion of non-conformity was significantly decreased. This showed that the revised category was more suitable for the study areas and could be used as the drought grading for studying the different growth stages of spring maize on the Loess Plateau.

5.3. Individual Validation of the Drought Index

Taking Shuozhou, Shanxi Province, as an example, the drought disaster data showed that moderate drought occurred in spring corn in July 2005, light drought occurred in spring maize in August 2008, and severe drought occurred in spring maize in 2010. The drought was judged using the revised relative soil humidity drought category standard, as shown in Table 3, and the drought degree of the corresponding growth period in the drought month was reduced, which was more in line with the actual drought situation.

6. Spatial Distribution of Spring Maize Drought Frequency on the Loess Plateau

According to the revised drought category standard of relative soil humidity of spring maize at different growth stages in different regions of the Loess Plateau, the occurrence frequencies of drought and above-drought events in 18 stations from 1997 to 2013 were calculated, and spatial distribution maps of the frequency of drought occurrence in different growth stages of spring maize on the Loess Plateau was obtained (Figure 6).
Figure 6 shows that drought in the emergence period mainly occurred in central and southern Shaanxi, northern Shanxi, central and eastern Gansu, and some regions of Qinghai Province, with a frequency of 25–75%. The maximum drought frequency was 75%, which occurred in pagodas. Figure 6b indicates that drought in the emergence and jointing stage mainly occurred in central Shaanxi, northeastern Shanxi, central and eastern Gansu, and some regions of Qinghai Province, with the drought frequency reaching 10–53%. The maximum drought frequency occurred in Xifeng: approximately 53%.
Figure 6c shows that the high-frequency drought area in the jointing–tasseling period was concentrated in the eastern part of the Loess Plateau, with a frequency of 20–41%, and drought occurred in other areas at a frequency below 20%, characterized by higher frequency in the east and lower frequency in the west. Figure 6d shows that drought in the period from tasseling to milking mainly occurred in central Shaanxi, eastern Shanxi, and most of Gansu, with a frequency of 6–41%. The maximum drought frequency occurred in Xi County: approximately 41%. Figure 6e shows that the high drought frequency in the milky and mature period occurred in the northeast of the Loess Plateau; the drought frequency in Xiyang and Changzhi was about 42%; and the drought frequency in other regions was 8–33%, occupying a large area of the Loess Plateau. The overall characteristics of high drought frequency in the northeast and low drought frequency in the central and western regions were presented. With the change in growth period, the area of high drought frequency gradually moved northward, the overall drought frequency decreased, and the degree of drought decreased. Ningxia Province did not exhibit obvious drought in each growth period; the overall occurrence frequency of each growth period was high in the east and low in the west.

7. Conclusions

We used the relative soil humidity and yield data at stations on the Loess Plateau for spring maize growth periods from 1997 to 2013 to refine the drought categories based on the yield reduction rate. The findings are as follows:
(1)
The multi-year average sowing date of spring maize on the Loess Plateau in Zone I was 9 April, whereas that in Zone II and Zone III was 26 April. The growth period of spring maize was mainly delayed—the delaying trend of the tasseling and maturity period was significant—and the number of days the whole growth period of spring maize lasted was prolonged. In terms of spatial distribution characteristics, it was shown that the east–west direction of each growth period was delayed, and gradually become later from west to east.
(2)
The relative soil humidity in May and September had a significant impact on the yield of spring maize. The soil depths in the jointing and heading stages of spring maize before and after July passed the 0.01 significance test; the relative soil humidity in the jointing and heading stages of spring maize exhibited the best correlation with the yield, which was superior to the relative humidity in other growth stages, followed by the milky and mature stages; and the relative soil humidity in the sowing and seedling stages had a minor impact on the yield.
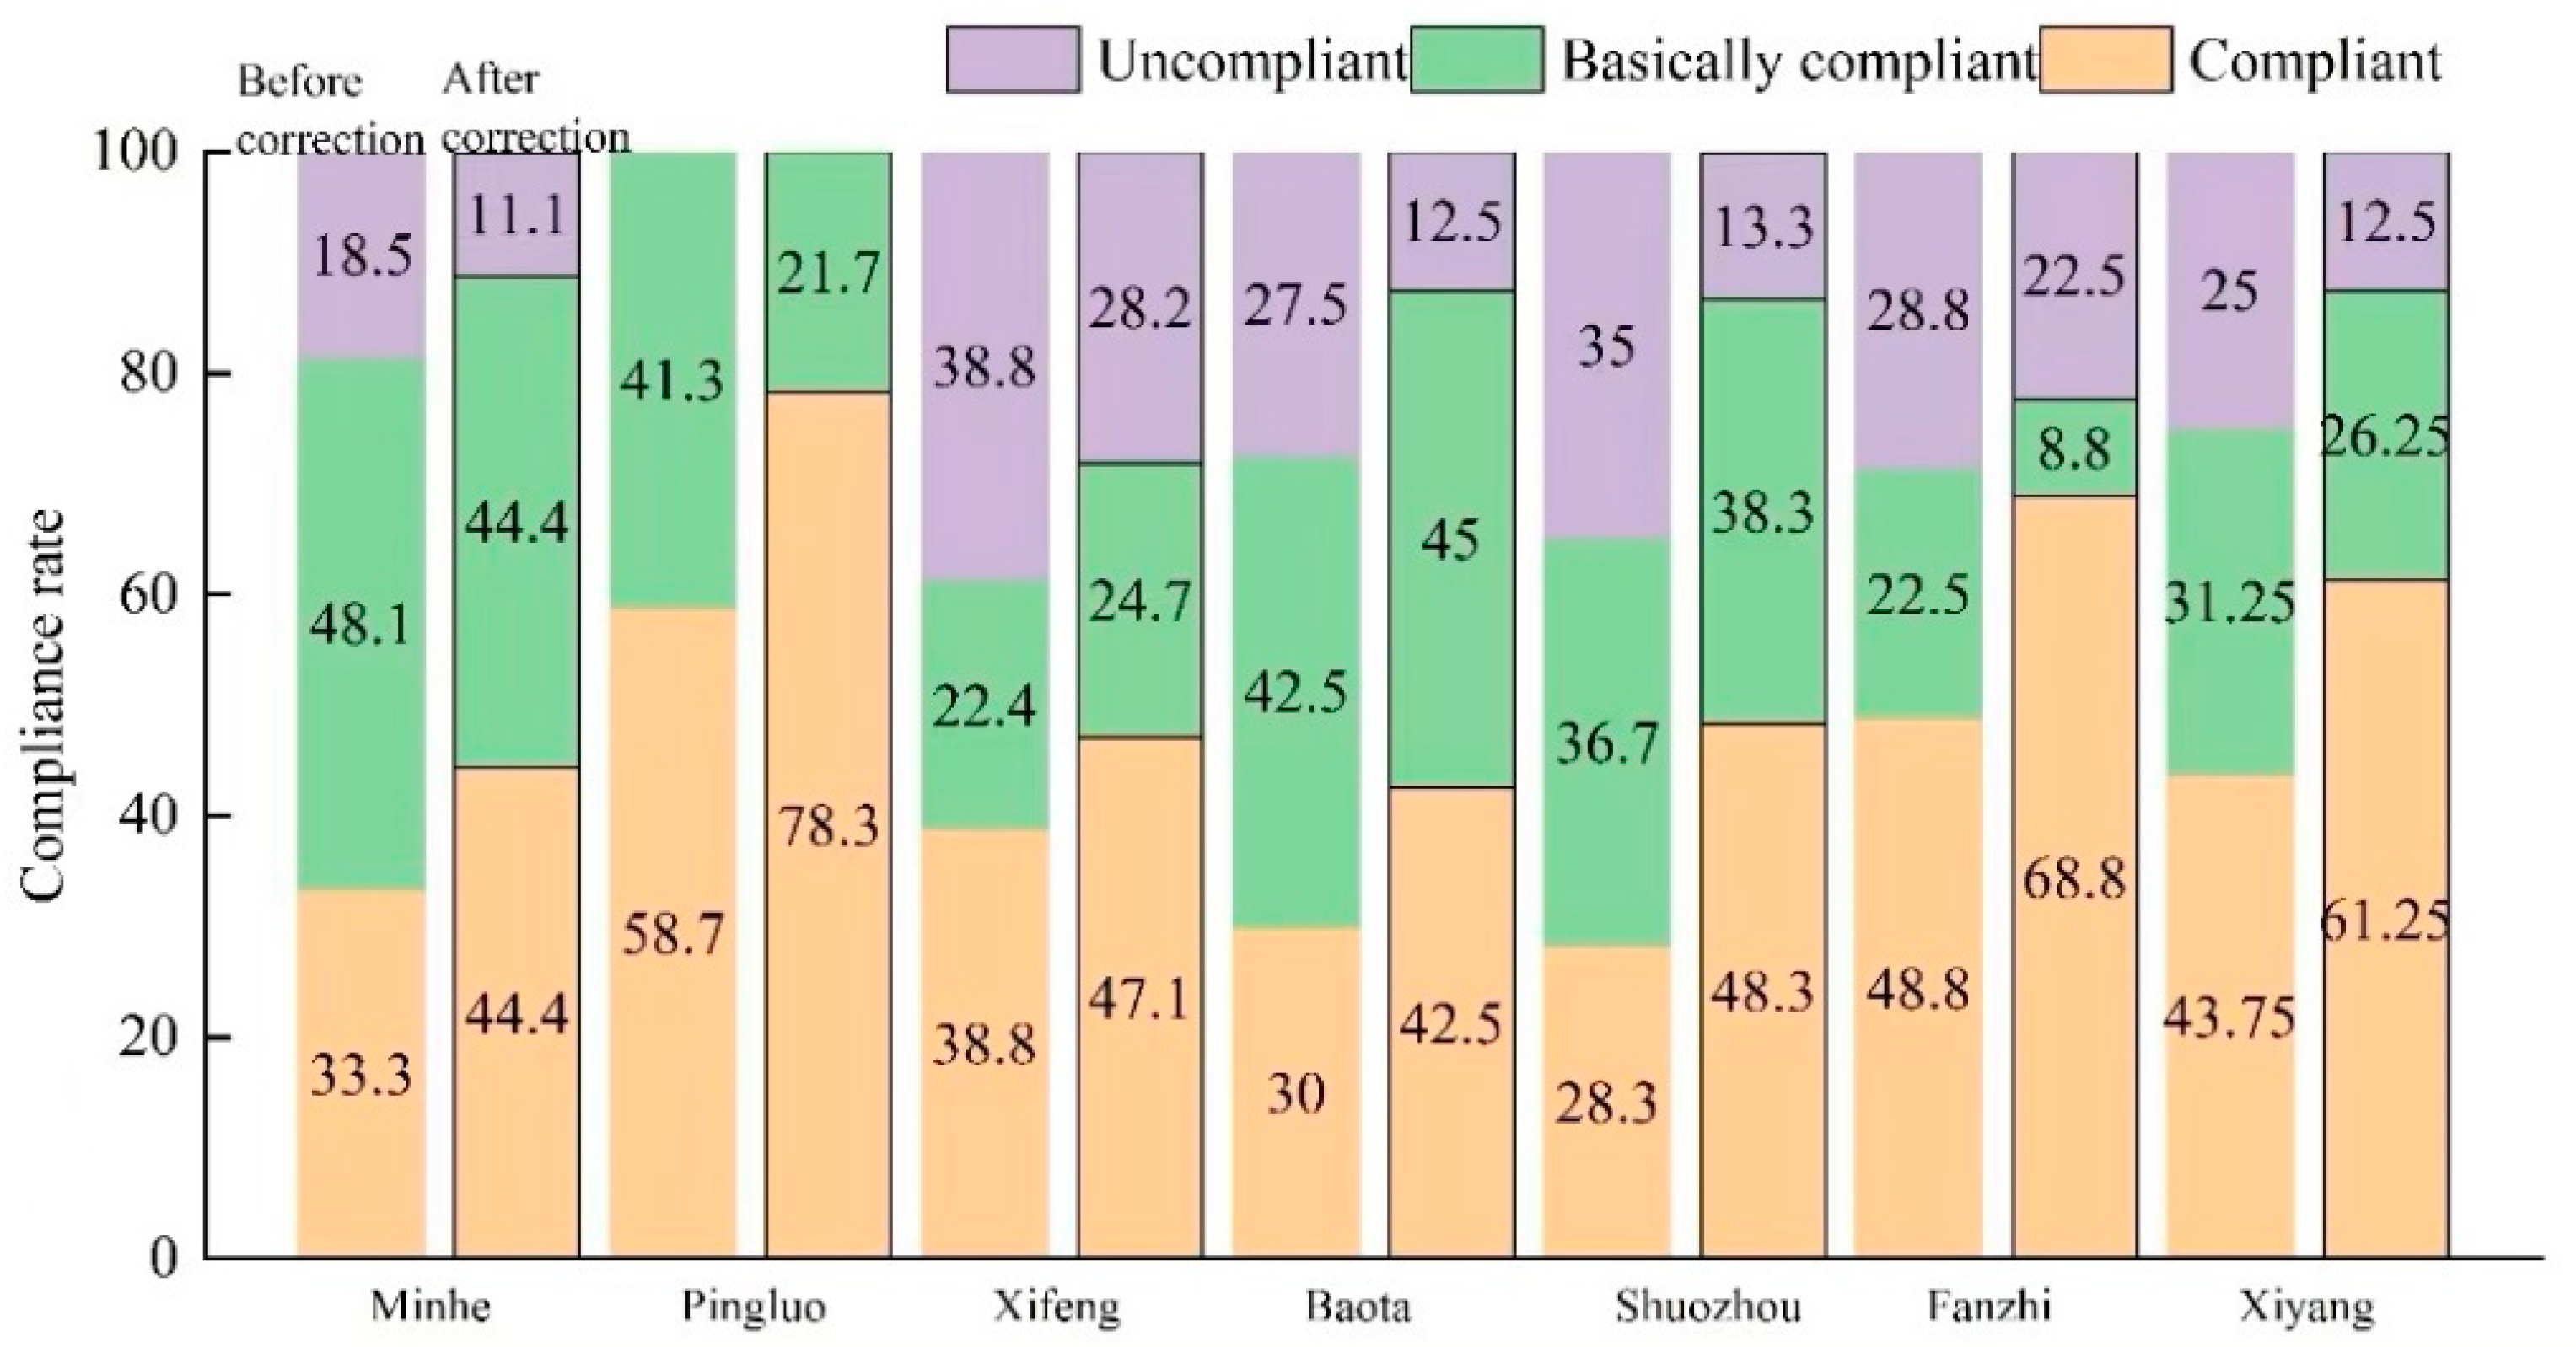
(3)
Based on the yield reduction rate of spring maize on the Loess Plateau, the original national drought standard was revised, and the drought categories of the relative soil humidity of spring maize were derived. The results showed that the relative soil humidity index of spring maize in each growth period increased or decreased by different degrees at each station, and the category at each station fluctuated within 25% compared with the national standard. Through the verification of the compliance rate of the drought index category standard and individual cases, it was shown that the relative soil humidity drought category classification standard of each station determined in this study can better indicate the severity of agricultural drought on the Loess Plateau. After correction, the compliance rate of the relative soil humidity suitability index was significantly improved, and the compliance rate of each station category was increased by 8.2–20%, with the most obvious changes in the compliance rate at Pingluo and Fanshi. Non-conformance rates of each station decreased by varying degrees, and the rate of non-conformance of the category at Shuozhou decreased the most, reaching 21.7%. The revised category was more suitable for the study area, and could be used for grading spring maize drought in different growth stages on the Loess Plateau.
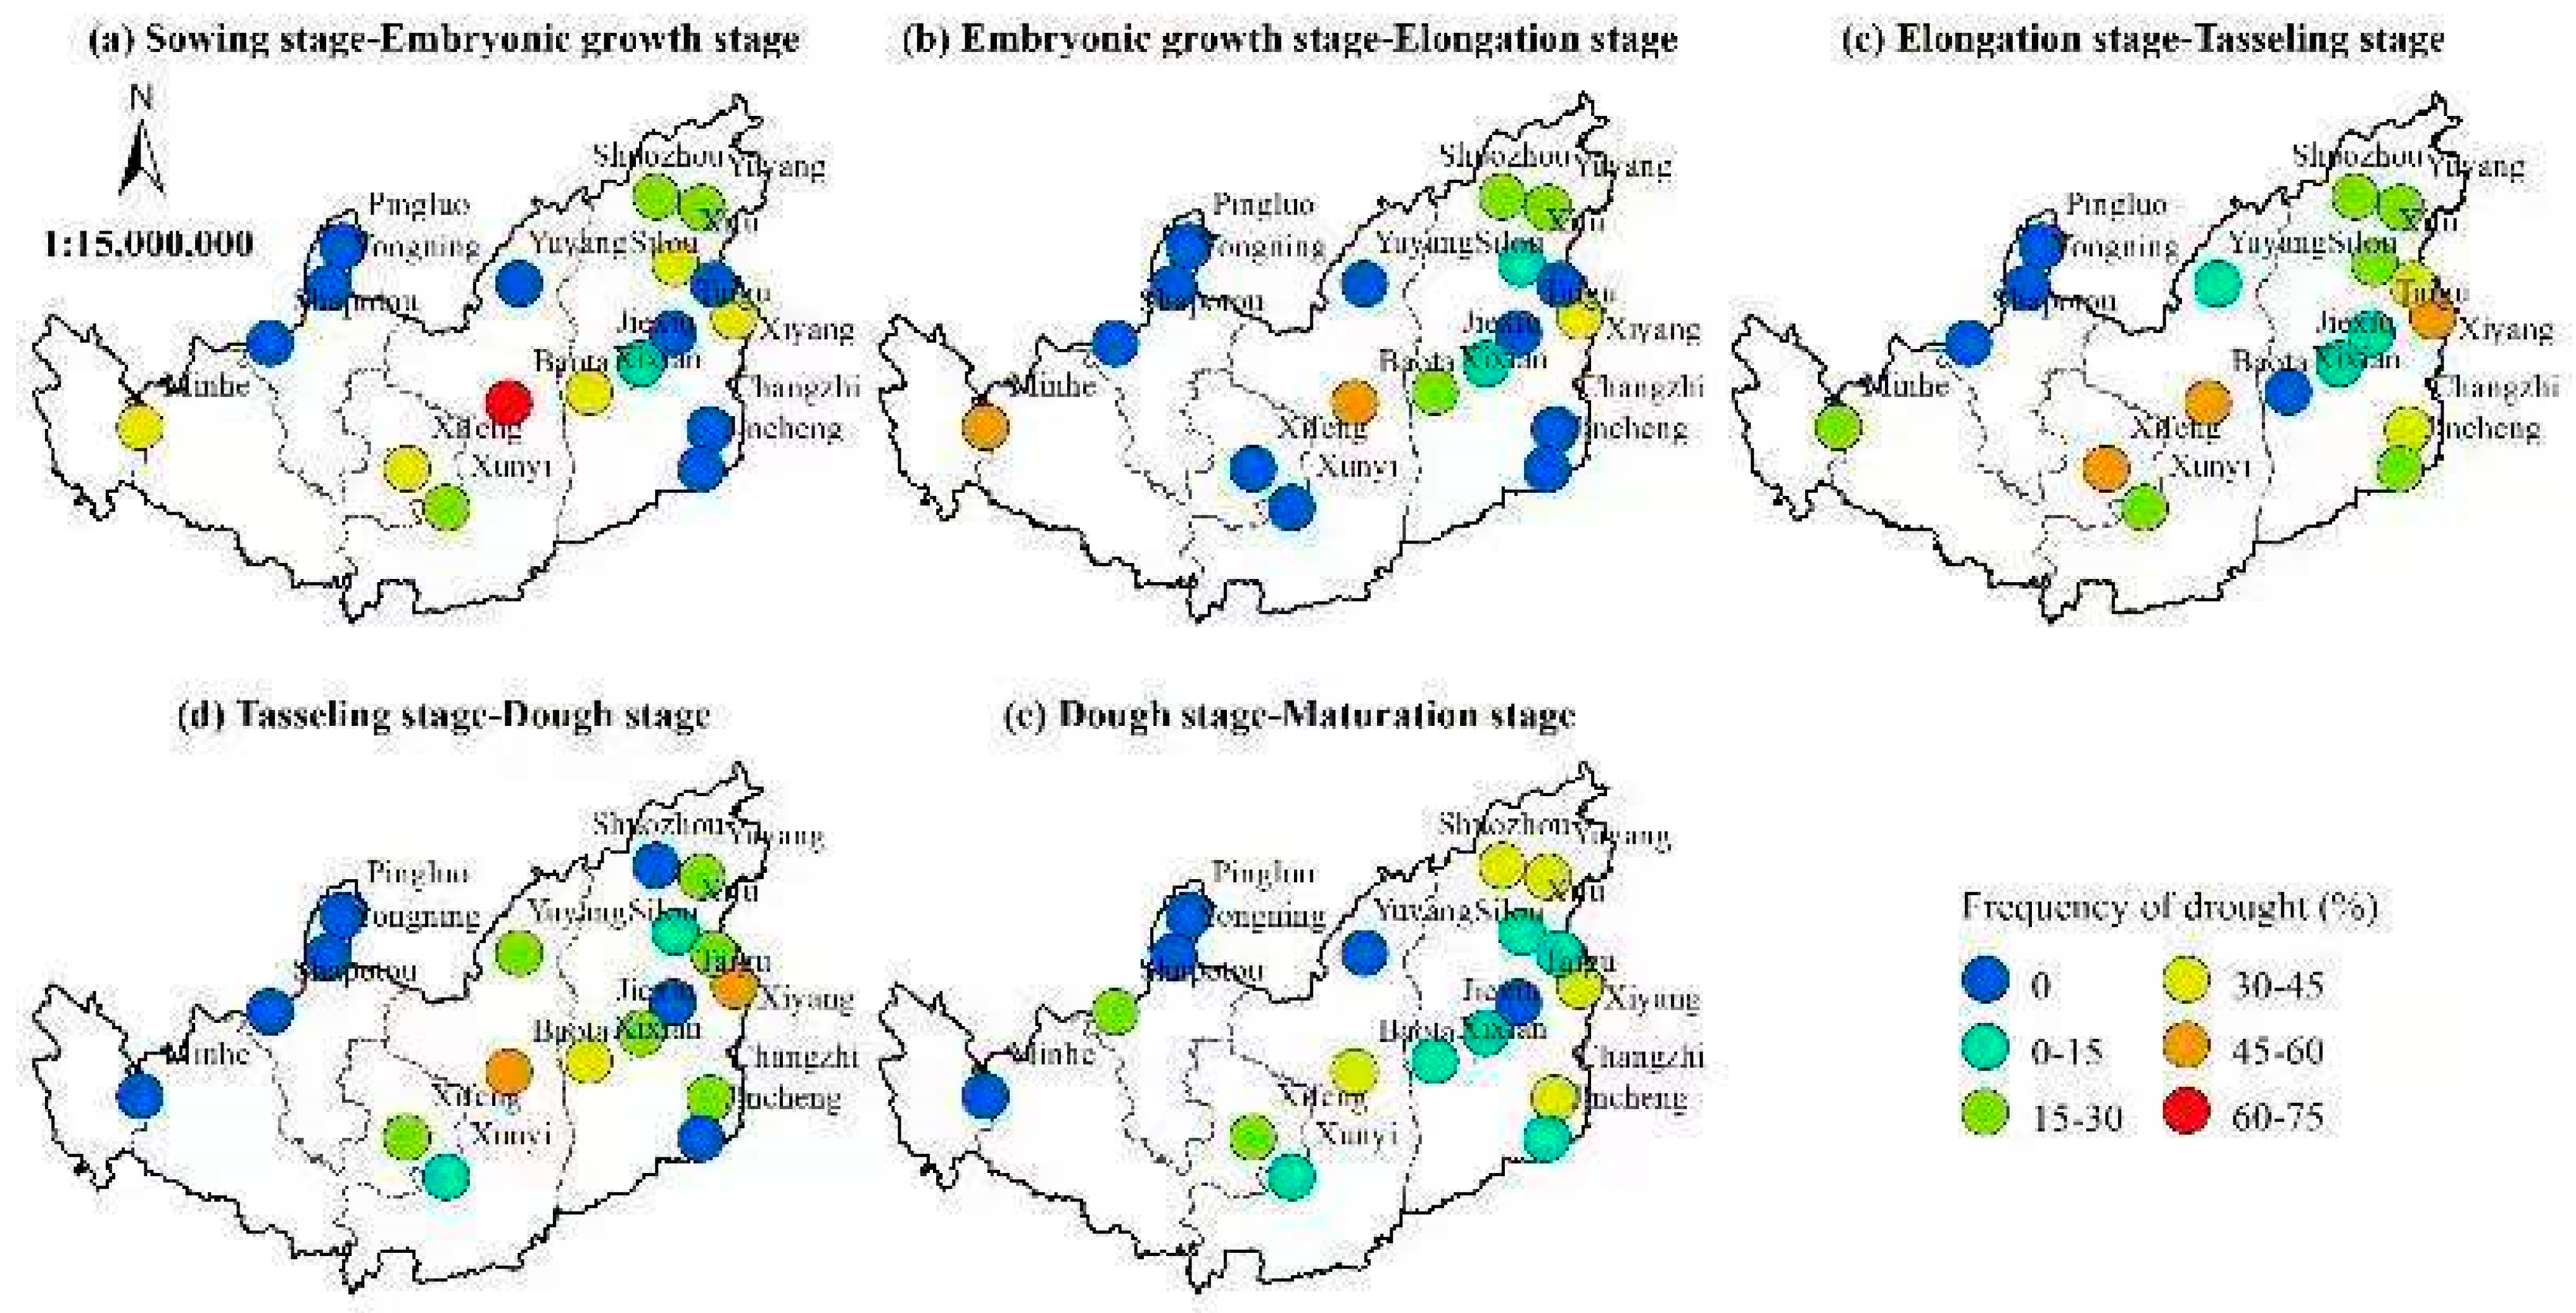
(4)
The drought frequency on the Loess Plateau was determined using the revised standard of relative soil humidity drought categories of spring maize. The results showed that moderate drought, severe drought, and extreme drought in the sowing and seedling stage of spring maize on the Loess Plateau from 1997 to 2013 mainly occurred in central and southern Shaanxi, northern Shanxi, central and eastern Gansu, and parts of Qinghai. The drought frequency was 25–75%, and the maximum drought frequency occurred in the pagoda of Gansu, which was 75%. With the change in the growth period of spring maize, the area with high drought frequency gradually moved northward, the drought frequency decreased overall, and the degree of drought decreased. The drought frequency in most regions during the milk–ripening period was less than 20%; the drought frequency in Xiyang and Changzhi in Shanxi Province was about 42%.

8. Discussion

Liu Qingqing [21] used the standardized precipitation evapotranspiration index (SPEI) and soil moisture deficit index (SMDI) to analyze the spatial–temporal evolution of agricultural drought and meteorological drought during the spring/summer maize growth period in Northeast, Northwest, and North China. The research results indicate that there was a certain degree of similarity in the spatiotemporal variation patterns of agricultural drought and meteorological drought during the maize growth period in different regions, but there were certain differences. Therefore, this study addressed the response law of yield-related factors of maize on the Loess Plateau to drought, analyzed the impact of meteorological and agricultural drought on maize growth and yield during the maize growth period, determined the key months and time scales of drought’s impact on maize growth and yield, and selected the drought indicators that were most suitable for reflecting maize yield response and corrected them, which has practical application and promotion significance.
Yan C. et al. (2023) calculated the standardized precipitation evapotranspiration index (SPEI) of maize growth periods at different scales based on measured meteorological data from 32 meteorological stations in Shaanxi Province from 1971 to 2020. They analyzed the spatiotemporal characteristics of drought in different maize growth periods and the impact of drought on the meteorological yield of maize [25]. Research has shown that the meteorological yield of maize is closely related to dry and wet conditions during the flowering period; the maize yield in most regions of Shaanxi Province was considerably affected by the dry and wet conditions throughout the entire growth period. Zhang X. F. (2022) utilized the daily climate data of 156 meteorological stations in dry farming areas of northern China from 1961 to 2018 and spring maize growth period data from 1991 to 2013, to divide the dryland area in northern China into four sub-areas according to their aridity index. Based on the crop water deficit index (CWDI), the temporal and spatial characteristics of spring maize drought in the dryland area of northern China were revealed by analyzing water supply and demand, inter-annual variation in CWDI, drought station ratio, and frequency. The results showed that in terms of spatial distribution, drought grade and frequency showed an obvious east–west distribution [26]. This demonstrated that exploring the temporal and frequency domain correlation between maize meteorological yield and drought indicators in different regions, and finally quantifying the relationship between dry and wet conditions and yield through regression analysis, could effectively provide a reference basis for ensuring disaster prevention and reducing agricultural production in the research area, as well as optimizing irrigation decision-making.

Author Contributions

Formal analysis and Writing—original draft, S.Y.; Conceptualization, Supervision, and Writing—review and editing, N.J. and L.X.; Formal analysis and Writing—review and editing, L.H. and J.W. The results of previous studies were similar to those of this article. All authors have read and agreed to the published version of the manuscript.

Funding

“Research on Quantitative Assessment of Climate Impact of Northwest Sichuan Ecological Demonstration Area on Surrounding Regions” (2022 NSFSC0208), a project funded by the Sichuan Natural Science Foundation; “Study on the Applicability of Refined Drought Indicators for Maize on the Loess Plateau”, project of Lanzhou Institute of Drought Meteorology, China Meteorological Administration (IAM202004).

Institutional Review Board Statement

Not applicable.

Informed Consent Statement

Not applicable.

Data Availability Statement

Not applicable.

Conflicts of Interest

The authors declare that they have no known competing financial interests or personal relationships that could have appeared to influence the work reported in this paper.

References

  1. Hou, Q.Q.; Pei, T.T.; Chen, Y.; Ji, Z.X.; Xie, B.P. Variations of drought and its trend in the Loess Plateau from 1986 to 2019. Chin. J. Appl. Ecol. 2021, 32, 649–660. [Google Scholar]
  2. Dong, C.Y.; Liu, Z.J.; Yang, X.L. Effects of different category drought on grain yield of spring maize in Northern China. Trans. Chin. Soc. Agric. Eng. 2015, 31, 157–164. [Google Scholar]
  3. Yang, W.J. Research on Corn Drought Monitoring Based on Landsat8 Growth Time Series Remote Sensing Information; Shihezi University: Shihezi, China, 2017. [Google Scholar]
  4. Wang, J.R.; Sun, C.J.; Zheng, Z.J.; Li, X.M. Drought characteristics of the Loess Plateau in the past 60 years and its relationship with changes in atmospheric circulation. Acta Ecol. Sin. 2021, 41, 5340–5351. [Google Scholar]
  5. Zhang, Q.; Yao, Y.B.; Li, Y.H.; Huang, J.P.; Ma, Z.G.; Wang, Z.L.; Wang, S.P.; Wang, Y.; Zhang, Y. Progress and prospect on the study of causes and variation regularity of droughts in China. Acta Meteorol. Sin. 2020, 78, 500–521. [Google Scholar] [CrossRef]
  6. Cheng, W.J. Causes and Prevention Measures of Drought Disaster in the Loess Plateau. J. Smart Agric. 2022, 3, 10–12. [Google Scholar]
  7. Li, M.; Deng, Y.Y.; Ge, C.H.; Wang, G.W.; Chai, X.R. Characteristics of meteorological drought across the Loess Plateau and their linkages with large-scale climatic factors during 1961–2017. Ecol. Environ. Sci. 2020, 29, 2231–2239. [Google Scholar]
  8. Li, J.; Jiang, B.; Hu, W. Characteristics of deep soil desiccation on rainfed G rain Croplands in different rainfall areas of the Loess Plateau of China. J. Nat. Resour. 2009, 24, 2124–2134. [Google Scholar]
  9. Zhang, J.Q. Risk assessment of drought disaster in the maize-growing region of Songliao Plain, China. Agric. Ecosyst. Environ. 2004, 102, 133–153. [Google Scholar] [CrossRef]
  10. Wang, P.X.; Gong, J.Y.; Li, X.W. Advances in drought monitoring by using remotely sensed normalized difference vegetation index and land surface temperature products. Adv. Earth Sci. 2003, 18, 527–533. [Google Scholar]
  11. Ghulam, A.; Qin, Q.; Zhan, Z. Designing of the perpendicular drought index. Environ. Geol. 2007, 52, 1045–1052. [Google Scholar] [CrossRef]
  12. Shi, X.X. Variations of Soil Moisture During the Growth Phase of Main Crops in Semi—Arid Region in Gansu. J. Arid Meteorol. 2011, 29, 461–465. [Google Scholar]
  13. Yao, X.Y.; Pu, J.Y.; Yao, R.H. Assessment of maize water adequacy in Loess Plateau of Gansu Province. Acta Ecol. Sin. 2010, 30, 6242–6248. [Google Scholar]
  14. Yin, H.X.; Zhang, B.; Zhang, J.X.; Zhang, T.F.; Li, X.Y.; Jin, Z.B. Spatial-Temporal Characteristics of Drought and Spring Maize in Eastern Gansu. Resour. Sci. 2012, 34, 2347–2355. [Google Scholar]
  15. An, X.L.; Wu, J.J.; Zhou, H.K.; Li, X.H.; Liu, L.Z.; Yang, J.H. Assessing the relative soil moisture for agricultural drought monitoring in Northeast China. Geogr. Res. 2017, 36, 837–849. [Google Scholar]
  16. Martínez-Fernández, J.; González-Zamora, A.; Sánchez, N.; Gumuzzio, A. A soil water-based index as a suitable agricultural drought indicator. J. Hydrol. 2015, 522, 265–273. [Google Scholar] [CrossRef]
  17. QX/T259-2015; Meteorological Industry Standard of the People’s Republic of China, Drought Category of Spring Maize in North China. China Standards Publishing House: Beijing, China, 2015.
  18. Zhang, J.; Mu, Q.; Huang, J. Assessing the remotely sensed Drought Severity Index for agricultural drought monitoring and impact analysis in North China. Ecol. Indic. 2016, 63, 296. [Google Scholar] [CrossRef]
  19. Bai, X.L.; Sun, S.X.; Yang, G.H.; Liu, M.; Zhang, Z.P.; Qi, H. Effect of Water Stress on Maize Yield During Different Growing Stages. J. Maize Sci. 2009, 17, 60–63. [Google Scholar]
  20. Hou, Q.; Li, J.J.; Wang, H.M. Dynamic Indexes of Water-saving irrigation based on Maize growth characteristics. J. Irrig. Drain. 2015, 34, 34. [Google Scholar]
  21. Liu, Q.Z.; Li, Y. Evaluation of the Impact of Spatial and Temporal Evolution of Drought on Maize Growth and Yield; College of Water Resources and Architectural Engineering: Xian, China, 2022. [Google Scholar]
  22. GB_ T 32136-2015; Meteorological Industry Standard of the People’s Republic of China, Agricultural Drought Rating. China Standards Publishing House: Beijing, China, 2015.
  23. He, Y.T.; Li, W.H.; Lang, H.O. Study on the characteristics of precipitation resources and the afforestation suitability in the Loess Plateau. Arid Zone Res. 2009, 26, 406–412. [Google Scholar] [CrossRef]
  24. Tang, Q.; Xu, Y.; Liu, Y. Spatial Difference Analysis of Land Use Dynamic Change in the Loess Plateau Region. Resour. Environ. Arid. Areas 2010, 24, 15–21. [Google Scholar]
  25. Yan, C.; Zhang, X.; Sun, Y.; Wei, Y.T.; Hu, X.M.; Luo, S.Q. Analysis of drought characteristics and its effect on maize yield in Shaanxi Province based on SPEI. Water Sav. Irrig. 2023, 1, 10–18. [Google Scholar]
  26. Zhang, X.F.; Zhang, B.; Ma, S.Q.; Huang, H.; Chen, J.; Zhou, J. Analysis on Temporal and Spatial Variation of Spring Maize Drought in Dry Farming Area of Northern China Based on Crop Water Deficit Index. Chin. J. Agrometeorol. 2022, 43, 749–760. [Google Scholar]
Figure 1. Regional division of the Loess Plateau and distribution map of agrometeorological stations.
Atmosphere 14 01481 g001
Figure 2. Temporal variation in spring maize growth periods on the Loess Plateau.
Atmosphere 14 01481 g002
Figure 3. Spatial distribution of daily sequence averages of critical fertility stages of spring maize on the Loess Plateau.
Atmosphere 14 01481 g003
Figure 4. Correlation coefficients between relative soil humidity and yield at different fertility stages of spring maize on the Loess Plateau.
Atmosphere 14 01481 g004
Figure 5. Compliance rate of drought-level criteria for soil moisture at different growth periods of maize on the Loess Plateau (%).
Atmosphere 14 01481 g005
Figure 6. Spatial distribution of drought frequency in different growth stages of spring maize in the Loess Plateau.
Atmosphere 14 01481 g006
Table 1. Relative soil humidity drought category standard for maize at different growth stages.
Drought CategoriesRelative Soil Moisture at Different Developmental Stages (%)
Sowing–SeedlingSeedling–JointingJointing–TasselingTasseling–MilkingMilking–Maturing
Drought-freeR > 65R > 60R > 70R > 75R > 65
Light
drought
55 < R ≤ 6550 < R ≤ 6060 < R ≤ 7065 < R ≤ 7555 < R ≤ 65
Moderate drought45 < R ≤ 5540 < R ≤ 5050 < R ≤ 6055 < R ≤ 6545 < R ≤ 55
Severe drought35 < R ≤ 4530 < R ≤ 4040 < R ≤ 5045 < R ≤ 5535 < R ≤ 45
Extreme droughtR ≤ 35R ≤ 30R ≤ 40R ≤ 45R ≤ 35
Table 2. Drought rating criteria for relative soil humidity at different fertility stages of maize.
StationDrought
Categories
Relative Soil Humidity at Different Stages (%)
Sowing–SeedlingSeedling–JointingJointing–TasselingTasseling–MilkingMilking–Maturing
Drought-freeR > 70R > 80R > 70R > 75R > 70
Light drought60 < R ≤ 7070 < R ≤ 8060 < R ≤ 7065 < R ≤ 7560 < R ≤ 70
MinheModerate drought40 < R ≤ 6060 < R ≤ 7050 < R ≤ 6055 < R ≤ 6550 < R ≤ 60
Severe drought30 < R ≤ 4050 < R ≤ 6040 < R ≤ 5045 < R ≤ 5540 < R ≤ 50
Extreme droughtR ≤ 30R ≤ 50R ≤ 40R ≤ 45R ≤ 40
Drought-freeR > 70R > 75R > 60R > 70R > 75
Light drought60 < R ≤ 7065 < R ≤ 7550 < R ≤ 6060 < R ≤ 7060 < R ≤ 75
PingluoModerate drought40 < R ≤ 6055 < R ≤ 6540 < R ≤ 5040 < R ≤ 6040 < R ≤ 60
Severe drought30 < R ≤ 4045 < R ≤ 5535 < R ≤ 4030 < R ≤ 4030 < R ≤ 40
Extreme droughtR ≤ 30R ≤ 45R ≤ 35R ≤ 30R ≤ 30
Drought-freeR > 60R > 60R > 50R > 50R > 60
Light drought53 < R ≤ 6050 < R ≤ 6040 < R ≤ 5040 < R ≤ 5055 < R ≤ 60
SuozhouModerate drought45 < R ≤ 5340 < R ≤ 5035 < R ≤ 4035 < R ≤ 4040 < R ≤ 55
Severe drought40 < R ≤ 4530 < R ≤ 4030 < R ≤ 3530 < R ≤ 3535 < R ≤ 40
Extreme droughtR ≤ 40R ≤ 30R ≤ 30R ≤ 30R ≤ 35
Drought-freeR > 65R > 65R > 60R > 70R > 65
Light drought60 < R ≤ 6560 < R ≤ 6550 < R ≤ 6060 < R ≤ 7055 < R ≤ 65
BaotaModerate drought40 < R ≤ 6050 < R ≤ 6040 < R ≤ 5040 < R ≤ 6045 < R ≤ 55
Severe drought35 < R ≤ 4045 < R ≤ 5035 < R ≤ 4030 < R ≤ 4035 < R ≤ 45
Extreme droughtR ≤ 35R ≤ 45R ≤ 35R ≤ 30R ≤ 35
Drought-freeR > 62R > 65R > 59R > 58R > 68
Light drought60 < R ≤ 6262 < R ≤ 6557 < R ≤ 5955 < R ≤ 5865 < R ≤ 68
FanshiModerate drought55 < R ≤ 6060 < R ≤ 6250 < R ≤ 5750 < R ≤ 5560 < R ≤ 65
Severe drought40 < R ≤ 5545 < R ≤ 6045 < R ≤ 5045 < R ≤ 5050 < R ≤ 60
Extreme droughtR ≤ 40R ≤ 45R ≤ 45R ≤ 45R ≤ 50
Drought-freeR > 63R > 65R > 70R > 75R > 75
Light drought55 < R ≤ 6360 < R ≤ 6568 < R ≤ 7065 < R ≤ 7570 < R ≤ 75
XiyangModerate drought45 < R ≤ 5555 < R ≤ 5055 < R ≤ 6855 < R ≤ 6560 < R ≤ 70
Severe drought40 < R ≤ 4550 < R ≤ 5545 < R ≤ 5545 < R ≤ 5550 < R ≤ 60
Extreme droughtR ≤ 40R ≤ 50R ≤ 45R ≤ 45R ≤ 50
Drought-freeR > 65R > 65R > 60R > 55R > 60
Light drought60 < R ≤ 6555 < R ≤ 6555 < R ≤ 6050 < R ≤ 5556 < R ≤ 60
XifengModerate drought55 < R ≤ 6050 < R ≤ 5550 < R ≤ 5545 < R ≤ 5053 < R ≤ 56
Severe drought45 < R ≤ 5545 < R ≤ 5045 < R ≤ 5040 < R ≤ 4550 < R ≤ 53
Extreme droughtR ≤ 45R ≤ 45R ≤ 45R ≤ 40R ≤ 50
Table 3. Drought disaster data and relative soil humidity drought level determination in Shuozhou (before/after revision).
Actual Drought ConditionsJointing–TasselingTasseling–Milking
July 2005, Moderate DroughtExtreme Drought/Severe Drought
August 2008, Light Drought Extreme Drought/Light Drought
July 2010, Severe DroughtExtreme Drought/Severe Drought
Disclaimer/Publisher’s Note: The statements, opinions and data contained in all publications are solely those of the individual author(s) and contributor(s) and not of MDPI and/or the editor(s). MDPI and/or the editor(s) disclaim responsibility for any injury to people or property resulting from any ideas, methods, instructions or products referred to in the content.

