
Fire Weather Conditions in Plantation Areas in Northern Sumatra, Indonesia


Arctic Research Center, Hokkaido University, Sapporo 0010021, Japan
Atmosphere 2023, 14(10), 1480; https://doi.org/10.3390/atmos14101480
Submission received: 14 August 2023
/
Revised: 11 September 2023
/
Accepted: 22 September 2023
/
Published: 24 September 2023
(This article belongs to the Special Issue Wildland Fire under Changing Climate (2nd Volume))
Abstract
:Peatland fires in Indonesia tend to be more active during El Niño-related droughts, with the exception of fires in North Sumatra. As North Sumatra is located north of the equator and is affected by the winter and summer monsoons, fires tend to be more active not only during the dry main season from January to March, but also in June and August due to short-term droughts. Due to these complex fire trends, no appropriate fire-related indices have been found in North Sumatra. In this paper, 20 years of fire (hotspot (HS) data from 2003 to 2022, weather data (hourly and daily), and various satellite data were used to analyze fire weather conditions in Dumai plantation areas. Analysis results of 20 fire incidents (largest fires (HSs) of each year) showed the following fire weather conditions: high wind speeds (>19 km h−1), high temperatures (>33 °C), and low relative humidity (<50%). Based on the results of fire and weather analyses, several fire-related indices selected from various satellite-measured data were examined. Precipitable water vapor has the highest negative correlation with fires. It is hoped that this new fire index will be used for fire prevention not only Sumatra but also in other areas in Indonesia.
1. Introduction
The tropical rainforests of Southeast Asia, including North Sumatra, are the most deforested areas in the world [1]. Indonesia has the highest rate of deforestation and forest degradation in the world due to rapid plantation development, timber extraction, and active peatland fires on its three main islands of Sumatra, Kalimantan, and Papua [2,3,4,5]. Among them, Riau Province in North Sumatra has the highest rate of deforestation. More than 4 million hectares (ha) of forest (65%) were lost. Forest cover in Riau declined by 65 percent over the past 25 years from 1982 [6].
Active peatland fires in Indonesia contribute significantly to emissions of various greenhouse gases, fine particulate matter (PM), and aerosols [7]. Very active fires in 1997–1998 and 2015 during droughts associated with very strong El Niño events burned about 9.7 Mha [8] and 2.6 Mha [9], respectively. Indonesia released more than 870 Tg of carbon into the atmosphere in the 1997 fires [10]. Peatland fires during July–October 2015 emitted about 2 Tg of carbon into the atmosphere, 81% of which was in the form of carbon dioxide (CO2), 16% carbon monoxide (CO), and 2.3% methane (CH4) [11].
Peatland fires in North Sumatra tended to occur which were not related to the El Niño event. Peatland fires in June 2013 (a non-drought year) were short-lived (one week) and limited to a localized area in North Sumatra (estimated 163,336 ha, 1.6% of Indonesia) [12]. Nevertheless, the June 2013 fire is estimated to have emitted a large amount of greenhouse gases (GHG), 113–231 Tg CO2 (19–43 Tg C). These emissions correspond to the average emissions in Indonesia for the period 2000–2005 [12,13]. Haze from the June 2013 fire in North Sumatra plantation areas became the worst air pollution event ever recorded in Singapore and was rated “very unhealthy” [12].
The impact of temperature rise due to recent climate change on peatland fires in Indonesia is unknown due to the lack of long-term, reliable meteorological and fire data. However, there are several reports and their estimations are as follows: temperatures will rise about 0.8 °C by 2030 and exceed 1.5 °C in the near future (2021–2040) [14], the rainy season will end earlier, and the length of the rainy season will become shorter. In addition, several studies have noted that since 1960, there has been an increase of 88 hot days and 95 hot nights per year, especially during the summer months of July through September [14], a decrease in average annual precipitation [15], and that the frequency of El Niño events may increase with rising sea temperatures, leading to increased drought [16,17]. A. Sulaiman et al. (2023) analyzed the teleconnected relationship between groundwater levels (GWL) and extreme climatic conditions such as ENSO and positive Indian Ocean Dipole (IOD+). They showed that the dropped sea surface temperature anomaly induced by anomalously easterly winds along the southern Java–Sumatra Straits occurs several weeks before the GWL drops to the lowest value [18]. For peatland fires in North Sumatra, the above estimates and trends for the rainy season, sea water temperature, and drought are not so easily applicable because active fires occur under specific fire weather conditions [19].
To assess future fire activities under climate change, the first step is to define the weather conditions on the fire date. Fire weather conditions can be determined by identifying the temperature, humidity, pressure, wind speed, wind direction, precipitable water vapor (PWV), outgoing longwave radiation (OLR), and groundwater level (GWL) on the fire date. However, we could not define fire weather conditions in Indonesia until recently, mainly due to the lack of long-term hourly weather data near active fire regions. But we have access to hourly data for several sites in Indonesia and have already analyzed peatland fire weather conditions in plantation areas in Sumatra [19], Papua in southern Indonesia [20], and the Mega Rice Project (MRP) region in Kalimantan [21]. Three reports cleared their fire weather conditions and fire-related indices except for North Sumatra.
Based on the results of the previous report on Sumatra [19], we carefully analyzed fires (HSs) and various weather data for Dumai plantation areas to determine fire weather conditions and appropriate fire-related indices in this report.
2. Materials and Methods
2.1. Study Area
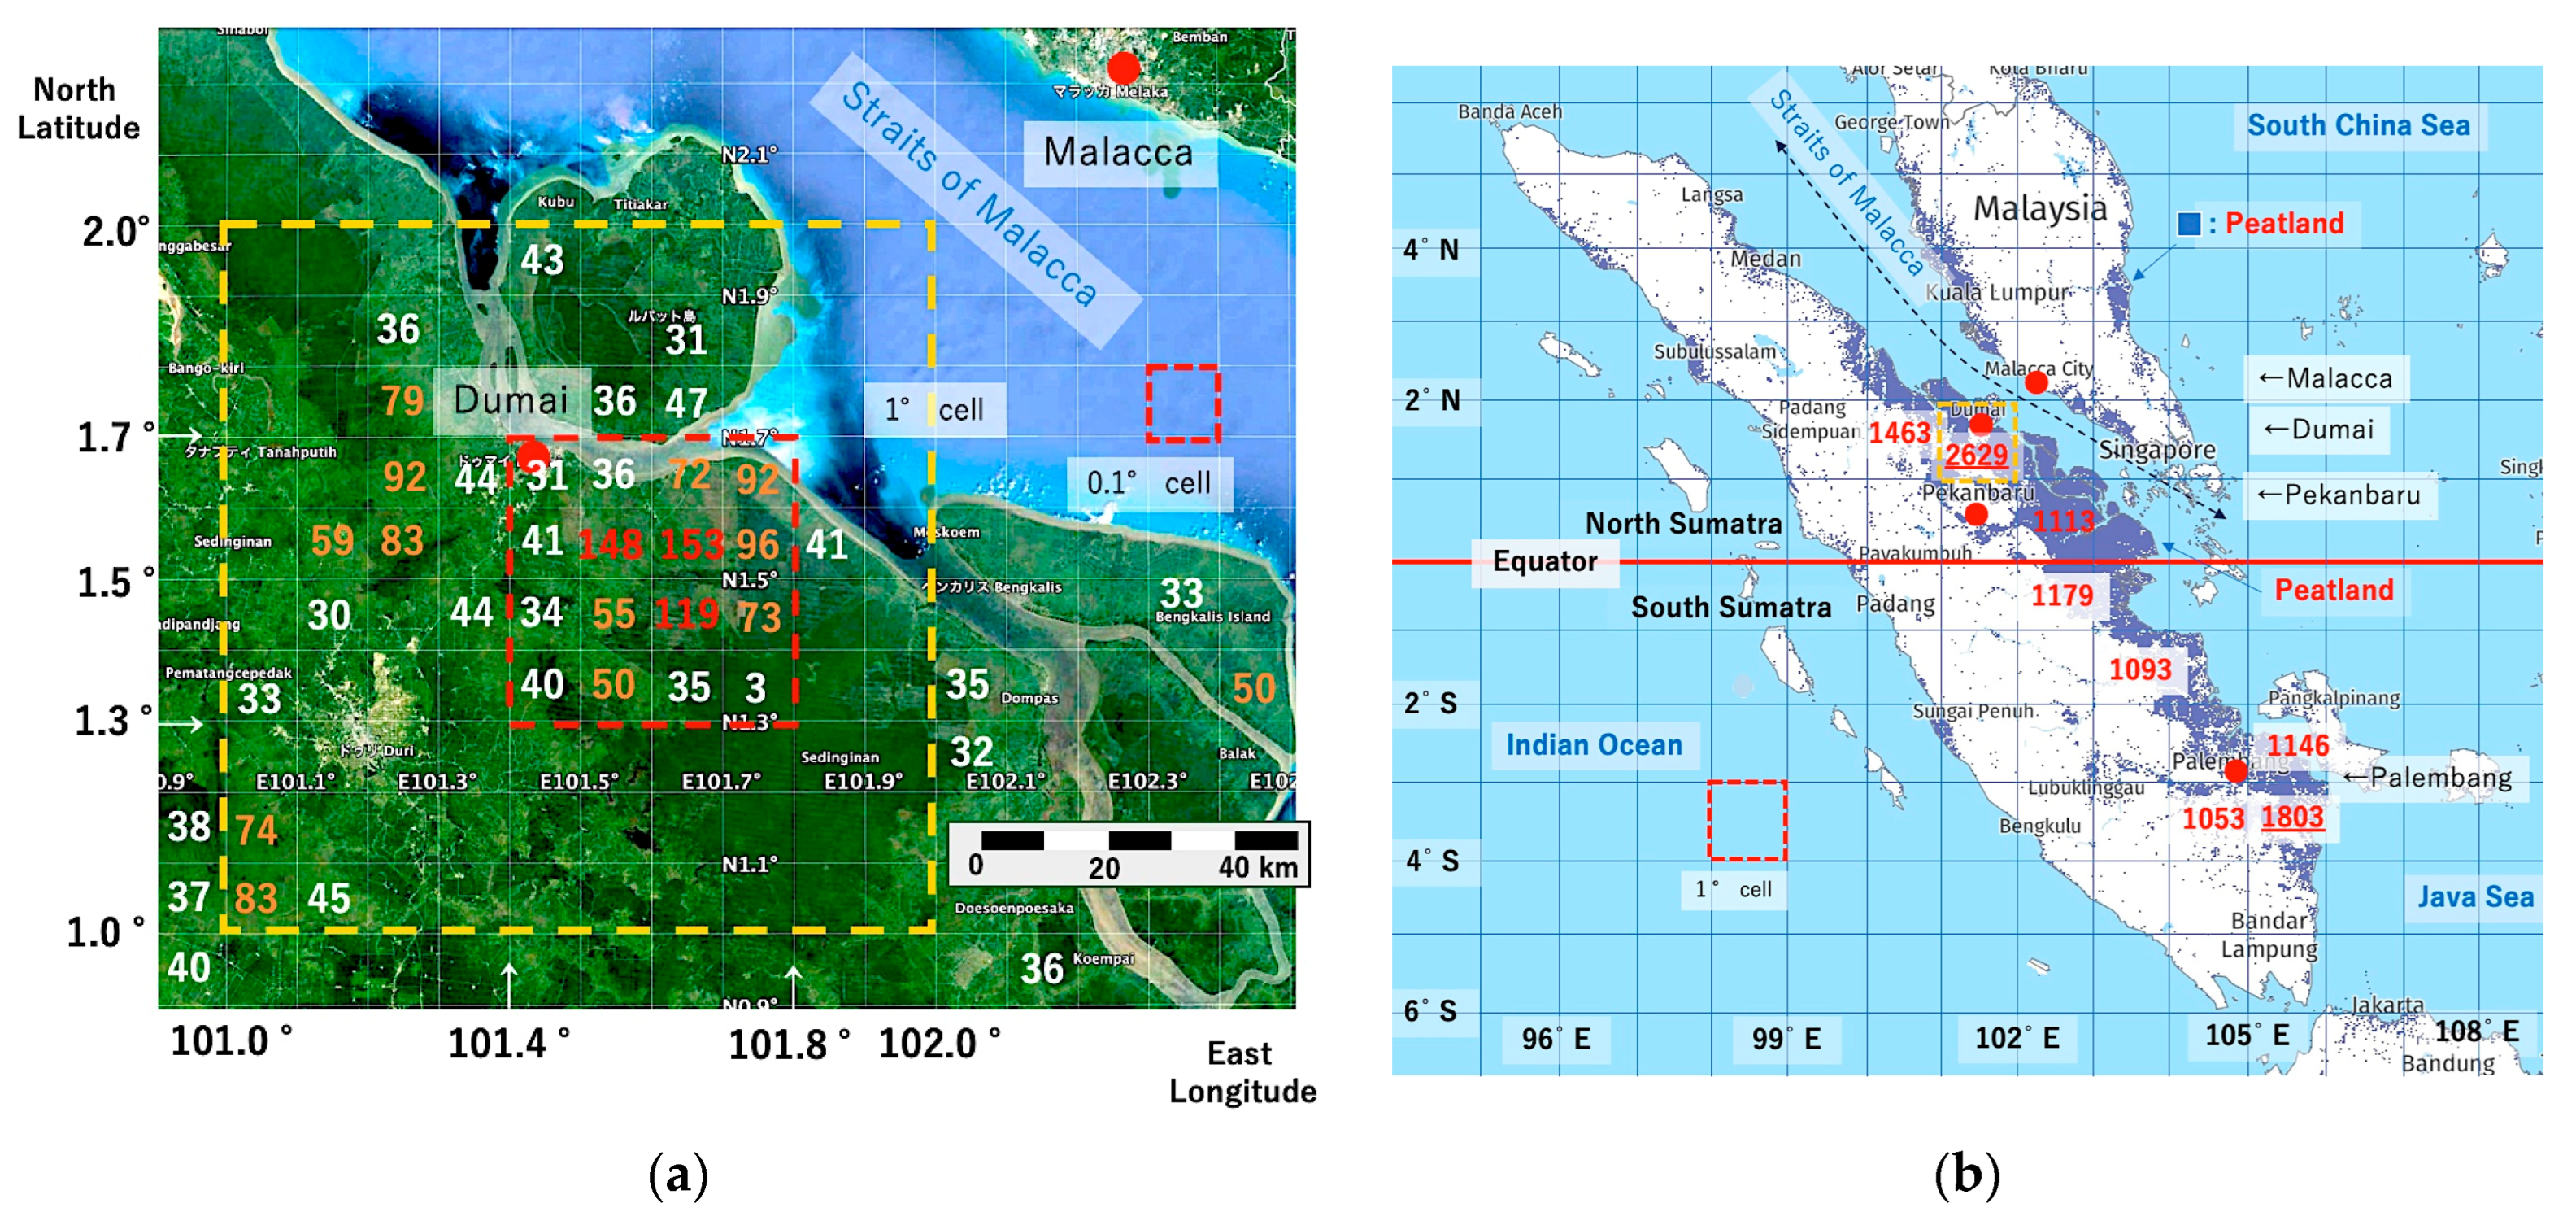
The study area (1.3–1.7° N, 101.4–101.8° E, sixteen 0.1° grid cells) in Figure 1a is a plantation area in the southeast of the Dumai, Riau province in Indonesia and located in the most fire-prone area (average number of hotspots (HSs) = 2629 for 1° grid cell) in Sumatra Island, as shown in Figure 1b. Average number of HSs in the study areas (sixteen 0.1° grid cells) is 1076. Although the area of the Dumai plantation areas is small (about 1/100th), about 41% (=1076/2629) of fires (HSs) occurred in the study areas.
2.2. Fire (Hotspot) and Weather Data
To assess wildfire occurrence, 20 years of hotspot (HS) from 1 July 2003 to 31 December 2022 detected by MODIS (Moderate Imaging Resolution Spectroradiometer) on the Terra and Aqua satellites data were used. Hotspots (HSs) data were obtained from NASA (Information for Resource Management System https://firms.eosdis.nasa.gov/download (accessed on 15 January 2023)). Daily number of HSs was used to identify dates of fire incidents and active fire periods.
Various daily mean weather maps, such as air temperature, vector wind, pressure of 500 hPa, 850 hPa, 925, and 1000 hPa, sea surface of temperature (SST), NOAA-interpolated outgoing longwave radiation (OLR), precipitable water vapor (PWA) and each of those anomalies, were obtained from the NOAA web site “Daily Mean Composites” (the NCEP/NCAR 40-year reanalysis data (https://psl.noaa.gov/data/composites/day/ (accessed on 15 January 2023)). We analyzed these daily mean weather maps to extract fire weather conditions on fire incident dates and during active fire periods.
Twenty years of daily rainfall data from 2003 for the Dumai (1.66° N, 101.45° E) were obtained from the JAXA website (https://sharaku.eorc.jaxa.jp/GSMaP_CLM/index.htm (accessed on 15 January 2023). The rainfall data were made by processing information from multiple precipitation-observing satellites and geostationary meteorological satellites.
Hourly weather data (temperature, relative humidity, wind speed, wind gust, wind direction, and atmospheric pressure) in Malacca (2.25° N, 102.25° E) were obtained from the Weather Underground website (https://www.wunderground.com/history/daily/id/banjarbaru/WAOO/%20date/2015-9-15, accessed on 26 July 2023).
2.3. Analysis Methods
The MODIS hotspot (HS) data from 20 years (2003–2022) were used for fire (daily hotspot) distribution in Dumai plantation areas (the study area), as shown in Figure 1. The distribution of fires (HSs) was determined by setting the 0.1° and 1° grid cell (0.1° × 0.1° and 1° × 1°, latitude and longitude). HS data were used to show the number of HSs on peak fire (HS) dates of 20 years, fire history, fire-prone areas, fire season, and active fire periods in the study area and North Sumatra (>0° N).
Twenty years (2003–2022) of daily precipitation data for Dumai plantation areas were used to examine the relationship between rainfall and fire activity.
Fire weather conditions on peak fire (HS) dates were examined using meteorological data (temperature, relative humidity, wind speed, wind gust, wind direction, and pressure) every 60 min from midnight (12:00 AM) in Malacca.
Various NOAA composite weather maps (such as air temperature, vector wind, pressure of 500 hPa, 850 hPa, 925, and 1000 hPa, sea surface of temperature (SST), NOAA-interpolated outgoing longwave radiation (OLR), precipitable water vapor (PWA), and their anomalies (1991–2020 climatology)) were used to determine fire weather conditions on the peak fire (HS) dates of each year.
For fire-related indices, the Niño 3.4 index, sea surface temperature (SST), NOAA-interpolated outgoing longwave radiation (OLR) anomaly, and precipitable water vapor (PWV) and their anomalies were used to show the correlation with the number of HSs in Dumai plantation areas.
3. Results
3.1. Fire and Peatland Distribution
Fire spatial distribution in Sumatra Island and the study area (plantation areas in the southeast area of Dumai) is shown in Figure 1. The total number of hotspots (HSs) detected from 2003 to 2022 was 521,676 [19].
The analysis using 1° resolution in the previous report [19] identified eight frequent fire areas in Sumatra, indicated in Figure 1b by red numbers (the average number of HSs of the last 20 years, >1000). Figure 1b shows that one grid cell (1–2° N, 101–102° E) in the Dumai region had the largest number of HSs (2629) indicating the most fire-prone area in Sumatra. This grid cell includes Dumai plantation areas.
Figure 1b shows the study area (1.3–1.7° N, 101.4–101.8° E, sixteen 0.1° grid cells) in Dumai plantation areas shown by the red dotted rectangle. Vegetation of the study area is mostly the Elaeis guineensis tree except for the most eastern and southern cells (1.3–1.4° N, 101.7–101.8° E), where virgin forest covers the area. Values above 30 for each 0.1° grid cell show frequent fire areas of the study areas and nearby areas. The average total number of HSs in the study region was 1076 HSs. Active fires occurred in 2005 and 2014, and their total numbers of HSs were 6746 and 3553, respectively.
3.2. Fire History in Dumai
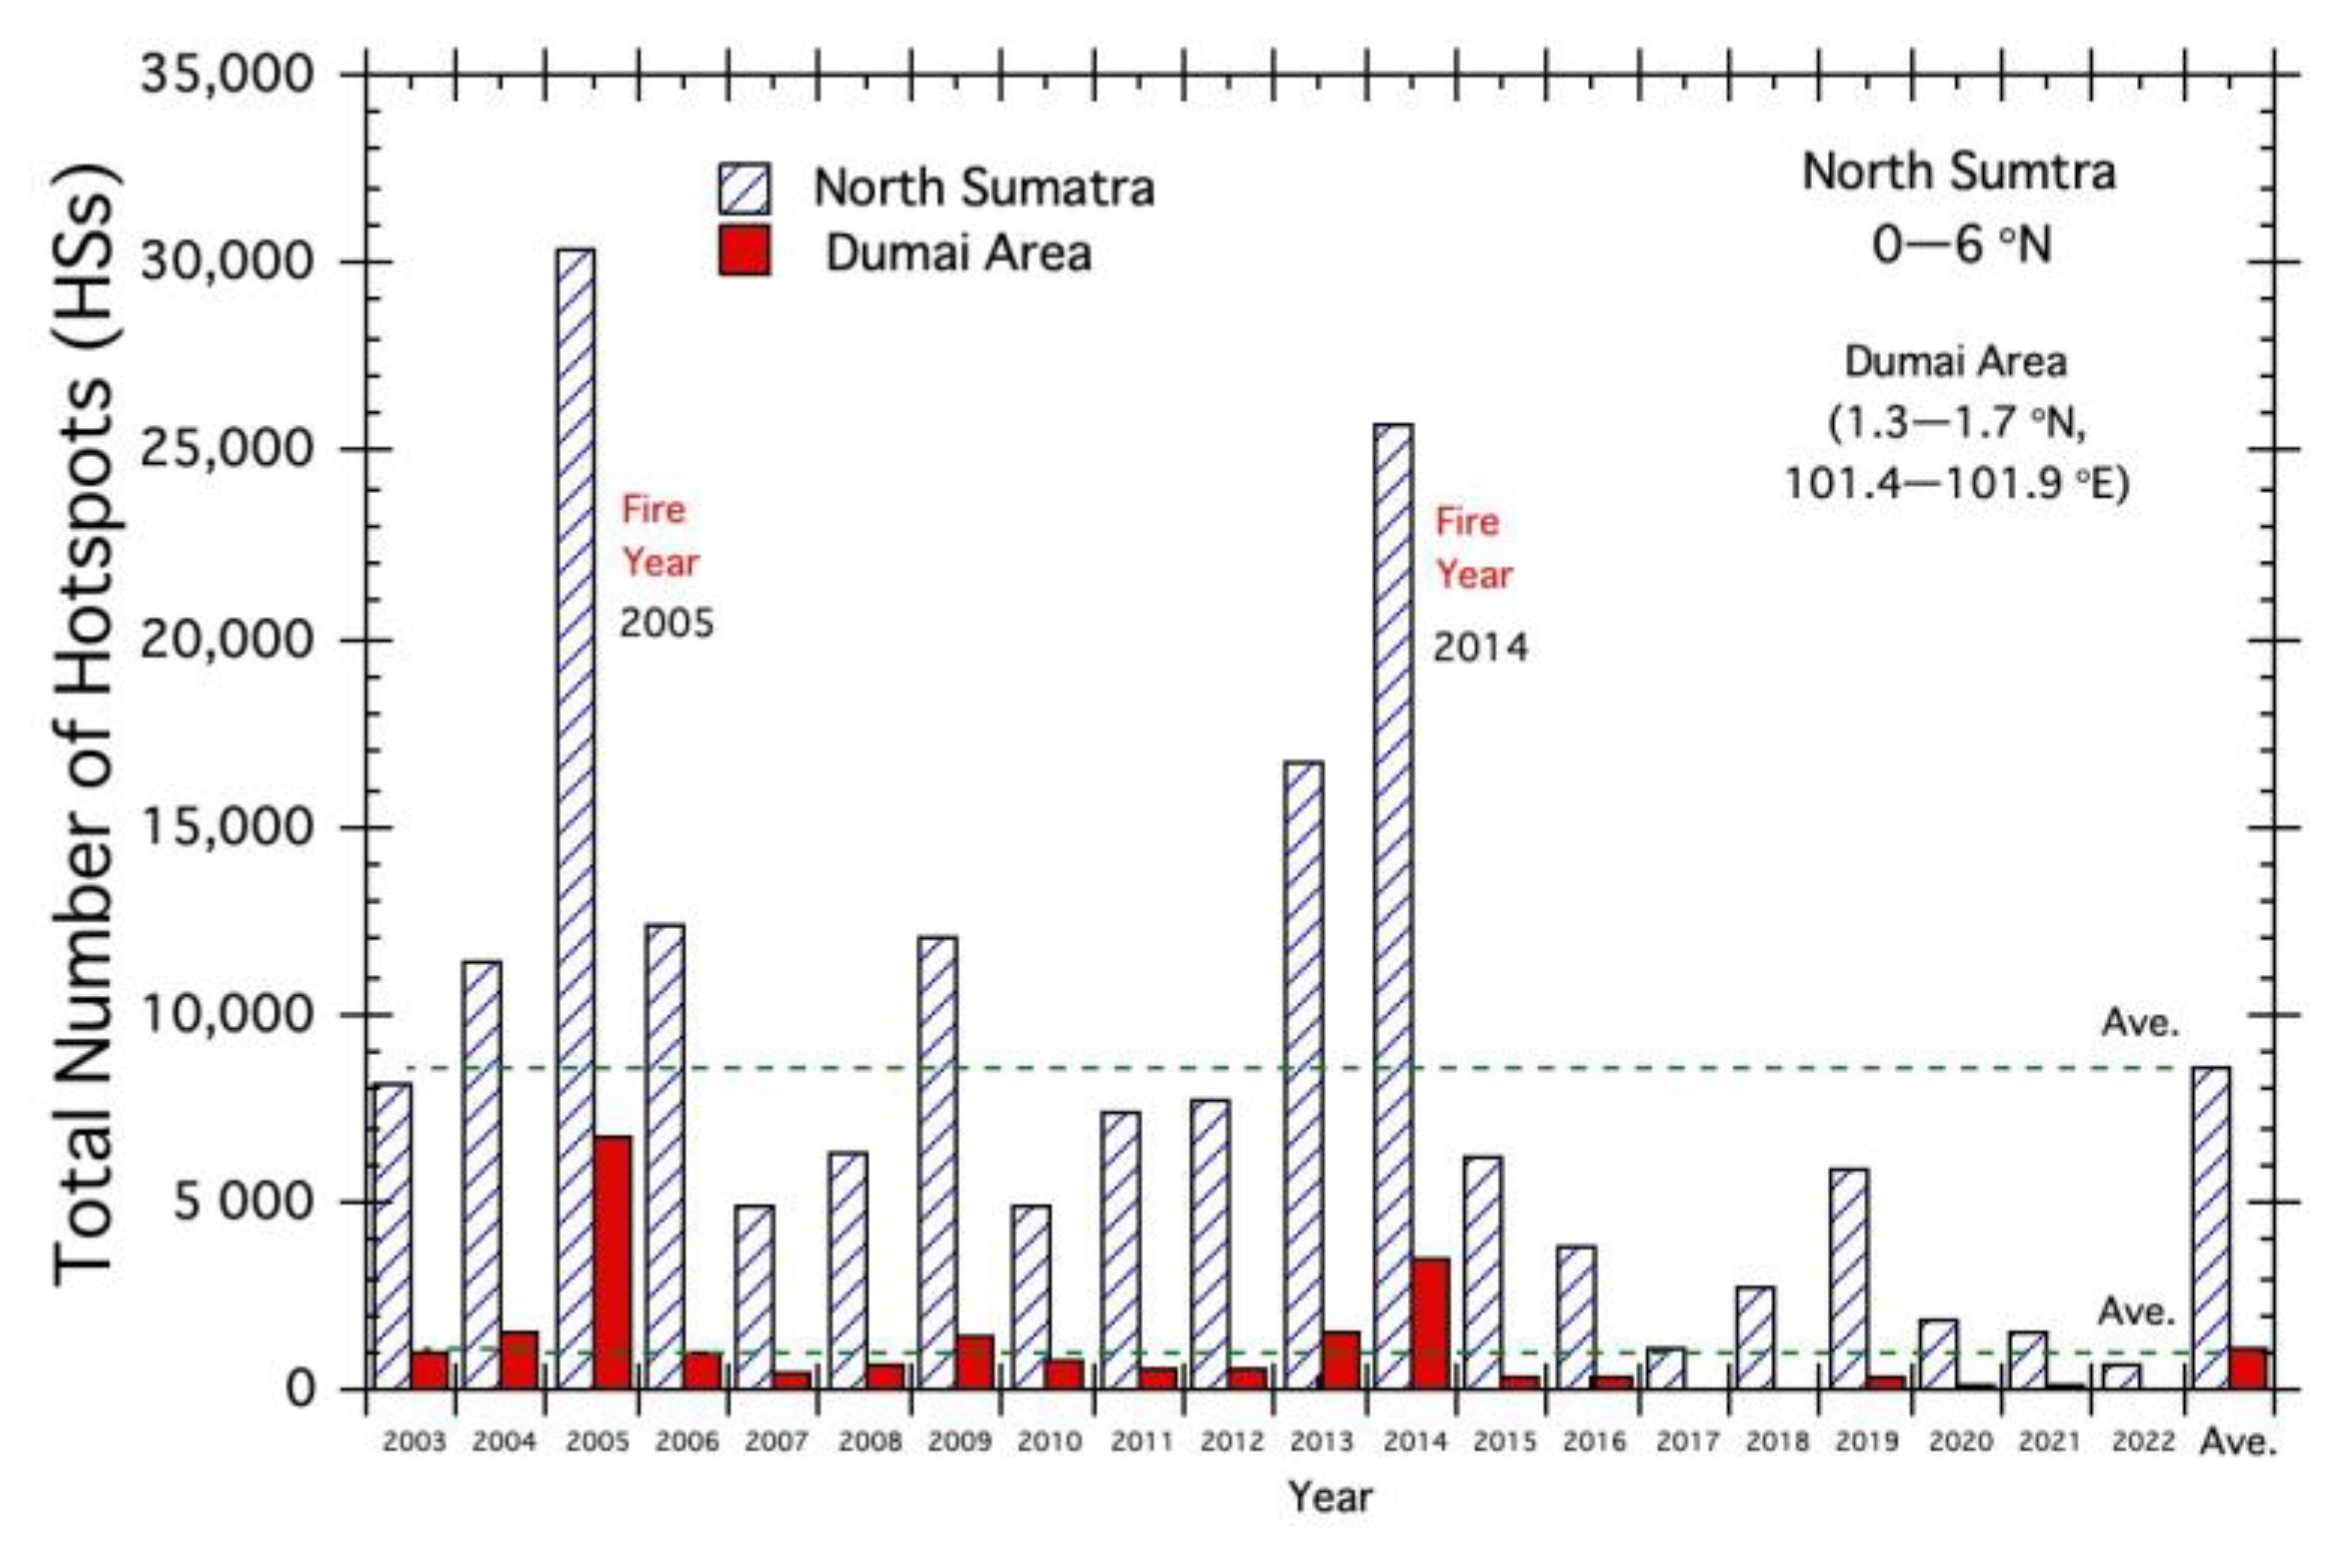
Figure 2 shows the recent annual fire history from 2003 in the Dumai plantation areas and North Sumatra. The number of HSs in two years (2005 and 2014) largely exceeds the average annual value (green straight lines for Dumai and North Sumatra shown in Figure 2). Those two years will be referred to as “fire years” in this report. Active fires in 2005 and 2014 are the unique fire trends observed in North Sumatra, suggesting unique fire weather conditions. Fire years in South Sumatra and Central Kalimantan happened in 2006 and 2015 [21]. 2015 was also the only year in which fires occurred in South Papua since 2012 [20].
3.3. Fire Weather Conditions
3.3.1. Fire and Rainfall
- Annual hotspots (HSs) and rainfall.
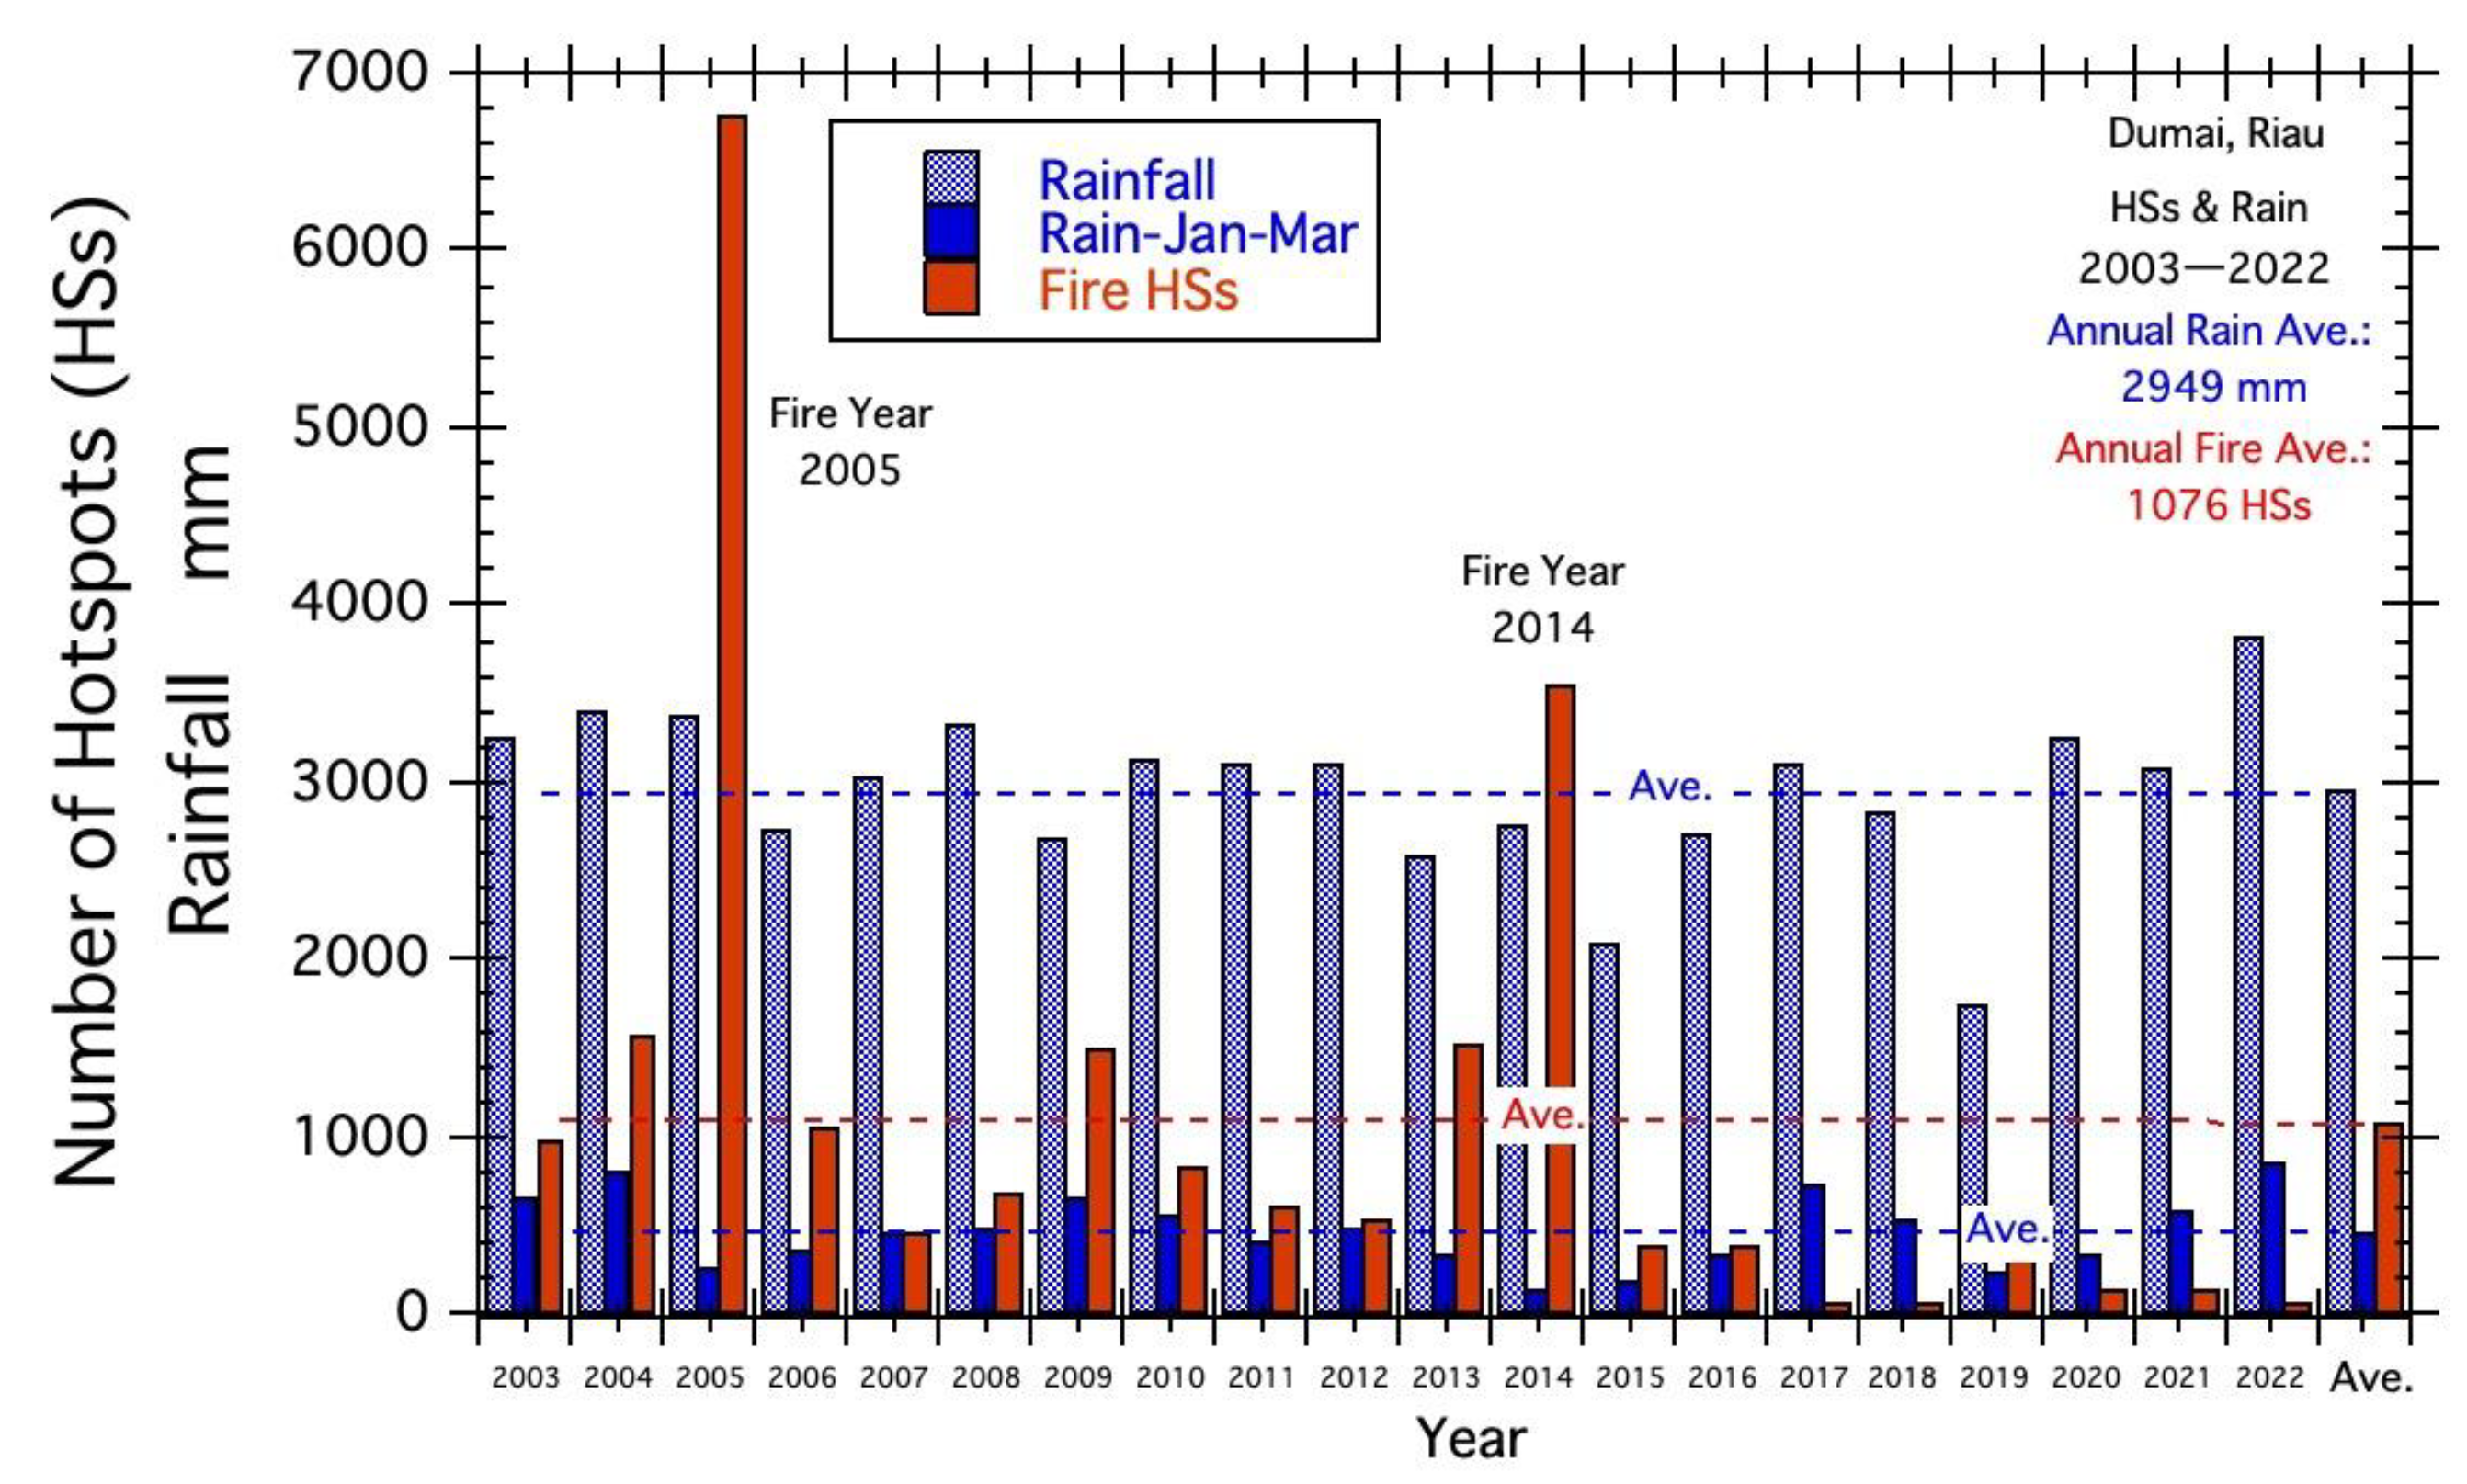
An annual number of HSs and rainfall in Dumai plantation areas are shown in Figure 3 to grasp the relationship between HSs and rainfall. Red bar graphs in Figure 2 and Figure 3 show annual HSs in Dumai plantation areas. To explain active fires in 2005 and 2014, annual rainfall and three months of rainfall during the main dry season (January to March) in North Sumatra are shown by blue dotted and solid bar graphs in Figure 3. From Figure 3, we can see active fires in 2005 and 2014 occurred under relatively low rainfall from January to March (262 mm in 2005, 140 mm in 2014, average rainfall = 464 mm). However, in 2015, despite the low annual rainfall (877 mm, average rainfall = 1832 mm) and dry season rainfall (183 mm), fires were not active (376 HSs, average 1076 HSs). Rain and fire trends in 2015 suggest that there are weather conditions other than rain that dominate fire activity.
- Average daily hotspots (HSs) and rainfall.
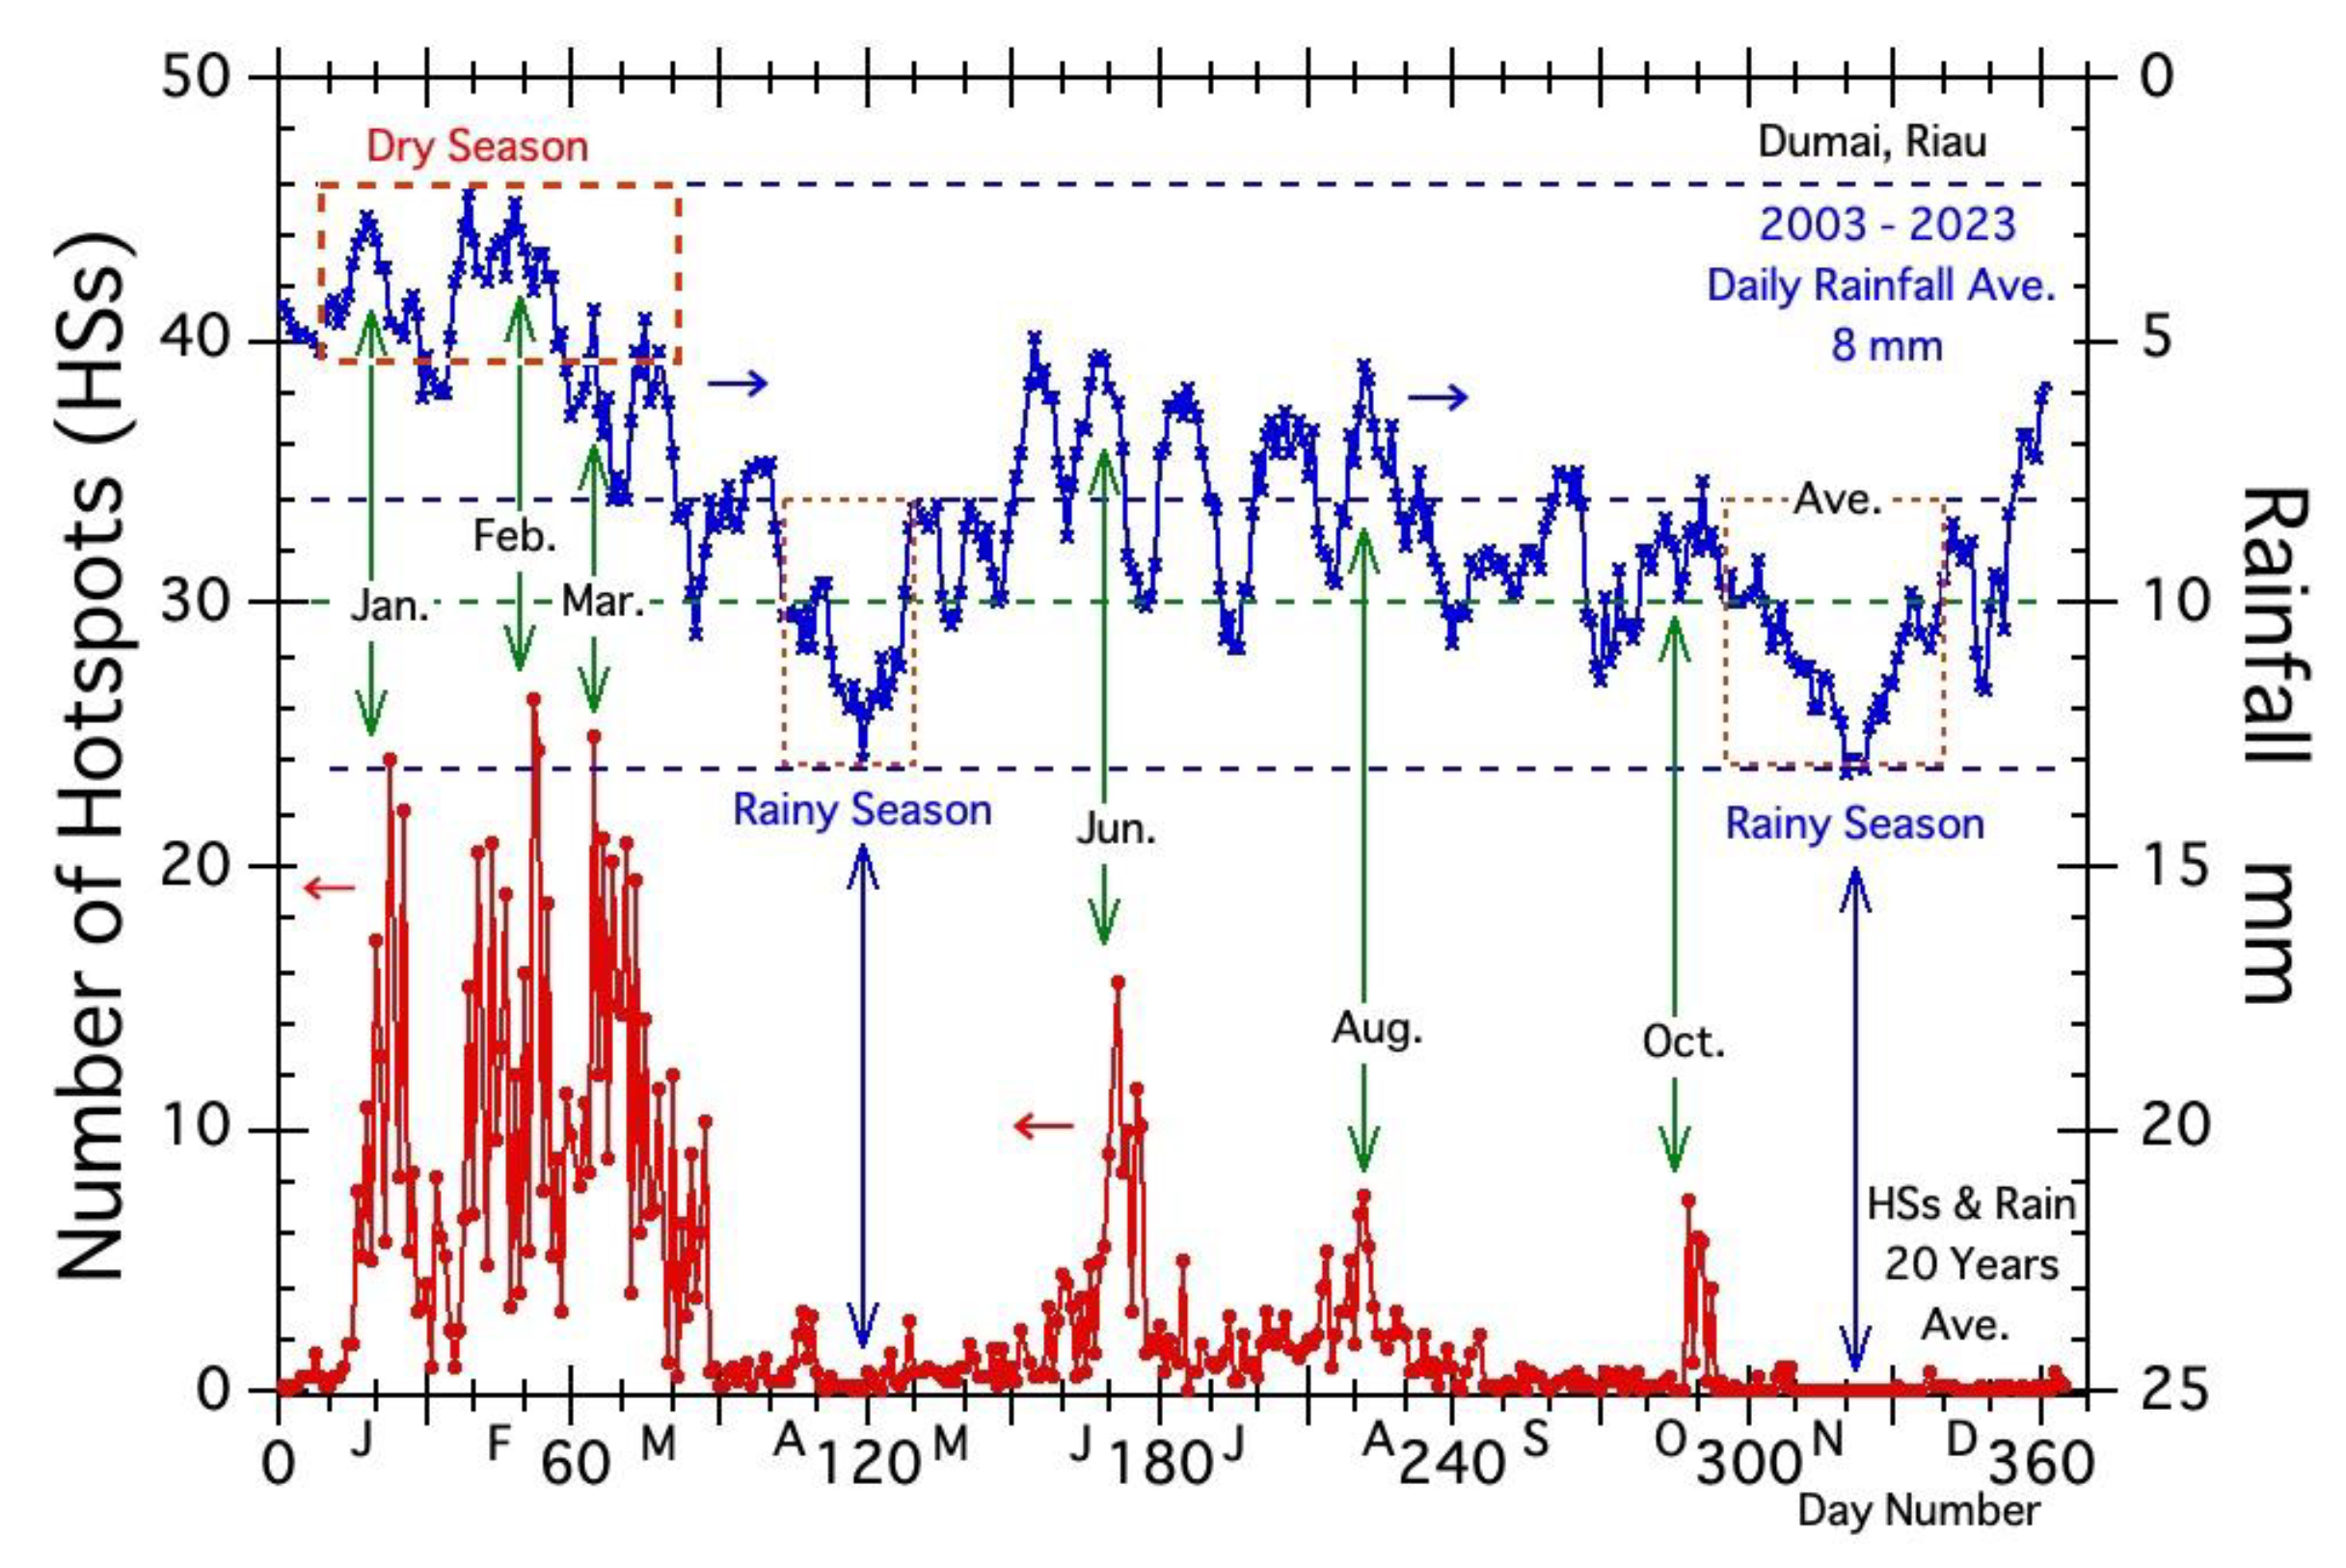
Figure 4 shows average HS and rainfall for the 20-year period from 2003 to 2022. The red line graph and blue line graph in Figure 4 show the fire activity periods and the dry and rainy periods. Three high HS peaks (>20 HSs) in Jan, Feb, and March occur during the main dry season (three months, <5 mm). The other three HS peaks in June, August, and October suggest that fire will always occur, except during two rainy seasons from April to May and from November to December.
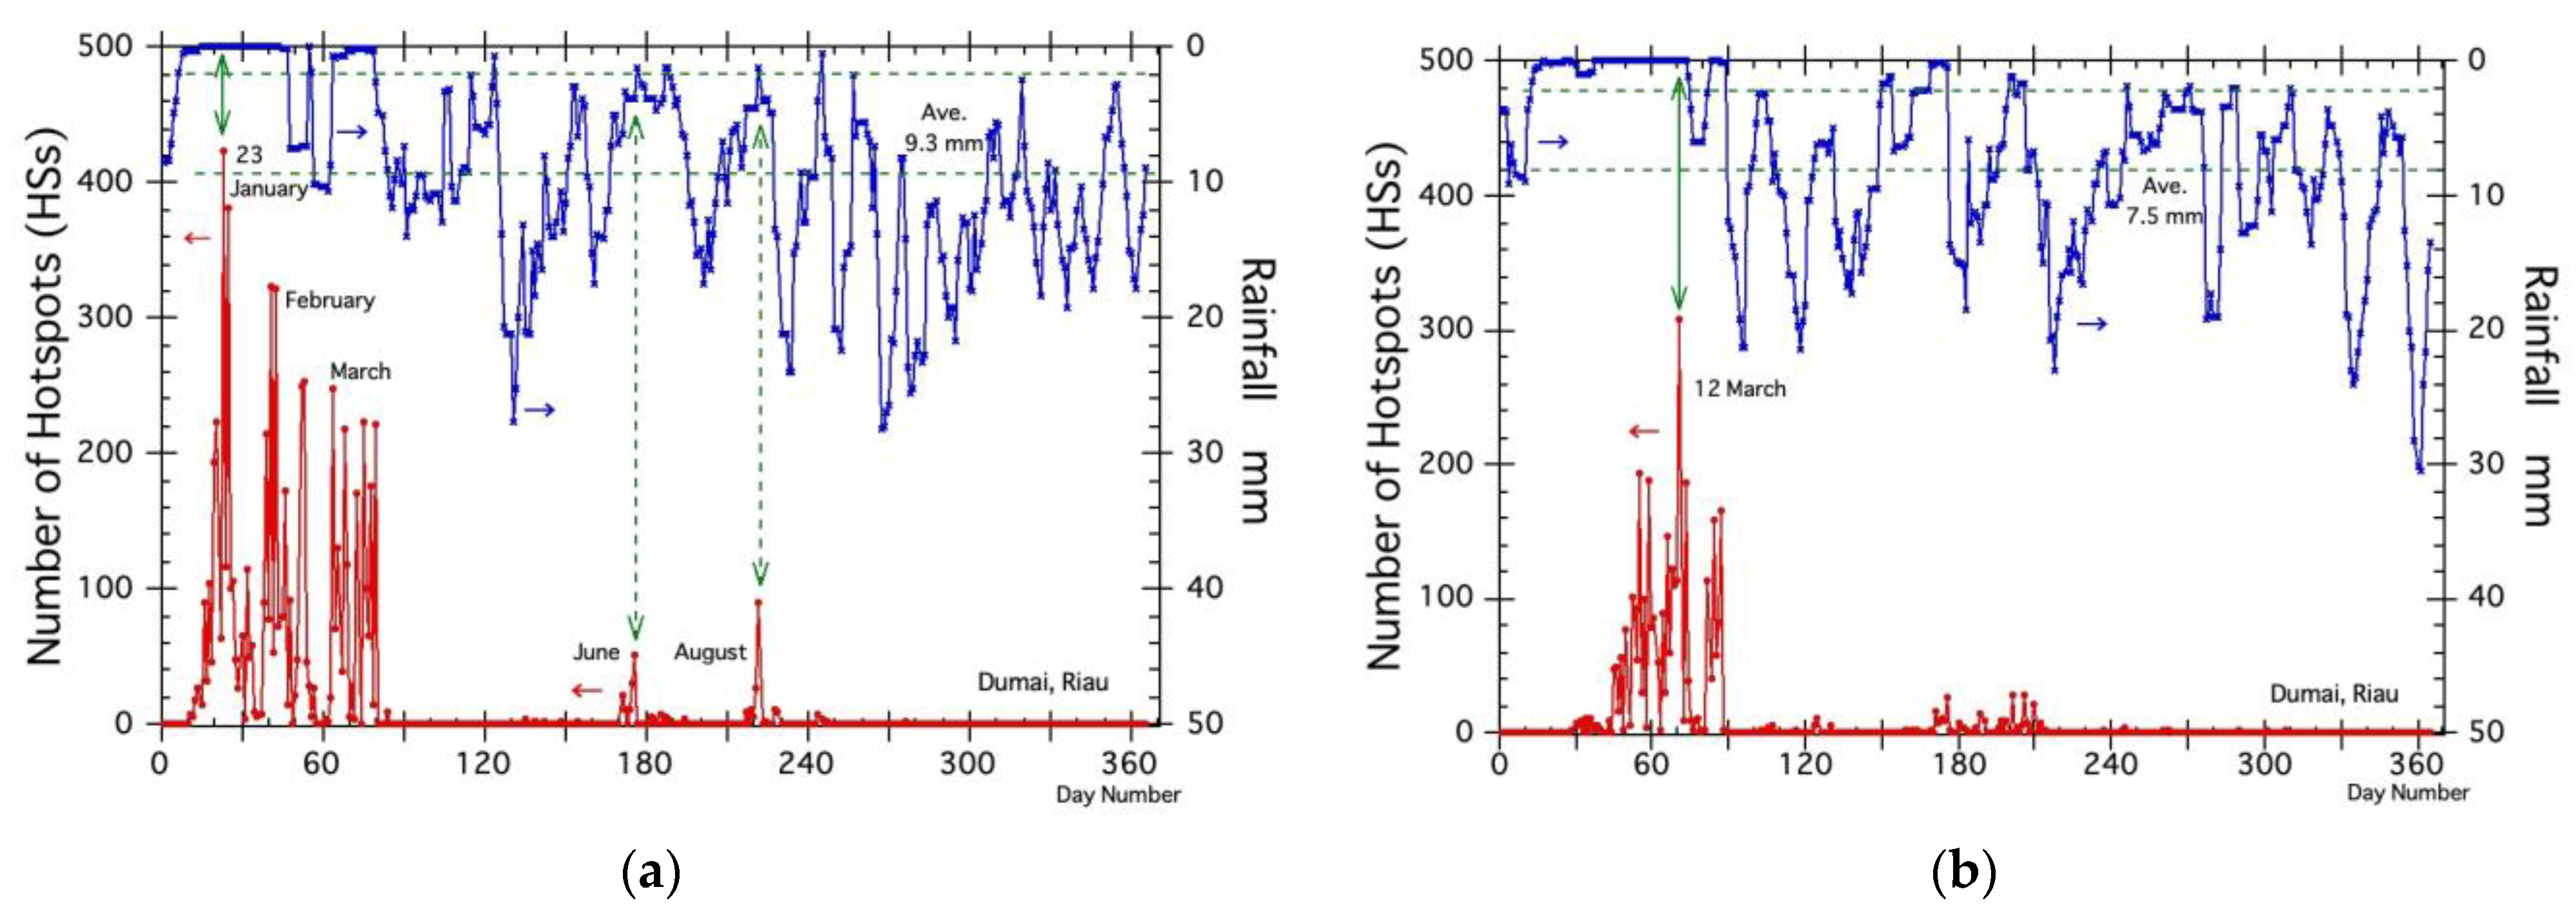
- Fire (HSs) and rainfall in 2005 and 2014.
Figure 5a,b show fire occurrence and rainfall trends of two fire years, 2005 and 2014, respectively. Figure 5a shows that fires in 2005 started at the end of January and continued into the middle of March. Fires in 2014 in Figure 5b occurred mainly in March. The two fire peaks in June and August in 2005 are larger than those peaks in 2014, suggesting that fires will become more active if fire weather conditions are met under low rainfall.
3.3.2. Fire and Weather Conditions, and Fire-Related Index
Fire weather conditions were identified by examining the weather conditions for the peak fire (HS) date that occurred in each year from 2003 to 2022. Twenty fire incidents are listed in descending HS order in Table 1. The number of peak HSs in each year varied from 423 to 4. The peak fire dates occurred not only in the dry months of January through March, but also in June, July, August, and October. Table 1 contains the major fire weather conditions: maximum wind speed, gusts, number of strong wind hours, wind direction, maximum temperature, minimum humidity, daily rainfall, and two fire-related index candidates (precipitable water vapor (PWV) and outgoing longwave radiation (OLR)).
Table 1 shows that the top two fires in 2005 and 2014 occurred under very strong wind conditions (Max. Wind: 24 and 30 km h−1), high temperatures (Max. Temp.: 33 and 35 °C), and low relative humidity (Mini. RH: 43 and 41%). The remaining 18 fires also had fast maximum wind speeds, ranging from 13 to 24 km h−1. From the weather conditions in Table 1, we can say that the fire weather conditions are fast wind speeds, high temperatures and low humidity.
3.4. Fire-Related Indices
The El Niño–Southern Oscillation (ENSO) index was used until recently as an explanation for drought and fires in peatlands in Indonesia. Since the 2019 peatland fires occurred independently of El Niño, more appropriate indicators and methods are needed to predict peatland fires. Several candidate fire-related indices are considered, and we showed that outgoing longwave radiation (OLR) can explain active fires in South Sumatra and Central Kalimantan [19,21] better than ENSO indices, and sea surface temperature anomaly (SSTA) can explain active fires in South Papua [20].
In this report, outgoing longwave radiation anomaly (OLRA), which is effective for the fires in South Sumatra [22], is first examined. Since OLRA takes large values when there are no clouds, we also applied it to active fires in North Sumatra. However, as shown in Table 1, the deviation of OLRA was found to have not only large positive values but also small positive and negative values. After a brief investigation of the cause of these small positive and negative values, it was determined that they were mainly due to the effects of ice crystals. Based on this result, it was determined that OLR could not be used as a fire index for North Sumatra. The correlation equation between 20 fires (HSs) and their OLRAs is as follows:
HSs = 33.994 − 0.75955 [OLRA] + 0.075764 [OLRA]2 (R2 = 0.43839)
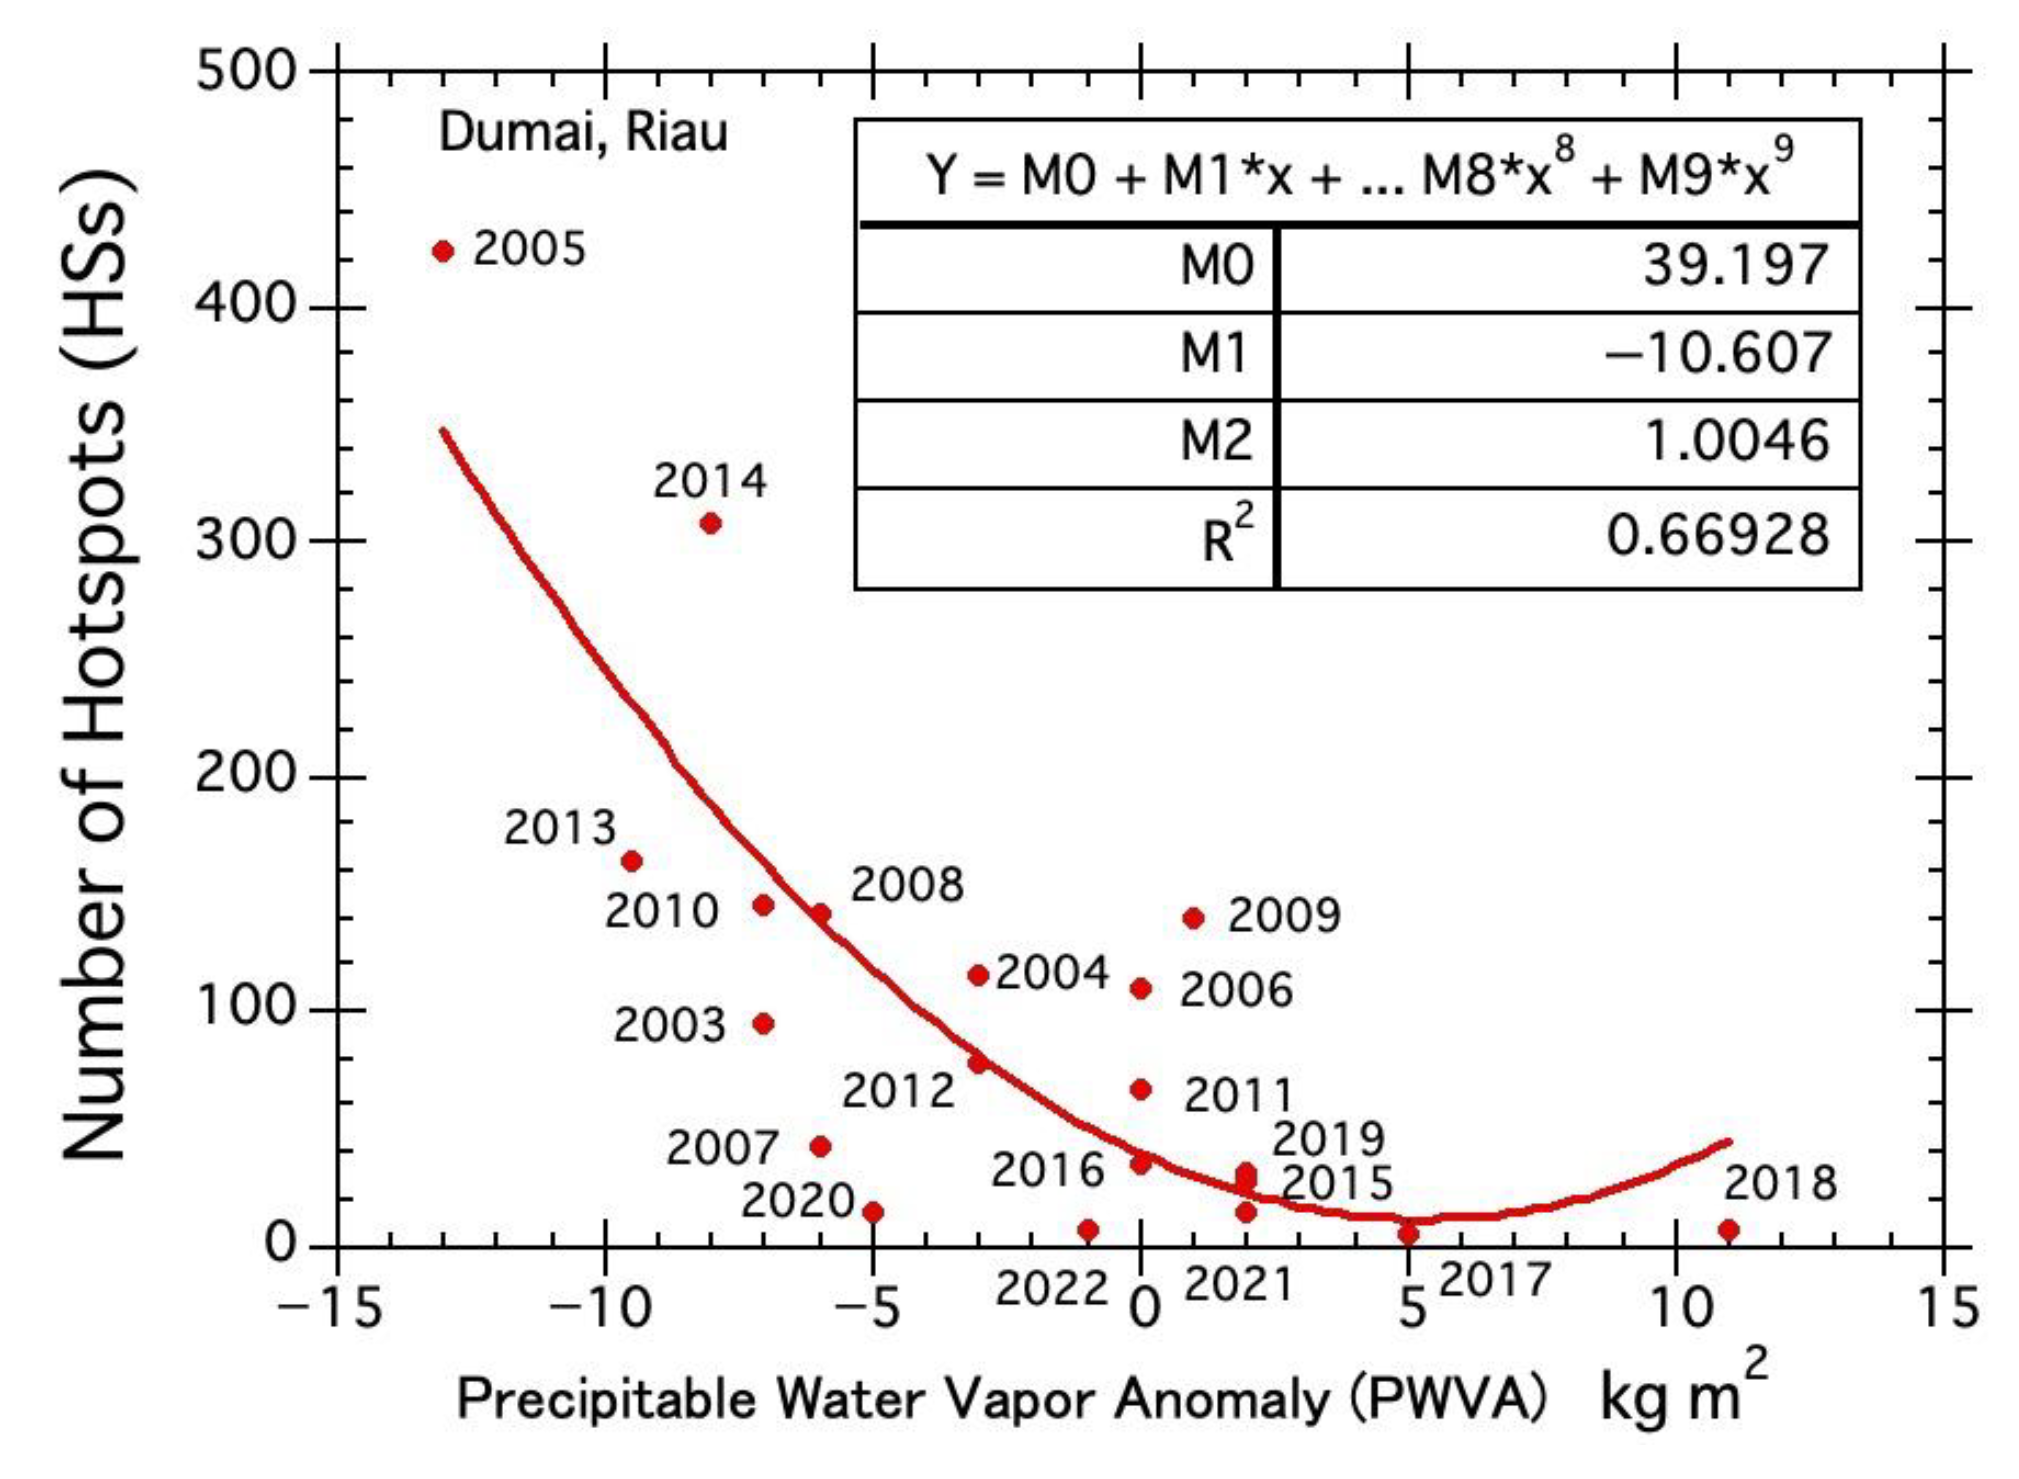
Next, precipitable water vapor anomaly (PWVA) is introduced in this report. PWV is the vertically integrated amount of water vapor in the atmosphere and is a valuable index for weather forecasting [23]. Figure 6 shows the correlation between 20 fires (HSs) and their PWVAs. The correlation equation in Figure 6 is as follows:
HSs = 39.197 − 10.607 [PWVA] + 1.0046 [PWVA]2 (R2 = 0.66928)
The coefficient of determination (R2) value is 0.66928, which is higher than 0.5 and the OLRA value (0.43839), indicating that PWVA has a good correlation with fire (HS).
The top two fires in 2004 and 2014 occurred under large PWV anomaly values, −13 and −8 kg m−2, respectively. In addition, positive PWV anomaly value, +2 on 16 July 2015, could explain the weak fires in 2015 (Num. HSs = 28 from Table 1). Finally, we may say that PWV is one of the important fire weather conditions in addition to strong wind, high temperature, and low humidity.
4. Discussion
There are few studies on fire weather conditions and fire-related indices for peatland fires in Indonesia. Because of this, we examined the applicability of PWV to other two fires in Papua [20] and Central Kalimantan [21]. In addition to atmospheric conditions, soil side (peat) conditions were also considered.
4.1. Fire-Related Index in Papua
For Papua fires, we suggested “sea surface temperature anomaly (SSTA)” as a good fire-related index [20]. We found that the SST around Papua (the Northern Arafura Sea) differs significantly between El Niño and La Niña years. The SSTAs in 2015 (El Niño) and 2021 (El La Niña) were −1.8 °K and +1 °K, respectively. We set the SSTA reference period for 7–19 October (the total numbers of HSs during this period were 3835 (23% of total HSs in 2015) and 84 (12% of total HSs in 2021), respectively). The correlation equation between annual total number of HSs during 7 − 19 October and SSTAs is as follows:
where HSs is the number of HSs for Southern Papua, and [SSTA] is the observed value at the Northern Arafura Sea.
HSs = 2976.2 – 3715.1 [SSTA] + 2125.4 [SSTA]2 (R2 = 0.95737)
From the strongest correlation, we could conclude that the SST anomalies at the Northern Arafura Sea will be the best fire-related index to evaluate fire activities for Papua [20].
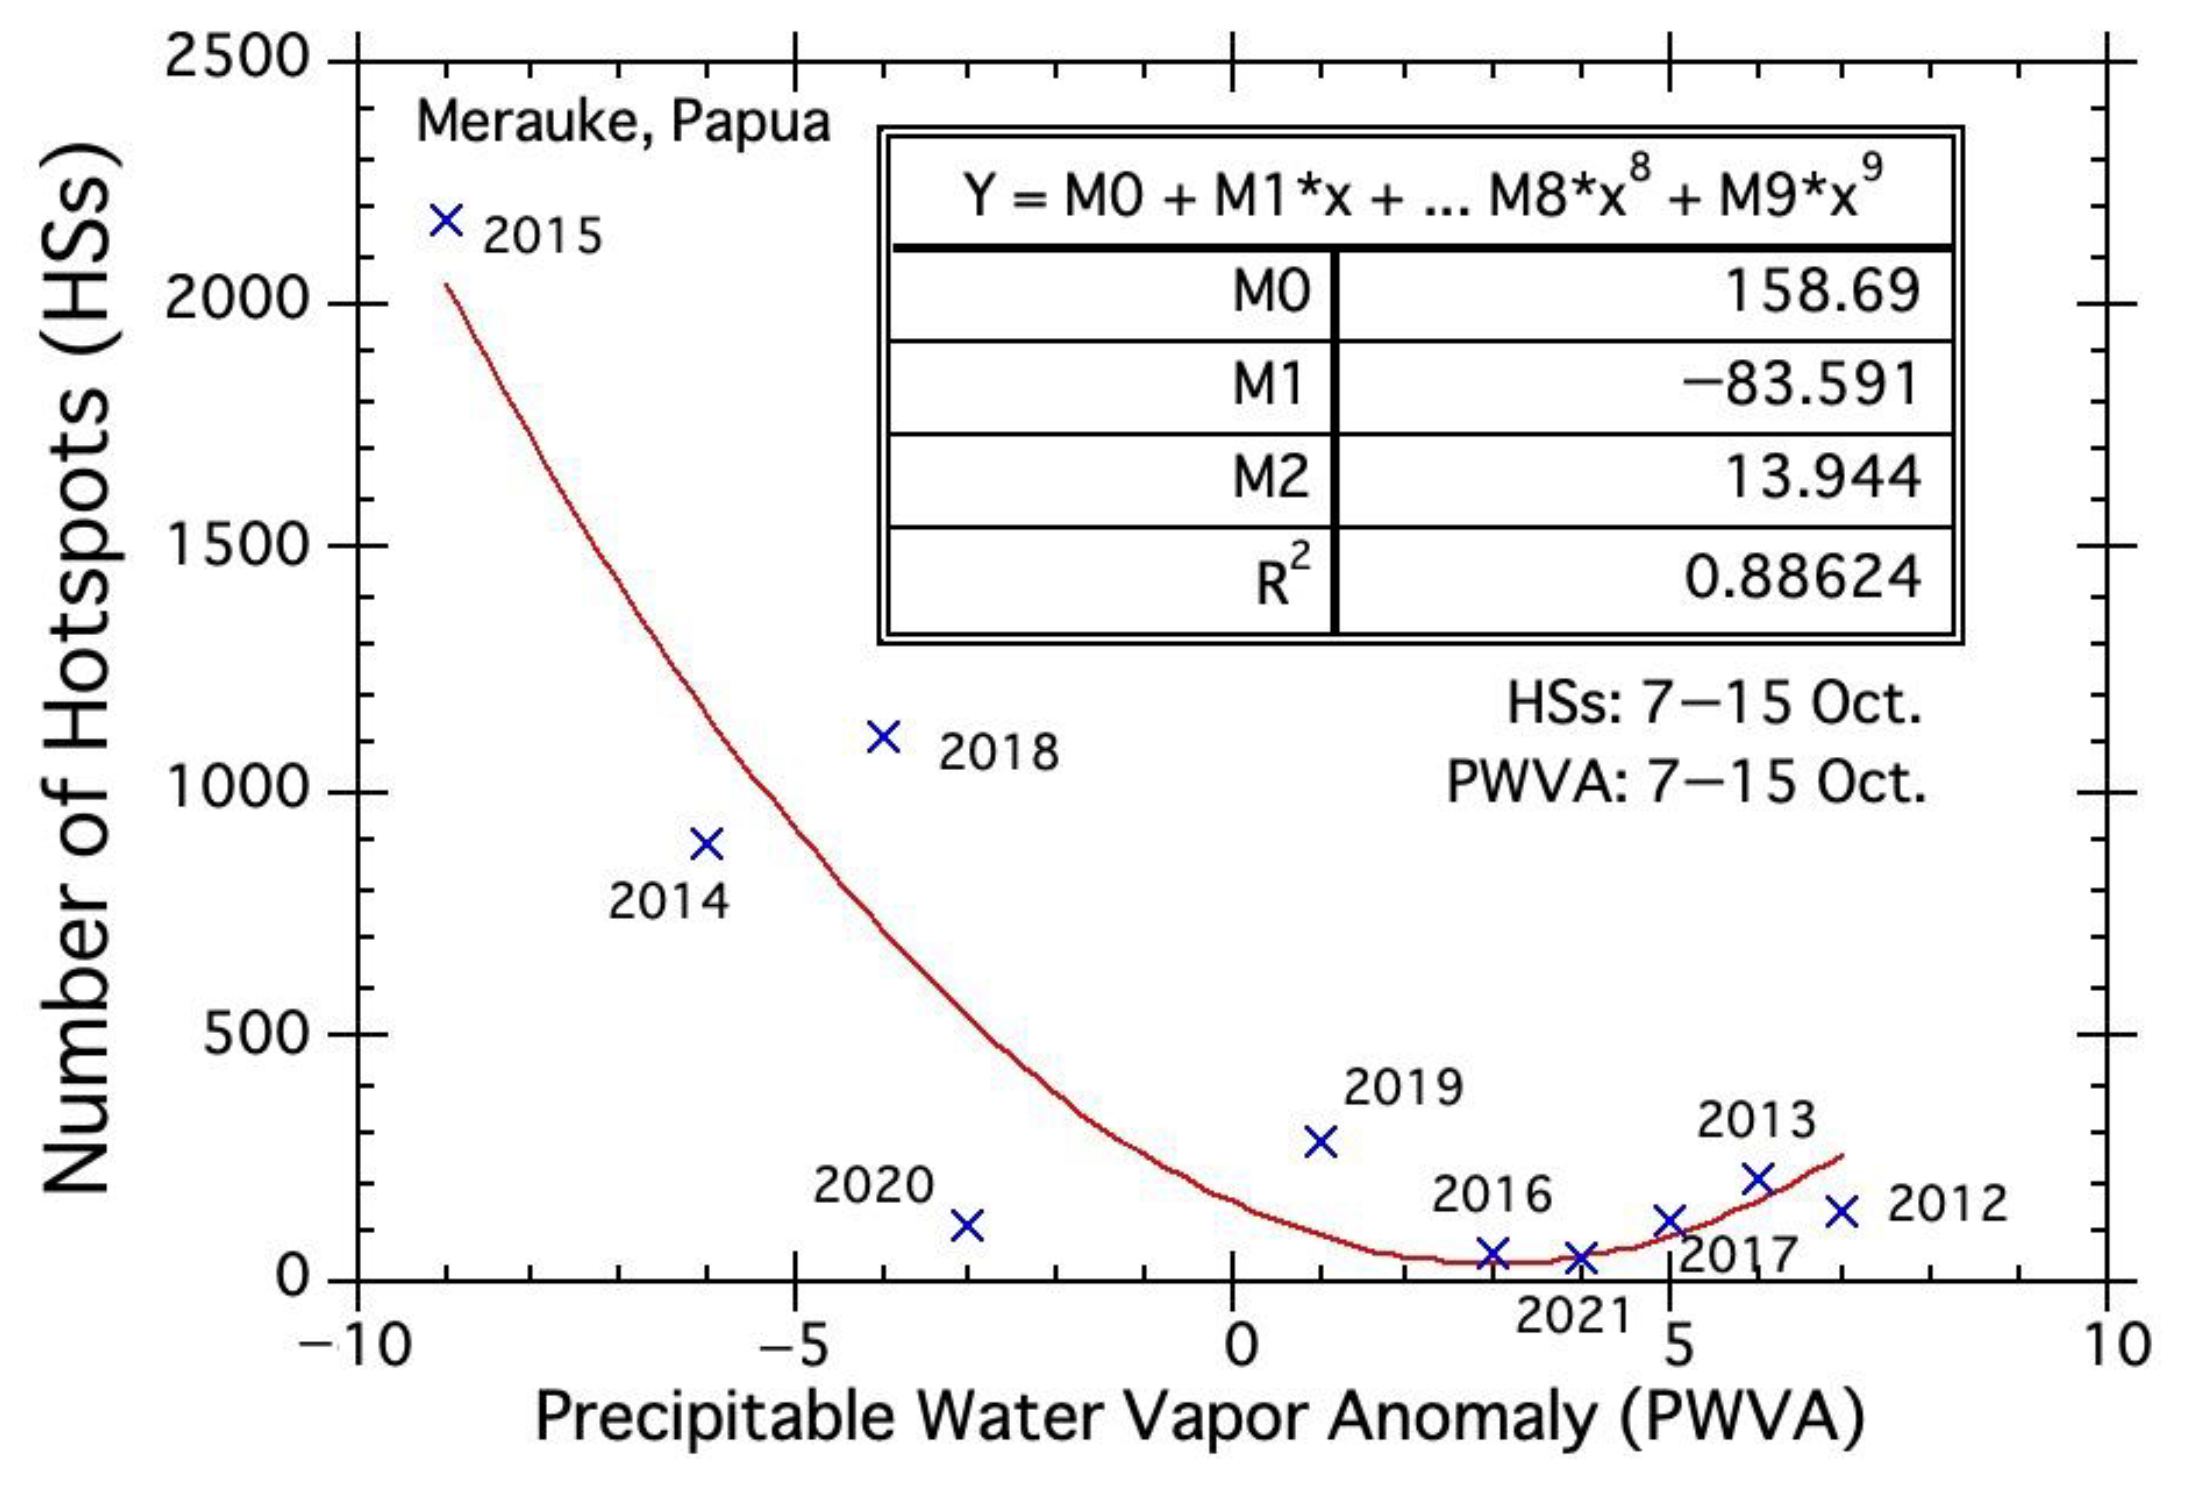
From here, the correlation between HSs and precipitable water vapor anomaly (PWVA) is discussed. The correlation equation in Figure 7 is as follows:
where HSs is the number of HSs, and PWVA is measured at Merauke, Papua.
HSs = 158.69 − 83.591 [PWVA] + 13.944 [PWVA]2 (R2 = 0.88624)
The coefficient of determination (R2) value is 0.88624 and lower than the above SSTA value (0.95737). Nevertheless, PWVA is a good enough fire-related index for Papua fires. Furthermore, the PWVA is one of the weather conditions for fires in Papua.
4.2. Fire-Related Index in Central Kalimantan
For peatland fires in Central Kalimantan, “Outgoing Longwave Radiation (OLR)” was introduced as a fire-related index [23]. OLR showed the best correlation among three indices, Niño 3.4 (region: 5 N–5 S, 170–120 W, the ENSO longwave radiation index), outgoing longwave radiation (OLR, NOAA), and outgoing longwave radiation (OLR–MC, JMA) [22].
OLR near Banjarmasin in southern Central Kalimantan was obtained using “EOSDIS Worldview (NASA)”. The correlation equation between total number of HSs and OLR in September is as follows:
where HSs is the number of HSs and [OLR] is measured at Banjarmasin.
HSs = 3.2111 × 10⁶ − 22,393 [OLR] + 39.038 [OLR]2 (R2 = 0.82684)
From good correlation, especially for the 2019 fires, we could conclude that the OLR at Banjarmasin will be the best fire-related index to evaluate fire activities in Central Kalimantan.
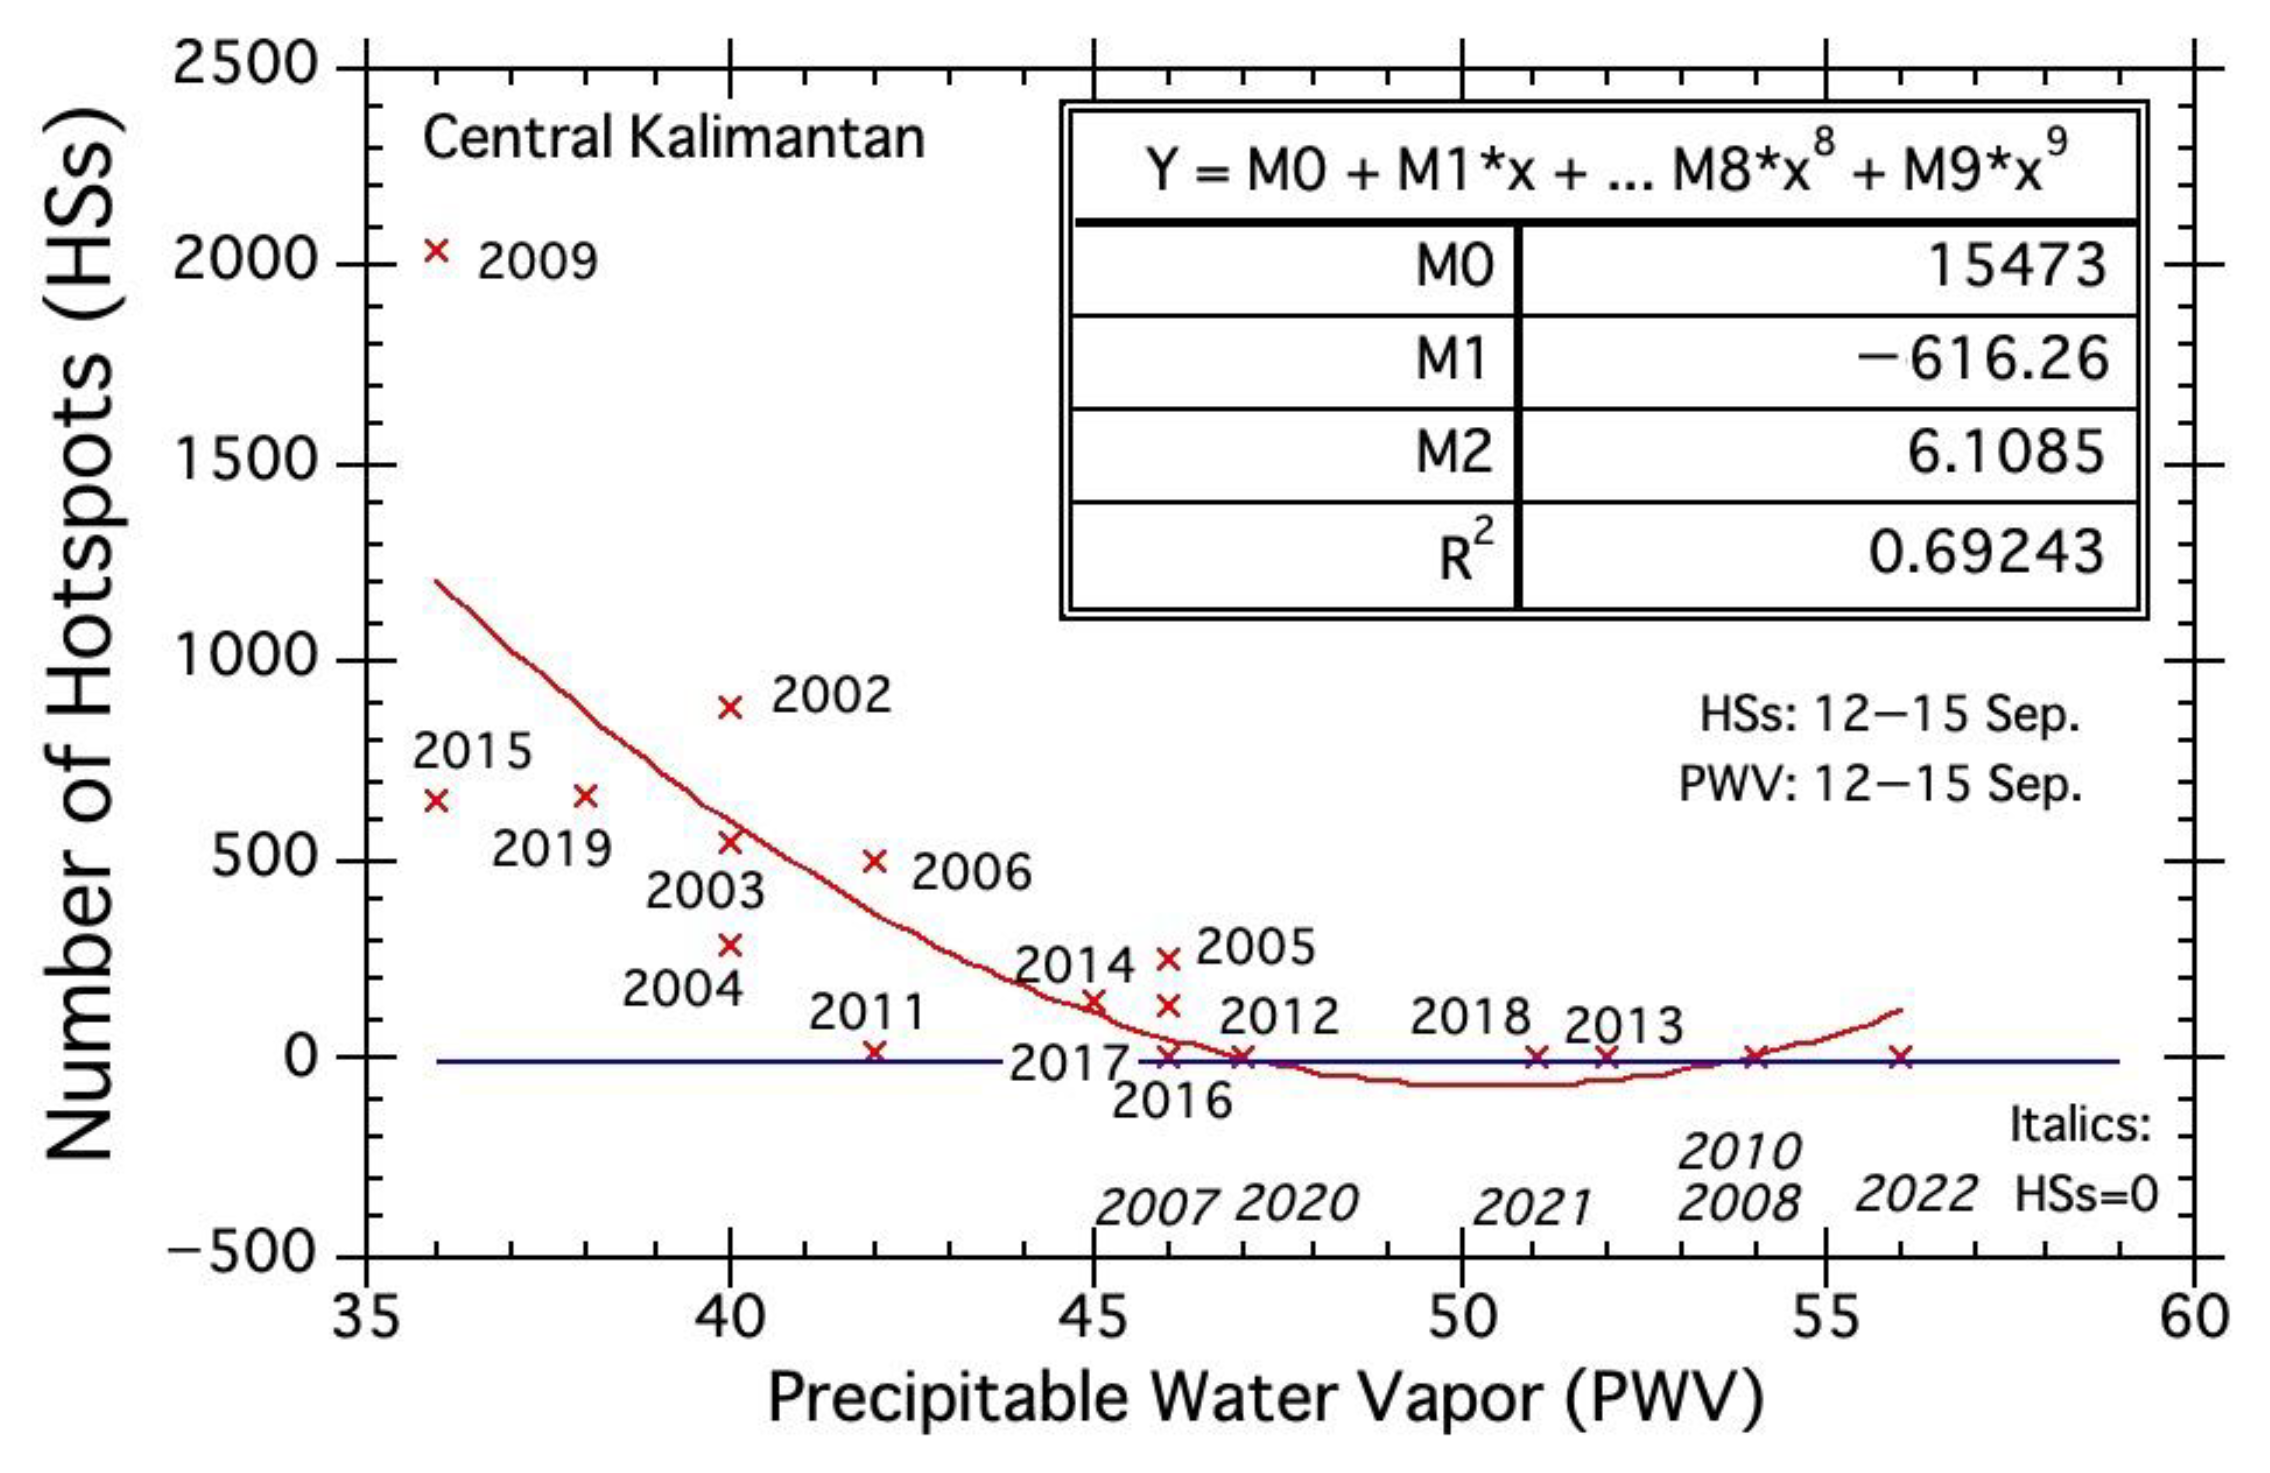
From here, the correlation between HSs and precipitable water vapor (PWV) is discussed. The correlation equation in Figure 8 is as follows:
where HSs is the number of HSs and PWV is measured at Banjarmasin.
HSs = 15,473 − 616.26 [PWV] + 6.1085 [PWV]2 (R2 = 0.69243)
The coefficient of determination (R2) value is 0.69243, lower than the above OLR value (0.82684). Nevertheless, PWV is a good enough fire-related index for Papua fires. Furthermore, the PWV is one of the weather conditions for fires in Papua, as PWV could explain the weak fire activities in 2005 under low rainfall conditions.
4.3. Fire and Ground Water Level (GWL)
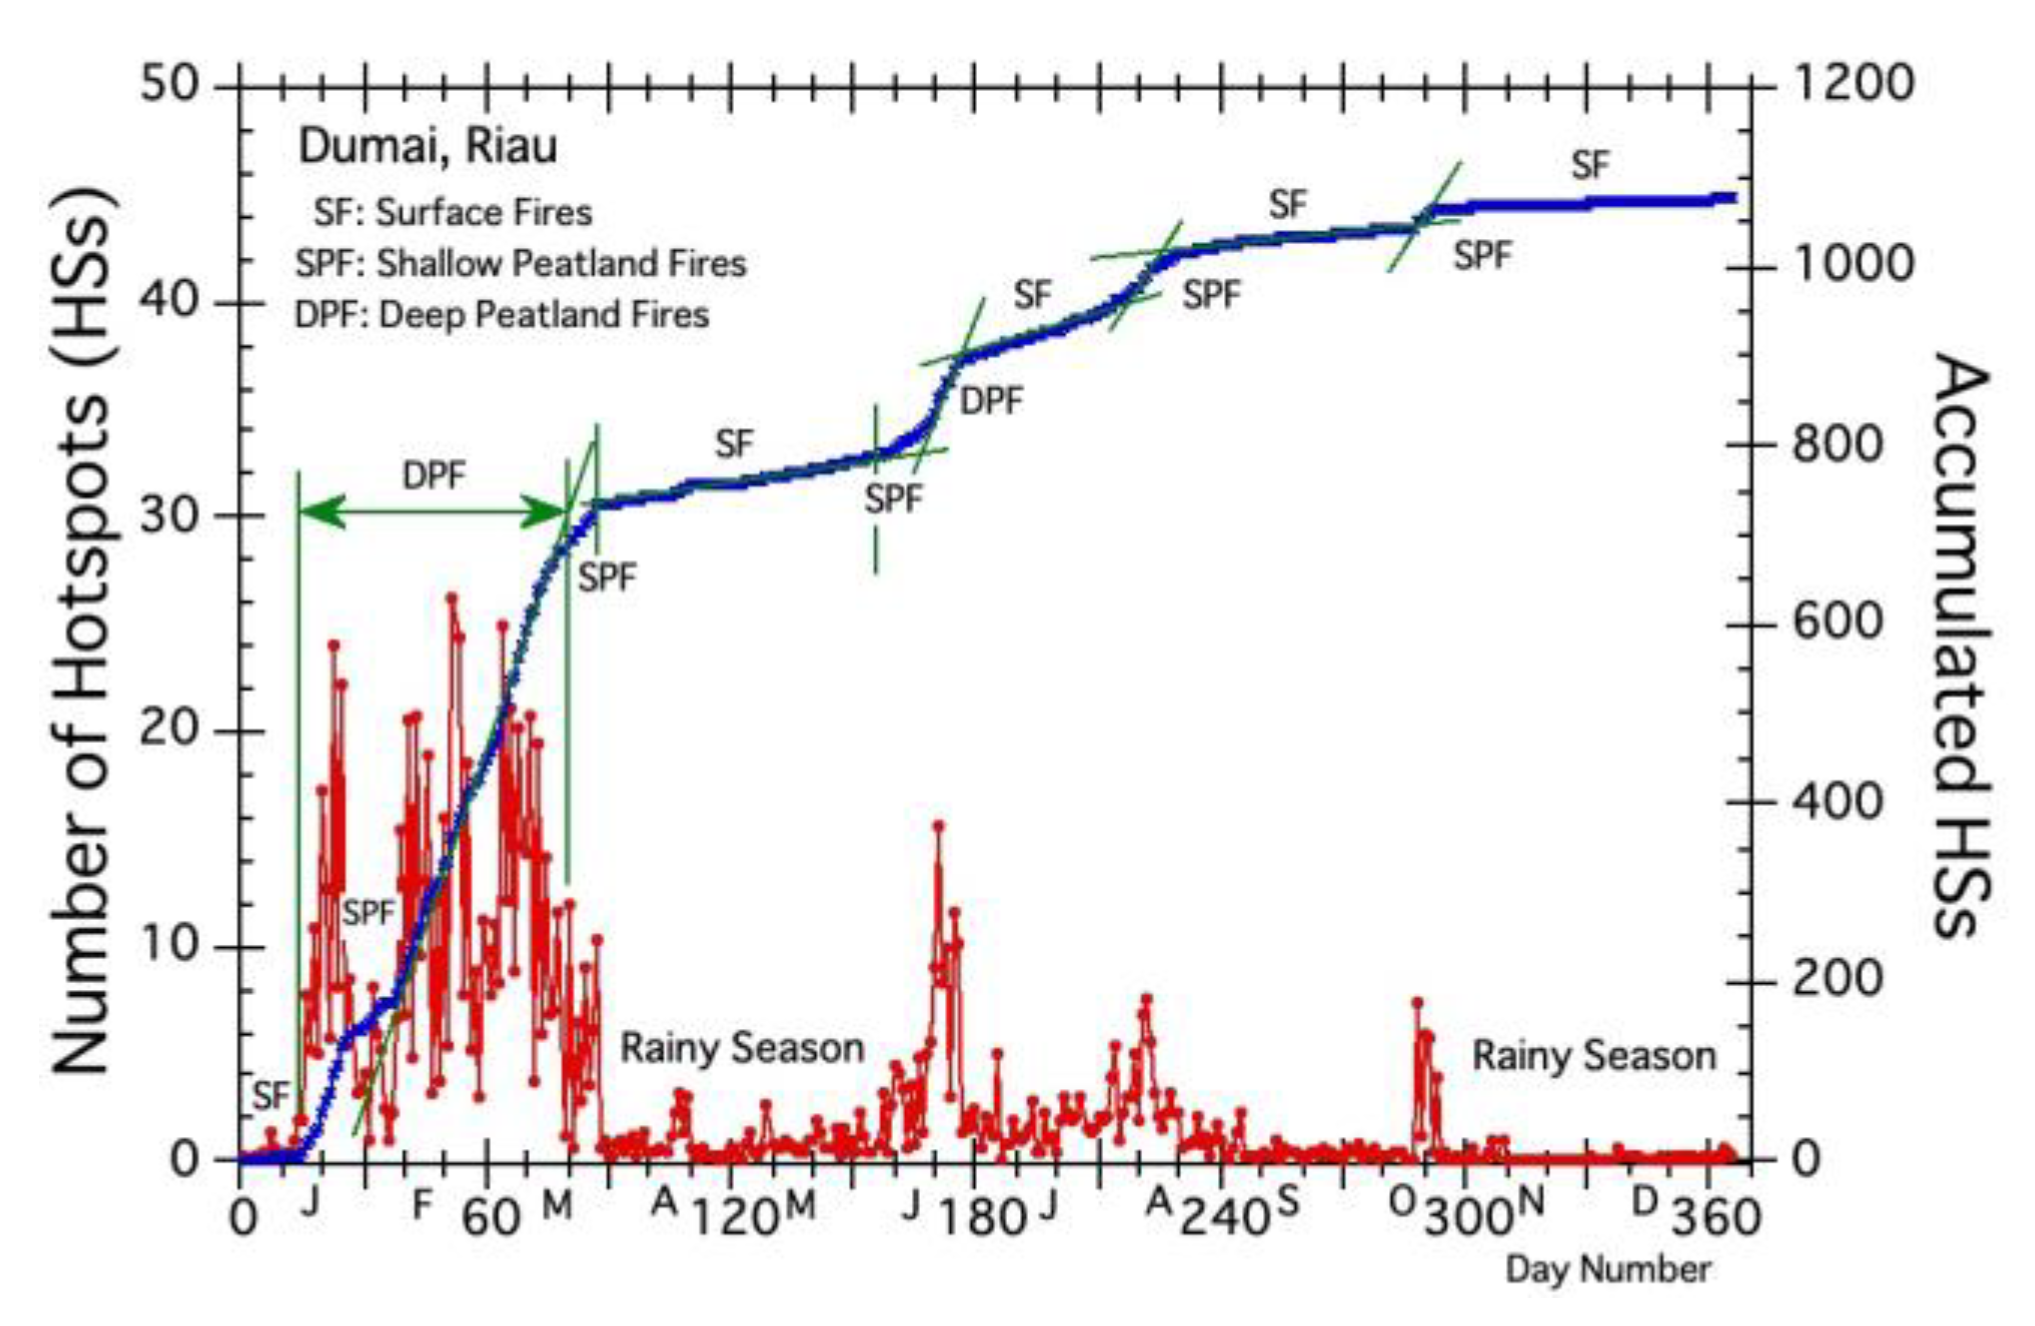
In addition to the above atmospheric conditions, soil side (peat) conditions were also examined here. We applied our evaluation method using ground water level (GWL) obtained in Kalimantan Island [21,22]. The three fire stages of peatland fire are called surface fire (SF), shallow peatland fire (SPF), and deep peatland fire (DPF). The different fire activities of the three fire stages come from the ground water level (GWL). SF starts just after GWL is less than 0 mm. The other two GWL boundary values are about −300 mm and about −500 mm.
Figure 9 shows the average fire occurrence of 20 years (2003–2022) in the Dumai plantation area. With the help of the cumulative hotspot (HS) curve and the thin green straight lines on the cumulative HS curve in Figure 9, we can define the three fire stages. A large gradient of the straight lines in January, February, March, and June indicates the occurrence of DPF.
The fire trends in Figure 9 indicate that the peatland in the Dumai plantation is a fire-prone area, and that peatland fires (SPF and DPF) could become more active when GWL drops due to short periods of drought. This result is consistent with the fire trend in North Sumatra [19], and we may say that GWL is also one of the important indicators for peatland fires in the Dumai plantation area. In order to predict the occurrence of extremely active peatland fires, we need to conduct a similar analysis as A. Sulaiman et al. conducted for Kalimantan peatland fires [18].
5. Conclusions
Fire conditions in the Dumai plantation areas, one of the most fire-prone areas in Indonesia, were carefully analyzed using 20 years of satellite hotspot and rainfall data, hourly weather data, and various satellite data to determine fire weather conditions and fire-related indices. The main conclusions drawn from the analysis are summarized below:
- (1)
- The fire months for the Dumai plantation areas are January through March during the main dry season, and June, August, and October (Figure 4).
- (2)
- Twenty fire incidents (largest fires (HSs) of each year) showed the following major fire weather conditions: high winds (>19 km h−1), high temperatures (>33 °C), and low relative humidity (<50%) (Table 1).
- (3)
- Especially active fires in 2005 and 2014 occurred under very strong wind conditions (24 and 30 km h−1), high temperatures (33 and 35 °C), and low relative humidity (43 and 41%) (Table 1)
- (4)
- (5)
- PWV is not only a fire-related index, but also one of important fire weather conditions. Active fires occurred under dry atmosphere conditions or small PWV values (Table 1).
The results of this report indicate that fires in plantation areas also occurred under fire-prone weather conditions. Clarifying different fire indices for each region will lead to better fire forecasts and fire prevention measures.
Funding
This research received no external funding.
Institutional Review Board Statement
Not applicable.
Informed Consent Statement
Not applicable.
Data Availability Statement
All data used in this report are publicly available on the Internet.
Acknowledgments
I would like to thank the following institutes and various earth data sites: (1) various weather maps from the Twentieth Century Reanalysis Project version 3 dataset provided by the U.S. Department of Energy, Office of Science Biological and Environmental Research (BER), by the National Oceanic and Atmospheric Administration Climate Program Office, and by the NOAA Physical Sciences Laboratory. (2) rainfall data from the JAXA (https://sharaku.eorc.jaxa.jp/GSMaP_CLM/index.htm, accessed on 15 January 2023). (3) hourly weather data from weather underground (https://www.wunderground.com/history/daily/my/malacca/WMKM/date/2019-3-6, accessed on 11 August 2023). (4) various maps from Google Map Pro by Google LLC. (5) various imagery from NASA’s Worldview application (https://worldview.earthdata.nasa.gov, accessed on 21 April 2023), part of NASA’s Earth Observing System Data and Information System (EOSDIS).
Conflicts of Interest
The author declare no conflict of interest.
References
- Langner, A.; Siegert, F. Spatiotemporal fire occurrence in Borneo over a period of 10 years. Glob. Chang. Biol. 2009, 15, 48–62. [Google Scholar] [CrossRef]
- Margono, B.A.; Potapov, P.V.; Turubanova, S.; Stolle, F.; Hansen, M.C. Primary forest cover loss in Indonesia over 2000–2012. Nat. Clim. Chang. 2014, 4, 730–735. [Google Scholar] [CrossRef]
- Hoscilo, A.; Page, S.E.; Tansey, K.J.; Rieley, J.O. Effect of repeated fires on land-cover change on peatland in southern Central Kalimantan, Indonesia, from 1973 to 2005. Int. J. Wildland Fire 2011, 20, 578–588. [Google Scholar] [CrossRef]
- Miettinen, J.; Shi, C.; Liew, S.C. Deforestation rates in insular Southeast Asia between 2000 and 2010. Glob. Chang. Biol. 2011, 17, 2261–2270. [Google Scholar] [CrossRef]
- Hooijer, A.; Page, S.; Jauhiainen, J.; Lee, W.A.; Lu, X.X.; Idris, A.; Anshari, G. Subsidence and carbon loss in drained tropical peatlands. Biogeosciences 2012, 9, 1053–1071. [Google Scholar] [CrossRef]
- Uryu, Y.; Mott, C.; Foead, N.; Yulianti, K.; Setiabudi, T.F.; Nursamsu, S.; Purastuti, E.; Fadhli, N.; Jaenick, J.; Stuwe, M.; et al. Deforestation, Forest Degradation, Biodiversity Loss and CO2 Emissions in Riau, Sumatra, Indonesia. In WWF Indonesia Technical Report; Jakarta, Indonesia, 2008; Available online: https://www.worldwildlife.org/publications/deforestation-forest-degradation-biodiversity-loss-and-co2-emissions-in-riau-sumatra-indonesia (accessed on 10 September 2023).
- Page, S.E.; Rieley, J.O.; Banks, C.J. Global and regional importance of the tropical peatland carbon pool. Glob. Chang. Biol. 2011, 17, 798–818. [Google Scholar] [CrossRef]
- Tacconi, L. Fires in Indonesia: Causes, Costs and Policy Implications. In CIFOR Occasional Paper No. 38; CIFOR: Bogor, Indonesia, 2003. [Google Scholar]
- Reuters. Greenpeace Blasts Indonesia for not Imposing Tough Penalties for Forest Fires. 2019. Available online: https://www.nst.com.my/world/2019/09/524250/greenpeace-blasts-indonesia-not-imposing-toughpenalties-forest-fires (accessed on 18 January 2020).
- Page, S.E.; Siegert, F.; Rieley, J.O.; Hans-Dieter, V.; Boehm, W.; Adi, J.; Limin, S. The amount of carbon released from peat and forest fires in Indonesia during 1997. Nature 2002, 420, 61–65. [Google Scholar] [CrossRef] [PubMed]
- Setyawati, W. Suwarsono Carbon Emission from Peat Fire in 2015. IOP Conf. Ser. Earth Environ. Sci. 2018, 166, 012041. [Google Scholar] [CrossRef]
- Gaveau, D.L.A.; Salim, M.A.; Hergoualc’h, K.; Locatelli, B.; Sloan, S.; Wooster, M.; Marlier, M.E.; Molidena, E.; Yaen, H.; De-Fries, R.; et al. Major atmospheric emissions from peat fires in Southeast Asia during non-drought years: Evidence from the 2013 Sumatran fires. Sci. Rep. 2015, 4, 6112. [Google Scholar] [CrossRef] [PubMed]
- Velasco, E.; Rastan, S. Air quality in Singapore during the 2013 smoke-haze episode over the Strait of Malacca: Lessons learned. Sustain. Cities Soc. 2015, 17, 122–131. [Google Scholar] [CrossRef]
- Pörtner, H.-O.; Roberts, D.C.; Poloczanska, E.S.; Mintenbeck, K.; Tignor, M.; Alegría, A.; Craig, M.; Langsdorf, S.; Löschke, S.; Möller, V.; et al. (Eds.) IPCC, 2022: Summary for Policymakers. In Climate Change 2022: Impacts, Adaptation and Vulnerability. Contribution of Working Group II to the Sixth Assessment Report of the Intergovernmental Panel on Climate Change; Cambridge University Press: Cambridge, UK; New York, NY, USA, 2022; pp. 3–33. [Google Scholar] [CrossRef]
- WBG Climate Change Knowledge Portal (CCKP, 2021). Indonesia. Available online: https://climateknowledgeportal.worldbank.org/country/indonesia/climate-data-historical (accessed on 21 April 2023).
- Aldrian, E. Decreasing Trends in Annual Rainfalls over Indonesia: A Threat for the National Water Resource? Geophysics and Meteorology Agency Jakarta, Indonesia. 2007. Available online: https://www.researchgate.net/publication/284944836_Decreasing_trends_in_annual_rainfalls_over_Indonesia_A_threat_for_the_national_water_resource (accessed on 21 April 2023).
- Wang, B.; Luo, X.; Yang, Y.-M.; Sun, W.; Cane, M.A.; Cai, W.; Yeh, S.-W.; Liu, J. Historical change of El Niño properties sheds light on future changes of extreme El Niño. Proc. Natl. Acad. Sci. USA 2019, 116, 22512–22517. [Google Scholar] [CrossRef] [PubMed]
- Sulaiman, A.; Osaki, M.; Takahashi, H.; Yamanaka, M.D.; Susanto, R.D.; Shimada, S.; Kimura, K.; Hirano, T.; Wetadewi, R.I.; Sisva, S.; et al. Peatland groundwater level in the Indonesian maritime continent as an alert for El Niño and moderate positive Indian Ocean dipole events. Sci. Rep. 2023, 13, 939. [Google Scholar] [CrossRef] [PubMed]
- Hayasaka, H. Peatland Fire Weather Conditions in Sumatra, Indonesia. Climate 2023, 11, 92. [Google Scholar] [CrossRef]
- Yulianti, N.; Hayasaka, H. Recent Active Fires in Indonesia’s Southern Papua Province Caused by El Niño Conditions. Remote Sens. 2023, 15, 2709. [Google Scholar] [CrossRef]
- Usup, A.; Hayasaka, H. Peatland Fire Weather Conditions in Central Kalimantan, Indonesia. Fire 2023, 6, 182. [Google Scholar] [CrossRef]
- Putra, E.I.; Hayasaka, H. The effect of the precipitation pattern of the dry season on peat fire occurrence in the Mega Rice Project area, Central Kalimantan, Indonesia. Tropics 2011, 19, 145–156. [Google Scholar] [CrossRef]
- Kelsey, V.; Riley, S.; Minschwaner, K. Atmospheric precipitable water vapor and its correlation with clear-sky infrared temperature observations. Atmos. Meas. Tech. 2022, 15, 1563–1576. [Google Scholar] [CrossRef]
Figure 1.
(a) Map of study area (1.3–1.7° N, 101.4–101.8° E, sixteen 0.1° grid cells) in Dumai plantation areas shown by the red color dashed line rectangle. Values above 30 of each 0.1° cell show frequent fire areas of the study areas and surrounding areas. Grid cell sizes of 0.1° and 1° are indicated by small red dashed rectangles and large yellow dashed rectangles, respectively. Red circles indicate the locations of major towns. (b) Map of Sumatra Island. Peatlands are indicated by the blue color. Red color circles show major cities related to fires. The numbers of several 1° grid cells show frequent fire areas. Base map is made by “Global peatland extent” (Global Forest (https://www.globalforestwatch.org (accessed on 10 March 2023)). All numbers in each grid cell are the average number of hotspots (HSs yr.−1) of the last 20 years from 2003. Grid cell size of 1° is indicated by a red and yellow dashed rectangle. Red circles indicate the locations of major towns. Base map: Google Earth Pro.

Figure 2.
Annual hotspots in North Sumatra and Dumai plantation areas. The dashed line represents the average.
Figure 2.
Annual hotspots in North Sumatra and Dumai plantation areas. The dashed line represents the average.

Figure 3.
Annual hotspots and rainfall in Dumai plantation areas. The dashed line represents the average.
Figure 3.
Annual hotspots and rainfall in Dumai plantation areas. The dashed line represents the average.

Figure 4.
Average hotspots and rainfall in the Dumai area. Inverted Y-axis on the right side of Figure 4 is for rainfall. The red line curve with round circles indicates daily hotspots (HS). The blue line curve with an x indicates the daily rainfall amount. The dashed line represents the average and rainfall values of 2, 10, and 13 mm. J (Jan.): January, F (Feb.): February, M (Mar.): March, A: April, M: May, J (Jun.): June, J: July, A (Aug.): August, S: September, O (Oct.): October, N: November, D: December.

Figure 5.
Hotspots and rainfall in Dumai area. (a) HSs and rainfall in 2005; (b) HSs and rainfall in 2014. The red line curve with round circles indicates daily hotspots (HS). The blue line curve with an x indicates the daily rainfall amount. The dashed line represents the average and rainfall value of 2 mm.

Figure 6.
Correlation between water vapor anomaly (PWVA) and number of hotspots (HSs). Red circles indicate HSs for each year. Asterisk (*) means multiplication.
Figure 6.
Correlation between water vapor anomaly (PWVA) and number of hotspots (HSs). Red circles indicate HSs for each year. Asterisk (*) means multiplication.

Figure 7.
Correlation between precipitable water vapor anomaly (PWVA) and number of hotspots (HSs) for Papua. Blue x marks represent HSs for each year. Asterisk (*) means multiplication.
Figure 7.
Correlation between precipitable water vapor anomaly (PWVA) and number of hotspots (HSs) for Papua. Blue x marks represent HSs for each year. Asterisk (*) means multiplication.

Figure 8.
Correlation between precipitable water vapor (PWV) and number of hotspots (HSs) for Central Kalimantan. Red x marks represent HSs for each year. Asterisk (*) means multiplication.
Figure 8.
Correlation between precipitable water vapor (PWV) and number of hotspots (HSs) for Central Kalimantan. Red x marks represent HSs for each year. Asterisk (*) means multiplication.

Figure 9.
Average fire occurrence of 20 years (2003–2022). Average hotspots (the red line curve with red round circles) and accumulated HSs (the blue line curve) in Dumai area. SF, SPF, and DPF are defined by gradients of thin green straight lines on accumulated HS curves. The first letter of each month is displayed below the X-axis. J: January, F: February, M: March, A: April, M: May, J: June, J: July, A: August, S: September, O: October, N: November, D: December.


Table 1.
Twenty fire incidents (peak HS dates, HSs, fire weather conditions, and two indices).
| Rank | Year | Peak HS Date | Num. HSs | Wind Speed km h−1 | Wind Direc. Degree | Max. Temp. °C | Mini. RH% | Rainfall mm | PWV 1 Anom. kg m−2 | OLR 2 Anom. W m−2 | ||
|---|---|---|---|---|---|---|---|---|---|---|---|---|
| Max. Wind | Gust | Num. Hours, >19 3 | ||||||||||
| 1 | 2005 | 23 January | 423 | 24 | 39, 41, 44, 46,50 | 11 | 45 | 33 | 43 | 0 | −13 | 60 |
| 2 | 2014 | 12 March | 308 | 30 | 3 | 45 | 35 | 41 | 0 | −8 | 60 | |
| 3 | 2013 | 20 June | 163 | 22 | 37, 43 | 6 | 270 | 34 | 46 | 0.02 | −10 | 20 |
| 4 | 2010 | 15 October | 145 | 15 | 270 | 34 | 52 | 0.3 | −7 | 26 | ||
| 5 | 2008 | 19 February | 142 | 24 | 6 | 30 | 34 | 41 | 0 | −6 | −10 | |
| 6 | 2009 | 20 Jane | 139 | 22 | 7 | 45 | 34 | 46 | 0 | 1 | 50 | |
| 7 | 2004 | 24 February | 115 | 19 | 1 | 270 | 33 | 59 | 0.02 | −3 | 10 | |
| 8 | 2006 | 3 March | 109 | 19 | 39 | 1 | 45 | 33 | 52 | 0.39 | 0 | 30 |
| 9 | 2003 | 5 March | 94 | 19 | 4 | 285 | 33 | 52 | 0.03 | −7 | 20 | |
| 10 | 2012 | 11 August | 77 | 13 | 7 | 32 | 62 | 5.28 | −3 | 30 | ||
| 11 | 2011 | 2 August | 67 | 19 | 1 | 150 | 32 | 66 | 0 | 0 | 30 | |
| 12 | 2007 | 11 March | 43 | 19 | 1 | 30 | 35 | 44 | 0.22 | −6 | 30 | |
| 13 | 2016 | 1 March | 35 | 26 | 39 | 15 | 45 | 34 | 49 | 0.19 | 0 | 40 |
| 14 | 2019 | 28 March | 31 | 15 | VAR | 35 | 41 | 9.74 | 2 | 50 | ||
| 15 | 2015 | 16 July | 28 | 13 | 150 | 32 | 70 | 3.68 | 2 | −20 | ||
| 16 | 2020 | 27 February | 15 | 17 | 37, 39 | 33 | 34 | 46 | 0 | −5 | 40 | |
| 17 | 2021 | 22 January | 15 | 11 | 28 | 45 | 31 | 66 | 1.46 | 2 | 0 | |
| 18 | 2018 | 28 February | 7 | 19 | 1 | 45 | 32 | 59 | 0.22 | 11 | −10 | |
| 19 | 2022 | 3 April | 6 | 15 | 46 | 240 | 32 | 58 | 5.73 | −1 | −10 | |
| 20 | 2017 | 30 July | 4 | 15 | 180 | 31 | 70 | 0.92 | 5 | 20 | ||
1 PWV: Precipitable water vapor. 2 OLR: outgoing longwave radiation, 3 >19 km h−1: ≒ lowest wind speed in moderate breeze category (wind speed > 19.8 km h−1 (5.5 m s−1)), Abbreviations: Num.: Number, Max.: Maximum, Mini: Minimum, Direc.: Direction, Anom.: Anomaly.
Disclaimer/Publisher’s Note: The statements, opinions and data contained in all publications are solely those of the individual author(s) and contributor(s) and not of MDPI and/or the editor(s). MDPI and/or the editor(s) disclaim responsibility for any injury to people or property resulting from any ideas, methods, instructions or products referred to in the content. |
© 2023 by the author. Licensee MDPI, Basel, Switzerland. This article is an open access article distributed under the terms and conditions of the Creative Commons Attribution (CC BY) license (https://creativecommons.org/licenses/by/4.0/).
Share and Cite
MDPI and ACS Style
Hayasaka, H. Fire Weather Conditions in Plantation Areas in Northern Sumatra, Indonesia. Atmosphere 2023, 14, 1480. https://doi.org/10.3390/atmos14101480
AMA Style
Hayasaka H. Fire Weather Conditions in Plantation Areas in Northern Sumatra, Indonesia. Atmosphere. 2023; 14(10):1480. https://doi.org/10.3390/atmos14101480
Chicago/Turabian StyleHayasaka, Hiroshi. 2023. "Fire Weather Conditions in Plantation Areas in Northern Sumatra, Indonesia" Atmosphere 14, no. 10: 1480. https://doi.org/10.3390/atmos14101480
Note that from the first issue of 2016, this journal uses article numbers instead of page numbers. See further details here.