Article

Roles of the Topographically-Affected Boundary Layer Low-Level Jet in the Moisture Transport Process of Nocturnal Rainstorms in Mountainous Areas around the Western Sichuan Basin

1
School of Atmospheric Sciences, Chengdu University of Information Technology, Chengdu 610225, China
2
Collaborative Innovation Center on Forecast and Evaluation of Meteorological Disasters, Nanjing University of Information Science & Technology, Nanjing 210044, China
*
Author to whom correspondence should be addressed.
Atmosphere 2023, 14(1), 84; https://doi.org/10.3390/atmos14010084
Submission received: 25 November 2022 / Revised: 25 December 2022 / Accepted: 28 December 2022 / Published: 31 December 2022

Abstract

:
Fifteen cases were selected from May to September 2010 to 2021 to study the moisture transport of nocturnal rainstorms in mountainous areas around the western Sichuan Basin (western SCB). Nocturnal rainstorms mainly occur along mountains in southwestern SCB, from 22 to 04 LST, peaking at 00 LST. The four following moisture transport paths (proportions) were obtained using the Hybrid Single Particle Lagrangian Integrated Trajectory model (HYSPLIT): the local path from southeastern SCB (51.9%), the southerly path from the South China Sea (35.1%), the northwestern path from western Tibetan Plateau (TP) (6.6%), and the easterly path from the East China Sea (6.4%). The persistent southwest monsoon is the large-scale circulation for nocturnal rainstorms in western SCB while the boundary layer low-level jet (BLJ) over southeastern SCB plays a key role in diurnal variations of moisture transport in western SCB. To discuss the roles of the topographically-affected BLJ in moisture transport, the wind field is decomposed into creeping flows (flows over mountains) and circumfluence flows (flows around mountains). At 22 LST, ageostrophic creeping flows turn southeast due to the clockwise rotation caused by inertial oscillations of the BLJ, transporting moisture directly into western SCB and converging because of the blocking effect of TP. Meanwhile, the opposite geostrophic circumfluence flows and ageostrophic circumfluence flows meet and accumulate at the “trumpet” topography in western SCB, leading to moisture convergence, and the moisture budget peaks at 22 LST, 2 h earlier than the rainstorm peak. The creeping flows force upward motions over western SCB, and the conflict between upward warm–moist flows and cold–dry downslope flows from TP triggers convection, which significantly strengthens the vertical velocity. The results confirm the existence of the BLJ over southeastern SCB both in the Eulerian and Lagrangian viewpoints and reveal the roles of the topographically-affected BLJ in the moisture transport process of nocturnal rainstorms in western SCB.

1. Introduction

Sichuan Basin (SCB) is located in the transition zone between the Tibetan Plateau (TP) and the middle and lower reaches of the Yangtze River Plain. It is China’s second-step terrain area, with diverse landforms. SCB is surrounded by undulating and vein-like mountains with altitudes ranging from 500 to 3000 m. The mountains around western SCB are the highest, as they are adjacent to the TP, but are lowest around southeastern SCB, that is, the SCB is high in the west and low in the east (Figure 1). According to the statistics, mountainous terrain accounts for 77.1% of the land area of Sichuan Province [1]. Studies have shown that mountainous areas around SCB are centers of rainstorms, especially for short-duration rainstorms, which mostly occur during the warm season (May–September) [2,3]. By calculating mountain rainstorms in Sichuan, Huang et al. [4] found that rainstorms in western Sichuan have the highest frequency and intensity, and the high nocturnal occurrence or nocturnal intensification is another distinguishing feature of mountain rainstorms in SCB. The thermal and dynamic effects of the mountainous underlying surface have to trigger, enhance, or weaken influences on precipitation, which make the formation mechanism of mountain rainstorms very complex and difficult to forecast. Mountain rainstorms often cause secondary disasters such as flash floods, mudslides, landslides, avalanches, etc. SCB is a densely-populated area in China; if a mountain rainstorm happens at night, it is extremely easy to cause serious loss of life and property, such as a sudden mountain rainstorm that occurred in the early morning in Liangshan Prefecture, Sichuan Province, on 8 August 2017, which triggered flash floods and caused 25 deaths and five injuries [5]. There is a considerable lack of research on nocturnal rainstorms in mountainous areas around SCB; strengthening relevant research is conducive to providing scientific guidance for the advancement of forecasting and warning, as well as for disaster prevention and mitigation.
An adequate moisture supply is a necessary condition in rainstorms. Moisture transport is studied from two different viewpoints—the Eulerian viewpoint and the Lagrangian viewpoint. The Eulerian viewpoint focuses on certain fixed points in space, such as calculating the moisture flux to observe the moisture transport in the whole region. The Lagrangian viewpoint focuses on individual air mass by studying trajectories of the air mass to understand moisture transport. The airflow trajectory model based on the Lagrangian view can simulate the three-dimensional trajectory of the air mass and exhibit the spatial position and corresponding physical properties during the movement of the air mass, which is used to explore the source or sink of moisture [6]. The HYSPLIT (Hybrid Single Particle Lagrangian Integrated Trajectory) model is an integrated model system jointly developed by the American Air Resources Laboratory and the Australian Bureau of Meteorology for the calculation and analysis of airflow and diffusion trajectories [7], which has been widely applied to diagnose the moisture sources in rainstorms [8,9,10]. In practical studies, the combination of Eulerian and Lagrangian methods provides a more comprehensive way to reveal characterizations of moisture transport.
Low-level jets (LLJs) are carriers of moisture, which often cause convergence at their termini, favoring the development of strong convections [11]. According to the altitude, LLJs can be divided into two types—the boundary layer jet (BLJ, 850 hPa and below) and the synoptic weather-related jet (SLLJ, 850–600 hPa) [12]. The BLJ weakens during the day and strengthens at night, regulating diurnal variations of moisture transport and further affecting precipitation. Meanwhile, due to the low height, the BLJ is prone to be influenced by the topography. There are two mainstream theories to explain the formation of the BLJ; one is the Blackadar inertial oscillation theory [13], which points out that the weakening turbulent mixing in the boundary layer and the reduction of friction at night disrupt the balance of pressure gradient force, Coriolis force, and friction force during the day, so the subgeostrophic wind field at daytime tends to evolve toward the geostrophic equilibrium at night; the ageostrophic winds rotate under the effect of the Coriolis force, causing inertial oscillations. The wind field undergoes an evolution process from subgeostrophic to supergeostrophic. The second theory is the Holton slope pressure theory [14], which emphasizes the thermal role of the topography and states that the conversions from heating to cooling of sloped terrains induce the diurnal cycles of the wind field. In recent years, theories combining these two mechanisms have given a better interpretation of the actual diurnal variations of the BLJ [15,16]. The western Great Plains of the United States, located on the eastern side of the Rocky Mountains, is a high-incidence center of BLJs. The BLJ enhances the moisture transport from the Gulf of Mexico at night, resulting in frequent nocturnal rain in this region [17,18]. In China, the BLJ is also observed in Yunnan–Guizhou Plateau [19], the Yangtze–Huaihe River Basin [20], and South China [12,21].
Zhang et al. [22] found that the BLJ exists in southeastern SCB, contrary to the common belief that emphasizes the solenoidal effects associated with the Tibetan and Yunnan–Guizhou Plateaus; prominent diurnal inertial oscillations of the BLJ are shown to play a more important role in modulating the diurnal cycles of precipitation in SCB. However, the study by Zhang et al. [22] focuses on precipitation over the whole basin; as mentioned above, there are regional differences in precipitation within SCB, so it needs to be confirmed whether nocturnal rainstorms occurring in western SCB are also influenced by the BLJ. Meanwhile, the topography greatly affects airflow movements; when airflows go through uneven terrain, they can cause blocking, creeping flows, circumfluence flows, and the narrow pipe effect [23]. Fu et al. [24] found that the BLJ is blocked by the Dabie Mountain topography, resulting in moisture uplift and condensation at the windward slope, which is the main reason for the occurrence of rainstorms at night. Jin and Li [25] decomposed the wind field into creeping flows and circumfluence flows in a sudden mountain rainstorm in SCB. They revealed that due to the blocking effect of the terrain, the airflow from the northeast direction rotates, generating circumfluence flows and forming a local vortex in SCB, and the altitude difference between SCB and mountains around SCB forces creeping flows to produce climbing motions, eventually enhancing the vertical upward velocity. The combined effects of creeping flows and circumfluence flows provide favorable wind field conditions for developing this sudden rainstorm. The method of decomposing the wind field into creeping flows and circumfluence flows is mostly applied in climate studies describing the dynamic effects of large topography [26]. Still, it has been less utilized in mesoscale meteorology. Applying it to the diagnosis of terrain precipitation may provide a new method to reveal topography’s role in rainstorms quantitatively. How does the multi-scale topography in SCB affect the BLJ and finally change the moisture transport process, and whether or not it differs in regions? This paper explores these questions to provide new insights into the nighttime intensification of mountain rainstorms in SCB.
The rest of this paper is organized as follows: the data used, the identification method of the nocturnal rainstorm in western SCB, the HYSPLIT simulation scheme, and the decomposition method of the creeping flow and the circumfluence flow will be presented in Section 2. The characteristics of nocturnal rainstorms as well as moisture sources and transport paths will be introduced in Section 3. Section 4 analyses the diurnal variations of moisture transport, starting with describing diurnal variations of the BLJ and investigating its formation mechanism, followed by a discussion of diurnal variations of moisture transport and moisture budget under the combined effects of inertial oscillations and the topography. The summary and conclusions are given in Section 5.

2. Data and Methods

2.1. Data

The hourly precipitation observation data are from 161 national meteorological stations and 4841 intensive automatic weather stations (black dots in Figure 1) in Sichuan Province from May to September 2010–2021, provided by the Sichuan Provincial Meteorological Bureau (the data in 2010–2012 only have 157 national meteorological stations and 2729 intensive automatic weather stations). The ERA5 data with a horizontal resolution of 0.25° × 0.25° and a temporal resolution of 1 h, are provided by the European Centre for Medium-Range Weather Forecasts (ECMWF). The HYSPLIT model uses GDAS meteorological data from the National Centers for Environmental Prediction (NCEP) with a spatial resolution of 1° × 1° and a temporal resolution of 6 h. The topographic height data shown in Figure 1 is from the Global Land 1 km Base Elevation Project (GLOBE) database (https://www.ngdc. noaa.gov/mgg/topo/globe.html) (accessed on 1 April 2008).

2.2. Identification of the Nocturnal Rainstorm in Western SCB

In this paper, a nocturnal rainstorm event in western SCB is defined when three or more stations located in mountains (altitude between 500–3000 m) in western SCB (102–105° E, 26–33° N) registered with a 1 h cumulative rainfall ≥ 20 mm and 3 h cumulative rainfall ≥ 50 mm at night (19–07 LST, LST = UTC + 7), and the nocturnal precipitation rate (nocturnal cumulative rainfall/24 h cumulative rainfall) >50%. Based on these criteria, 15 cases were selected.

2.3. HYSPLIT Model Simulation Scheme

The rainstorm center site of each case was selected as the starting point for the HYSPLIT model simulation. The simulation period was from 07–07 LST (the next day), and all initial points were tracked backward for 10 days (the average residence time of moisture in the atmosphere [27]) every 1 h. The meteorological elements of air parcels (air pressure, specific humidity, and temperature) were obtained through interpolation, and since moisture transport occurs mainly at low levels, the initial heights were chosen as 1000 m, 1500 m, and 3000 m above the sea level, representing 900 hPa, 850 hPa, and 700 hPa, respectively. A total of 1080 trajectories were obtained, and the trajectories were clustered by analyzing all trajectories’ total spatial variance (TSV) [7].

2.4. The Calculation Method of the Creeping Flow and the Circumfluence Flow

Based on the method proposed by Zhang et al. [28], the wind field is decomposed into the sum of the creeping flow and the circumfluence flow as follows:
V = V p + V r
where V is the total wind, Vp is the creeping flow, Vr is the circumfluence flow, Vp and Vr are orthogonal to each other, and they should satisfy:
V p × Z = 0
V p · Z = V · Z
V r · Z = 0
V r × Z = V × Z
where Z is the terrain height gradient. It is known that the creeping flow is parallel to the terrain gradient, and the circumfluence flow is perpendicular to the terrain gradient.
Combining Equations (2)–(5), we can get:
u p = [ u ( Z x ) 2 + v Z x Z y ] / | Z | 2
v p = [ v ( Z y ) 2 + u Z x Z y ] / | Z | 2
u r = [ u ( Z y ) 2 v Z x Z y ] / | Z | 2
v r = [ v ( Z x ) 2 u Z x Z y ] / | Z | 2
where u and v are the latitudinal and longitudinal components of the total wind, up and vp are the latitudinal and longitudinal components of the creeping flow, and ur and vr are the latitudinal and longitudinal components of the circumfluence flow.
Forced uplift of the terrain is one of the important reasons for vertical motions, for the rigid boundary condition, there is:
w p = V · Z = ( V p + V r ) · Z = V p · Z
where wp is the vertical velocity forced out by the terrain. It can be seen that wp can only be generated by the creeping flow and the circumfluence flow does not produce vertical motion, and wp is proportional to the magnitude of the terrain gradient. Since the terrain gradient in SCB varies largely, the calculation method of the creeping flow and the circumfluence flow is used for the decomposition of the wind field at low levels of 1000–700 hPa in this paper.

2.5. Calculation of the Moisture Flux, Moisture Flux Divergence, and Moisture Budget

To understand the moisture transport in the rainstorm, the moisture flux Q and the moisture flux divergence Qdiv were calculated as follows:
Q = 1 g p t p s q V d p
Q d i v = 1 g p t p s q V d p
where V is the horizontal velocity, q is the specific humidity, g is the acceleration of gravity, ps indicates the surface pressure, and pt is taken as 700 hPa in this study.
For different boundaries, the moisture budget Ql is calculated as:
Q l = 1 g l p t p s q V n d p d l
where l is the length of each boundary and Vn is the normal velocity of each boundary. The moisture budget of the region is the sum of the moisture budget of boundaries around it, defining the moisture flux into the region as positive, otherwise, it is negative.

3. Characteristics of Nocturnal Rainstorms

3.1. The Temporal and Spatial Distribution of Rainstorms

Table 1 displays the statistics of nocturnal rainstorm cases during 2010–2021 in western SCB. For example, for the rainstorm occurring on 2 July 2010, our study time starts at 07 LST on 2 July 2010 and ends at 07 LST on 3 July 2010. In all selected cases, rainstorms occur most in July. The rainstorm centers mainly distribute at 102.5–104.5° E, and 28.0–32.0° N (red dots in Figure 1). The altitudes of rainstorm centers range from 500–1500 m, among which three of them exceed 1000 m. The 12 h nocturnal accumulated precipitation of each case is more than 100 mm, peaking at 22–03 LST, with a maximum 1 h precipitation exceeding 40 mm. The largest rainstorm appears on 21 May 2018, reaching 332.8 mm, which caused economic losses of more than 60 million yuan, and two people died [29]. The night rain rates of all events are over 80%, and some cases can even achieve 100%.
Figure 2a shows the 12 h nocturnal accumulated precipitation by averaging 15 cases. It can be seen that there are two rainstorm centers exist in southwestern SCB, represented by station R1(103.44° E, 29.73° N) and station R2 (103.91° E, 29.42° N), whose altitudes are 746 m and 426 m, respectively. These two rainstorm centers are both located in Leshan City, Sichuan, south of the “trumpet” topography in western SCB. Figure 2b,c show the diurnal variations of precipitation at these two rainstorm centers. There is little precipitation at station R1 and station R2 during the day, but the precipitation increases significantly at night. For station R1, it peaks at 00 LST, nearly all cases contribute to it, indicating that station R1 is a high-incidence center of nocturnal rainstorms. Station R2 peaks at 02 LST, there are also many cases that contribute to it at peak time. The precipitation peak of station R2 is weaker than station R1. Figure 3 shows the temporal and spatial distribution of the precipitation. In the daytime, there is almost no precipitation. At 20 LST, light rain occurs in western SCB. At 22 LST, the precipitation intensity strengthens and the precipitation area expands along the western mountains. Scattered precipitation areas gradually merge at 00 LST, and a strong precipitation center (R1) appears in the southwestern mountains. At 02 LST, the precipitation center moves southeastward and weakens (R2). At 04 LST, the precipitation area continues moving eastward, but the precipitation center disappears. By 06 LST, there was little rain. Nocturnal rainstorms in western SCB exhibit the characteristics of local, short duration, and suddenness.

3.2. Moisture Sources and Transport Paths of Rainstorms

HYSPLIT was used for the 10-day backward tracking of the moisture. Finally, four moisture transport paths were clustered (Figure 4a), paths 1–4 and their proportions are: the local path from southeastern SCB (51.9%), the southerly path from the South China Sea (35.1%), the northwestern path from western TP (6.6%), and the easterly path from the East China Sea (6.4%). Combining the temporal changes of meteorological elements (Figure 4b,c), path 2, which originates from the tropical sea, starts at the lowest altitude and with the highest specific humidity and temperature among all paths. As it transports northward to the land, its height gets higher, but its temperature and specific humidity decrease, especially when the airflow goes over the Yunnan–Guizhou plateau, and significant losses occur. Path 1 starts at a higher altitude with lower specific humidity and temperature than path 2, its short trajectory indicates that it runs quite slowly. Path 1 keeps nearly stagnant over the southeastern SCB in the first few days. It begins to move toward SCB 5 days before the rainstorm occurs. Path 4 also comes from the sea surface but with a higher altitude, lower specific humidity and temperature, and moves faster than path 2. Path 3 begins at the highest altitude, bringing dry and cold airflow from TP. Comparing paths from different directions, we find that all paths have converged in southeastern SCB 3 days before the rainstorm occurs, they will enter western SCB together thereafter. The contribution of paths 1 and 2 exceeds 80% but are both small for paths 3 and 4, therefore, paths 1 and 2 are the main moisture transport paths for nocturnal rainstorms in western SCB, that is, the southeastern SCB and the South China Sea are the major moisture sources. It is worth noting that path 1 accounts for more than 50%, implying that the local moisture source over southeastern SCB plays a crucial role in moisture transport. Many studies on the moisture transport of rainstorms in SCB have been conducted, Huang and Cui [30] used another Lagrangian atmospheric dispersion model, the Flexible Lagrangian Particle Dispersion Model (FLEXPART), to study rainstorms in SCB from 2009 to 2013 and discovered that the Bay of Bengal and the neighborhood of SCB (the local moisture source) are important sources, and rainstorms in western SCB are contributed to more by the local moisture source than those in central and northeastern SCB. Chen and Xu [31] also found that the moisture contribution of nearby areas of SCB reaches 51.6% in rainstorms of SCB. Our findings are consistent with theirs, but why does the moisture source in southeastern SCB play such a critical role in rainstorms over SCB and contribute more to the rainstorms in western SCB? The former studies [30,31] attribute these phenomena to local evaporation or regional precipitation recycling over SCB, but without detailed explanations. In this study, we will try to search for this reason from the perspective of the diurnal variations of the BLJ.
The above is to show the moisture transport paths from the Lagrangian viewpoint. Next, we will exhibit the distribution of moisture flux in the whole region from the Eulerian viewpoint. Figure 5 shows the moisture flux distribution on the 10th day (Figure 5a,d), the 5th day (Figure 5b,e) before the rainstorm occurs, and the day (Figure 5c,f) when the rainstorm occurs at daytime (14 LST) and nighttime (00 LST), respectively. It presents that a strong southwest moisture transport path from the Bay of Bengal through the South China Sea and then to China’s mainland persists in the study area during the period before the rainstorm occurs. Combined with path 2 in Figure 4a, it confirms that the persistent strong southwest monsoon is the large-scale circulation condition for the occurrence of nocturnal rainstorms in western SCB during the warm season. Owing to the thermodynamic difference between the continent and the ocean, the moisture source located in the Bay of Bengal is stronger in the afternoon than at night, and as the moisture is continuously transported to land, in contrast, the moisture flux on land is stronger at night, more significant in some areas, such as the southern coast, the eastern coast, and areas around YGP and SCB in China. The magnitude of the moisture flux depends on the specific humidity and the wind field. By calculating the specific humidity and the wind field at low levels during daytime and nighttime, it is found that the specific humidity changes little, while the wind field (mainly in the boundary layer height of each region) increases at night (Figures not shown), implying that it is the enhanced wind field that primarily causes the enhanced moisture transport at night. Du et al. [32] demonstrated that the southern coast, the eastern coast, and areas around YGP of China are with a high frequency of BLJs, so it can be assumed that the BLJ in southeastern SCB plays an essential role in the moisture transport of nocturnal rainstorms in western SCB, and its formation mechanism will be explored next.

4. Characteristics of the Moisture Transport

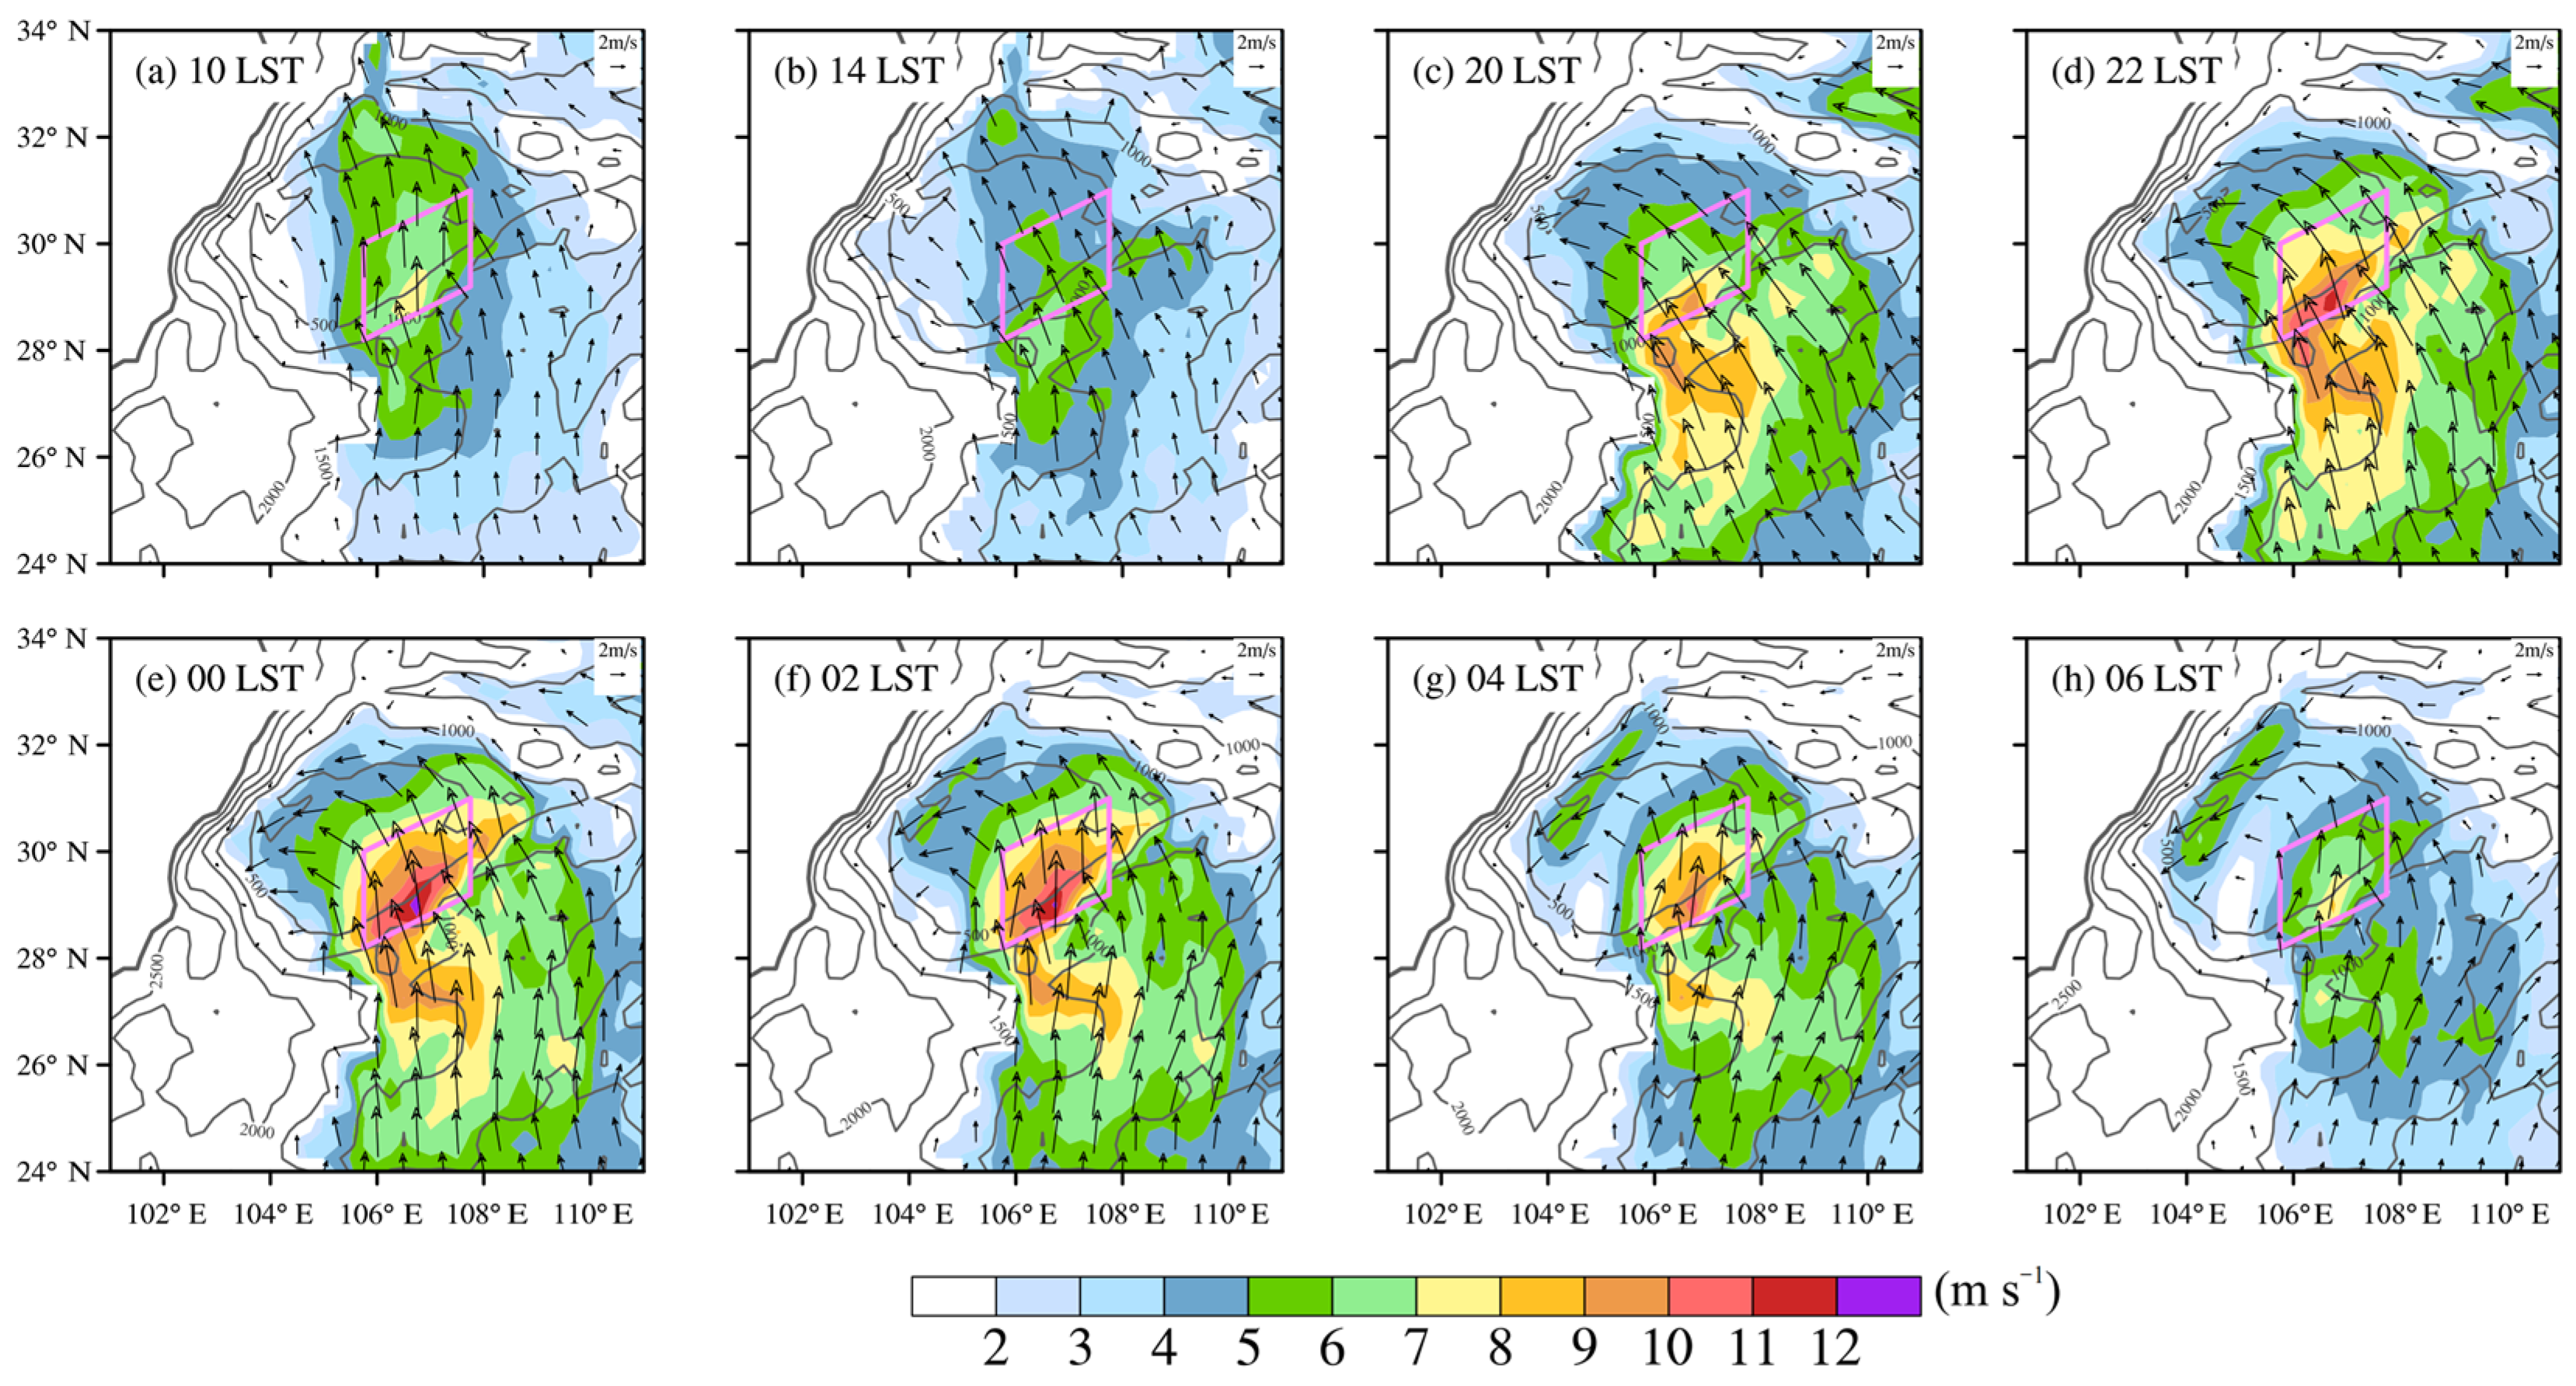
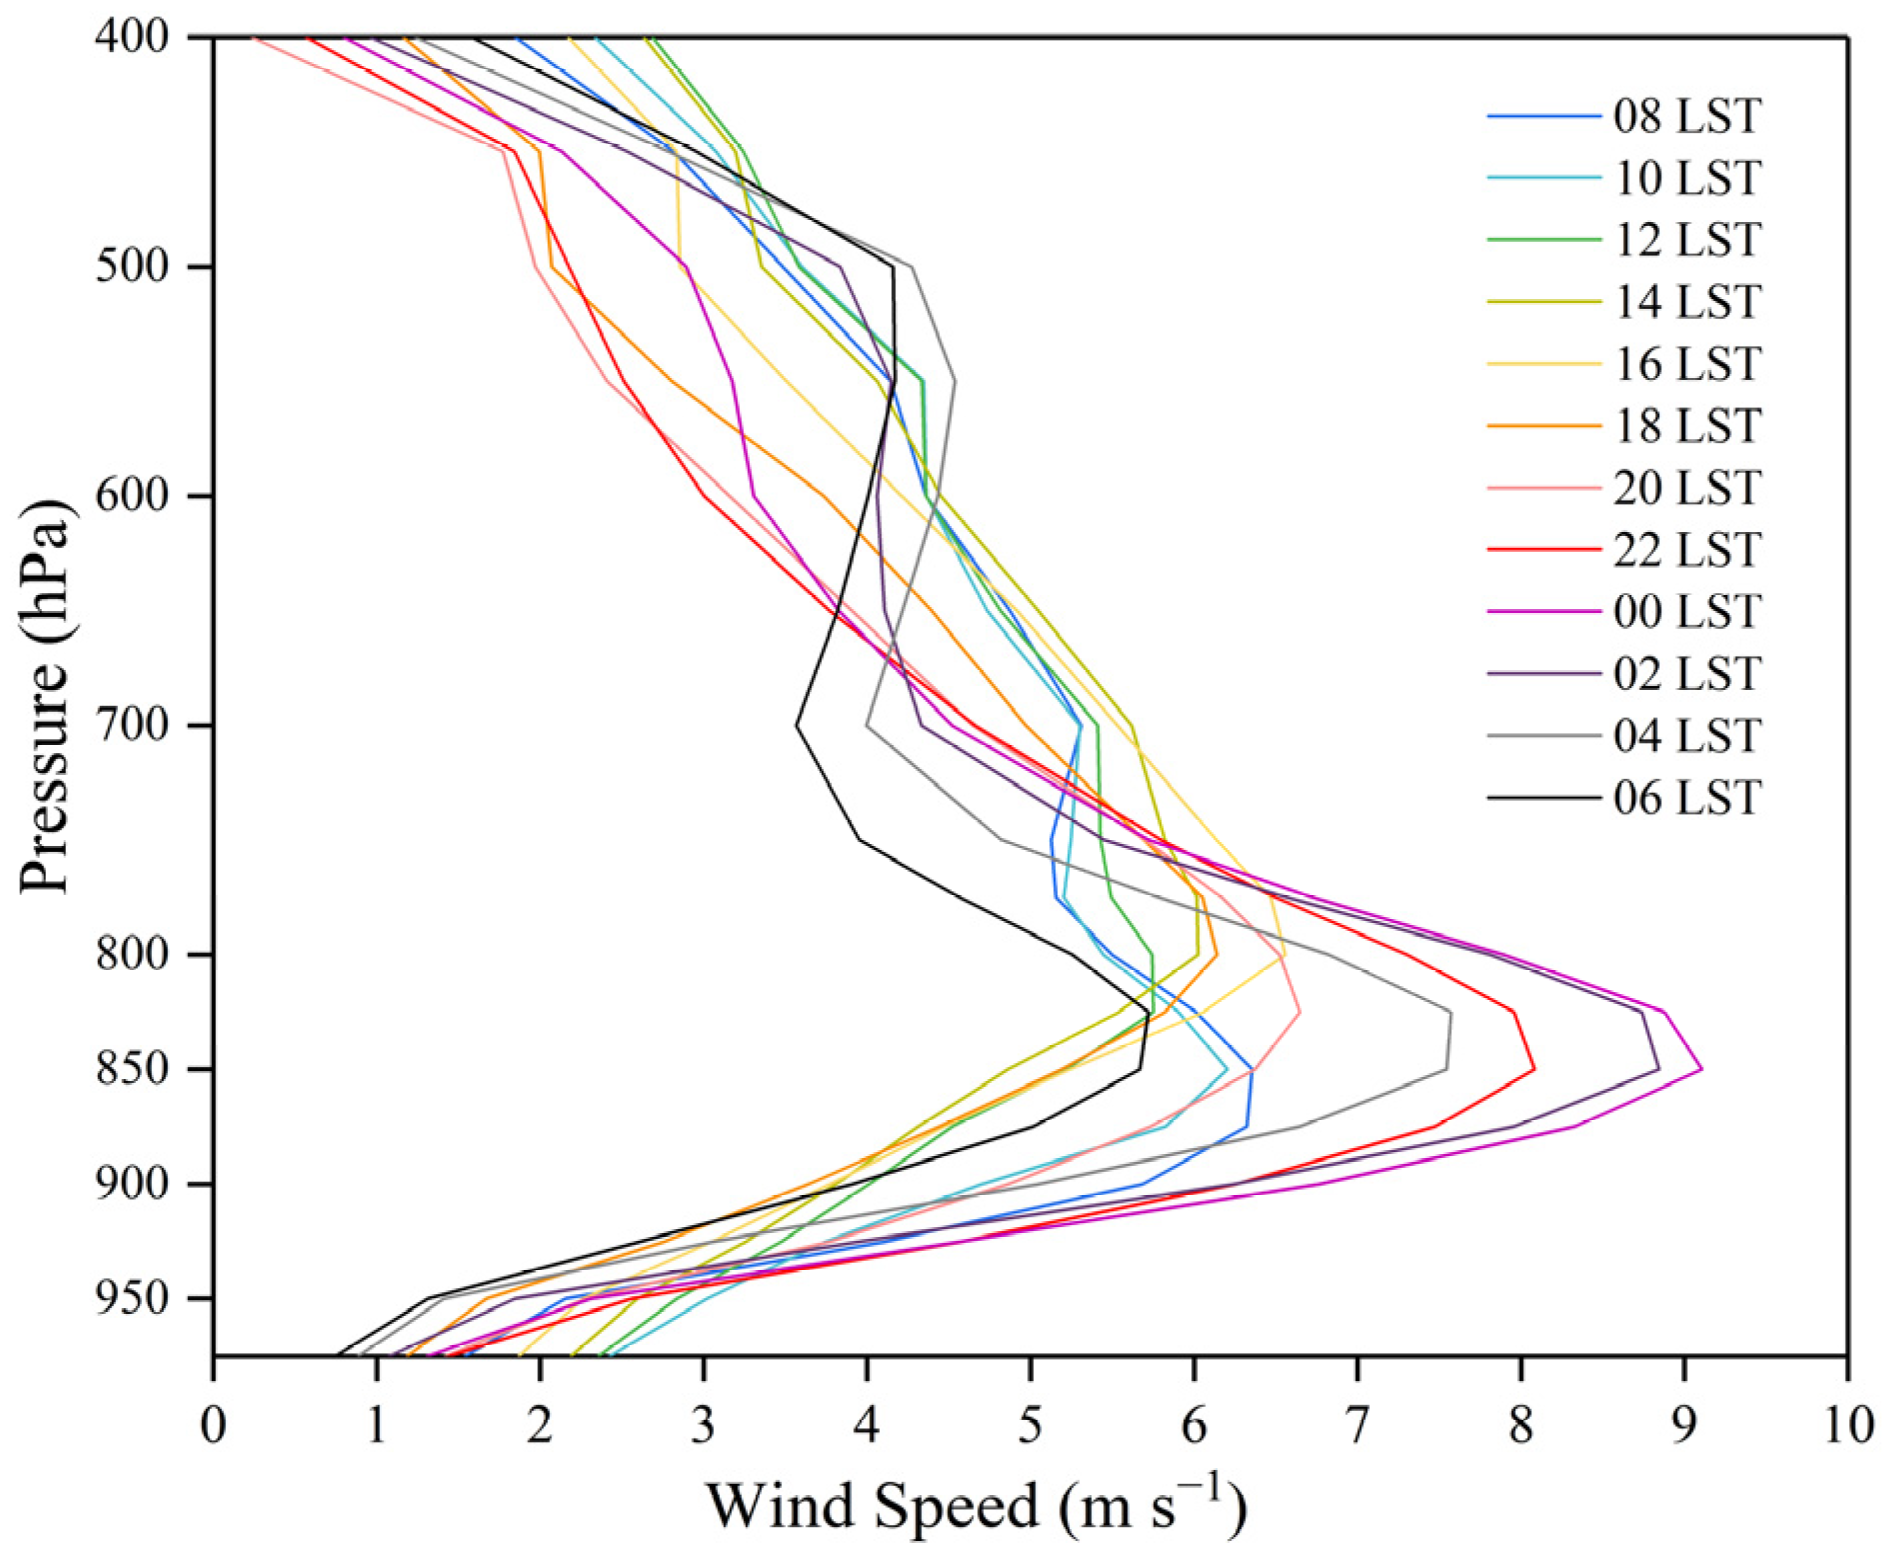
4.1. Diurnal Variations of the Boundary Layer Low-Level Jet

4.1.1. Diurnal Variations of Low-Level Geostrophic Winds and Ageostrophic Winds

Considering the high altitude of the study area, we chose 850 hPa as the boundary layer height of this region, and the diurnal variations of the 850 hPa wind field were made by averaging 15 cases (Figure 6). It can be seen that there is always a southerly flow over SCB, and its magnitude and direction exhibit obvious diurnal variations; the wind speed is weak during the day, reaching the minimum at 14 LST, but increases after 20 LST, while the wind speed over southeastern SCB (indicating by the pink box, region S) increases most. Meanwhile, the cyclonic rotation of the wind field is enhanced at night, which reaches its strongest at 22 LST, with the wind speed exceeding 12 m s–1. After 22 LST, the wind speed continues increasing, peaking at 00 LST, but the cyclonic rotation of the wind field does not enhance, instead, the wind turns to rotate clockwise, changing from southeast to southwest gradually. The wind speed profile of region S (Figure 7) appears to be an obvious “nose-like” structure. The maximum wind speed occurs at 850 hPa, with a strong vertical shear, which satisfies the criteria of LLJs [33], confirming that the BLJ exists over southeastern SCB in nocturnal rainstorms in western SCB. It also can be seen that the wind speed in western SCB is low compared with southeastern SCB.
Total winds are decomposed into the sum of geostrophic and ageostrophic flow (V = Vg + Va) to explore the reason for diurnal variations of the BLJ. Since geostrophic winds remain constant, the diurnal variations of ageostrophic winds cause the diurnal variations of total winds. The large-scale background of the wind field approximately satisfies the geostrophic equilibrium. Referring to the scheme of Xue et al. [20], the small-scale fluctuations are filtered out and the large-scale fluctuations are retained by the Barnes filtering method [34], and then geostrophic winds are calculated using the obtained large-scale geopotential height field. Finally, ageostrophic winds can be calculated by subtracting geostrophic winds from total winds. As shown in Figure 8, the large-scale background wind field is used to replace the geostrophic wind field, because of the thermodynamic difference between the continent and the ocean, the obtained geostrophic winds are stronger during the daytime, but the geostrophic wind direction remains unchanged and is always southwesterly and parallel to the geopotential height. Here, we hypothesize that the effects of diurnal variations of the large-scale circulation are small compared to the effects of ageostrophic winds changes [20]. The directions of ageostrophic winds exhibit obvious diurnal variations—a clockwise circular motion from the northeast–east–southeast–southwest–northwest–northeast. During the daytime, ageostrophic winds are in the opposite direction of geostrophic winds, weakening the geostrophic winds, and making total winds subgeostrophic during the day. While at night, the clockwise ageostrophic winds turn to be in the same direction as geostrophic winds, making total winds supergeostrophic and thus increasing the wind speed at night, eventually leading to the diurnal variations of the BLJ, which is in accord with the Blackadar’s theory of inertial oscillations [13].

4.1.2. The Creeping Flows and Circumfluence Flows Caused by Geostrophic and Ageostrophic Winds

The boundary layer inertial oscillations cause diurnal variations of ageostrophic winds, at the same time, the complex topography changes the movement of airflows to a large extent. These two effects exist together. To reveal the topography effect, according to Equations (6)–(9), we further decompose the geostrophic and ageostrophic winds to obtain geostrophic creeping flows, geostrophic circumfluence flows, ageostrophic creeping flows, and ageostrophic circumfluence flows, respectively. Considering the large terrain gradient in SCB, the 900 hPa and 850 hPa pressure levels were selected to observe the diurnal variations of creeping flows and circumfluence flows. Firstly, parallel to the terrain gradient, creeping flows (Figure 9) tend to enter or exit each boundary nearly perpendicularly. At 900 hPa, creeping flows are mainly generated by the interaction between the central basin and mountainous areas around SCB, while at 850hPa, creeping flows between mountains and plateaus (boundaries B and C) appear. The southerly geostrophic creeping flows (blue arrows in Figure 9a–d) always produce descending motions at boundary A, causing a large number of inflows into SCB. Most of the geostrophic creeping flows continue to move northward, due to the low altitude of Daba Mountain in the northeastern boundary; plenty of geostrophic creeping flows can go over boundary D and flow out of SCB. The ageostrophic creeping flows (Figure 9e,f) also exhibit a clockwise rotation: at 14 LST, the northerly ageostrophic creeping flows appear primarily over southeastern SCB and will pull the flows out of SCB. At 22 LST, the ageostrophic creeping flows convert to the southeast direction, towards the western SCB. Most of them flow directly into western SCB, blocked by the high topography of TP, thus gathering in western SCB. After 22 LST, the ageostrophic creeping flows continue rotating clockwise and gradually become southwest flows, some of them will flow out SCB through boundary D. The circumfluence flows (Figure 10) are different from creeping flows, which are perpendicular to the terrain gradient. They always flow along mountains, approximately parallel to the mountain boundaries A, B, C, and D. Since geostrophic winds are southwest, the geostrophic circumfluence flows (Figure 10a–d) rotate counterclockwise along the mountains. The ageostrophic circumfluence flows (Figure 10e,f) mainly rotate clockwise along mountains, opposite to the geostrophic circumfluence flows.

4.1.3. The Total Vertical Velocity and Forced Vertical Velocity Generated by Creeping Flows

As topography has a lifting impact on airflows, we compare the total vertical velocity and the vertical velocity forced by total creeping flows, geostrophic creeping flows, and ageostrophic creeping flows, respectively. Their vertical cross-sections along line L (Figure 1) are illustrated in Figure 11 and Figure 12. Line L crosses three types of terrains: the basin, the mountain, and the plateau, which can exhibit changes in the vertical velocity along the complex terrain well. For the total vertical velocity (Figure 11a–d), the ascending motions over point P (Figure 1) are weak during the day (Figure 11a), indicating that there are few inflows from outside SCB during the daytime. Thus, the vertical velocity within the basin in the daytime is less affected by external influences but mainly generated by the local effect of SCB. It can be seen that the vertical upward motions primarily develop along the eastern slope of TP, also existing above TP in the day. Meanwhile, a corresponding downward branch is located in the central and eastern SCB, which consists of the valley wind circulation in the afternoon formed by the thermal effect between SCB and TP. At 22 LST (Figure 11b), the descending motions above point P are greatly enhanced at low levels, implying that a lot of southeastern airflows flow into SCB; when the strong easterly airflows pass the transition from the central basin to western mountains, the updraft significantly amplifies. An upward motion center appears above station R1, which is located on the western mountains’ windward slope. Compared to the uphill winds during the daytime, the vertical upward motions at night expand nearly to the whole basin, which is heavily affected by airflows from outside SCB. At 00 LST (Figure 11c), the descending movements above point P remain strong, and the ascending motions concentrate over the rainstorm area and strengthen upward. Meanwhile, shallow downslope winds appear along TP. The downdraft above point P attenuates at 02 LST (Figure 11d), resulting in weakness of the updraft over western SCB. But the downslope winds from TP develop significantly. A sinking core appears at low levels over western mountains at 02 LST, caused by the mountain wind formed at night due to the thermal effect.
By Equation (10), it is clear that the vertical velocity forced by creeping flows is proportional to the magnitude of the terrain gradient. Hence, the forced vertical upward motions mainly occur along the windward slope over eastern TP, and the descending motions exist over the southeastern SCB, where in both exist large terrain gradients. In contrast, the vertical motions over the central basin are very weak because of the flat terrain (Figure 11e–h). The vertical motions forced by creeping flows are completely produced by the dynamic effect of the topography. Thus, the development of the thermally-induced downslope winds (Figure 11b–d) is not observed in forced vertical motions (Figure 11f–h) at night. However, both downslope winds from TP and upward motions forced by creeping flows develop along the windward TP slope at night. The warm–moist air meets with the cold–dry air, which triggers convection and dramatically strengthens the total vertical velocity (Figure 11b,c). From the vertical cross-sections of the equivalent potential temperature (θe) (Figure 11a–d), at 14 LST (Figure 11a), the θe at low levels decreases with height, indicating that the unstable stratification has been established. The θe gradient zone is located in the eastern SCB. At 22 LST (Figure 11b), due to the increase of moisture flowing into SCB, a warm–moist tongue develops along the slope of eastern TP. At 00 LST (Figure 11c), downslope winds from TP appear, the conflict of warm–moist and cold–dry air triggers convection, causing total vertical upward motions to enhance significantly, and the unstable stratification is up to 400 hPa, leading to the rainstorm peak at this time. At 02 LST (Figure 11d), easterly flows from outside SCB weaken, but the cold-dry downslope winds from TP continuously sink and form a cold pool at low levels. As a result, the θe decreases largely, and the warm–moist tongue structure of θe is destroyed and the precipitation center moves southeastward (R2) and weakens.
From the above analysis, we know that both the total vertical velocity and the forced vertical velocity generated by creeping flows are weak during the daytime but strengthen at night, and the ascending motions over western SCB change synchronously with the descending motions over southeastern SCB (Figure 11), indicating that the strengthened flows over southeastern SCB at night play an important role in increasing upward motions over western SCB. Figure 12 shows that the vertical motions forced by geostrophic and ageostrophic creeping flows are both limited at low levels. Still, the former is lower, below 850 hPa, with weaker intensity and slight diurnal variations (Figure 12a–d). Since the northerly ageostrophic creeping flows over southeastern SCB during daytime can hardly enter SCB, the vertical motions forced by them are weak during the day (Figure 12e). At night, ageostrophic creeping flows rotate clockwise into SCB, forcing strong vertical upward motions up to 600 hPa on the windward slope of TP (Figure 12f,g), resulting in the enhancement of upward velocity forced by total creeping flows (Figure 11f,g). The vertical motions forced by creeping flows are confined to low levels and are smaller than the total vertical velocity. This is because the total vertical velocity is the sum of the systematic vertical velocity and the topographically forced vertical velocity, the vertical motion is generated by both the dynamic forcing of the topography itself and the contribution of other uplift effects [26]. Undoubtedly, the forced upward motions generated by creeping flows are crucial for moisture transport at low levels and are also beneficial to trigger convection on windward slopes of TP, thereby amplifying the upward motions over western SCB.

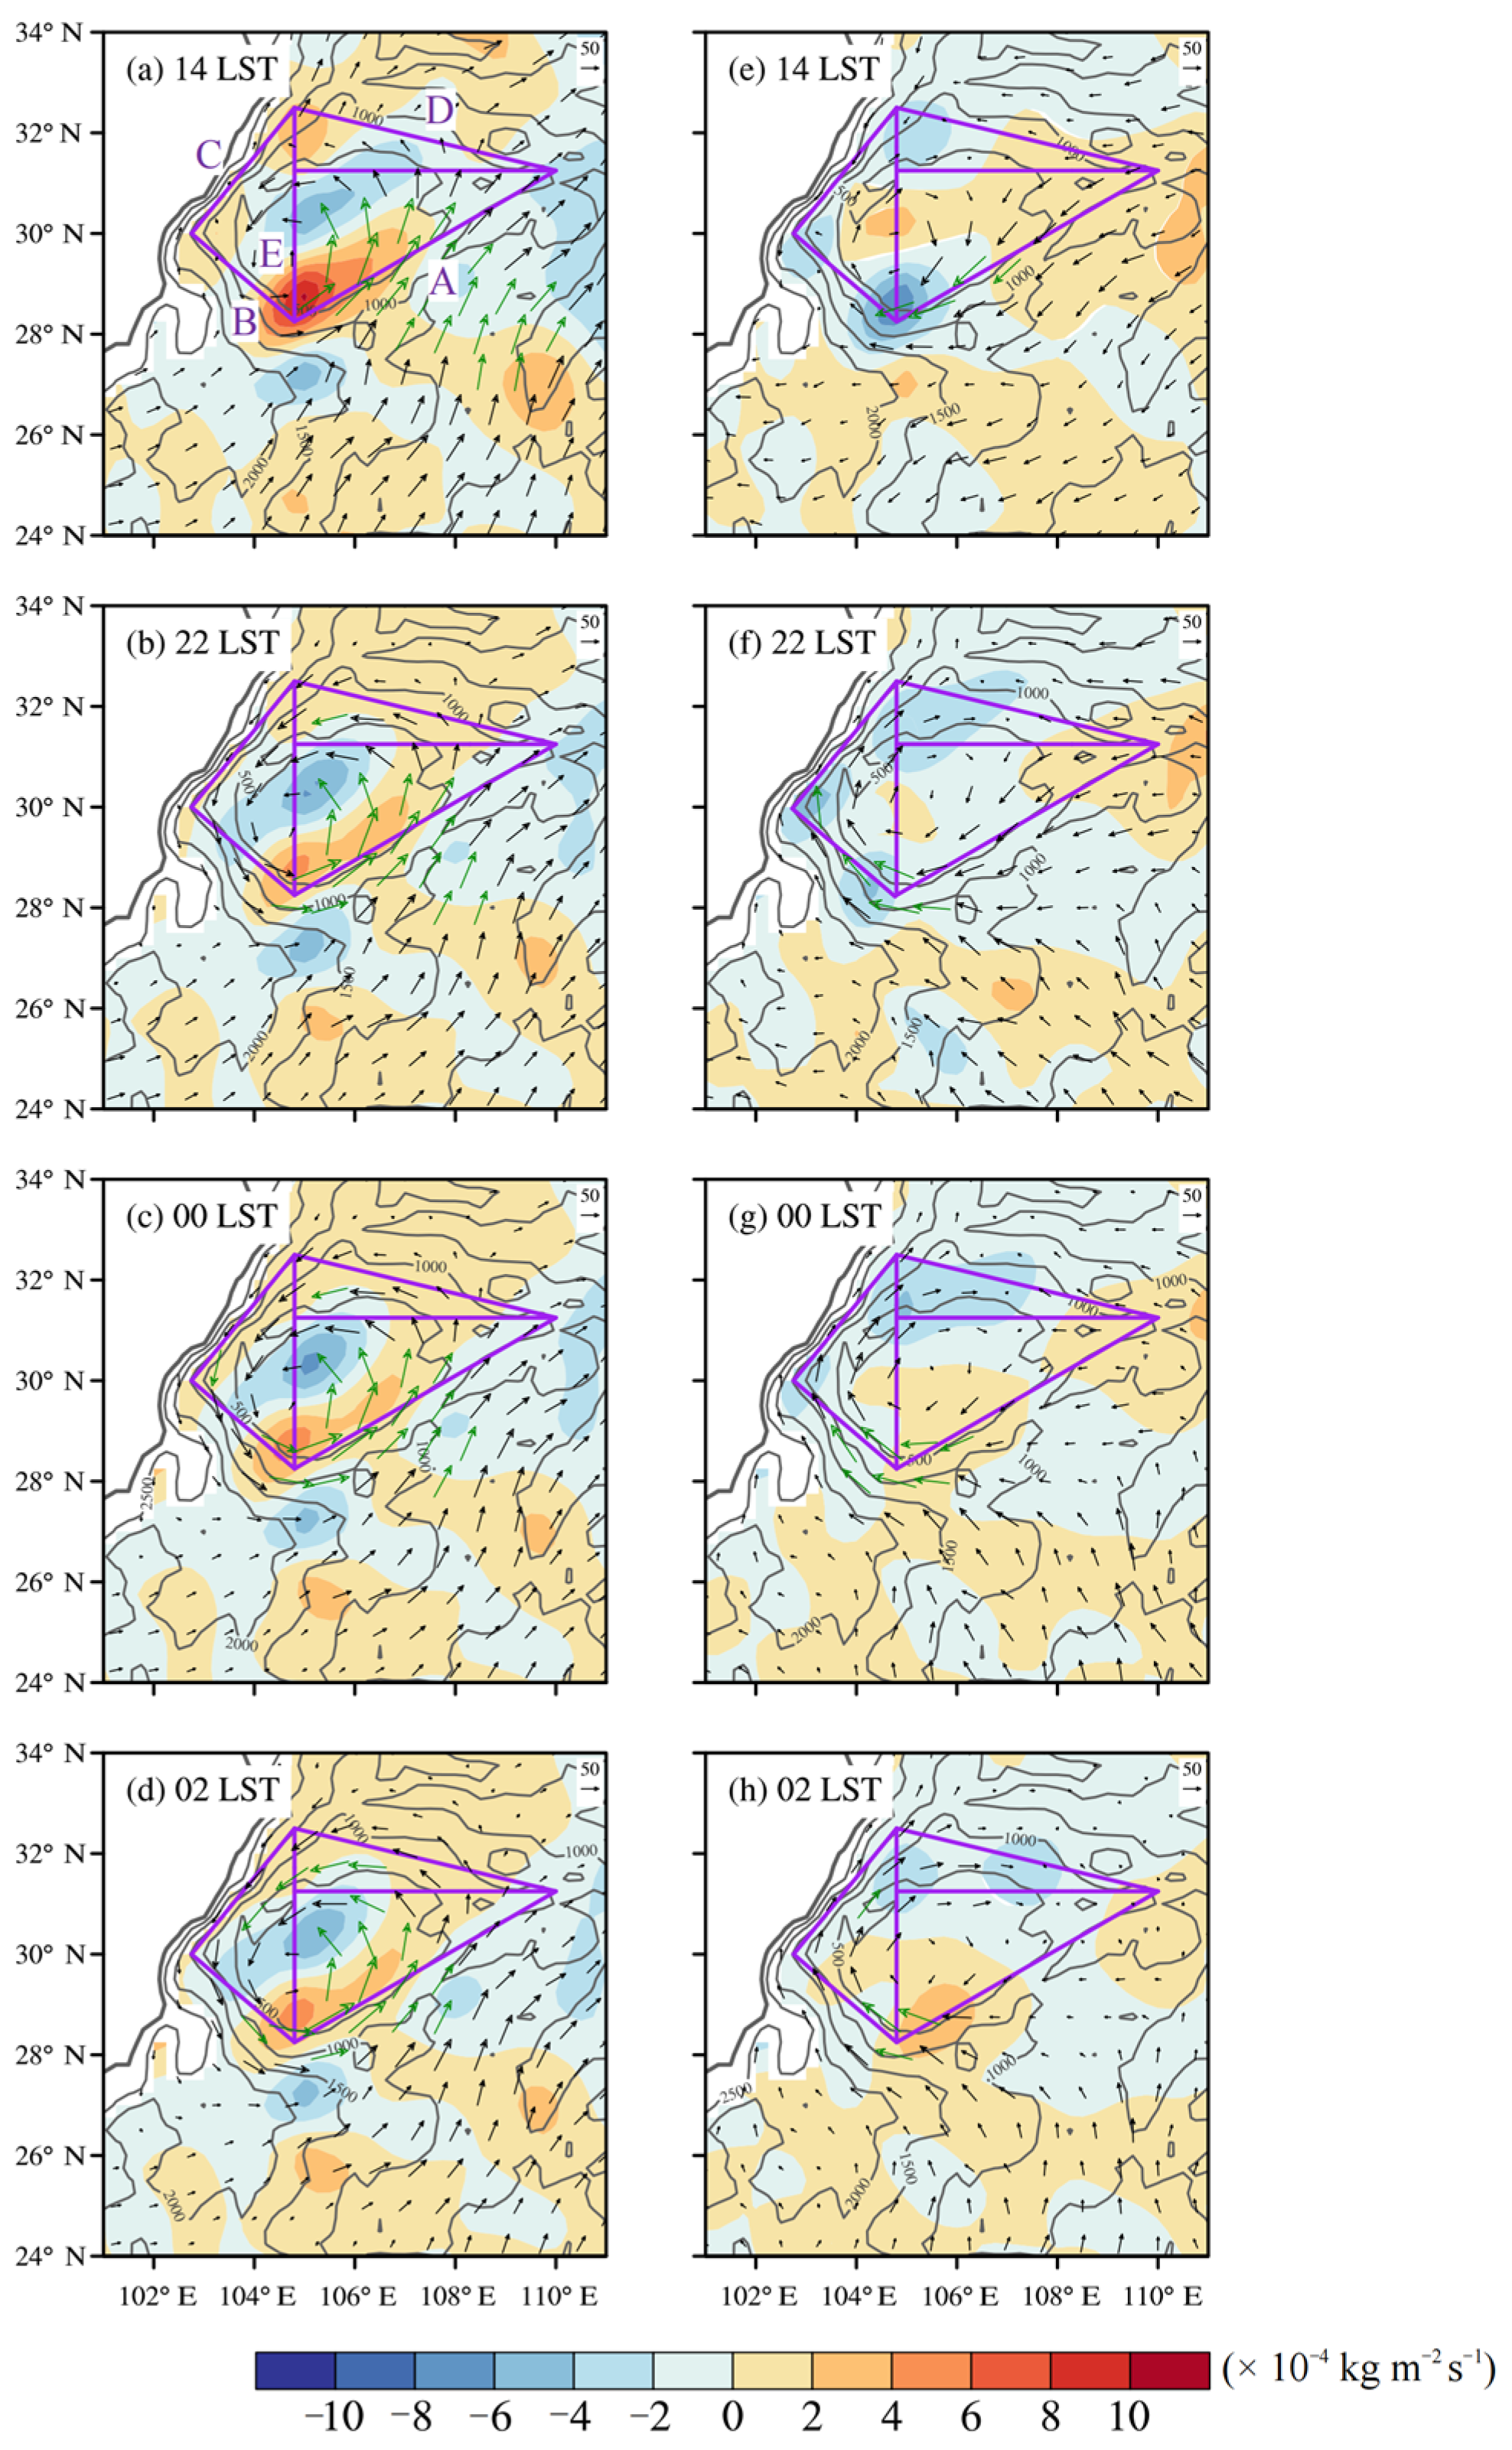
4.2. Diurnal Variations of the Moisture Flux and the Moisture Flux Divergence

Section 4.1 introduces the diurnal variations of the wind field. This section discusses the diurnal variations of the moisture flux and the moisture flux divergence of nocturnal rainstorms. The distribution of the total moisture flux (Figure 13) is similar to the 850 hPa wind field (Figure 6). Boundary A in southeastern SCB is always the entrance of the southerly moisture. The moisture flux divergence in western SCB shows an evident diurnal variation: being divergent during the day but turning to be convergent at night, and the moisture convergence is mainly distributed over southwestern mountains, corresponding to the rainstorm areas, peaking at 00 LST, the same as the rainstorm peak. Although there is a strong moisture convergence zone in western SCB at night, the moisture flux is small there, which is mainly due to the low wind speed in western SCB (Figure 6), indicating that the moisture tends to converge and accumulate in western SCB. In contrast, the low wind speed makes the moisture rarely flow out, and this is closely related to the topography of western mountains. To seek the causes of the enhanced moisture convergence at night in western SCB, we calculated the moisture flux and the moisture flux divergence generated by geostrophic creeping flows, geostrophic circumfluence flows, ageostrophic creeping flows and ageostrophic circumfluence flows, respectively.
From the moisture flux and the moisture flux divergence generated by geostrophic creeping flows (Figure 14a–d), in combination with Section 4.1.2, we know that the majority of the moisture transported by southwest geostrophic creeping flows will flow out from low-altitude boundary D, thus forming moisture divergence at boundary D. There are also some moistures that flow out from boundaries B and C. The ageostrophic creeping flows flow northerly during the daytime (Figure 14e), causing moisture to flow out from boundaries A and B. Therefore, creeping flows mainly cause moisture divergence during the daytime. At 22–00 LST (Figure 14f,g), the ageostrophic creeping flows rotate clockwise into southeasterly flows, transporting a large amount of moisture into western SCB perpendicularly through the southeastern boundary, converging in western SCB because of the blocking effect of TP. At 02 LST (Figure 14h), the ageostrophic creeping flows begin to turn southwestward, causing some moisture to flow out from boundary D. Unlike creeping flows, circumfluence flows (Figure 15) flow along mountains around SCB, tending to accumulate in topographic depressions, such as the “trumped” topography in western SCB. The moisture fluxes generated by geostrophic circumfluence flows (Figure 15a–d) and ageostrophic circumfluence flows (Figure 15e–h) are in opposite directions, when they meet at western SCB, a strong moisture convergence zone forms, providing a sufficient moisture condition for the occurrence of rainstorms in western SCB.

4.3. Diurnal Variations of the Moisture Budget

The diurnal moisture budget curves were made for boundaries A, B, C, D, E, and regions SCB, the western SCB, and the northeastern SCB, respectively (Figure 16). Since SCB is controlled by the southwest monsoon in the warm season and the southeastern boundary of SCB is the lowest, boundary A (Figure 16a) is the most important moisture entrance in the SCB. The total moisture budget keeps positive for the whole day and increases at night, reaching a peak at 22 LST. The geostrophic winds contribute positively to the moisture budget of boundary A, while geostrophic creeping flows are responsible for most of the net moisture fluxes. Ageostrophic winds contribute negatively during the day but positively at night, which is caused by the clockwise rotation of ageostrophic winds due to the inertial oscillations in the boundary layer. The high-altitude boundaries of B and C are difficult for airflows to go over, so the moisture budgets of these two boundaries are small (Figure 16b,c). The total moisture budget of boundary D (Figure 16d) is always negative, owing to substantial negative moisture fluxes caused by geostrophic creeping flows. Boundary E (Figure 16e) is the entrance to western SCB, whose total moisture budget is small during the day but increases mainly during the night, peaking at 22 LST. The moisture budget of boundary E is influenced by the four mountainous boundaries (boundary A, B, C, and D), by calculating the correlation coefficients between boundary E and the other 4 boundaries, the result shows that the moisture budget of boundary E is only related to boundary A, and the correlation coefficient reaches 0.7 (passed the significance test of 0.01). The moisture budget of western SCB (Figure 16f) relies on the three boundaries around it (boundaries B, C, and E). The western SCB is positively correlated with boundary E (the correlation coefficient is 0.88), while it is negatively correlated with boundary B (the correlation coefficient is −0.54), and fails the significance test with boundary C, indicating that the moisture in western SCB is primarily from the contribution of easterly flows. Moreover, the correlation coefficient between western SCB and boundary A reaches 0.72, further revealing that the southeastern SCB is an important moisture source in nocturnal rainstorms of western SCB, which proves the existence of path 2 in Figure 4a. The peak of moisture budget in western SCB also occurs at 22 LST, 2 h earlier than the rainstorm peak. The total diurnal variation of the moisture budget in northeastern SCB (Figure 16g) maintains small throughout the day, which is not in favor of precipitation. The diurnal variation of the total moisture budget of SCB (Figure 16h) is in phase with that of western SCB, so it is the diurnal variation of western SCB that primarily changes the moisture budget in SCB. At 22 LST, the peak time of the moisture budget in the western SCB, the moisture contributions caused by each component are: ageostrophic circumfluence flows (48%) > ageostrophic creeping flows (33%) > geostrophic circumfluence flows (12%) > geostrophic creeping flows (7%). The positive contribution caused by circumfluence flows reached 60%, and combined with Section 4.2, we know that circumfluence flows play an essential role in moisture convergence and accumulation in western SCB during the night.

5. Conclusions and Discussion

In this paper, 15 cases of nocturnal rainstorms in western SCB from May to September 2010 to 2021 are selected, the temporal and spatial distribution characteristics of nocturnal rainstorms are analyzed, and the moisture sources and transport paths of rainstorms are obtained using the HYSPLIT model. Finally, the roles of the BLJ in the moisture transport process under the combined effects of inertial oscillations and topography were discussed. Specific findings are as follows:
Nocturnal rainstorms in western SCB mainly occur along mountains in southwestern SCB, with altitudes ranging from 500–1500 m, from 22 to 04 LST, peaking at 00 LST, exhibiting the characteristics of local, short duration, and suddenness.
The four moisture transport paths and their proportions of nocturnal rainstorms are: the local transport path from southeastern SCB (51.9%), the southerly path from the South China Sea (35.1%), the northwestern path from western Tibetan Plateau (6.6%), and the easterly path from the East China Sea (6.4%). The persistent and strong southwest monsoon is the large-scale circulation condition for the occurrence of nocturnal rainstorms in western SCB during the warm season, while the BLJ, located at 850 hPa over southeastern SCB, dominates the diurnal variations of the moisture transport in western SCB.
The southwest geostrophic creeping flows cause a large number of outflows at the low-altitude northeastern boundary of SCB, while the northerly ageostrophic winds pull the moisture out of SCB in the day, causing moisture divergence in SCB during the daytime. At 22 LST, the ageostrophic creeping flows turn to the southeast direction due to the clockwise rotation caused by inertial oscillations of the BLJ, transporting moisture directly into western SCB and then converging because of the blocking effect of TP. Meanwhile, the southwest geostrophic circumfluence flows rotate counterclockwise along mountains around SCB and the southeast ageostrophic circumfluence flows rotate clockwise. They meet and accumulate at the “trumpet” topography in western SCB, leading to strong convergence in this region. The creeping flows force upward motions on the windward slope of eastern TP and the conflict between warm–moist flows and the cold–dry downslope flows from TP triggers convection, which significantly strengthens the vertical velocity, favoring the outbreak of nocturnal rainstorms in western SCB.
The moisture budget in western SCB peaks at 22 LST, 2 h earlier than the rainstorm peak. The correlation coefficient of the moisture budget between western SCB and the southeastern boundary reaches 0.7, indicating that the southeastern SCB is a significant moisture source for nocturnal rainstorms in western SCB. The positive contribution of the moisture budget caused by circumfluence flows reaches 60% at the peak time of the rainstorm, suggesting that circumfluence flows play an essential role in moisture convergence and accumulation in western SCB.
To explore the impact of the topography on moisture transport quantitatively, the study simply decomposes the wind field into the creeping flow and the circumfluence flow, but in fact, the final behaviours of air masses as they approach a mountain ridge are very complex, depending on wind speed, stratification, mountain size, and shape, etc., but we do not consider this comprehensively in this study. Three important aspects should be noted in terrain precipitation [35]: (a) large-scale ambient atmospheric circulation, (b) the interaction of the ambient flow with terrain, and (c) cloud microphysical processes. It is difficult to separate these three aspects cleanly because they can operate synergistically. In addition to the dynamical effects of terrain on airflows on the macro scale, the impact of terrain on cloud microphysical processes is of great importance. Our study and some studies in recent years [22,36] have confirmed that diurnal variations of the BLJ caused by inertial oscillations exert important influences on the diurnal cycles of the precipitation in SCB, but all studies limit to the warm season, and it needs to be studied whether it applies to other seasons. Many studies have shown that there are regional differences in precipitation within SCB, the eastward propagation of precipitation is a distinctive feature, with precipitation occurring mainly during the early night (18–00 LST) in the western SCB and during the late night (00–06 LST) in the central and eastern SCB, there is also an afternoon precipitation peak in eastern SCB during summer [37,38,39]. Our study found that the BLJ may be more favorable for nocturnal rainstorms in western SCB because of the higher and more complex topography compared with other regions in SCB. Rainstorms in northeastern SCB should also be influenced by other weather systems or processes. Zhang et al. [40] found that the interaction of double LLJs (700 hPa SLLJ and 850 hPa BLJ) lead to a sudden rainstorm in northeastern SCB, while many studies showed that rainstorms in northeastern SCB were influenced by the intrusion of cold advection from the north [41,42]. Thus, the differences in the moisture transport process between western SCB and northeastern SCB need to be further studied.
The precipitation over a region is related to the local moisture already existing in the atmosphere, the long-distance moisture transport, and the local evaporation [43]. Our study mainly focused on the first and second factors. Pathak et al. [44] suggested that local evaporation has potential impacts on precipitation formation by providing extra moisture and causing increased precipitation recycling. Therefore, it is also important to study the roles of the local evaporation in the moisture transport process in western SCB. The simulation of rainstorms under complex terrain is a difficulty. In our study, we decompose the wind field into creeping flows and circumfluence flows. These flows are closely related to the terrain and changed the path of moisture transport. Therefore, it is important for the simulation of the wind field of the rainstorm in complex terrain. One simple way to solve this problem is to improve the simulation resolution; the high resolution can simulate the fine structure of the wind field, similar to the WRF-LES. The other way is to adopt the subgrid-scale terrain parameterization scheme. High bias of surface wind speed has been reported in the WRF model over flat regions and over windward slopes [45,46]. Lee et al. [47] adopted the subgrid-scale terrain parameterization scheme into the simulation of mountain rainstorms. They found that the more realistic surface wind field in the WRF model caused moisture divergence and increased surface latent heat flux, which alleviated the excessive precipitation simulated over mountainous areas of East Asia. The idea of improving terrain precipitation by improving the wind field forecast is worth exploring.

Author Contributions

A.W. and G.L. contributed to the conceptualization, methodology, investigation, writing, reviewing, and editing of the present work. All authors have read and agreed to the published version of the manuscript.

Funding

This research was funded by the National Natural Science Foundation of China (grant No. 42175002, No. 91937301, No. 42075013), the Natural Science Foundation of Sichuan, China (No. 2023NSFSC0242), and Key Grant Project of Science and Technology Innovation Ability Enhancement Program of CUIT (No. KYTD202201).

Institutional Review Board Statement

Not applicable.

Informed Consent Statement

Not applicable.

Data Availability Statement

The ERA5 data is downloaded from the Climate Data Store (CDS) (https://cds.climate.copernicus.eu/cdsapp#!/dataset/reanalysis-era5-land?tab=overview) (accessed on 12 July 2019). The GDAS one-degree data is downloaded from the National Centers for Environmental Prediction (NCEP) (ftp://ftp.arl.noaa.gov/pub/archives/gdas1). The Global Land 1 km Base Elevation Project (GLOBE) database is downloaded from the National Oceanic and Atmospheric Administration (NOAA) (https://www.ngdc.noaa.gov/mgg/topo/globe.html) (accessed on 1 April 2008).

Acknowledgments

We would like to express our gratitude to the workers in the ECWMF for ERA5, the National Geophysical Data Center of the National Oceanic and Atmospheric Administration (NOAA) for providing global Digital Elevation Model (DEM) data, and the developer of HYSPLIT model, Roland Draxler. We thank the anonymous reviewers who provide helpful comments that improved the article.

Conflicts of Interest

The authors declare no conflict of interest.

References

  1. Wang, Y.; Deng, L.J. Quantitative structural analysis of land use and study on land sustainable utilization in Sichuan Province. JSAU 2006, 24, 194–200. (In Chinese) [Google Scholar]
  2. Zhou, Q.X.; Liu, Y.; Feng, L.M.; Niu, J.L. Analysis on temporal and spatial distribution characteristics of strong hour rainfall intensity in Sichuan during 2008–2012. Plateau Meteorol. 2015, 34, 1261–1269. (In Chinese) [Google Scholar]
  3. Chen, Y.R.; Li, Y.Q. Convective characteristics and formation conditions in an extreme rainstorm on the eastern edge of the Tibetan plateau. Atmosphere 2021, 12, 381. [Google Scholar] [CrossRef]
  4. Huang, C.H.; Li, G.P.; Zhang, F.L.; Gao, Y.Z.; Wang, M.Y.; Guo, S.Y. Evolution characteristics of mountain rainstorms over Sichuan Province in the past ten years under the influence of climate change. Torrential Rain Disasters 2020, 39, 335–343. (In Chinese) [Google Scholar]
  5. Liu, C.; Nie, R.H.; Liu, X.N.; Xu, W.L. Research conception and achievement prospect of key technologies for forecast and early warning of flash flood and sediment disasters in mountainous rainstorm. Adv. Eng. Sci. 2020, 52, 1–8. (In Chinese) [Google Scholar]
  6. Brimelow, J.C.; Reuter, G.W. Transport of atmospheric moisture during three extreme rainfall events over the Mackenzie River basin. J. Hydrometeorol. 2005, 6, 423–440. [Google Scholar] [CrossRef]
  7. Draxler, R.R.; Stunde, G.D.; Rolph, G. Hysplit_4 User’s Guide; NOAA Tech. Memo. ERL ARL-224; NOAA Air Resources Laboratory: Silver Spring, MD, USA, 2005. [Google Scholar]
  8. Shi, Y.; Jiang, Z.H.; Liu, Z.Y.; Laurent, L. A Lagrangian analysis of water vapor sources and pathways for precipitation in East China in different stages of the East Asian summer monsoon. J. Clim. 2020, 33, 977–992. [Google Scholar] [CrossRef]
  9. Guo, L.Y.; Shi, Y.; Jiang, H.R. Comparison of impact and water vapor characteristics between two types of floods in Eastern China. Environ. Res. Lett. 2022, 17, 024039. [Google Scholar] [CrossRef]
  10. Yang, H.; Xu, G.Y.; Mao, H.X.; Wang, Y. Spatiotemporal variation in precipitation and water vapor transport over central Asia in winter and summer under global warming. Front. Earth Sci. 2020, 8, 297. [Google Scholar] [CrossRef]
  11. Saulo, A.C.; Ruiz, J.; Skabar, Y.G. Synergism between the low-level jet and organized convection at its exit region. Mon. Weather Rev. 2007, 135, 1310–1326. [Google Scholar] [CrossRef]
  12. Du, Y.; Chen, G.X. Climatology of low-level jets and their impact on rainfall over southern China during early-summer rainy season. J. Clim. 2019, 32, 8813–8833. [Google Scholar] [CrossRef]
  13. Blackadar, A.K. Boundary layer wind maxima and their significance for the growth of nocturnal inversions. Bull. Am. Meteorol. Soc. 1957, 38, 283–290. [Google Scholar] [CrossRef] [Green Version]
  14. Holton, J.R. The diurnal boundary layer wind oscillation above sloping terrain. Tellus 1967, 19, 199–205. [Google Scholar] [CrossRef]
  15. Du, Y.; Rotunno, R. A simple analytical model of the nocturnal low-level jet over the Great Plains of the United States. J. Atmos. Sci. 2014, 71, 3674–3683. [Google Scholar] [CrossRef]
  16. Shapiro, A.; Fedorovich, E.; Rahimi, S. A unified theory for the Great Plains nocturnal low-level jet. J. Atmos. Sci. 2016, 73, 3037–3057. [Google Scholar] [CrossRef]
  17. Higgins, R.W.; Yao, Y.; Yarosh, E.S.; Janowiak, J.E.; Mo, K.C. Influence of the Great Plains low-level jet on summertime precipitation and moisture transport over the central United States. J. Clim. 1997, 10, 481–507. [Google Scholar] [CrossRef]
  18. Weaver, S.J.; Schubert, S.; Wang, H. Warm season variations in the low-level circulation and precipitation over the central United States in observations. AMIP simulations, and idealized SST experiment. J. Clim. 2009, 22, 5401–5420. [Google Scholar] [CrossRef]
  19. He, M.Y.; Liu, H.B.; Wang, B.; Zhang, D.L. A modeling study of a low-level jet along the Yun-Gui Plateau in south China. J. Appl. Meteor. 2016, 55, 41–60. [Google Scholar] [CrossRef]
  20. Xue, M.; Luo, X.; Zhu, K.F.; Sun, Z.Q.; Fei, J.F. The controlling role of boundary layer inertial oscillations in Meiyu frontal precipitation and its diurnal cycles over China. J. Geophys. Res. Atmos. 2018, 123, 5090–5115. [Google Scholar] [CrossRef]
  21. Du, Y.; Chen, G.X. Heavy rainfall associated with double low-level jets over southern China. Part I: Ensemble-based analysis. Mon. Weather Rev. 2018, 146, 3827–3844. [Google Scholar] [CrossRef]
  22. Zhang, Y.H.; Xue, M.; Zhu, K.F.; Zhou, B.W. What is the main cause of diurnal variations and nocturnal peak of summer precipitation in Sichuan Basin, China? The key role of boundary layer low-level jet inertial oscillations. J. Geophys. Res. Atmos. 2019, 124, 2643–2664. [Google Scholar] [CrossRef]
  23. Li, G.P. Progress and prospects in research of mountain meteorology in China during the past 25 years. Meteorol. Sci. Technol. 2016, 6, 115–122. (In Chinese) [Google Scholar]
  24. Fu, P.L.; Zhu, K.F.; Zhao, K.; Zhou, B.W.; Xue, M. Role of the nocturnal low-level jet in the formation of the morning precipitation peak over the Dabie Mountains. Adv. Atmos. Sci. 2019, 36, 15–28. [Google Scholar] [CrossRef]
  25. Jin, Y.; Li, G.P. Impact of flow around and flow over in a sudden rainstorm on Mountains. Plateau Meteorol. 2021, 40, 314–323. (In Chinese) [Google Scholar]
  26. Li, F.; Li, J.; Li, Y.J.; Zheng, F. Climatological characteristics of flow around and flow over the Tibetan Plateau. Chin. J. Atmos. Sci. 2012, 36, 1236–1252. (In Chinese) [Google Scholar]
  27. Numaguti, A. Origin and recycling processes of precipitating water over the Eurasian continent: Experiments using an atmospheric general circulation model. J. Geophys. Res. 1999, 104, 1957–1972. [Google Scholar] [CrossRef]
  28. Zhang, Y.C.; Qian, Y.F. Numerical studies on the effects of the critical height of Qinghai-Xizang Plateau uplift on the atmosphere. Acta Meteorol. Sin. 1999, 57, 157–167. (In Chinese) [Google Scholar]
  29. Chinanews. Tracking: 51 Towns in 7 Counties Were Affected by the “May 21” Torrential Rain in Leshan, Sichuan [EB/OL]. 2018. Available online: https://www.chinanews.com.cn/sh/2018/05-22/8520120.shtml (accessed on 22 May 2018).
  30. Huang, Y.J.; Cui, X.P. Moisture sources of torrential rainfall events in the Sichuan Basin of China during summers of 2009–13. J. Hydrometeor. 2015, 16, 1906–1917. [Google Scholar] [CrossRef]
  31. Chen, B.; Xu, X.D. Spatiotemporal structure of the moisture sources feeding heavy precipitation events over the Sichuan Basin. Int. J. Climatol. 2016, 36, 3446–3457. [Google Scholar]
  32. Du, Y.; Zhang, Q.H.; Chen, Y.L.; Zhao, Y.Y.; Wang, X. Numerical simulations of spatial distributions and diurnal variations of low-level jets in China during early summer. J. Clim. 2014, 27, 5747–5767. [Google Scholar] [CrossRef]
  33. Bonner, W.D. Climatology of the low level jet. Mon. Weather Rev. 1968, 96, 833–850. [Google Scholar] [CrossRef]
  34. Barnes, S.L. A technique for maximizing details in numerical weather map analysis. J. Appl. Meteor. 1964, 3, 396–409. [Google Scholar] [CrossRef]
  35. Sawyer, J.S. The physical and dynamical problems of orographic rain. Weather 1956, 11, 375–381. [Google Scholar] [CrossRef]
  36. Xia, R.D.; Luo, Y.L.; Zhang, D.L.; Li, M.X.; Bao, X.H.; Sun, J.S. On the diurnal cycle of heavy rainfall over the Sichuan Basin during 10–18 August 2020. Adv. Atmos. Sci. 2021, 38, 2183–2200. [Google Scholar] [CrossRef]
  37. Bao, X.H.; Zhang, F.Q.; Sun, J.H. Diurnal variations of warm-season precipitation east of the Tibetan Plateau over China. Mon. Weather Rev. 2011, 139, 2790–2810. [Google Scholar] [CrossRef]
  38. Jin, X.; Wu, T.W.; Li, L. The quasi-stationary feature of nocturnal precipitation in the Sichuan Basin and the role of the Tibetan Plateau. Clim. Dyn. 2013, 41, 977–994. [Google Scholar] [CrossRef] [Green Version]
  39. Li, J.; Li, Y.Q.; Zhao, T.L.; Reinhard, S.; Mark, M.; Jiang, X.W. Northeastward propagation of nocturnal precipitation over the Sichuan Basin. Int. J. Climatol. 2020, 41, E2863–E2879. [Google Scholar] [CrossRef]
  40. Zhang, F.L.; Li, G.P.; Yue, J. The moisture sources and Transport processed for a sudden rainstorm associated with double low-level jets in the northeast Sichuan Basin of China. Atmosphere 2019, 10, 160. [Google Scholar] [CrossRef] [Green Version]
  41. Cheng, X.L.; Li, Y.Q.; Xu, L. An analysis of an extreme rainstorm caused by the interaction of the Tibetan Plateau vortex and the Southwest China vortex from an intensive observation. Meteor. Atmos. Phys. 2016, 128, 373–399. [Google Scholar] [CrossRef]
  42. Chen, S.; Sun, J.S.; He, L.F. Analysis of Multi-scale Characteristics of Three Different Types of Heavy Rainfall in Sichuan Basin. Plateau Meteorol. 2022, 4, 1190–1208. (In Chinese) [Google Scholar]
  43. Brubaker, K.L.; Entekhabi, D.; Eagleson, P.S. Estimation of continental precipitation recycling. J. Clim. 1993, 6, 1077–1089. [Google Scholar] [CrossRef]
  44. Pathak, A.; Ghosh, S.; Kumar, P. Precipitation recycling in the Indian subcontinent during summer monsoon. J. Hydrometeor. 2014, 15, 2050–2066. [Google Scholar] [CrossRef]
  45. Papanastasiou, D.K.; Melas, D.; Lissaridis, I. Study of wind field under sea breeze conditions: An application of WRF model. Atmos. Res. 2010, 98, 102–117. [Google Scholar] [CrossRef]
  46. Jiménez, P.A.; González-Rouco, J.F.; García-Bustamante, E.; Navarro, J.; Montávez, J.P.; De Arellano, J.V.G.; Dudhia, J.; Muñoz-Roldan, A. Surface wind regionalization over complex terrain: Evaluation and analysis of a high-resolution WRF simulation. J. Appl. Meteorol. Climatol. 2010, 49, 268–287. [Google Scholar] [CrossRef] [Green Version]
  47. Lee, J.; Shin, H.H.; Hong, S.Y.; Jiménez, P.A.; Dudhia, J.; Hong, J. Impacts of subgrid-scale orography parameterization on simulated surface layer wind and monsoonal precipitation in the high-resolution WRF model. J. Geophys. Res. Atmos. 2015, 120, 644–653. [Google Scholar] [CrossRef]
Figure 1. Distribution of topography (shaped) and stations (black dots) in Sichuan Province (red dots represent rainstorm center stations in 15 cases). Solid black lines represent the boundaries of Sichuan Province. SCB (Sichuan Basin) is surrounded by boundaries A, B, C, and D. Western SCB (mountainous areas around the western Sichuan Basin) is surrounded by boundaries B, C, and E. The blue triangle represents northeastern SCB (mountainous areas around the northeastern Sichuan Basin). The white line L intersects boundary A at point P.
Atmosphere 14 00084 g001
Figure 2. (a) Spatial distribution of accumulated precipitation at night and (b,c) diurnal variations of precipitation at station R1 (103.44° E, 29.73° N) and station R2 (103.44° E, 29.73° N). Line L cross R1 and R2. (Cases on 2 July 2010, 16 September 2010, 20 July 2011, and 26 July 2012 lack the precipitation data at station R1 and station R2).
Atmosphere 14 00084 g002
Figure 3. The temporal and spatial distribution of rainstorms at (a) 10 LST, (b) 14 LST, (c) 20 LST, (d) 22 LST, (e) 00 LST, (f) 02 LST, (g) 04 LST, and (h) 06 LST. Gray solid line represents terrain height, bolded solid line indicates the altitude of 3000 m. R1 and R2 represent rainstorm center stations.
Atmosphere 14 00084 g003
Figure 4. (a) Moisture transport paths and temporal variations of (b) the air pressure, (c) specific humidity, and (d) temperature of each path. Paths 1, 2, 3, and 4 are represented by red, blue, black, and green lines.
Atmosphere 14 00084 g004
Figure 5. Spatial distribution of moisture flux from surface to 700hPa on the (a,d) 10th day (−10 d), (b,e) 5th day (−5 d) before the rainstorm occurs, and (c,f) the day (0 d) when the rainstorm occurs.
Atmosphere 14 00084 g005
Figure 6. Diurnal variations of 850 hPa wind field.
Atmosphere 14 00084 g006
Figure 7. Diurnal variations of wind speed profiles in region S.
Atmosphere 14 00084 g007
Figure 8. Diurnal variations of geostrophic winds (blue arrows) and ageostrophic winds (red arrows) at (a) 10 LST, (b) 14 LST, (c) 20 LST, (d) 22 LST, (e) 00 LST, (f) 02 LST, (g) 04 LST, and (h) 06 LST. The large red arrows indicate the prominent direction of ageostrophic winds in region S. The brown solid lines represent the filtered geopotential height.
Atmosphere 14 00084 g008
Figure 9. Diurnal variations of geostrophic creeping flows (blue arrows) and ageostrophic creeping flows (red arrows). (ad) 900 hPa, (eh) 850 hPa. Purple lines in (a) represent boundaries A, B, C, D, and E.
Atmosphere 14 00084 g009
Figure 10. Diurnal variations of geostrophic circumfluence flows (blue arrows) and ageostrophic circumfluence flows (red arrows). (ad) 900 hPa, (eh) 850 hPa. Purple lines in (a) represent boundaries A, B, C, D, and E.
Atmosphere 14 00084 g010
Figure 11. Vertical cross-sections along line L in Figure 1, (ad) the total vertical velocity overlay the equivalent potential temperature (θe) (green contours), (eh) the vertical velocity forced by the total creeping flow.
Atmosphere 14 00084 g011
Figure 12. The vertical velocity forced by (ad) the geostrophic creeping flow and (eh) the ageostrophic creeping flow.
Atmosphere 14 00084 g012
Figure 13. Diurnal variations of the total moisture flux (arrows) and the moisture flux divergence (shaded) from surface—700 hPa at (a) 10 LST, (b) 14 LST, (c) 20 LST, (d) 22 LST, (e) 00 LST, (f) 02 LST, (g) 04 LST, and (h) 06 LST. Purple lines in (a) represent boundaries A, B, C, D, and E. Green arrows represent the moisture flux larger than 100 kg m–1 s–1.
Atmosphere 14 00084 g013
Figure 14. Diurnal variations of the moisture flux and the moisture flux divergence from surface—700 hPa caused by (ad) geostrophic creeping flows and (eh) ageostrophic creeping flows. Purple lines in (a) represent boundaries A, B, C, D, and E.
Atmosphere 14 00084 g014
Figure 15. Diurnal variations of the moisture flux and the moisture flux divergence from surface—700 hPa caused by (ad) geostrophic circumfluence flows and (eh) ageostrophic circumfluence flows. Purple lines in (a) represent boundaries A, B, C, D, and E.
Atmosphere 14 00084 g015
Figure 16. Diurnal variations of moisture budget at boundaries (a) A, (b) B, (c) C, (d) D, and (e) E and regions (f) western SCB, (g) northeastern SCB, and (h) SCB (the total, geo_vp, geo_vr, ageo_vp, ageo_vr in (a) represent the moisture budget caused by total winds, geostrophic creeping flows, geostrophic circumfluence flows, ageostrophic creeping flows, and ageostrophic circumfluence flows, respectively).
Atmosphere 14 00084 g016
Table 1. Statistics of nocturnal rainstorm cases during 2010–2021 in western SCB.
DateRainstormHeight (m)Precipitation atPeak TimePrecipitation at Night Rain Rate (%)
Center (°E,°N)Night (mm)(LST)Peak Time (mm)
2 July 2010103.00, 29.98628192.30367.5100.0
16 September 2010104.40, 31.73782154.32351.696.7
20 July 2011104.11, 31.54904115.02340.6100.0
26 July 2012103.19, 30.00619225.70160.5100.0
15 July 2013102.72, 30.13931146.22251.3100.0
20 August 2014103.53, 28.83614111.52260.498.6
7 July 2016104.27, 31.71799144.80143.785.0
26 July 2017104.33, 31.68982149.80058.099.5
21 May 2018103.80, 28.981015332.800107.998.9
26 July 2018103.12, 30.281114187.10365.588.0
21 August 2018103.49, 30.10555150.123103.799.9
13 August 2019103.52, 29.40672166.62375.793.0
4 August 2020103.68, 31.131054171.02349.399.1
23 August 2020103.44, 29.73746285.000130.3100.0
21 July 2021104.38, 31.79700126.50052.7100.0
Disclaimer/Publisher’s Note: The statements, opinions and data contained in all publications are solely those of the individual author(s) and contributor(s) and not of MDPI and/or the editor(s). MDPI and/or the editor(s) disclaim responsibility for any injury to people or property resulting from any ideas, methods, instructions or products referred to in the content.

