
Characterising Large-Scale Meteorological Patterns Associated with Winter Precipitation and Snow Accumulation in a Mountain Range in the Iberian Peninsula (Sierra de Guadarrama)

Abstract
:1. Introduction
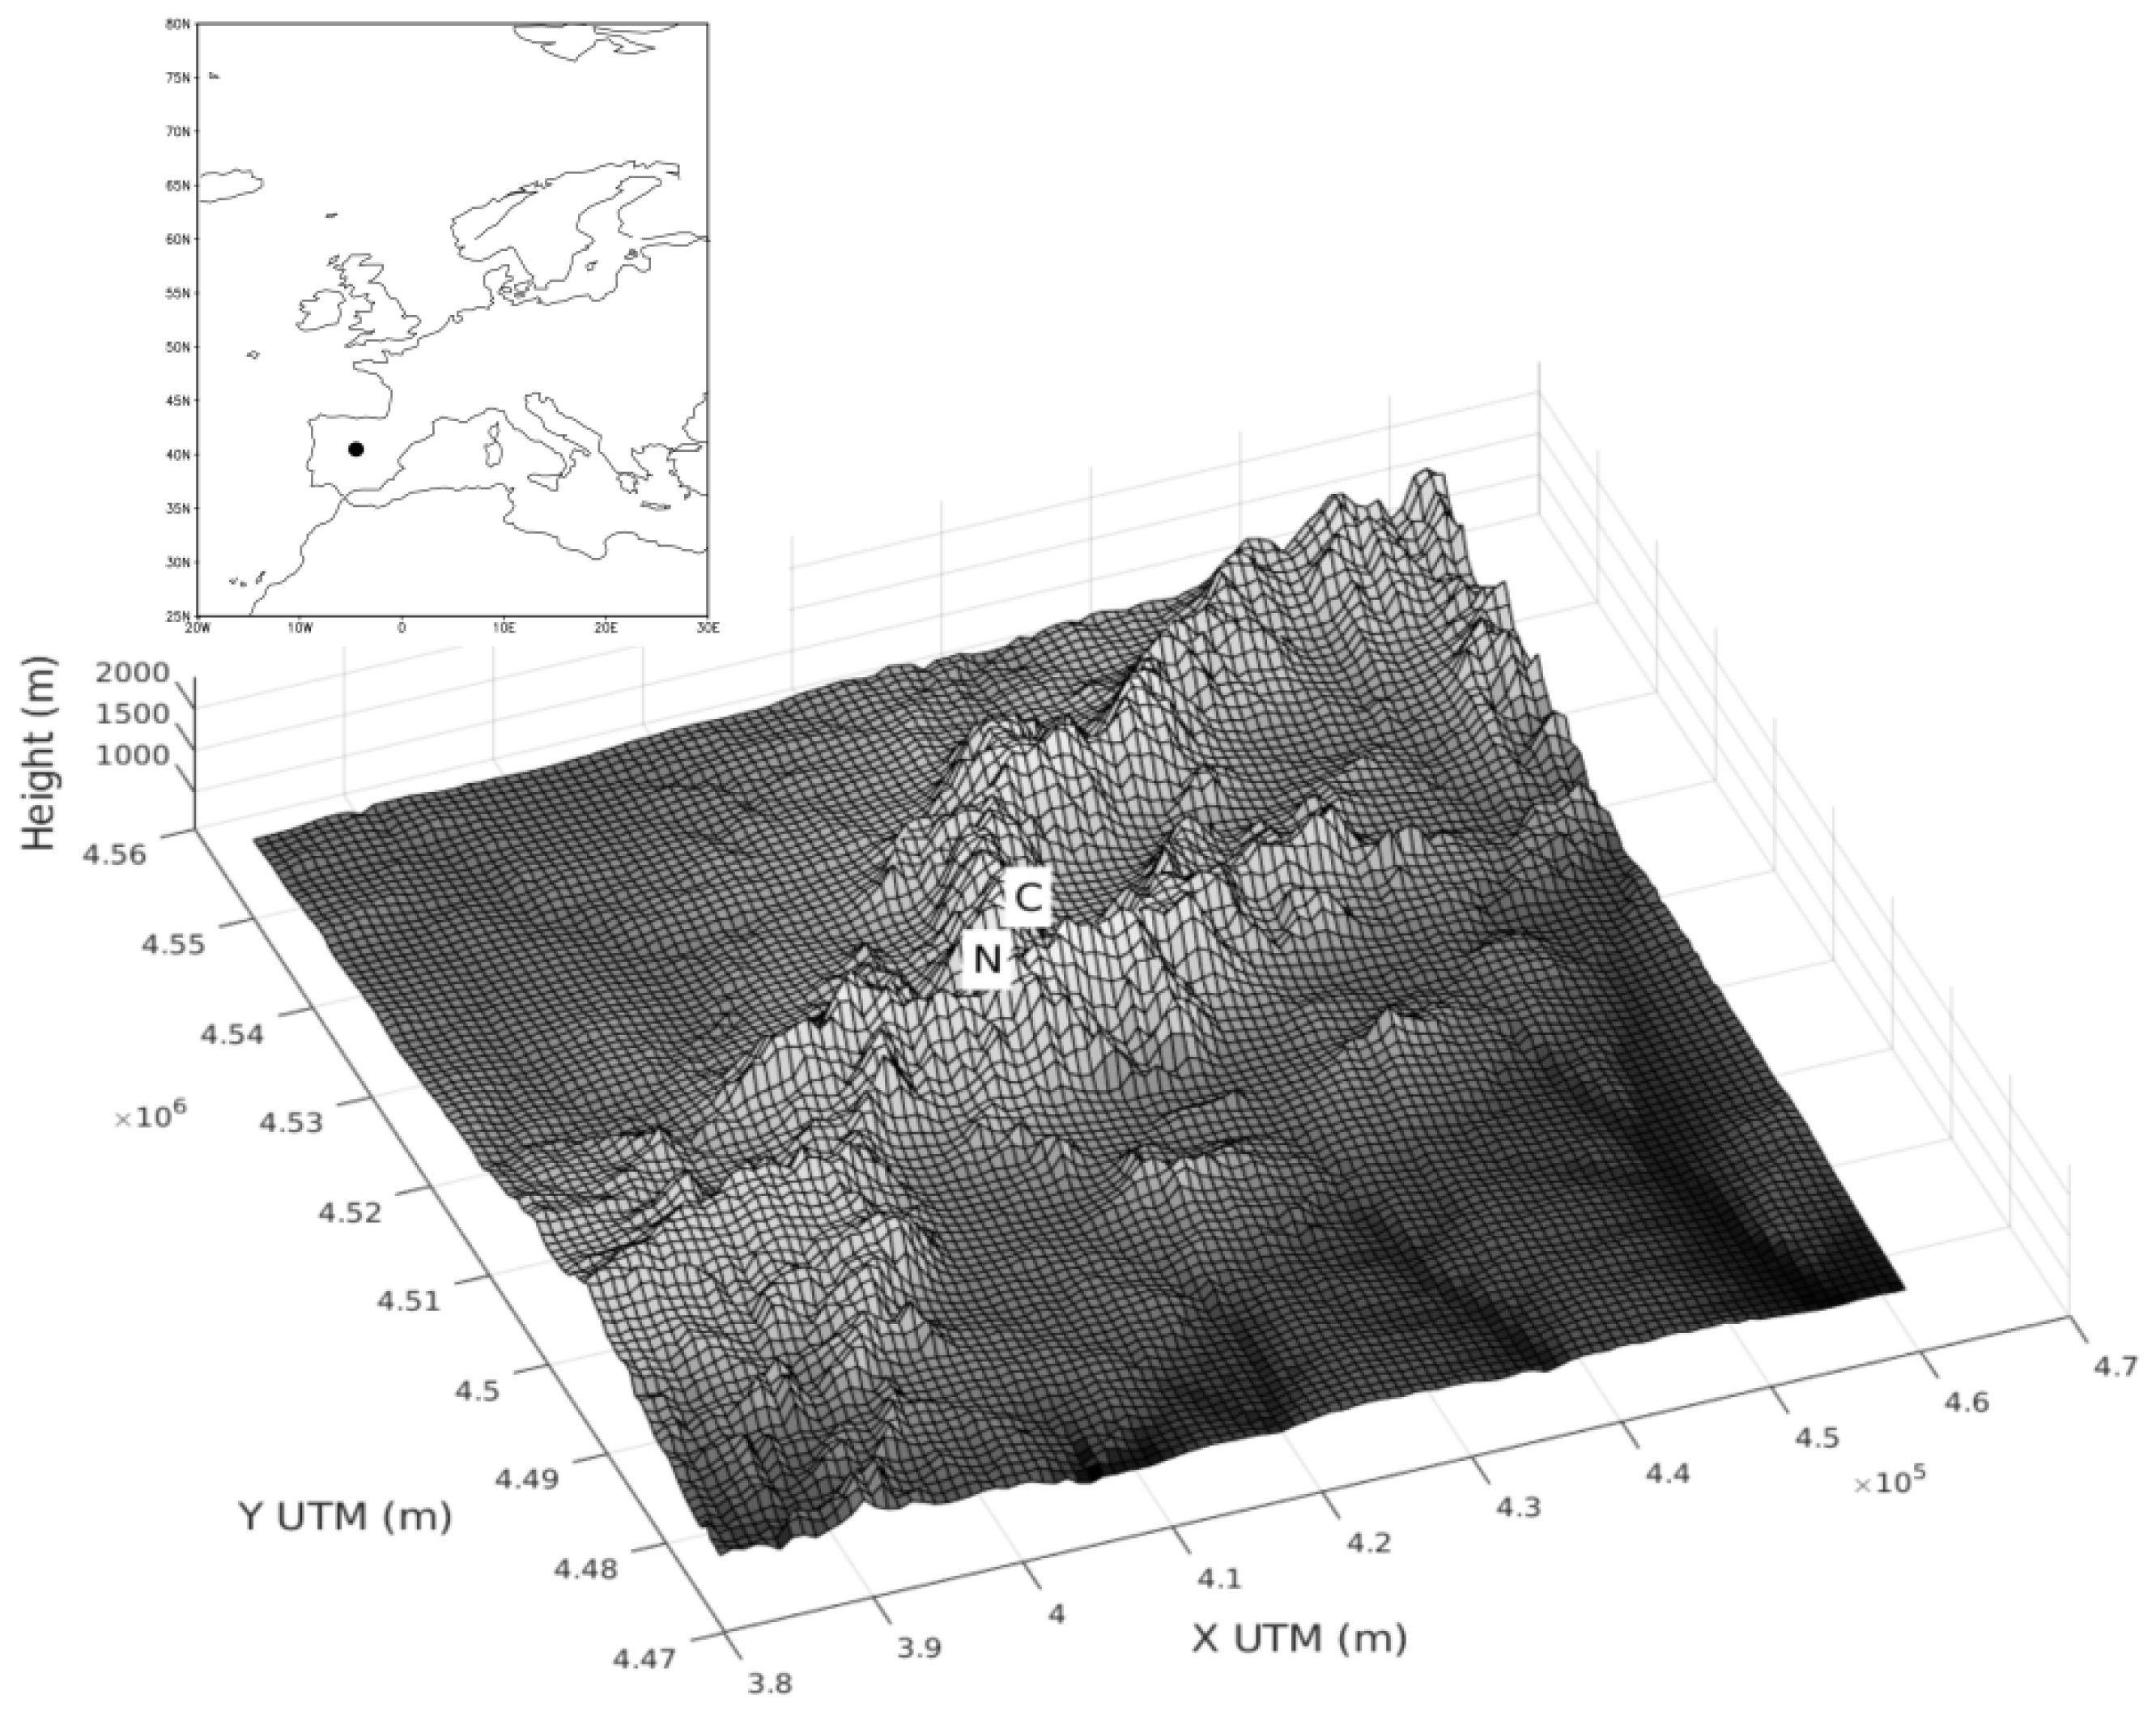
2. Study Area
3. Material and Methods
3.1. Observations
3.2. Model Data
3.3. Statistical Analysis of Precipitation
3.4. Principal Component Analysis
3.5. K-Means Clustering and Circulation Weather Types
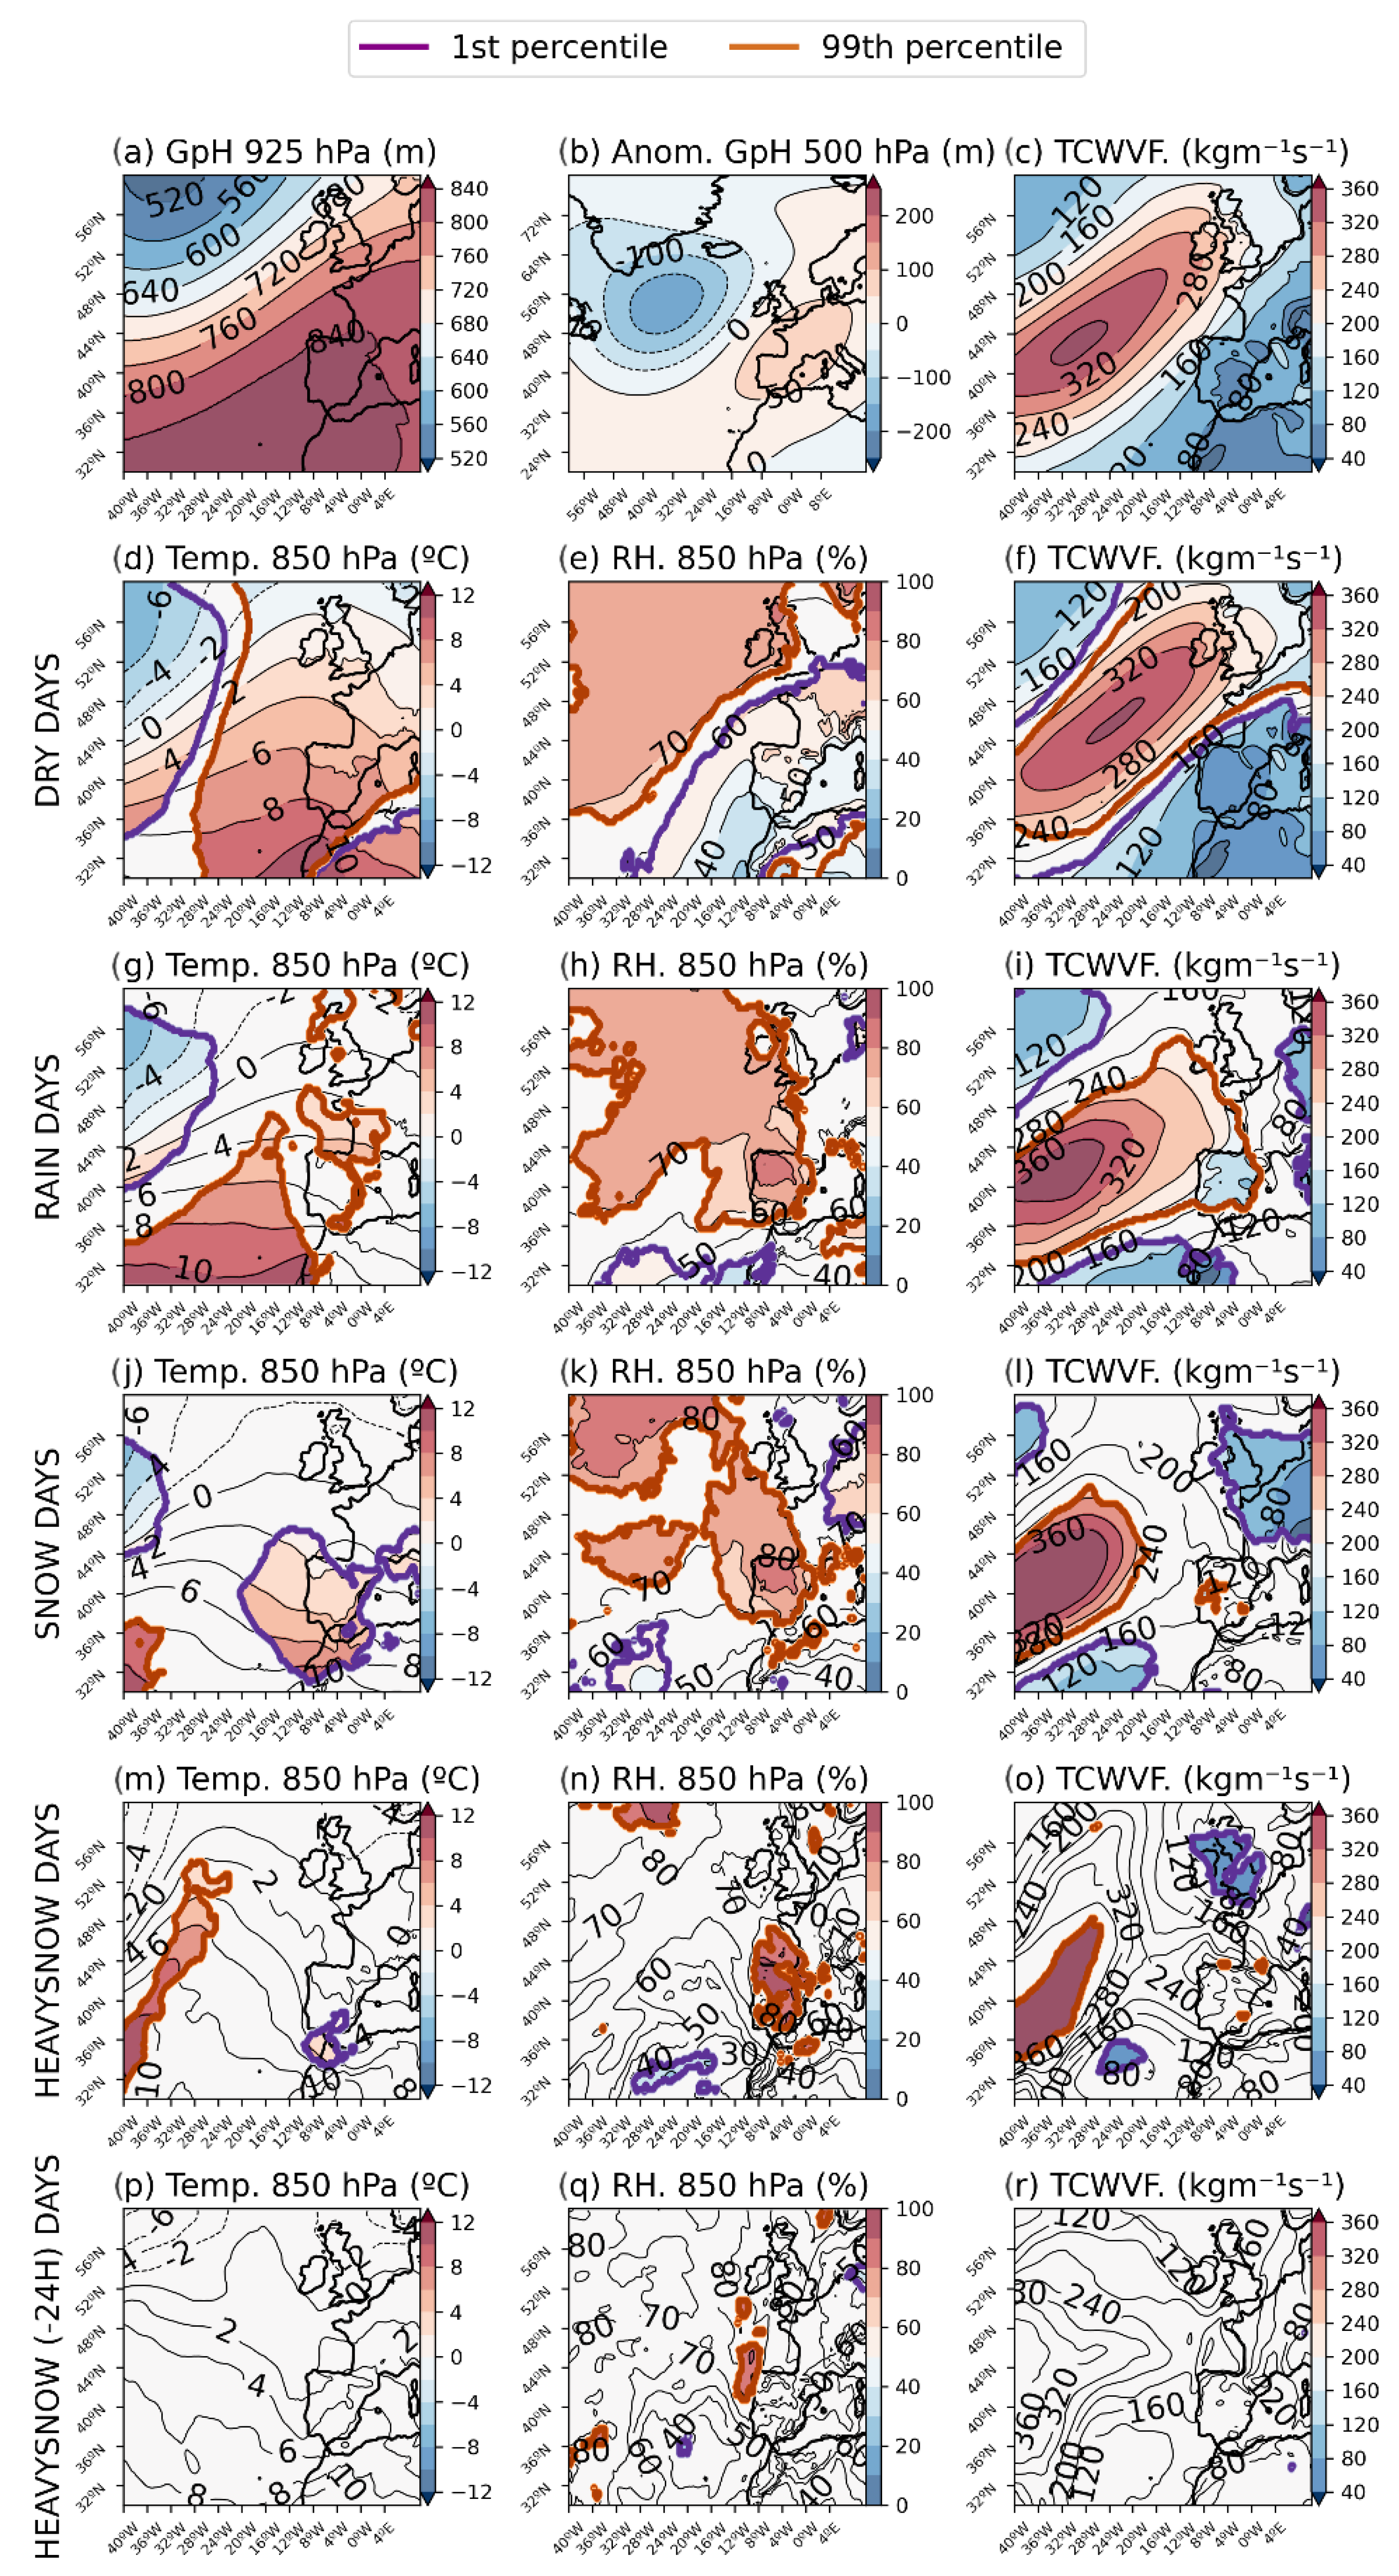
3.6. Composite Maps
4. Results and Discussion
4.1. Winter Precipitation and Snow Events in Sierra de Guadarrama
4.2. Circulation Weather Types and Winter Precipitation
4.2.1. Cyclonic
4.2.2. Western
4.2.3. NAO-
4.2.4. Atlantic Ridge
4.2.5. NAO+
4.2.6. Scandinavian Blocking
4.2.7. Anticyclonic
5. Conclusions
Author Contributions
Funding
Institutional Review Board Statement
Informed Consent Statement
Acknowledgments
Conflicts of Interest
References
- Barry, R.G. The role of snow and ice in the global climate system: A review. Polar Geogr. 2002, 26, 235–246. [Google Scholar] [CrossRef]
- Ballantyne, C.K. The hydrologic significance of nivation features in permafrost areas. Geogr. Ann. Ser. A Phys. Geogr. 1978, 60, 51–54. [Google Scholar] [CrossRef]
- IPCC. Summary for Policymakers. In Climate Change 2021: The Physical Science Basis. Contribution of Working Group I to the Sixth Assessment Report of the Intergovernmental Panel on Climate Change; Masson-Delmotte, V., Zhai, P., Pirani, A., Connors, S.L., Péan, C., Berger, S., Caud, N., Chen, Y., Goldfarb, L., Gomis, M.I., et al., Eds.; Cambridge University Press: Cambridge, UK, 2021. [Google Scholar]
- Marty, C.; Tilg, A.M.; Jonas, T. Recent Evidence of Large-Scale Receding Snow Water Equivalents in the European Alps. J. Hydrometeorol. 2017, 18, 1021–1031. [Google Scholar] [CrossRef]
- Earman, S.; Dettinger, M. Potential impacts of climate change on groundwater resources—A global review. J. Water Clim. Change 2011, 2, 213–229. [Google Scholar] [CrossRef]
- Berghuijs, W.R.; Woods, R.A.; Hrachowitz, M.; Hrachowitz, R. A precipitation shift from snow towards rain leads to a decrease in streamflow. Nat. Clim. Change 2014, 4, 583–586. [Google Scholar] [CrossRef]
- Matiu, M.; Crespi, A.; Bertoldi, G.; Carmagnola, C.M.; Marty, C.; Morin, S.; Schöner, W.; Berro, D.C.; Chiogna, G.; De Gregorio, L.; et al. Observed snow depth trends in the European Alps: 1971 to 2019. Cryosphere 2021, 15, 1343–1382. [Google Scholar] [CrossRef]
- Schöner, W.; Koch, R.; Matulla, C.; Marty, C.; Tilg, A.M. Spatiotemporal patterns of snow depth within the Swiss-Austrian Alps for the past half century (1961 to 2012) and linkages to climate change. Int. J. Climatol. 2019, 39, 1589–1603. [Google Scholar] [CrossRef]
- López-Moreno, J.I.; Soubeyroux, J.M.; Gascoin, S.; Alonso-Gonzalez, E.; Durán-Gómez, N.; Lafaysse, M.; Vernay, M.; Carmagnola, C.; Morin, S. Long-term trends (1958–2017) in snow cover duration and depth in the Pyrenees. Int. J. Climatol. 2020, 40, 6122–6136. [Google Scholar] [CrossRef]
- Skiles, S.M.; Painter, T.H. Assessment of radiative forcing by light-absorbing particles in snow from in situ observations with radiative transfer modeling. J. Hydrometeorol. 2018, 19, 1397–1409. [Google Scholar] [CrossRef]
- Di Mauro, B.; Garzonio, R.; Rossini, M.; Filippa, G.; Pogliotti, P.; Galvagno, M.; Morra di Cella, U.; Migliavacca, M.; Baccolo, G.; Clemenza, M.; et al. Saharan dust events in the European Alps: Role in snowmelt and geochemical characterization. Cryosphere 2019, 13, 1147–1165. [Google Scholar] [CrossRef] [Green Version]
- Dumont, M.; Tuzet, F.; Gascoin, S.; Picard, G.; Kutuzov, S.; Lafaysse, M.; Cluzet, B.; Nheili, R.; Painter, T. Accelerated Snow Melt in the Russian Caucasus Mountains After the Saharan Dust Outbreak in March 2018. J. Geophys. Res. Earth Surf. 2020, 125, e2020JF005641. [Google Scholar] [CrossRef]
- Fulgencio, C.; Briviesca, E. El Canal de Isabel II. Boletín De La Soc. Española De Hidrol. Médica 2015, 30, 73–88. [Google Scholar] [CrossRef]
- Durán, L.; Sánchez, E.; Yagüe, C. Climatology of precipitation over the Iberian Central System mountain range. Int. J. Climatol. 2013, 33, 2260–2273. [Google Scholar] [CrossRef]
- Durán, L.; Rodríguez-Fonseca, B.; Yagüe, C.; Sánchez, E. Water vapour flux patterns and precipitation at Sierra de Guadarrama mountain range (Spain). Int. J. Climatol. 2015, 35, 1593–1610. [Google Scholar] [CrossRef]
- Durán, L.; Barstad, I. Multi-scale evaluation of a linear model of orographic precipitation over Sierra de Guadarrama (Iberian Central System). Int. J. Climatol. 2018, 38, 4127–4141. [Google Scholar] [CrossRef]
- Alonso-González, E.; López-Moreno, J.I.; Navarro-Serrano, F.; Sanmiguel-Vallelado, A.; Revuelto, J.; Domínguez-Castro, F.; Ceballos, A. Snow climatology for the mountains in the Iberian Peninsula using satellite imagery and simulations with dynamically downscaled reanalysis data. Int. J. Climatol. 2020, 40, 477–491. [Google Scholar] [CrossRef]
- Durán, L.; Rodríguez-Muñoz, I.; Sánchez, E. The Peñalara Mountain Meteorological Network (1999–2014): Description, Preliminary Results and Lessons Learned. Atmosphere 2017, 8, 203. [Google Scholar] [CrossRef]
- Hersbach, H.; Bell, B.; Berrisford, P.; Hirahara, S.; Horányi, A.; Muñoz-Sabater, J.; Nicolas, J.; Peubey, C.; Radu, R.; Schepers, D.; et al. The ERA5 global reanalysis. Q. J. R. Meteorol. Soc. 2020, 146, 1999–2049. [Google Scholar] [CrossRef]
- Zhang, X.; Sorteberg, A.; Zhang, J.; Gerdes, R.; Comiso, J.C. Recent radical shifts of atmospheric circulations and rapid changes in Arctic climate system. Geophys. Res. Lett. 2008, 35. [Google Scholar] [CrossRef]
- Yuan, P.; Hunegnaw, A.; Alshawaf, F.; Awange, J.; Klos, A.; Teferle, F.N.; Kutterer, H. Feasibility of ERA5 integrated water vapor trends for climate change analysis in continental Europe: An evaluation with GPS (1994–2019) by considering statistical significance. Remote Sens. Environ. 2021, 260, 112416. [Google Scholar] [CrossRef]
- Santos, J.A.; Corte-Real, J.; Leite, S.M. Weather regimes and their connection to the winter rainfall in Portugal. Int. J. Climatol. 2005, 25, 33–50. [Google Scholar] [CrossRef]
- Farukh, M.A.; Yamada, T.J. Synoptic climatology associated with extreme snowfall events in Sapporo city of northern Japan. Atmos. Sci. Lett. 2014, 15, 259–265. [Google Scholar] [CrossRef]
- Merino, A.; Fernández, S.; Hermida, L.; López, L.; Sánchez, J.L.; García-Ortega, E.; Gascón, E. Snowfall in the northwest Iberian Peninsula: Synoptic circulation patterns and their influence on snow day trends. Sci. World J. 2014, 2014, 480275. [Google Scholar] [CrossRef] [PubMed]
- Coe, D.; Barlow, M.; Agel, L.; Colby, F.; Skinner, C.; Qian, J.H. Clustering Analysis of Autumn Weather Regimes in the Northeast United States. J. Clim. 2021, 34, 7587–7605. [Google Scholar] [CrossRef]
- Plaut, G.; Schuepbach, E.; Doctor, M. Heavy precipitation events over a few Alpine sub-regions and the links with large-scale circulation, 1971–1995. Clim. Res. 2001, 17, 285–302. [Google Scholar] [CrossRef]
- Esteban, P.; Jones, P.D.; Martín-Vide, J.; Mases, M. Atmospheric circulation patterns related to heavy snowfall days in Andorra, Pyrenees. Int. J. Climatol. 2005, 25, 319–329. [Google Scholar] [CrossRef]
- Mock, C.J.; Birkeland, K.W. Snow climatology of the western United States mountain ranges. Bull. Amer. Meteor. Soc. 2000, 81, 2367–2392. [Google Scholar] [CrossRef]
- Fernández-Cañadas, J.A. Los Aludes de Nieve en el Macizo de Peñalara. Available online: https://www.aemet.es/documentos/es/conocermas/recursos_en_linea/publicaciones_y_estudios/publicaciones/Aludes_penalara/NT_14_AEMET.pdf (accessed on 8 August 2022).
- Wilks, D.S. Statistical Methods in the Atmospheric Sciences, 3rd ed.; Academic Press: Cambridge, MA, USA, 2011. [Google Scholar]
- Birkeland, K.W.; Mock, C.J.; Shinker, J.J. Avalanche extremes and atmospheric circulation patterns. Ann. Glaciol. 2001, 32, 135–140. [Google Scholar] [CrossRef]
- Solman, S.A.; Menendez, C.G. Weather regimes in the South American sector and neighbouring oceans during winter. Clim. Dyn. 2003, 21, 91–104. [Google Scholar] [CrossRef]
- Romero, R.; Ramis, C.; Guijarro, J.A.; Sumner, G. Daily rainfall affinity areas in the Mediterranean Spain. Int. J. Climatol. 1999, 19, 557–578. [Google Scholar] [CrossRef]
- Fernández-Montes, S.; Rodrigo, F.S.; Seubert, S.; Sousa, P.M. Spring and summer extreme temperatures in Iberia during last century in relation to circulation types. Atmos. Res. 2013, 127, 154–177. [Google Scholar] [CrossRef]
- North, G.R.; Bell, T.L.; Cahalan, R.F. Sampling errors in the estimation of empirical orthogonal functions. Mon. Weather Rev. 1982, 110, 699–706. [Google Scholar] [CrossRef]
- Hartigan, J.A.; Wong, M.A.; Algorithm, A.S. 136: A K-means clustering algorithm. J. R. Stat. Soc. Ser. C Appl. Stat. 1979, 28, 100–108. [Google Scholar]
- Corte-Real, J.; Qian, B.; Xu, H. Regional climate change in Portugal: Precipitation variability associated with large-scale atmospheric circulation. Int. J. Climatol. 1998, 18, 619–635. [Google Scholar] [CrossRef]
- Gershunov, A.; Barnett, T.P. ENSO influence on intraseasonal extreme rainfall and temperature frequencies in the contiguous United States: Observations and model results. J. Clim. 1998, 11, 1575–1586. [Google Scholar] [CrossRef]
- Gershunov, A.; Barnett, T.P. Interdecadal modulation of ENSO teleconnections. Bull. Amer. Meteor. Soc. 1998, 79, 2715–2725. [Google Scholar] [CrossRef]
- Matthews, A.J.; Kiladis, G.N. Interactions between ENSO, transient circulation, and tropical convection over the Pacific. J. Clim. 1999, 12, 3062–3086. [Google Scholar] [CrossRef]
- Lee, S.H.; Furtado, J.C.; Charlton-Perez, A.J. Wintertime North American weather regimes and the Arctic stratospheric polar vortex. Geophys. Res. Lett. 2019, 46, 14892–14900. [Google Scholar] [CrossRef]
- Grotjahn, R.; Faure, G. Composite predictor maps of extraordinary weather events in the Sacramento, California, region. Weather Forecast. 2008, 23, 313–335. [Google Scholar] [CrossRef]
- Wilson, R.J.; Gutiérrez, D.; Gutiérrez, J.; Martínez, D.; Agudo, R.; Monserrat, V.J. Changes to the elevational limits and extent of species ranges associated with climate change. Ecol. Lett. 2005, 8, 1138–1146. [Google Scholar] [CrossRef]
- Bosch, J.; Carrascal, L.M.; Duran, L.; Walker, S.; Fisher, M.C. Climate change and outbreaks of amphibian chytridiomycosis in a montane area of Central Spain; is there a link? Proc. R. Soc. B: Biol. Sci. 2007, 274, 253–260. [Google Scholar] [CrossRef] [PubMed] [Green Version]
- Wilson, R.J.; Gutierrez, D.; Gutierrez, J.; Monserrat, V.J. An elevational shift in butterfly species richness and composition accompanying recent climate change. Glob. Change Biol. 2007, 13, 1873–1887. [Google Scholar] [CrossRef]
- Rubio-Romero, A.; Granados, I. Efectos del cambio climático sobre los macroinvertebrados fluviales del Alto Lozoya. In Proceedings of the XIV Congreso de la Asociación Ibérica de Limnologá, Huelva, Spain, 8–12 September 2008. [Google Scholar]
- Legras, B.; Desponts, T.; Piguet, B. Cluster analysis and weather regimes. In Proceedings of the ECMWF Seminar, The Nature and Prediction of Extratropical Weather Systems, ECMWF, Reading, UK, 7–11 September 1987. [Google Scholar]
- Barnston, A.G.; Livezey, R.E. Classifications, Seasonality, and Persistence of Low-Frequency Atmospheric Circulation Patterns. Mon. Weather Rev. 1987, 115, 1083–1126. [Google Scholar] [CrossRef]
- Cassou, C. Euro-Atlantic regimes and their teleconnections. In Proceedings of the ECMWF Seminar on Predictability in the European and Atlantic Regions, Reading, UK, 6–9 September 2010; pp. 1–14. Available online: https://www.ecmwf.int/sites/default/files/elibrary/2012/8609-euro-atlantic-regimes-and-their-teleconnections.pdf (accessed on 7 June 2022).
- Tyrlis, E.; Hoskins, B.J. Aspects of a Northern Hemisphere Atmospheric Blocking Climatology. J. Atmos. Sci. 2008, 65, 1638–1652. Available online: https://journals.ametsoc.org/view/journals/atsc/65/5/2007jas2337.1.xml (accessed on 7 June 2022). [CrossRef]
- Falkena, S.K.; de Wiljes, J.; Weisheimer, A.; Shepherd, T.G. Revisiting the identification of wintertime atmospheric circulation regimes in the Euro-Atlantic sector. Q. J. R. Meteorol. Soc. 2020, 146, 2801–2814. [Google Scholar] [CrossRef]
- Sousa, P.M.; Trigo, R.M.; Barriopedro, D.; Soares, P.M.; Ramos, A.M.; Liberato, M.L. Responses of European precipitation distributions and regimes to different blocking locations. Clim. Dyn. 2017, 48, 1141–1160. [Google Scholar] [CrossRef] [Green Version]


| Statistics | Total Precipitation (mm/Year) | Snow (mm/Year) |
|---|---|---|
| Mean | 1315 | 488 |
| Median | 1373 | 488 |
| Standard deviation | 199 | 116 |
| Maximum | 1579 → Year 2003–2004 | 725 → Year 2017–2018 |
| Minimum | 948 → Year 2004–2005 | 320 → Year 2007–2008 |
| Date | Snow Precipitation (Water Equivalent, (mm/Day)) | Circulation Weather Type | Date | Snow Precipitation (Water Equivalent, (mm/Day)) | Circulation Weather Type | ||
|---|---|---|---|---|---|---|---|
| Navacerrada | Cotos | Navacerrada | Cotos | ||||
| 13–14 January 2000 | 30.1 | AR | 4 November 2011 | 31 | 37.2 | W | |
| 02 April 2000 | 74 | NAO- | 13–14 April 2012 | 41.2 | 44.3 | NAO- | |
| 22 December 2000 * | 85 | C | 18 April 2012 | 34.5 | 49.3 | W | |
| 28 January 2001 * | 32.2 | NAO+ | 16 January 2013 | 40 | 55.3 | A | |
| 7 February 2001 | 42.5 | W | 19 January 2013 | 37.2 | 50.5 | C | |
| 13 March 2002 * | 40 | NAO- | 27–28 February 2013 | 32.8 | 31.2 | AR | |
| 11 April 2002 * | 35.5 | NAO- | 4 March 2013 | 37.6 | 36.1 | C | |
| 9 October 2002 * | 39.3 | 24 December 2013 | 30.6 | 25.3 | W | ||
| 13 November 2002 | 30.3 | W | 17 January 2014 * | 40.7 | 29.1 | W | |
| 29 November 2002 | 39.3 | A | 29 March 2014 | 39.2 | 28.7 | NAO- | |
| 10 December 2002 | 36.1 | AR | 13 December 2014 | 42.9 | 28.5 | NAO+ | |
| 24 February 2003 | 58.8 | C | 21–22 January 2015 | 31.2 | 44.1 | NAO+ | |
| 25 February 2003 * | 65.8 | C | 02 February 2015 * | 41.3 | 42.8 | NAO- | |
| 6 May 2003 * | 40.7 | 3 February 2015 | 41.7 | 41.3 | NAO- | ||
| 5 December 2003 * | 70.7 | 55 | AR | 14 February 2015 | 39.7 | 49.5 | A |
| 9 December 2003 * | 34.1 | 28.6 | NAO- | 26 February 2016 * | 38.1 | 37.5 | NAO- |
| 21 February 2004 | 31.5 | 24.2 | NAO- | 27 February 2016 | 35 | 41.6 | NAO- |
| 1 December 2004 * | 50.2 | 38 | NAO- | 28 February 2016 * | 36.6 | 16.1 | AR |
| 26 December 2004 * | 31.5 | 34.7 | NAO+ | 11–12 April 2016 * | 44 | 20.6 | NAO- |
| 6 February 2005 * | 32.8 | 22.8 | AR | 26 November 2016 | 59.8 | 39.2 | SB |
| 7 February 2005 * | 44.2 | 33.6 | NAO+ | 26–27 January 2017 * | 41 | 29 | C |
| 22 February 2005 * | 31.7 | 27.6 | NAO- | 11 February 2017 * | 35.2 | 24.5 | AR |
| 12 November 2005 * | 38.5 | 34.8 | AR | 12 February 2017 * | 137.4 | 139.4 | NAO- |
| 26–27 December 2005 | 46.6 | 68 | NAO- | 26–27 December 2017 | 37 | 49.8 | W |
| 20–21 February 2006 * | 41.8 | AR | 06 January 2018 * | 52.3 | NAO- | ||
| 25 February 2006 * | 46.2 | NAO- | 4–5 February 2018 * | 52.2 | 36.8 | AR | |
| 22 January 2007 * | 36 | 48.1 | AR | 3–4 March 2018 * | 38.8 | 23.7 | C |
| 17–18 February 2008 * | 34.7 | 59.9 | A | 19 March 2018 | 33.3 | 37.8 | NAO- |
| 20 December 2007 | 33.7 | 28.8 | SB | 10 April 2018 | 43.8 | 53.3 | NAO- |
| 17 April 2008 | 33.2 | 26 | C | 30 October 2018 | 33.3 | 24.2 | |
| 13 December 2008 * | 35 | 34.6 | W | 19 January 2019 | 33 | 45.4 | NAO+ |
| 25–26 January 2009 * | 33.3 | 38 | W | 22 January 2019 | 41.4 | 65.3 | NAO+ |
| 4 February 2009 | 35.9 | NAO- | 56 April 2019 | 35.5 | 31 | NAO- | |
| 4 March 2009 * | 52 | 45.5 | W | 20 January 2020 * | 34 | 31.3 | AR |
| 30–31 December 2009 | 41.6 | 38.4 | NAO- | 16 March 2020 * | 48.6 | 42.2 | NAO+ |
| 16 February 2010 | 36 | 22.8 | C | 31 March 2020 | 39 | AR | |
| 22 February 2010 | 33.4 | 21.3 | NAO- | 8–9 January 2021 * | 32.8 | 38.2 | AR |
| 16–17 February 2011 * | 47.4 | 56.5 | C | 8 February 2021 * | 30.5 | 30 | C |
| 4 March 2011 | 43.2 | 37 | AR | 9 February 2021 | 31.8 | 32.5 | C |
| 23 March 2011 | 30.4 | 26.4 | SB | ||||
| CWT | Freq (%) | CTP (%) | PoP (%) | PoS (%) | PoHS (%) | MPR (mm/Day) | MSR (mm/Day) | MAT (°C) |
|---|---|---|---|---|---|---|---|---|
| SB | 16.9 | 8.3 | 29.3 | 47.7 | 4.3 | 8.1 | 13.1 | 2.6 |
| W | 11.8 | 20.6 | 71.2 | 38.1 | 7.2 | 12.0 | 17.2 | 1.2 |
| NAO- | 13.7 | 26.2 | 70.1 | 61.0 | 9.3 | 13.3 | 22.9 | 0.0 |
| C | 8.1 | 16.0 | 72.2 | 42.4 | 11.3 | 13.4 | 21.8 | 1.3 |
| AR | 17.0 | 12.0 | 38.3 | 67.2 | 5.8 | 8.9 | 13.9 | 0.6 |
| NAO+ | 17.9 | 10.6 | 34.5 | 52.5 | 5.9 | 8.3 | 13.5 | 1.6 |
| A | 14.6 | 6.2 | 26.9 | 31.5 | 8.2 | 7.7 | 15.5 | 3.5 |
Publisher’s Note: MDPI stays neutral with regard to jurisdictional claims in published maps and institutional affiliations. |
© 2022 by the authors. Licensee MDPI, Basel, Switzerland. This article is an open access article distributed under the terms and conditions of the Creative Commons Attribution (CC BY) license (https://creativecommons.org/licenses/by/4.0/).
Share and Cite
González-Flórez, C.; González-Cervera, Á.; Durán, L. Characterising Large-Scale Meteorological Patterns Associated with Winter Precipitation and Snow Accumulation in a Mountain Range in the Iberian Peninsula (Sierra de Guadarrama). Atmosphere 2022, 13, 1600. https://doi.org/10.3390/atmos13101600
González-Flórez C, González-Cervera Á, Durán L. Characterising Large-Scale Meteorological Patterns Associated with Winter Precipitation and Snow Accumulation in a Mountain Range in the Iberian Peninsula (Sierra de Guadarrama). Atmosphere. 2022; 13(10):1600. https://doi.org/10.3390/atmos13101600
Chicago/Turabian StyleGonzález-Flórez, Cristina, Álvaro González-Cervera, and Luis Durán. 2022. "Characterising Large-Scale Meteorological Patterns Associated with Winter Precipitation and Snow Accumulation in a Mountain Range in the Iberian Peninsula (Sierra de Guadarrama)" Atmosphere 13, no. 10: 1600. https://doi.org/10.3390/atmos13101600